
Maximizing Producer Value through Alliance Pipeline and Aux Sable
Aux Sable Channahon Facility TourSeptember 20, 2012
W.J. (Bill) McAdamCEO, Aux Sable
T.L. (Tim) StauftPresident , Aux Sable
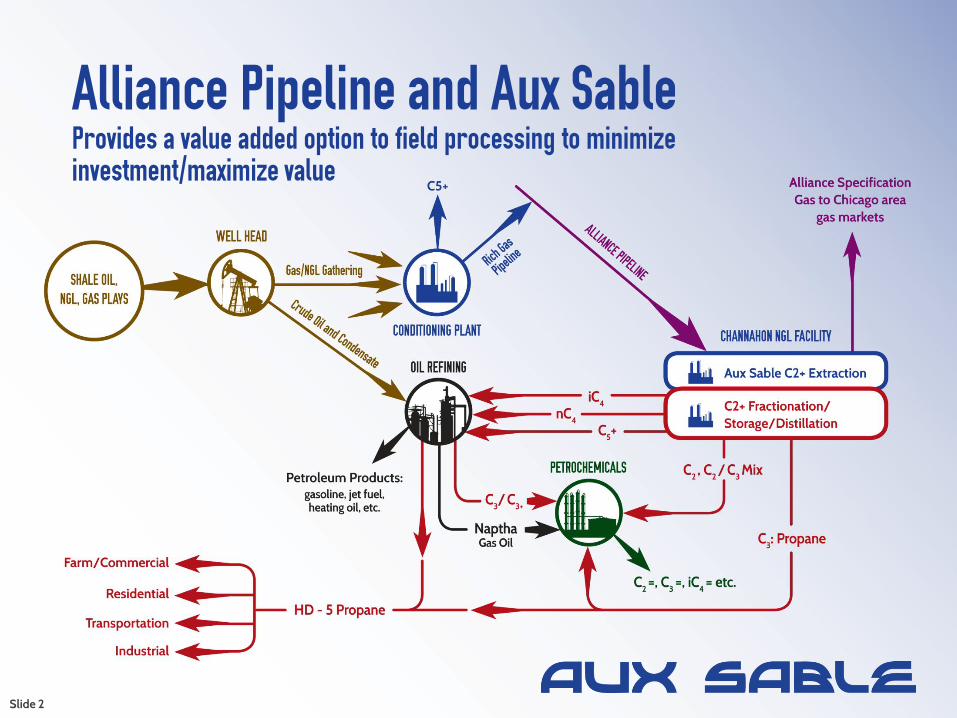
Alliance Pipeline and Aux Sable Provides a value added option to field processing to minimize investment/maximize value
Slide 2

Slide 3
Outline Overview of North American NGL markets Fundamentals of “Rich” Gas Production in North
America Key Attributes of the Alliance and Aux Sable assets What do Producers want? Summary Questions

Natural Gas and NGL Value ChainNatural Gas Production
Processing & Treating
Natural Gas Transmission Straddle Plant Natural Gas
Transmission
NGL Fractionation
NGL Storage
NGL Product Transportation
Natural Gas Storage
Residential/Commercial/
IndustrialPower Plants
Natural Gas Distribution
C2+ or C3+
C2+ or C3+
C2+NGL Raw Mix Transportation
Refined Products
Petrochem Industry
Residential/Commercial
C2+
Slide 4
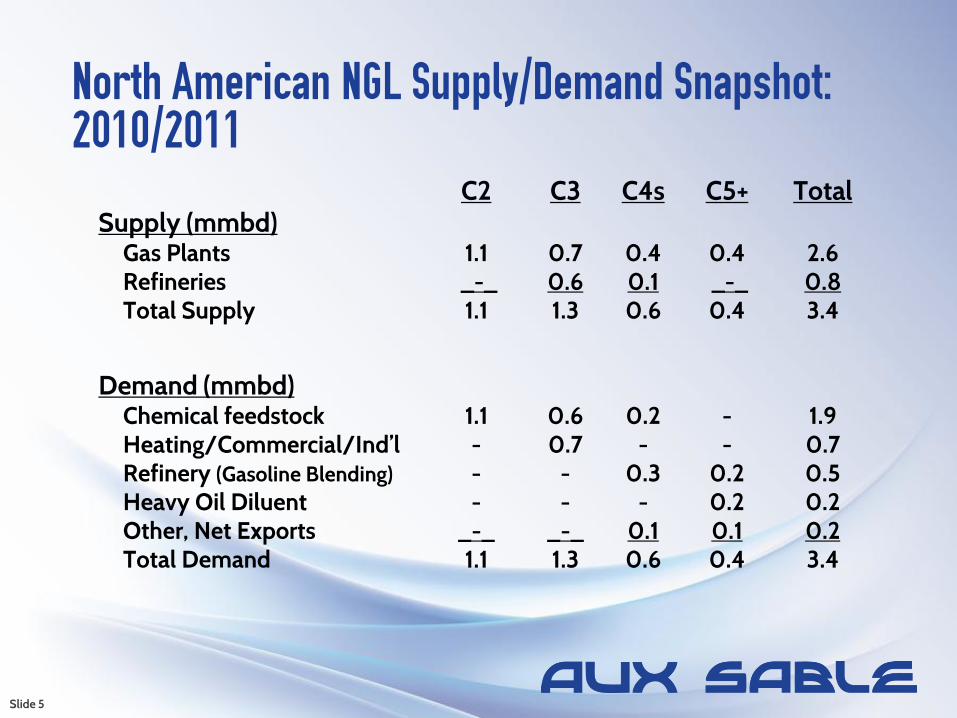
C2 C3 C4s C5+ TotalSupply (mmbd)
Gas Plants 1.1 0.7 0.4 0.4 2.6Refineries _-_ 0.6 0.1 _-_ 0.8Total Supply 1.1 1.3 0.6 0.4 3.4
Demand (mmbd)Chemical feedstock 1.1 0.6 0.2 - 1.9Heating/Commercial/Ind’l - 0.7 - - 0.7Refinery (Gasoline Blending) - - 0.3 0.2 0.5Heavy Oil Diluent - - - 0.2 0.2Other, Net Exports _-_ _-_ 0.1 0.1 0.2Total Demand 1.1 1.3 0.6 0.4 3.4
North American NGL Supply/Demand Snapshot:2010/2011
Slide 5

North American NGL Infrastructure
Slide 6
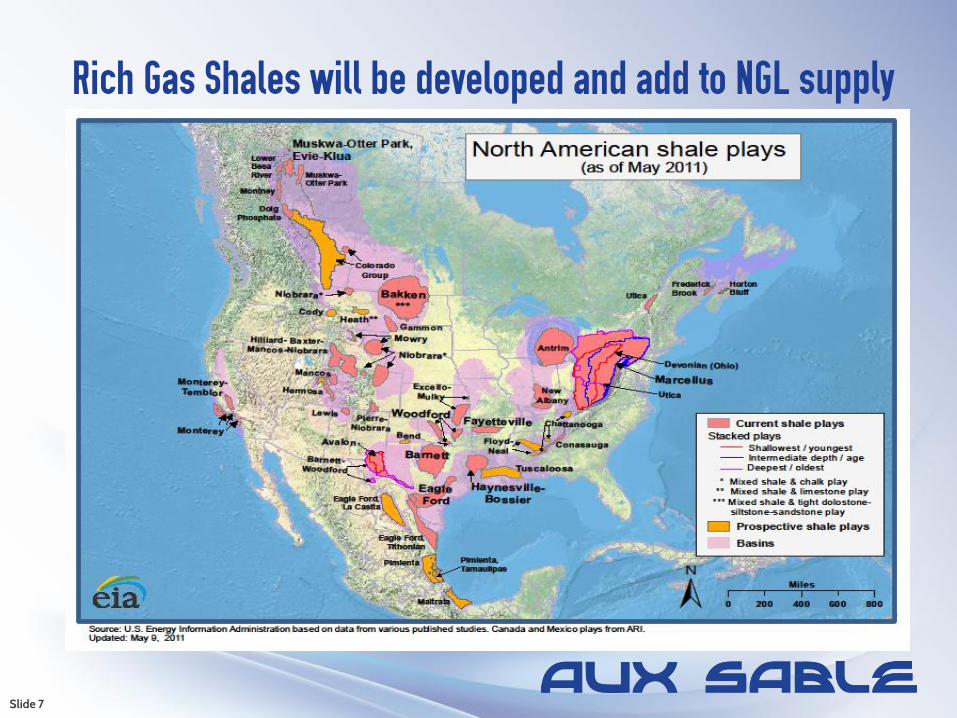
Rich Gas Shales will be developed and add to NGL supply
Slide 7

The Push to Develop Rich Gas and NGLs
-
5
10
15
20
25
30
35
40
2006 2008 2010 2012 2014 2016 2018 2020
Bcf
/d
Western Canada
All Other US
Eagle Ford
Bakken
Utica
Marcellus
Haynesville /1
Fayetteville
Barnett
Woodford
Source: ICF International
Slide 8
Shale gas has driven a dramatic increase in gas production
Low gas netbacks have forced focus on developing oil/rich gas shales deposits
New NGL infrastructure required to recover, process and transport spec product markets to end markets
NGL supply volumes are increasing significantly and will outstrip demand without new markets
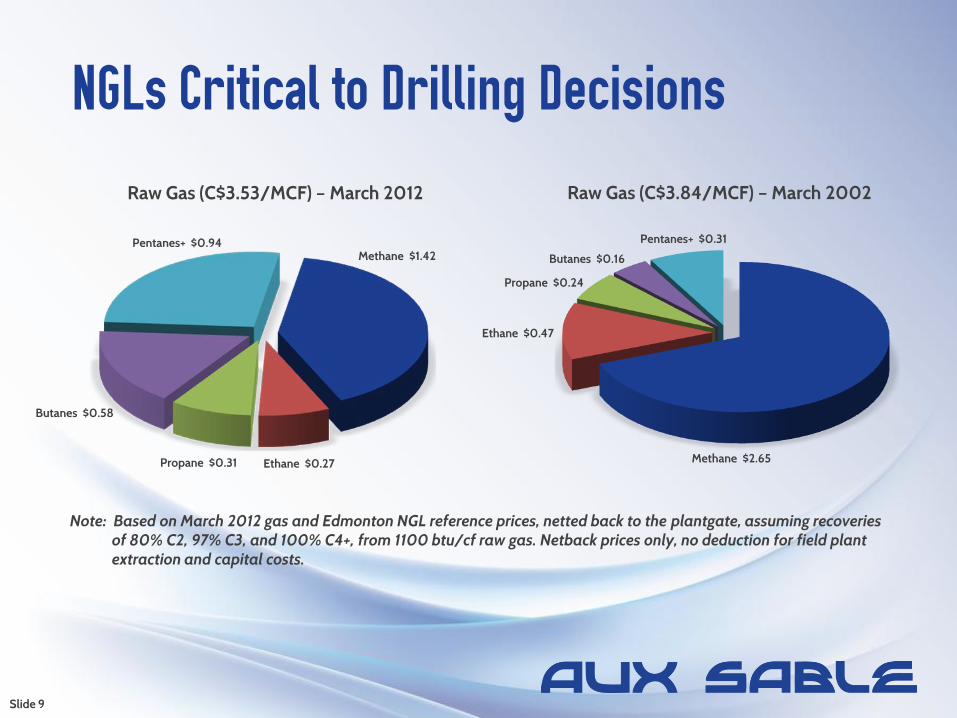
NGLs Critical to Drilling Decisions
Note: Based on March 2012 gas and Edmonton NGL reference prices, netted back to the plantgate, assuming recoveries of 80% C2, 97% C3, and 100% C4+, from 1100 btu/cf raw gas. Netback prices only, no deduction for field plant extraction and capital costs.
Raw Gas (C$3.53/MCF) – March 2012 Raw Gas (C$3.84/MCF) – March 2002
Methane $1.42Pentanes+ $0.94
Ethane $0.27Propane $0.31
Butanes $0.58
Methane $2.65
Pentanes+ $0.31
Ethane $0.47
Propane $0.24
Butanes $0.16
Slide 9

Mont Belvieu
Conway
Sarnia (2.6 B lbs/Yr)
Fort Saskatchewan (2.6 B lbs/Yr)
Chicago
ENTERPRISE ONEOK
COCHIN
ENBRIDGE
ALLIANCE
PTC Empress
Salt Storage
ENTERPRISE
Cochrane
AEGS
North American Ethylene Plants
Slide 10
Extraction Facilities
Ethylene Plant
Joffre (6.0 B lbs/Yr)
USGC (55 B lbs/Yr)
Clinton (1.1 B lbs/Yr)
Morris (1.3 B lbs/Yr) Calvert City
(0.4 B lbs/Yr)

0%
10%
20%
30%
40%
50%
60%
70%
80%
90%
100%
C2 C3 nC4 Naphtha Gas Oil
Typical Olefins Cracker Yields
Ethylene Propylene Butadiene/Butylenes SC Naphtha SC Gas Oil Fuel Gas
Slide 11

IHS CMAI Global Ethylene Cash Costs
Slide 12
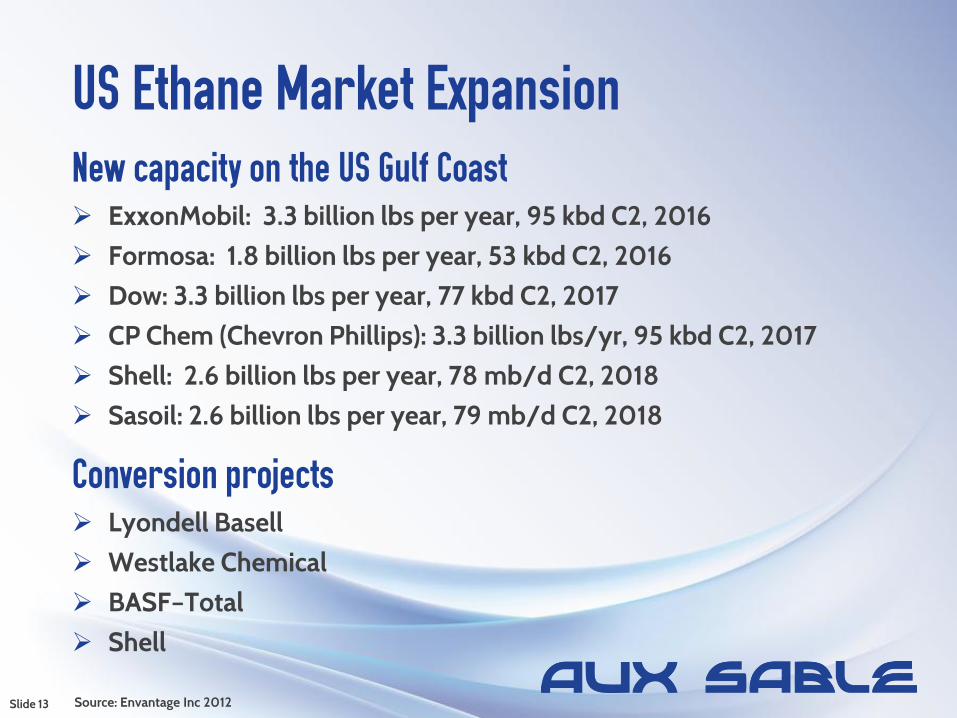
US Ethane Market ExpansionNew capacity on the US Gulf Coast ExxonMobil: 3.3 billion lbs per year, 95 kbd C2, 2016 Formosa: 1.8 billion lbs per year, 53 kbd C2, 2016 Dow: 3.3 billion lbs per year, 77 kbd C2, 2017 CP Chem (Chevron Phillips): 3.3 billion lbs/yr, 95 kbd C2, 2017 Shell: 2.6 billion lbs per year, 78 mb/d C2, 2018 Sasoil: 2.6 billion lbs per year, 79 mb/d C2, 2018
Conversion projects Lyondell Basell Westlake Chemical BASF–Total Shell
Slide 13 Source: Envantage Inc 2012

Max US Ethane Supply vs Max Demand (1000 BPD)
Source: Envantage Inc 2012
US Ethane Supply/Demand Growth
Slide 14

LPG Netbacks from Growing Export Markets
Netbacks (March 2012, US cpg) US Gulf Coast to Japan US Gulf Coast to NWE
C3Market Price
Less:Mont Belvieu PriceTanker LoadingFreight
Subtotal
Margin
201
1261323
162
39
186
1261313
152
34
C4Market Price
Less:Mont Belvieu PriceTanker LoadingFreight
Subtotal
Margin
236
1856
26217
19
211
1856
15206
5
Source: Waterborne LPG Report & Petral, March 2012
Exports of propane from the US Gulf Coast enjoy strong netbacks vs domestic prices.
Slide 15
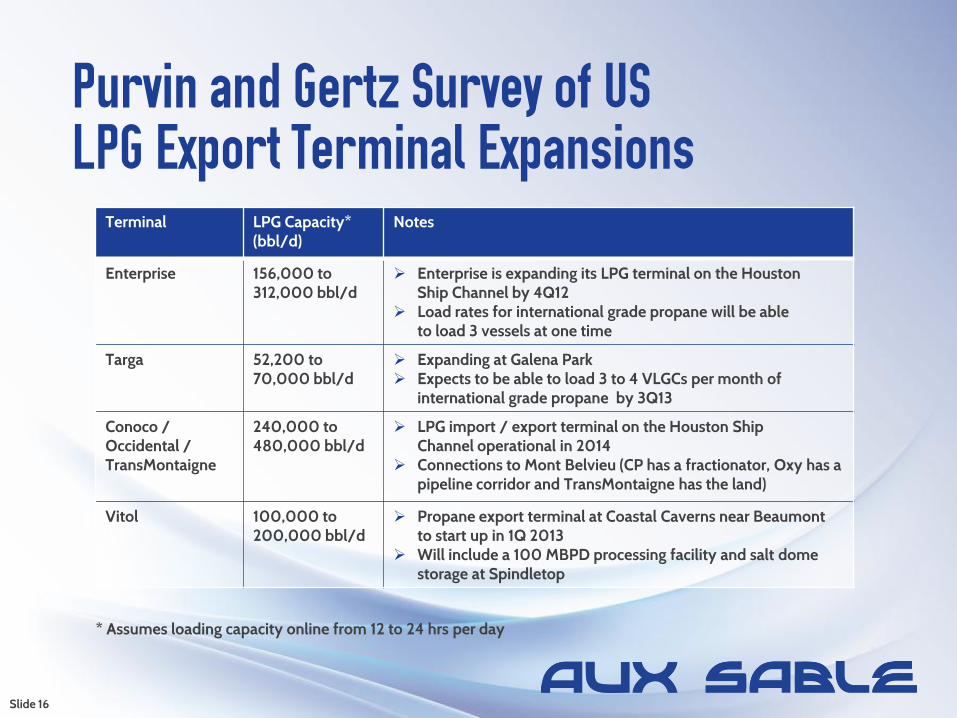
Purvin and Gertz Survey of US LPG Export Terminal Expansions
Terminal LPG Capacity*(bbl/d)
Notes
Enterprise 156,000 to 312,000 bbl/d
Enterprise is expanding its LPG terminal on the Houston Ship Channel by 4Q12
Load rates for international grade propane will be able to load 3 vessels at one time
Targa 52,200 to 70,000 bbl/d
Expanding at Galena Park Expects to be able to load 3 to 4 VLGCs per month of
international grade propane by 3Q13
Conoco / Occidental / TransMontaigne
240,000 to 480,000 bbl/d
LPG import / export terminal on the Houston Ship Channel operational in 2014
Connections to Mont Belvieu (CP has a fractionator, Oxy has a pipeline corridor and TransMontaigne has the land)
Vitol 100,000 to 200,000 bbl/d
Propane export terminal at Coastal Caverns near Beaumont to start up in 1Q 2013
Will include a 100 MBPD processing facility and salt dome storage at Spindletop
* Assumes loading capacity online from 12 to 24 hrs per day
Slide 16
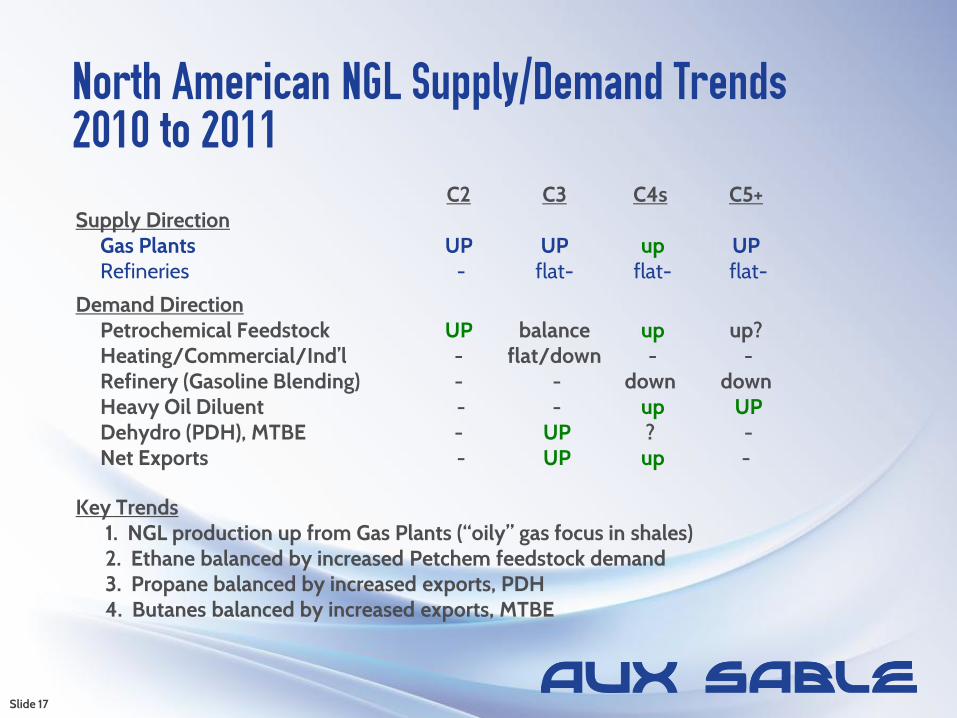
C2 C3 C4s C5+Supply Direction
Gas Plants UP UP up UPRefineries - flat- flat- flat-
Demand DirectionPetrochemical Feedstock UP balance up up?Heating/Commercial/Ind’l - flat/down - -Refinery (Gasoline Blending) - - down downHeavy Oil Diluent - - up UPDehydro (PDH), MTBE - UP ? -Net Exports - UP up -
Key Trends1. NGL production up from Gas Plants (“oily” gas focus in shales)2. Ethane balanced by increased Petchem feedstock demand3. Propane balanced by increased exports, PDH4. Butanes balanced by increased exports, MTBE
North American NGL Supply/Demand Trends2010 to 2011
Slide 17
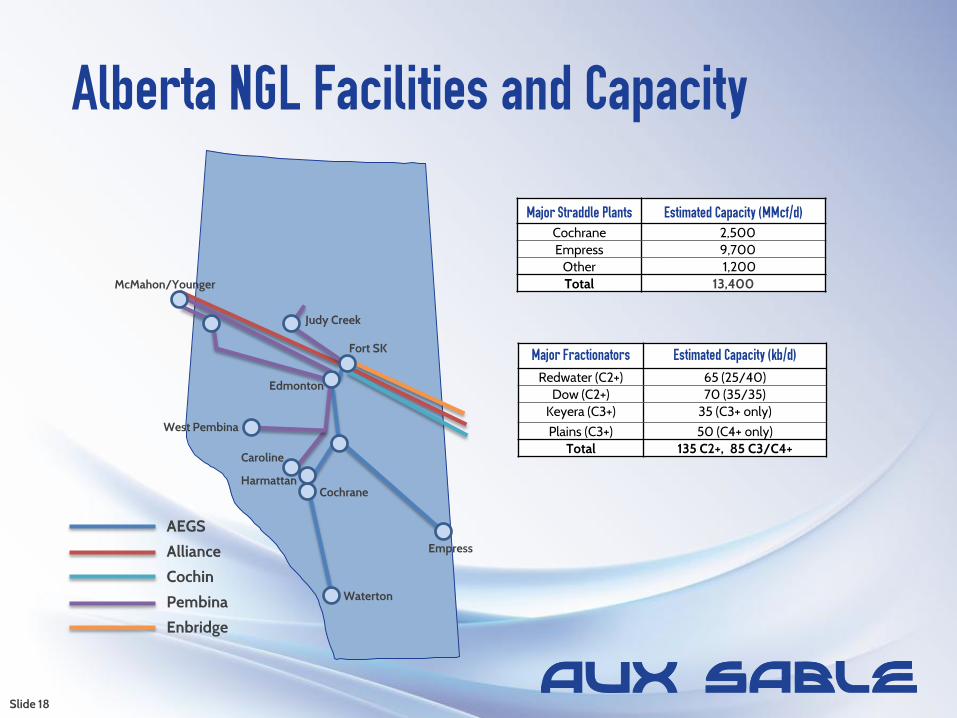
Alberta NGL Facilities and Capacity
Major Straddle Plants Estimated Capacity (MMcf/d)Cochrane 2,500Empress 9,700
Other 1,200Total 13,400
Major Fractionators Estimated Capacity (kb/d)
Redwater (C2+) 65 (25/40)Dow (C2+) 70 (35/35)
Keyera (C3+) 35 (C3+ only)
Plains (C3+) 50 (C4+ only)Total 135 C2+, 85 C3/C4+
McMahon/Younger
Judy Creek
Fort SK
Edmonton
West Pembina
Caroline
HarmattanCochrane
Empress
Waterton
AEGS
Alliance
Cochin
Pembina
Enbridge
Slide 18
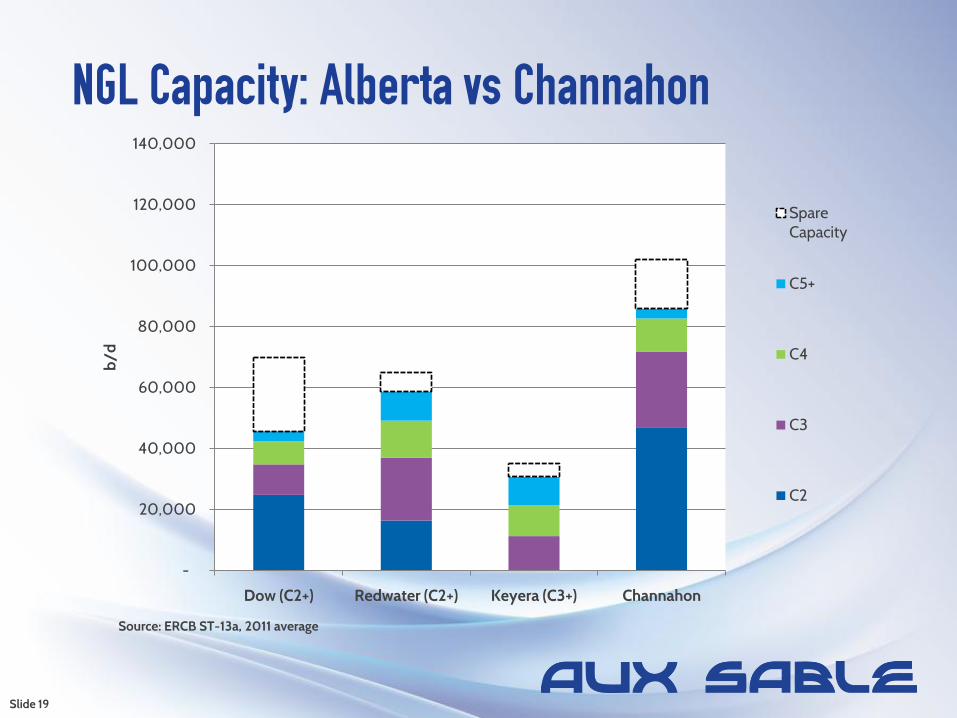
NGL Capacity: Alberta vs Channahon
Source: ERCB ST-13a, 2011 average
-
20,000
40,000
60,000
80,000
100,000
120,000
140,000
Dow (C2+) Redwater (C2+) Keyera (C3+) Channahon
b/d
Spare Capacity
C5+
C4
C3
C2
Slide 19
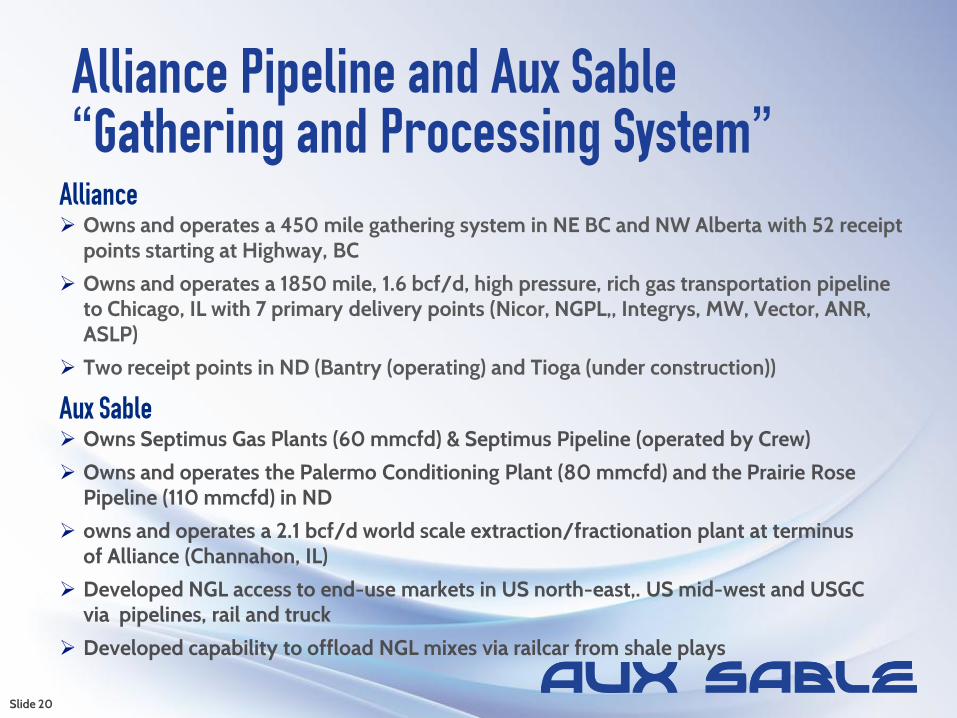
Alliance Pipeline and Aux Sable “Gathering and Processing System”
Alliance Owns and operates a 450 mile gathering system in NE BC and NW Alberta with 52 receipt
points starting at Highway, BC
Owns and operates a 1850 mile, 1.6 bcf/d, high pressure, rich gas transportation pipeline to Chicago, IL with 7 primary delivery points (Nicor, NGPL,, Integrys, MW, Vector, ANR, ASLP)
Two receipt points in ND (Bantry (operating) and Tioga (under construction))
Aux Sable Owns Septimus Gas Plants (60 mmcfd) & Septimus Pipeline (operated by Crew)
Owns and operates the Palermo Conditioning Plant (80 mmcfd) and the Prairie Rose Pipeline (110 mmcfd) in ND
owns and operates a 2.1 bcf/d world scale extraction/fractionation plant at terminus of Alliance (Channahon, IL)
Developed NGL access to end-use markets in US north-east,. US mid-west and USGC via pipelines, rail and truck
Developed capability to offload NGL mixes via railcar from shale plays
Slide 20
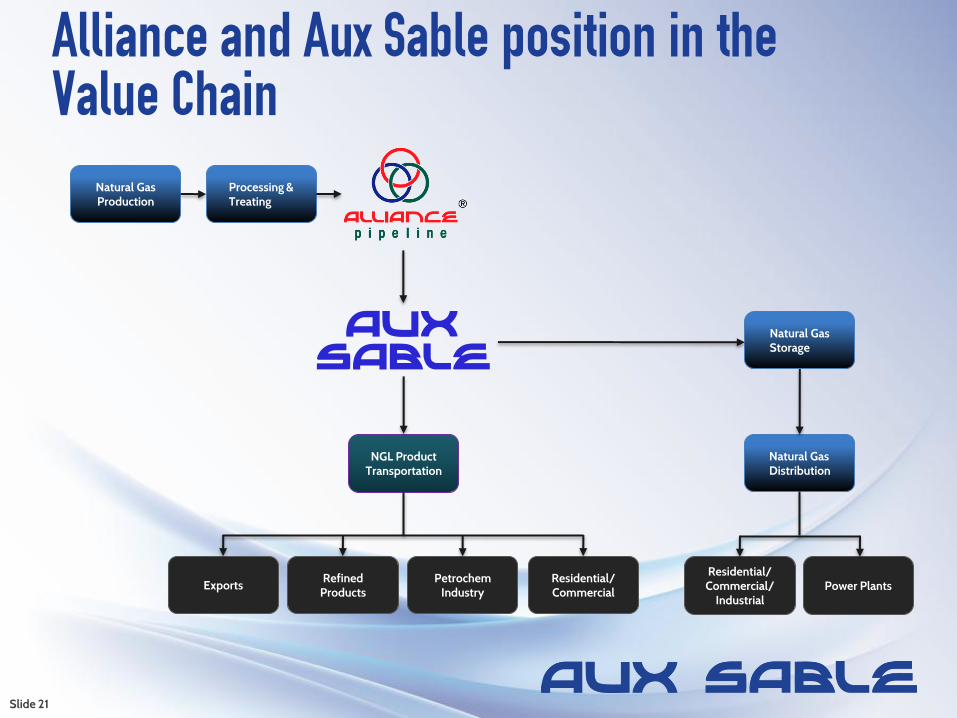
Alliance and Aux Sable position in the Value Chain
Natural Gas Production
Processing & Treating
NGL Product Transportation
Refined Products
Petrochem Industry
Residential/Commercial
Natural Gas Storage
Residential/Commercial/
IndustrialPower Plants
Natural Gas Distribution
Exports
Slide 21

Alliance Pipeline Receipt Points
Slide 22
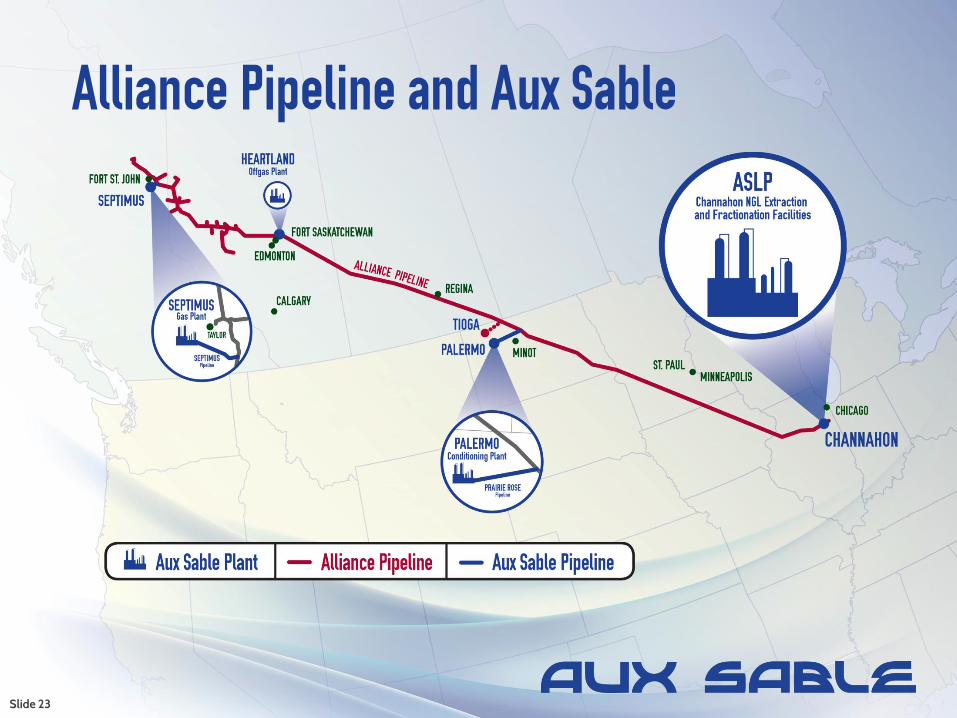
Alliance Pipeline and Aux Sable
Slide 23

Alliance Pipeline and Aux Sable Provides a value added option to field processing to minimize investment/maximize value
Slide 24

What do Producers want? Value for their rich gas production against liquid markets
Access to infrastructure that meets their needs, provides reliable takeaway and is shaped to their production profile as they develop their reserves
Minimum capital investment for field processing and extraction
Minimum commitments to NGL pipeline and processing fees
Access to liquid, transparent markets for pricing and hedging
Recognition of NGLs as liquid production (versus gas equivalent)
Slide 25

Aux Sable rich gas premiums (RGPs) provide value to WCSB gas producers for NGLs, allowing producers to: Avoid costly field plant investments Capture NGL value not available on NGTL system Direct greater resources to gas drilling activities Increase netbacks at plantgate Allows producer to record barrel reserves
The APL-AS system value proposition provides a competitive alternative for producers to maximize value of rich shale gas………also applies to Bakken shale oil play
Greater connectivity for BC/AB & Bakken NGLs/gas to liquid markets increases value of rich gas to producers who commit to use the system
Recent RGP deals in the public domain:— TRILOGY: “Eliminates 2011 and 2012 capital expenditures of approximately $55 Million
for new deep-cut gas plant”— CEQUENCE: “Increase in realized product price”; “Resulting increase to recent netbacks
of approximately $3.00 per boe” — CELTIC: “Eliminates for requirement to incur additional capital expenditures of
approximately 75 MM$”
Aux Sable Rich Gas Premiums
Slide 26
Summary Significant new volumes of NGLs will be produced in North America
driven by high NGL frac spread, low gas prices and rich gas directed drilling activities
Frac spreads have structurally shifted to a new higher level that will can be sustained…..US frac spreads will cycle as supply/demand evolves— Ethane demand increases based on C2=/PE production for export— Propane will be exported via waterborne markets, PD to C3=
Significant midstream infrastructure investments are required in the WCSB, Bakken shale plays to connect gas/NGLs to liquid markets
The Alliance Pipeline and Aux Sable provide a competitive alternative to realize value and meet producers’ needs
Slide 27


