Fixed Income Research
© Nomura Securities International, Inc.
MBS Basics
Mark H. Adelson Director–Head of Structured Finance Research
Nomura Securities International, Inc.
Thacher Proffitt & Wood New York, Tuesday, 11 April 2006
Fixed Income Research
2 © Nomura Securities International, Inc.
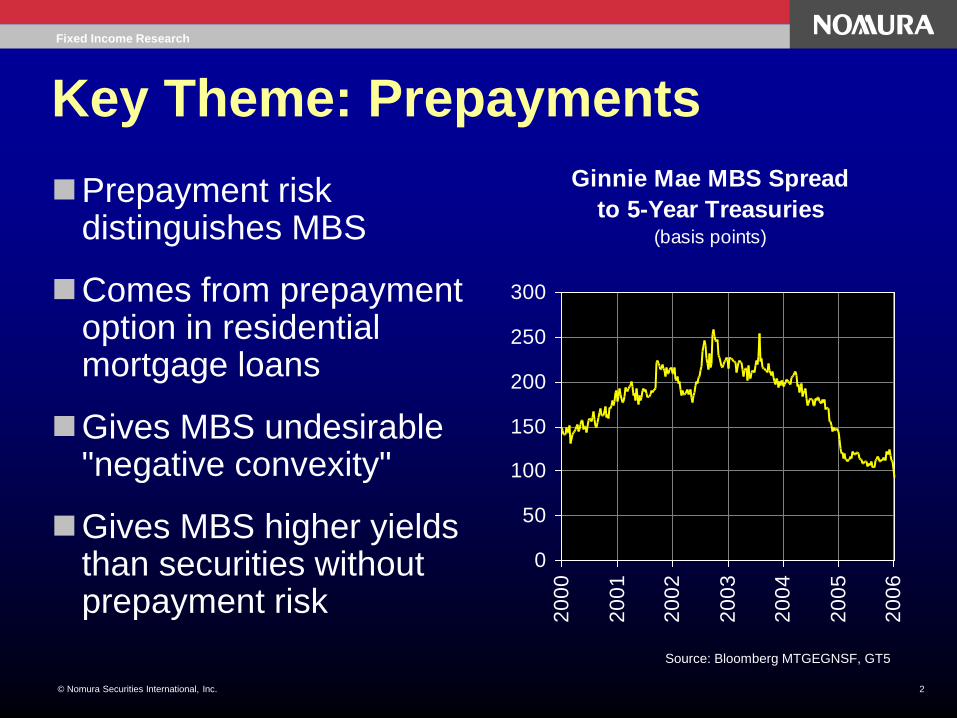
Key Theme: Prepayments
Prepayment risk distinguishes MBS
Comes from prepayment option in residential mortgage loans
Gives MBS undesirable "negative convexity"
Gives MBS higher yields than securities without prepayment risk
Ginnie Mae MBS Spread
to 5-Year Treasuries(basis points)
0
50
100
150
200
250
300
20
00
20
01
20
02
20
03
20
04
20
05
20
06
Source: Bloomberg MTGEGNSF, GT5

Fixed Income Research
3 © Nomura Securities International, Inc.
Why Focus on MBS
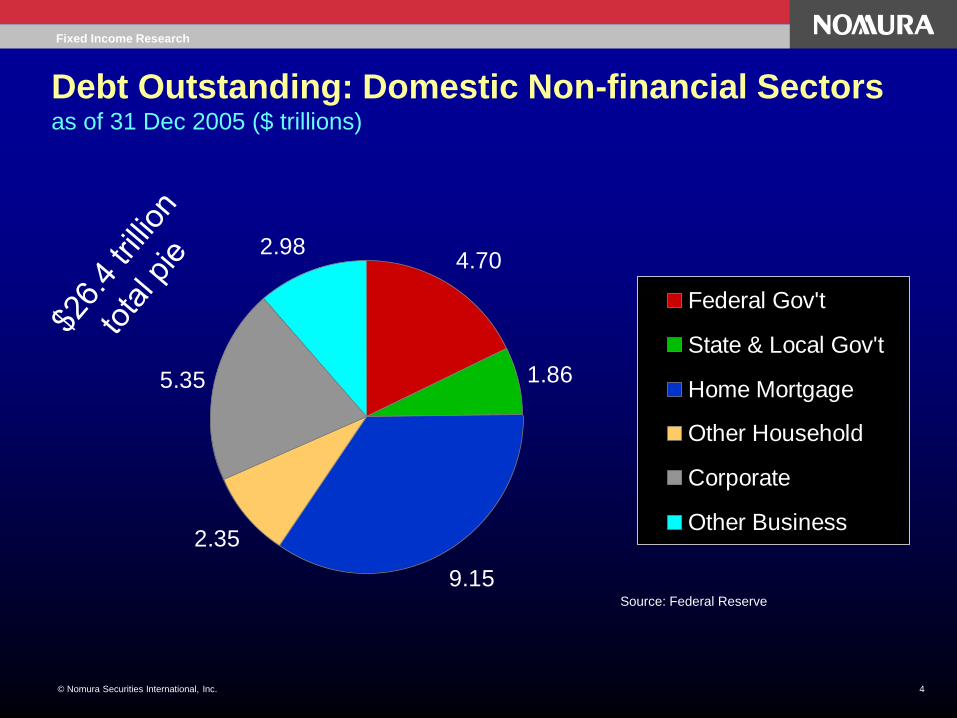
Mortgages are a big slice of all U.S. debt
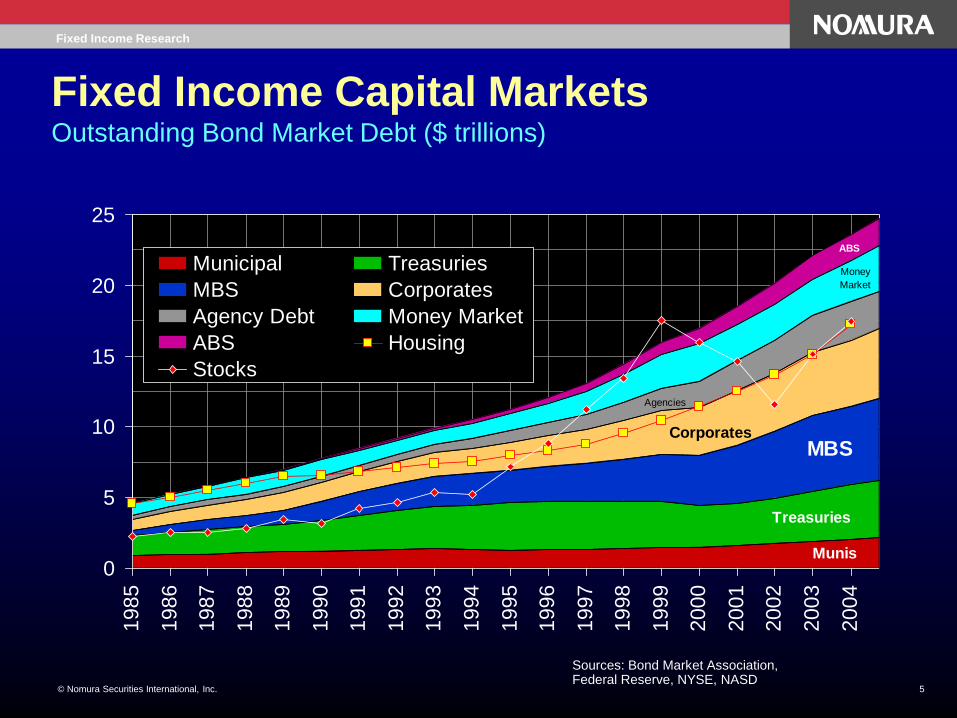
MBS are a big slice of the bond market
MBS are the biggest slice of the securitization
market
MBS is the original source of securitization
technology
Understanding MBS is helpful (often essential) to
understanding other types of securitizations
Fixed Income Research
4 © Nomura Securities International, Inc.
Debt Outstanding: Domestic Non-financial Sectors as of 31 Dec 2005 ($ trillions)
4.70
1.86
9.15
2.35
5.35
2.98
Federal Gov't
State & Local Gov't
Home Mortgage
Other Household
Corporate
Other Business
Source: Federal Reserve
Fixed Income Research
5 © Nomura Securities International, Inc.
Fixed Income Capital Markets Outstanding Bond Market Debt ($ trillions)
0
5
10
15
20
25
1985
1986
1987
1988
1989
1990
1991
1992
1993
1994
1995
1996
1997
1998
1999
2000
2001
2002
2003
2004
Municipal Treasuries
MBS Corporates
Agency Debt Money Market
ABS Housing
Stocks
Treasuries
MBSCorporates
Munis
Money
Market
ABS
Agencies
Sources: Bond Market Association, Federal Reserve, NYSE, NASD
Fixed Income Research
6 © Nomura Securities International, Inc.
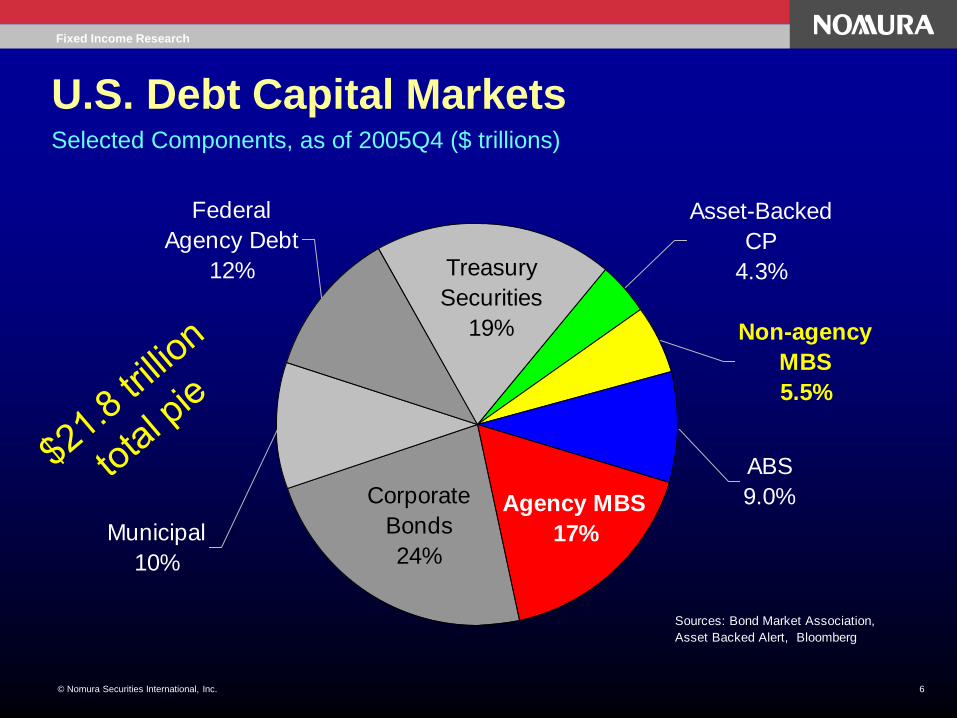
U.S. Debt Capital Markets Selected Components, as of 2005Q4 ($ trillions)
Federal
Agency Debt
12%
Corporate
Bonds
24%
Agency MBS
17%Municipal
10%
Asset-Backed
CP
4.3%
Non-agency
MBS
5.5%
ABS
9.0%
Treasury
Securities
19%
Sources: Bond Market Association,
Asset Backed Alert, Bloomberg
Fixed Income Research
7 © Nomura Securities International, Inc.
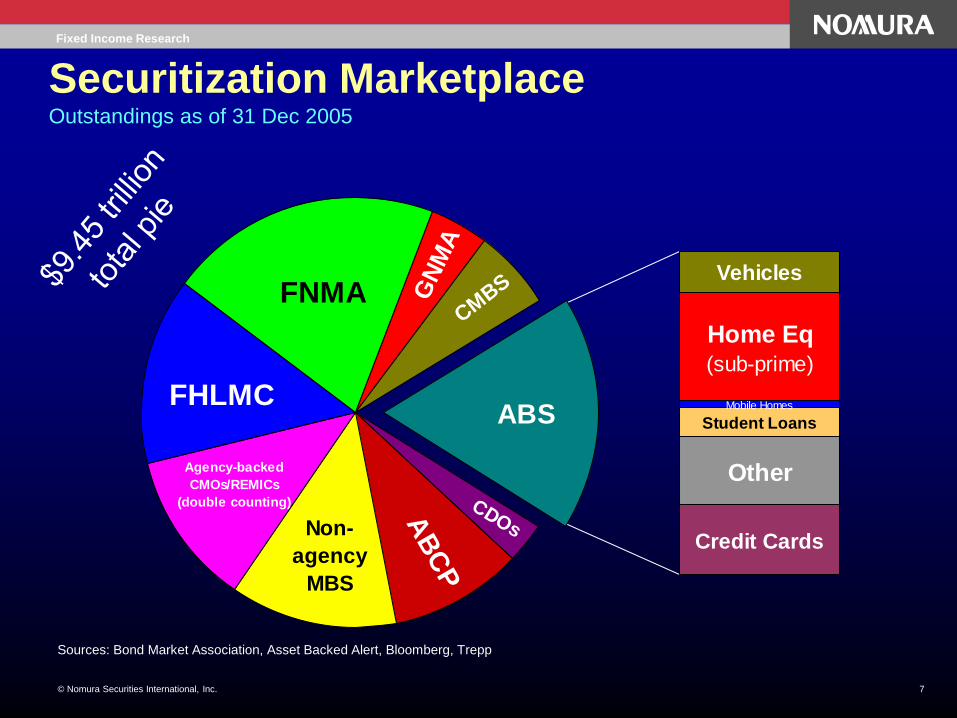
Securitization Marketplace Outstandings as of 31 Dec 2005
Mobile Homes
Student Loans
Credit Cards
Other
ABS
CMBS
CDOs
GN
MA
FHLMC
Agency-backed
CMOs/REMICs
(double counting)
Non-
agency
MBS
AB
CP
Home Eq(sub-prime)
FNMAVehicles
Sources: Bond Market Association, Asset Backed Alert, Bloomberg, Trepp
Fixed Income Research
8 © Nomura Securities International, Inc.
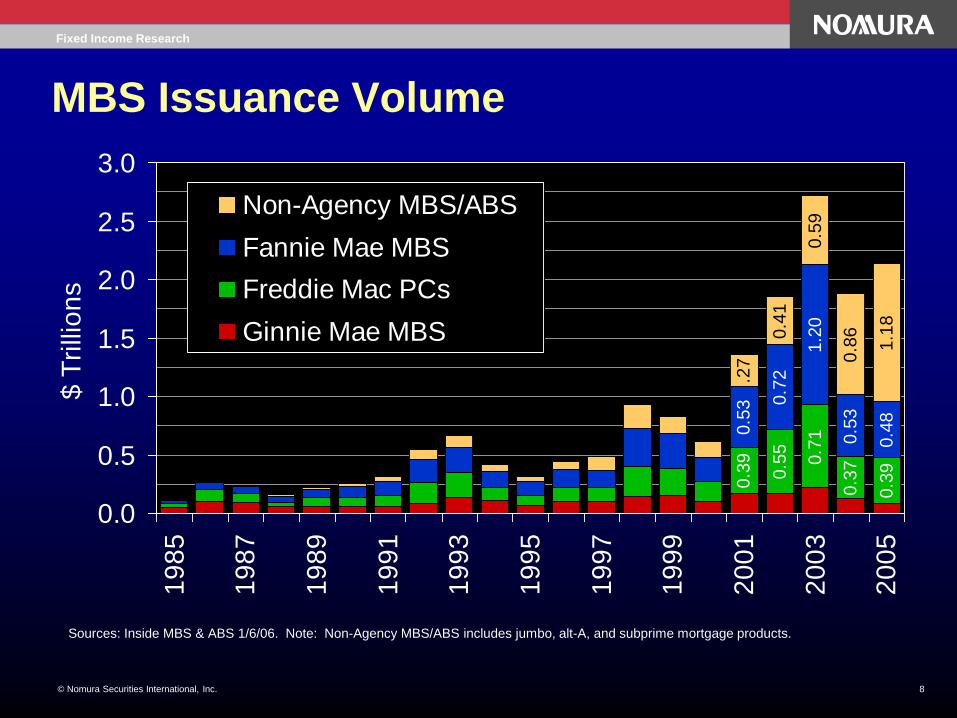
MBS Issuance Volume
0.3
9
0.5
5
0.7
1
0.3
7
0.3
9
0.5
3 0.7
2
1.2
0
0.5
3
0.4
8
0.4
1
0.5
9
0.8
6
1.1
8
.27
0.0
0.5
1.0
1.5
2.0
2.5
3.01
98
5
19
87
19
89
19
91
19
93
19
95
19
97
19
99
20
01
20
03
20
05
$ T
rilli
on
s
Non-Agency MBS/ABS
Fannie Mae MBS
Freddie Mac PCs
Ginnie Mae MBS
Sources: Inside MBS & ABS 1/6/06. Note: Non-Agency MBS/ABS includes jumbo, alt-A, and subprime mortgage products.
Fixed Income Research
9 © Nomura Securities International, Inc.
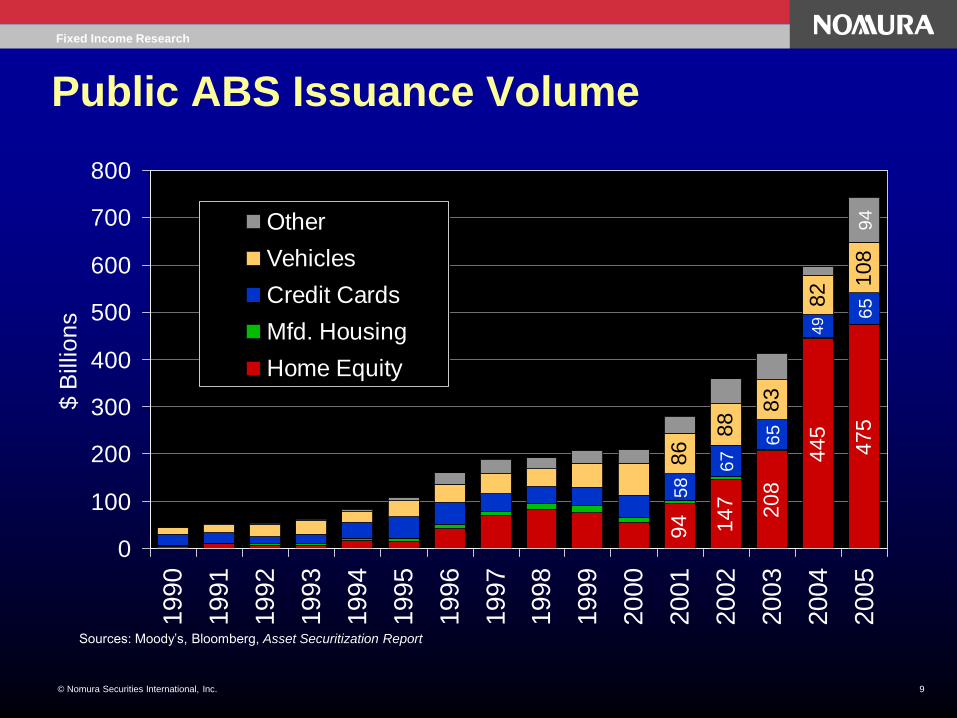
Public ABS Issuance Volume
94 147 208
475
445
65
49
65
67
58
108
82
83
88
86
94
0
100
200
300
400
500
600
700
8001990
1991
1992
1993
1994
1995
1996
1997
1998
1999
2000
2001
2002
2003
2004
2005
$ B
illio
ns
Other
Vehicles
Credit Cards
Mfd. Housing
Home Equity
Sources: Moody’s, Bloomberg, Asset Securitization Report

Fixed Income Research
10 © Nomura Securities International, Inc.
Mortgage Loan Basics
Traditional loan is 30-year, fixed rate, fully amortizing,
payable monthly, and prepayable at any time
Variations
15-year, 20-year
adjustable interest rate (ARMs)
index
caps
hybrid (fixed/adjustable)
Affordability features: interest only, negative am., 40-year
Specialty mortgage products: alt-A, sub-prime
Fixed Income Research
11 © Nomura Securities International, Inc.
Refinancing: A Valuable Option
Fixed rate loans
When interest rates fall, a borrower can refinance his loan at a
lower interest rate
When interest rates rise, a borrower has the benefit of having
locked-in a lower rate in the past
Floating rate loans
When hybrid loan resets borrower can refinance to new hybrid or
to fixed
When interest rates fall, a borrower has the ability to "permanently"
lock-in the benefit of the low rates by refinancing into a fixed rate
loan

Fixed Income Research
12 © Nomura Securities International, Inc.
Mortgage Loan = A Bond minus an Option
Bond portion: obligation to pay principal and interest in
monthly installments
Option portion: opportunity to "call" (purchase) the bond at
a price of par, at any time
Lender is long the bond and short the option
Borrower is short the bond and long the option
Jargon: Mortgage loan contains an embedded short option
Value of a mortgage loan is the value of the bond minus
the value of the option
Valuing the option is hard to do

Fixed Income Research
13 © Nomura Securities International, Inc.
MBS Basic Features (GSE MBS)
Pass-through security
Monthly collections of interest and principal, including prepayments, "passed through" to investors
Servicer collects payments from borrowers (for a fee)
GSE guarantee protects investors from credit risk on loans
Pass-through rate is like an interest rate on the MBS
Lower than the interest rates on the loans
Difference is the servicing fee plus the guarantee fee
Loans backing an MBS are generally similar
Interest rates
Loan maturities

Fixed Income Research
14 © Nomura Securities International, Inc.
Basic MBS Cash Flow
Homeowners
Servicer
Investors
Monthly P&I at
the mortgage
rate (e.g. 6.5%)
Monthly P&I at
the pass-through
rate (e.g. 6.0%)
Homeowners make monthly
payments of principal and
interest at the mortgage rate.
The servicer retains a portion
of the interest component of
each monthly payment as the
"servicing fee."
The pass-through rate is the
mortgage rate net of the
servicing fee rate.
$
$

Fixed Income Research
15 © Nomura Securities International, Inc.
Ginnie Mae – GNMA
Guarantees securities issued by banks and mortgage
banks that participate in Ginnie Mae programs
Part of HUD
Loans have federal insurance or guarantees (e.g. FHA or
VA; usually low- or moderate income borrowers)
Full faith and credit guarantee
0% risk weight for bank capital
GN I: All loans have same interest rate
GN II: Loan rates in 0.75% band
Competes with sub-prime mortgage ABS for loans

Fixed Income Research
16 © Nomura Securities International, Inc.
Fannie Mae (FNMA) & Freddie Mac (FHLMC)
Private corporations, federally chartered & regulated
Directly issue MBS
Accept conventional mortgage loans < $417,000
Cash and swap programs for lenders
Regular and special servicing
with and without recourse; most sellers choose without
Guarantees its own MBS against credit losses on the underlying loans
Guarantee is not backed by the government
20% risk weight
Loan Interest rates usually in 1.75% band
Fixed Income Research
17 © Nomura Securities International, Inc.
Private-Label MBS
Issued by private companies
No GSE guarantee
Rated securities w/ credit support
Subordinate tranches absorb losses before senior tranches
Mortgage loan credit quality:
Collateral – loan-to-value ratio (LTV)
Credit – credit score (FICO)
Capacity – debt-to-income ratio (DTI)
Jumbo: loans above conforming limit
Alt-A: loans that contain non-standard features but which have borrowers of "A" creditworthiness
Securities backed by sub-prime mortgage loans are classified as "home equity ABS" rather than MBS

Fixed Income Research
18 © Nomura Securities International, Inc.
Reallocating Credit Risk – Tranching
Pool of
Loans
Residual - NR
Class D - Baa2
Class C - A2
Class B -
Aa2
Class A -
Aaa
Underlying Assets Securities
Fir
st L
oss A
lloca
tio
n L
ast
Hig
he
st R
isk L
ow
est

Fixed Income Research
19 © Nomura Securities International, Inc.
More on Credit Enhancement
Subordination
Six pack structure (jumbo and "true" alt-A)
Prepayment lockout: seven years or 2 subordination, phase-out, triggers
Excess spread/OC structure (sub-prime and weak alt-A)
Use ES to cover current losses and build OC (turbo)
Surplus ES to residual class
Principal lockout w/ triggers (3 years or 2)
Fast pay, no pay
Reserve Fund
Bond Insurance, guarantees
Fixed Income Research
20 © Nomura Securities International, Inc.
MBS Trading
TBA (to be announced) pools traded generically
Coupon stack
Cheapest to deliver strategy
Specified pools – investor knows exactly what he will get
but he must pay more and can pick only from what is
available
BloombergSM system provides much information
The whole GSE MBS market settles trades according to a
fixed monthly cycle
Fixed Income Research
21 © Nomura Securities International, Inc.
MBS Valuation
Dynamic analysis
Prepayment models and assumptions
Interest rate simulations
Option adjusted spread (OAS) analysis:
Applies a fixed spread over benchmark interest rates to calculate a
simulated price for the security under each scenario, as well as the
average of the simulated prices across all scenarios
Adjusts the fixed spread and repeats the calculation process until the
average of the simulated prices across all scenarios converges to the
actual market price
Reported OAS is the fixed spread that equates the average of the
simulated prices to the actual market price of the security
MBS values falls when interest rates are more volatile
Private label also must consider credit risk

Fixed Income Research
22 © Nomura Securities International, Inc.
Positive vs. Negative Convexity
$700
$900
$1,100
$1,300
$1,500
$1,700
2% 3% 4% 5% 6% 7% 8% 9% 10%
Market Yields
Price
5 Yr. Bond 10 Yr. Bond
30 Yr. Bond MBS
Fixed Income Research
23 © Nomura Securities International, Inc.
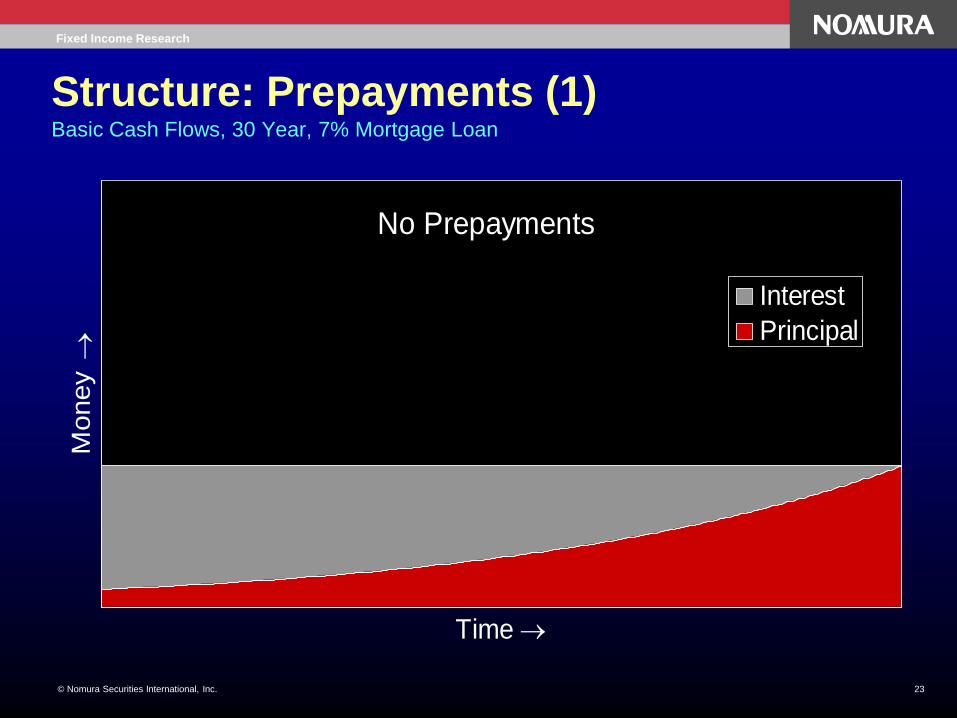
Structure: Prepayments (1) Basic Cash Flows, 30 Year, 7% Mortgage Loan
No Prepayments
Time
Money
Interest
Principal

Fixed Income Research
24 © Nomura Securities International, Inc.
Structure: Prepayments (2) Principal Cash Flows, 30 Year, 7% Mortgage Loan
No Prepayments
Time
Money
Principal
Fixed Income Research
25 © Nomura Securities International, Inc.
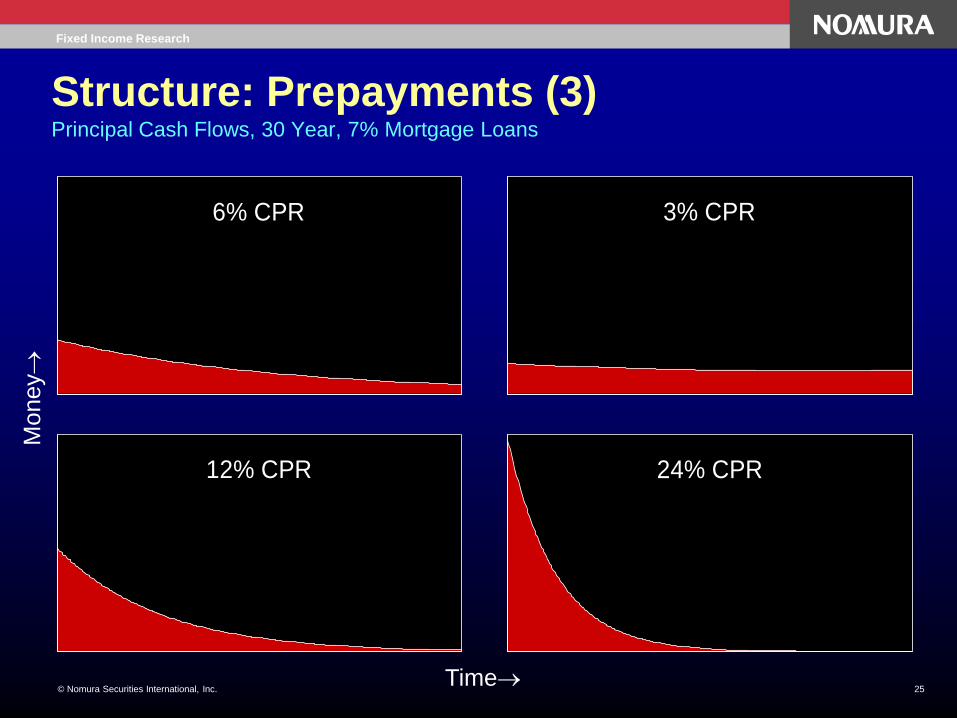
Structure: Prepayments (3) Principal Cash Flows, 30 Year, 7% Mortgage Loans
6% CPR 3% CPR
12% CPR 24% CPR
Time
Money

Fixed Income Research
26 © Nomura Securities International, Inc.
Structure: Prepayments (4) Principal Cash Flows, 30 Year, 7% Mortgage Loans
100% PSA 50% PSA
200% PSA 400% PSA
Time
Money
Fixed Income Research
27 © Nomura Securities International, Inc.
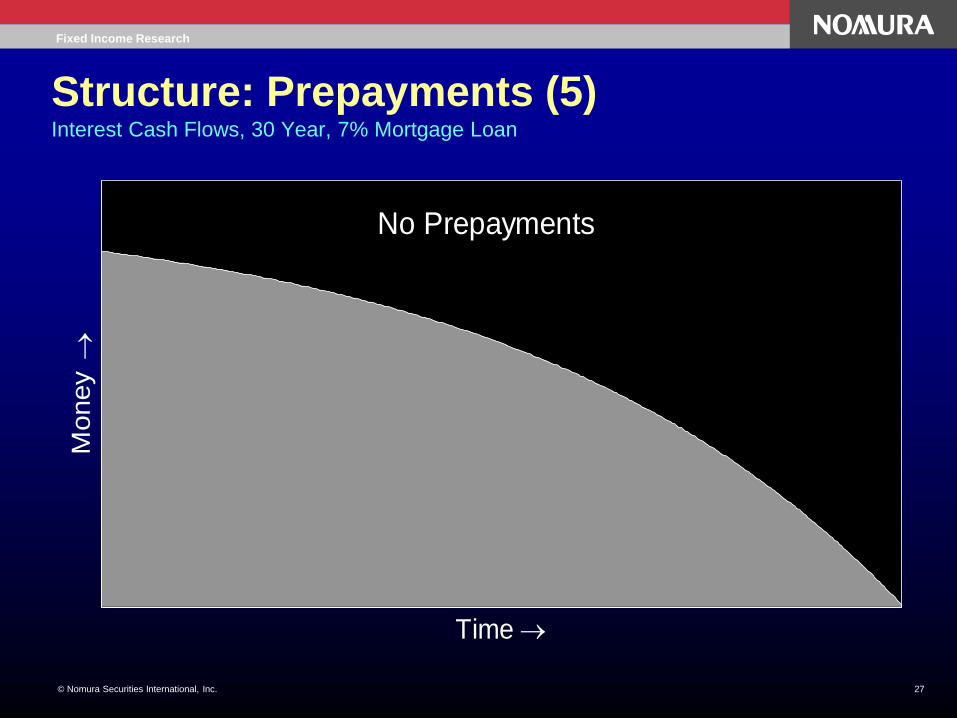
Structure: Prepayments (5) Interest Cash Flows, 30 Year, 7% Mortgage Loan
No Prepayments
Time
Money

Fixed Income Research
28 © Nomura Securities International, Inc.
Structure: Prepayments (6) Interest Cash Flows, 30 Year, 7% Mortgage Loans
100% PSA 50% PSA
200% PSA 400% PSA
Time
Money

Fixed Income Research
29 © Nomura Securities International, Inc.
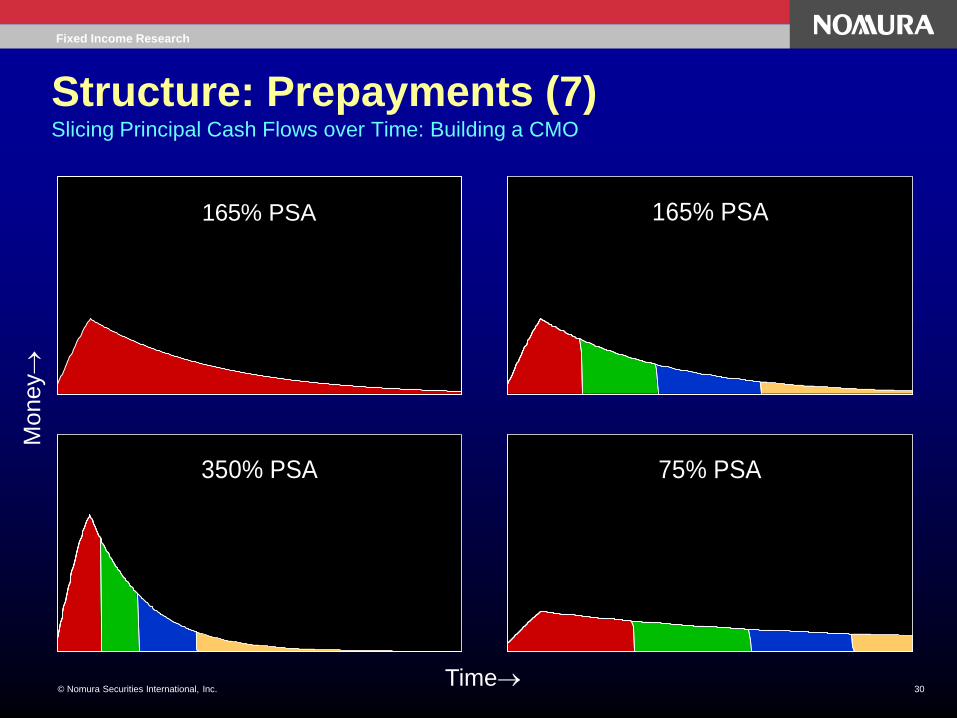
CMOs/REMICs
Time-tranching of cash flows
Underlying assets can be GSE MBS, raw mortgage loans,
or other REMIC securities
GSEs issue CMOs/REMICs
Private MBS issuers typically structure all their deals as
CMOs/REMICs
Fixed Income Research
30 © Nomura Securities International, Inc.
Structure: Prepayments (7) Slicing Principal Cash Flows over Time: Building a CMO
165% PSA 165% PSA
350% PSA 75% PSA
Time
Money
Fixed Income Research
31 © Nomura Securities International, Inc.
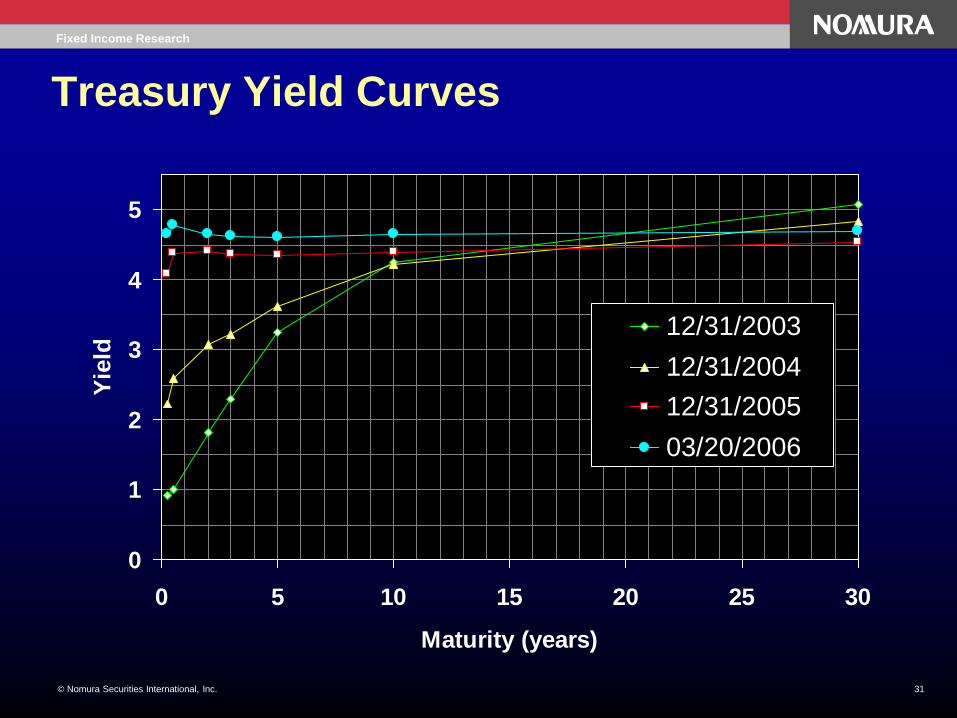
Treasury Yield Curves
0
1
2
3
4
5
0 5 10 15 20 25 30
Maturity (years)
Yie
ld
12/31/2003
12/31/2004
12/31/2005
03/20/2006
Fixed Income Research
32 © Nomura Securities International, Inc.
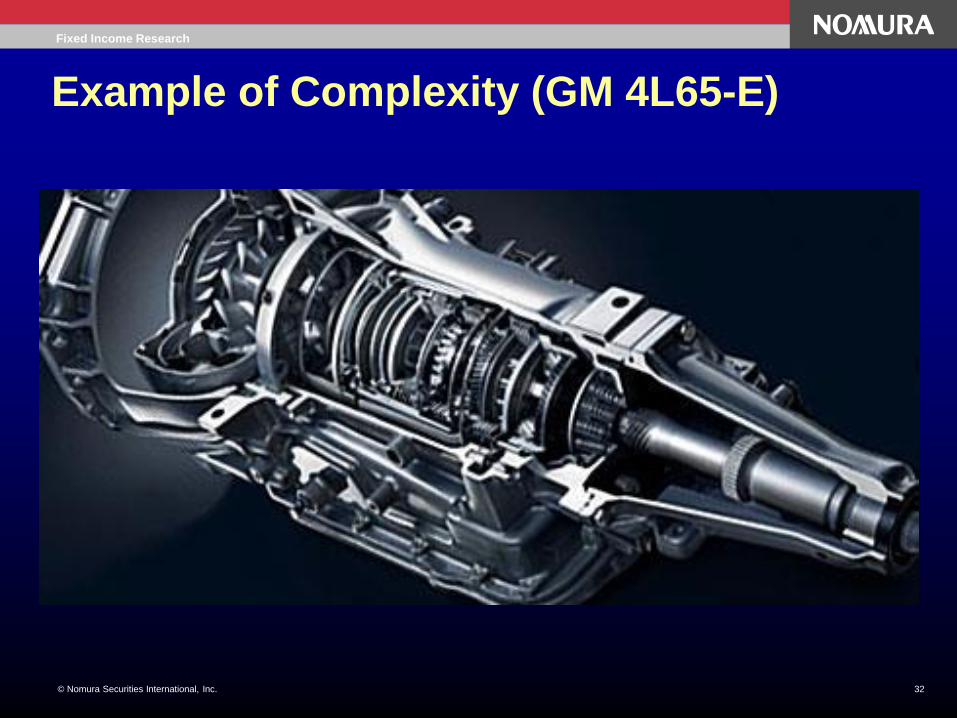
Example of Complexity (GM 4L65-E)

Fixed Income Research
33 © Nomura Securities International, Inc.
Structure: Prepayments (8) Shifting Prepayment Risk: Building PAC Classes in a CMO
Defining PAC Cash Flow
The area under both curves
represents the principal cash flow
available at any constant PSA
prepayment rate between the rate of
the upper PAC band and the rate of
the lower PAC band.
165% PSA
PAC A PAC C
PAC E PAC FCompanions
350% PSA 75% PSA
Time
Money

Fixed Income Research
34 © Nomura Securities International, Inc.
Structure: Prepayments (9) Shifting Prepayment Risk: Sensitivity of Companion Classes
165% PSA 165% PSA
Companion G
Companion D
Companion B
PACs
350% PSA 75% PSA
Time
Money

Fixed Income Research
35 © Nomura Securities International, Inc.
Recent Times Have Been Good…
1900 1910 1920 1930 1940 1950 1960 1970 1980 1990 2000
-25%
-15%
-5%
5%
15%
25%
Recession
Unemployment %
HY Default Rate
CPI % Change
GNP % Change
Fixed Income Research
36 © Nomura Securities International, Inc.
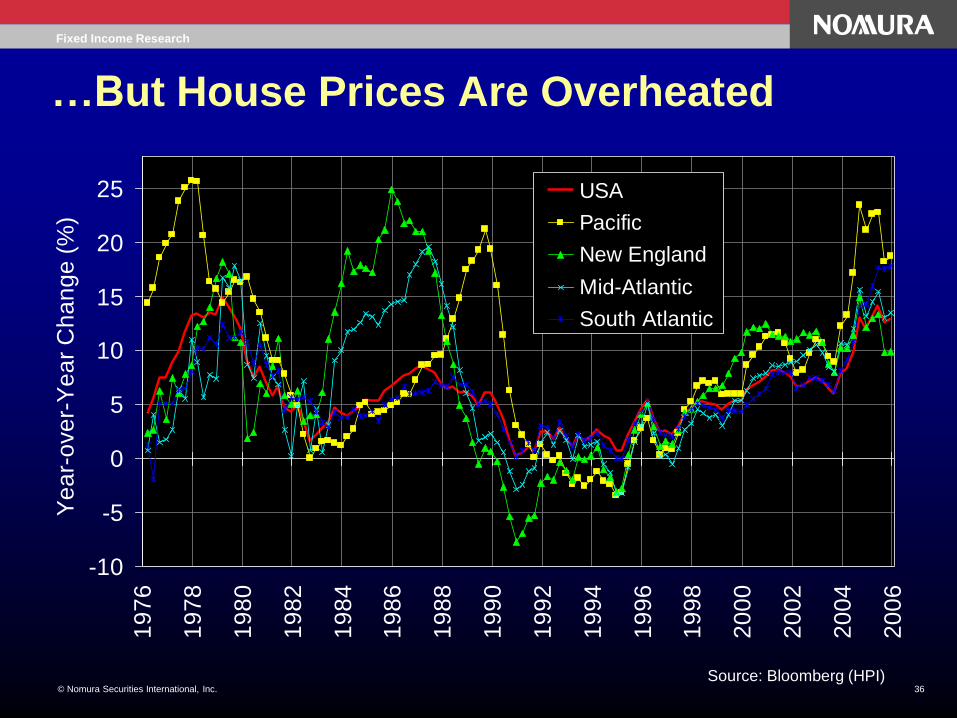
…But House Prices Are Overheated
-10
-5
0
5
10
15
20
25
19
76
19
78
19
80
19
82
19
84
19
86
19
88
19
90
19
92
19
94
19
96
19
98
20
00
20
02
20
04
20
06
Ye
ar-
ove
r-Y
ea
r C
ha
ng
e (
%)
USA
Pacific
New England
Mid-Atlantic
South Atlantic
Source: Bloomberg (HPI)
Fixed Income Research
37 © Nomura Securities International, Inc.
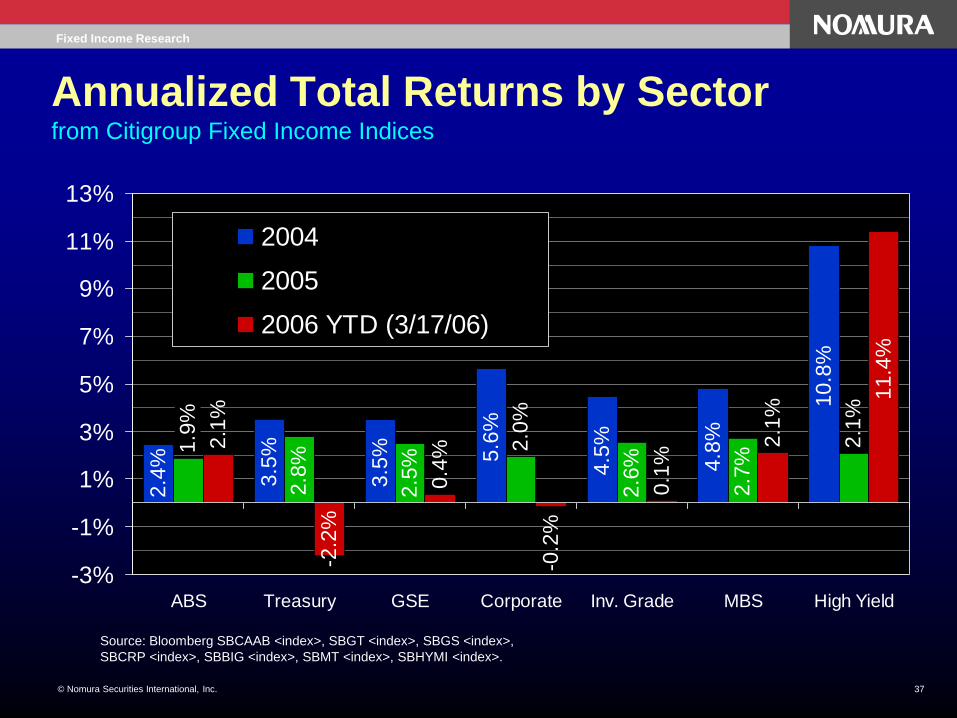
Annualized Total Returns by Sector from Citigroup Fixed Income Indices
2.4
%
3.5
%
3.5
% 5.6
%
4.5
%
4.8
%
10
.8%
2.8
%
2.5
%
2.6
%
2.7
%
2.1
%
0.4
%
-0.2
%
0.1
%
2.1
%
2.1
%
2.0
%
1.9
%
-2.2
%
11
.4%
-3%
-1%
1%
3%
5%
7%
9%
11%
13%
ABS Treasury GSE Corporate Inv. Grade MBS High Yield
2004
2005
2006 YTD (3/17/06)
Source: Bloomberg SBCAAB <index>, SBGT <index>, SBGS <index>,
SBCRP <index>, SBBIG <index>, SBMT <index>, SBHYMI <index>.

Fixed Income Research
38 © Nomura Securities International, Inc.
Conclusion
Prepayments are the key to understanding MBS cash
flows, performance and valuations
MBS represent a large portion of all fixed income activity in
the U.S.
MBS represent the largest portion of securitization activity
in the U.S.
No fixed income professional can afford to be ignorant
about MBS

Fixed Income Research
56 © Nomura Securities International, Inc.


