
MEASURING ENERGY EFFICIENCY SAVINGS IN REAL-TIME ENHANCES PROGRAM PERFORMANCE
MODERATOR:
COMMISSIONER KIMBERLY O'GUINN, ARKANSAS
PANELISTS:
CARMEN BEST, DIRECTOR OF POLICY & EMERGING MARKETS, RECURVE
BEN BROWN, EXPERT PROGRAM MANAGER, PACIFIC GAS & ELECTRIC
MARK WYMAN, SENIOR PROGRAM MANAGER, ENERGY TRUST OF OREGON

• The National Association of Regulatory Utility Commissioners (NARUC) is a non-profit organization founded in 1889.
• Our Members are the state regulatory Commissioners in all 50 states & the territories. FERC & FCC Commissioners are also members. NARUC has Associate Members in over 20 other countries.
• NARUC member agencies regulate electricity, natural gas, telecommunications, and water utilities.
WHAT IS NARUC
3

WHAT IS NARUC’S CENTER FOR PARTNERSHIPS AND INNOVATION?
• Grant-funded team dedicated to providing technical assistance to members.
• CPI identified emerging challenges and connects state commissions with expertise and strategies.
• CPI builds relationships, develops resources, and delivers trainings.
Energy Infrastructure & Technology
Modernization
Electricity System
Transition
Emerging Issues
Critical Infrastructure, Cybersecurity,
Resilience
NARUC CPITopical Areas
www.NARUC.org/CPI-1
4

WEBINAR LOGISTICS
5
• We’re recording the webinar. It will be posted on the CPI webpage
• Because of the large number of participants, everyone is in listen mode only.
• Please use the questions box to send us your questions and comments any time during the webinar. You may want to direct your question to a specific panelist.
• The panelists will respond to questions typed in the chat box during moderated Q&A, following each presentation and at the end.

MEASURING ENERGY EFFICIENCY SAVINGS IN REAL-TIME ENHANCES PROGRAM PERFORMANCE
MODERATOR:
COMMISSIONER KIMBERLY O'GUINN, ARKANSAS
PANELISTS:
CARMEN BEST, DIRECTOR OF POLICY & EMERGING MARKETS, RECURVE
BEN BROWN, EXPERT PROGRAM MANAGER, PACIFIC GAS & ELECTRIC
MARK WYMAN, SENIOR PROGRAM MANAGER, ENERGY TRUST OF OREGON

Moderator & Panelists
Carmen Best, Director of Policy & Emerging
Markets, Recurve
Mark Wyman, Senior Program Manager,
Energy Trust of Oregon
Ben Brown, Expert Program Manager
PG&E
6
Commissioner Kimberly O’Guinn,
Arkansas

Building a Grid-Integrated Future
Carmen Best, Director of Policy & Emerging Markets
Meter-Based Efficiency
NARUC Webinar June 18, 2020

8

9
The Grid is Transforming from Centralized Power Plants to Distributed Grid Edge Resources

Recurve Platform:
Architected for the Distributed Grid Edge
1010

Follow with WHAT
STANDARD WEIGHTS & MEASURESThe Foundation of Market-Based Solutions


• Standard M&V Calculation Methods
• Monthly, Daily, and Hourly
• Public Stakeholders Empirical Process
• www.CalTRACK.org
• Python CalTRACK Engine
• Open Source Apache 2.0
• How It Works: https://www.lfenergy.org/projects/openeemeter/
• Code Repo: https://goo.gl/qFdW4P
14

Recurve Platform:
Execution of meter-based calculations at scale
ScaleableParallelized architecture
utilizing on demand disposable cloud resources
AutomatedAutomatically run complex
ETL and metering calculations in real time
TransparentAuditable record down to
the meter
VerifiableCalTRACK compliant using
openEEmeter
SecureIsolated platform nodes with permissioned user
access
Computing savings once for 1,000,000 meters...
≈ 1/2 HourUsing Recurve Flex Platform parallel cloud architecture
≈ 3,472 DaysUsing a local computer
15

SCALE FOR THE FUTUREGetting Started on Meter-based Solutions

17
A Path to Scaling Efficiency

23% of Projects
18
2.5X
Greater
Savings
70%
Fewer
Negatives
19
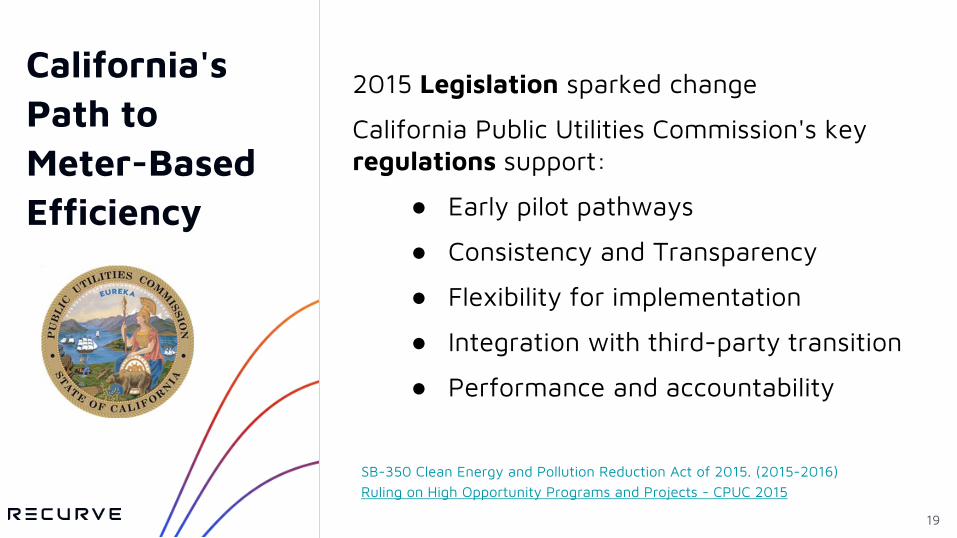
2015 Legislation sparked change
California Public Utilities Commission's key regulations support:
● Early pilot pathways
● Consistency and Transparency
● Flexibility for implementation
● Integration with third-party transition
● Performance and accountability
SB-350 Clean Energy and Pollution Reduction Act of 2015. (2015-2016)Ruling on High Opportunity Programs and Projects - CPUC 2015
California's Path to Meter-Based Efficiency

20
CPUC Releases Version 2.0 of the Meter-Based NMEC Rulebook
Pre-Defined & Consistent
Measurement methods and calculation software are set before the program starts (and not subsequently changed) and apply to all sites in a uniform fashion
Program FitPrograms must meet the Population-level NMEC regulatory and filing requirements described in this document;
Population-Level NMEC
Meter-Based
Energy savings determinations are made using an NMEC approach based on pre and post-intervention energy usage data observed at the meter

Create Performance Accountability
21
Contractors
Load Serving Entity
Private Capital Performance Risk
Efficiency Businesses
Utility
Measurement
Project Finance Insurance
Aggregators
Channels
Buildings
Planning/Evaluation
Regulatory
Load Forecast
State Energy Office or RTO

Project Finance: The long-term financing of projects based upon projected cash flows rather than the balance sheets of its sponsors.
22

BUSINESS MODELS
Savings Comfort Health
3RD Party Providers(aggregators)
Services and Products
Consumer Finance
ProjectFinance
Sales and Marketing
Contractor Management
23
DEMAND FLEXIBILITY
Key policy changes today . . .
. . . enable a future of grid integration.

Metered Flexiwatt
Resource Curve
Pay for Performance
Demand Flexibility
Procurement
Carmen Best

References & Resources
25

26
2019 Energy Efficiency Plan -Doubling Efficiency
- “develop ability to incorporate aggregations of energy efficiency and demand response programs into long term planning”
- “incorporate meter-based analysis into potential studies to identify cost effective savings potential.”
“With current savings projections, the state is missing the 2030 goal in terms of avoided GHG emissions.” p4

https://www.sciencedirect.com/science/article/pii/S1040619019302027
27

Clean Energy Portfolios Win on Price
https://rmi.org/insight/the-economics-of-clean-energy-portfolios/28

29
https://www.linkedin.com/pulse/open-source-opening-new-doors-performance-based-regulation-best/

30https://www.2035report.com/
"The best way to create value for flexibility is to enhance price signals in the energy markets themselves, to ensure they are rewarding flexible resources."

31
Normalized Metered Energy Consumption
“The energy efficiency savings and demand reduction . . . achieving
the targets established pursuant to paragraph (doubling of EE by
2030) shall be measured taking into consideration the overall
reduction in normalized metered electricity and natural gas
consumption where these measurement techniques are feasible and
cost effective.”
Link: https://leginfo.legislature.ca.gov/faces/billNavClient.xhtml?bill_id=201520160SB350
SB-350 Clean Energy and Pollution Reduction Act of 2015. (2015-2016)

32
Normalized Metered Energy Consumption
". . . increase the energy efficiency of existing buildings based on all estimated
energy savings and energy usage reductions, taking into consideration the
overall reduction in normalized metered energy consumption as a measure of
energy savings. Those programs shall include energy usage reductions
resulting from the adoption of a measure or installation of equipment
required for modifications to existing buildings to bring them into
conformity with, or exceed, the requirements of Title 24 of the California
Code of Regulations . . ."
Link: https://leginfo.legislature.ca.gov/faces/billNavClient.xhtml?bill_id=201520160AB802
AB-802 Energy efficiency.(2015-2016)

33
Normalized Metered Energy Consumption
CPUC Guidelines: Programs and Projects Using Normalized Metered Energy Consumption (NMEC)https://www.cpuc.ca.gov/General.aspx?id=6442456320
History of NMEC (An Unauthorized Biography): Policy References for Normalized Metered Energy Consumption in California - 2018 Update, Published on February 4, 2019https://www.linkedin.com/pulse/policy-references-normalized-metered-energy-consumption-carmen-best/
As California continues the discussions on Normalized Metered Energy Consumption…, Published on February 14, 2018https://www.linkedin.com/pulse/california-continues-discussions-normalized-metered-energy-best/

34
Population NMEC M&V Plan & Compliance Checklist
Impact Evaluation Specification Comparison Group Methods
- Matching Approach & Criteria- Statistical Metrics
"Proprietary Methods & Software: Savings measurementmethods and calculation software that is public, and especiallythose that are open-source, benefit from a stakeholder vettingprocess that allows experts and practitioners to share theirknowledge and use updated information to inform savingsestimates. The Commission has supported the development ofpublic, open-source processes to develop NMEC methods (e.g.CALTRACK) and encourages stakeholders to engage in theseopen-source initiatives." p. 18
Rulebook for Programs and Projects Based on Normalized Metered Energy Consumption
Version 2.0
Release Date: 7 January, 2020

35
Reproducible Execution
Professional Guidance
Framework
(2004)
Time of Week & Temperature
ModelProtocols
(2006)
IPMVP Option (C)
M&V Protocols and standards . ..
. . . enable settlement.
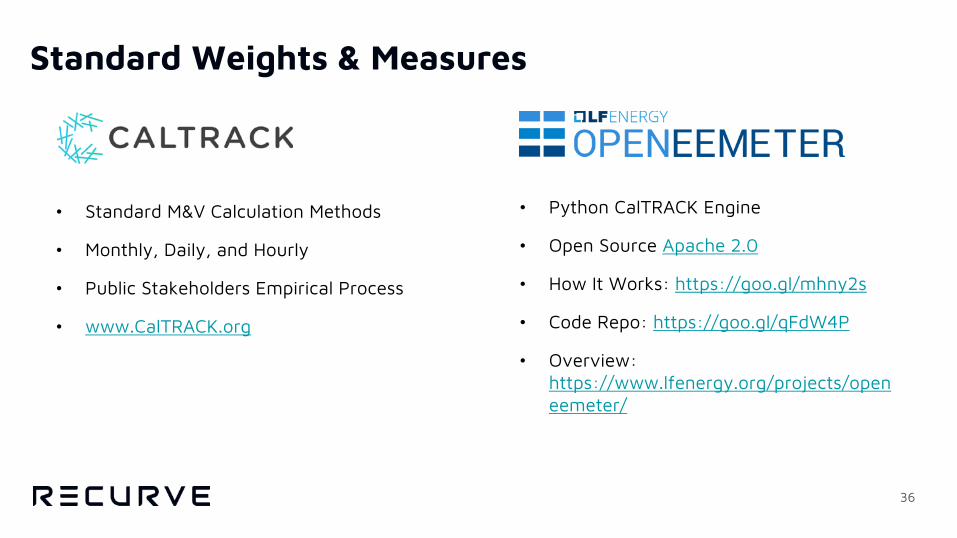
• Standard M&V Calculation Methods
• Monthly, Daily, and Hourly
• Public Stakeholders Empirical Process
• www.CalTRACK.org
• Python CalTRACK Engine
• Open Source Apache 2.0
• How It Works: https://goo.gl/mhny2s
• Code Repo: https://goo.gl/qFdW4P
• Overview: https://www.lfenergy.org/projects/openeemeter/
36
Standard Weights & Measures

CalTRACK Monthly Model
37
CalTRACK Hourly Time of Week Temperature (TOWT)
Model
Technology Agnostic Change In Consumption

38
International Energy Program Evaluation Conference 2019
Abstract: https://www.iepec.org/wp-content/uploads/2019/02/abstracts_presentations_best.pdfPaper: https://www.iepec.org/2019_proceedings/#/paper/event-data/044-pdf

39
Three Generic Categories of AdoptionMarket Focus
Large scale pilot with focus on market development
New York: Business Energy Pro, a Pay-for-Performance initiative
Executive direction for grid level improvements, coupled with State Authority leadership
Scaled Pilots & 3P
Large scale pilots and third-party procurements
California: Pacific Gas & Electric Residential Pay-for-Performance, and Third-party Solicitations
Legislation, regulatory authorization, and utility administrator leadership
Contractor Focus
Step-wise testing with contractors delivering existing programs
Oregon: Energy Trust Pay-for-Performance Pilot
Third-party administrator initiative coupled with Governors executive order
Source: Policy Pathways to Meter-based Pay for Performance

Pacific Gas and Electric Company Pay for Performance Programs & Grid Resource Program Procurement
Ben BrownNARUC Webinar on Meter-BasedEfficiencyJune 18th, 2020
40

Energy Efficiency in California
History
• Began in the 1970s
• Building and appliance Codedrove savings
• Decoupling introduced –utility profits not tied torevenue
• Shareholder incentive introduced
Currently
• $1 Billion/year in ratepayer funded EE
• Cost effective savings are mandated
• Huge variety of programs, channels andofferings
41

California Duck Curve
Source: https://www.caiso.com/Documents/FlexibleResourcesHelpRenewables_FastFacts.pdf
42

Hourly Value of Energy (Electric)
2020 2030
Hour Ending (Standard Time) Hour Ending (Standard Time)
Source (CZ13 Shown):ftp://ftp.cpuc.ca.gov/gopher-data/energy_division/EnergyEfficiency/CostEffectiveness/2020%20ACC%20Electric%20Model%20v1b.xlsb
43

Recent Impactful Legislation/Policy
California (CA) Senate Bill 350
• Doubles energy efficiency goals in existing buildings by 2030
• Calls out behavioral savings opportunities
CA Assembly Bill (AB) 802
• Allows “existing conditions” baselines
• Prioritizes weather normalized, “meter-based” savings
CA AB 793
• Requires that real time energy usage data is made available to
customers
• Requires utilities to incentivize energy management technologies
CA Public Utilities Commission Decision 16-08-019
• Requires utilities to procure third party designed and implemented
energy efficiency programs
44

Pay for Performance Program Model
Implementer/Aggregator
45
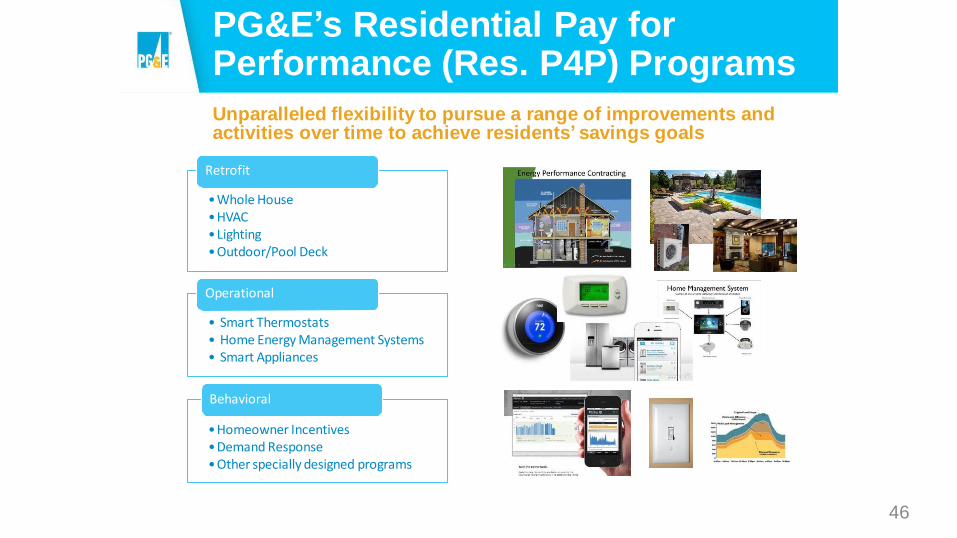
PG&E’s Residential Pay for Performance (Res. P4P) Programs
Unparalleled flexibility to pursue a range of improvements andactivities over time to achieve residents’ savings goals
Retrofit
•Whole House•HVAC•Lighting•Outdoor/Pool Deck
Operational
• Smart Thermostats• Home Energy Management Systems• Smart Appliances
Behavioral
•Homeowner Incentives•Demand Response•Other specially designed programs
46

Res. P4P Experience (so far)
Successful Solicitations
• We competitively procured four program contracts with three different implementers
• All contracts are entirely performance based using CalTRACK methods
• Two contracts contain variable pricing allowing us to value program energy savings
in close alignment with real energy costs
Innovative Implementation
• Programs largely include behavioral and operational interventions to drive savings
• Customers are provided a strategic energy partner
• Implementers use data driven feedback to inform future program interventions
Challenges
• Incorporate behind the meter solar PV, battery storage, electric vehicle charging
• Implementer cash flow challenges
• Ensuring program participant and data integrity
• Develop benefit and cost reporting structure able to accommodate new programmodel
47

Res. P4P Next Steps and Goals
Next Steps
• Application in other program models and sectors
(commercial retrofits and financing programs)
• Develop track record to allow for accuracy in forecasting
• Incorporate wider range of distributed energy resources
(DERs)
• Incorporate more dynamic pricing into future contracts
Program Goals
• Demonstrate program is a sustainable model for EE
program portfolios
• Create a supportive data ecosystem
• Allow EE to emerge as a reliable grid resource
48

10
• PG&Einvited Biddersto submit programdesigns that could demonstratethecapability of EE as a Distributed Energy Resource (DER).
• DERs must meet the same technicaland operating standardsas the rest of the distributionsystem such that when DERs are interconnected, they do not impactthe safety and reliability of the grid.
• For EE, this requires a programthat can deliver verifiable energy savings at:
– Specific locations
– Predictable times
– Predictable levels (magnitude)
– Acceptable levels of availability and assurance
• Grid Resource programproposals must target the right customers with the rightmeasures at the right time and at the right locationssuch that the energy savingsgeneratedby the programnaturally align to the specific locationaland temporalneeds of the grid.
EE as a Grid Resource
49

11
• PG&E’s objectivefor Grid Resource programs in this RFP is to identify innovative EEprogramdesigns that demonstrateEE can provide energy savings with the level ofprecision and confidence equivalent to other DER technologies.
• There are two requirements for a programto be considered as a Grid Resourceprogramin the RFP.
– Grid Resource programs require a meter-based approach and support near real-timeEmbedded
M&V to deliver verified energy savings and/or capacity reductions that can be substantiated, commercially transacted and settled to terms on par with other DER technologies.
– Grid Resource Programs must be informed by both customer dataand grid data to createa programdesign that can target customers in a region with the right measures, so the energy savings producedcoincides when they are most needed by the grid which varies by the time of day, the time of year, and geographic location.
• At this stage, such program structures will not need to defer distribution capitalinvestments or relieve grid constraints, avoiding the risk to system reliability andthe associatedpunitive commercialterms that follow.
• It is PG&E’s expectationthat some or all of these Grid Resource programs will, atsome point in the future, serve these grid resourceroles.
EE as a Grid Resource
50

12
• The dynamic interplay between weather patterns (coast,valley, mountain), development (urban, suburban, rural),and other regional factors (commercial/ industrial activity and customer adoption of rooftopsolar) coalesce and create distinct variations in gridneeds across the various Distribution Planning Regions.
• This analysis is depicted as a simple delivery window foreach DRP and can be seen in Figure 5.6 – PG&EDPRSavings Delivery Windows.
• For each DP Region, energy savings delivered during thetime frames indicated in green are designated aspreferred. Energy savings delivered outside of thesetimeframes are also accepted.
EE as a Grid Resource
51


Mark Wyman
Pay For Performance
June 2020 Update

Independent nonprofit
Providing access to affordable
energy
Generating homegrown,
renewable power
Serving 1.6 million customers of Portland General Electric,
Pacific Power, NW Natural, Cascade Natural Gas and Avista
Building a stronger Oregon
and SW Washington
About us
5
4

Oregon Residential Pay For Performance (P4P) Design Principles
55
SAVINGS CALCULATED OFF
12 MONTHS WEATHER
NORMALIZED BASELINE AND 12 MONTHS POST-
TREATMENT USAGE DATA
USE CALTRACK AS THE FOUNDATION
FOR SAVINGS METHODOLOGY, IMPLEMENTED
THROUGH OPEN EEPLATFORM
SAVINGS ARE MEASURE-AGNOSTIC

Pilot overview
56
2 year limited deployment
Three aggregators
Portfolios based on dominant treatment type
Layered onto deemed savings
Savings + incentives paid on performance above deemed assumptions
Lifetime value established by deemed weighted average measure life
1 year performance period
Two enrollment periods per year
Comparison group analysis nets exogenous change
Contractor-facing market test
Three contractors act as aggregators of projects
Contractors have access to performance dashboards

Sample Portfolio Life Cycle
Example: deemed savings 15 therms per treatment, savings above deemed priced at $10/therm
5
7
A
B
C
D
Portfolio
15 * 4=
60
therms
Claime
d
Standar
d
custome
r
incentiv
e
Year 1: Deemed Savings
15 therms per siteYear 2: Metered Savings
Savings
Calculations
Portfolio Payment:
(80 – 60) * $10= $200
Comparison
group
analysis
Pre/post
weather
normalize
Site Savings
A 10
B 30
C 15
D 25

Priority Measures
Pay for Performance Portfolio Types
weatherization• insulation
• windows
HVAC• heating systems
• HVAC controls
• water heaters
whole home• HVAC + weatherization
5
8
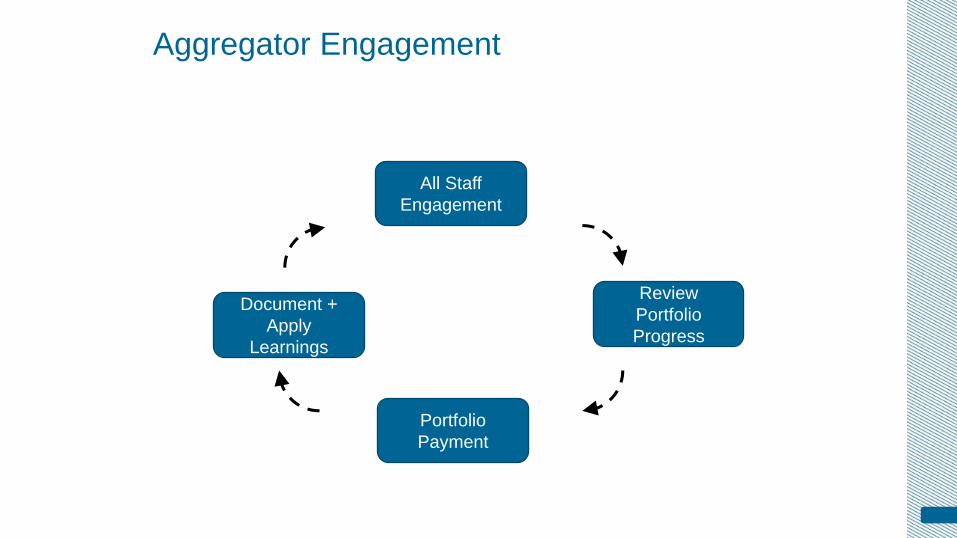
Aggregator Engagement
All Staff
Engagement
Review
Portfolio
Progress
Portfolio
Payment
Document +
Apply
Learnings
5
9

Research Questions
1)Do P4P designs enable better targeting of interventions with variable outcomes?
2) Do P4P designs improve measure cost effectiveness?
3) Do P4P designs create new participation opportunities for lagging markets?
4) Is the market ready for a “pure” P4P approach with no guaranteed (deemed) incentives?
5) How persistent are the energy savings from P4P?
60

Limits and Exclusions
• Sites with solar
• Missing meter data
• Fuel switching
• “Synthetic baselining” or non-routine adjustments
6
1

• Monthly billing data quality
• Account changeovers
• Non-routine events
• Measures with market baselines
• Forecasting yield
Risks, Unknowns and Considerations
6
2

Pilot Milestones
63
April 2019 launch
October 2019
Portfolio #1 closes, Portfolio 2
opens
October 2020 First Portfolio Payment
Q1 2020 Evaluation
Report


1. Use the Question box
2. Direct your question to Panelist by name
QUESTIONS?

Hosted one Thursday each month from 3:00 p.m. to 4:00 p.m. ET
• PUC Participation in EarthEx 2020: An Energy Security Exercise
June 25, 2020 | 3:00 – 4:00 PM Eastern
• Renewable Technologies You May Not Have Heard Of
August 20, 2020 | 3:00 - 4:00 pm Eastern
Register at: https://www.naruc.org/cpi-1/emerging-issues/innovation-webinars/
NARUC thanks the U.S. Department of Energy for support for this series.
NARUC Innovation Webinar series
66


