
I
Measuring head, mandible and body posture changes during
sleep
Michael Crocker
10529370
School of Mechanical Engineering, University of Western Australia
Supervisor: Dr Adrian Keating
School of Mechanical Engineering
Co-supervisor: Professor Peter Eastwood
Department of Anatomy & Human Biology
Co-Supervisor: Dr Jennifer Walsh
Department of Anatomy & Human Biology
Final Year Project Thesis
School of Mechanical Engineering
University of Western Australia
Submitted: May 31st, 2010

II
Project Summary
Obstructive Sleep Apnoea (OSA) is a condition that affects the quality of life for many
people around the world. The West Australian Sleep Disorders Research Institute
(WASDRI) believe that there is a link between the position of a supine patient’s head
relative to their body and sleep apnoea events. Considering this, a system designed to
detect such change in orientation would be of great benefit.
Currently, no such system exists. This project therefore identified many approaches
such a system, such as using Electroactive Polymers (EAPs), Hall effect sensors,
spring/torsion systems, motion capture systems as well as accelerometers.
After determining the required characteristics of the system, the ADXL335 triaxial
accelerometers were chosen with an Arduino® Duemilanove microcontroller to
measure, calculate and send the data to a pre-existing data logger at WASDRI.
Preliminary tests prove the choice to be suitable, and after a more rugged prototype was
built, human tests have been planned for the near future.
This project has made significant progress in its objectives, but some tasks remain
unfinished. Future works to be completed include completing human trials, a wireless
interface and a self-calibrating system.

III
Letter of Transmittal
Michael Crocker
337 Fitzgerald St
North Perth WA 6006
28th May 2010
Winthrop Professor John Dell Dean Faculty of Engineering, Computing and Mathematics University of Western Australia 35 Stirling Highway Crawley, WA, 6009 Dear Professor Dell I am pleased to submit this thesis, entitled “Measuring head, mandible and body posture changes during sleep”, as part of the requirement for the degree of Bachelor of Engineering. Yours Sincerely
Michael Crocker 10529370

IV
Acknowledgments
I would like to thank Assoc/Prof Adrian Keating for his supervision and guidance with
this project and Professor Peter Eastwood and Dr Jennifer Walsh for their key support.
Combined, their knowledge and tireless enthusiasm over the year has proved to be
critical to the completion of this work.
I wish also to thank the staff in both the Mechanical and Electrical Engineering
workshops for their work in constructing testing rigs. In particular, my thanks go out to
Reinier De Lange and Malcolm Stafford, who provided solutions to the small problems,
and ran tests on my behalf respectively.
Lastly, I would like to thank my colleagues from SAIL and ENCM G.19 namely Artur
Gruszecki, Jason Moore, Ali Barnes, Chris Godfrey, Alex Doncon and David Smith.
Their support, advice and humour throughout the year is much appreciated.

V
Table of Contents
���������� �� ������������������������������������������������������������������������������������������������������������������������������
���������� ����� � ������������������������������������������������������������������������������������������������������������ ����
������������� �������������������������������������������������������������������������������������������������������������������������
� ������������ ������������������������������������������������������������������������������������������������������������������������ ��
� ������������������������������������������������������������������������������������������������������������������������������������������
������� ���������������������������������������������������������������������������������������������������������������������������������� ����
����������������������������������������������������������������������������������������������������������������������������������������������� ��
����� ���������������������������������������������������������������������������������������������������������������������������������� ��
���������������� ����������������������������������������������������������������������������������������������������������������������������������� ��
����������������� ������������������������������������������������������������������������������������������������������������������������������� ��
����� �� ��� ����� ���������������������������������������������������������������������������������������������������������������������������������������� ��
� ������� ������ �� �������������������������������������������������������������������������������������������������������������������������������� ��
��� � ��� ����������������������������������������������������������������������������������������������������������������������������������������������������
����� ���� ������������� ������� ������������������������������������������������������������������� �
��� ��� ������������������������������������������������������������������������������������������������������������������������������������������������������������������
������������������������������������������������������������������������������������������������������������������������������������������������������������������������
���� ��������������������������������������������������������������������������������������������������������������������������������������������������!�
����� ��������� �������������������������������������������������������������������������������������������������������������"�
��������� � ���������������������������������������������������������������������������������������������������������������������������������������������������������
���������������������������������������������������������������������������������������������������������������������������������������������������������������������
������ �������������������������������������������������������������������������������������������������������������������������������������������������������
�������������������������������������������������������������������������������������������������������������������������������������������������������������������
���������� ����������������������������������������������������������������������������������������������������������������������������������#$�
���������������������������������������������������������������������������������������������������������������������������������������������������
������� ���������������������������������������������������������������������������������������������������������������������������������������������������������������!�
"#����� �����������������������������������������������������������������������������������������������������������������������������������������������������
�#���$������ ������ �����������������������������������������������������������������������������������������������������������������������������������������!�
#������� $��%�� �������� ���������������������������������������������������������������������������������������������������������������

VI
Table of Figures
Figure 1: Diagram showing head rotation. .......................................................................3�
Figure 2: Diagram showing flexion. .................................................................................3�
Figure 3: The system for measuring jaw movement in deer ............................................4�
Figure 4: The OKAS-3D system showing dual CRT tubes .............................................5�
Figure 5: RGR optical technology used to measure knee joint flexing during jumping .6�
Figure 6: Sensor system used to measure jaw movement.................................................7�
Figure 7: PVDF film exhibiting piezoelectric properties..................................................9�
Figure 8: IPMC film demonstrating piezoelectric properties ...........................................9�
Figure 9: Graph showing progressive miniaturization of accelerometers ......................11�
Figure 10: Basic system for ‘telecare’ – remote monitoring .........................................13�
Figure 11: Basic framework outlining future work in accelerometers ..........................14�
Figure 12: TA system used to monitor behaviour in cattle ............................................15�
Figure 15: Demonstration of Instron® testing................................................................22�
Figure 16: Graph demonstrating the unreliable nature of the EAP tests ........................23�
Figure 17: Photo of TA testing rig ..................................................................................24�
Figure 18: Map of SAIL, showing safety devices and evacuation routes.......................25�
Figure 19: Hot press machine in SAIL ...........................................................................26�
Figure 20: Oscilloscope results showing timing problem with ADXL345 ....................28�
Figure 22: The Arduino® IDE, demonstrating software debugging ..............................31�
Figure 23: Flow diagram of code used to govern system ...............................................32�
Figure 25: Comparison of performance between the two accelerometers......................34�
Figure 26: comparison of flexion, as measured by the accelerometer and goniometer..35�
Figure 27: Comparison of changing values under rotation.............................................35�
Figure 28: Changing Y values with different degrees of rotation...................................36�
Figure 29: PCB design ....................................................................................................37�
Figure 30: Schematic of Amplification circuit ...............................................................40�

VII
Nomenclature
DAC - Digital to Analog Converter
EAP - Electroactive Polymer
GIMP - Gnu Image Manipulation Program®
IDC - Insulation Displacement Connector
IDE - Integrated Development Environment
IMU - Inertia Measurement Unit
MISO - Master In, Slave Out
MOSI - Master Out, Slave In
OSA - Obstructive Sleep Apnoea
PCB - Printed Circuit Board
PDMS - Polydimethylsiloxane
SAIL - Sensors and Advanced Instrumentation Laboratory
SCGH - Sir Charles Gairdner Hospital
SPI - Serial Peripheral Interface
TA - Triaxial Accelerometer
UNSW – The University of New South Wales
USB - Universal Serial Bus
WASDRI - Western Australia Sleep Disorders Research Institute

2
Introduction
Obstructive sleep apnoea (OSA) is a common sleep disorder characterised by
intermittent partial or complete collapse of the upper airway during sleep. This results
in reduced oxygen saturation and arousal from sleep the consequences of which include
depression, cardiovascular disease, hypertension and excessive daytime sleepiness.
OSA and its consequences are estimated to result in significant financial cost to
Australian society, in excess of US$7billion (Hillman 2006).
It is well known that the upper airway is particularly vulnerable to collapse when
patients are in the supine posture; in more than 50% of patients the number of complete
or partial obstructive events in the supine posture is more than twice that in the lateral
posture (Cartwright 1984). Recent data obtained during general anaesthesia suggests
that position of the head relative to the upper body can significantly influence airway
collapsibility in anaesthetised patients (Walsh 2008).
Given the relationship between airway collapsibility during anaesthesia and sleep
(Eastwood 2002), it is hypothesised that head posture will significantly impact airway
collapsibility during sleep also. However, as of yet no system exists to quantify head
posture during sleep. Therefore, this project aims to design, build and test a system to
sense relative head motion and integrate the output with the pre existing sleep
monitoring system at the West Australian Sleep Disorders Research Institute
(WASDRI) at Sir Charles Gairdner Hospital (SCGH). This project is being conducted
with WASDRI in collaboration with the Sensors and Advanced Instrumentation
Laboratory (SAIL) at UWA.
There are two different orientations that have been identified as crucial to this project
and hence must be clearly defined and separated. Rotation is the twisting motion made
in the neck whereby the persons head rotates around the axis formed by their upper
spine, as shown in Figure 1. Positive rotation is defined as movement to the patient’s
left, with the zero point when the patient is looking forward with shoulders square.

3
Figure 1: Diagram showing head rotation. Adapted from:
<http://www.istockphoto.com/file_closeup.php?id=2925059&SearchLang=EN>
Flexion/extension is the movement whereby the patient’s head rotates around the axis
formed roughly by passing a line through the ears of the patient. In a standing patient
this would be commonly thought of as looking up or down. Flexion is the movement of
the head towards the chest, while extension is the opposite movement. The zero point is
taken when the patient is looking straight ahead.
Figure 2: Diagram showing flexion. Adapted from:
<http://www.istockphoto.com/file_closeup.php?id=2925059&SearchLang=EN>
This project will not only be able to identify discrete states such as flexion and
extension, but also the angle of separation between the forehead and chest. It will be
able to assist in determining the relationship between head posture and the occurrences
of sleep apnoea events in individual patients. This will greatly assist medical personnel
in diagnosing OSA and patients in managing their condition.

4
Literature Review
This project focuses on humans in the supine position and the unique challenges that
arise from such a distinct situation. Despite an extensive search, no record was found of
an existing system for this purpose. As such, the scope of background research was
expanded to recording movements of animals in all positions. Measuring movement in
animals as a topic of research has being gaining interest over the past few decades as the
size and sensitivity of potential systems have become better suited to accurately and
unconstructively record changes in orientation and position. Several distinct categories
of sensor systems were identified and reviewed.
Spring/Torsion Systems
The first system devised to measure mandible movement was identified in a paper by
Kokjer and White in 1986, whereby they measured the chewing activity of reindeer
using transducers and a bellows tube (Figure 1).
Figure 3: The system for measuring jaw movement in deer (Kokjer & White 1986)

5
The system could be altered to use a number of different sensor systems instead of the
transducers and bellows in measuring length changes around the mandible, and the
paper neglects to mention the reasoning for selecting the components. This was
identified as a potential area of improvement, as modern sensors could replicate the
results with less obstruction. The paper is useful in that unlike many papers read, it
devotes a significant proportion of the article to the technical aspects of the recording
system. However, due to the large size of the system, and the differences between
chewing reindeer and sleeping humans, this paper and its derivatives were not more
thoroughly researched.
Optical/Motion Capture
The next system identified as a potential candidate was optical / motion capture
systems. A paper written in 1995 described efforts to measure jaw movement with six
degrees of freedom using two orthogonally placed CRT screens and optical markers
attached to the patient, as shown in Figure 4 (Naejie et al. 1995).
Figure 4: The OKAS-3D system showing dual CRT tubes (Naejie et al. 1995)

6
The paper identified this system as being accurate to within 0.27mm in any dimension.
Despite the accuracy and novelty of such a system and the efforts of the investigators,
the system remains bulky and expensive. Following on from this work, Retro-gate
Reflector (RGR) technology has been used to record 3D movement with a single
camera (Weinhandl 2010), enabling analysis of human movement at a lower cost and
with increased simplicity.
Figure 5: RGR optical technology used to measure knee joint flexing during
jumping (Weinhandl 2010)
Retro-gate reflector technology entails a source of light being emitted and bounced back
off a target to a photo sensor (Figure 5). The movement of the target and hence data
received by the photo sensor is used to calculate the movement of the human. However,
several shortcomings such as the requirement of line of sight and lighting conditions
were not mentioned or discussed thoroughly in these or other papers dealing with
photostereometrics (Hayashi et al. 1994).

7
Another aspect of optics relevant to the present project was using optical reflector
systems within the patient’s mouth to record the distance between the teeth. A search
revealed no papers on the subject, but remains an interesting area for further research.
Hall Effect Sensors
A series of studies by the University of Adelaide’s physiology department utilized a
system combining a Hall effect sensor and two accelerometers (their data integrated
twice to give positional values) to record jaw movement in supine patients (Flavel
2002). The study presented accelerometers as a cheap and reliable option to record
movement and orientation. The investigators anchored the system to the teeth, making
for a more accurate reading as they are rigidly attached to the jaw. This decision would
influence this project’s choice of anchor spots, as loose skin would provide inaccurate
results.
Figure 6: Sensor system used to measure jaw movement (Flavel 2002)
While there is a lack of engineering experience amongst the authors of the paper, it
does raise the possibility of using Hall effect sensors for movement/proximity
recording. The question of accelerometer drift was also not raised, despite the
integration.

8
Electroactive Polymers
A particularly exciting and novel area of sensors is in Electro-Active Polymers (EAPs).
EAPs are polymers that exhibit piezoelectric properties by changing volume or shape
under the influence of thermal, mechanical or electrical stimuli (Biddiss & Chau 2006;
Guimard, Gomez & Schmidt 2007; Shieh et al. 2001; Wilson et al. 2007). EAPs show
potential as a sensor as physical stimuli will provide an electrical response and vice
versa. There are many different forms of EAP that achieve these results through
different means, but this study focused on the most reactive three - Polypyrrole,
Polyvinyledene Fluoride and Ionic Polymeric Metal Composites.
Polypyrrole uses oxidation/reduction reactions to cause changes in volume in response
to changes in the electrical field, deformation or thermal stimuli and can be fashioned
into films, fibres, sheets or tubules (Biddiss & Chau 2006). Polypyrrole could be used
as a sensor in that it measurably changes resistivity when stretched (depending on the
direction) (Biddiss & Chau).
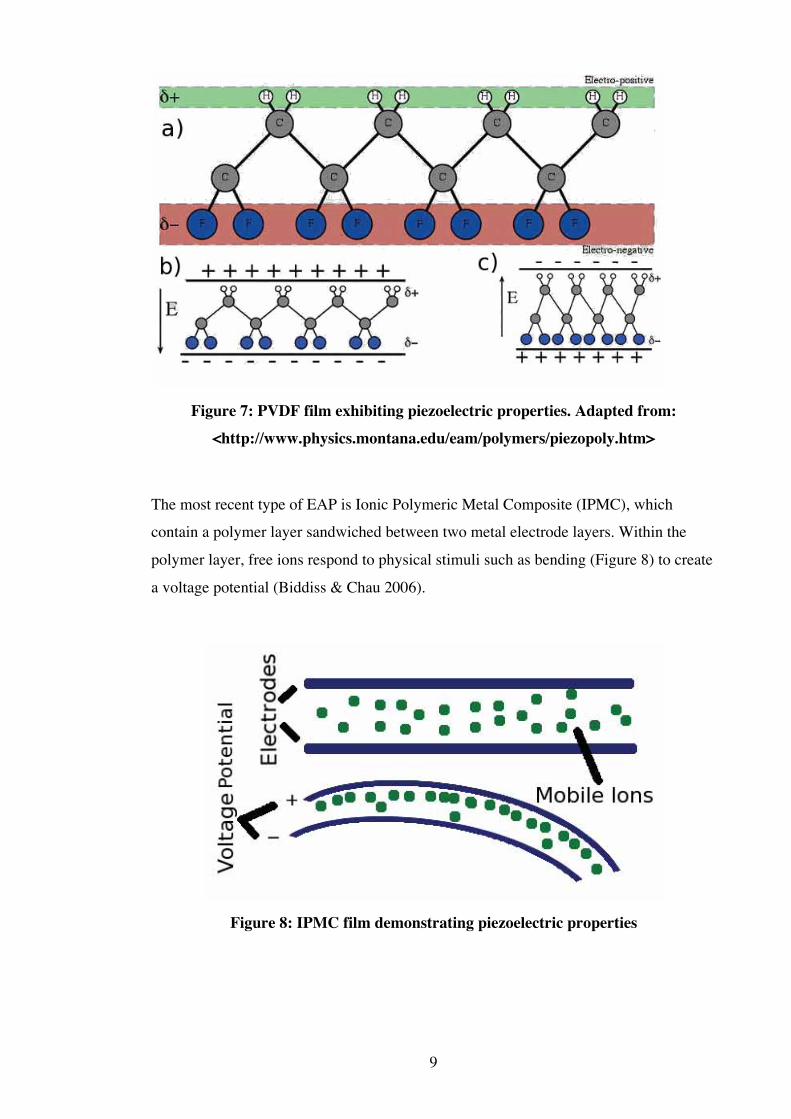
Polyvinyledene Fluoride (PVDF) is manufactured so that its long chain molecules
change shape when deformed to create a polarity and exhibit piezoelectric properties
(Shieh et al. 2001). Figure 7, part (a) shows the relative polarity of the PVDF molecule
in its unstressed shape. Parts (b) and (c) shows how the film reacts to an applied electric
field. From this, it can be seen how the film reacts to stretching and shrinking, via the
relative distance between the charged atoms in the chain.
9
Figure 7: PVDF film exhibiting piezoelectric properties. Adapted from:
<http://www.physics.montana.edu/eam/polymers/piezopoly.htm>
The most recent type of EAP is Ionic Polymeric Metal Composite (IPMC), which
contain a polymer layer sandwiched between two metal electrode layers. Within the
polymer layer, free ions respond to physical stimuli such as bending (Figure 8) to create
a voltage potential (Biddiss & Chau 2006).
Figure 8: IPMC film demonstrating piezoelectric properties

10
IPMC requires much smaller electrical stimuli to produce the same physical result
(Biddiss & Chau 2006), making it the most attractive candidate for actuators such as
artificial muscles, but the least attractive candidates for movement sensors. While the
literature in this area provide reliable detail, this technology is in its infancy, and hence
lacks enough critical attention and academic auditing to be considered gospel.
Accelerometers
Accelerometers have been used to measure human movement for decades, but with
significant technology advances in the last 10 years, progress has rapidly advanced
recently. This has led to an increase in their popularity amongst the scientific
community. Chief amongst the reasons for such a rise in popularity is the reduction in
their size.
A comparison of the footprint of accelerometers used in studies read is shown in Figure
9. (Note: where dimensions were not given, estimations were made using pictorial
evidence). The power consumptions are also given, using the quiescent current at the
typical voltage level. The two “3 axis” series provide comparisons between single axis
and dual axis accelerometers to today’s standard, the TA. A linear scaling factor was
used to calculate these results in power volume and power usage.

11
Figure 9: Graph showing progressive miniaturization of accelerometers
Figure 9 demonstrates that there has been a considerable drop over the past 14 years in
both size and power consumption. The two accelerometers from 1998 and 1999 show
an increase in size but a considerable improvement in power consumption (and
accuracy). Up until 2003, the accelerometers used in the studies read were single axis.
The accelerometers used in 2003 were both dual axis, and post 2003 were all TAs. This
miniaturization of the sensors has allowed them to become a viable alternative in this
project and many others.
The main focus recently has been on the use of accelerometers to monitor humans with
health conditions, such as the elderly and recently discharged patients. The
accelerometers have allowed patients to be monitored remotely, allowing them to live
their lives with less intrusion (Bouten et al. 1997).

12
Accelerometers are used to measure force (and hence acceleration), chiefly through the
use of capacitive scales (Shieh et al. 2001). Modern improvements have both increased
the number of axes (the current standard is three orthogonal axes) and size -
accelerometers can now be much smaller than 1cm2. Digital accelerometers now often
incorporate memory (most often registers for ‘tap’ detection and storage of force
values). Considering their size and precision, they have become popular methods for
recording the movements of humans in scientific studies across the globe. While there is
a wealth of information available on the use of accelerometers to measure and classify
human movement, this project appears to be unique in the use of a sleeping, supine
patient and the degree of precision required in the classification of different states.
A critical paper written by Bouten et al. in 1995, and has often been cited in the
literature relevant to this project. While they didn’t technically use a triaxial
accelerometer (three single axis accelerometers were combined to form an improvised
and more error-prone TA), they do evaluate the effectiveness of such uses: “reliable and
valid for the measurement of acceleration within the frequency and amplitude range of
human movement” (Bouten et al. 1997 : 146). This has served to be used as a backing
statement for the selection of accelerometers. Several other papers also reference this
paper as a testimonial to the effectiveness of using accelerometers.
One of the original articles, written in 1991 (Evans, Duncan & Gilchrist 1991) details
these advances and serves as an intermediary paper, highlighting the previous problems
with accelerometers and pointing the way forward. Several other papers reference this
article, proving it to be an important launching pad for many other researchers.
A series of papers written by researchers from The University of New South Wales
(UNSW), beginning in 2001 on the monitoring of ambulatory people have proven to be
informative and reliable, not only providing details of studies conducted in parallel, but
also providing a framework for the classification of the recorded movements.
Subsequent articles (and a PhD dissertation by M. Mathie) have formed the basis and
fundamental structure for this project. These series of papers also focus on the technical
rather than physiological aspects of the study, rather than the opposite, which has
proved to be a problem with many papers read for this project.

13
The first paper was a conference presentation made at a 2001 IEEE conference entitled
“A System for Monitoring Posture and Physical Activity Using Accelerometers”. This
essentially laid out their plan to use accelerometers to ‘telecare’ for patients with heart
conditions. As a preliminary paper, it obviously doesn’t include any results or
conclusions, but it does provide the rationale for future studies. Figure 10 is a simplified
version of this system.
Figure 10: Basic system for ‘telecare’ – remote monitoring (Mathie, Basilakis &
Celler 2001)
Two papers were also written (Mathie et al. 2003 ; Mathie, Lovell & Coster 2004)
concerning the classification of the monitored movements. In studies where patients
were recorded as standing, sitting, etc it is useful to understand the conditions that must
be met to classify a certain movement. The rationale behind the framework detailed in
Figure 11, such as the conditions required for detection of a fall, allow for an insight
into the decision making process involved as well as the potential for incorrect
classifications. While the framework required for this project is quite different with less
movements and a higher degree of accuracy required, it does allow for a basic model to
follow. In this project, there will not be as many discrete states, but nonetheless a
similar framework was created to help with design decisions.

14
Figure 11: Basic framework outlining future work in accelerometers (Mathie et al.
2004)
By far, the most important paper read for this project is the PhD dissertation written by
Merry Mathie in 2003 entitled “Monitoring and Interpreting Human Movement Patterns
Using a Triaxial Accelerometer”. The paper essentially encapsulates the previous
studies at UNSW on monitoring ambulatory patients and the classification of
movements. It does go into a high degree of detail however, and has served as a reliable
reference tool to understand their previous studies.
Humans are not the only creatures to be involved in accelerometer-based movement
studies. TAs were used in a study to remotely monitor the activity of cattle (Robert et al.
2009). Some interesting concerns were made in the long-term nature and reliability
requirements of the study, particularly the importance of reporting intervals and solid
design. The study divides movement into discrete states (sitting, standing etc) and
incorporates a mobile data logger contained in a unit (with two dual axis orthogonally
orientated) strapped to the cattle themselves, as shown in Figure 12. The rugged nature
of this design is also of importance – the units were worn by cattle without breaking, or
injuring the animal.

15
Figure 12: TA system used to monitor behaviour in cattle (Robert et al. 2009)
Although the authors of the paper are not of an engineering background, and it wasn’t
published in a well-known journal (Computers And Electronics in Agriculture), the
paper is well referenced and researched. The authors notably reference the research
from UNSW, and utilize this research (and others) to form the technical background for
the paper. As such, it makes little technical contribution but expands the scope of using
accelerometers into agriculture.
In 2003, the UNSW group wrote several papers on different aspects of recent studies.
One paper, entitled “A pilot study of long-term monitoring of human movements in the
home using accelerometry” involved the study of elderly patients, requiring them to
wear the unit throughout the day for up to three months. The paper highlights some
potential problems with long-term studies – data collection and patient compliance.
Patients in this study proved to be reliable and would wear the accelerometers,
attributed to the ease of wearing the unit. This is a vital consideration in this project –
although a sleep study is only several hours long, the system must not interfere with
their normal sleep patterns, so as to ensure an accurate diagnosis.

16
Also important to this project is the ability to record in real time, which was again
investigated by UNSW in 2006 (Karantonis et al. 2006) and provides some useful
insights to how to ensure reliability of data when using accelerometers. The system
consisted of accelerometers sampling at 45Hz, much faster than human movement. The
study wirelessly transmitted the data to a computer, where it was evaluated in real time.
This system showed great promise, achieving 90.8% accuracy in identifying discrete
states such as sitting, lying down, etc using a framework similar to that shown in Figure
11. The success of this study has further shown that accelerometers are a suitable option
for this project.

17
Design Approach & Experimental Method
Criteria
There is no current system to measure head posture in supine patients. For this reason,
and because the system was to be designed specifically for WASDRI, a series of
meetings and consultations were held to determine the criteria that would define the
system. Patients undergoing diagnostics and testing were also observed during a night
spent at the sleep clinic at SCGH. After much deliberation, the following criteria were
set to define the needed system: safety, size, strength, sensitivity, speed, compatibility,
cost and reliability.
Safety
A project of this kind must keep safety first and so this must be the first consideration
when making a design decision. Choking hazards such as wires and the device itself
present a clear and present danger to patients. As such, care must be taken to ensure the
system is firmly attached to the patient, and that wires are placed to prevent wrapping
around the patient and choking. Latex allergies are a hazard, particularly as the chance
of developing an allergy increases with exposure (National Institute for Occupational
Safety and Health 1997). Therefore, the outer layer of any device must be coated with
Elastane or similar non-allergenic material. All sharp edges are to be mitred off prior to
sealing in an epoxy to prevent cuts/poking injuries. It is also for safety reasons that a
wireless system is being devised.
Size
The most obvious constraint is the size of the system. The patient already has to wear
several other devices on their face, and in order to fit properly on the patient's head the
attached devices must be at most 4cm^2. Figure 13 clearly demonstrates the lack of
space and need for a compact and unobtrusive system.

18
Figure 13: Patient at WASDRI. It is important to note the lack of space for a
sensor on the head
This constraint doesn't really affect many of the options presented in the literature
review besides spring/torsion systems such as EAPs, which would be difficult to attach
to two points without obstructing equipment or being obstructed. Wireless systems
require more space and so this constraint could cause problems in the future.
Physical Strength
The system must be able to withstand the normal wear and tear of everyday use at the
sleep clinic as well as disinfection after each use. Although the system doesn't need to
survive sterilization in an autoclave, it is cleaned with rubbing alcohol. As such, the
system must be sealed in an epoxy to prevent shorting. Again, this makes EAPs a
difficult choice to justify as an epoxy layer will reduce the flexibility and linearity of
data.

19
Speed
This is not a great issue as it is static position, not movement that is being recorded. An
estimated 10Hz will more than satisfy requirements over the course of an hours long
sleep study.
Sensitivity
The previous system used to measure body position at WASDRI is a mercury switch,
with a recorded resolution of 90 degrees (device can record "on back", "on front", "left"
and "right"). The current system will use the body sensor to replace this outdated
sensor. It is hoped that the sensor system will have a resolution of approximately 5
degrees.
Compatibility
WASDRI already has two different data acquisition systems for research and day-to-
day diagnostics: Chart® by ADInstruments® and a Compumedics® E-Series system.
Chart® is a far more powerful recording system, but is used for research purposes only.
The latter system is used for day-to-day diagnostics and therefore, while the system is
designed to interface with both, the E-Series® is the most important. From the User
guide, The E-Series® can accept DC inputs between 0-256mV, has a frequency
response between DC to 105Hz, and can accept a maximum of 30nA. There is only one
channel currently available to use during sleep studies, but if the system is able to
replace the need for the body tilt sensor, two channels may be used. Discussions on how
to best represent the data on such a limited band has led the design to incorporate a
microcontroller in order to collect the data, do the necessary calculations and return the
required information as a single value. The possibility of using Pulse Width Modulation
(PWM) to add a second layer of data to the signal has been presented but rejected,
WASDRI instead opting for the simpler former solution.

20
Figure 14: Screenshots from the two different data acquisition systems. Chart®
(top) is a more powerful analysis tool, but the Compumedics® system (bottom) is
used for day-to-day diagnostics.

21
The system must be able to interface with the two data acquisition systems in place at
WASDRI (Compumedics and PowerLab) and hence must be able to express the results
of its calculations as a function of voltage between 0-256mV and 0-5V, depending on
the system used. The voltage must also be kept low to prevent potential electrocution, as
outlined in the safety section of this thesis. The close proximity of other systems also
means that care must be taken to avoid inducing voltage in other wires (a potential
hazard in digital systems) and having an error signal induced from those other systems
(more likely in analog systems).
Cost
While the system doesn't need to be mass-produced, and there is no tight budget on the
project, it is expected that the system will be reproduced for other sleep clinics, and
hence must be somewhat financially attractive.
Reliability
The long-term nature of sleep studies, and the potential for long-distance nature of
future trials means that the system needs to be reliable and easy to use. To this end, the
system must be designed so that components are both sturdy, but also that they can only
be assembled in the correct manner. A full user guide outlining safety protocol and
operation instructions is expected to accompany the system in the case of international
or other long distance trials/use. The system must also always be able to give accurate
data, or report to the user that the data isn't valid to avoid potential misdiagnoses.
The potential solutions were then rated against these criteria and evaluated for their
suitability. The EAP/Torsion systems would prove to be obstructive, and there is no
data on allergic reactions to EAPs or their common coatings. Such systems also require
fixed positions to remain anchored in order to provide tension - unlikely in an obese
patient. Optical systems would need to be both cost effective and provide a solution in
the situation that a patient blocks the camera by turning over, shifting pillows, etc. Hall
effect sensors are accurate at close range, usually 1-25mm (Flavel 2002), but unhelpful
at larger distances. From the known body of knowledge, this leaves the accelerometer.

22
Testing
EAP
Tests were carried out on PVDF (generously supplied by CS Hyde Company in Illinois,
USA), to judge its suitability for this project. The small Instron® machine in the School
of Mechanical Engineering was used to provide an accurate tensile force for the
experiments. Samples were prepared with different properties (length, width, etc) and
two contacts were attached with conductive tape. The Instron was then programmed to
put the samples under a tensile force. The resistance and voltage differential was then
measured.
Figure 15: Demonstration of Instron® testing
However, obtaining meaningful results proved difficult, despite the accuracy of the
materials testing machine. It was possible to measure resistance accurately, but the
results seem to have no predictability, making interpolation impossible (Figure 16). The
voltage recording had to be abandoned as measurements proved unreliable (the voltage
levels remained dynamic, even as the test remained static).

23
Figure 16: Graph demonstrating the unreliable nature of the EAP tests
Due to the inconsistency of such results, the requirement of secure anchor points, and
the lack of reliable data outside of a laboratory, EAPs were abandoned as a potential
sensor device.
Final System Test
After the design was built, preliminary experiments were carried out to confirm its
suitability and that the system was working as designed. A testing rig (Figure 17) was
designed by combining a goniometer borrowed from The University of Western
Australia with a custom built metal stand. The stand was designed in SolidWorks® and
built by the School of Mechanical Engineering workshop. Further details are available
in Appendix D.

24
Figure 17: Photo of TA testing rig
The goniometer can measure angles with a tolerance of one arcminute, and was used to
measure flexion/extension. The testing rig was not as accurate as each change in
position had to be measured with a protractor. For this reason, the rig measured head
rotation, which as explained earlier, is less important to this project than
flexion/extension.
Results were measured by rotating the rig, then rotating through the needed values on
the goniometer. This limited the number of times the rig had to be rotated. The rig was
allowed to come to a resting position. This is because after even a small movement, the
rig would vibrate for a few seconds. Combined with the damped oscillation effect of the
TA means that a waiting time of a few seconds was required. The median data value, as
recorded by the Arduino® was recorded.

25
Safety
Engineering projects in all forms involve hazards of varying permutations and potential
consequences. As such, safety should always be at the forefront of any engineers' mind.
�In this project, the major safety focus concerns the laboratory in which the devices were
designed and tested as well as patient safety. Potential hazards were identified early in
the project and measures were implemented to reduce or eradicate potentially negative
consequences from such hazards.
The majority of work for the project was completed at SAIL at UWA. Whilst given an
induction at the project’s commencement, several potential hazards were identified and
measures outlined to prevent harm. A copy of the induction is shown in Appendix B.
Figure 18: Map of SAIL, showing safety devices and evacuation routes
Many instruments in the lab are mains electricity powered and combined with low
voltage power sources, have the potential to electrocute. As such, any device that is
mains powered may only be serviced/altered by authorized personnel with appropriate
qualifications and training was undertaken previously concerning electrical safety.
Mains devices are also tested by Testel® and double insulated as a standard.

26
Concentrated and potentially dangerous chemicals used in the manufacture of Printed
Circuit Boards (PCB’s) are appropriately labeled and stored to avoid confusion and
potential mix-ups. All personnel in SAIL are trained in safety procedures in PCB
manufacturing and the relative chemicals. Emergency showers and eyewash stations are
also conveniently located close by.
Fire is always a potential hazard and fortunately SAIL is located close to several fire
extinguishers. Again, all personnel have been trained how to select and use the
appropriate extinguisher for particular fires. The entire building is also equipped with
fire and smoke alarms. The nearest evacuation point is labeled in Figure 18. While the
nearby Centre for Energy was under construction however, the nearest evacuation point
was several metres down the hall in the opposite direction.
There is a hydraulic hot press located within SAIL but not used for this project. As
Figure 19 shows, several safety backups such as protective Perspex screens attached to
circuit breakers and emergency stops ensure that this machine could not be accidently
started.
Figure 19: Hot press machine in SAIL

27
The SAIL laboratory is a small community and hence communication about safety is on
a more personal level than most. Telephone, email or personal meetings are the most
common forms of communication. Hence, any concerns about safety are rectified
almost immediately.
The testing rig was built by the workshop at the School of Mechanical Engineering. The
design was made from mild steel and did not require any unusual or particularly
hazardous steps to be performed. As such, this design did not present any danger to the
workshop staff outside of normal dangers associated with using their machinery.
Therefore, no extra steps outside of normal precautions and procedures already in place
in the workshop were needed.
The project also utilizes the West Australian Sleep Disorders Research Institute
(WASDRI) as a testing ground and eventual home to the finalized product. WASDRI
adheres to safety guidelines outlined by the Sir Charles Gairdner Hospital (SCGH) and
the WA Health Department. This project does not include any dangers that are not
already covered by the expansive (over 100 pages) and comprehensive safety manual
followed by all WASDRI staff.
Being a design project involving human test subjects, human ethics approval was
required. This was required from committees at both UWA and SCGH. These
committees required safety measures to be outlined to ensure patient safety. In this
project, human ethics approval has been granted as an addendum to existing approvals
at WASDRI.
The Instron® tension machine has its own induction and safety regulations. To avoid a
lengthy induction, Malcolm Stafford was asked to run these experiments. As the safety
officer in charge of both Instron® machines at the School of Mechanical Engineering at
UWA, Malcolm is more than capable and knowledgeable on safety matters and the use
of the machine.

28
Results and Discussion
Final System
Sensor
Taking into the consideration the arguments laid out previously concerning the types of
sensor systems, it is obvious that the most appropriate choice for the sensor is an
accelerometer. Several different accelerometers were considered, and two were trialed -
the ADXL345 and ADXL335, both from Analog Devices®. Both these devices are
small, low power Triaxial Accelerometers (TAs), but they differ in that the ADXL345 is
digital, as opposed to the analog ADXL335. The 345 communicated to the Arduino®
using a 4 wire SPI protocol where a chip select line, combined with a clock line to
communicate along a master in/slave out (MISO) line and master out/slave (MOSI) in
line.
There were significant problems when interfacing the Arduino® with the 345, requiring
2.5V for the datasheet to be accurate, and timing problems shown in Figure 20.
Figure 20: Oscilloscope results showing timing problem with ADXL345

29
Figure 20 shows the voltage levels of both the clock (line 1), and the MISO line. As can
be seen, the clock pulsed while the data itself was changing. This resulted in unreliable
data, and lost time. It is believed that the reason behind this is a lack of a comprehensive
SPI code library for the Arduino®, which was under construction as the project
progressed.
As a result of these problems, the ADXL335 was chosen as the sensor for this project.
The 335 communicates with the Arduino® through a changing voltage along three
lines. This TA is simpler to use, as it doesn't need to communicate with the Arduino® to
start sending data - simply supplying power to the device is enough to get usable data
from it. Unlike the 345, the 335 can accept voltages from 1.8V to 3.6V, with a linear
scaling factor applying to its sensitivity and output voltage range. This differs to the
345, where there is no data for supply voltages other than 2.5V.
Digital-to-Analog Converter
After the Arduino® has performed this calculation, the system must still transform this
digital value to an analog value. This is done through the Texas Instruments®
TLV5608, an eight channel 10 bit Digital-to-Analog Converter (DAC). This DAC was
largely chosen for it's availability at SAIL, but it also has some advantages over other
DACs. The TLV5608 is able to adjust the output value between 0V and the voltage
level of the reference input pin. This makes it possible to easily scale the output of the
system depending on the data acquisition system being used.
Attaching to patients
These accelerometers are then attached to patients using standard electrode backing tape
already in use in WASDRI (Figure 21). There is a potential problem with the
accelerometers rotating around the stud while attached, but this can be prevented with a
simple adhesive locking together the backing tape and accelerometer.

30
Figure 21: Picture of backing tape to attach sensor to patient. Adapted from:
<http://multimedia.3m.com>
Microcontroller
The microcontroller used in this project is the Arduino® Duemilanove®, chosen for its
availability and the abundance of open source libraries available online. With 6 Analog
I/O pins, it can periodically read the 3 data lines from both ADXL335s at once. The
ATMega328 that lies at the core of the Duemilanove® is more than capable of handling
the trigonometric calculations required. Being an open source project in its own, the
Arduino Integrated Development Environment (IDE) is available on all three common
computer platforms and communicates with the Arduino through a USB connection to
the first two digital input pins, Transmit (Tx) and Receive (Rx).
The IDE features a serial output screen, compile and upload functions as well as
highlighting of recognized text such as library functions and keywords. The compiler
assists in debugging by displaying, sometimes cryptically, problems it had in compiling
and highlighting potential bugs in coding.

31
Figure 22: The Arduino® IDE, demonstrating software debugging
Code
The code to control the system was written in the Arduino® IDE. As such, it is based on
the C/C++ programming languages, with its own library files (Arduino 2010). The
essential operation of the code is demonstrated in Figure 23.

32
Figure 23: Flow diagram of code used to govern system
Figure 23 shows that the code checks first to see whether or not the system has been
calibrated. This can be set by the push of a button by a lab technician, or avoided by
simply setting the calibration variable to "true" in the code. It then checks the two
accelerometers in succession, reading each line with the function analogRead(). This
process is designed to be fast, as the data is constantly changing, and accurate results
necessitate a fast 'snapshot', rather than a lengthy and 'blurred' data set. However, this
process is repeated in the form of an averaging filter of ten iterations to limit noise.
Once the data is saved in global variables, the Arduino compares them and derives the
resultant angle between the head and chest. This value is then saved and transferred to
the DAC, whereby the process repeats.
The code has been written in a flexible style, which presents several opportunities for
future optimisation, when other aspects of the system have been completed. For a full
outline of the code, please refer to Appendix A.

33
Calculation of Angles
The TAs report back values according to forces along three predetermined axes. In
order to calculate the angles of rotation and flexion/extension, some mathematics was
required. Figure 24 demonstrates the three axes and the corresponding angles.
Figure 24: Diagram of equations calculated using accelerometer data. Note that ��
is rotation, and � is flexion/extension
Limitations
There are however, limitations with the system. The most pressing concern is the
inability for an accelerometer to measure sufficiently slow movement around the axis of
gravity. This presents a problem if the patient is on his/her side and flexes/extends their
head. The focus at this point is patients in the supine position, which avoids this
problem. However, it is believed that if the scope of the project expands to include this
situation, an Inertial Measurement Unit (IMU) may be employed, as described in the
Future Work section of this thesis. This does mean an increased size and more wires
however, which will create problems considering the limited number of I/O pins on the
Arduino®.

34
Testing Results
Figure 25: Comparison of performance between the two accelerometers
Figure 25 shows that the accelerometers exhibit unique characteristics. Particularly
relevant is the difference in z values (top two lines at 0˚ rotation). This means that the
calibration system must be able to take this into account, or this data must be
programmed in the program, and altered if the devices are replaced.
The differences can be attributed in part to the accelerometers being attached to the
breakout board differently, as well as the testing rig repeatability problems. The
ADXL335 does normally exhibit unique values due to machining, but these are
typically marginal. The results also show that the testing rig did not perform well in
initial orientation, as the Y values should remain constant during flexion. This is put
down to misalignment during testing.

35
Figure 26: comparison of flexion, as measured by the accelerometer and
goniometer.
Figure 26 compares the angles measured by one of the accelerometers and goniometer
in flexion. The difference in angles measured is shown by the vertical separation (the
horizontal axis represents the data id number) and shows that the ADXL335 is an
appropriate choice for the system. The other accelerometer exhibits similar results.
Figure 27: Comparison of changing values under rotation

36
Figure 27 demonstrates the changes in x, y and z values in an accelerometer as the head
is rotated. It is important to note the differences in the X and Z series as this means that
rotation can affect the values of these vectors, even though they are perpendicular to the
rotation of the head. The value of Y is then required to determine the rotation in order to
account for the reduced size of X & Z in that orientation. Figure 28 outlines the changes
in Y with rotation.
Figure 28: Changing Y values with different degrees of rotation
Figure 28 demonstrates that rotation can be accurately measured, and hence used to
adjust the values of X & Z accordingly. It can be determined from the experimental
results that the system is appropriate and working, as the values of the TA follow the
known orientation values. The recorded value was found to be +/- 5mV of the expected
value (read by the Arduino®), or +/-1.5˚, as shown in Figure 25. This is well within the
requirements of the project, and far exceeds that of the previously used mercury switch.

37
Prototyping
Following preliminary testing, it became obvious that the system would have to be
improved to avoid failure due to breakage or lab technician error. Several potential
pitfalls were identified and accounted for. The first concern was wires breaking free,
from either the Arduino® or TA. The solution decided upon was a custom made Printed
Circuit Board (PCB) (Figure 29) that fitted snugly to the Arduino® and locked in the
TAs using an Insulation Displacement connector (IDC). This was completed using the
Gnu Image Manipulation Program® (GIMP).
Figure 29: PCB design
This 2-layer board reduces the number of wires required for the system (and hence
potential for failure). The IDC can only be inserted one way, preventing the user from
creating improper connections and shorting the TAs. The board is labeled, as is the box
it is housed in, to prevent the user from connecting the TAs to the wrong IDC.
Templates of this PCB have been saved to assist future work in altering designs using
GIMP.
Potting
The TAs must also be able to be cleaned with a rubbing alcohol or detergent after each
use for hygiene reasons. This means that they must be coated in an epoxy to protect the
circuitry. Several different epoxies were looked at, and Polydimethylsiloxane (PDMS)
was chosen for its availability in SAIL and simplicity of application.

38
Conclusions
Several systems were identified as potential candidates to measure relative head
position including motion capture systems, EAPs and Hall effect sensors, as well as
triaxial accelerometers.
The TA was chosen for this system as it presents a compact, reliable and inexpensive
solution to measuring relative head position in supine humans. The ADXL335 from
Analog Devices® was chosen as a suitable candidate and was combined with the
Arduino® Duemilanove® microcontroller and Texas Instruments® TLV5608 DAC to
measure the relative orientations of the head and body, compute the resulting angle and
transfer this data to the pre-existing data acquisition systems at WASDRI.
Preliminary testing was completed on the system using a custom built rig and
goniometer. These tests proved its suitability and superiority to existing tilt sensors at
WASDRI, and a more rugged version of the system has been built to prevent lab
technician error, wires coming free or breaking of the system. This system is scheduled
for human trials at WASDRI in the near future, possibly followed by international trials
at a later date.
The project reflects a multi-year program, and so not all objectives have yet been fully
completed. However, significant progress has been made and the project stands in good
stead. Several delays including attempting to interface the ADXL345 accelerometer
with the microcontroller hampered the progress of the project, but so far have not
prevented the project from progressing as can be expected.

39
Future Work
Interstate and international trials are planned, requiring the system to not only be able to
work with systems used in SCGH, but in hospitals across the world. This poses
potential hurdles such as language and a higher demand for reliability, as the system
isn’t designed to be fixed remotely. The logging and use of data may also present
problems, however inexpensive options such as small web servers may serve as
automatic information relays.
A wireless interface would reduce clutter and the risk of strangulation of a patient.
However, the sensitivity of surrounding equipment and the corresponding noise would
be challenging considerations. Powering sensors attached to patients and the increase in
size would also be major concerns, primarily from a practicality and safety point of
view.
IMUs (usually a TA combined with one or two gyroscopes) are believed to be a
potential solution to the inability of TAs to record flexion/extension when the patient is
on their side. This was out of the scope of the project for this year, and their size creates
a unique set of associated engineering challenges.
The ability for a system to self-calibrate and adjust to its conditions would be very
advantageous in this situation. Hence, an auto calibration system is currently being
developed, with the aim of adjusting for the original orientation vector and data
acquisition system with the push of a button. Once the button is pushed, the Arduino®
would record the original orientation data, and transfer the relevant voltage to the DAC
to scale the system output for the data acquisition system (there will have to be a button
for each data logger).

40
This system will also amplify the signal from TA to Arduino®, to utilize the full 0-5V
range of the analog I/O pin. As shown in Figure 30, the circuit will compare the value to
the known -1g voltage using an instrumentation amplifier. It then sends that value to the
Arduino®. Hurdles to overcome include the lack of available analog I/O pins (possibly
remedied by multiplexing using Field Effect Transistors), and changes in accuracy
brought about through amplification of noise.
Figure 30: Schematic of Amplification circuit
The movement of the mandible (jaw) is also considered a factor in OSA and again, no
system as of yet exists to measure such movement. While out of the scope for this
project, it would make for an interesting and challenging future project. A preliminary
investigation was done to identify potentially appropriate sensing systems.
Accelerometers are not suitable as the sole sensors as the jaw has six degrees of
freedom. The use of hall effect sensors and quadrant detectors within the patients mouth
has been investigated and appears to be the most appropriate sensor system, possibly
also involving accelerometers for larger scale movement and rotation around the
temporomandibular joint (jaw socket). Figure 31 shows another 2 possibilities: the use
of optical emitters/detectors. The system detects the opening and closing of the jaw by
measuring the distances between the emitter/sensor pair, and hence calculating the angle
of separation.

41
Figure 31: Future jaw sensor. Adapted from <http://en.wikipedia.org/wiki/Teeth>
However, further investigation and testing is required to decide on the sensor. These
types of sensors may not be new, but the location of electronics within the mouth of a
patient is novel and will require special safety and engineering consideration.

42
References
Arduino 2010, Arduino - Reference, Arduino. Available from :
<http://www.arduino.cc/en/Reference/HomePage> [20th May 2010].
Biddiss, E & Chau, T 2006, 'Electroactive polymeric sensors in hand prostheses:
Bending response of an ionic polymer metal composite', Medical Engineering &
Physics, vol. 28, pp. 568-578. Available from Science Direct [30th June 2009].
Bouten, CVC, Koekkoek, KTM, Verduin, M, Kodde, R & Janssen, JD 1997, 'A Triaxial
Accelerometer and Portable Data Processing Unit for the Assessment of Daily Physical
Activity', IEEE Transactions on Biomedical Engineering, vol. 44, no. 3, pp. 136-147.
Available from IEEExplore [26th June 2009].
Cartwright RD 1984, ‘Effect of sleep position on sleep apnea severity’, SLEEP, vol. 7,
pp 110-114.
Eastwood, PR, Szollosi, I, Platt, PR, Hillman, DR 2002, ‘Comparison of upper airway
collapse during general anaesthesia and sleep’, Lancet, vol. 359, pp. 1207-1209.
Evans, AL, Duncan, G & Gilchrist, W 1991, 'Recording accelerations in body
movements', Medical & Biological Engineering & Computing, vol. 29, pp. 102-104.
Available from Proquest [14th October 2009].
Flavel, SC, Nordstrom, MA & Miles, TS 2002, 'A simple and inexpensive system for
monitoring jaw movements in ambulatory humans', Journal of Biomechanics, vol. 35,
pp. 573-577. Available from Science Direct [26th September 2009].
Guimard, NK, Gomez N & Schmidt, CE 2007, 'Conducting polymers in biomedical
engineering', Progress in Polymer Science, vol. 32, pp. 876-921. Available from
Science Direct [1st November 2009].

43
Hayashi, T, Kurokawa, M, Miyakawa, M, Aizawa, T, Kanaki, A, Saitoh, A & Ishioka,
K 1994, 'A high-resolution line sensor-based photostereometric system for measuring
jaw movements in 6 degrees of freedom', Frontiers of Medical and Biological
Engineering, vol. 6, no. 3, pp. 171-186.
Hillman, DR, Murphy, AS, Antic, R & Pezzullo, L 2006, 'The Cost of Sleep Disorders',
SLEEP, vol. 29, no. 3, pp. 209-305.
Karantonis, DM, Narayanan, MR, Mathie, MJ, Lovell, NH & Celler, BG 2006,
'Implementation of a Real-Time Human Movement Classifier Using a Triaxial
Accelerometer for Ambulatory Monitoring', IEEE Transactions on Information
Technology in Biomedicine, vol. 10, no. 1, pp. 156-167. Available from IEEExplore
[22nd June 2009].
Kokjer, KJ & White, RG 1986, 'A Simple Telemetry System for Monitoring Chewing
Activity of Reindeer', The Journal of Wildlife Management, vol. 50, no. 4, pp. 737-740.
Available from: JSTOR [13th October 2009].
Mathie, MJ, Basilakis, J & Celler, BG 2001, 'A System for Monitoring Posture and
Physical Activity Using Accelerometers' in Proceedings of the 23rd Annual EMBS
International Conference, pp. 3654-3657. Available from IEEExplore. [8th Feburary
2010].
Mathie, MJ 2003, ‘Monitoring and Interpreting Human Movement Patterns Using a
Triaxial Accelerometer’, PhD Thesis, The University of New South Wales.
Mathie, MJ, Coster, ACF, Lovell, NH & Celler, BG 2003, 'Detection of daily physical
activities using a triaxial accelerometer', Medical and Biological Engineering &
Computing, vol. 41, pp. 296-301. Available from Proquest [22nd June 2009].

44
Mathie, MJ, Celler, BG, Lovell, NH & Coster, ACF 2004, 'Classficiation of basic daily
movements using a triaxial accelerometer', Medical & Biological Engineering &
Computing, vol. 42, pp. 679-687. Available from Proquest [22nd June 2009].
Mathie, MJ, Coster, ACF, Lovell, NH, Celler, BG, Lord, SR & Tiedenann, A 2004, 'A
pilot study of long-term monitoring of human movements in the home using
accelerometry', Journal of Telemedicine and Telecare, vol. 10, no. 3, pp. 144-151.
Available from Proquest [22nd June 2009].
Naejie, M, Van der Weijden, JJ & Megens, CCEJ 1995, 'OKAS 3D: optoelectronic jaw
movement recording system with six degrees of freedom', Medical & Biological
Engineering & Computing, vol. 33, pp. 683-688. Available from Proquest [5th
September 2009].
National Institute for Occupational Safety and Health 1997, Preventing Allergic
Reactions to Natural Rubber Latex in the Workplace, Center for Disease Control,
Available from http://<www.cdc.gov/niosh/latexalt.html>. [24th May 2010].
Robert, B, White, BJ, Renter, DG & Larson, RL 2009, 'Evaluation of three-dimensional
accelerometers to monitor and classify behavior patterns in cattle', Computers and
Electronics in Agriculture, vol. 67, pp. 80-84. Available from Science Direct [21st June
2009].
Shieh, J, Huber, JE, Fleck, NA & Ashby, MF 2001, 'The selection of sensors', Progress
in Materials Science, vol. 46, pp. 461-504. Available from Science Direct [17th August
2009].
Walsh, JH, Maddison, KJ, Platt, PR, Hillman, DR, Eastwood, PR 2008, ‘Influence of
head extension, flexion and rotation on collapsibility of the passive upper airway’,
SLEEP, vol. 10, pp. 1440-1447.

45
Weinhandl, JT, Armstrong, BSR, Kusik, TP, Barrows, RT & O'Connor, KM 2010,
'Validation of a single camera three-dimensional motion tracking system', Journal of
Biomechanics, vol. 43, pp. 1437-1440. Available from Science Direct [19th May 2010].
Wilson, SA, Jourdain, RPJ, et al. 2007, 'New materials for micro-scale sensors and
actuators: An engineering review', Materials Science and Engineering, vol. 56, pp. 1-
129. Available from Science Direct [1st May 2010].

46
Appendices
A – Code
/*
This is the code to operate 2 ADXL335 3-axis accelerometers from Analog Devices mounted on
the relevant breakout board from Sparkfun Electronics with the TLV5608 Digital-to-Analog
Converter (using the 4-wire SPI comm. system)
*
* TLV5608 (DAC) Setup:
* 1: Digital GND
* 2: DIN (MOSI)
* 3: SCLK
* 4: FS Chip Select
* 5: PRE Rail DAC to preset value (Active Low)
* 6: OUTE Output from DAC E
* 7: OUTF Output from DAC F
* 8: OUTG Output from DAC G
* 9: OUTH Output from DAC H
* 10: AGND Analog Ground
* 11: AV Analog Power
* 12: OUTA Output from DAC A
* 13: OUTB Output from DAC B
* 14: OUTC Output from DAC C
* 15: OUTD Output from DAC D
* 16: REF Reference Voltage
* 17: MODE 1-> uC, 0-> DSP
* 18: LDAC DAC only loads when LDAC is low.
* 19: DOUT Data out. used for debugging/daisy chaining
* 20: DV Digital power
The ADXL335 is a 3-axis accelerometer with signal conditioned outputs (The breakout board
originally comes with capacitors chosen so the bandwidth is 50Hz, but these can be changed).
It measures up to +/-3g, but can withstand up to 10,000g momentarily without damage. Vs is
to be between 1.8 and 3.6 Volts (3.3v from Arduino board is fine).
With this power, the sensitivity is 330 mV/g.
the 0g point is Vs/2, so @ Vs=3.3v, Og = 1.65V (approximately).
Data read into Arduino is converted to an integer [0,1023] 0->0v, 1023->5v ; 3.3v~ 675
The breakout board has 6 connections - Power, Ground, Self-Test, Xout,Yout and Zout.
*/

47
//-----------------------------------------------------------------------------------------
//DECLARATION OF GLOBAL VARIABLES
//-----------------------------------------------------------------------------------------
//ACCELEROMETER VARIABLES
int head = 0; // To differentiate between the two accelerometers
int chest = 1; // Head(x,y,z) connected to analog pins 0,1,2 : chest to 3,4,5
double gravity = 0; // for calibration, determine the voltage level eq. for gravity
int calibrate_button = 7; // to initialize calibration
boolean calibrated = false; // are accelerometers calibrated?
boolean moving = false; // Is patient moving fast?
boolean on_side = false; // Is patient on their side?
int stop_button = 6; // Emergency stop button
// Initialize pin variables (Changed within read_adxl function)
int xpin = 0;
int ypin = 1;
int zpin = 2;
// Initialize variables in which to store data
int x_value = 0;
int y_value = 0;
int z_value = 0;
// Initialize Acceleration variables (0 - 1023)
double A_x = 0;
double A_y = 0;
double A_z = 0;
// Initialize offset values - different for each accelerometer!!!
double x_offset = 339;
double y_offset = 334;
double z_offset = 352;
// Initialize angles - Flex is x relative to ground, roll y relative to ground, theta is z relative to gravity.
double flex = 0;
double rotation = 0;
double theta = 0;
double gamma = 0;

48
//Initialize variables for averaging filter
double previous = 0;
long current = 0;
//--------------------------------------------------------------------------------------------------
//DAC VARIABLES
int DATAOUT = 11; //MOSI
int DATAIN = 12; //MISO
int SPICLOCK = 13; //sck
int SS0 = 10; //ss for DAC
int LDAC = 9; //Load pin for DAC
byte clr;
int address=0;
byte DACSELECT = 0x00; // value for selection of the DAC
int DACVALUE = 0; // value to be passed to DAC
//-------------------------------------------------------------------------------------------
//SETUP - RUNS ONCE ON STARTUP
//---------------------------------------------------------------------------------------------
void setup()
{
Serial.begin(9600);
pinMode(DATAIN, INPUT);
pinMode(DATAOUT, OUTPUT);
pinMode(SPICLOCK,OUTPUT);
pinMode(SS0, OUTPUT);
pinMode(LDAC,OUTPUT);
digitalWrite(SS0,HIGH);
digitalWrite(LDAC,HIGH);
SPCR = B01011001;
// interrupt disabled,spi enabled,msb 1st,master,clk high when idle,sample on falling edge,
//clock = 62.5kHz [SPCR = (1<<SPE)|(1<<MSTR)|(1<<CPOL)|(1<<CPHA)|(1<<SPR1)|(1<<SPR0);]
clr=SPSR;
clr=SPDR;
delay(10);
}

49
//-------------------------------------------------------------------------------------------------
// FUNCTIONS GO HERE
//--------------------------------------------------------------------------------------------------
//ACCELEROMETER FUNCTIONS
void calibrate()
{
// Code to calibrate accelerometers and find voltage level for gravity
//
// MUST CALIBRATE BEFORE USING read_adxl PROPERLY!!!!!!!!!!!!
//
double working = 0;
read_adxl(head);
working = square(A_x) + square(A_y) + square(A_z);
working = sqrt(working);
calibrated = true;
}
void read_adxl(int accelerometer)
{
// Code to read values from the accelerometers
// Variable to be passed to function - acceleromter to be read
// Variable stored: angles in range of [-pi/2,+pi/2] radians
if (accelerometer == head){
xpin = 0;
ypin = 1;
zpin = 2;
} else {
xpin = 3;
ypin = 4;
zpin = 5;
}
x_value = 0;
y_value = 0;
z_value = 0;
for (int i=0;i<20;i++) {

50
x_value = x_value + analogRead(xpin);
y_value = y_value + analogRead(ypin);
z_value = z_value + analogRead(zpin);
delay(100);
}
x_value = x_value/20;
y_value = y_value/20;
z_value = z_value/20;
A_x = (x_value - x_offset)/(70); // Acceleration in x direction
A_y = (y_value - y_offset)/(70); // Acceleration in y direction
A_z = (z_value - z_offset)/(70); // Acceleration in z direction
double grav = A_x*A_x + A_y*A_y + A_z*A_z;
A_x = A_x / grav; // Acceleration in x direction
A_y = A_y / grav; // Acceleration in y direction
A_z = A_z / grav;
if (calibrated) {
/* // Check to see if person is moving fast (values > g)
if(abs(A_x) > 1 | abs(A_y) > 1 | abs(A_z) >1) {
moving = true;
delay(2000);
}
*/
flex = atan((A_x)/sqrt((A_y * A_y)+(A_z * A_z)));
rotation = atan((A_y)/sqrt((A_x * A_x)+(A_z * A_z)));
theta = atan(sqrt((A_x * A_x)+(A_y * A_y))/A_z);
// CHECK THIS OUT
}
moving = false;
if(abs(roll) > 0.66){ // Is patient on side?
on_side = true;
} else {
on_side = false;}

51
}
void compare_adxl()
{
//This is the crux of the program. Reads the two accelerometers, then computes the angles
//along a single plane, then computes the angle difference along that plane, then returns
//that as a integer for the DAC to relay on.
read_adxl(head);
gamma = asin(sin(flex)/cos(rotation));
}
//-----------------------------------------------------------------------------------------------
//DAC FUNCTIONS
byte first(int value)
{
// Code to combine address byte and 1st 4 bits of value for DAC
// Note: DAC has 10 bit resolution [0,1023] - last 6 bits converted in another function
// IF WANT TO USE ANOTHER CHANNEL ON THE DAC, MUST CODE IT IN HERE - DEFAULT IS DAC A
int working = 0;
working = value - (value % 64); //set last 6 bits to zero
working = working / 64; // "shift" down 6 bits
byte work = (byte) working;
work = work + DACSELECT;
return work;
}
byte last(int value)
{
// Code to extract the last 6 bits of value to pass to the DAC
byte working = 0x00;
working = (byte)value;
working = working << 2; // Shift bits two places to the left.
}
52
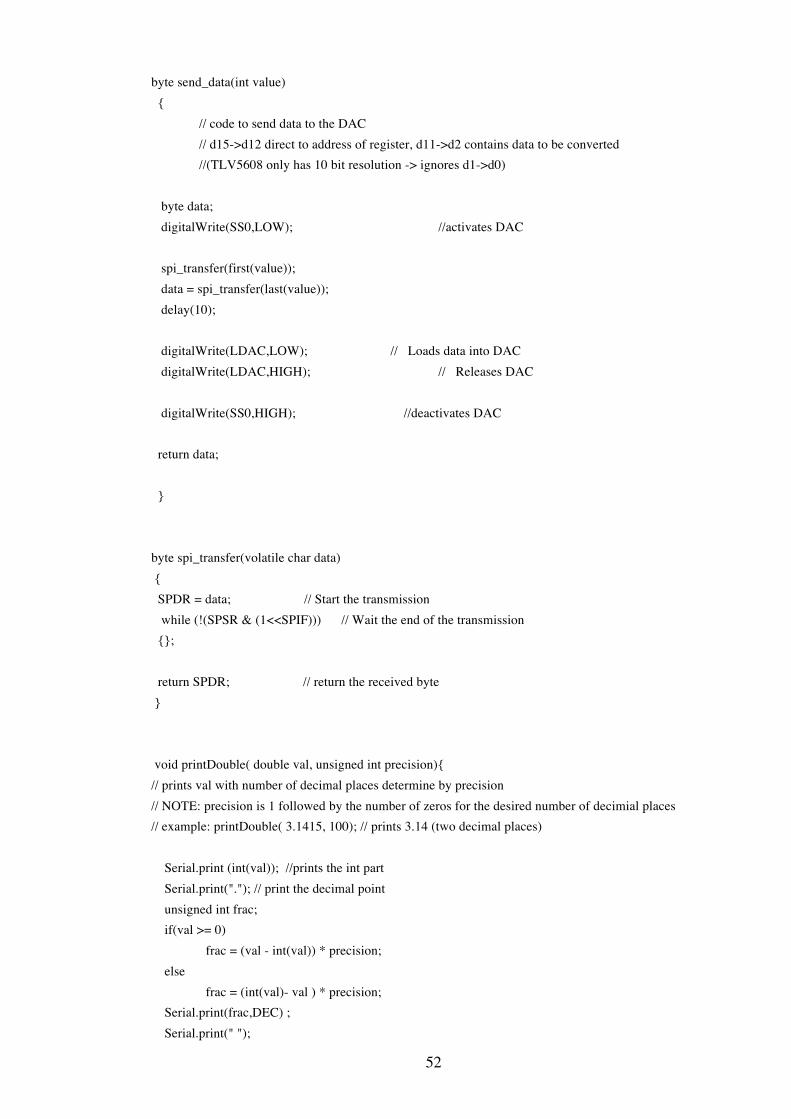
byte send_data(int value)
{
// code to send data to the DAC
// d15->d12 direct to address of register, d11->d2 contains data to be converted
//(TLV5608 only has 10 bit resolution -> ignores d1->d0)
byte data;
digitalWrite(SS0,LOW); //activates DAC
spi_transfer(first(value));
data = spi_transfer(last(value));
delay(10);
digitalWrite(LDAC,LOW); // Loads data into DAC
digitalWrite(LDAC,HIGH); // Releases DAC
digitalWrite(SS0,HIGH); //deactivates DAC
return data;
}
byte spi_transfer(volatile char data)
{
SPDR = data; // Start the transmission
while (!(SPSR & (1<<SPIF))) // Wait the end of the transmission
{};
return SPDR; // return the received byte
}
void printDouble( double val, unsigned int precision){
// prints val with number of decimal places determine by precision
// NOTE: precision is 1 followed by the number of zeros for the desired number of decimial places
// example: printDouble( 3.1415, 100); // prints 3.14 (two decimal places)
Serial.print (int(val)); //prints the int part
Serial.print("."); // print the decimal point
unsigned int frac;
if(val >= 0)
frac = (val - int(val)) * precision;
else
frac = (int(val)- val ) * precision;
Serial.print(frac,DEC) ;
Serial.print(" ");

53
}
//------------------------------------------------------------------------------------------------
//LOOP - FUNCTIONS RUN CONTINUOUSLY IN ORDER
//-------------------------------------------------------------------------------------------------
void loop()
{
if (!calibrated) {
calibrate();
Serial.print("calibrated");
}
compare_adxl();
gamma = gamma*1000;
gamma = map(gamma,-1571,1571,0,1023); // shifts values to 0 to 1023
printDouble(gamma,1000);
int result = (int) gamma;
if (result % 2 == 1) {
result++; // DAC cant send 1 in LSB
}
send_data(result);
delay(10);
}

54
Created by UWA Safety and Health Page 1 of 2 30/05/2010
The University of Western Australia
G55 Safety Induction Checklist
Employee’s Name: ______________________________________________
Position: ______________________________________________________
Supervisor: ____________________________________________________
School/Section: ________________________________________________
Location: _____________________________________________________
Supervisor: These actions should be completed during the first week or as soon as
practicable after the employee commences. Tick off each action and sign when all actions
have been completed. Please retain this checklist and provide a photocopy to the
employee.
Employee: You should sign the form where indicated when you are satisfied that the
items have been completed.
This induction form can be used instead of the general Safety Induction Checklist. A copy
of the general checklist with hyper links to relevant safety policies and procedures is
available from the Safety and Health web site at: www.safety.uwa.edu.au
1. General safety information provided and discussed:
UWA Occupational Safety and Health Policy – provide a copy / discuss
UWA occupational safety and health policies and procedures – refer to a copy
of the current index and discuss relevant parts including
• Smoking policy
• Resolving occupational safety and health issues
• Hazard reporting – show a copy of the hazard report form / discuss
• Incident/injury (accident) reporting – show a copy of this form / discuss
• Workers’ compensation and rehabilitation
Employee assistance programme - advise
Provide and explain the following pamphlets:
• A User Guide to the Safe Use of Electrical Equipment on UWA
Premises
• Working Comfortably with Computers
School safety and health manual (where relevant) – provide a copy / discuss
Staff, students and others working at non UWA work sites (such as hospital,
businesses etc) – arrange site specific safety inductions that complement the
established safe working procedures for that site
2. Emergency Procedures:
Provide and explain the Emergency Procedure for fire, evacuation, fire, bomb
threats and other events
Show locations and discuss use of fire extinguisher and other equipment
Show means of escape from building and assembly locations
Show location of First Aid box – advise of nearest First Aid Officer
B- Induction Forms

55
Created by UWA Safety and Health Page 2 of 2 30/05/2010
3. Safety Personnel in School/Section. Introduce and discuss, where applicable,
the safety roles and responsibilities of the:
Designation Name
Head of School/Section
School Safety Officer
Safety and Health Representative
Warden – Chief for Building
Warden – Area
First Aid Officer
School Safety Officer Rob Greenhalgh
G55 Safety Officer Adrian Keating
4. Specific workplace procedures and requirements:
Discuss specific workplace hazards and procedures to be followed, including:
• Screen based equipment
• Laboratories and workshops – inc. hazardous substances requirements
• Machinery and equipment – discuss/demonstrate safe working procedures
• Waste disposal procedures
Provide and discuss proper use and care of personal protective equipment
• Where are safety glasses/PPE located
• Which PPE are appropriate for each situation in the room
Assist in obtaining any necessary certificates, permits, licences or other
qualifications as required
• Attended the Heat Press safety course
Discuss Safety, it’s importance and how to ensure it
• Chemicals must be stored properly and used appropriately
• All mains powered electronic equipment must be Testel® tested
•
•
5. Follow up actions such as further information, instruction, equipment or
training required:
Action By whom By when
Supervisor's Signature .........................................Date............................
Employee's Signature ...........................................Date............................
Comments
…………………………………………………………………………………………
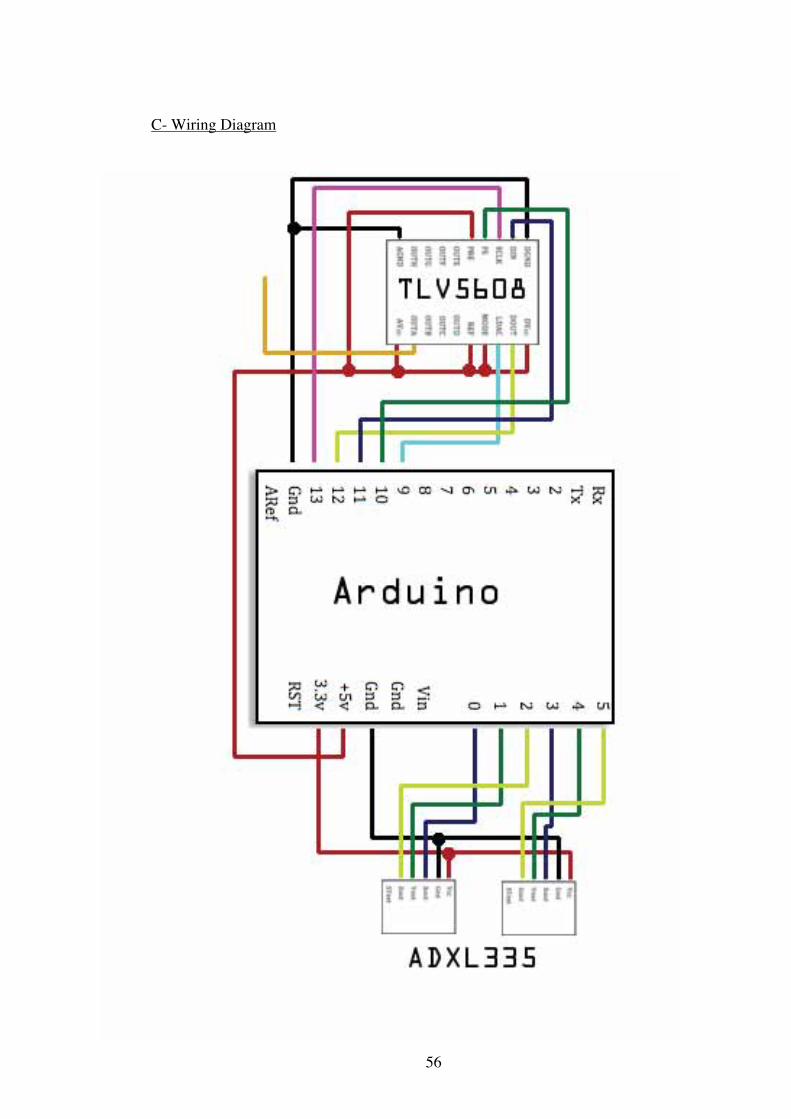
56
C- Wiring Diagram

57
��������
��
���
�
���
�
��
��
���
����
�
��
���
�
��
��
��
����
�
���
�
��
����
�����
� ���
��
���
��
�
��
��
���
����
��
�
������
���
���
����
��
��
� ���
� �!
�
���
���
��
��
��
��
�
��
��
��
" �
���
���
�
��
���
��
��
��
#��
�
��
�
$�
���
��
%
��
����
��
����
��
���
���
&
����
�
����
�
���
��
�
�
����
��
������������� �����������
��
��
��
����
��
���
�����
��
��
���
�
�
��
��
���
���
�
�
��
����
���
�
���
� �
��'
���
�
���
��
�
���
����
����
��
�
��
��
���
�
��
��
��
�
��
��
��
���
��
�
��
����
�
�
���
���
�
��
����
�����
��
�
��
���
����
���
����
��
��
� �
���
�
���
�
��
��
���
����
�
��
����
��
��
��
���
����
���
��
��
��
���
��
���
�
����
����
��
���
���
��
�
��
�
�()
�*
+,��
�)-
.+
��
/&
�0
$1
/
��
��0/
//
2��
�%�
�00 /30
&/
%
4
0/2
�% &$% �/
/
$/
D- Solidworks Design of Testing Rig


