
8/4/2019 Measuring the Return on Marketing Investment From Channel Marketing Programs Whitepaper
http://slidepdf.com/reader/full/measuring-the-return-on-marketing-investment-from-channel-marketing-programs 1/21
Measuring the Return on Marketing Investment (ROMI)from Channel Marketing Programs
September 2008
8/4/2019 Measuring the Return on Marketing Investment From Channel Marketing Programs Whitepaper
http://slidepdf.com/reader/full/measuring-the-return-on-marketing-investment-from-channel-marketing-programs 2/21
Page
Table of Contents Executive Summary ...................................................................................................................................... 3
Introduction ................................................................................................................................................... 4
Why Is It Important to Measure ROMI? ........................................................................................................ 5
Justifying the Marketing Budget ................................................................................................................................. 5
Establishing a Rational Basis for the Allocation of Marketing Resources .................................................................. 5
Providing Real Time Feedback on Program Effectiveness ........................................................................................ 6
Understanding the Positive Implications for Shareholder Value................................................................................. 6
Measuring ROMI – The Vision ..................................................................................................................... 7
ROMI Scope ............................................................................................................................................... 10
Measurable and Calculated (Imputed) Marketing Impact ......................................................................................... 10
Marketing Programs in Scope for ROMI Analysis .................................................................................................... 11
Defining and Calculating ROMI .................................................................................................................. 13
Definition .................................................................................................................................................................. 13
Calculation ............................................................................................................................................................... 14
Delivering the ROMI Solution ..................................................................................................................... 16
Analytical Framework ............................................................................................................................................... 17
Questions for Management Discussion ...................................................................................................... 19
Acknowledgements .................................................................................................................................... 20
About InfoNow Corporation ........................................................................................................................ 21
8/4/2019 Measuring the Return on Marketing Investment From Channel Marketing Programs Whitepaper
http://slidepdf.com/reader/full/measuring-the-return-on-marketing-investment-from-channel-marketing-programs 3/21
Page
Executive Summary
Unlike most other major corporate investments, marketing has historically escaped rigorous financial
scrutiny, chiefly because of the difficulty inherent in measuring its impact. A reliable methodology capable of
projecting and measuring an organization’s return on marketing investments (ROMI) would allow a company
to improve the effectiveness of its marketing programs, allocate marketing resources more effectively, and,
ultimately, increase shareholder returns.
A roadblock to measuring ROMI has been lack of transparency in channel sales data. However, by using
key attributes embedded in or appended to sales records to classify and segment transactions, supported
sales can be isolated from unsupported sales and the impact of a marketing action measured. Additional
financial modeling then results in a true ROMI calculation, subject to some limitations.
8/4/2019 Measuring the Return on Marketing Investment From Channel Marketing Programs Whitepaper
http://slidepdf.com/reader/full/measuring-the-return-on-marketing-investment-from-channel-marketing-programs 4/21
Page
Introduction
John Wanamaker, the department store owner, was famous for saying, “Half the money I spend on
advertising is wasted. The trouble is, I don’t know which half.” That sums up the plight of many channel
marketers for whom the challenge of measuring their return on marketing investment (ROMI) is an ongoing
problem. But is measuring ROMI doomed to be unsolvable in the channel marketing environment?
We believe that with proper sales tracking and access to sales data, the issue of ROMI is, indeed, solvable.
This paper presents a methodology based upon techniques developed by some of our partners (see
Acknowledgements), and has applicability as outlined below:
a) Applications are targeted towards the management of channel sales data, and the
methodology is focused on understanding the impact of channel marketing programs, asopposed to other types of marketing programs, which require their own methodology.
b) These tools can provide only part of a solution. A complete ROMI calculation
incorporates unstructured financial information that would not be processed in the
application environment. However, it should be possible to identify and model these
additional data points within most companies, and users of this methodology will have to
apply their own insights. Research and computation of supporting data values,
particularly on the investment side of the equation, will be required.
c) The impact of some marketing activities, such as brand building and awareness
advertising, can be measured only by surveys, not in transactional detail. It may be
possible to adapt this methodology to measure ROMI for these types of program;
however, we have not attempted to cover above-the-line activities in this paper.
8/4/2019 Measuring the Return on Marketing Investment From Channel Marketing Programs Whitepaper
http://slidepdf.com/reader/full/measuring-the-return-on-marketing-investment-from-channel-marketing-programs 5/21
Page
Why Is It Important to Measure ROMI?
Justifying the Marketing Budget
Marketing is a significant expense for most businesses ⎯ yet its impact on the organization is difficult to
measure. Lacking quantifiable measures of success, CFOs and CEOs are increasingly skeptical about the
true value of marketing. When faced with the need for cost cutting, many organizations believe that cutting
the marketing budget is relatively risk-free since there is no objective measurement of the benefits marketing
expenditures produce for the company.
For the CMO, this is a potentially perilous state of affairs. The marketing function knows that finding
customers, nurturing relationships and building the firm’s brand are vitally important. But, in the absence of
any metrics, how can the value be demonstrated ? A financially robust method of modeling, justifying and
measuring ROMI would put marketing expenditure on the same footing as other investments.
Establishing a Rational Basis for the Allocation of Marketing Resources
It is not uncommon for an organization to distribute its marketing budget among divisions or territories in a
way that is somehow “fair” or proportionate, rather than economically rational. For instance, marketing
budgets are often calculated as a percentage of projected revenues, or as a uniform increase on last year’s
spend. Similarly, channel partners frequently get away with less-than-rigorous justification for vendor-
funded marketing activities. Consequently, channel MDF1
has notoriously underperformed as an
investment, with sometimes dubious returns that cannot be audited.
A responsible way for management to allocate capital is to seek to maximize shareholder returns. It is
inevitable that some investments will be more profitable than others. Budget allocations ⎯ including
marketing budgets ⎯ should reflect this analysis, rather than last year’s sales performance or historical
expenditure patterns.
By measuring and predicting ROMI, marketing departments can make investments on an increasingly
rational basis. With experience, a firm can learn what works best, when and where, and, over time, rapidly
improve the success of its programs. The planning and execution of marketing activities can become more
scientific as it reflects factors that impact returns, such as product lifecycle, customer or segment
responsiveness, seasonality and the competitive environment.
1 Channel MDF = Market Development Funds paid to channel partners such as distributors and retailers.
8/4/2019 Measuring the Return on Marketing Investment From Channel Marketing Programs Whitepaper
http://slidepdf.com/reader/full/measuring-the-return-on-marketing-investment-from-channel-marketing-programs 6/21
Page
Providing Real Time Feedback on Program Effectiveness
By institutionalizing the measurement of program ROI, the business has the opportunity to correct course
and reinforce behaviors while a campaign is still in progress.
A classic example is that of a channel program designed to create an increase in reseller sales of a
particular product line. By monitoring performance measurement on an ongoing basis, program participants
can determine whether their efforts are on track to deliver the expected results. If sales metrics are showing
below-plan performance at any stage, the program owner can instantly react with necessary changes to
program rewards, timing or content to deliver the planned results.
Understanding the Positive Implications for Shareholder Value
An important intellectual step is to recognize that marketing investments create intangible assets with real
business value. For example, a strong brand drives purchasing preference, thereby reducing future selling
costs and building competitive barriers. Similarly, an effective loyalty program increases customer lifetimevalue and creates a stream of future income.
By demonstrating the financial value of marketing assets in terms of future income streams, the marketing
function is better able to justify its activities and demonstrate its importance to the business on a strategic,
as well as tactical, basis ⎯ a stronger position to be in than the traditional uncertainty attached to marketing
impact. While marketing programs are often viewed as tactical, and short term in nature ⎯ certainly true of
some programs ⎯ more strategic investments should really be treated as capital expenditure.

8/4/2019 Measuring the Return on Marketing Investment From Channel Marketing Programs Whitepaper
http://slidepdf.com/reader/full/measuring-the-return-on-marketing-investment-from-channel-marketing-programs 7/21
Page
Measuring ROMI – The Vision
In an ideal world, a marketing program involving a specific expenditure would result in an unambiguous
impact, lasting for a defined period. Take the example of a supermarket promotion involving a pallet of
specially sourced merchandise, which sells out in a day or so, and is then gone. The profit is known. The
cost of goods sold is known. The cost of the floor space is known. On the face of it, the ROMI calculation is
straightforward: (revenue – cost of goods) / occupancy = return on investment.
Figure 1: Incremental vs. Ru n‐Rate Sales
However, that picture fails to take into account two key issues: the opportunity cost of using the floor space
in that way and the possibility that the product competed with another elsewhere in the store, possibly
displacing other sales.
A more accurate method is to calculate the impact of the marketing action against revenues that would have
happened without it. In other words, isolate the sales lift occurring as a consequence of the marketing
action and compare that with the unsupported sales run-rate that would have occurred otherwise.
Figure 2: A Simple Formula for Calculating ROMI
In the supermarket example (which could be an instance of a channel marketing action by a product
vendor), this measurement could be achieved, in principle, by running the pallet promotion in half of a

8/4/2019 Measuring the Return on Marketing Investment From Channel Marketing Programs Whitepaper
http://slidepdf.com/reader/full/measuring-the-return-on-marketing-investment-from-channel-marketing-programs 8/21
Page
chain’s stores and comparing the effect with sales from the other half.
Figure 3: Supported vs . Unsupported Sales
Translating this scenario into the world of channel marketing programs requires segmenting reseller
performance (or behavior) into (i) test samples which are impacted by a particular marketing action and (ii)
control groups which are unaffected by the action. The measurement of the test sample’s (hopefully
superior) performance is then compared to that of the control segment. Pragmatically, this segmentation
can occur across a number of dimensions by careful specification of where, precisely, the impact takes
place. For example:
» Resellers in one geography, versus resellers in another (subject to an adjustment for relative
market growth, potential differences in the customer base, or degrees of market penetration, if
necessary).
» One time period this year, versus the same period the previous year (adjusted as necessary foryear-on-year market or channel growth).
» One reseller channel (e.g. VARs) versus all the others (e.g. retail, online and mail order).
» One product family versus all other product families.
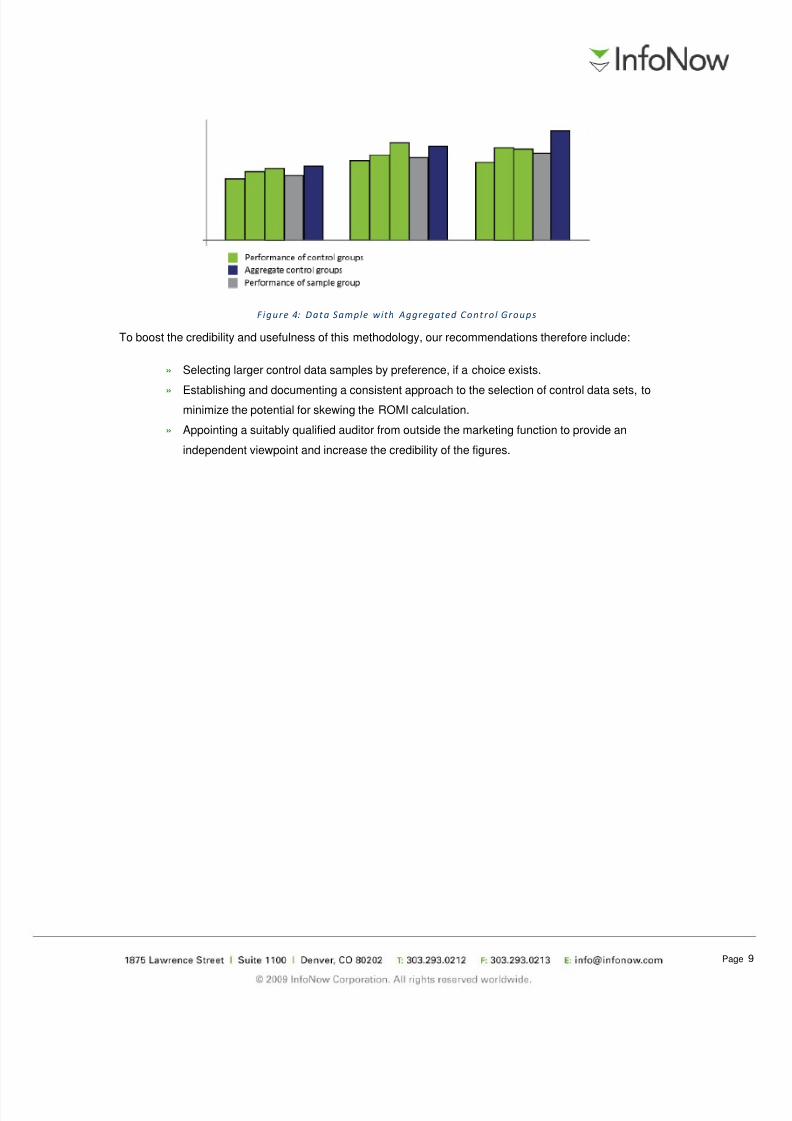
Larger controls groups are preferable. It is a good practice to aggregate control samples, for a number of
reasons.
» Aggregating controls reduces statistical uncertainty due to small sample sizes.
» The demographics and behaviors of different samples may vary widely, undermining the validity
of a comparison. The larger the control group can be, the closer it matches the population as a
whole.
» It is quite feasible to construct many different outcomes for a ROMI calculation depending on
which control is used to benchmark the marketing impact. Combining control samples reduces
the risk of gaming the ROMI calculation.
8/4/2019 Measuring the Return on Marketing Investment From Channel Marketing Programs Whitepaper
http://slidepdf.com/reader/full/measuring-the-return-on-marketing-investment-from-channel-marketing-programs 9/21
Page
Figure 4: Data Sample with Aggregated Control Groups
To boost the credibility and usefulness of this methodology, our recommendations therefore include:
» Selecting larger control data samples by preference, if a choice exists.
» Establishing and documenting a consistent approach to the selection of control data sets, tominimize the potential for skewing the ROMI calculation.
» Appointing a suitably qualified auditor from outside the marketing function to provide an
independent viewpoint and increase the credibility of the figures.
8/4/2019 Measuring the Return on Marketing Investment From Channel Marketing Programs Whitepaper
http://slidepdf.com/reader/full/measuring-the-return-on-marketing-investment-from-channel-marketing-programs 10/21
Page
ROMI Scope
Measurable and Calculated (Imputed) Marketing Impact
The reporting data collected by vendors from their channel partners, i.e. distributors, retailers and resellers,
includes point of sales (POS) reports and inventory reports. Typically, the information in these reports
comprises:
» Transaction date
» Product identification
» Price-related information
» Transaction quantity
» Reseller or customer identification
In practice, this information is spread across 20 or 30 data fields, with each item of information, such as a
street address or product sold, occupying one field.
POS data supplies two distinct types of marketing impact measurement: directly measured impact which is
inherent in the sales data, and imputed impact, which is the result of further calculation.
The fields available within POS reports determine which impacts can be directly measured. For example,
the data may show that a reseller sold three distinct products ⎯ an example of Measurable Impact. As an
example of calculated (or imputed impact), additional information might reveal that these were from one, two
or three product families. If the vendor wanted to increase reseller loyalty across the whole product portfolio,
measuring sales impact in these terms (i.e. products per customer, or PPC) would be the required metric.
So the ROMI practitioner, in this example, would need to translate “number of different products sold” to
“number of different product families sold.”
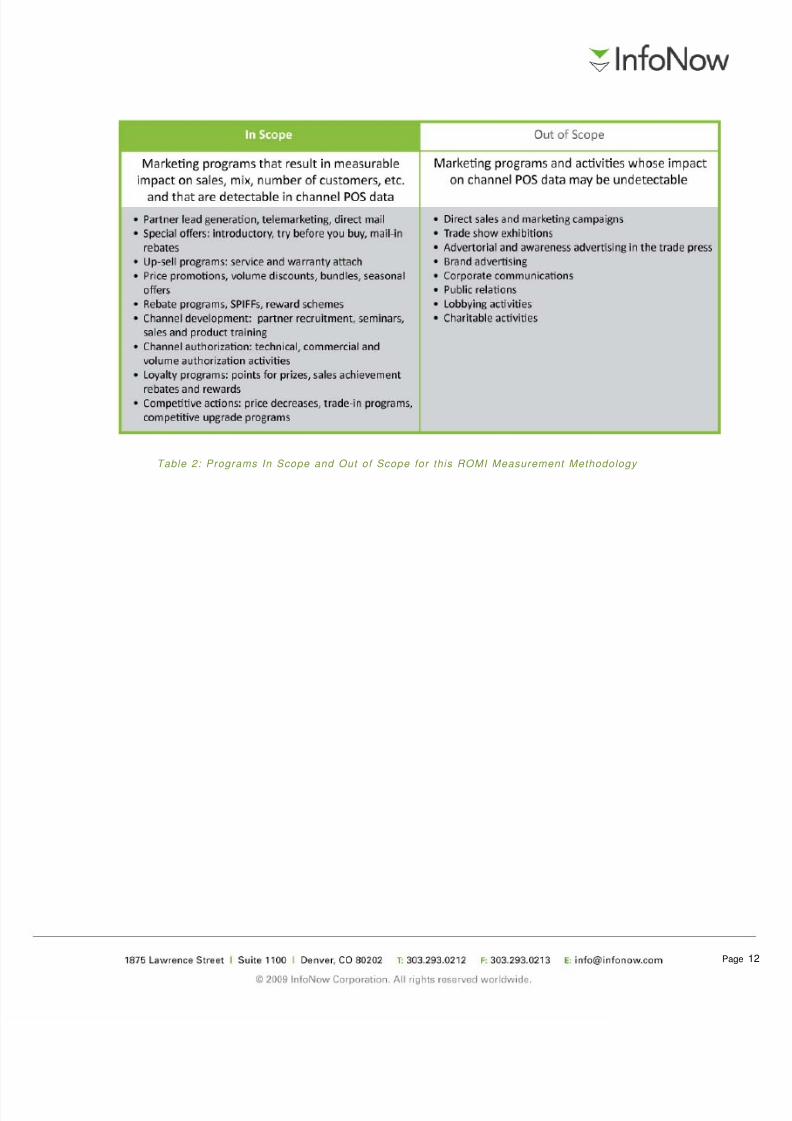
The table below identifies some impacts that can be measured either directly or that may be deduced from
POS data with additional analysis.

8/4/2019 Measuring the Return on Marketing Investment From Channel Marketing Programs Whitepaper
http://slidepdf.com/reader/full/measuring-the-return-on-marketing-investment-from-channel-marketing-programs 11/21
Page
Table 1: Marketing Impacts Identif iable from POS Data
Marketing Programs in Scope for ROMI Analysis
Channel marketing programs are designed to achieve specific objectives such as partner recruitment,
accelerated sales growth, contract renewals and so on. The mechanisms used to achieve these aims are
investments such as communications, training, and rewards.
The table above identifies many of the metrics that channel POS can provide, both directly and by
deduction, and reveals the impacts that can be measured and those that cannot. Based on this
understanding, we can identify the types of program for which ROMI analysis is possible.
8/4/2019 Measuring the Return on Marketing Investment From Channel Marketing Programs Whitepaper
http://slidepdf.com/reader/full/measuring-the-return-on-marketing-investment-from-channel-marketing-programs 12/21
Page
Table 2: Programs In Scope and Out of Scope for this ROMI Measurement Methodology
8/4/2019 Measuring the Return on Marketing Investment From Channel Marketing Programs Whitepaper
http://slidepdf.com/reader/full/measuring-the-return-on-marketing-investment-from-channel-marketing-programs 13/21
Page
Defining and Calculating ROMI
Definition
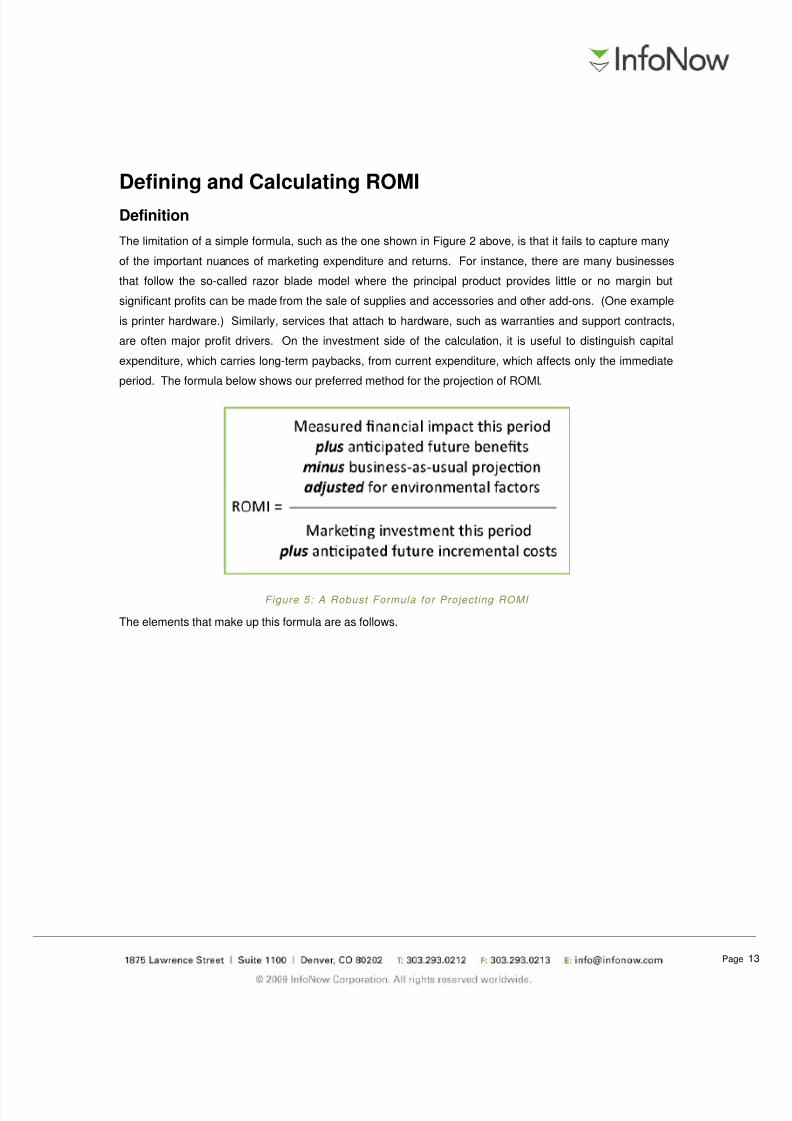
The limitation of a simple formula, such as the one shown in Figure 2 above, is that it fails to capture many
of the important nuances of marketing expenditure and returns. For instance, there are many businesses
that follow the so-called razor blade model where the principal product provides little or no margin but
significant profits can be made from the sale of supplies and accessories and other add-ons. (One example
is printer hardware.) Similarly, services that attach to hardware, such as warranties and support contracts,
are often major profit drivers. On the investment side of the calculation, it is useful to distinguish capital
expenditure, which carries long-term paybacks, from current expenditure, which affects only the immediate
period. The formula below shows our preferred method for the projection of ROMI.
Figure 5: A Robust Formula for Projecting ROMI
The elements that make up this formula are as follows.

8/4/2019 Measuring the Return on Marketing Investment From Channel Marketing Programs Whitepaper
http://slidepdf.com/reader/full/measuring-the-return-on-marketing-investment-from-channel-marketing-programs 14/21
Page
Table 3: The Elements of a ROMI Projection
Calculation
The list above illustrates how the measurement of ROMI cannot be achieved by merely tracking sales uplift.
In a hypothetical example of a manufacturer of printing hardware who changes from selling black and white
laser printers to a multi-function color printing system, the vendor could see a $3,000 future profit stream
from the ink sold for the color system versus $1,000 for the toner used in the black and white printer. From
channel sales data, it would be relatively easy to measure any change in the mix and any increase in sales
volume for the printers themselves. However, the financial benefits of those changes are felt over the

8/4/2019 Measuring the Return on Marketing Investment From Channel Marketing Programs Whitepaper
http://slidepdf.com/reader/full/measuring-the-return-on-marketing-investment-from-channel-marketing-programs 15/21
Page
lifetime of the devices, potentially three or four years. Rather than waiting several years to measure sales of
printer supplies, a projected impact analysis for each printer type can be made using a net present value
financial model.
Table 4: Example ROMI Calculation
Scenario: By changing the product mix of a printer business from black and white to color devices,
within a channel segment

8/4/2019 Measuring the Return on Marketing Investment From Channel Marketing Programs Whitepaper
http://slidepdf.com/reader/full/measuring-the-return-on-marketing-investment-from-channel-marketing-programs 16/21
Page
Delivering the ROMI Solution
A complete ROMI solution involves a dedicated analytical effort drawing together all the financial information
implied by the ROMI formula in Figure 5, above.
The accuracy, completeness and timeliness of the underlying POS data collected from channel partners are
vital to accurate ROMI calculations. Inaccurate or incomplete data defeats ROMI calculations and can result
in investments in unsuccessful channel marketing programs. Therefore, sales data quality becomes an
overriding organizational priority. The following factors are key to accurate data collection:
Accuracy. Advanced technologies should be employed for the automatic identification of entities
within POS records. Unprocessed sales data files contain numerous duplicate records, ambiguous
data values and inconsistencies both within a single partner’s files, but especially across multiple
reporting partners. Algorithms can deliver a single, consistent customer view, auditable down to
the transaction line level.
Attribute Assignment. In order to give structure and context to POS data, it is necessary to
assign appropriate attributes to each individual transaction. The most useful attribute assignment
is highly variable from company to company and depends on the nature of an organization’s
business. Product attributes, for instance, may fall into categories that are specific to a given
vendor’s business model and business vocabulary. Reseller attributes might include type,
geography, authorization status, channel program status and so on. Using the rules of a client’s
business, each partner POS record should be placed within its appropriate categories and sub-
categories, as illustrated in Figure 6, below.
Figure 6: Examples of the Application of Business Rules to a Channel POS transaction

8/4/2019 Measuring the Return on Marketing Investment From Channel Marketing Programs Whitepaper
http://slidepdf.com/reader/full/measuring-the-return-on-marketing-investment-from-channel-marketing-programs 17/21
Page
These two key features empower the analyst to classify and sub-divide sales data for multiple purposes,
including ROMI analysis.
Analytical Framework
As can be clearly seen, this level of analysis required for a ROMI calculation is detailed, fairly complex and
highly specific to individual circumstances. The steps required to implement this proposed methodology are
summarized below.

8/4/2019 Measuring the Return on Marketing Investment From Channel Marketing Programs Whitepaper
http://slidepdf.com/reader/full/measuring-the-return-on-marketing-investment-from-channel-marketing-programs 18/21
Page
Figure 7: ROMI Analysis Framework

8/4/2019 Measuring the Return on Marketing Investment From Channel Marketing Programs Whitepaper
http://slidepdf.com/reader/full/measuring-the-return-on-marketing-investment-from-channel-marketing-programs 19/21
Page
Questions for Management Discussion
These questions will qualify the potential benefits to your company of establishing a formal methodology for
the projections and measurement of ROMI.
1) Review the importance of indirect sales channels to your business. Will the future performance of
your channel partners have a material impact on your company’s success?
2) Would you consider your company’s channel relationships as a source of competitive advantage,
either currently or potentially? If you significantly enhanced your firm’s influence over indirect
channels, what impact might that have on market share?
3) Quantify the future profit contribution your company is seeking from growth in sales via channel
partners. Are indirect revenues planned to grow faster or slower than overall sales? How do they
compare to expected market growth rates?
4) What level of investment would be appropriate to deliver that incremental profit contribution, given
your firm’s internal rate of return hurdles? How does that compare to your current channelmarketing expenditure?
5) How does your company currently allocate its global marketing budget? Would you describe it as
rational (i.e. profit maximizing) or merely fair (e.g. proportionate to historical expenditure, or to
budgeted sales)?
6) Based on the answers to the questions above, how much value would your firm place on realizing
the benefits associated with detailed ROMI analysis, projection and visibility?
» Establishing an economically rational basis for the allocation of marketing investments, so that
expenditure can be aligned with the greatest potential returns.
» Developing a foundation of corporate knowledge regarding what returns to expect from various
marketing actions at different times and in different circumstances.
» Receiving real-time feedback on the impact of current marketing expenditure, for course
correction and partner motivation.
» Expressing marketing impact in financial terms such as net present value, or projected
shareholder returns, allowing marketing investments to be evaluated alongside other uses of
the firm’s capital resources, such as research and development, or corporate acquisitions.

8/4/2019 Measuring the Return on Marketing Investment From Channel Marketing Programs Whitepaper
http://slidepdf.com/reader/full/measuring-the-return-on-marketing-investment-from-channel-marketing-programs 20/21
Page
Acknowledgements
The methodology described in this paper draws on techniques and insights from a number of sources. In
particular, the authors of the paper wish to acknowledge valued contributions from the following
organizations, all leading practitioners in the design of channel programs.
Company Name Corporate website URL Main telephone number
Birch Worldwide www.birchworldwide.com +44 118 912 1200
Hawkeye | Cohesion www.hawkeyeww.com (214) 659-5656
PlanetDNA www.planetmad.co.uk +44 162 852 1234
VIA International www.viaint.com +44 20 8899 7333
8/4/2019 Measuring the Return on Marketing Investment From Channel Marketing Programs Whitepaper
http://slidepdf.com/reader/full/measuring-the-return-on-marketing-investment-from-channel-marketing-programs 21/21
About InfoNow Corporation
InfoNow’s on-demand Channel Performance Optimization solutions provide global Fortune 1000 high-
technology and component manufacturers with visibility into every channel relationship and interaction in
real-time, allowing them to gain the insight necessary to find the best mix of channel actions that grow
revenue and reduce cost in order to achieve sustainable competitive advantage. Combining industry best
practices with patented technologies, InfoNow’s SaaS-based solutions ensure timely, accurate and complete
channel insights to optimize business processes. InfoNow processes over 120 million POS and inventory
transactions per year delivering channel visibility, agility, and control. For more information, go to
www.infonow.com


