©Re
tsch
Tec
hnol
ogy
2012
-1
Speaker: Dipl.-Ing. Gert BeckmannRetsch Technology GmbH
Host: Ian TreviranusHORIBA Scientific Inc.
CAMSIZER
CAMSIZER®Dynamic Image Analysis
ISO 13322-2 conform
Measuring the Size and Shape of Frac Sand and other Proppants
Webinar PresentationFriday, March 9th, 2012

©Re
tsch
Tec
hnol
ogy
2012
-2
Measuring the Size and Shape of Frac Sand and other Proppants
The size and shape of frac sands and other proppants plays a critical role in keeping fractures open and atthe desired conductivity. Learn how the CAMSIZER has greatly improved theaccuracy and speed of proppant analysis. This information will be useful for any petroleumengineer or proppant supplier referencingISO 13503-2 or API RP 56/58/60 standards.
This Webinar will cover the following topics:
* Faster, more accurate size measurement* Reporting sphericity and roundness* Objective results in only 3 minutes* Example measurement results
Abstract
©Re
tsch
Tec
hnol
ogy
2012
-3
• Instead of size measurement with sieve shaker and shape analysis by visual inspection you can do a CAMSIZER analysis of both in a much shorter time
• Reproducible results because of high statistics and accurate calibration
• Measuring easily in compliance of API specifications of grain size (90%), oversize and dust (<1%), roundness and sphericityand measure the dust content before and after the crush resistance test
• Measure the increase of layer coating thickness and change of roundness because of the resin coating of sand grains or ceramic proppants
• Also possible: Measuring diameter and length of extrudates
Benefits for the Proppant Industry
©Re
tsch
Tec
hnol
ogy
2012
-4
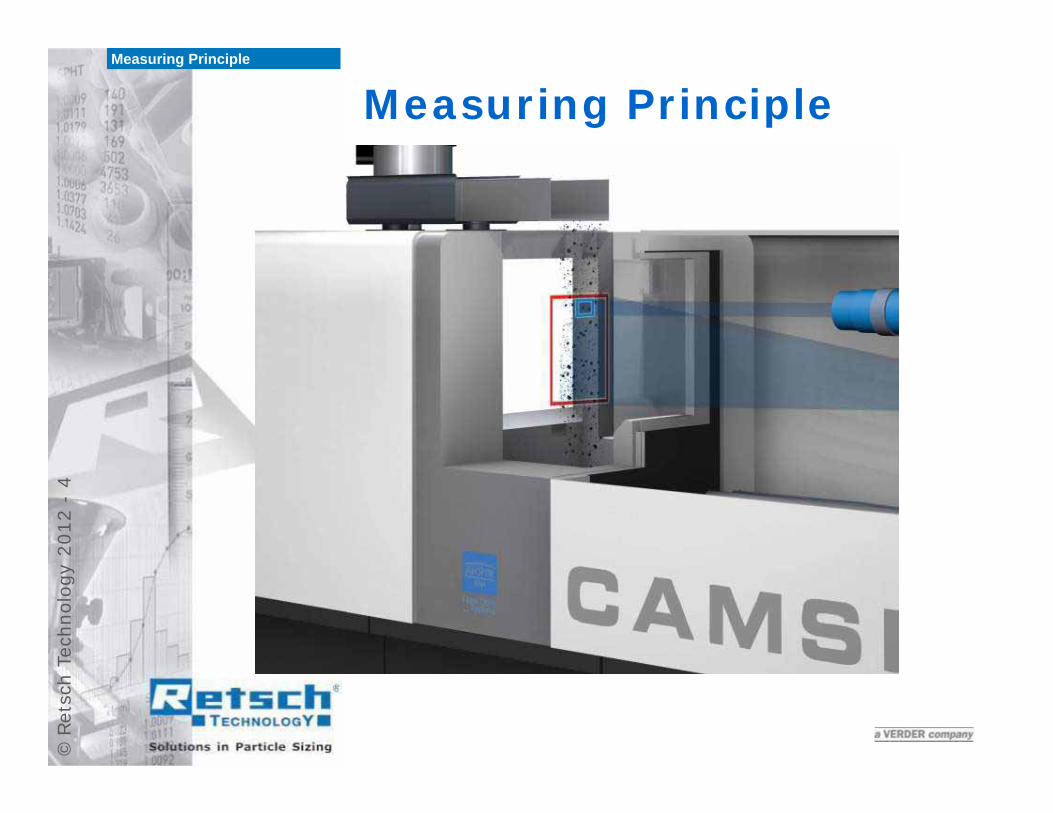
Measuring PrincipleMeasuring Principle
©Re
tsch
Tec
hnol
ogy
2012
-5
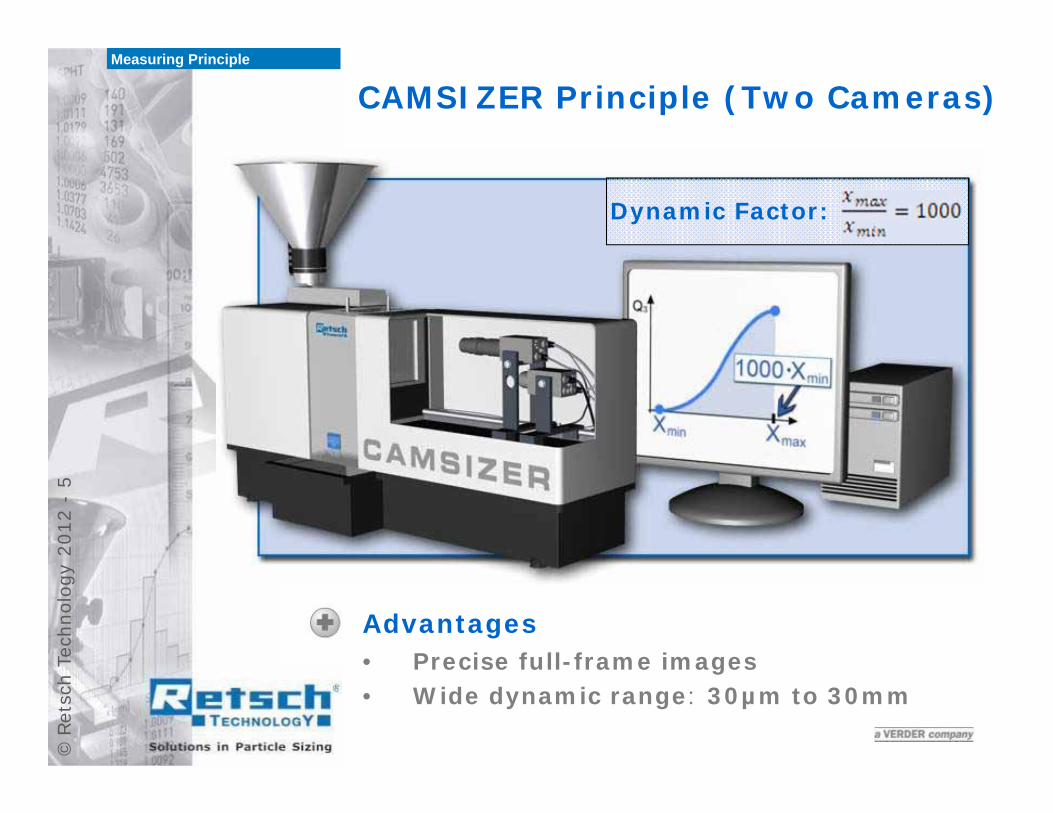
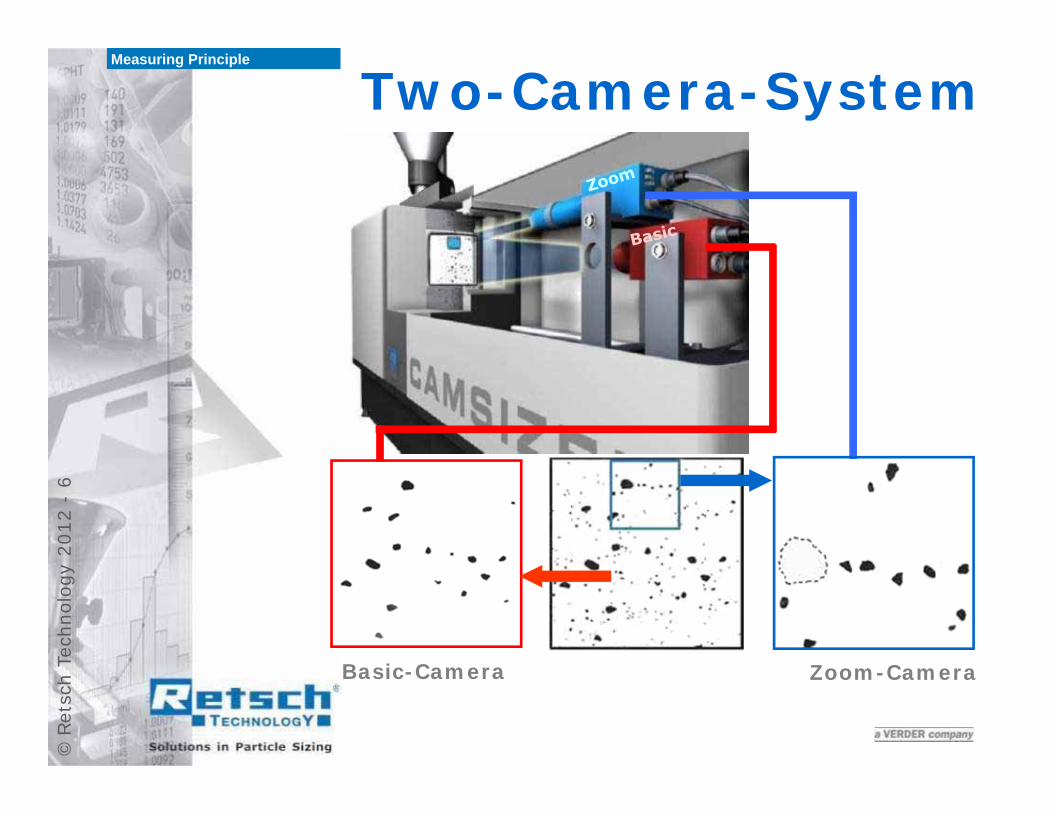
CAMSIZER Principle (Two Cameras)
Advantages• Precise full-frame images• Wide dynamic range: 30µm to 30mm
Dynamic Factor:
Measuring Principle
©Re
tsch
Tec
hnol
ogy
2012
-6
Two-Camera-System
Basic-Camera
Measuring Principle
Zoom-Camera
©Re
tsch
Tec
hnol
ogy
2012
-7

©Re
tsch
Tec
hnol
ogy
2012
-8
Workers at the drill hole of the rig
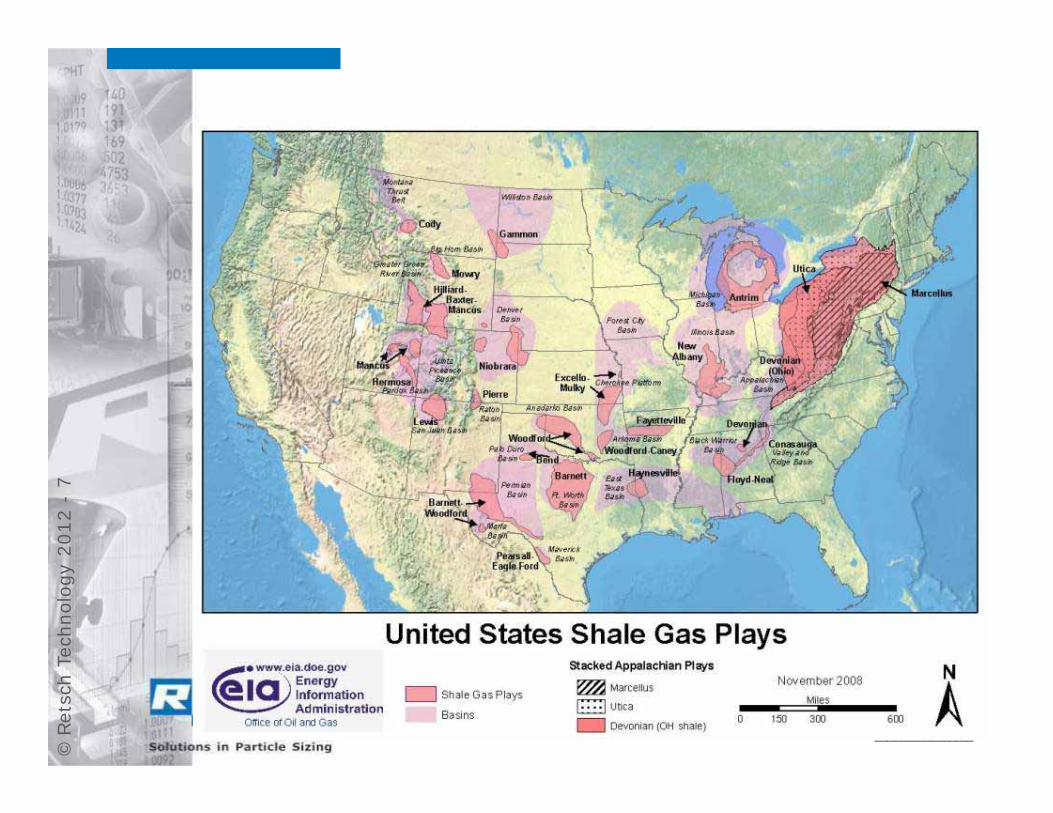
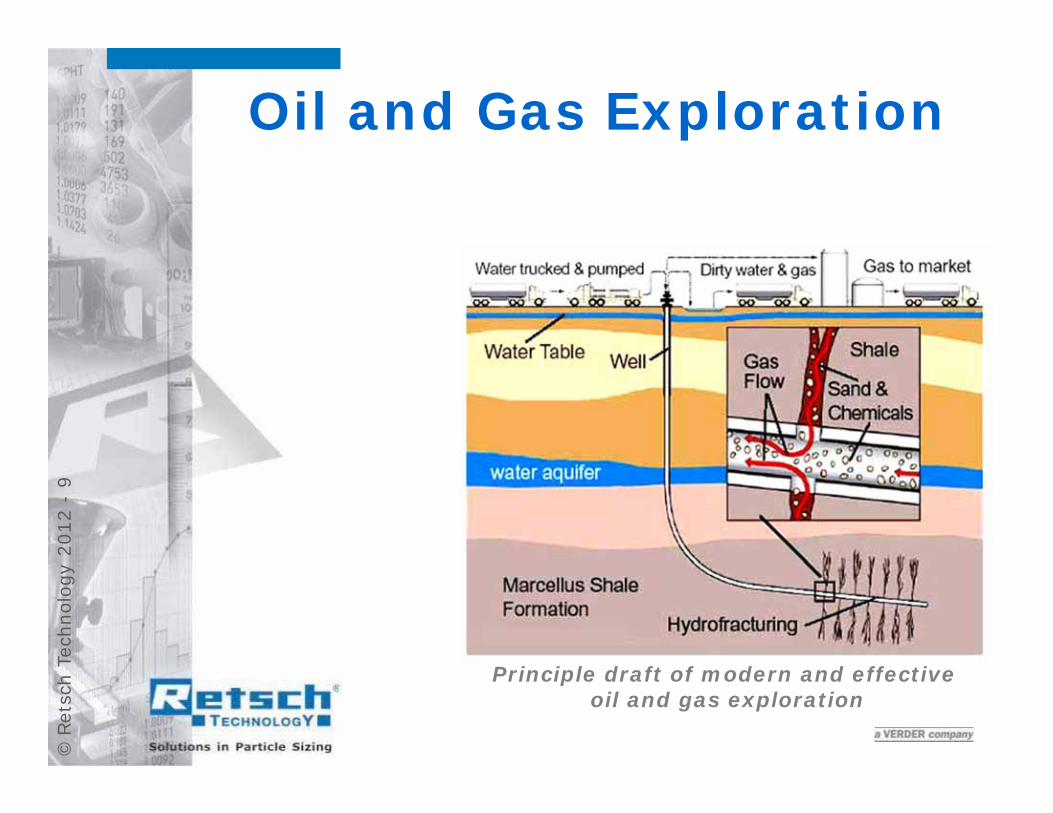
Oil and Gas Exploration
©Re
tsch
Tec
hnol
ogy
2012
-9
Oil and Gas Exploration
Principle draft of modern and effective oil and gas exploration
©Re
tsch
Tec
hnol
ogy
2012
-10
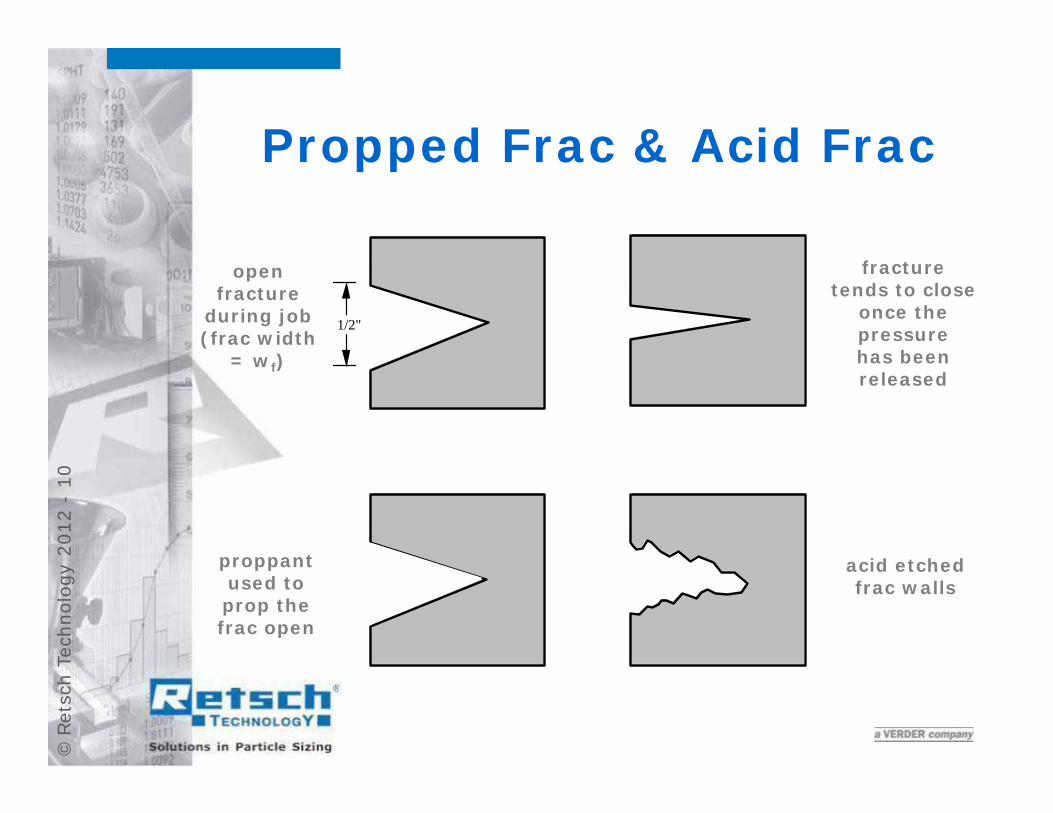
Propped Frac & Acid Frac
1/2"
open fracture
during job(frac width
= wf)
fracture tends to close
once the pressure has beenreleased
proppantused to prop thefrac open
acid etched frac walls
©Re
tsch
Tec
hnol
ogy
2012
-11
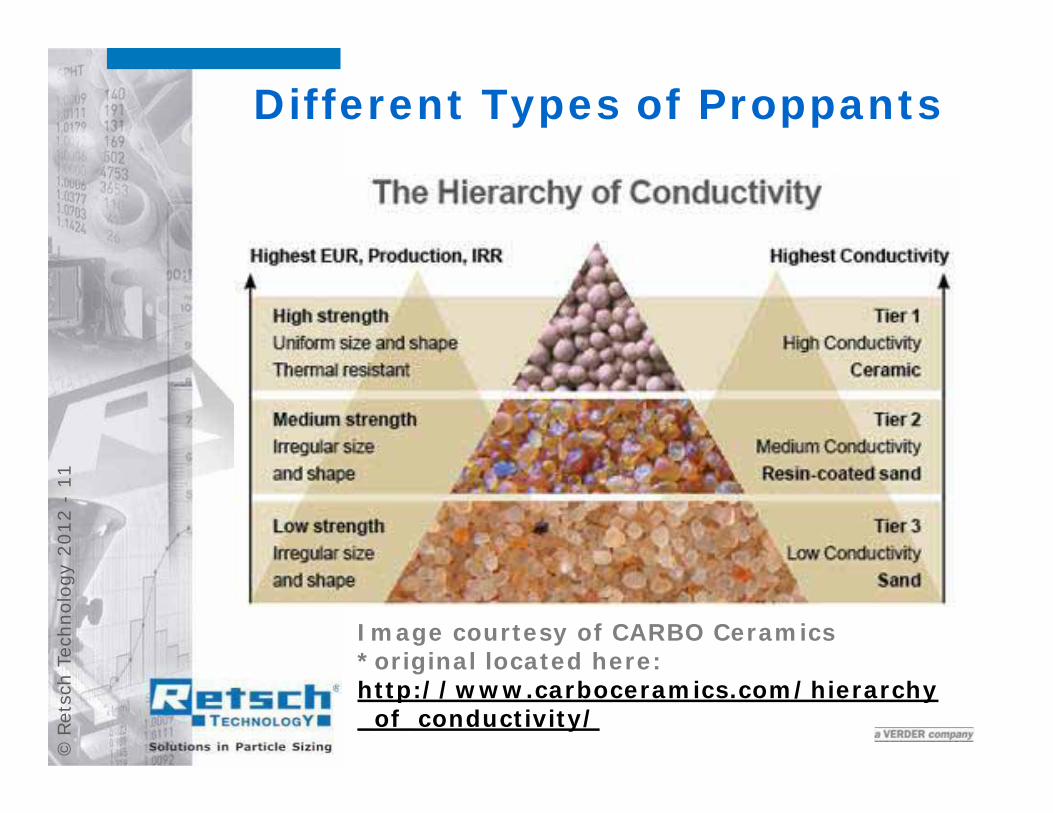
Different Types of Proppants
Image courtesy of CARBO Ceramics*original located here: http://www.carboceramics.com/hierarchy_of_conductivity/

©Re
tsch
Tec
hnol
ogy
2012
-12
Different Types of Proppants
Frac Sand (<6,000psi)• Jordan • Ottawa• Brady
Resin-Coated Frac Sand (<8,000psi)• Cureable• Precured
Intermediate Strength Ceramics (<10,000psi)
High Strength Ceramics (<15,000psi)
©Re
tsch
Tec
hnol
ogy
2012
-13

©Re
tsch
Tec
hnol
ogy
2012
-14
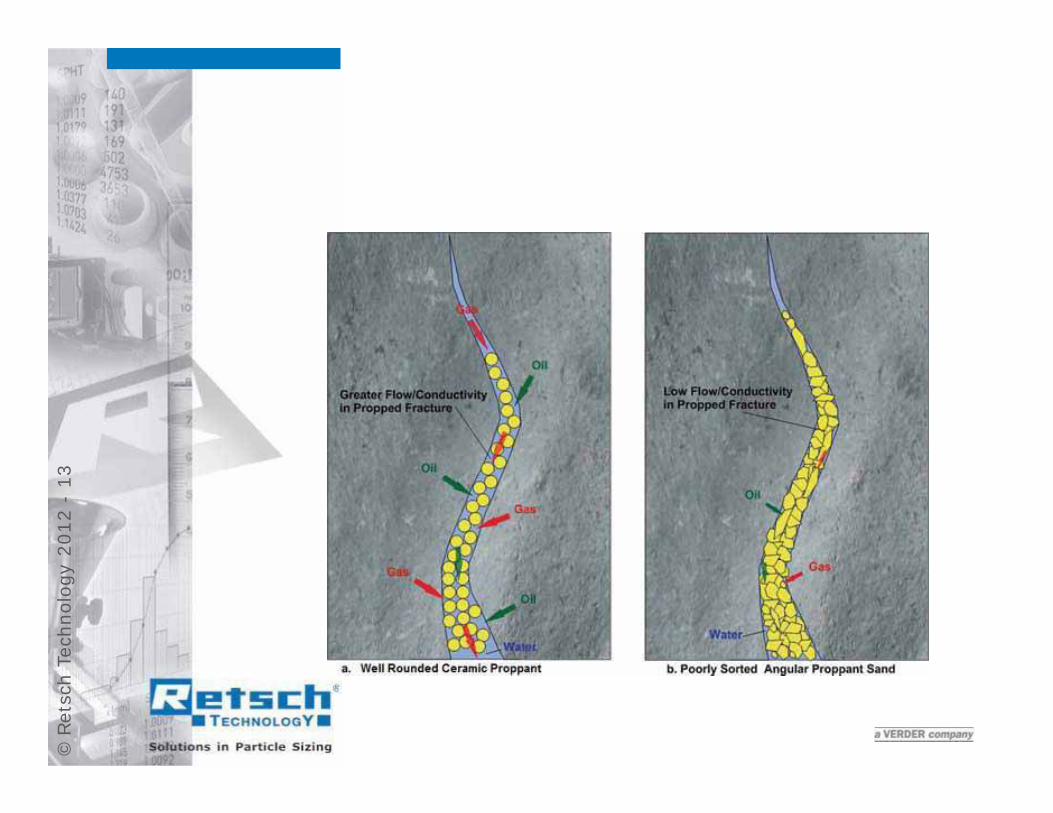
Different Principles to increasethe Oil and Gas Conductivity
Image courtesy of Schlumberger*original located here: http://www.slb.com/
©Re
tsch
Tec
hnol
ogy
2012
-15
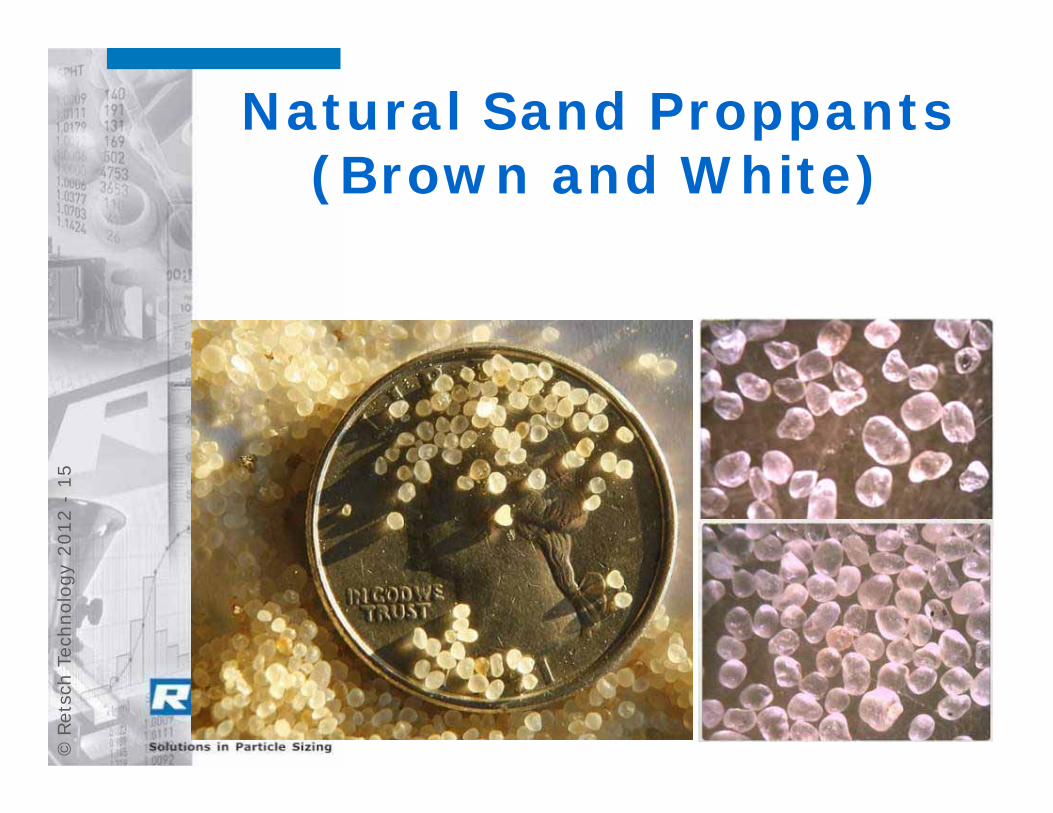
Natural Sand Proppants(Brown and White)
©Re
tsch
Tec
hnol
ogy
2012
-16
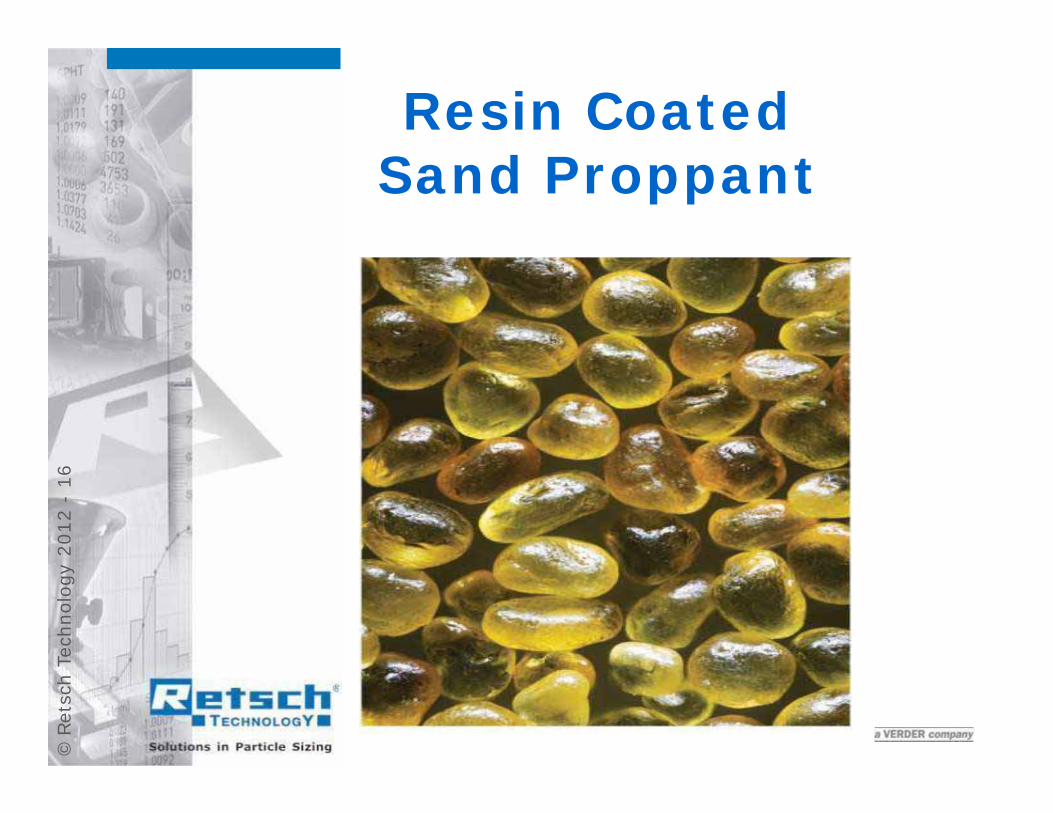
Resin CoatedSand Proppant
©Re
tsch
Tec
hnol
ogy
2012
-17
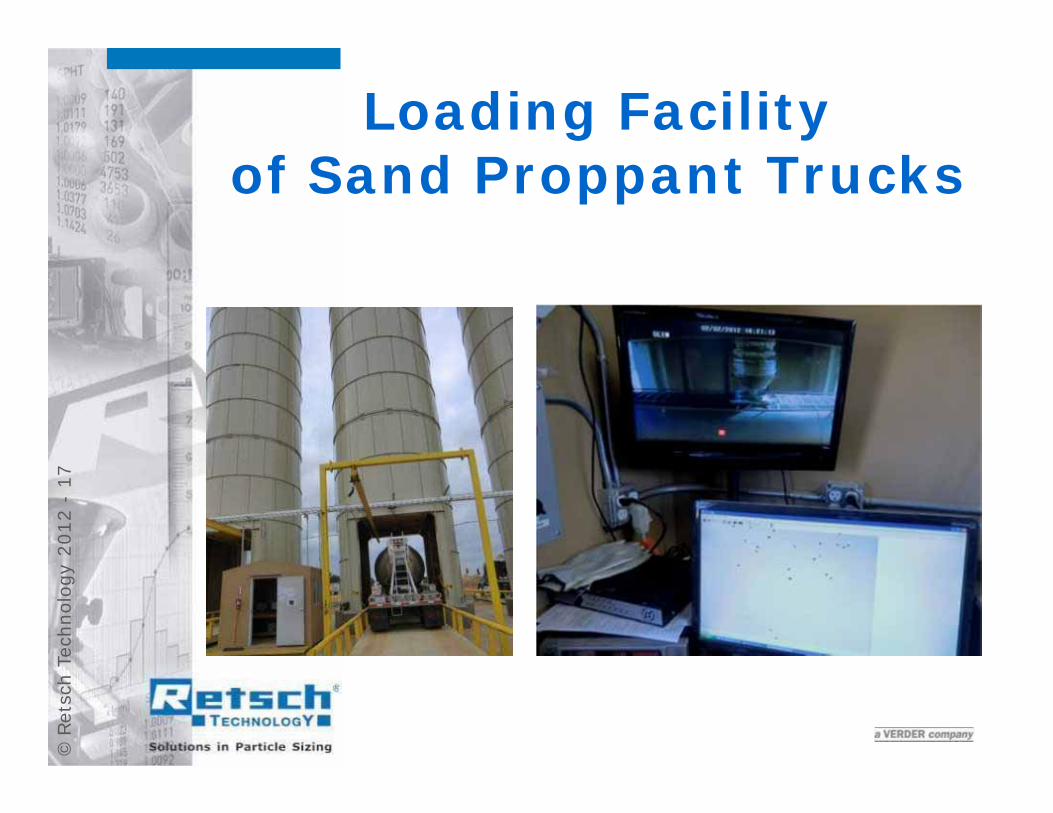
Loading Facilityof Sand Proppant Trucks

©Re
tsch
Tec
hnol
ogy
2012
-18
Unloadingof a Proppant Railcar
©Re
tsch
Tec
hnol
ogy
2012
-19
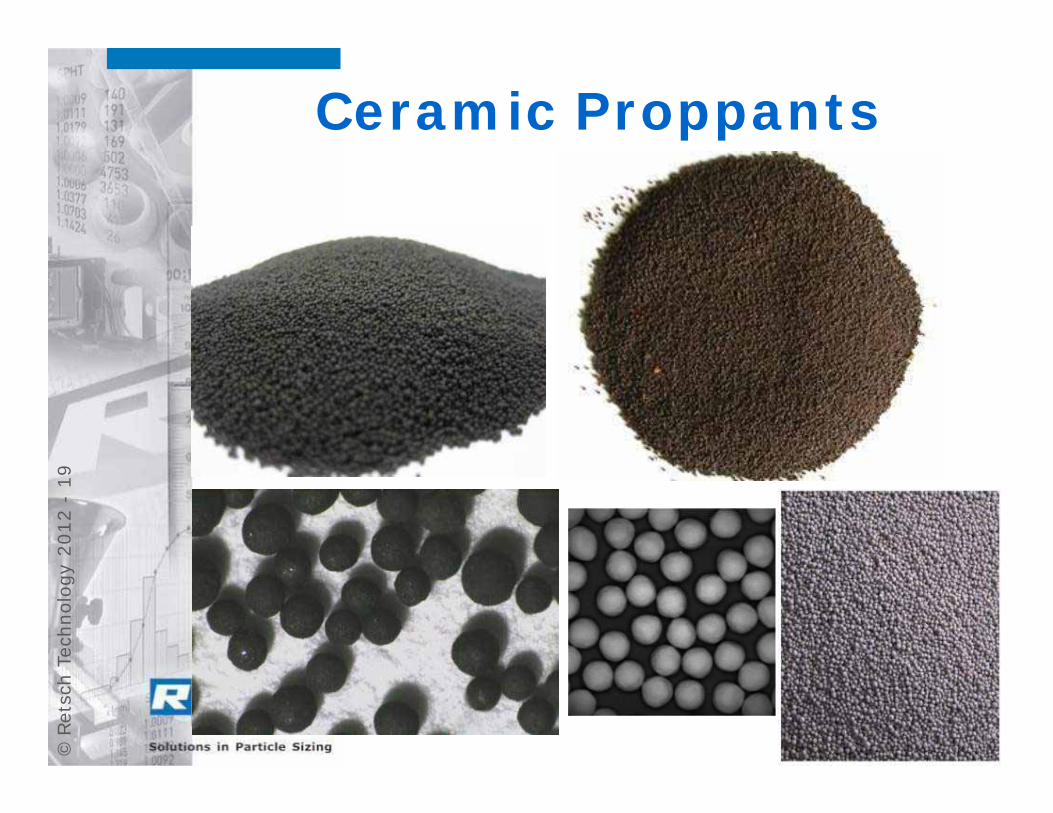
Ceramic Proppants

©Re
tsch
Tec
hnol
ogy
2012
-20
Ceramic Proppants
©Re
tsch
Tec
hnol
ogy
2012
-21
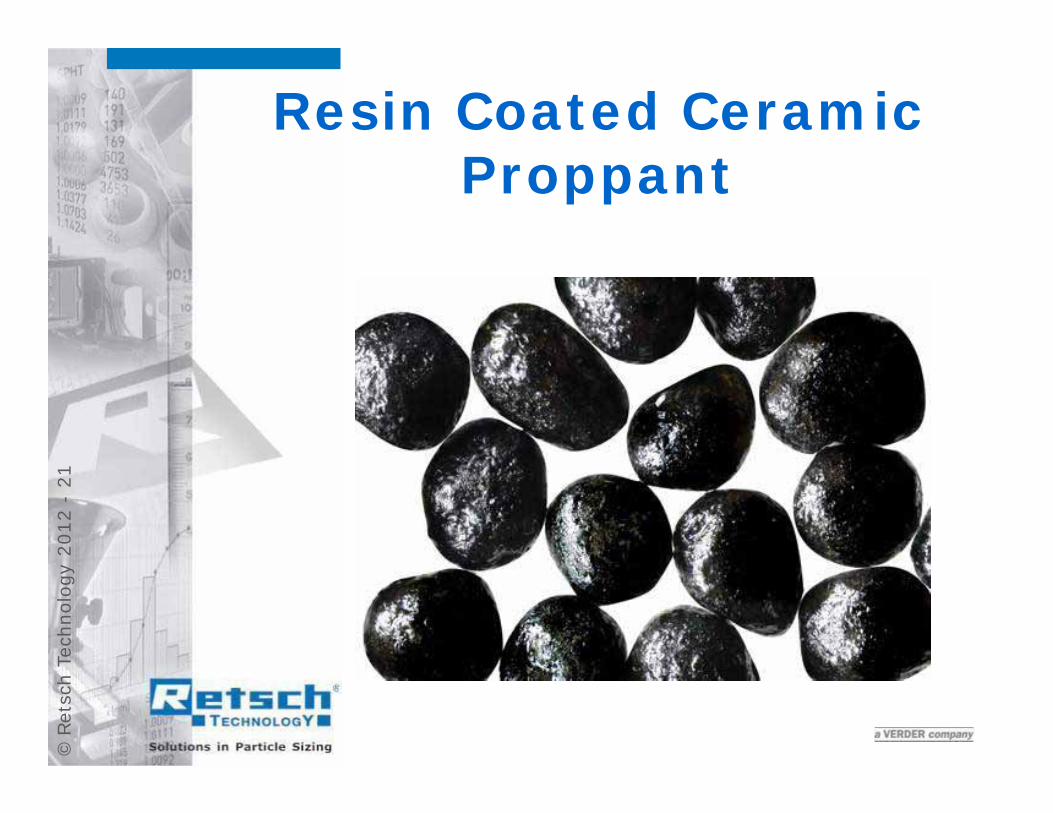
Resin Coated CeramicProppant
©Re
tsch
Tec
hnol
ogy
2012
-22
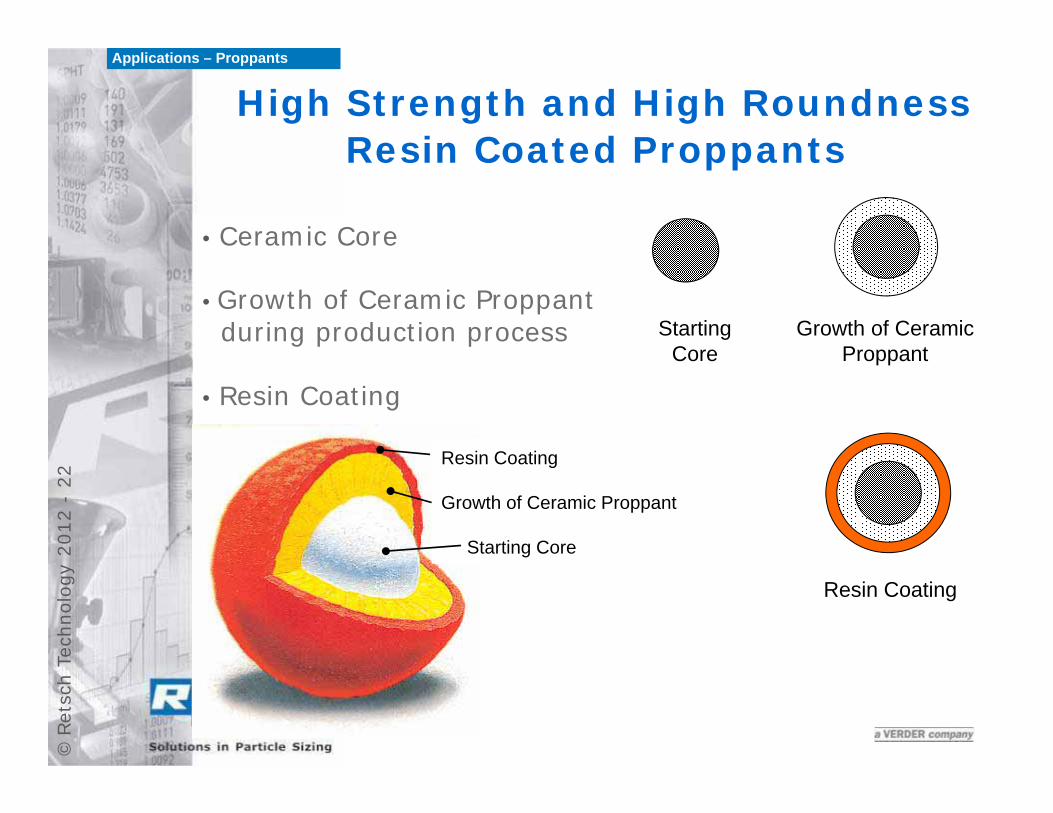
High Strength and High Roundness Resin Coated Proppants
• Ceramic Core
• Growth of Ceramic Proppantduring production process
• Resin Coating
Resin Coating
Growth of Ceramic Proppant
Starting Core
Applications – Proppants
Resin Coating
Growth of Ceramic Proppant
Starting Core
©Re
tsch
Tec
hnol
ogy
2012
-23
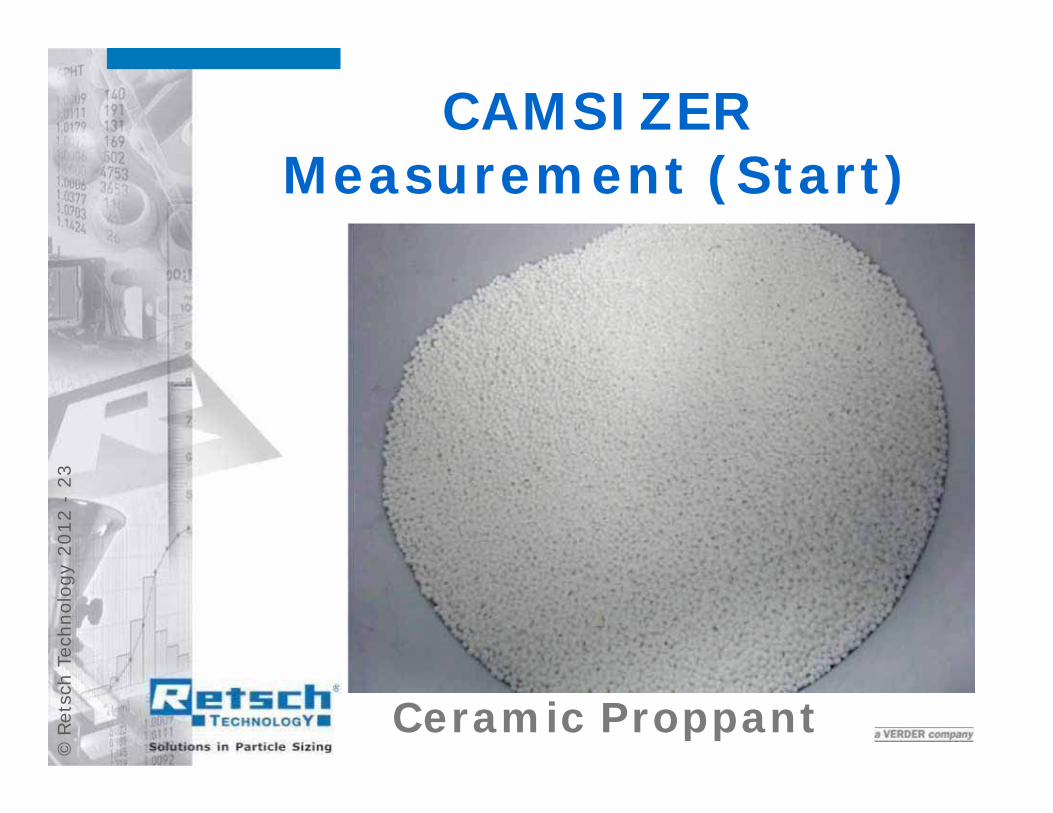
Ceramic Proppant
CAMSIZER Measurement (Start)
©Re
tsch
Tec
hnol
ogy
2012
-24
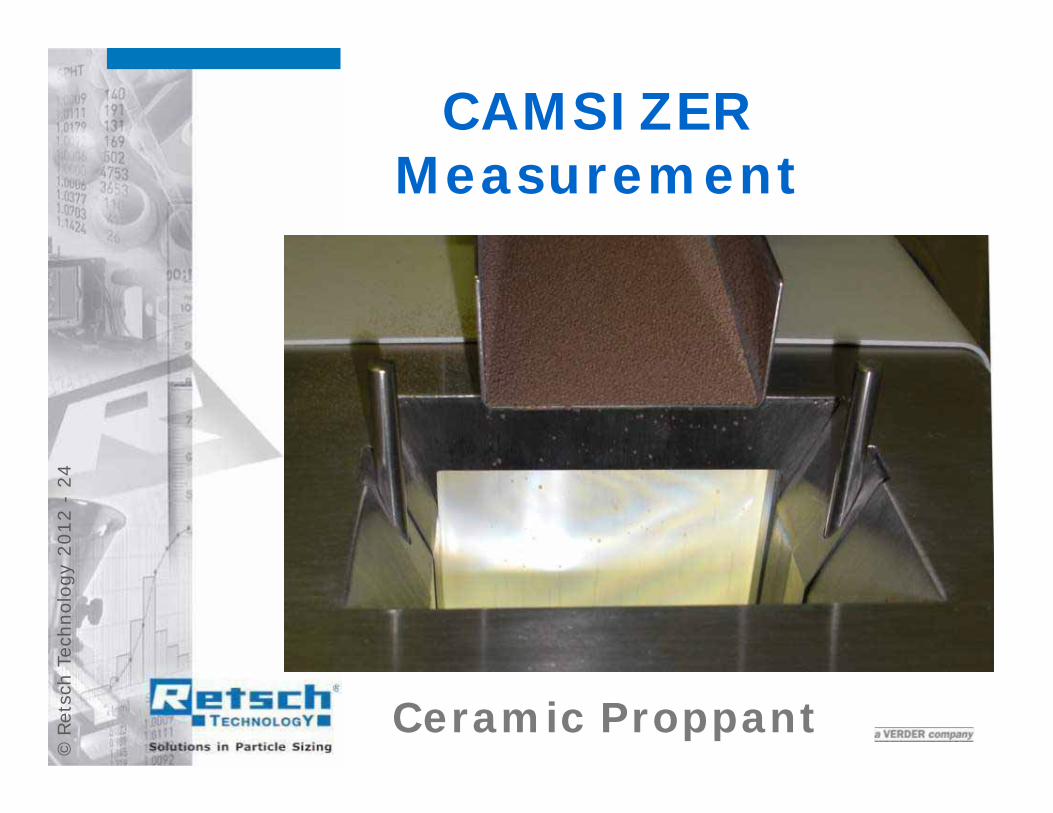
CAMSIZER Measurement
Ceramic Proppant
©Re
tsch
Tec
hnol
ogy
2012
-25
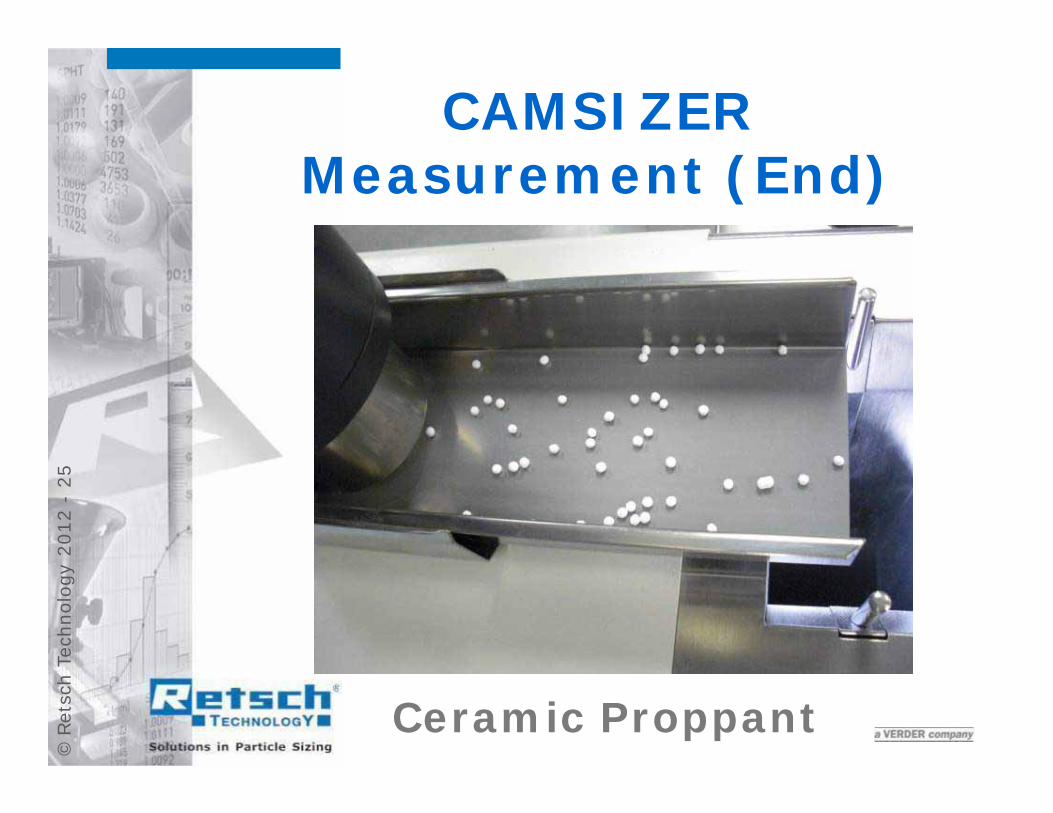
Ceramic Proppant
CAMSIZER Measurement (End)
©Re
tsch
Tec
hnol
ogy
2012
-26
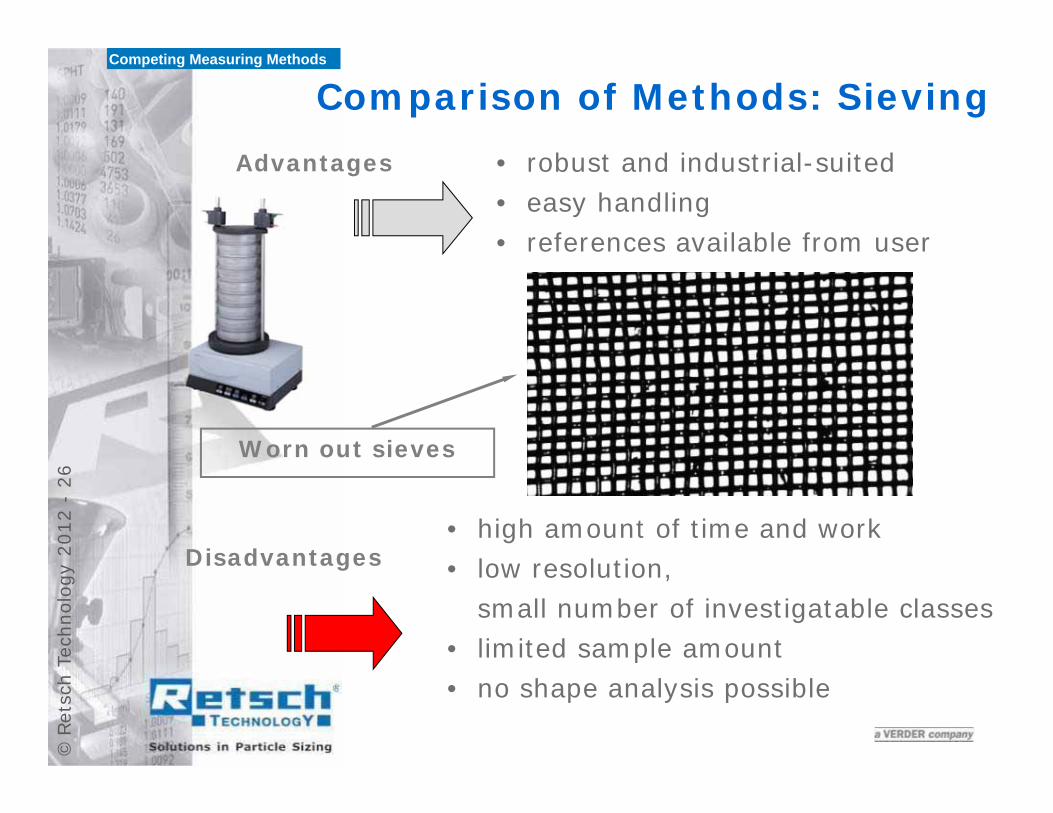
Comparison of Methods: Sieving• robust and industrial-suited• easy handling• references available from user
Advantages
Disadvantages• high amount of time and work• low resolution,
small number of investigatable classes• limited sample amount• no shape analysis possible
Competing Measuring Methods
Worn out sieves

©Re
tsch
Tec
hnol
ogy
2012
-27
Typical Grain Sizes of Proppants
©Re
tsch
Tec
hnol
ogy
2012
-28
F2
F1
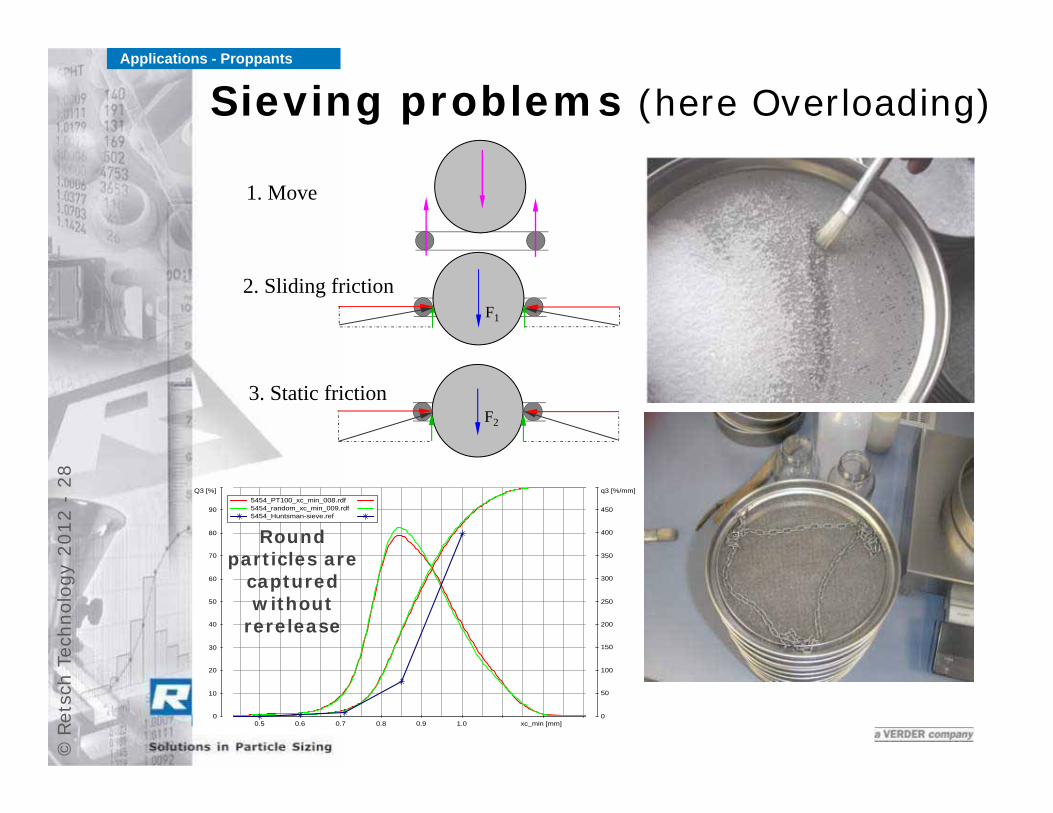
1. Move
2. Sliding friction
3. Static friction
xc_min [mm]0.5 0.6 0.7 0.8 0.9 1.00
10
20
30
40
50
60
70
80
90
Q3 [%]
0
50
100
150
200
250
300
350
400
450
q3 [%/mm]5454_PT100_xc_min_008.rdf5454_random_xc_min_009.rdf5454_Huntsman-sieve.ref
Roundparticles are
capturedwithout
rerelease
Applications - Proppants
Sieving problems (here Overloading)
©Re
tsch
Tec
hnol
ogy
2012
-29
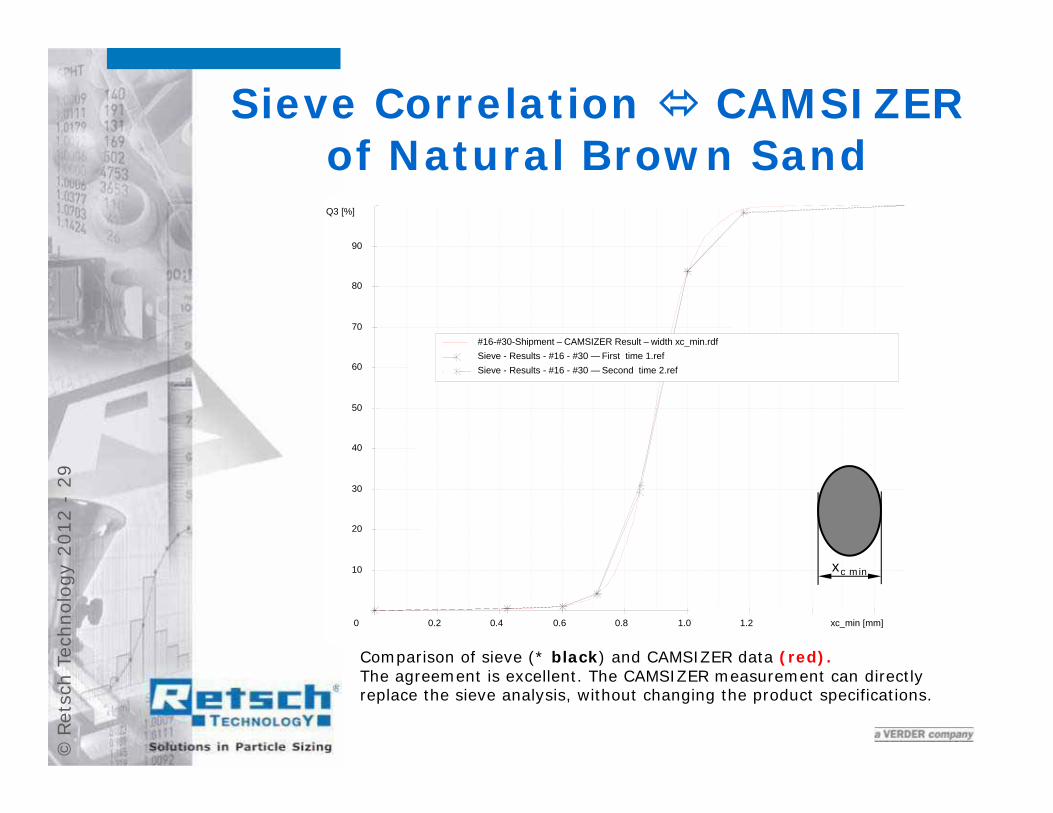
xc_min [mm]0.2 0.4 0.6 0.8 1.0 1.20
10
20
30
40
50
60
70
80
90
Q3 [%]
#16-#30-Shipment – CAMSIZER Result – width xc_min.rdfSieve - Results - #16 - #30 — First time 1.refSieve - Results - #16 - #30 — Second time 2.ref
Comparison of sieve (* black) and CAMSIZER data (red). The agreement is excellent. The CAMSIZER measurement can directly replace the sieve analysis, without changing the product specifications.
Sieve Correlation CAMSIZER of Natural Brown Sand
xc min
©Re
tsch
Tec
hnol
ogy
2012
-30
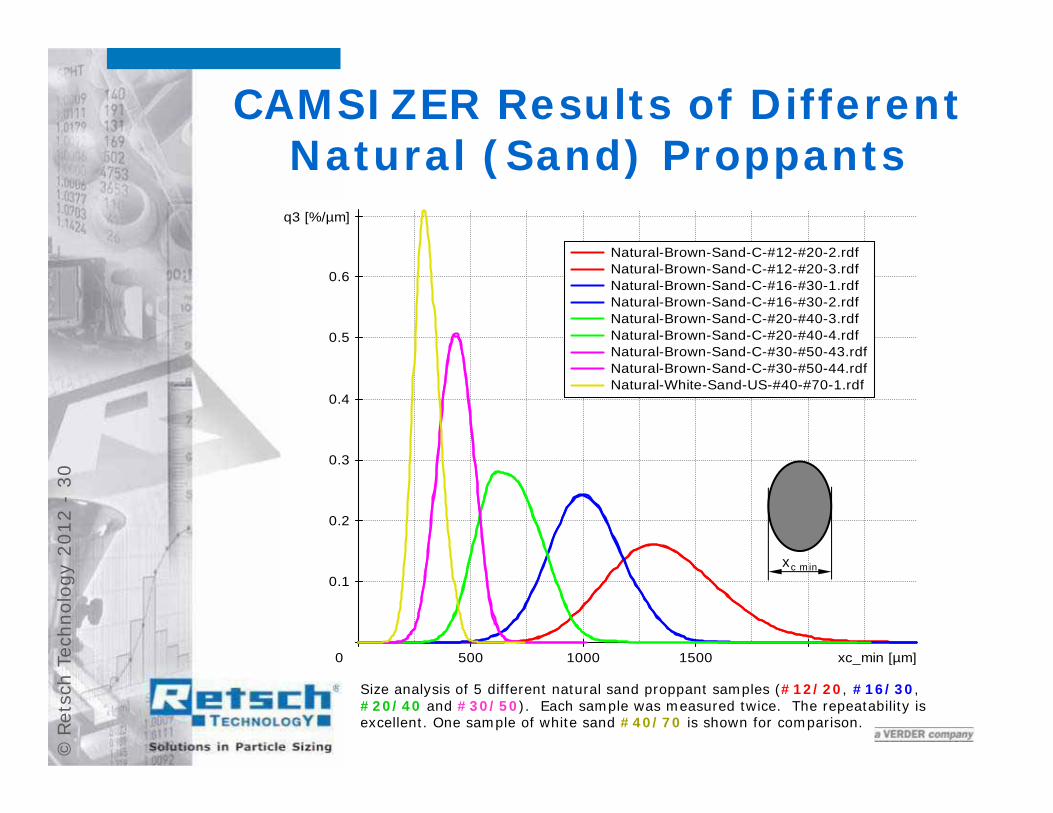
CAMSIZER Results of Different Natural (Sand) Proppants
xc_min [µm]500 1000 15000
0.1
0.2
0.3
0.4
0.5
0.6
q3 [%/µm]
Natural-Brown-Sand-C-#12-#20-2.rdfNatural-Brown-Sand-C-#12-#20-3.rdfNatural-Brown-Sand-C-#16-#30-1.rdfNatural-Brown-Sand-C-#16-#30-2.rdfNatural-Brown-Sand-C-#20-#40-3.rdfNatural-Brown-Sand-C-#20-#40-4.rdfNatural-Brown-Sand-C-#30-#50-43.rdfNatural-Brown-Sand-C-#30-#50-44.rdfNatural-White-Sand-US-#40-#70-1.rdf
xc min
Size analysis of 5 different natural sand proppant samples (#12/20, #16/30, #20/40 and #30/50). Each sample was measured twice. The repeatability is excellent. One sample of white sand #40/70 is shown for comparison.
©Re
tsch
Tec
hnol
ogy
2012
-31
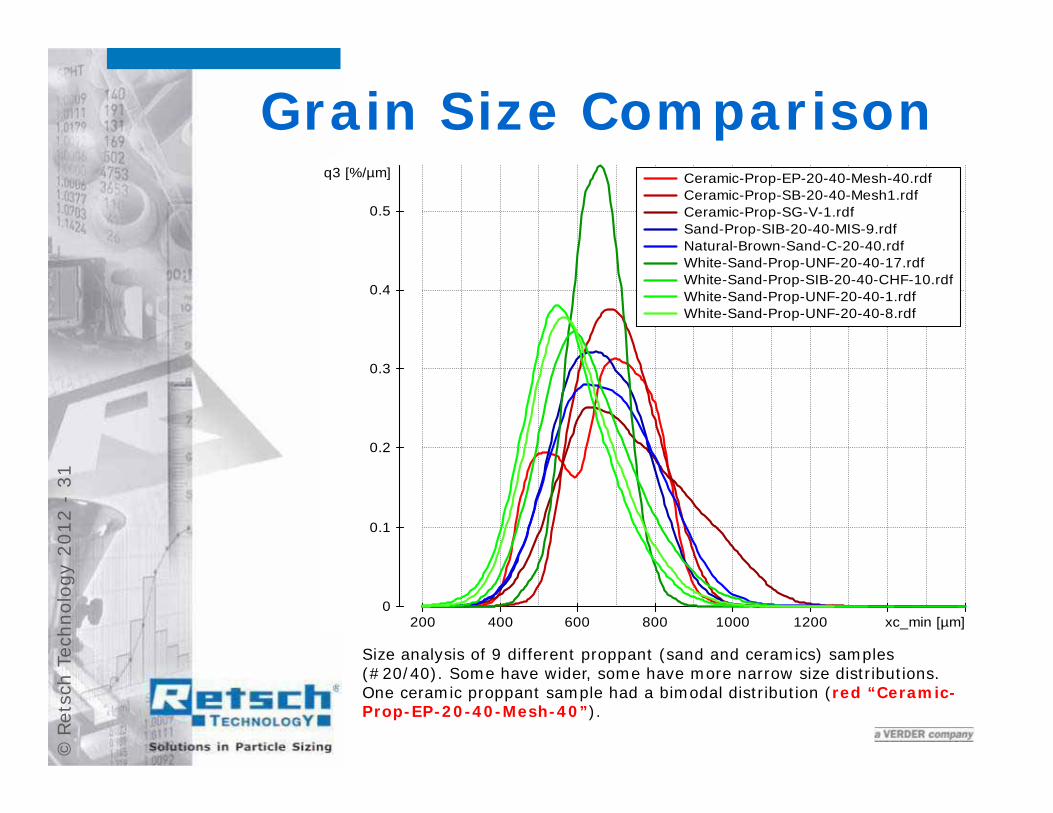
xc_min [µm]200 400 600 800 1000 12000
0.1
0.2
0.3
0.4
0.5
q3 [%/µm] Ceramic-Prop-EP-20-40-Mesh-40.rdfCeramic-Prop-SB-20-40-Mesh1.rdfCeramic-Prop-SG-V-1.rdfSand-Prop-SIB-20-40-MIS-9.rdfNatural-Brown-Sand-C-20-40.rdfWhite-Sand-Prop-UNF-20-40-17.rdfWhite-Sand-Prop-SIB-20-40-CHF-10.rdfWhite-Sand-Prop-UNF-20-40-1.rdfWhite-Sand-Prop-UNF-20-40-8.rdf
Size analysis of 9 different proppant (sand and ceramics) samples (#20/40). Some have wider, some have more narrow size distributions. One ceramic proppant sample had a bimodal distribution (red “Ceramic-Prop-EP-20-40-Mesh-40”).
Grain Size Comparison
©Re
tsch
Tec
hnol
ogy
2012
-32
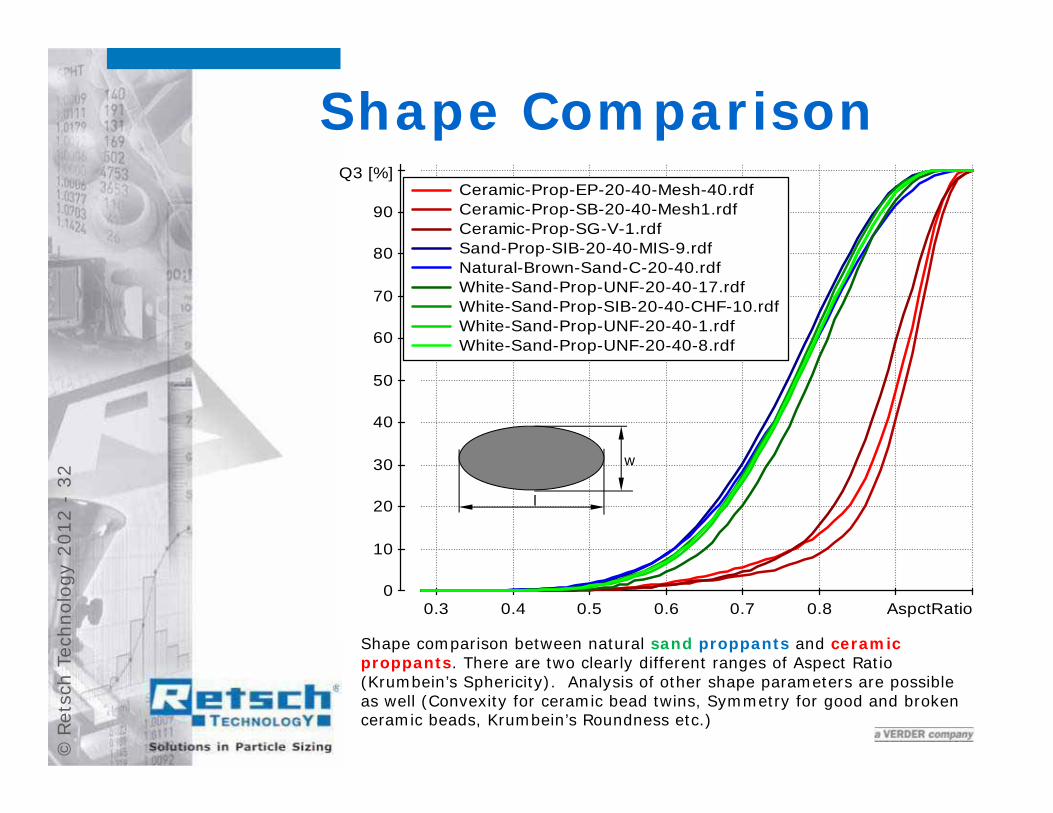
Shape Comparison
AspctRatio0.3 0.4 0.5 0.6 0.7 0.80
10
20
30
40
50
60
70
80
90
Q3 [%]Ceramic-Prop-EP-20-40-Mesh-40.rdfCeramic-Prop-SB-20-40-Mesh1.rdfCeramic-Prop-SG-V-1.rdfSand-Prop-SIB-20-40-MIS-9.rdfNatural-Brown-Sand-C-20-40.rdfWhite-Sand-Prop-UNF-20-40-17.rdfWhite-Sand-Prop-SIB-20-40-CHF-10.rdfWhite-Sand-Prop-UNF-20-40-1.rdfWhite-Sand-Prop-UNF-20-40-8.rdf
l
w
Shape comparison between natural sand proppants and ceramic proppants. There are two clearly different ranges of Aspect Ratio (Krumbein’s Sphericity). Analysis of other shape parameters are possible as well (Convexity for ceramic bead twins, Symmetry for good and broken ceramic beads, Krumbein’s Roundness etc.)
©Re
tsch
Tec
hnol
ogy
2012
-33
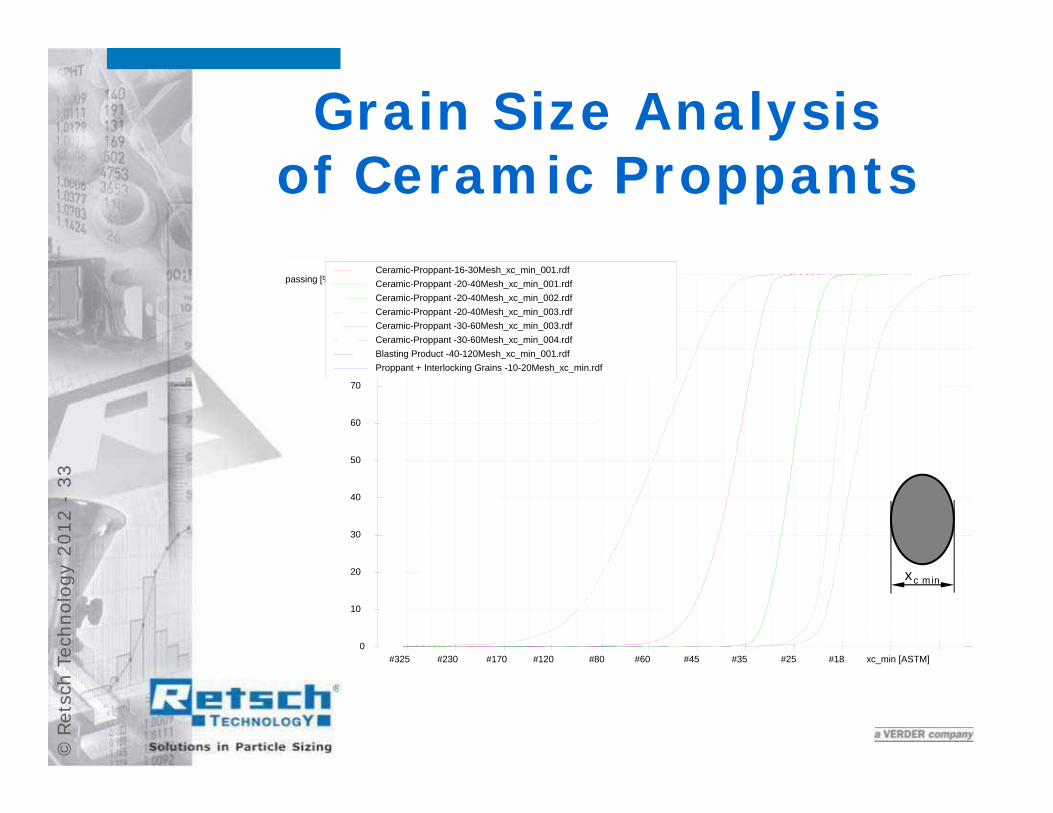
xc_min [ASTM]#325 #230 #170 #120 #80 #60 #45 #35 #25 #180
10
20
30
40
50
60
70
80
90
passing [%]Ceramic-Proppant-16-30Mesh_xc_min_001.rdfCeramic-Proppant -20-40Mesh_xc_min_001.rdfCeramic-Proppant -20-40Mesh_xc_min_002.rdfCeramic-Proppant -20-40Mesh_xc_min_003.rdfCeramic-Proppant -30-60Mesh_xc_min_003.rdfCeramic-Proppant -30-60Mesh_xc_min_004.rdfBlasting Product -40-120Mesh_xc_min_001.rdfProppant + Interlocking Grains -10-20Mesh_xc_min.rdf
xc min
Grain Size Analysis of Ceramic Proppants
©Re
tsch
Tec
hnol
ogy
2012
-34
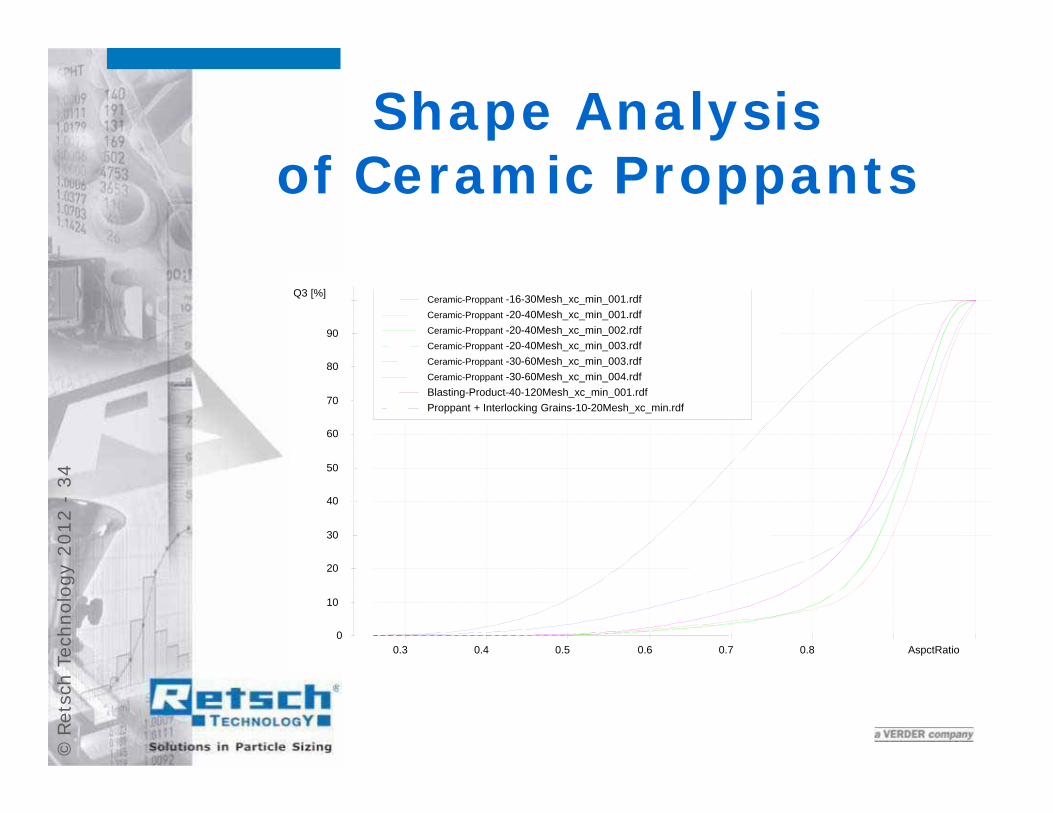
Shape Analysis of Ceramic Proppants
AspctRatio0.3 0.4 0.5 0.6 0.7 0.80
10
20
30
40
50
60
70
80
90
Q3 [%] Ceramic-Proppant -16-30Mesh_xc_min_001.rdfCeramic-Proppant -20-40Mesh_xc_min_001.rdfCeramic-Proppant -20-40Mesh_xc_min_002.rdfCeramic-Proppant -20-40Mesh_xc_min_003.rdfCeramic-Proppant -30-60Mesh_xc_min_003.rdfCeramic-Proppant -30-60Mesh_xc_min_004.rdfBlasting-Product-40-120Mesh_xc_min_001.rdfProppant + Interlocking Grains-10-20Mesh_xc_min.rdf

©Re
tsch
Tec
hnol
ogy
2012
-35
Hydraulic Fracturing
Principle draft of modern and effective oil and gas exploration
©Re
tsch
Tec
hnol
ogy
2012
-36
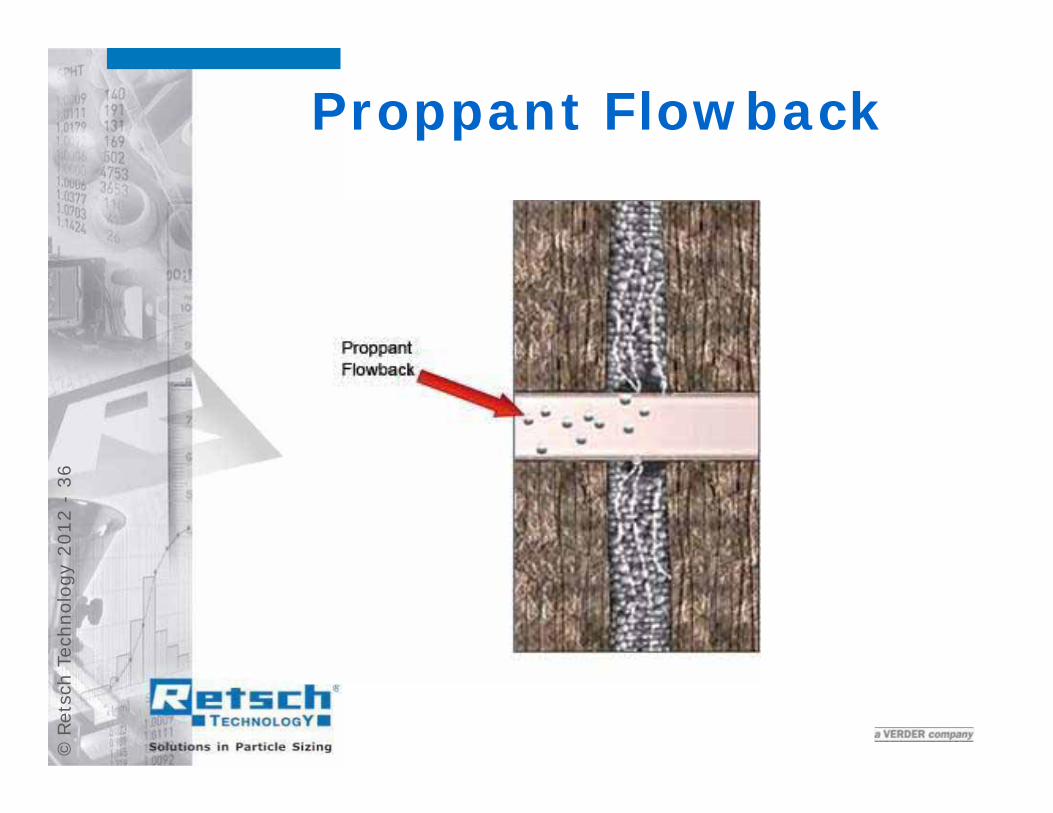
Proppant Flowback
©Re
tsch
Tec
hnol
ogy
2012
-37
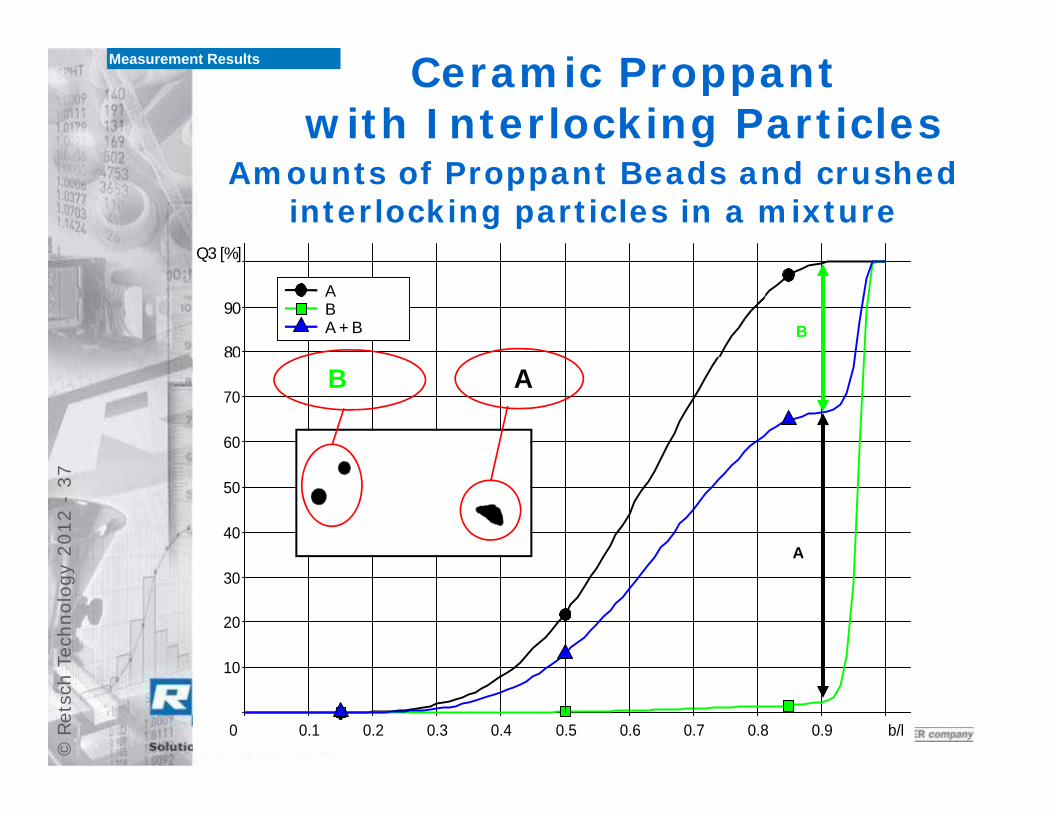
Measurement Results
b/l0.1 0.2 0.3 0.4 0.5 0.6 0.7 0.8 0.90
10
20
30
40
50
60
70
80
90
Q3 [%]AK_22,15g_0,3%_BZ_LB_n Ü_xc_min_001.rdfIA_22,15g_0,3%_BZ_LB_n Ü_mit Aerosil_xc_min_001.rdfIA + AK_je 22,15g_0,3%_BZ_LB_n Ü_als Mischung_xc_min_001.rdf
B
A
80
90
Q3 [%]
A B A + B
B A
Amounts of Proppant Beads and crushed interlocking particles in a mixture
Ceramic Proppantwith Interlocking Particles
©Re
tsch
Tec
hnol
ogy
2012
-38
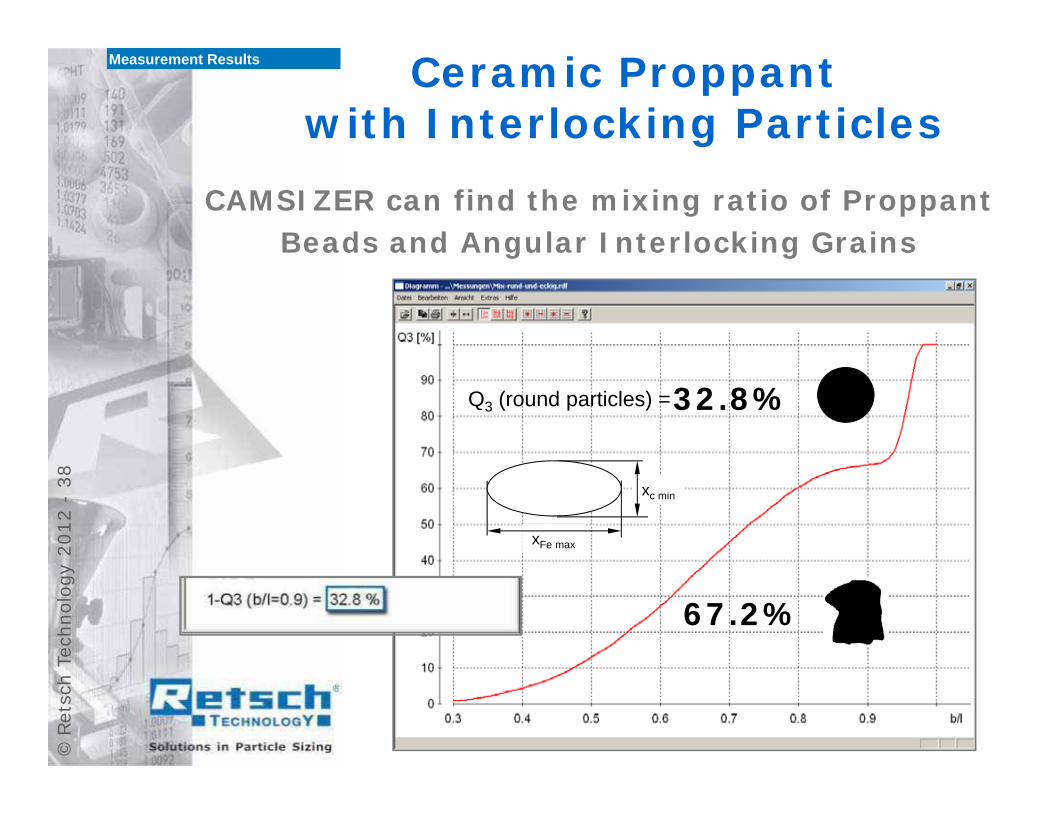
32.8%
67.2%
xFe max
xc min
Measurement Results
Q3 (round particles) =
CAMSIZER can find the mixing ratio of ProppantBeads and Angular Interlocking Grains
Ceramic Proppantwith Interlocking Particles
©Re
tsch
Tec
hnol
ogy
2012
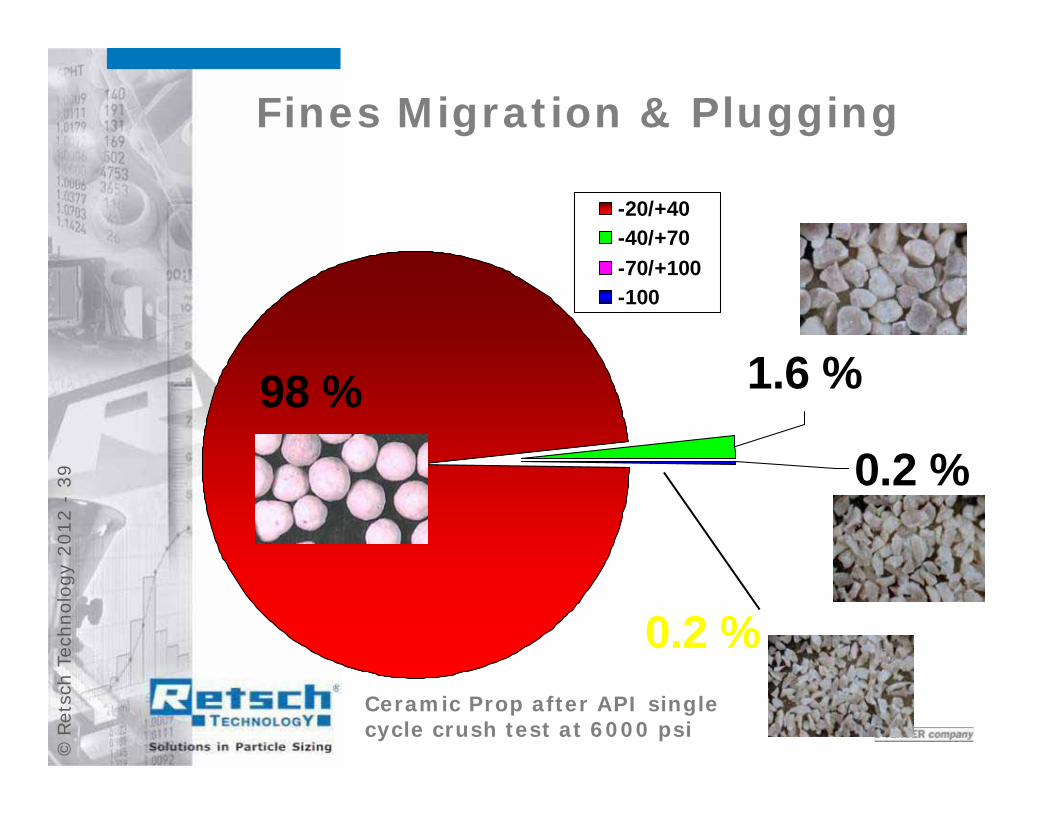
-39 0.2 %
0.2 %
1.6 %98 %
-20/+40-40/+70-70/+100-100
Ceramic Prop after API single cycle crush test at 6000 psi
Fines Migration & Plugging
©Re
tsch
Tec
hnol
ogy
2012
-40
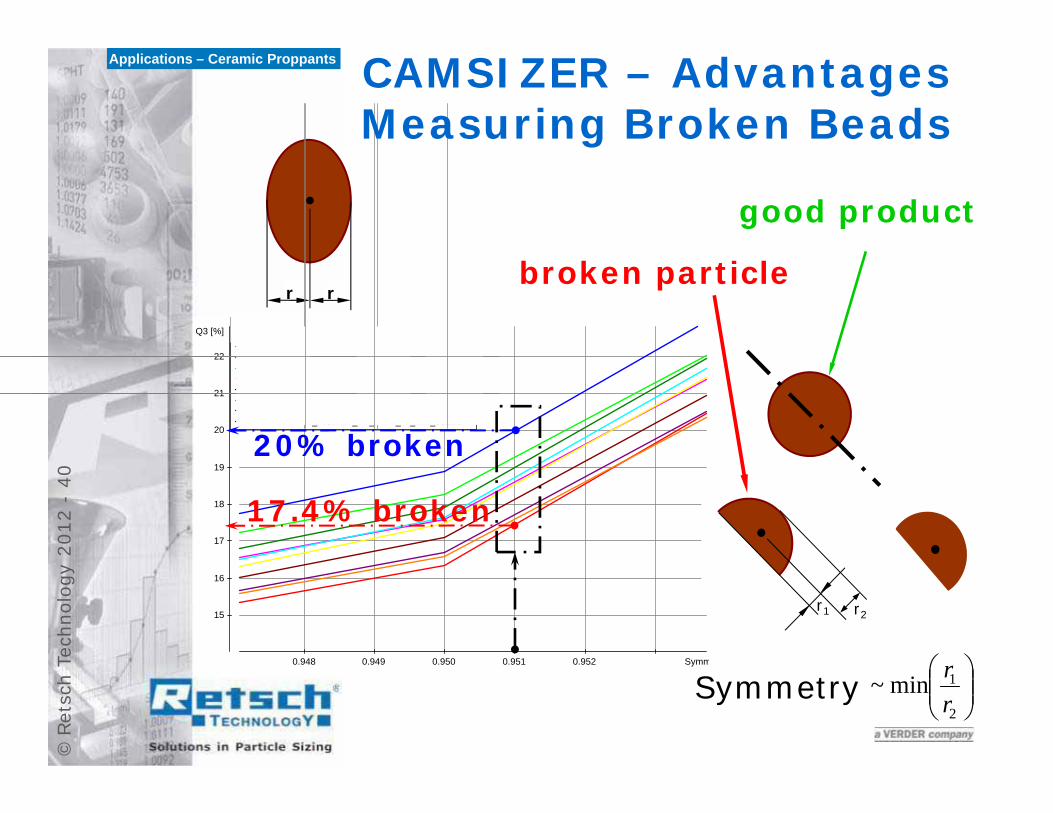
r rbroken particle
good product
Symm0.948 0.949 0.950 0.951 0.952
15
16
17
18
19
20
21
22
Q3 [%]TP-WS 0525_Probe1_BZ_0.5%_xc_min_001.rdfTP-WS 0525_Probe2_BZ_0.5%_xc_min_001.rdfTP-WS 0525_Probe3_BZ_0.5%_xc_min_001.rdfTP-WS 0525_Probe4_BZ_0.5%_xc_min_001.rdfTP-WS 0525_Probe5_BZ_0.5%_xc_min_001.rdfTP-WS 0525_Probe6_BZ_0.5%_xc_min_001.rdfTP-WS 0525_Probe7_BZ_0.5%_xc_min_001.rdfTP-WS 0525_Probe8_BZ_0.5%_xc_min_001.rdfTP-WS 0525_Probe9_BZ_0.5%_xc_min_001.rdfTP-WS 0525_Probe10_BZ_0.5%_xc_min_001.rdf
2
1min~rr
17.4% broken
20% broken
Symmetry
r1 r2
CAMSIZER – Advantages Measuring Broken Beads
Applications – Ceramic Proppants
©Re
tsch
Tec
hnol
ogy
2012
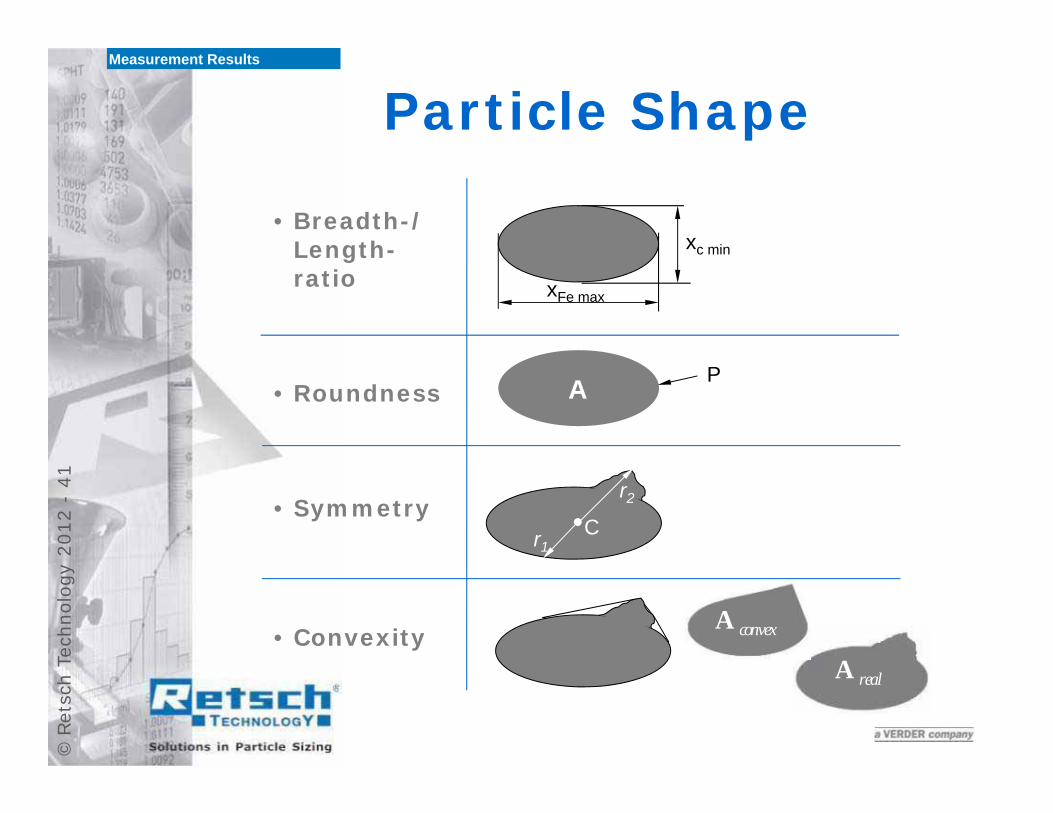
-41
• Breadth-/Length-ratio
• Roundness
• Symmetry
• Convexity
xFe max
xc min
A
r1
r2
C
A convex
A real
Particle ShapeMeasurement Results
P
©Re
tsch
Tec
hnol
ogy
2012
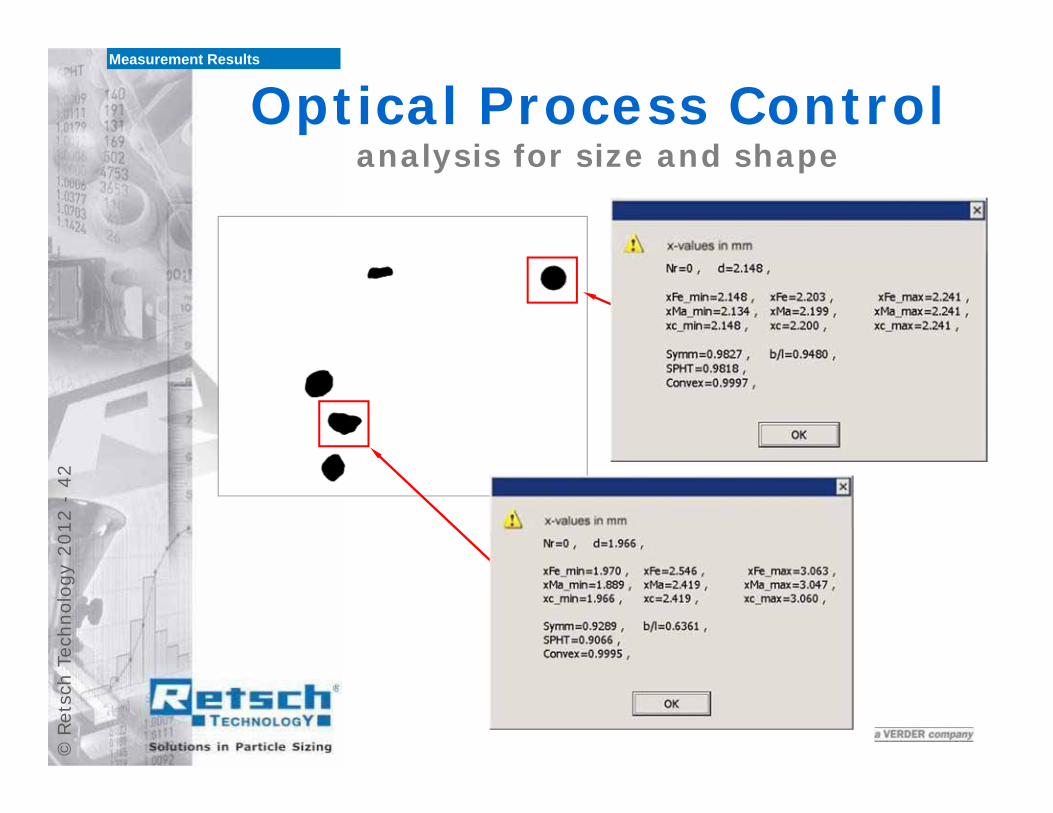
-42
Optical Process Controlanalysis for size and shape
Measurement Results
©Re
tsch
Tec
hnol
ogy
2012
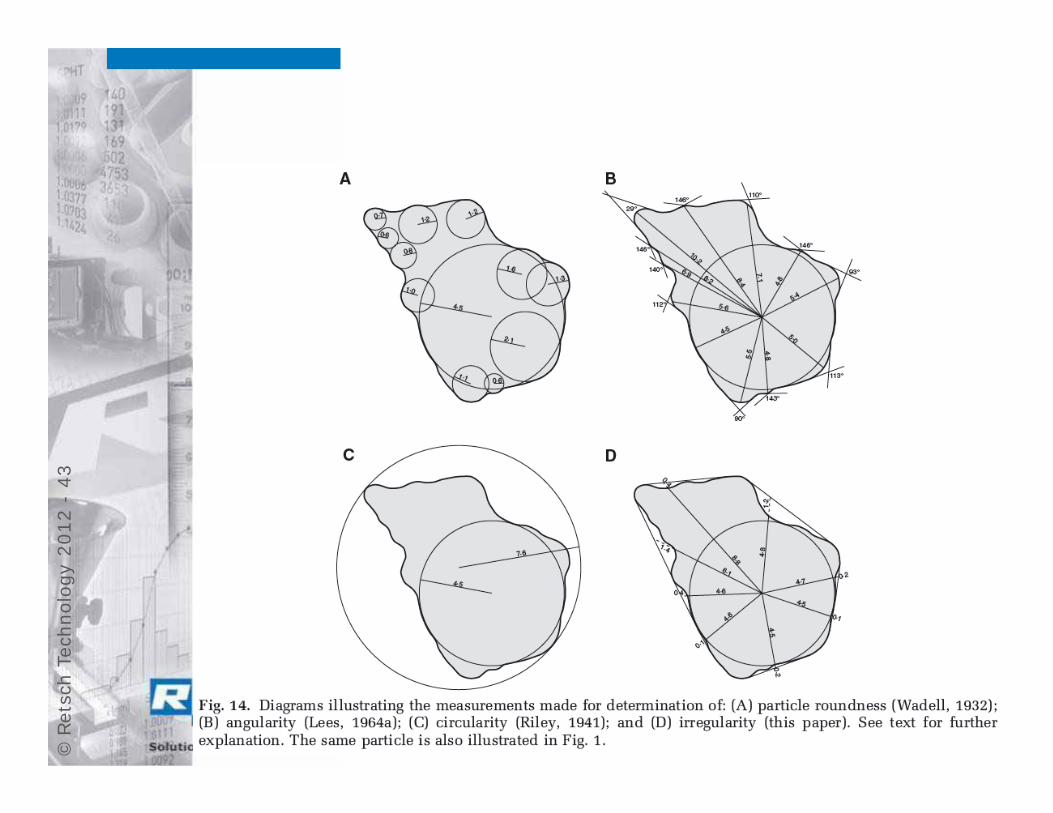
-43
©Re
tsch
Tec
hnol
ogy
2012
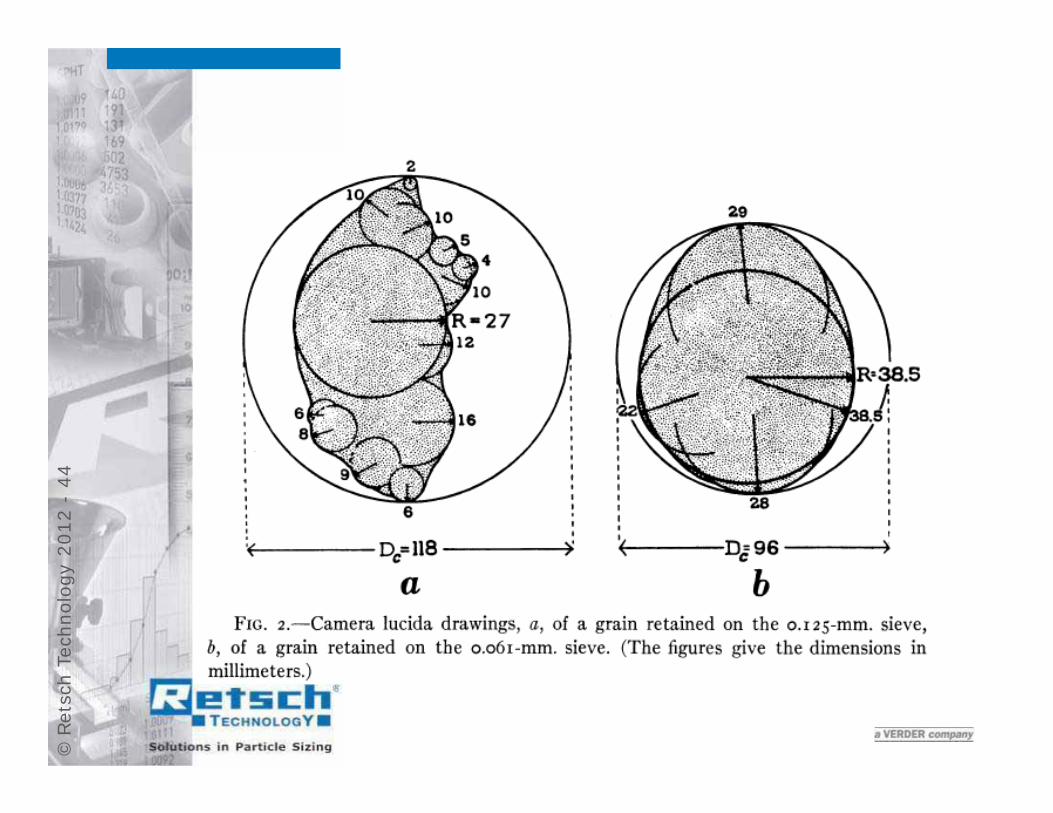
-44
©Re
tsch
Tec
hnol
ogy
2012
-45
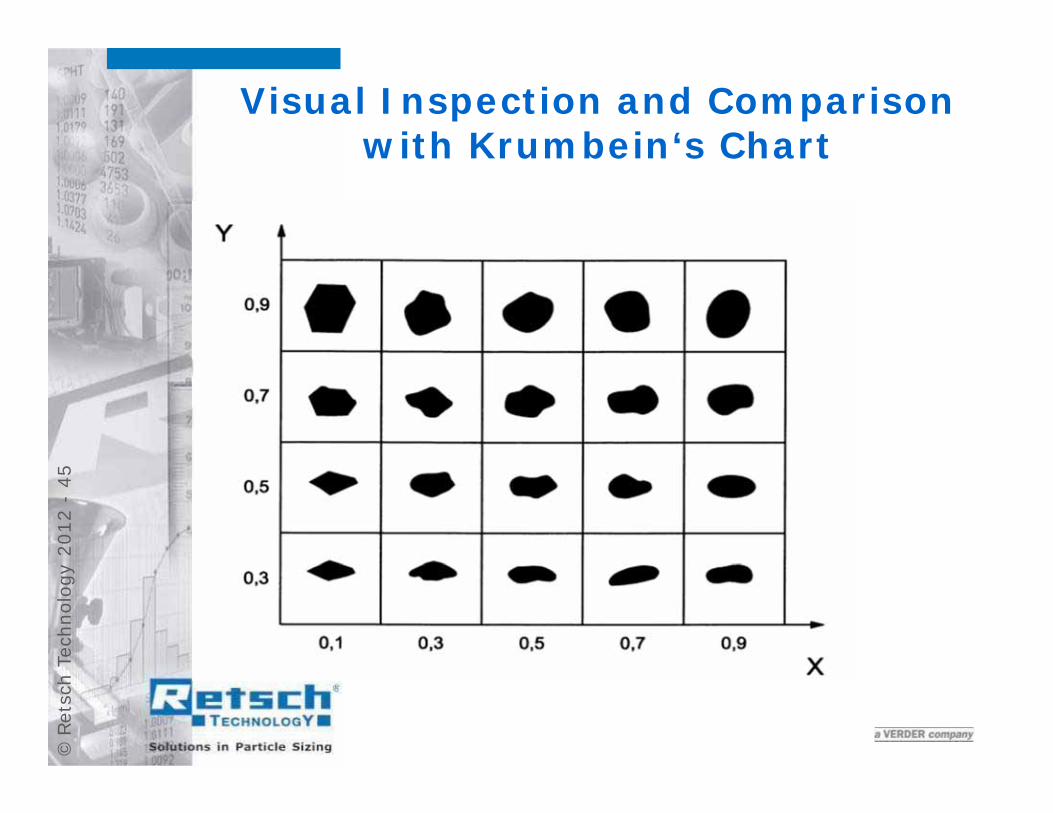
Visual Inspection and Comparisonwith Krumbein‘s Chart
©Re
tsch
Tec
hnol
ogy
2012
-46
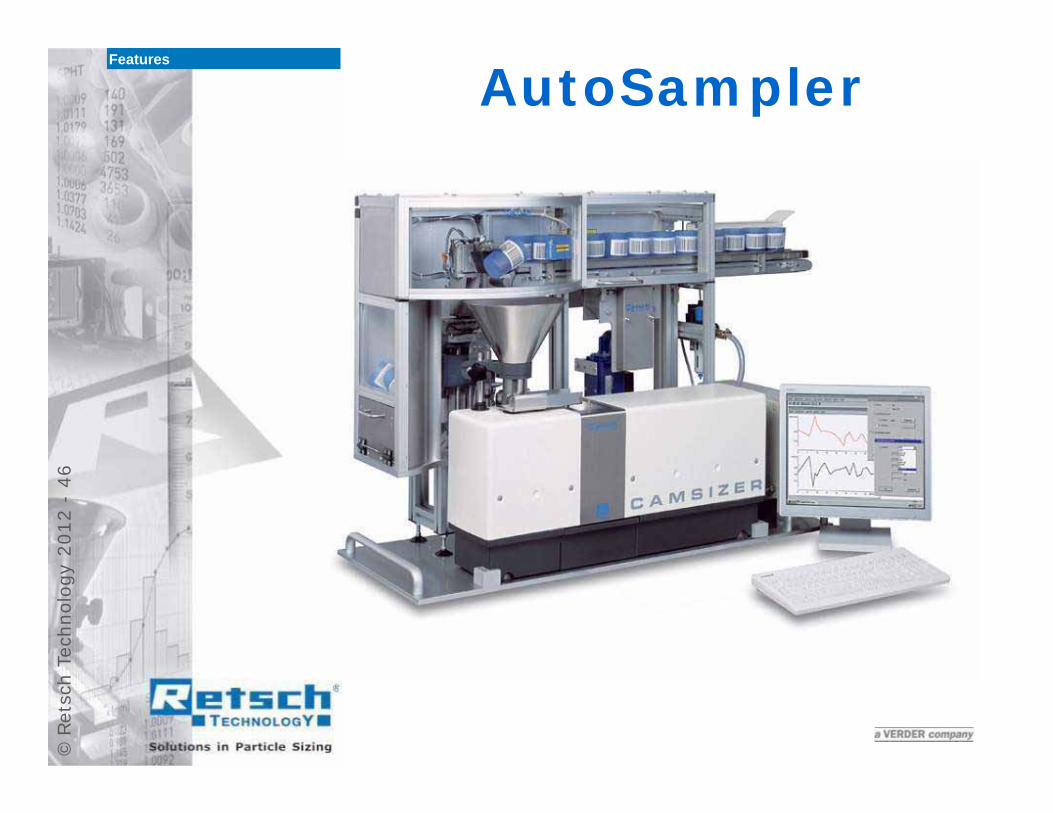
AutoSamplerFeatures
©Re
tsch
Tec
hnol
ogy
2012
-47
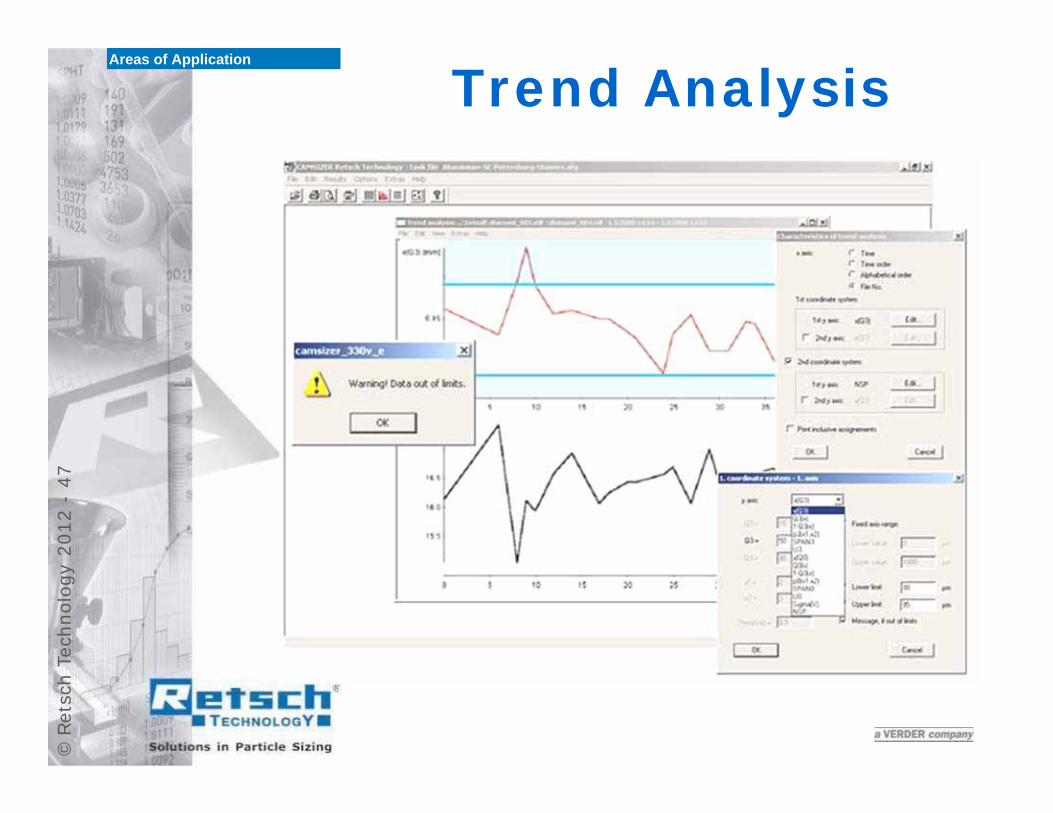
Trend AnalysisAreas of Application
©Re
tsch
Tec
hnol
ogy
2012
-48
Features
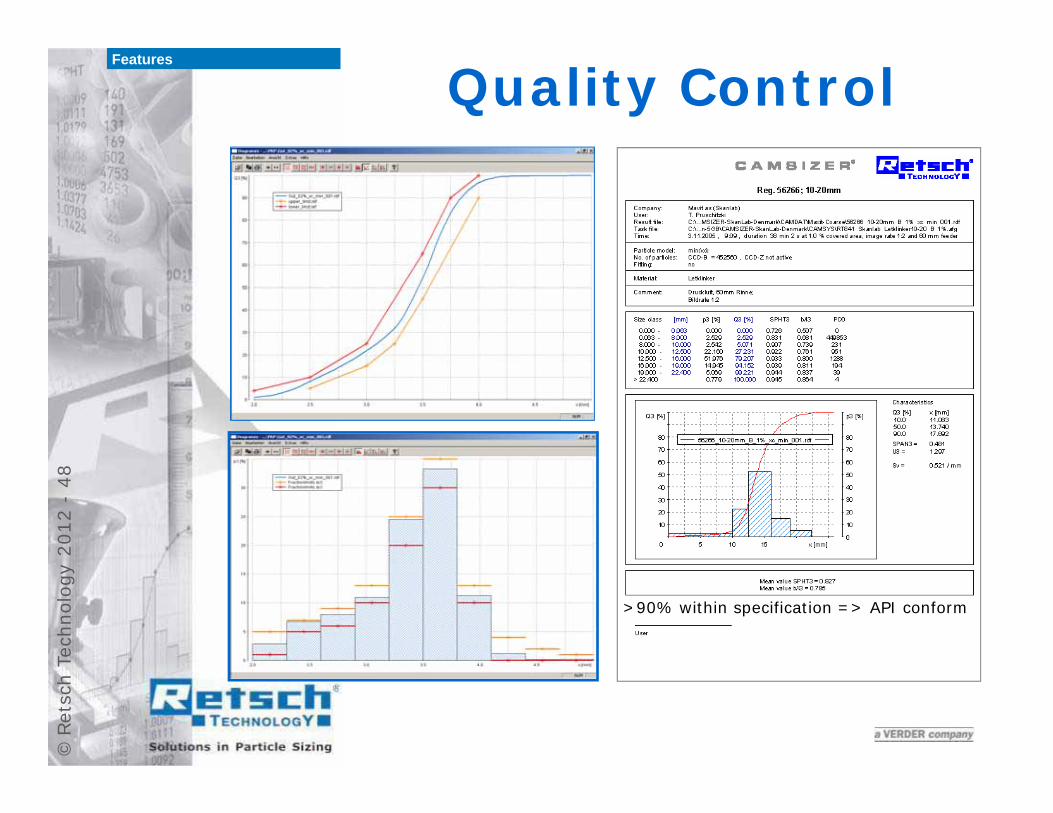
Quality Control
>90% within specification => API conform
©Re
tsch
Tec
hnol
ogy
2012
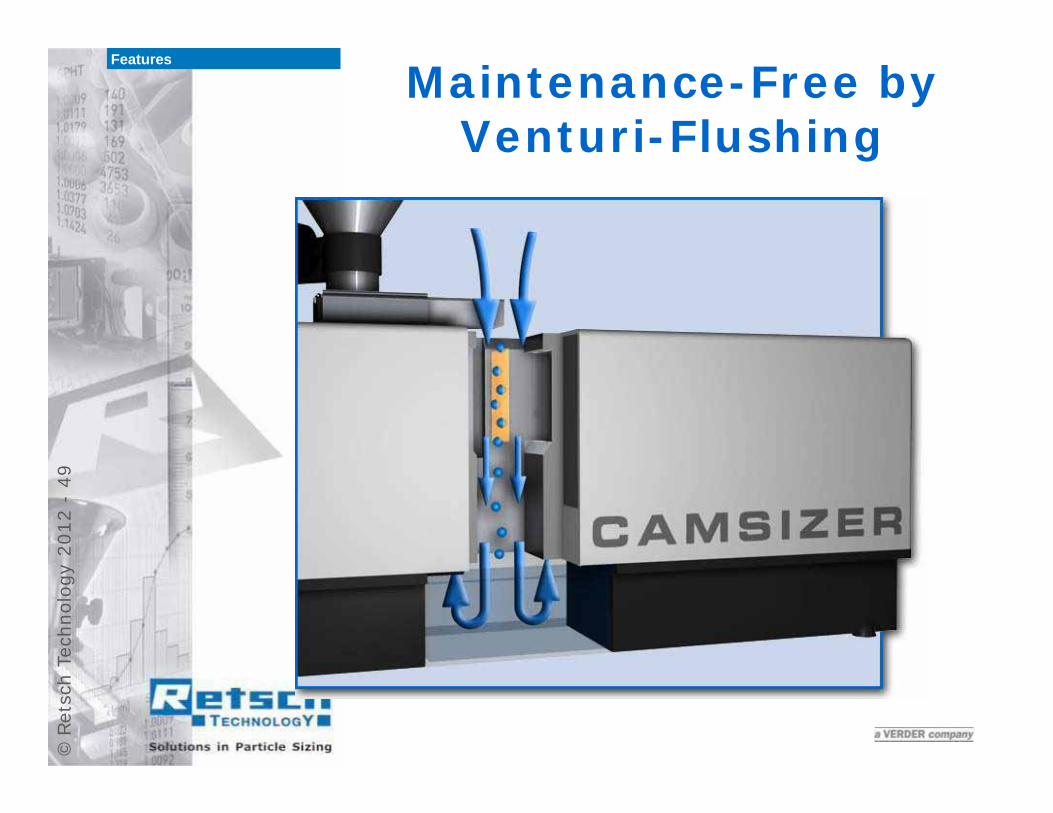
-49
Maintenance-Free byVenturi-Flushing
Features
©Re
tsch
Tec
hnol
ogy
2012
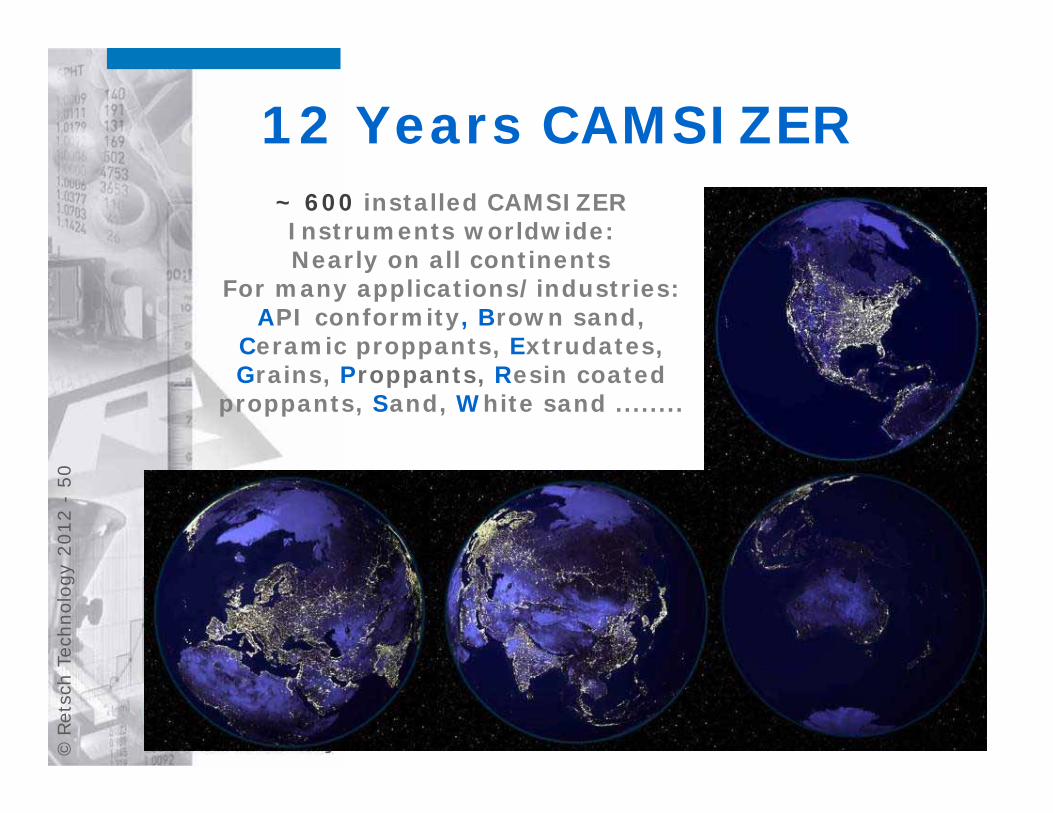
-50
12 Years CAMSIZER~ 600 installed CAMSIZER Instruments worldwide:Nearly on all continents
For many applications/industries:API conformity, Brown sand,
Ceramic proppants, Extrudates, Grains, Proppants, Resin coated
proppants, Sand, White sand ........
©Re
tsch
Tec
hnol
ogy
2012
-51
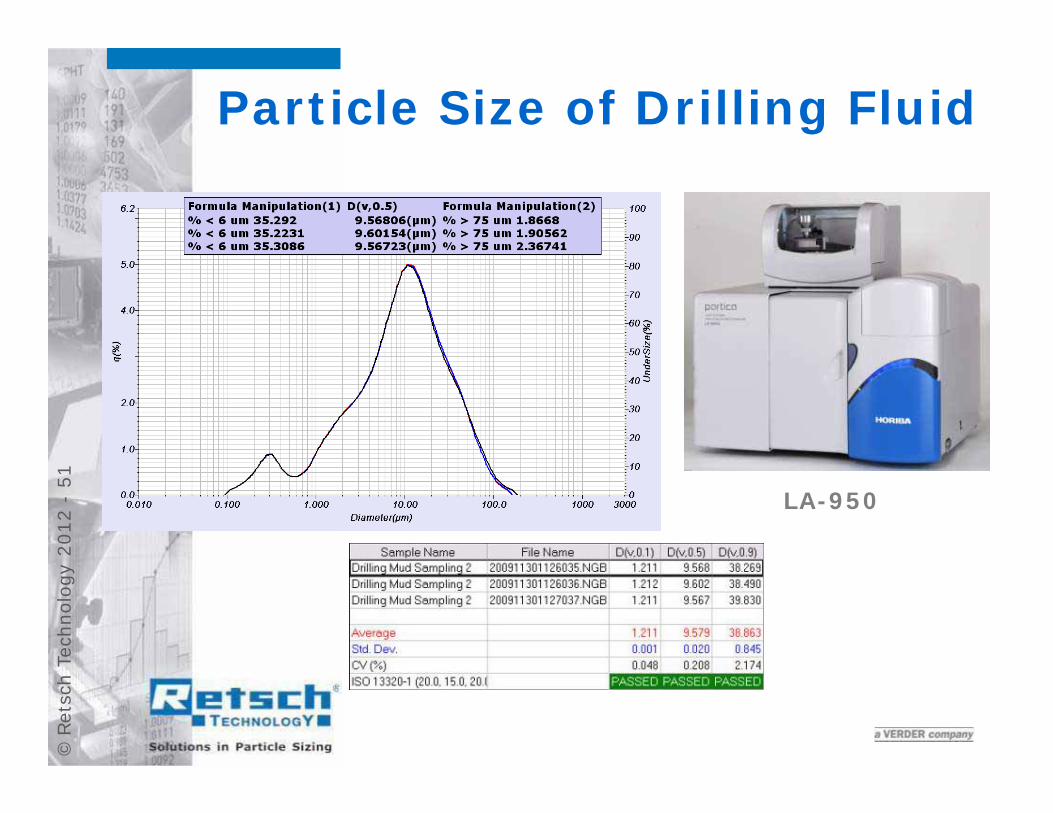
Particle Size of Drilling Fluid
LA-950
©Re
tsch
Tec
hnol
ogy
2012
-52
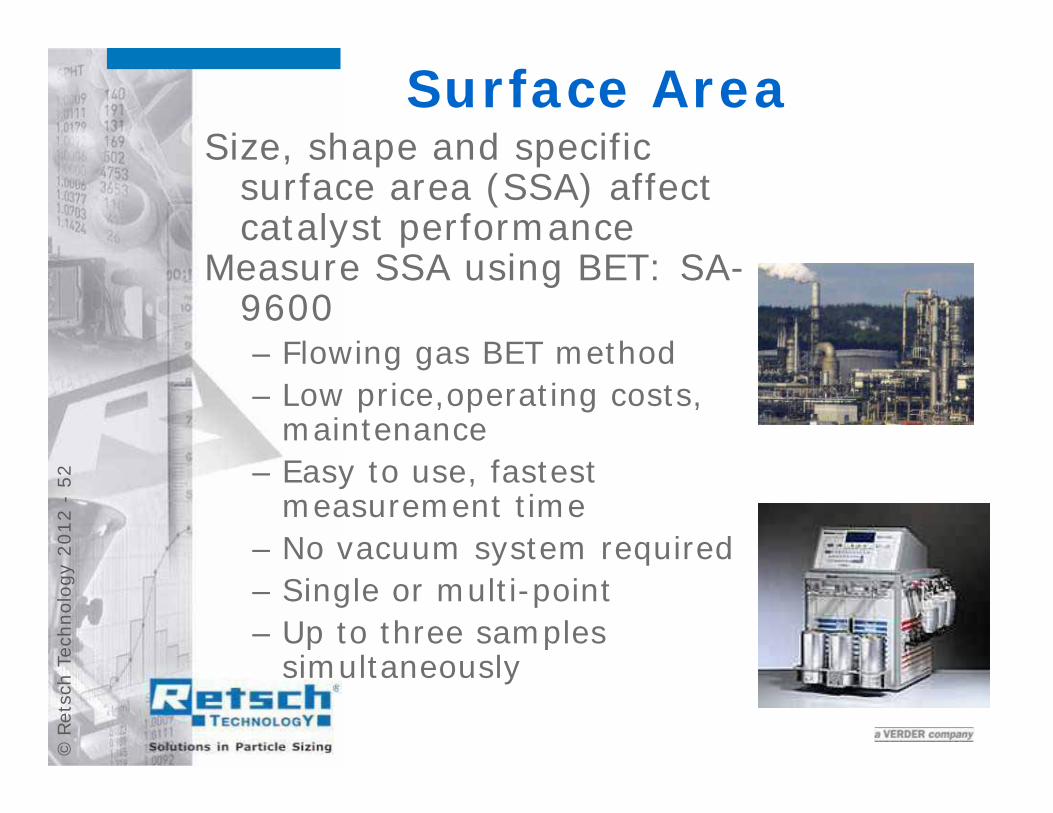
Surface AreaSize, shape and specific
surface area (SSA) affect catalyst performance
Measure SSA using BET: SA-9600– Flowing gas BET method– Low price,operating costs,
maintenance– Easy to use, fastest
measurement time– No vacuum system required– Single or multi-point– Up to three samples
simultaneously
©Re
tsch
Tec
hnol
ogy
2012
-53
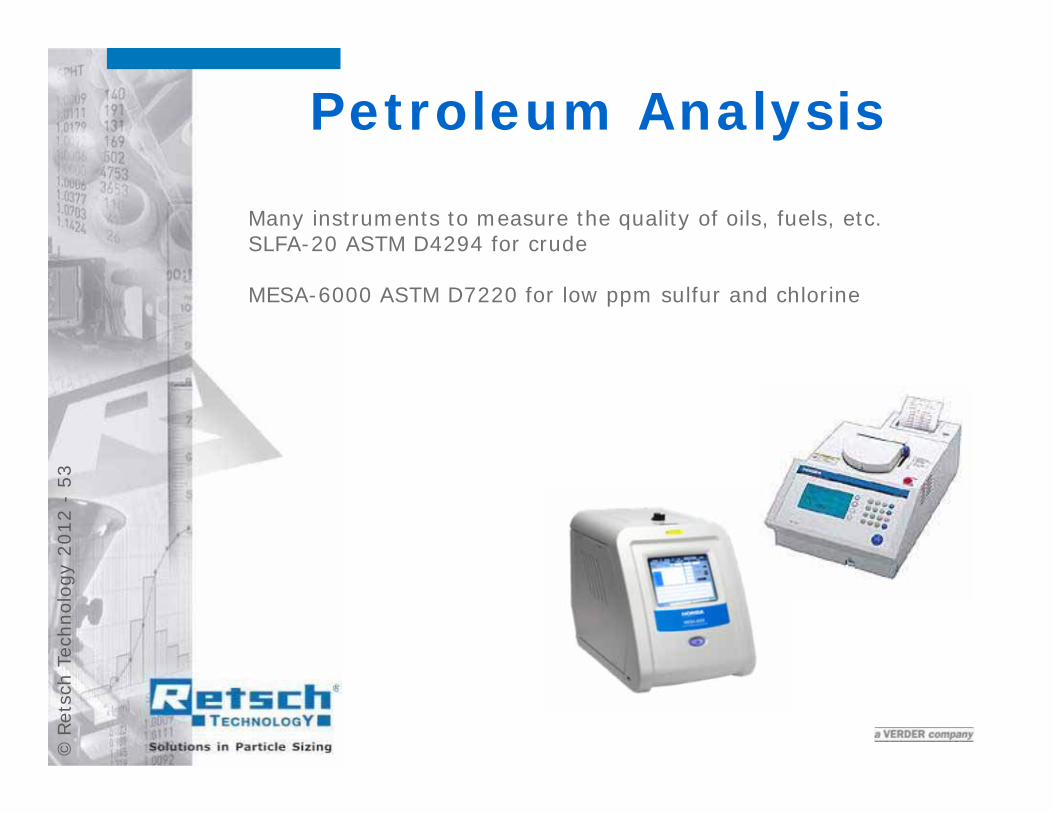
Petroleum Analysis
Many instruments to measure the quality of oils, fuels, etc. SLFA-20 ASTM D4294 for crude
MESA-6000 ASTM D7220 for low ppm sulfur and chlorine
©Re
tsch
Tec
hnol
ogy
2012
-54
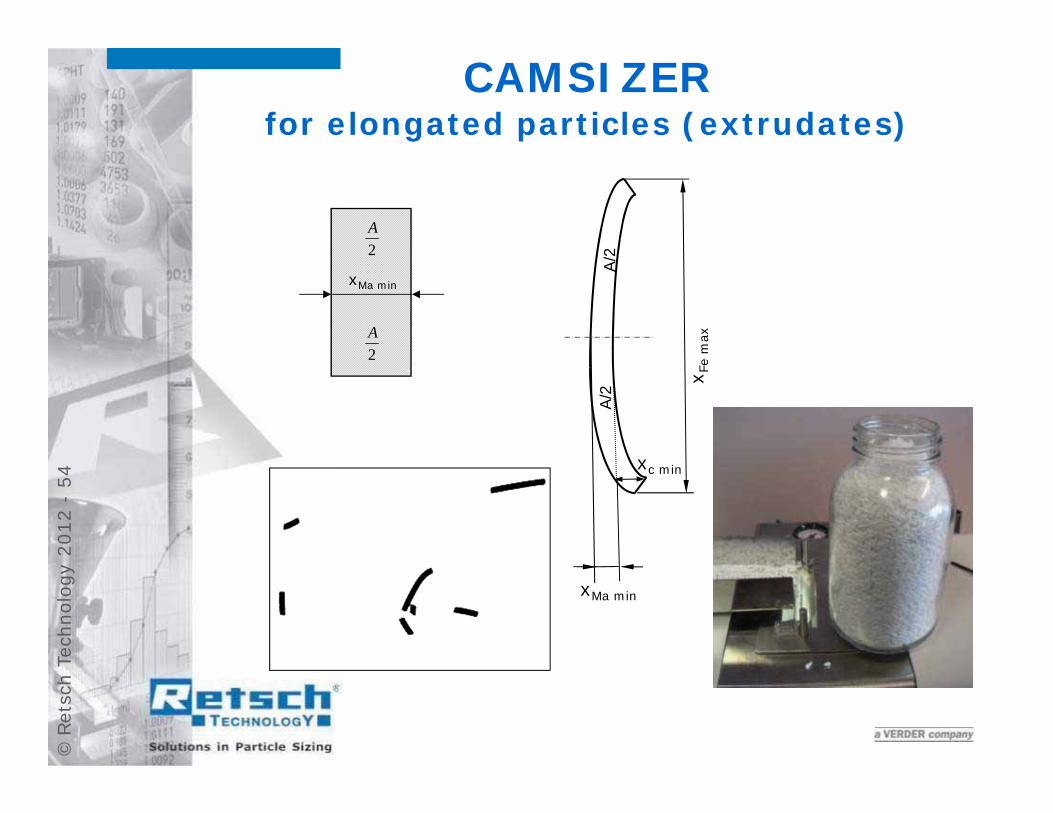
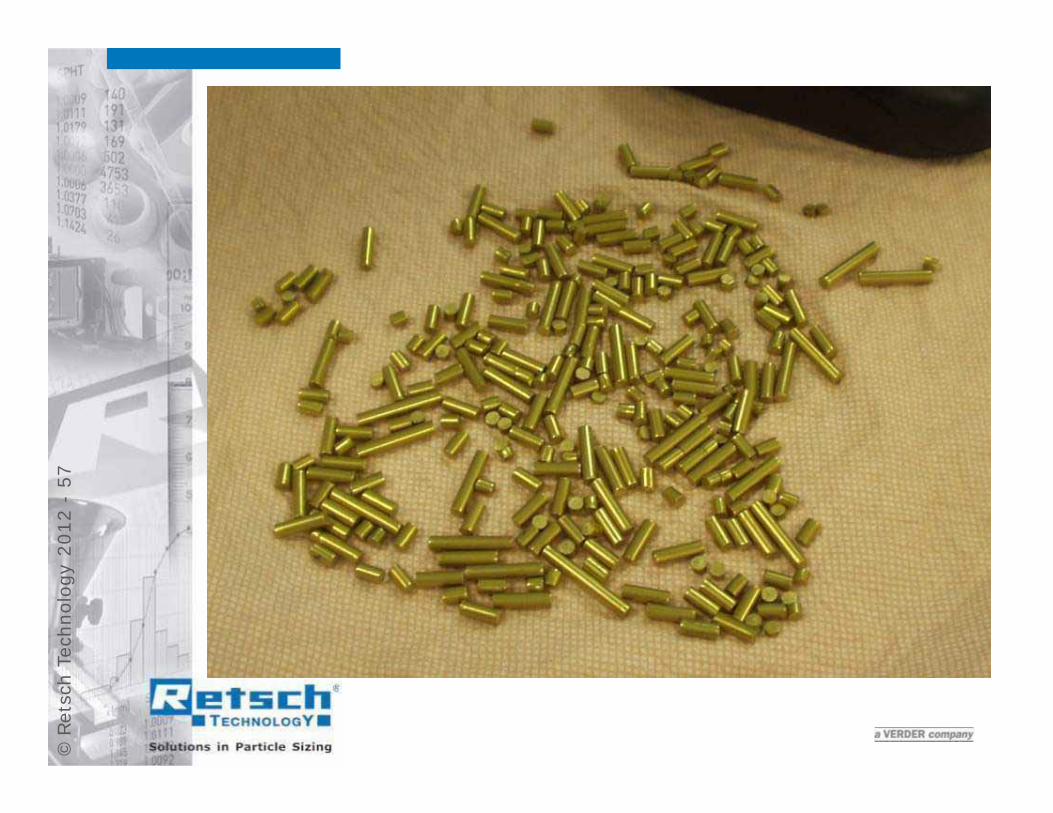
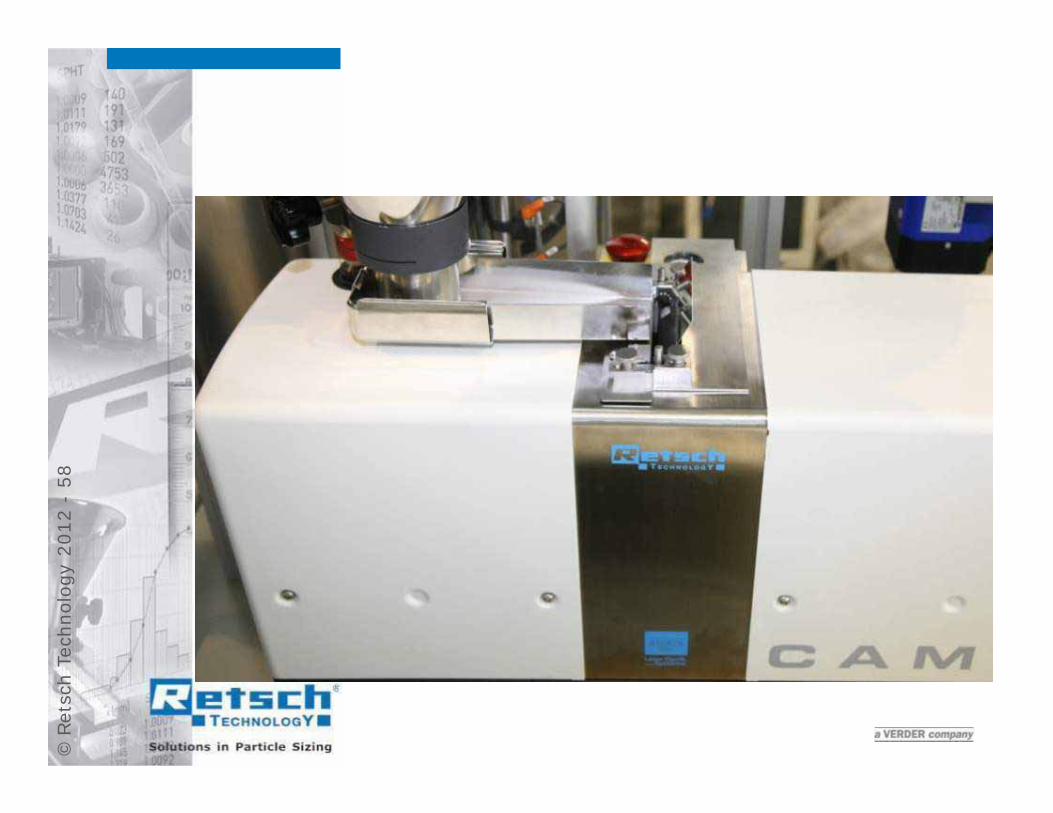
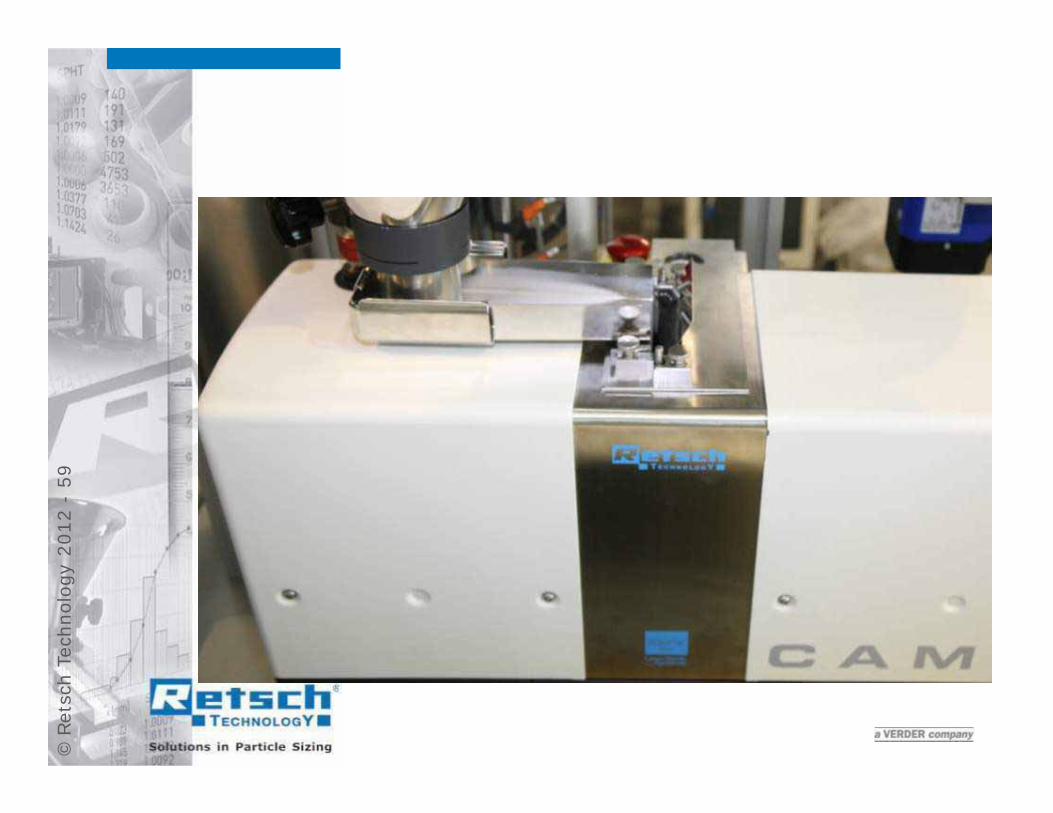
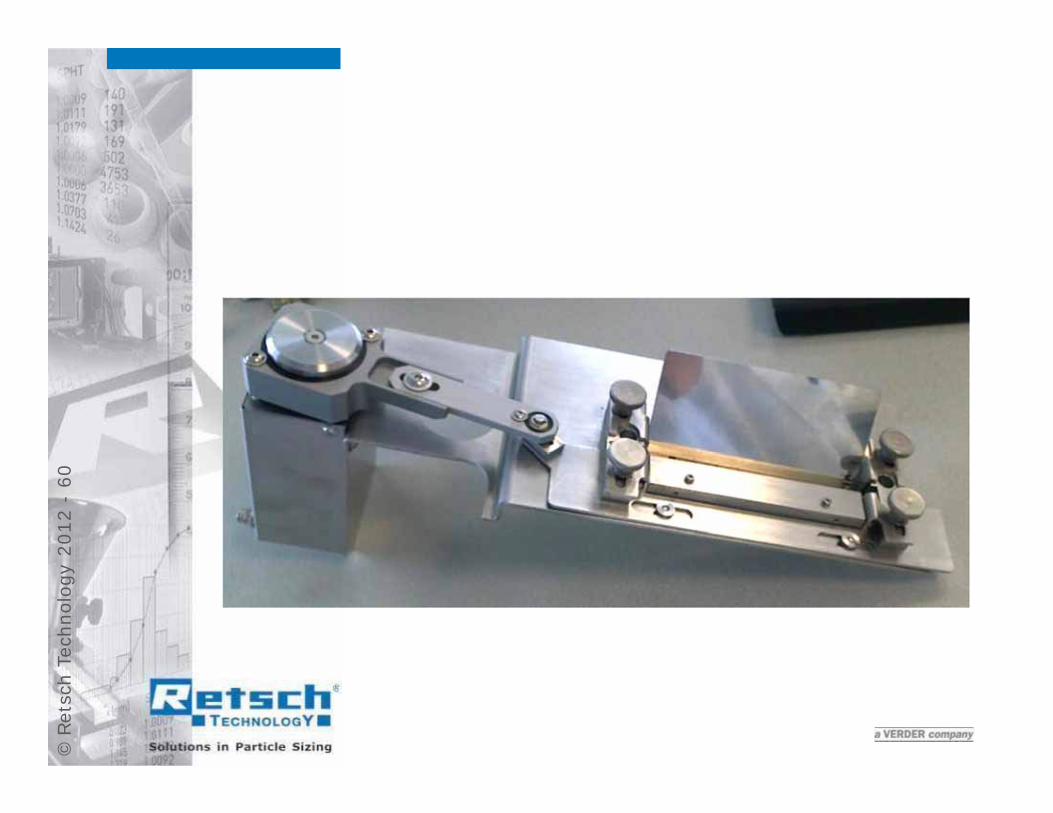
CAMSIZERfor elongated particles (extrudates)
xMa min
xc min
x Fe
max
A/2
A/2
xMa min
2A
2A
©Re
tsch
Tec
hnol
ogy
2012
-55
©Re
tsch
Tec
hnol
ogy
2012
-56
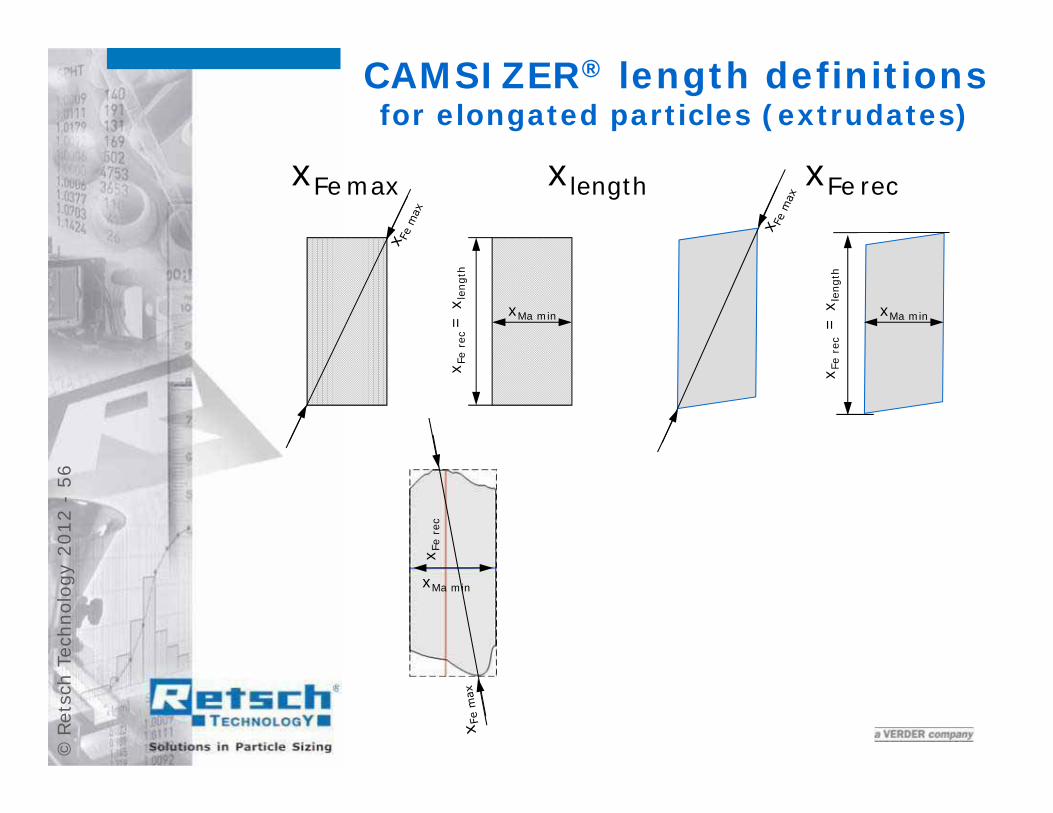
xFe max xlength xFe rec
xMa min
x Fe
rec =
xle
ngth
CAMSIZER® length definitionsfor elongated particles (extrudates)
xMa min
x Fe
rec
= x
leng
th
xMa min
x Fe
rec
©Re
tsch
Tec
hnol
ogy
2012
-57
©Re
tsch
Tec
hnol
ogy
2012
-58
©Re
tsch
Tec
hnol
ogy
2012
-59
©Re
tsch
Tec
hnol
ogy
2012
-60
©Re
tsch
Tec
hnol
ogy
2012
-61
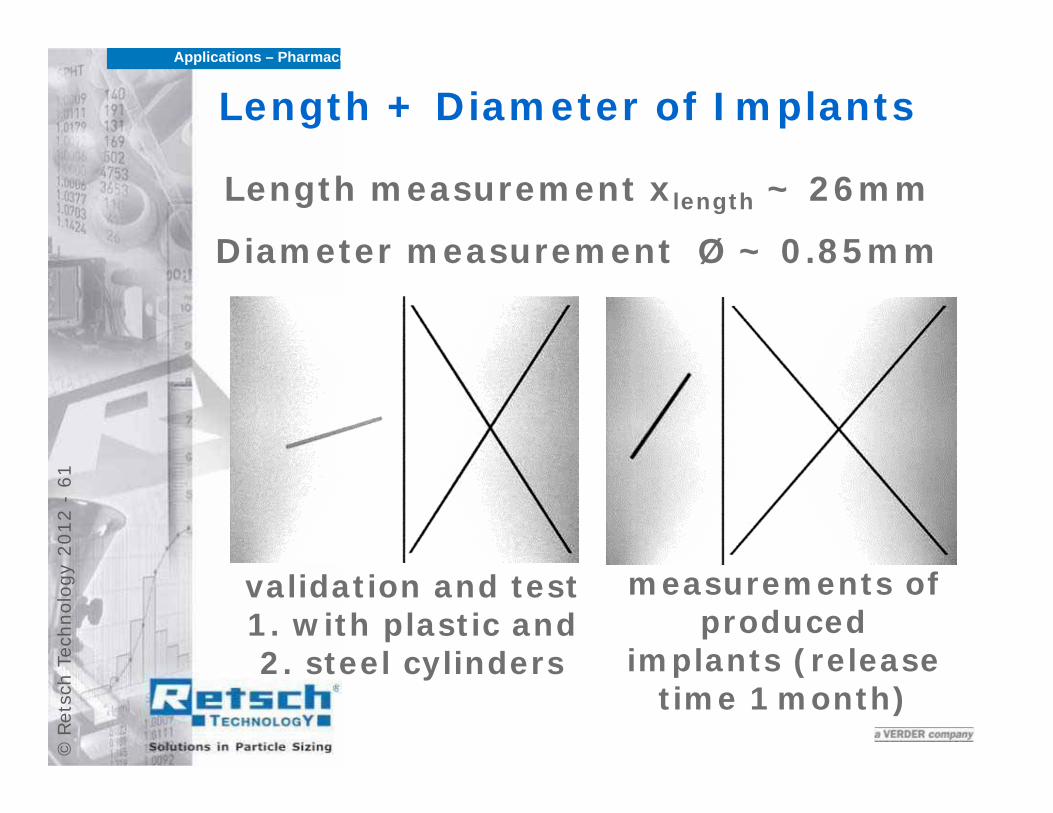
Length + Diameter of Implants
Length measurement xlength ~ 26mm
Diameter measurement Ø ~ 0.85mm
validation and test 1. with plastic and 2. steel cylinders
measurements of produced
implants (release time 1month)
Applications – Pharmaceuticals

©Re
tsch
Tec
hnol
ogy
2012
-62
Slides ShownDuring the Q&A Session
©Re
tsch
Tec
hnol
ogy
2012
-63
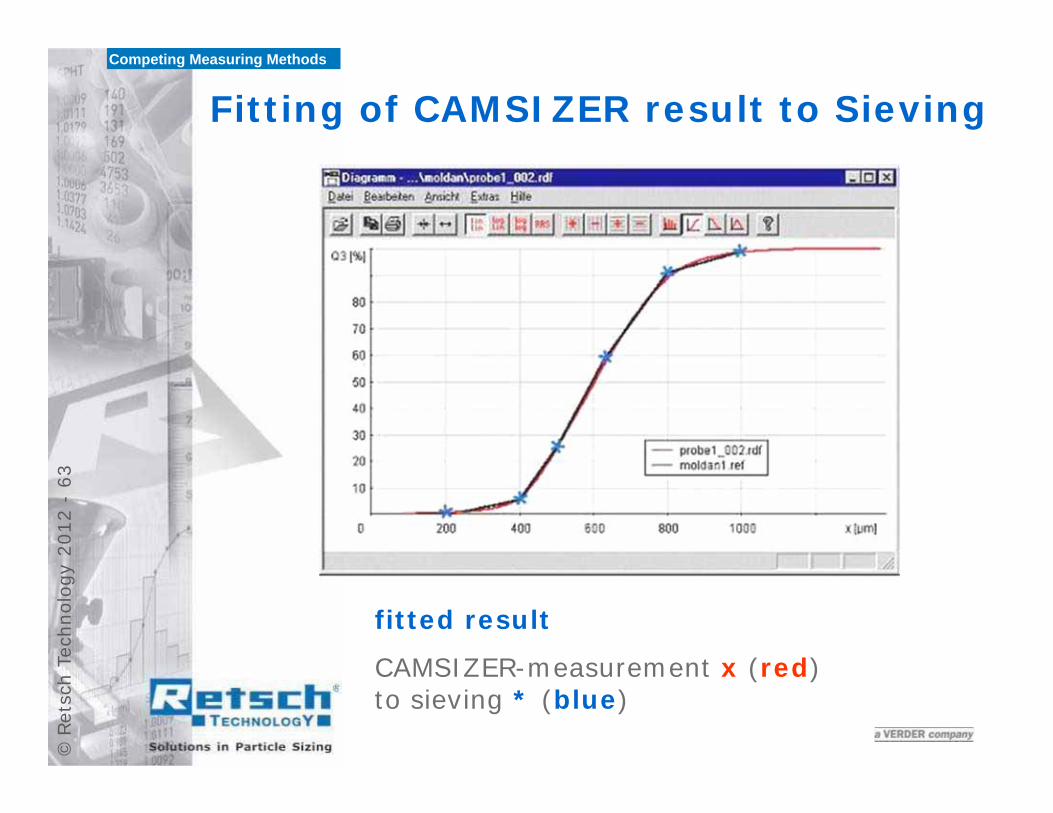
fitted result
CAMSIZER-measurement x (red)to sieving * (blue)
Competing Measuring Methods
Fitting of CAMSIZER result to Sieving
©Re
tsch
Tec
hnol
ogy
2012
-64
x [mm]0.1 10
0.1
0.2
0.3
0.4
0.5
0.6
0.7
0.8
0.9
Q3
Tinovetin-B-CA584A_BZ_xc_min_002.rdfSyngenta-1mm-2min-Sieb.ref
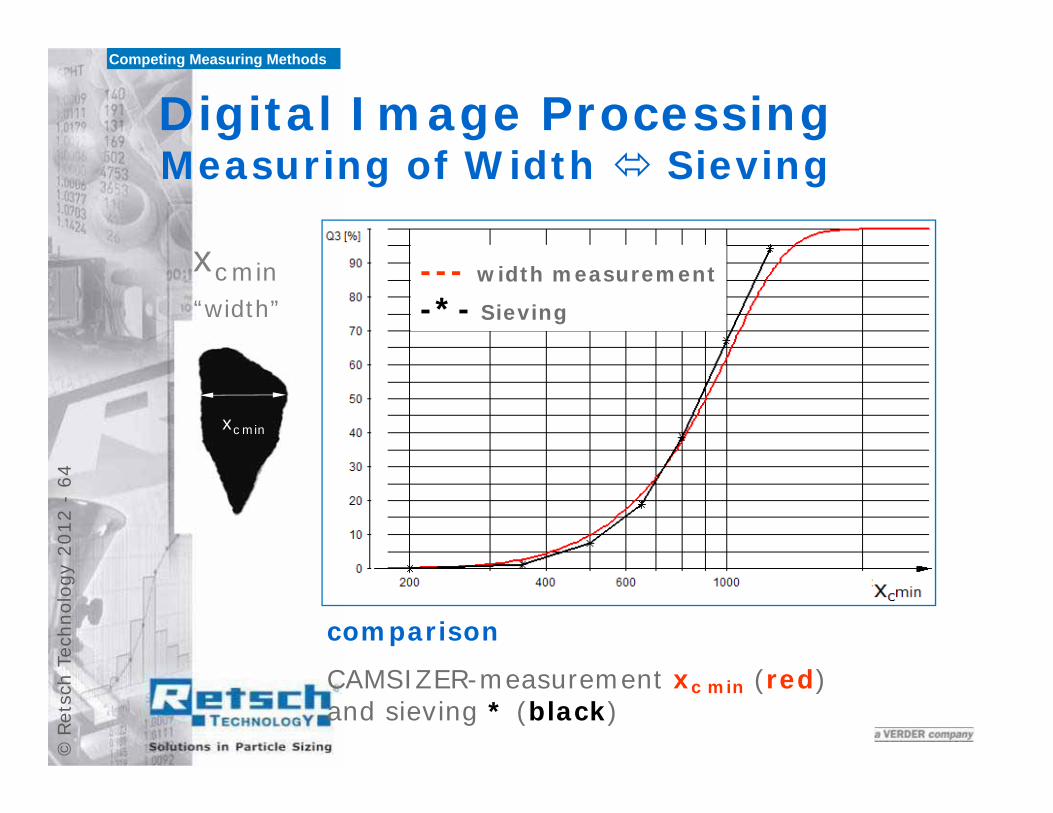
Digital Image Processing Measuring of Width Sieving
--- width measurement
-*- Sieving
comparison
CAMSIZER-measurement xc min (red)and sieving * (black)
Competing Measuring Methods
xcmin
xc min
“width”
©Re
tsch
Tec
hnol
ogy
2012
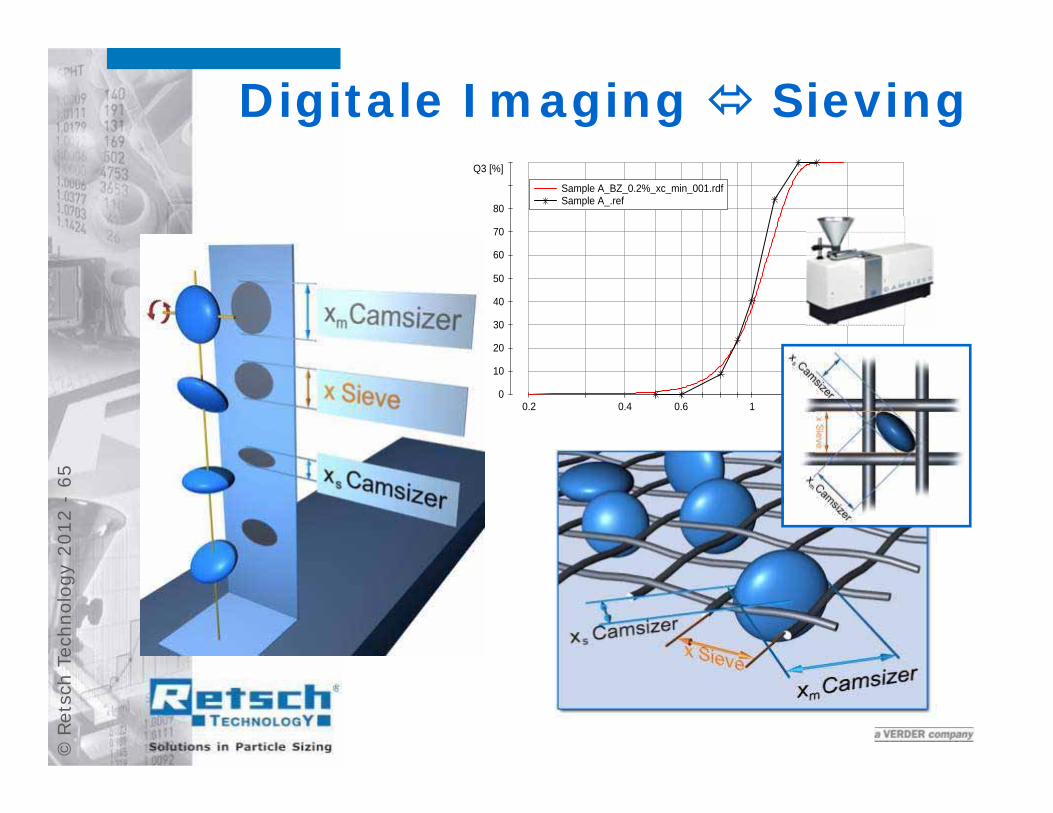
-65
x [mm]0.2 0.4 0.6 10
10
20
30
40
50
60
70
80
Q3 [%]
Sample A_BZ_0.2%_xc_min_001.rdfSample A_.ref
Digitale Imaging Sieving
©Re
tsch
Tec
hnol
ogy
2012
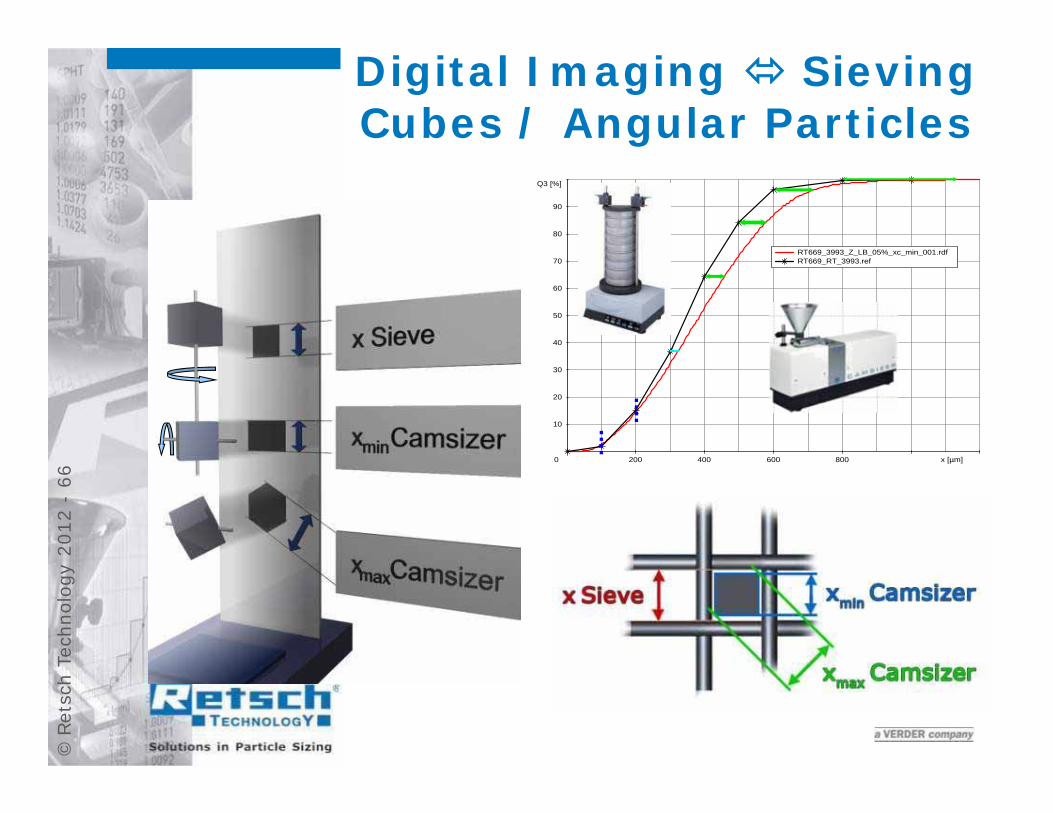
-66
x [µm]200 400 600 8000
10
20
30
40
50
60
70
80
90
Q3 [%]
RT669_3993_Z_LB_05%_xc_min_001.rdfRT669_RT_3993.ref
Digital Imaging SievingCubes / Angular Particles
©Re
tsch
Tec
hnol
ogy
2012
-67
x0.5 1.0 1.5 2.00
0.1
0.2
0.3
0.4
0.5
0.6
0.7
0.8
0.9
y
10-16mm_BZ_05%_xc_min_001.Q3Real_10-16mm.Q3
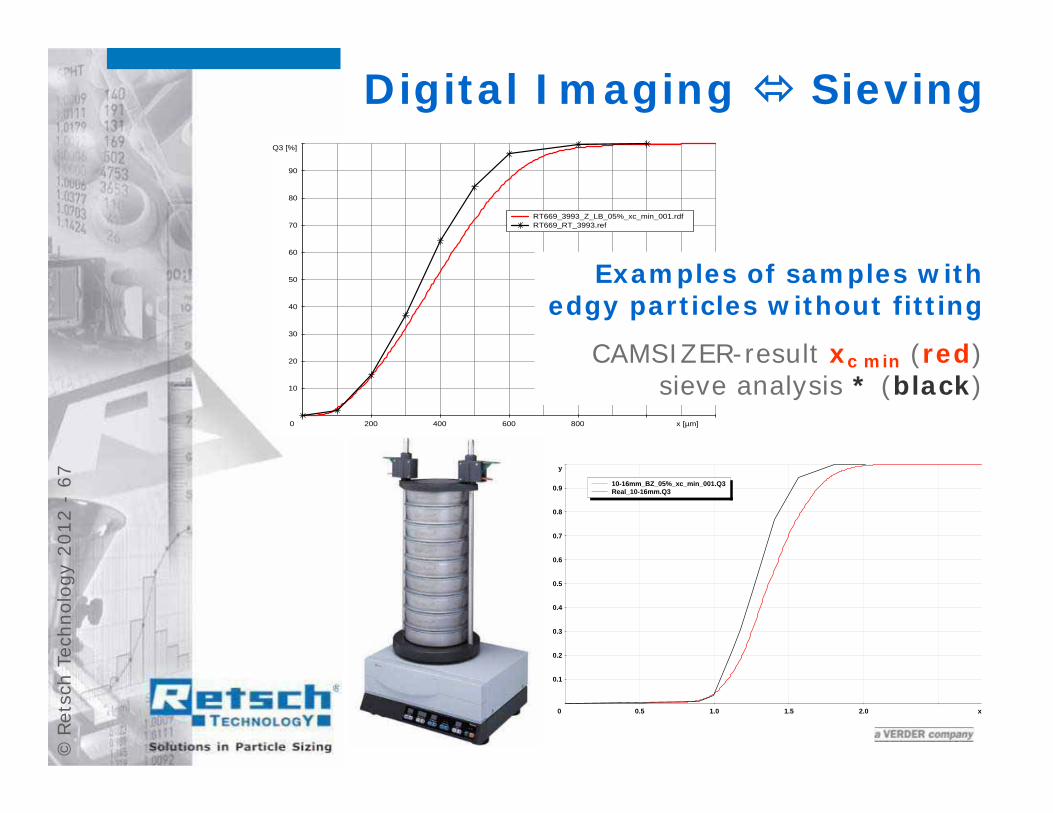
x [µm]200 400 600 8000
10
20
30
40
50
60
70
80
90
Q3 [%]
RT669_3993_Z_LB_05%_xc_min_001.rdfRT669_RT_3993.ref
Digital Imaging Sieving
Examples of samples with edgy particles without fitting
CAMSIZER-result xc min (red)sieve analysis * (black)
©Re
tsch
Tec
hnol
ogy
2012
-68
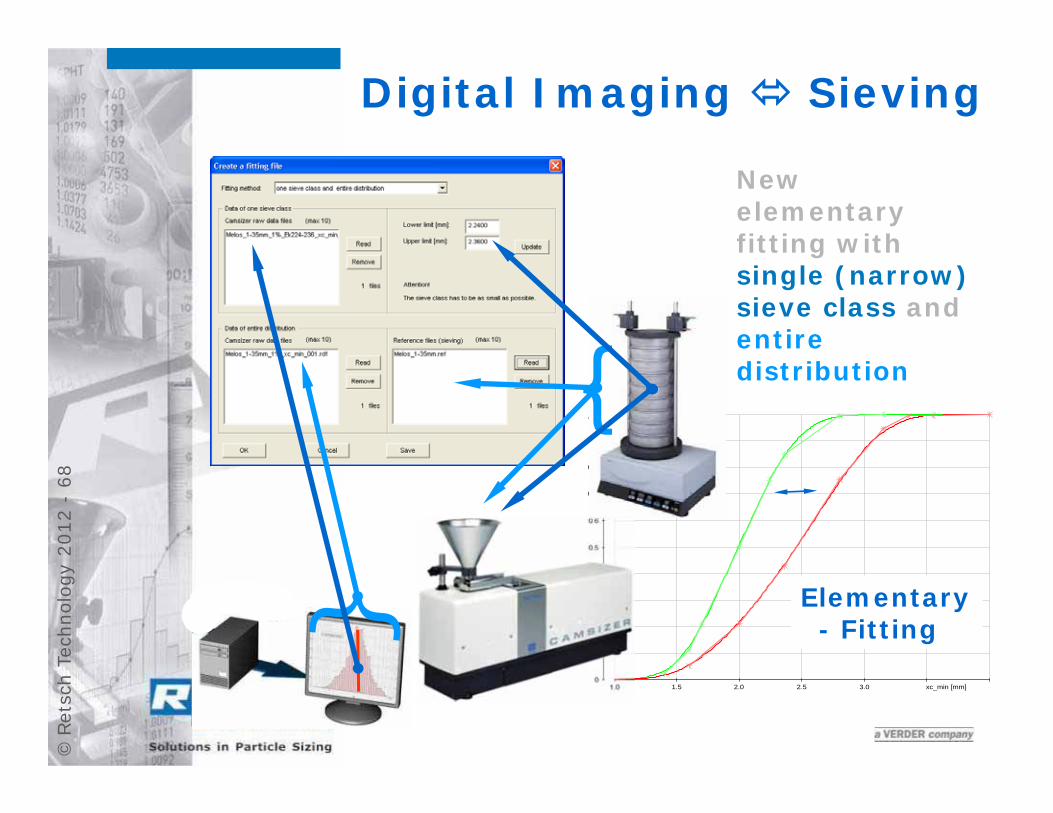
xc_min [mm]1.0 1.5 2.0 2.5 3.00
0.1
0.2
0.3
0.4
0.5
0.6
0.7
0.8
0.9
Q3
Digital Imaging Sieving
Elementary - Fitting
New elementary fitting with single (narrow) sieve class and entire distribution{

©Re
tsch
Tec
hnol
ogy
2012
-69
Digital Imaging Sieving
Elementary fitting =
Sieve Correlation with single (narrow)
sieve class
Samples with
similar shape
©Re
tsch
Tec
hnol
ogy
2012
-70
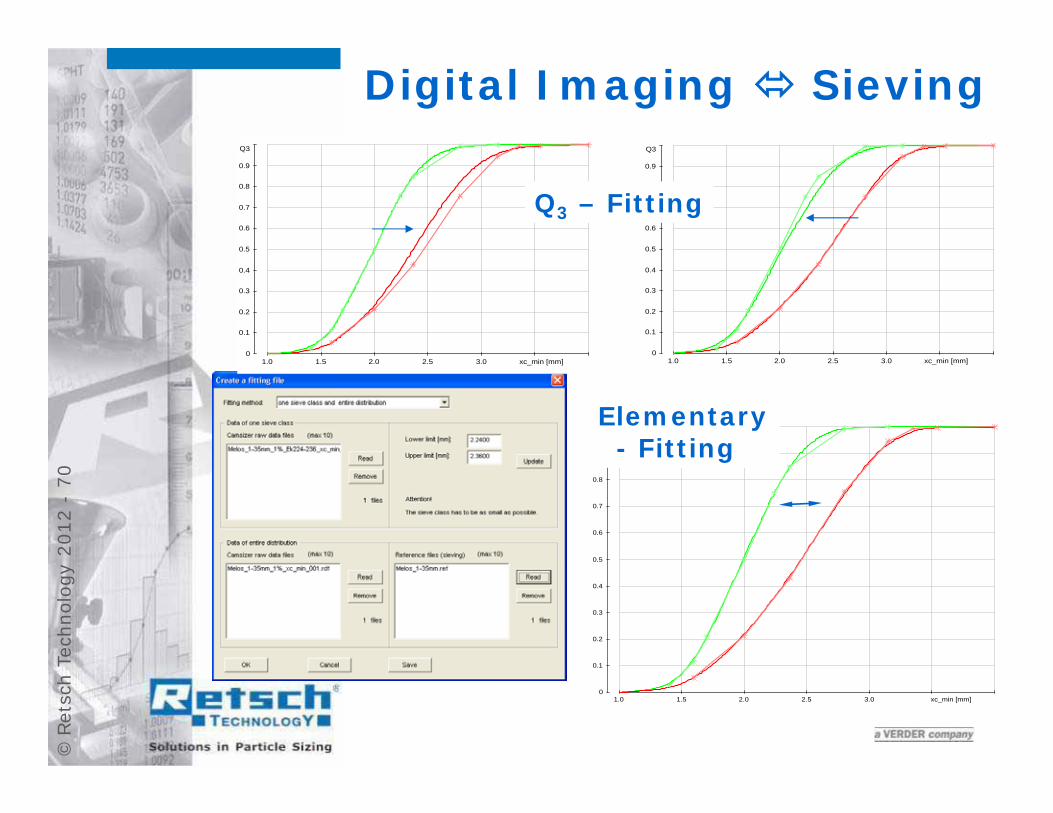
xc_min [mm]1.0 1.5 2.0 2.5 3.00
0.1
0.2
0.3
0.4
0.5
0.6
0.7
0.8
0.9
Q3
xc_min [mm]1.0 1.5 2.0 2.5 3.00
0.1
0.2
0.3
0.4
0.5
0.6
0.7
0.8
0.9
Q3
xc_min [mm]1.0 1.5 2.0 2.5 3.00
0.1
0.2
0.3
0.4
0.5
0.6
0.7
0.8
0.9
Q3
Digital Imaging Sieving
Q3 – Fitting
Elementary - Fitting

©Re
tsch
Tec
hnol
ogy
2012
-71
Slides ShownDuring the Q&A Session
©Re
tsch
Tec
hnol
ogy
2012
-72
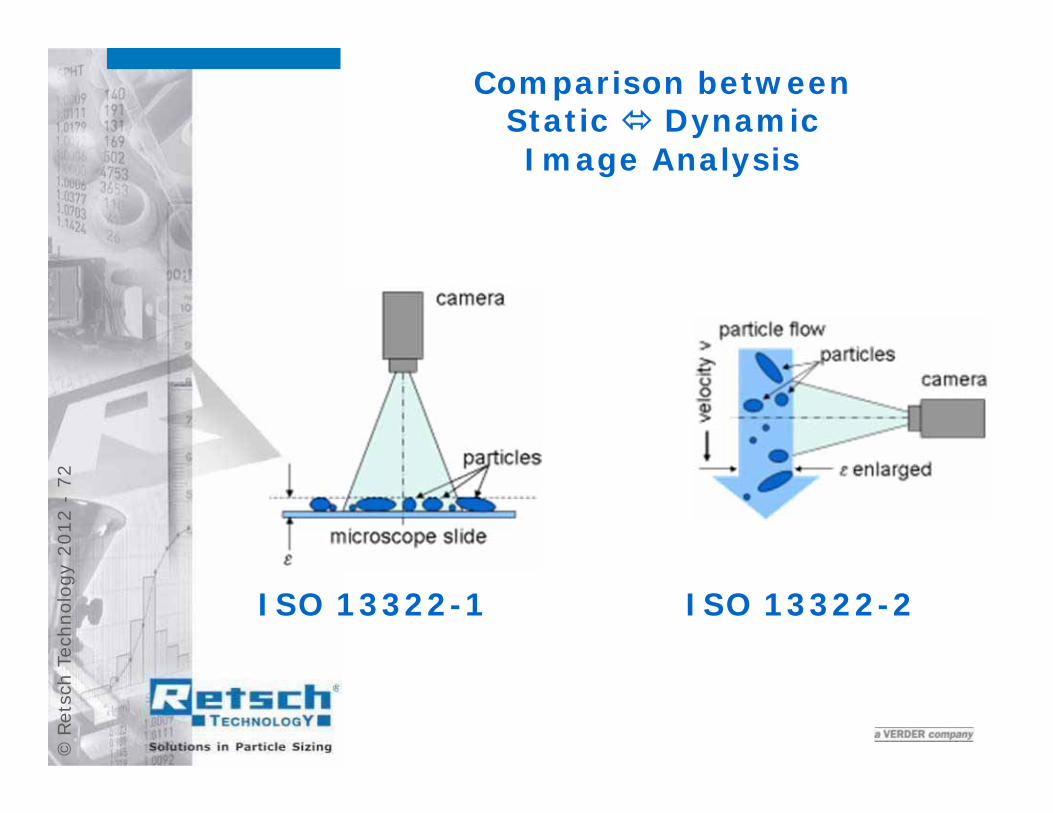
Comparison betweenStatic Dynamic Image Analysis
ISO 13322-1 ISO 13322-2
©Re
tsch
Tec
hnol
ogy
2012
-73
Slides ShownDuring the Q&A Session
Sampling
©Re
tsch
Tec
hnol
ogy
2012
-74
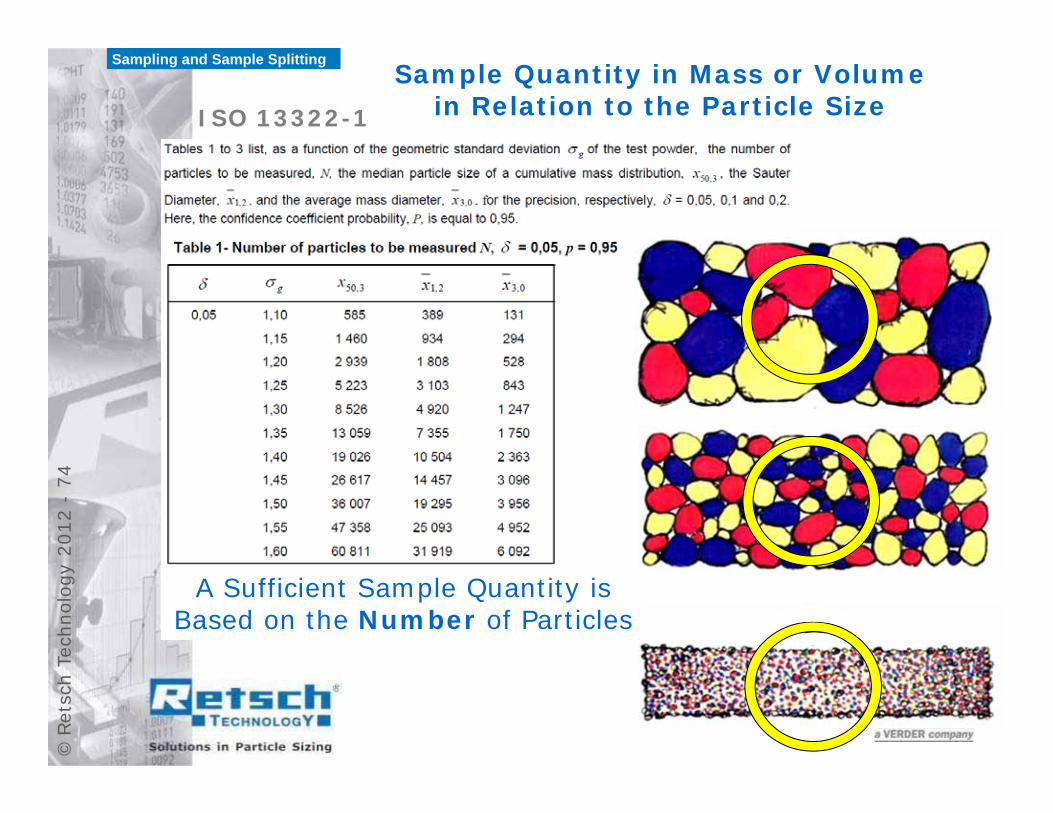
Sample Quantity in Mass or Volume in Relation to the Particle Size
A Sufficient Sample Quantity isBased on the Number of Particles
ISO 13322-1
Sampling and Sample Splitting
©Re
tsch
Tec
hnol
ogy
2012
-75
Additional Slides to betterexplain Sampling and
Sample Splitting
©Re
tsch
Tec
hnol
ogy
2012
-76
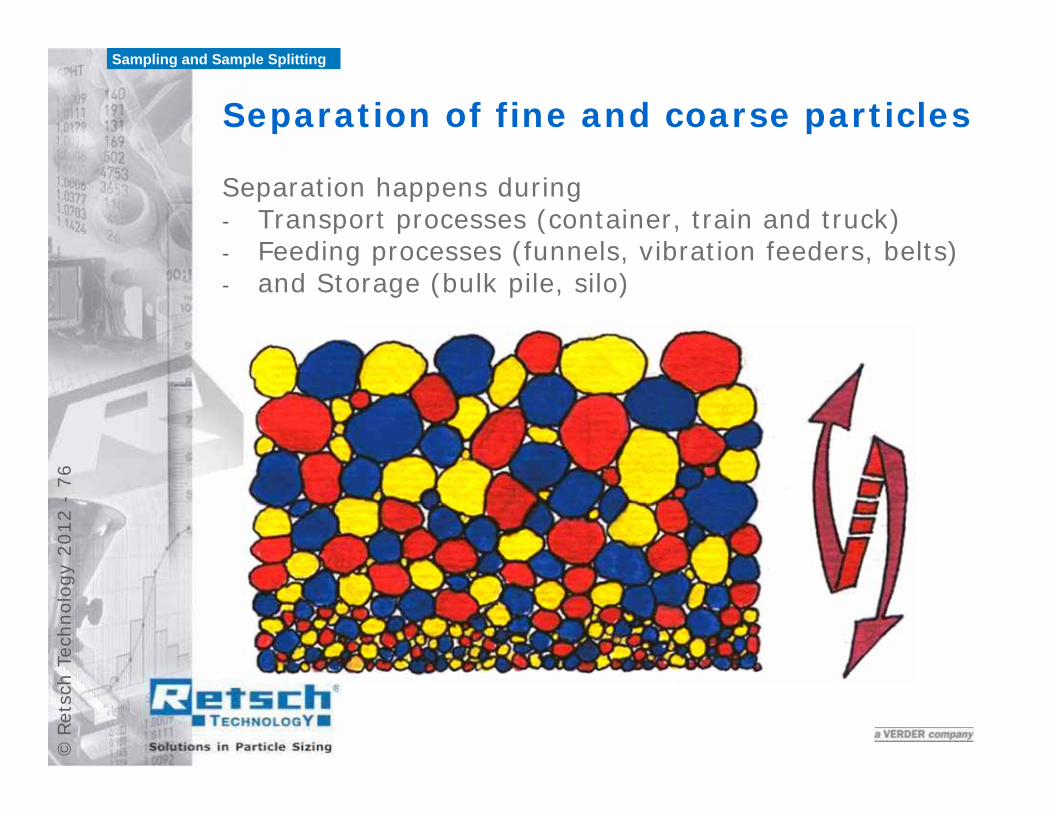
Separation of fine and coarse particles
Separation happens during- Transport processes (container, train and truck)- Feeding processes (funnels, vibration feeders, belts)- and Storage (bulk pile, silo)
Sampling and Sample Splitting
©Re
tsch
Tec
hnol
ogy
2012
-77
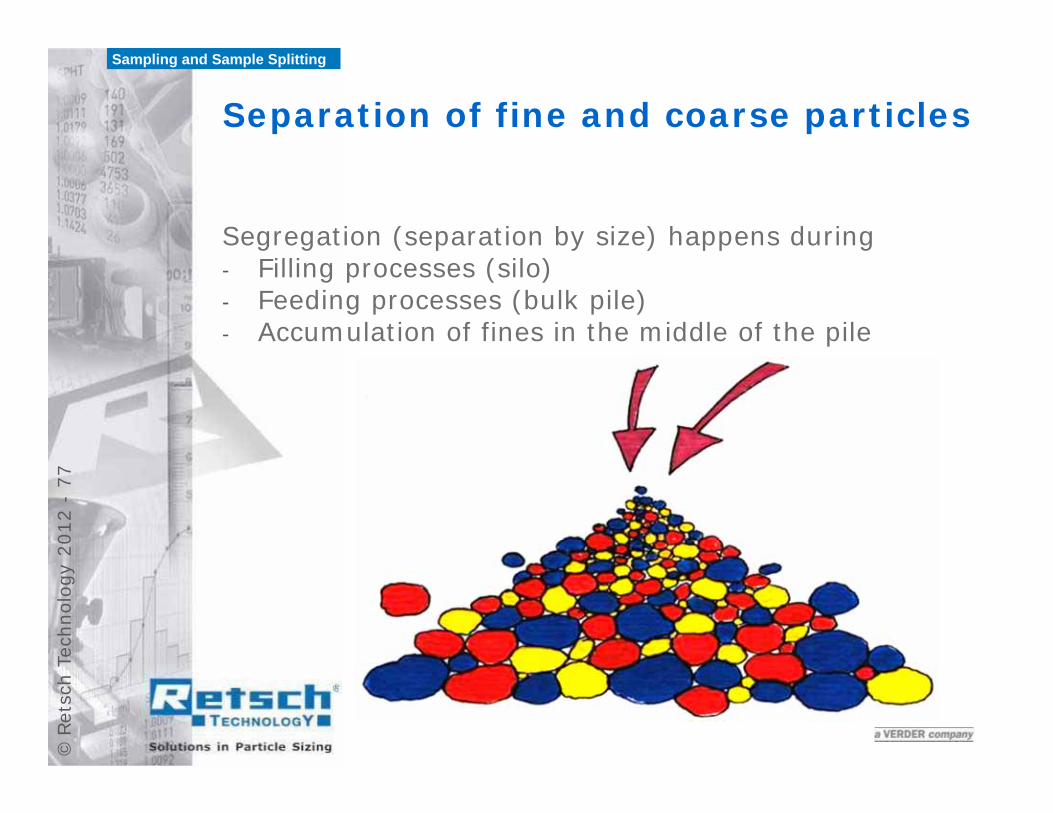
Separation of fine and coarse particles
Segregation (separation by size) happens during- Filling processes (silo)- Feeding processes (bulk pile)- Accumulation of fines in the middle of the pile
Sampling and Sample Splitting
©Re
tsch
Tec
hnol
ogy
2012
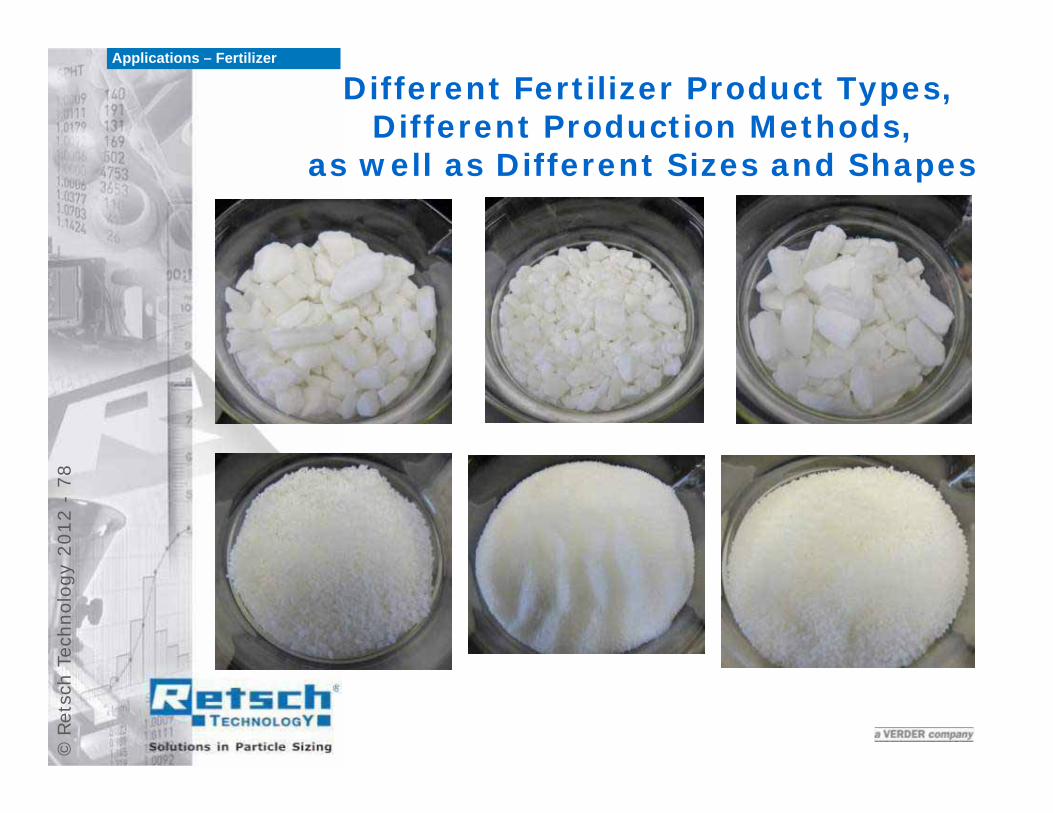
-78Different Fertilizer Product Types,
Different Production Methods, as well as Different Sizes and Shapes
Applications – Fertilizer
©Re
tsch
Tec
hnol
ogy
2012
-79
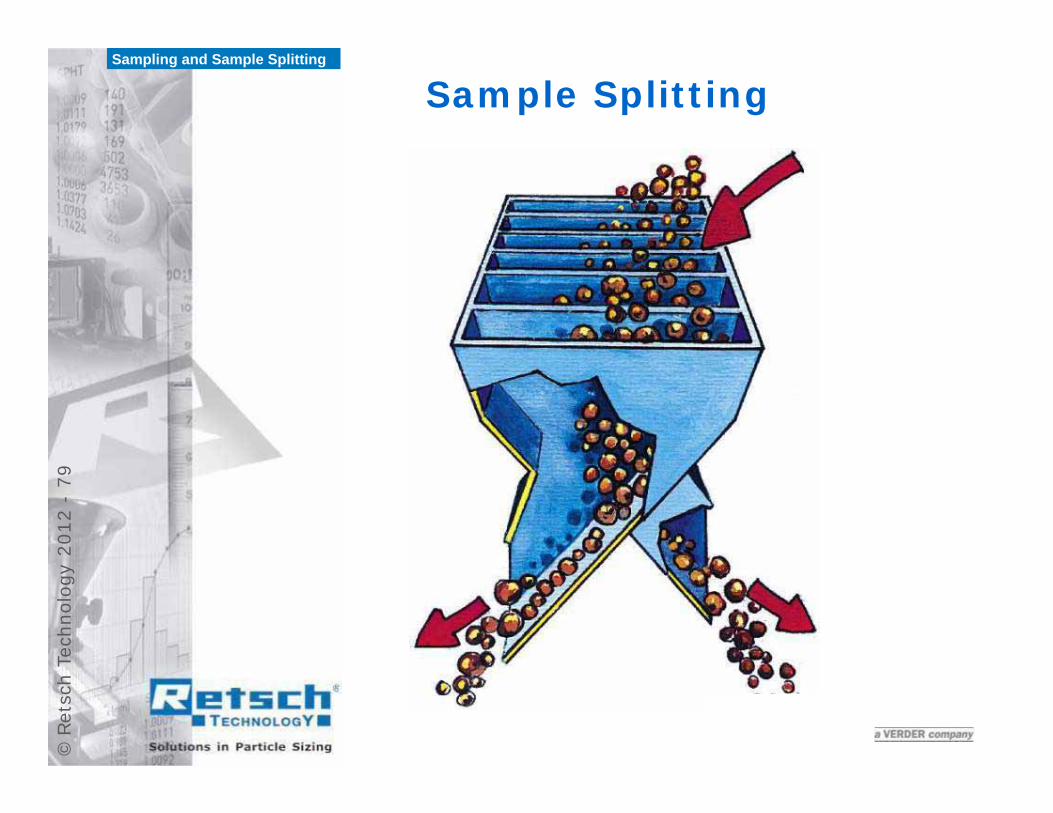
Sample SplittingSampling and Sample Splitting
©Re
tsch
Tec
hnol
ogy
2012
-80
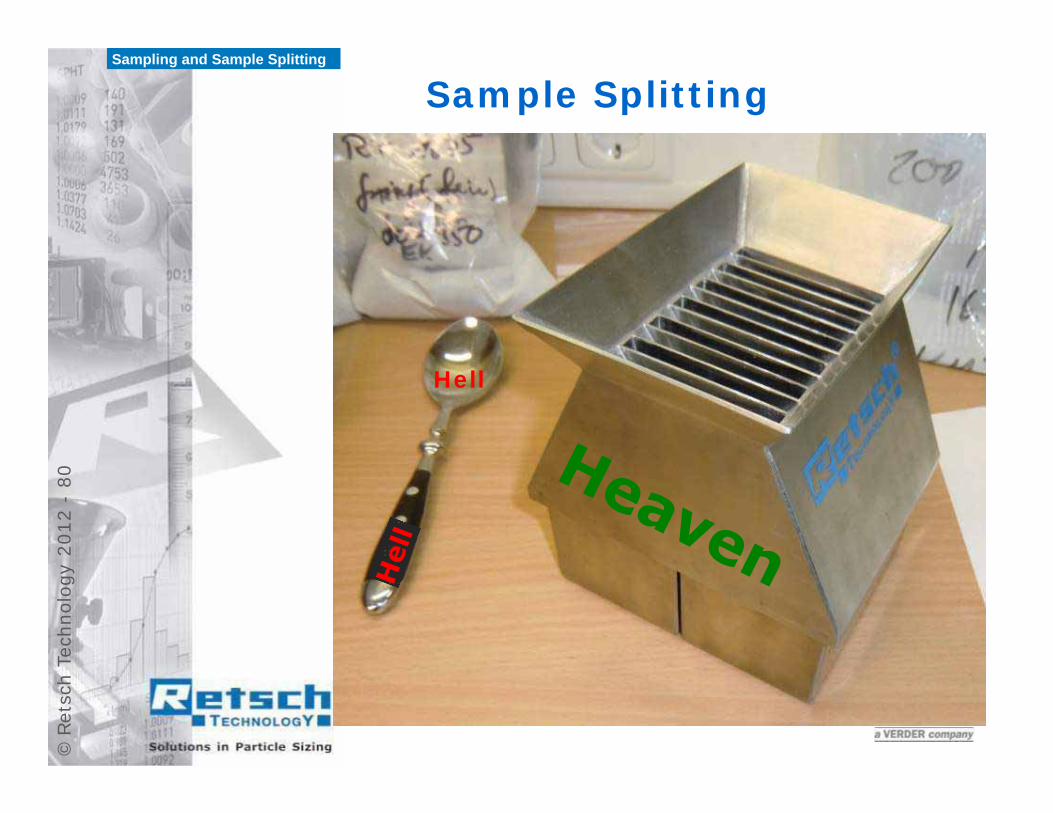
Sample Splitting
Hell
Sampling and Sample Splitting
©Re
tsch
Tec
hnol
ogy
2012
-81
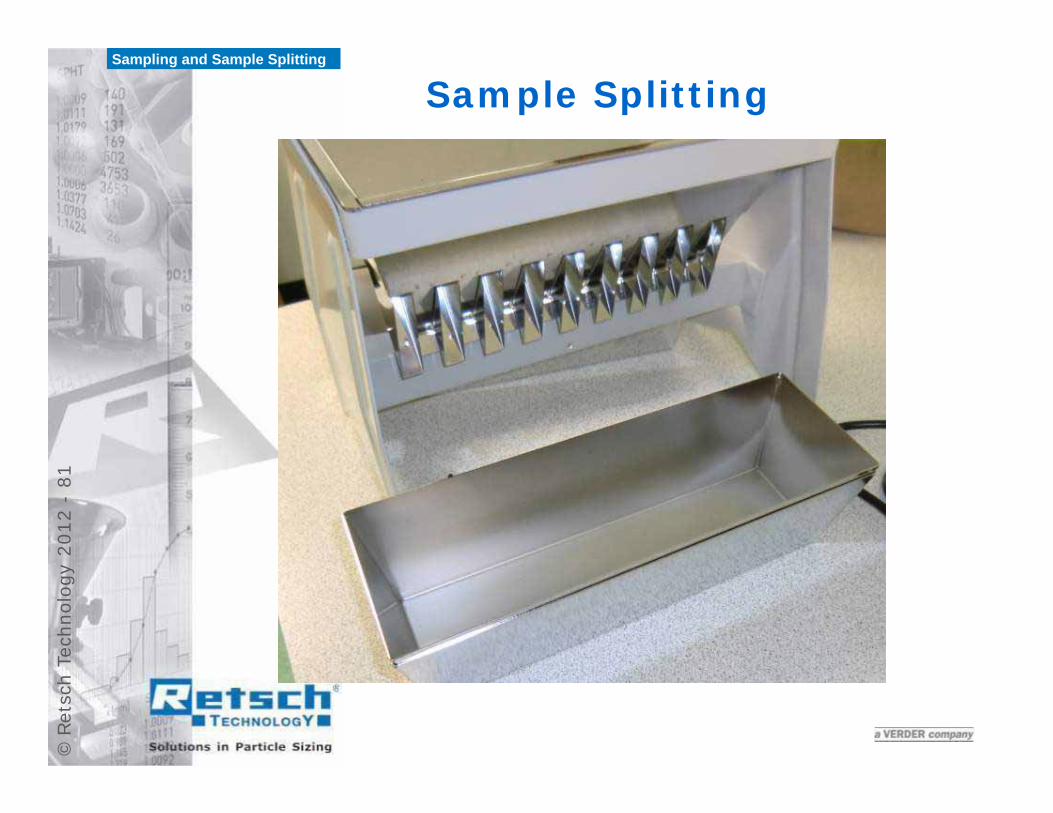
Sample SplittingSampling and Sample Splitting
©Re
tsch
Tec
hnol
ogy
2012
-82
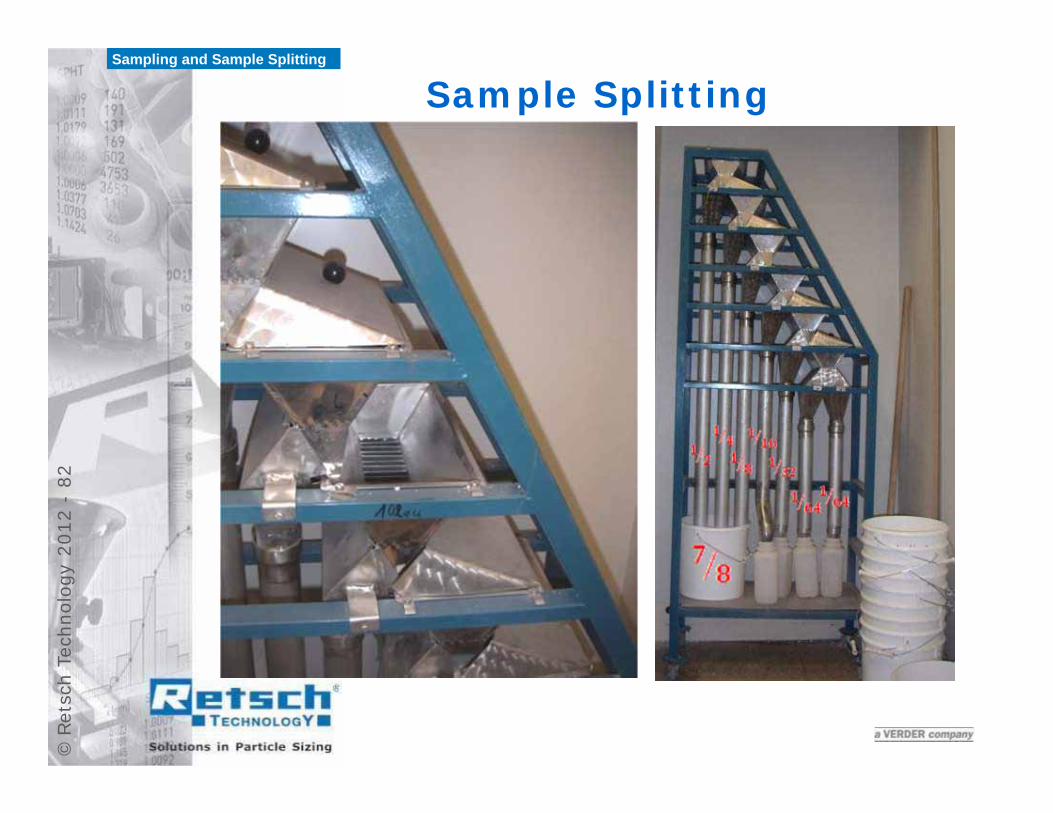
Sample SplittingSampling and Sample Splitting
©Re
tsch
Tec
hnol
ogy
2012
-83
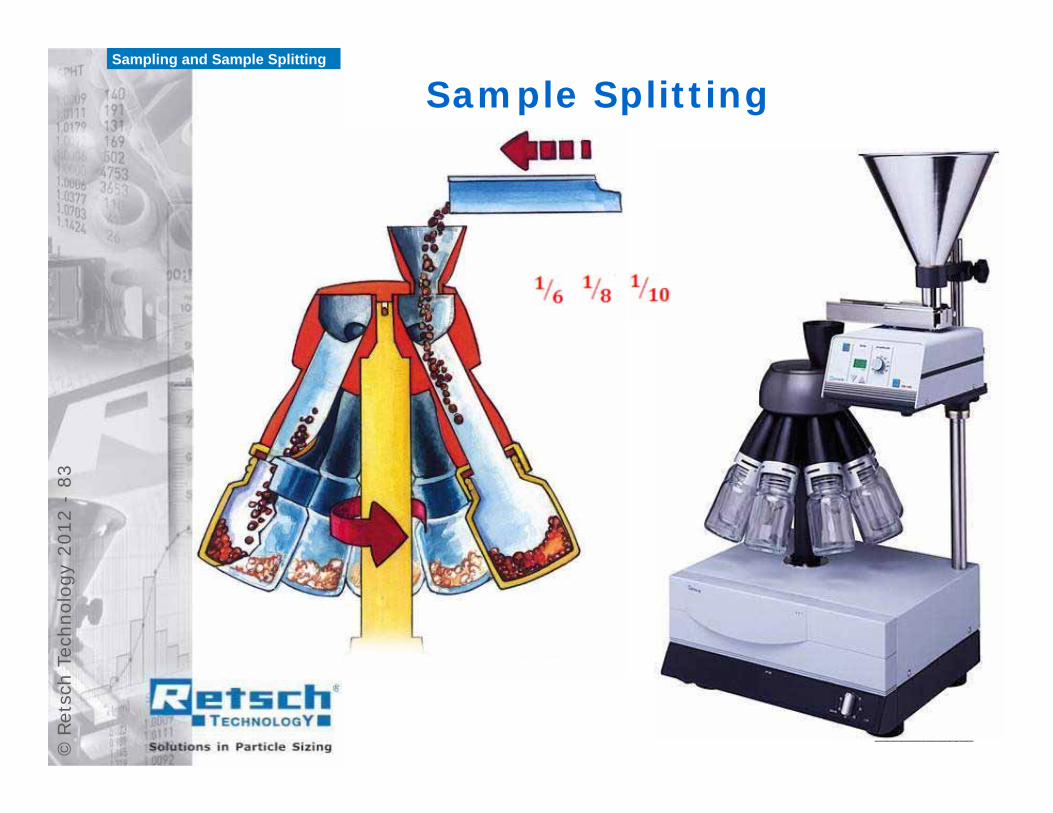
Sample SplittingSampling and Sample Splitting
©Re
tsch
Tec
hnol
ogy
2012
-84
Additional Slides to betterexplain the CAMSIZER
Technology
©Re
tsch
Tec
hnol
ogy
2012
-85
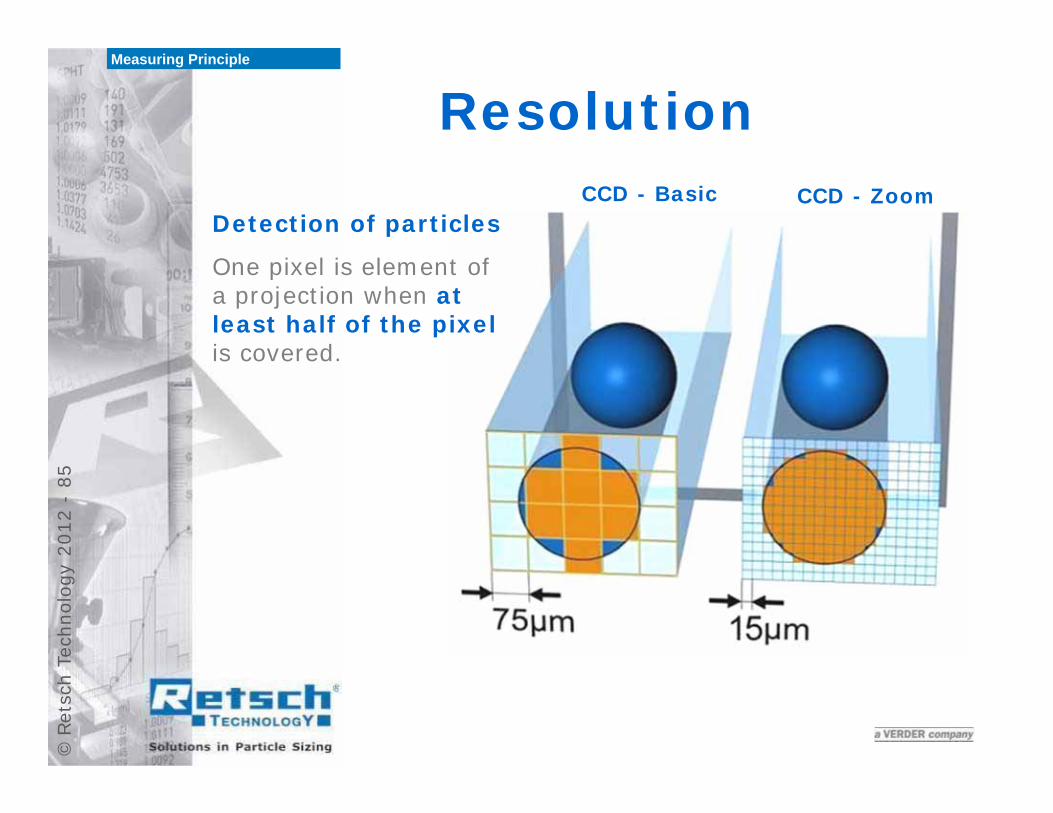
CCD - Basic CCD - Zoom
Measuring Principle
Detection of particles
One pixel is element of a projection when at least half of the pixelis covered.
Resolution
©Re
tsch
Tec
hnol
ogy
2012
-86
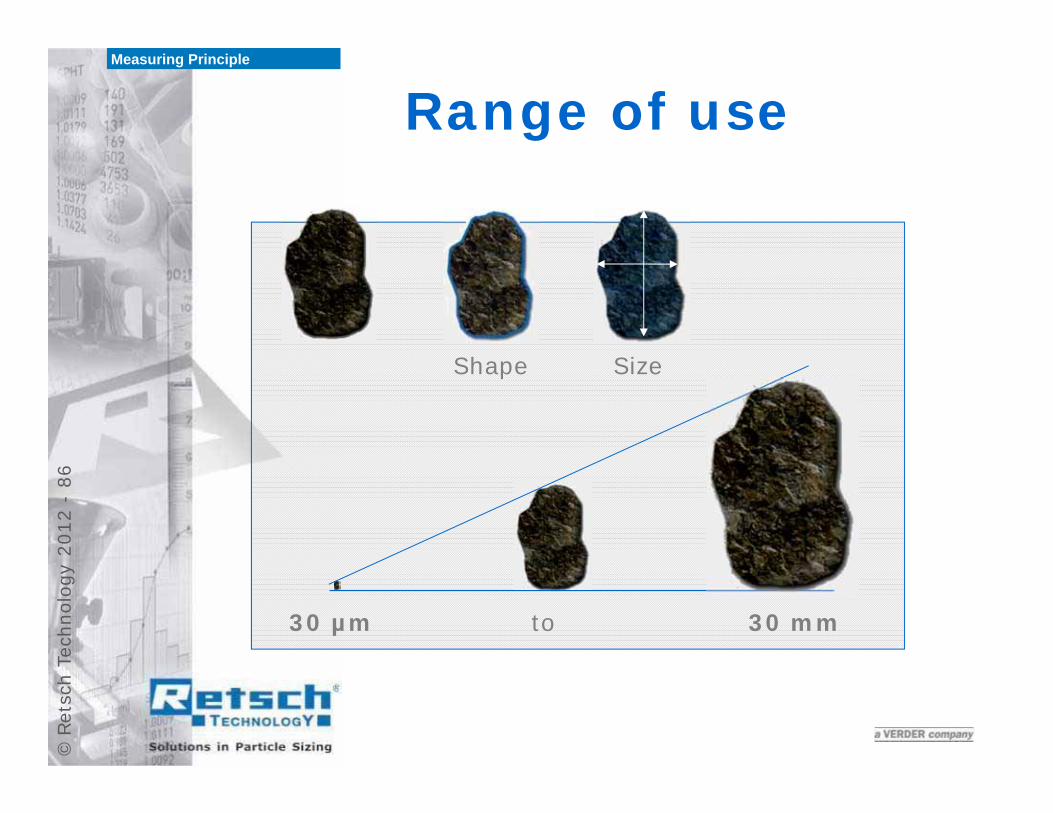
Range of useMeasuring Principle
30 µm to 30 mm
Shape Size
©Re
tsch
Tec
hnol
ogy
2012
-87
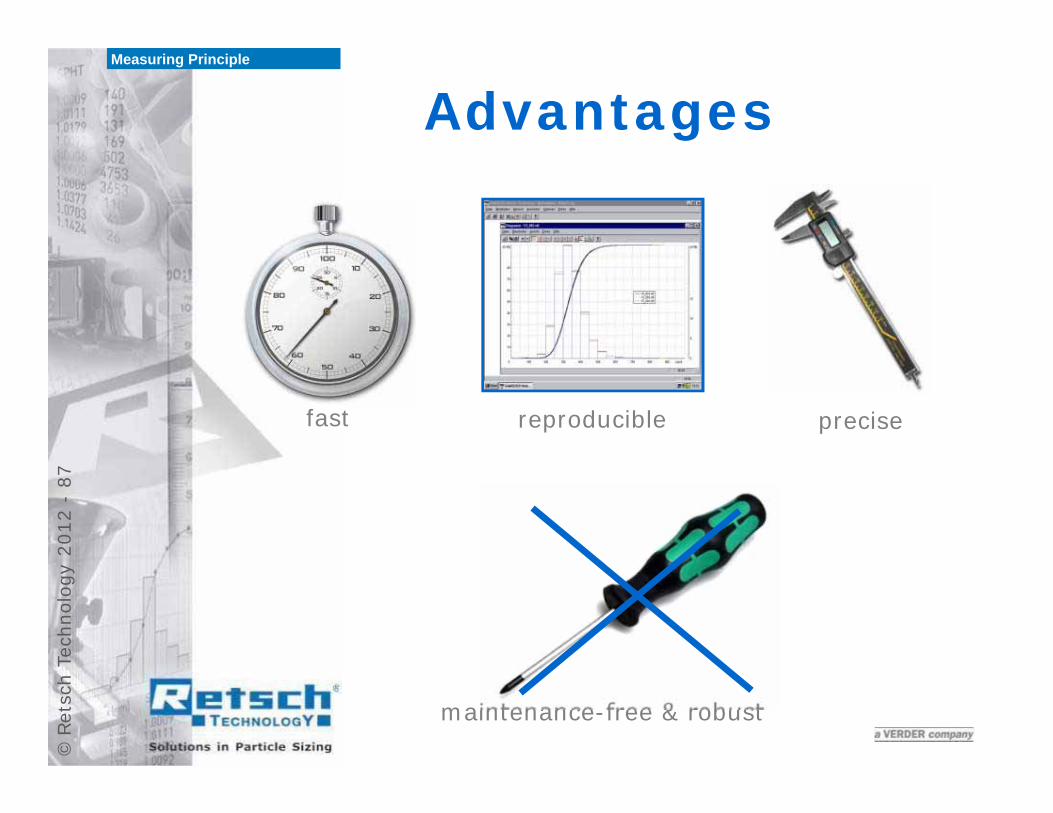
Advantages
fast reproducible
Measuring Principle
maintenance-free & robust
precise
©Re
tsch
Tec
hnol
ogy
2012
-88
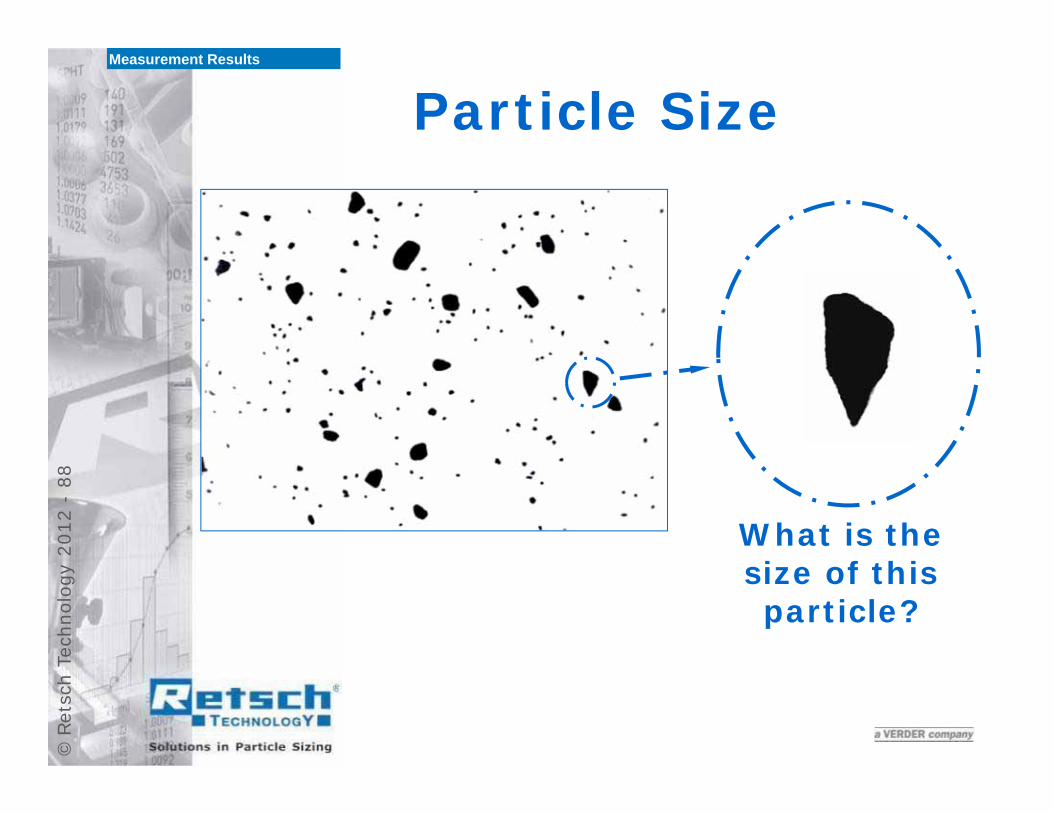
What is the size of this particle?
Measurement Results
Particle Size
©Re
tsch
Tec
hnol
ogy
2012
-89
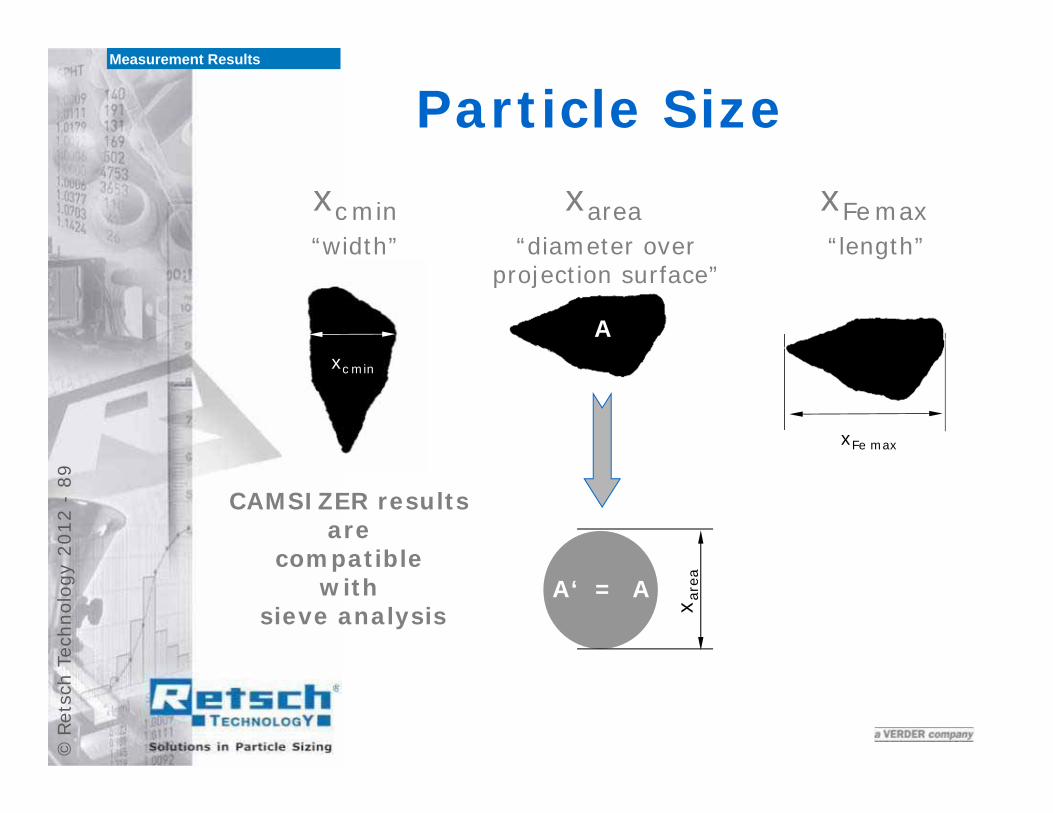
Particle SizeMeasurement Results
xcmin
xc min
“width”
A
A‘ = A
x are
a
“diameter overprojection surface”
xarea“length”
xFe max
xFemax
CAMSIZER results are
compatible with
sieve analysis
©Re
tsch
Tec
hnol
ogy
2012
-90
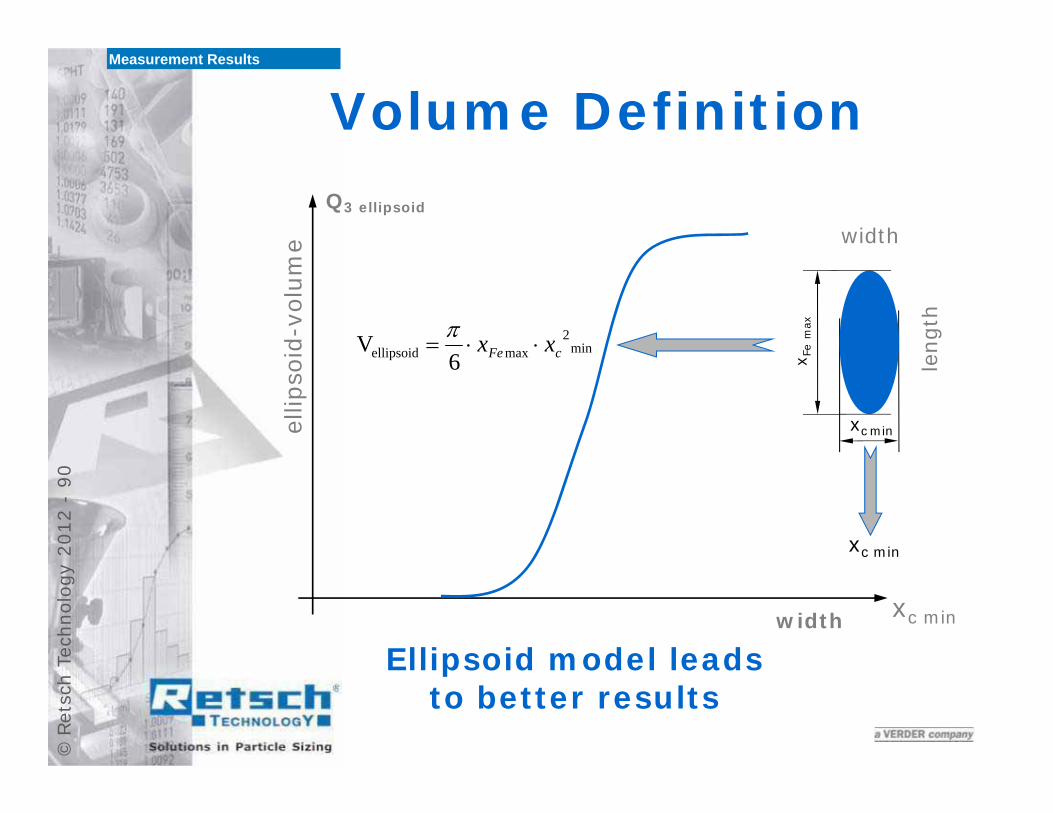
xc min
width
xc min
xc min
leng
th
x Fe
max
Q3 ellipsoid
ellip
soid
-vol
ume
min2
maxellipsoid 6V cFe xx
width
Ellipsoid model leads to better results
Measurement Results
Volume Definition
©Re
tsch
Tec
hnol
ogy
2012
-91
Additional Slides to betterexplain the Dispersion
Technology (against
static chargedparticles)
©Re
tsch
Tec
hnol
ogy
2012
-92
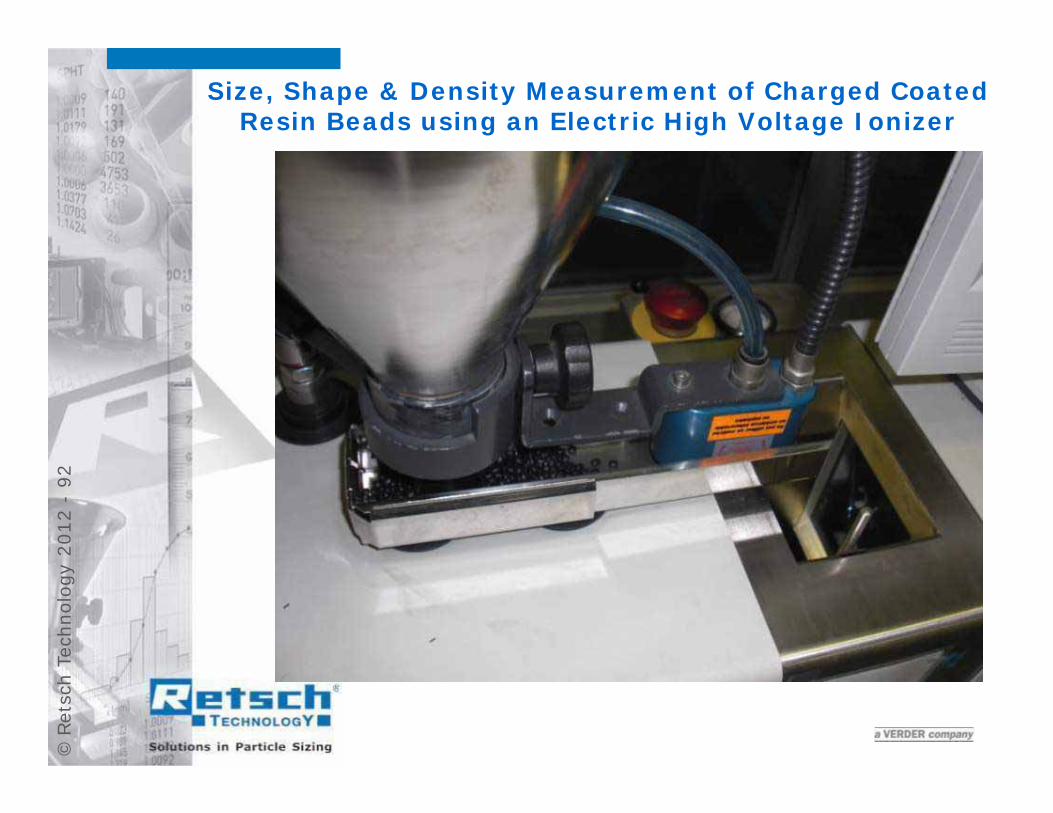
Size, Shape & Density Measurement of Charged Coated Resin Beads using an Electric High Voltage Ionizer
©Re
tsch
Tec
hnol
ogy
2012
-93
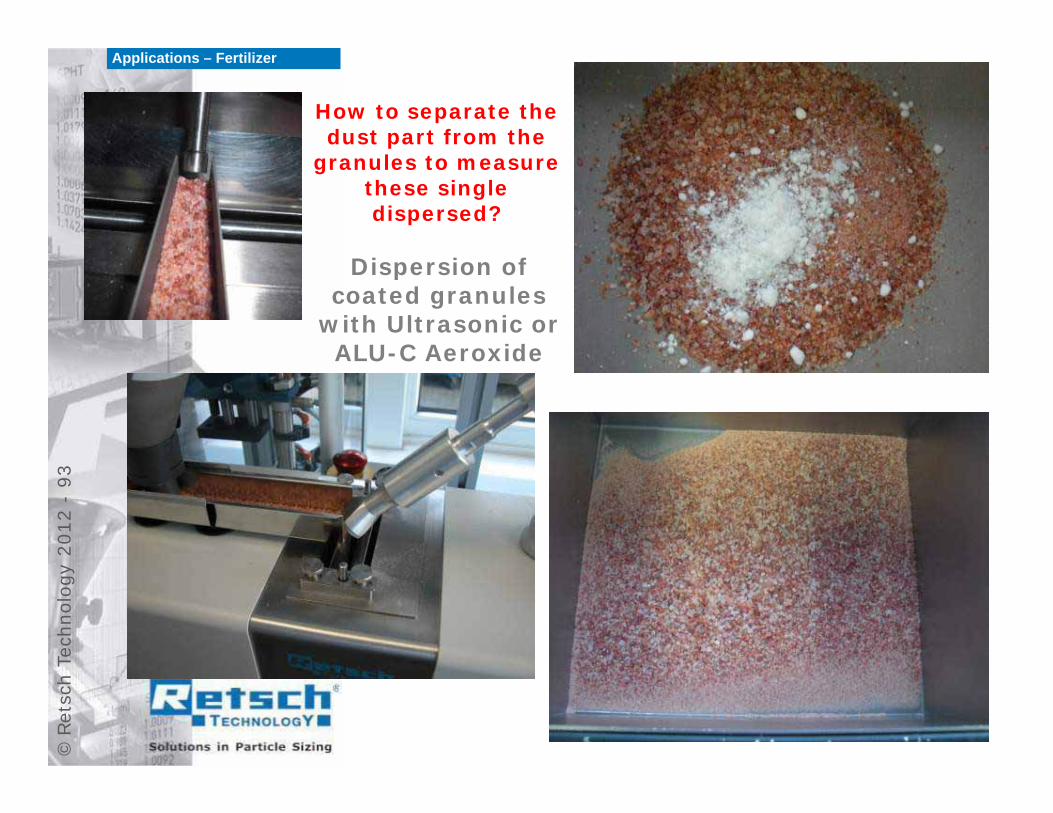
Dispersion ofcoated granules
with Ultrasonic orALU-C Aeroxide
How to separate thedust part from the
granules to measurethese singledispersed?
Applications – Fertilizer

©Re
tsch
Tec
hnol
ogy
2012
-94
©Re
tsch
Tec
hnol
ogy
2012
-95
Additional Slides to betterexplain the Basics of theused Parameters and the
Calibration of theInstrument
©Re
tsch
Tec
hnol
ogy
2012
-96
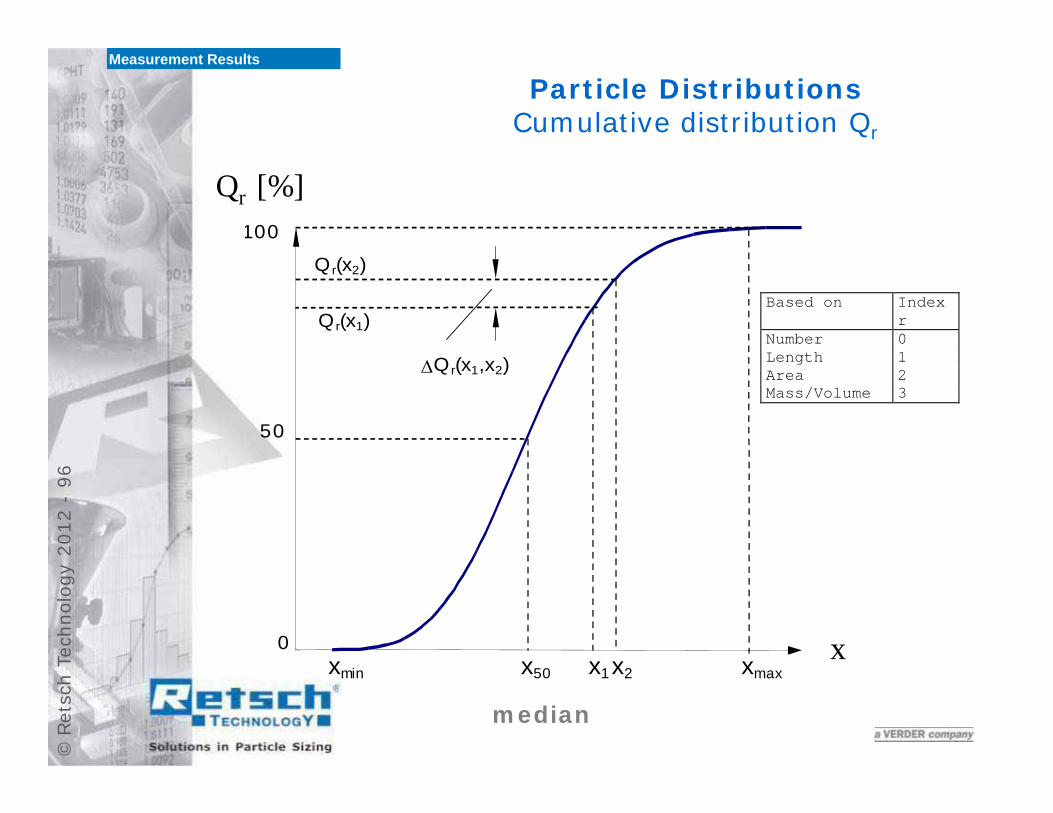
Particle DistributionsCumulative distribution Qr
Based on Index
r Number 0 Length 1 Area 2 Mass/Volume 3
x
Qr [%]
x50 x1x2 xmaxxmin
Qr(x2)
Qr(x1)
Qr(x1,x2)
0
50
100
Measurement Results
median
©Re
tsch
Tec
hnol
ogy
2012
-97
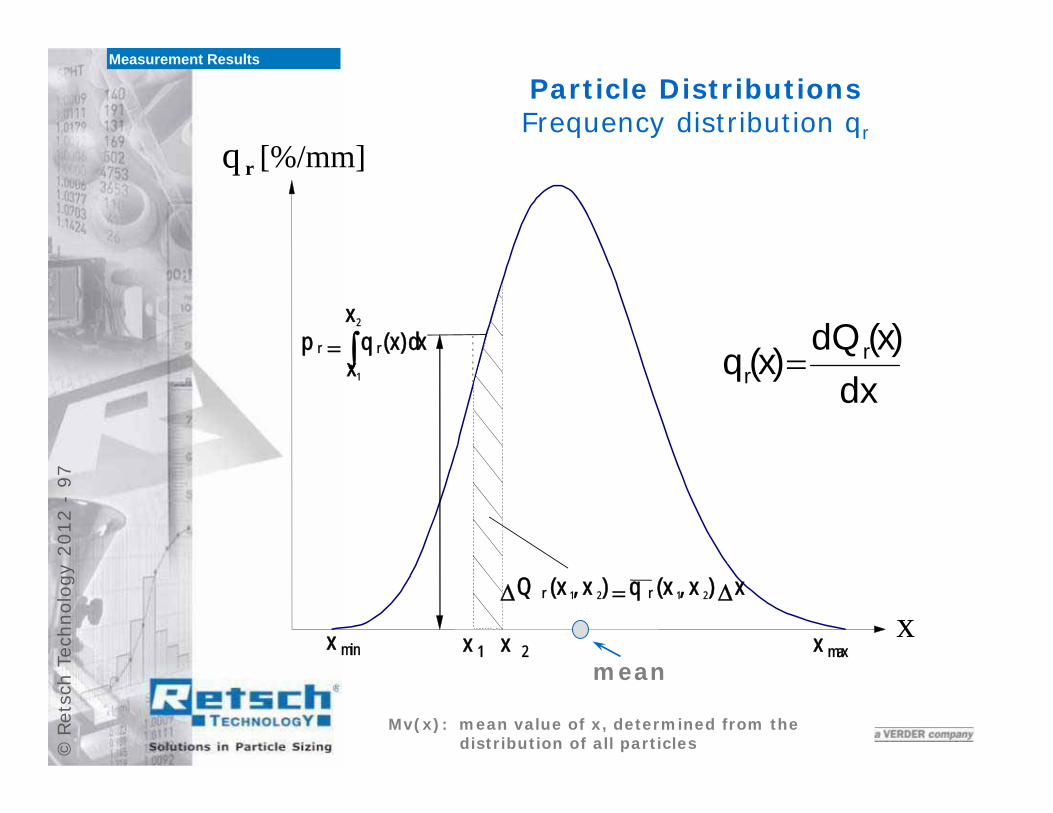
x
q r
x min
2
1
x
xdx)x(qp rr
x)x,x(q)x,x(Q 2121 rr
x 1 x 2 x max
dx)x(dQ
)x(q rr
[%/mm]
Particle DistributionsFrequency distribution qr
Measurement Results
mean
Mv(x): mean value of x, determined from the distribution of all particles
©Re
tsch
Tec
hnol
ogy
2012
-98
x [µm]400 600 800 1000 12000
5
10
15
20
25 p3 [%]
0
10
20
30
40
50
60
70
80
90
Q3 [%]
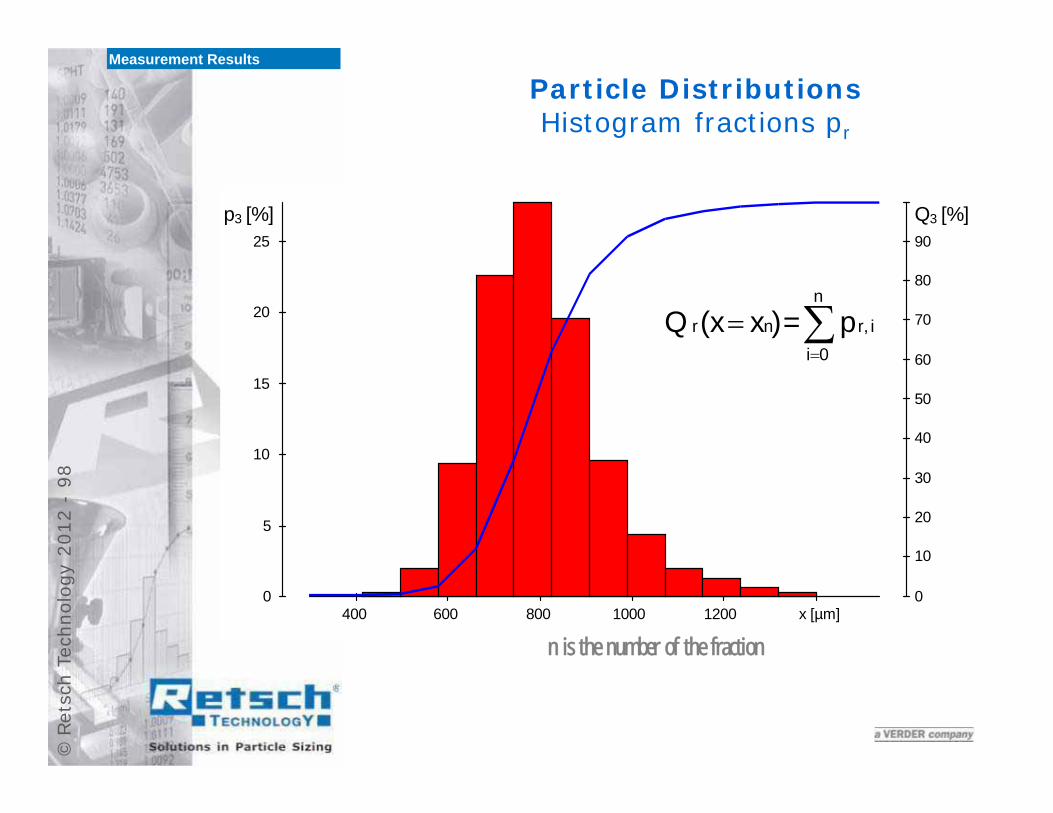
n
0iir,nr p = )x(xQ
n is the number of the fraction
Particle DistributionsHistogram fractions pr
Measurement Results
©Re
tsch
Tec
hnol
ogy
2012
-99
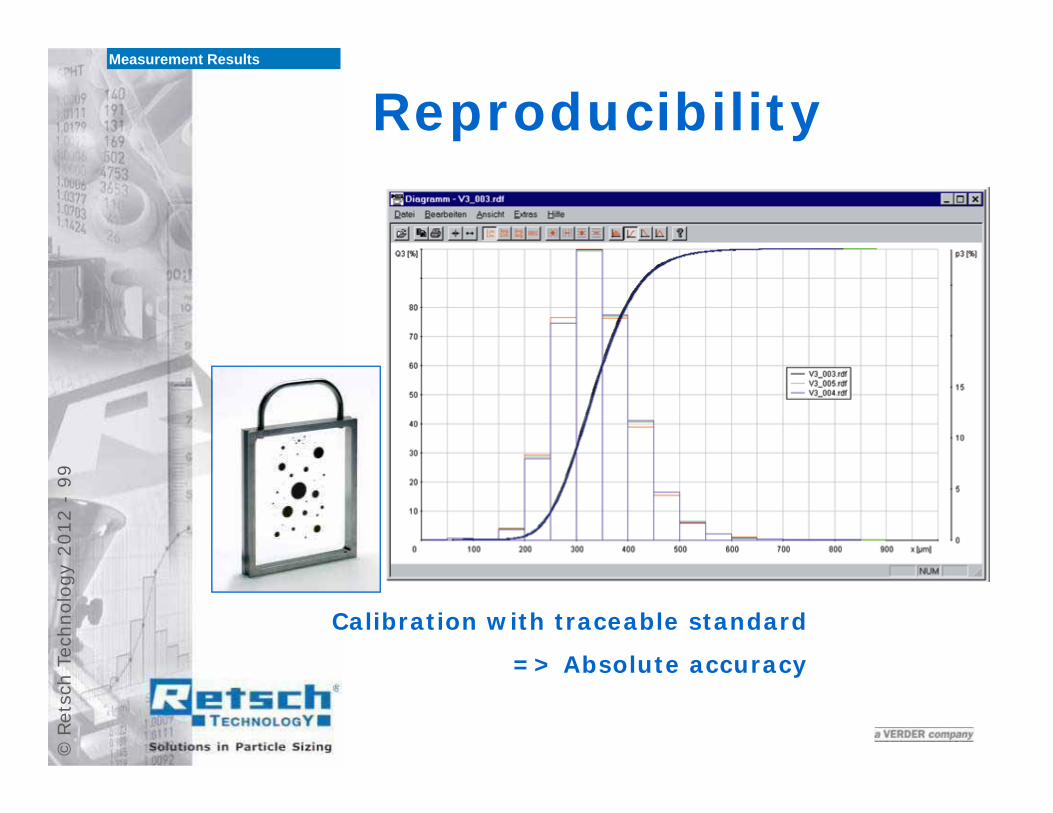
Reproducibility
Calibration with traceable standard
=> Absolute accuracy
Measurement Results
©Re
tsch
Tec
hnol
ogy
2012
-10
0
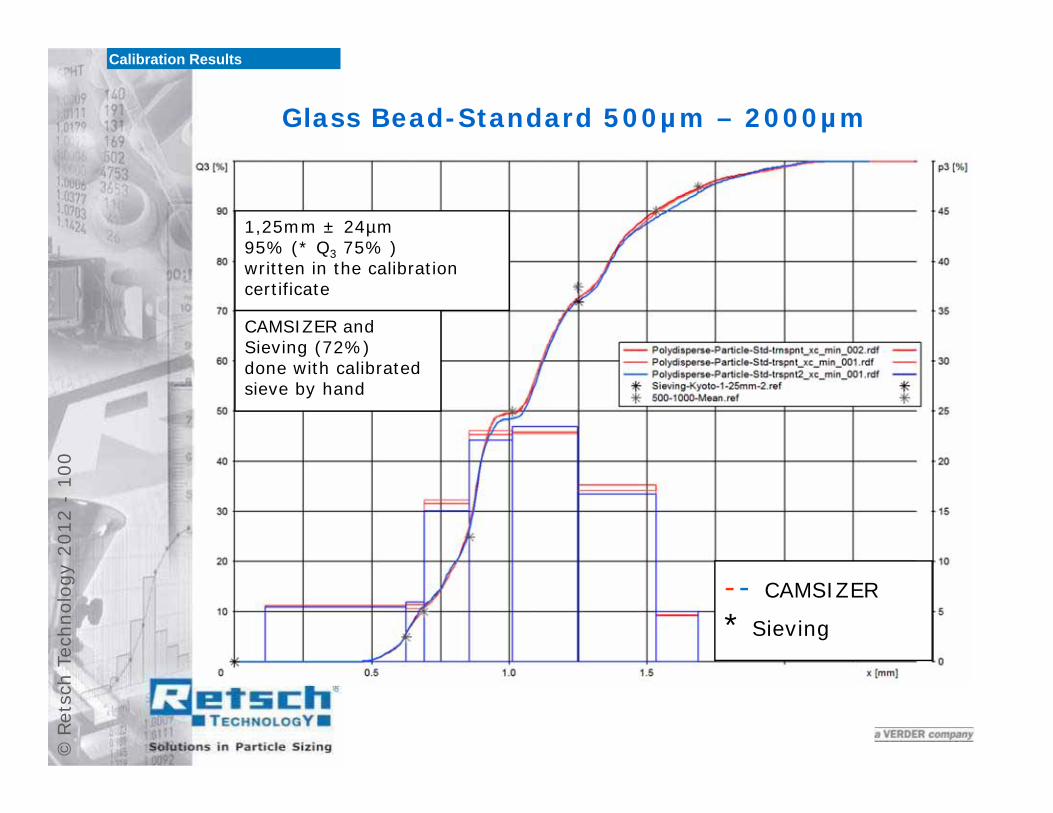
Glass Bead-Standard 500µm – 2000µm
1,25mm ± 24µm 95% (* Q3 75% )written in the calibration certificate
-- CAMSIZER
* Sieving
CAMSIZER and Sieving (72%)done with calibrated sieve by hand
Calibration Results
©Re
tsch
Tec
hnol
ogy
2012
-10
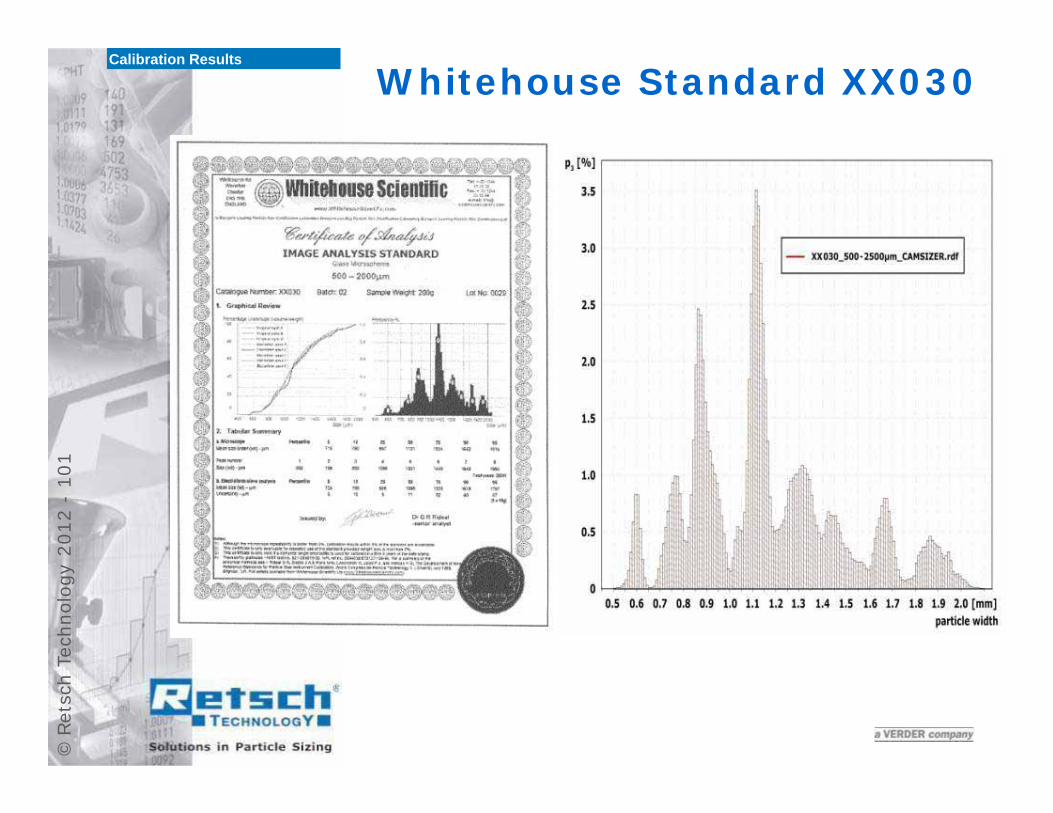
1Whitehouse Standard XX030
Calibration Results

©Re
tsch
Tec
hnol
ogy
2012
-10
2End
Thank you for your attention!


