
MECHANISMS OF DRUG-INDUCED OXIDATIVE STRESS IN THE HEPATOCYTE INFLAMMATION MODEL
By
Shahrzad Tafazoli
A thesis submitted in conformity with the requirements for the degree of Doctor of Philosophy
Graduate Department of Pharmaceutical Sciences University of Toronto
©Copyright by Shahrzad Tafazoli 2008

ii
Abstract Mechanisms of drug-induced oxidative stress in the hepatocyte inflammation model Doctor of Philosophy, 2008 Shahrzad Tafazoli Department of Pharmaceutical Sciences University of Toronto Drug induced idiosyncratic agranulocytosis has been attributed to oxidation by hypochlorite
formed by bone marrow myeloperoxidase (MPO). Idiosyncratic liver toxicity could also involve
drug oxidative activation by cytochrome P450 (in hepatocytes) or MPO (in Kupffer cells or
infiltrating neutrophil/macrophages). Such drug reactive metabolites could cause cytotoxicity or
release “danger signals” that attract immune cells which release H2O2 resulting from
nicotinamide adenine dinucleotide phosphate oxidase (NADPH oxidase) activation. In vivo
animal studies have shown that low level tissue inflammation markedly increased drug-induced
tissue toxicity which was prevented by immune cell inhibitors and increased by cell activators. It
is suggested that idiosyncratic drugs are much more toxic, taken during symptomless
inflammation periods. Furthermore, it is hypothesized that hepatocytes are much more
susceptible to some idiosyncratic drugs if they are exposed to hydrogen peroxide
(H2O2)/myeloperoxidase or cytokines released by inflammatory cells. A hepatocyte
inflammation model, in which hepatocytes were exposed to a non-toxic H2O2 generating system
and peroxidase, was found to be much more vulnerable to four idiosyncratic drugs e.g.,
troglitazone, isoniazid, hydralazine and amodiaquine. The molecular cytotoxic mechanisms for
this marked increase in cytotoxicity were investigated as follows: 1) A P450/H2O2-catalyzed
pathway not involving oxidative stress e.g., hydralazine and isoniazid; 2) A P450/H2O2-catalyzed
oxidative stress-mediated cytotoxic pathway e.g., hydrazine (an isoniazid metabolite) and

iii
hydralazine; and 3) A peroxidase/H2O2-catalyzed oxidative stress-mediated cytotoxic pathway
e.g,, hydralazine, amodiaquine and troglitazone. Before cytotoxicity ensued, GSH oxidation,
protein carbonyl formation and often lipid peroxidation occurred followed by a decrease in
mitochondrial membrane potential indicating that oxidative stress was the molecular mechanism
of cytotoxicity. In summary, a H2O2-enhanced hepatocyte system in the presence and absence of
peroxidase may prove useful for a more robust screening of drugs for assessing the enhanced
drug toxicity risk associated with taking drugs during periods of inflammation.

iv
Acknowledgments
I would like to dedicate this work with my heartfelt gratitude to my parents, Simin and Jahan
for their love and support. Their words of wisdom while they were miles away from me, in times
of stress and frustration, afforded me the enthusiasm to press forward. My special
acknowledgment and deepest thank you goes to my beloved husband Giuseppe for his constant
support and inspiration without which I would not have been able to write this dissertation.
I would like to express my sincerest gratitude to my supervisor, Dr. Peter J. O’Brien, for his
inspiring supervision and patient guidance throughout the course of my study and for leading me
into the world of life sciences. His broad knowledge and enthusiasm has set an example for me.
I would like to acknowledge Dr. W. Robert Bruce, Dr. A. Michael Rauth and Dr. Peter
Pennefather who have been an essential part of my advisory committee and their suggestions and
advice helped in shaping my research. Most notably, I would like to extend my gratitude to Dr.
Rauth for giving his time to meticulously appraise my thesis. I would like to thank Dr. Deborah
A. Nicoll-Griffith, my external appraiser, and Dr. David Riddick for taking the time to be part of
my defense committee.
My experience during my research in Dr. O’Brien’s laboratory was enhanced by many
stupendous people, without which completion of this dissertation would not have been possible. I
am indebted to all of them. Most notably, I would like to extend my thanks to Katie Chan and
Rhea Mehta whose support and thoughtfulness and above all, friendship helped make my
stressful research moments tolerable and my laboratory experience memorable. I will always
cherish our coffee breaks!
Thank you all for your support. Each of you has made a valuable contribution to this work.
In the end, though, maybe we must all give up just trying to pay back the people in this world
who sustain our lives:
“Maybe it is wise to surrender before the miraculous scope of human generosity and to just keep
saying thank you, forever and sincerely, for as long as we have voices.” –Elizabeth Gilbert

v
Table of Contents
Topic
Page Number
Abstract
ii
Acknowledgments
iv
List of Abbreviations
x
List of Tables
xiii
List of Figures and Schemes
xv
List of Publications Relevant to this Thesis
xviii
Chapter 1. General Introduction
1
1.1 Isolated hepatocytes in studying drug-induced hepatotoxicity
2
1.2 Accelerated cytotoxic mechanism screening (ACMS) with hepatocytes
3
1.3 Biochemistry of Reactive Oxygen Species (ROS)
5
1.4 Sources of ROS
6
1.4.1 Mitochondrial sources of ROS
7
1.4.2 Cytochrome P450 enzymes
7
1.4.3 Peroxisomes
8
1.4.4 Phagocytic NADPH oxidase
9
1.5 ROS detoxification
13
1.6 ROS-induced injury 16
1.6.1 Oxidative stress
16
1.6.2 Lipid peroxidation
16
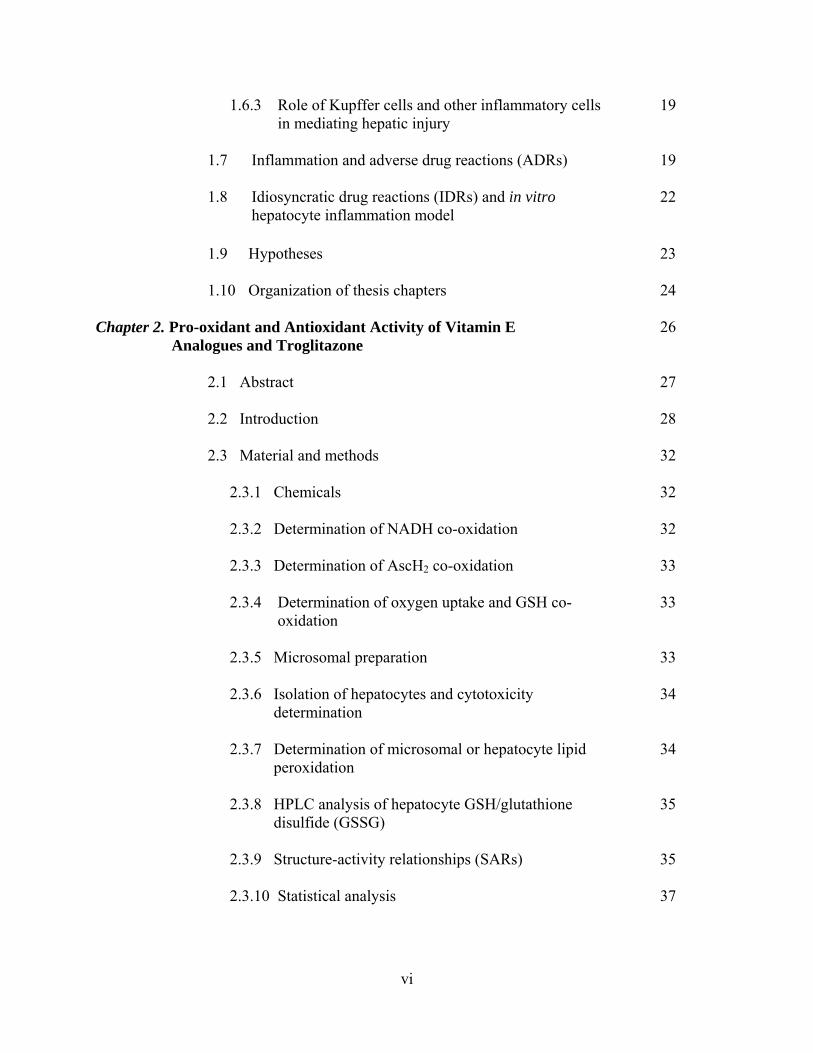
vi
1.6.3 Role of Kupffer cells and other inflammatory cells in mediating hepatic injury
19
1.7 Inflammation and adverse drug reactions (ADRs)
19
1.8 Idiosyncratic drug reactions (IDRs) and in vitro hepatocyte inflammation model
22
1.9 Hypotheses
23
1.10 Organization of thesis chapters
24
Chapter 2. Pro-oxidant and Antioxidant Activity of Vitamin E Analogues and Troglitazone
26
2.1 Abstract
27
2.2 Introduction
28
2.3 Material and methods
32
2.3.1 Chemicals
32
2.3.2 Determination of NADH co-oxidation
32
2.3.3 Determination of AscH2 co-oxidation
33
2.3.4 Determination of oxygen uptake and GSH co- oxidation
33
2.3.5 Microsomal preparation
33
2.3.6 Isolation of hepatocytes and cytotoxicity determination
34
2.3.7 Determination of microsomal or hepatocyte lipid peroxidation
34
2.3.8 HPLC analysis of hepatocyte GSH/glutathione disulfide (GSSG)
35
2.3.9 Structure-activity relationships (SARs)
35
2.3.10 Statistical analysis 37

vii
2.4 Results 38
2.5 Discussion 45
Chapter 3. Role of Hydrazine in Isoniazid-Induced Hepatotoxicity in a Hepatocyte Inflammation Model
51
3.1 Abstract 52
3.2 Introduction 53
3.3 Materials and methods 56
3.3.1 Chemicals 56
3.3.2 Animal treatment and hepatocyte preparation 56
3.3.3 Cell viability 57
3.3.4 H2O2 generating system 57
3.3.5 H2O2 measurement 57
3.3.6 Protein carbonylation assay 58
3.3.7 ROS formation 58
3.3.8 Mitochondrial membrane potential assay 59
3.3.9 Statistical analysis 59
3.4 Results 60
3.5 Discussion 70
Chapter 4. Accelerated Cytotoxic Mechanism Screening of Hydralazine Using an In Vitro Hepatocyte Inflammatory Cell Peroxidase Model
74
4.1 Abstract 75
4.2 Introduction 77
4.3 Material and methods 80

viii
4.3.1 Chemicals 80
4.3.2 Animal treatment and hepatocyte preparation 80
4.3.3 Cell viability 81
4.3.4 H2O2 generating system 81
4.3.5 Hepatocyte lipid peroxidation 81
4.3.6 Cellular GSH and oxidized glutathione (GSSG) content
82
4.3.7 H2O2 measurement 82
4.3.8 Protein carbonylation assay 82
4.3.9 Statistical analysis 83
4.4 Results 84
4.5 Discussion 97
Chapter 5. Amodiaquine-Induced Oxidative Stress in a Hepatocyte Inflammation Model
100
5.1 Abstract 101
5.2 Introduction 102
5.3 Material and methods 105
5.3.1 Chemicals 105
5.3.2 Animal treatment and hepatocyte preparation 105
5.3.3 Cell viability 106
5.3.4 Preparation of the enzyme-inhibited hepatocytes 106
5.3.5 H2O2 generating system
107
5.3.6 Cellular GSH and oxidized glutathione (GSSG) content
107

ix
5.3.7 H2O2 measurement 107
5.3.8 Protein carbonylation assay 108
5.3.9 Mitochondrial membrane potential assay 108
5.3.10 Statistical analysis 109
5.4 Results 110
5.5 Discussion 124
Chapter 6. General Conclusions and Summary 129
6.1 Hypotheses revisited 130
6.1.1 Hypothesis 1 130
6.1.2 Hypothesis 2 133
6.2 Future directions
137
6.2.1 An in vivo animal inflammation
137
6.2.2 Limitations and knowledge gaps
138
References
Apendices
141
160
Appendix I. List of Drugs that did not Form Cytotoxic Radicals in the Hepatocyte Inflammation Model
161
Appendix II. A Preliminary In Vivo Rat Study 164
Appendix III. The Cytotoxic Pathways of the Idiocyncratic Drugs Researched in the Thesis Chapters
170

x
List of Abbreviations
ACMS Accelerated cytotoxic mechanism screening (ACMS)
ADRs Adverse drug reactions
ALT Alanine aminotransferase
ANOVA Analysis of variance
AscH2 Ascorbate
AST Aspartate aminotransferase
ATP Adenosine triphosphate
BDE Bond dissociation energy
BHA Butylated hydroxyanisole
t-BHP tert-Butyl hydroperoxide
BNPP bis-p-Nitrophenyl phosphate
BSA Bovine serum albumin
CuZnSOD Copper/zinc superoxide dismutase
CYP Cytochrome P450
CYP1A2, CYP2C8 Cytochrome P450 1A2, Cytochrome P450 2C8
DCFH 2’,7’-Dichlorofluorescein
DCFH-DA 2’,7’-Dichlorofluorescein diacetate
DETAPAC Diethylenetriamine penta-acetic acid
DMSO Dimethylsulfoxide
DNA Deoxyribonucleic acid
DNFB 2′,4′-Dinitrofluorobenzene
DNPH 2’,4’-Dinitrophenylhydrazine
DTNB 5,5′-Dithiobis-(2-nitrobenzoic acid) (Ellman’s reagent)
ECSOD Extracellular superoxide dismutase
EHOMO Energy of the highest occupied molecular orbital
ELISA Enzyme-linked immunosorbent assay
EPR Electron paramagnetic resonance
ESR Electron spin resonance

xi
ER Endoplasmic reticulum
F Fischer value, An overall indicator of significance, where the greater the value corresponds to better regression.
FAD Flavin adenine dinucleotide
FMN Flavin mononucleotide
FOX 1 reagent Ferrous oxidation of xylenol orange
G Glucose
GI Gastrointestinal tract
GO Glucose oxidase
GPx Glutathione peroxidase
GSH Reduced glutathione
GSSG Glutathione disulfide (oxidized glutathione)
H2O2 Hydrogen peroxide
HEPES 4-(2-Hydroxyethyl)-1-piperazineethanesulfonic acid
HO2• Hydroperoxyl radical
HOCl Hypochlorous acid
HPLC High pressure liquid chromatography
HRP Horseradish peroxidase
IAA Indole-3-acetic acid
IDRs Idiosyncratic drug reactions
LD50/LC50 Dose/concentration of a chemical that produces 50% death of the population (e.g., cells) under study
Log P Logarithm of partition coefficient
Log LPO Logarithm of lipid peroxidation
LPS Lipopolysaccharide
MDA Malondialdehyde
MnSOD Manganese Superoxide Dismutase
MOPAC Molecular orbital package
MPO Myeloperoxidase
n Number of observations
NAD Oxidized nicotinamide adenine dinucleotide

xii
NADH Reduced nicotinamide adenine dinucleotide
NAD(P)H Reduced nicotinamide adenine dinucleotide phosphate
NQO NAD(P)H/quinone oxidoreductase
NSAIDs Nonsteroidal anti-inflammatory drugs
O2•− Superoxide anion
OH• Hydroxyl radical
p Probability, represents statistical significance
PhO• Phenoxyl radical
PhOH Phenolic compound
PHS Prostaglandin H synthase
PMC 2,2,5,7,8-Pentamethyl-6-hydroxychromane
PTU 6-n-propyl-thiouracil
PUFA Polyunsaturated fatty acids
PUFA• Lipid radical
PUFAOO• Lipid peroxy radical
R• Reactive free radical
r2 r-Squared, Statistical measure of how well a regression line approximates real data points; an r-squared of 1.0 (100%) indicates a perfect fit.
ROS Reactive oxygen species
s Standard error of the estimate
SARs Structure-activity relationships
SEM Standard error of mean
SOD Superoxide dismutase
TBARS Thiobarbituric acid reactive substances
TCA Trichloroacetic acid
TEMPOL 4-Hydroxy-2,2,6,6-tetramethylpiperidene-1-oxyl
TNB 2-Nitro-5-thiobenzoic acid
TNB2- 2-Nitro-5-thiobenzoic acid dianion
UQ•– Ubisemiquinone anion radical
UV Ultraviolet

xiii
List of Tables Tables
Page number
Chapter 2
Table 2.1 Physico-chemical parameters used to derive SAR for vitamin E analogues pro-oxidant and antioxidant activity
36
Table 2.2 Antioxidant activity of low concentrations of vitamin E analogues
38
Table 2.3 Pro-oxidant activity of vitamin E analogues
40
Table 2.4 Cytotoxic effects of vitamin E analogues pro-oxidant radicals
41
Table 2.5 QSAR models derived for vitamin E analogues pro-oxidant and antioxidant activity
42
Chapter 3
Table 3.1 Bioactivation of isoniazid in the hepatocyte inflammation model
62
Table 3.2 Contribution of hydrazine to isoniazid-induced toxicity in the hepatocyte inflammation model
65
Chapter 4
Table 4.1 Hydralazine-induced toxicity in the presence and absence of hepatocyte H2O2 oxidative stress model
85
Table 4.2 Oxidative stress induced by P450/H2O2-catalyzed hydralazine oxidation in the hepatocyte H2O2 oxidative stress model
87
Table 4.3 Hydralazine-induced toxicity in the peroxidase oxidative stress- enhanced model
92
Table 4.4 Oxidative stress induced by peroxidase/H2O2-catalyzed hydralazine oxidation in the hepatocyte peroxidase oxidative stress model
93
Chapter 5
Table 5.1 Amodiaquine-induced cytotoxicity in the hepatocyte inflammation model
118

xiv
Table 5.2 Oxidative stress induced by peroxidase/H2O2-catalyzed amodiaquine oxidation in the hepatocyte inflammation model
120
Appendix I
Table AI.1 List of the drugs that did not form cytotoxic pro-oxidant radicals in the hepatocyte inflammation model
162

xv
List of Figures
Figures
Page number
Chapter 1
Figure 1.1 Structure of neutrophil NAD(P)H oxidase
10
Figure 1.2 Endogenous and exogenous sources of ROS production
12
Figure 1.3 Pathways of ROS production and clearance
15
Figure 1.4 Schematic diagram of the process of lipid peroxidation
18
Chapter 2
Figure 2.1 Structures of the vitamin E analogues used
31
Figure 2.2a Calculated versus experimental log LPO values (antioxidant activity) for hepatocytes treated with vitamin E analogues
43
Figure 2.2b Calculated versus experimental log LPO values (pro-oxidant activity) for hepatocytes treated with vitamin E analogues
44
Chapter 3
Figure 3. 1 Isoniazid-induced cytotoxicity towards isolated rat hepatocytes
60
Figure 3.2 Hydrazine-induced cytotoxicity towards isolated rat hepatocytes
63
Figure 3.3 Hydrazine-induced toxicity in the hepatocyte inflammation model involves lysosomal labilization and mitochondrial toxicity
67
Figure 3.4 Prevention of hydrazine-induced mitochondrial membrane collapse by lysosomotropic agents, iron chelators and protease inhibitors
69
Chapter 4
Figure 4.1a Hepatocyte GSH depletion by hydralazine/H2O2 generating system
89
Figure 4.1b Hepatocyte GSSG formation by hydralazine/H2O2 generating system
90

xvi
Figure 4.2a Hepatocyte GSH oxidation by hydralazine/H2O2 generating system + peroxidase.
95
Figure 4.2b Hepatocyte GSSG formation by peroxidase catalyzed hydralazine oxidation
96
Chapter 5
Figure 5.1 Dose response of amodiaquine-induced cytotoxicity towards isolated rat hepatocytes
111
Figure 5.2 Modulating amodiaquine-induced cytotoxicity by chelators, NQO or glucuronidation inhibitors and GSH depletion
113
Figure 5.3 Modulating amodiaquine-induced mitochondrial membrane potential collapse by NQO or glucuronidation inhibitors and GSH depletion
115
Figure 5.4 Modulating amodiaquine-induced protein carbonylation by NQO or glucuronidation inhibitors and GSH depletion
116
Figure 5.5a Hepatocyte GSH oxidation by amodiaquine catalyzed by H2O2
generating system/peroxidase
122
Figure 5.5b Hepatocyte GSSG formation by peroxidase catalyzed amodiaquine oxidation
123
Chapter 6 Figure 6.1 Schematic of drug-induced oxidative stress in the hepatocyte inflammation model Appendix I Figure AI.1 Structure of the drugs that did not form cytotoxic pro-oxidant radicals in the hepatocyte inflammation model Appendix II
136
163
Figure AII.1 Hydroperoxide oxidative stress increased hydrazine-induced hepatotoxicity in vivo (using ALT as a biomarker)
167
Figure AII.2 Hydroperoxide oxidative stress increased hydrazine-induced hepatotoxicity in vivo (using AST as a biomarker)
168
Figure AII.3 Effects of t-BHP and hydrazine co-treatment on hepatic levels of GSH (µg/mg protein)
169

xvii
Appendix III Figure AIII.1 Proposed troglitazone-induced toxicity in the hepatocyte inflammation model Figure AIII.2 Proposed mechanism of isoniazid cytotoxicity in the inflammation model: Role of hydrazine Figure AIII.3 Hydralazine-induced oxidative stress in the hepatocyte peroxidase inflammation model Figure AIII.4 Proposed mechanism of amodiaquine-induced cytotoxicity in the hepatocyte inflammation model
171
172
173
174
xviii
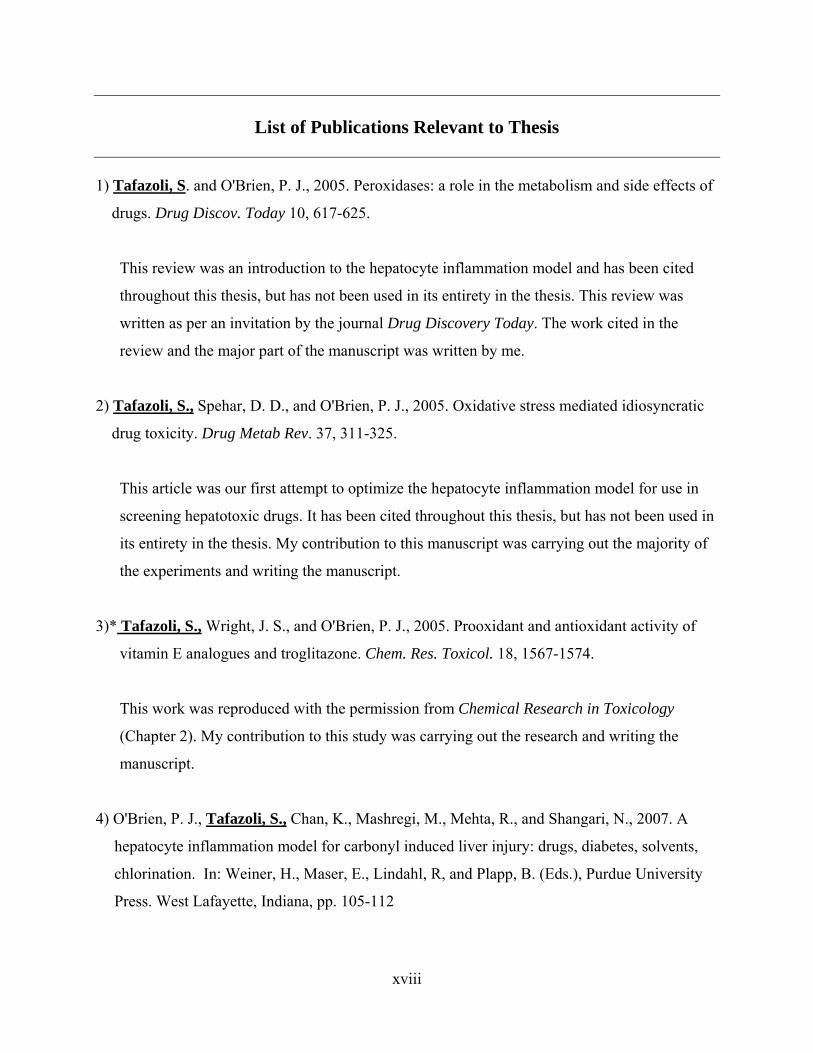
List of Publications Relevant to Thesis
1) Tafazoli, S. and O'Brien, P. J., 2005. Peroxidases: a role in the metabolism and side effects of
drugs. Drug Discov. Today 10, 617-625.
This review was an introduction to the hepatocyte inflammation model and has been cited
throughout this thesis, but has not been used in its entirety in the thesis. This review was
written as per an invitation by the journal Drug Discovery Today. The work cited in the
review and the major part of the manuscript was written by me.
2) Tafazoli, S., Spehar, D. D., and O'Brien, P. J., 2005. Oxidative stress mediated idiosyncratic
drug toxicity. Drug Metab Rev. 37, 311-325.
This article was our first attempt to optimize the hepatocyte inflammation model for use in
screening hepatotoxic drugs. It has been cited throughout this thesis, but has not been used in
its entirety in the thesis. My contribution to this manuscript was carrying out the majority of
the experiments and writing the manuscript.
3)* Tafazoli, S., Wright, J. S., and O'Brien, P. J., 2005. Prooxidant and antioxidant activity of
vitamin E analogues and troglitazone. Chem. Res. Toxicol. 18, 1567-1574.
This work was reproduced with the permission from Chemical Research in Toxicology
(Chapter 2). My contribution to this study was carrying out the research and writing the
manuscript.
4) O'Brien, P. J., Tafazoli, S., Chan, K., Mashregi, M., Mehta, R., and Shangari, N., 2007. A
hepatocyte inflammation model for carbonyl induced liver injury: drugs, diabetes, solvents,
chlorination. In: Weiner, H., Maser, E., Lindahl, R, and Plapp, B. (Eds.), Purdue University
Press. West Lafayette, Indiana, pp. 105-112

xix
This manuscript constitutes the study on some therapeutic drugs forming carbonyl
metabolites in the hepatocyte inflammation model. This review was written in combination
with an invited oral presentation given at the Enzymology and Molecular Biology of
Carbonyl Metabolism conference at Nashville, Indiana in July 2006. This manuscript has
been cited throughout this thesis, but has not been used in its entirety in the thesis. My
contribution to this manuscript was carrying out the experiments on alcohols in the
inflammation model and writing parts of the manuscript.
5)* Tafazoli, S., Mashregi, M., and O'Brien, P. J., 2008. Role of hydrazine in isoniazid-induced
hepatotoxicity in a hepatocyte inflammation model. Toxicol. Appl. Pharmacol. 229, 94-101.
This work was reproduced with the permission from Toxicology and Applied Pharmacology
(Chapter 3). My contribution to this study was carrying out the research, doing all the
analysis and writing the manuscript.
6)* Tafazoli, S. and O'Brien, P. J., 2008. Accelerated cytotoxic mechanism screening of
hydralazine using an in vitro hepatocyte inflammatory cell peroxidase model. Chem. Res.
Toxicol. 21, 904-910.
This work was reproduced with the permission from Chemical Research in Toxicology
(Chapter 4). My contribution to this study was carrying out the research, doing all the
analysis and writing the manuscript.
7) *Tafazoli, S. and O'Brien, P. J., Amodiaquine-induced oxidative stress in a hepatocyte
inflammation model. Submitted to Toxicology.
My contribution to this study was carrying out the research, doing all the analysis and writing
the manuscript (Chapter 5).
* References that are used as Chapters in the thesis.

1
Chapter 1
General Introduction

2
This introduction covers four major topics. The first part introduces “Accelerated Cytotoxic
Mechanism Screening (ACMS)”, as a screening system to determine the molecular cytotoxic
mechanism of drugs or xenobiotics when they are incubated with freshly isolated hepatocytes
from Sprague-Dawley male rats. The second topic, deals with drug or xenobiotic-induced
reactive oxygen species (ROS), their sources of production within hepatocytes, the hepatocyte
defense mechanisms against ROS-mediated injuries and also ROS as mediators of oxidative
stress and lipid peroxidation. The theme of ROS-mediated oxidative stress is carried out
throughout all the chapters of the thesis. The third part of the introduction covers the role of
Kupffer cells and inflammation in mediating adverse drug reactions with a focus on idiosyncratic
drug reaction. This leads to the last part of the introduction which introduces the use of
hepatocytes in an in vitro inflammation model, which can be used as a tool for screening the
cytotoxic mechanism of some drugs known for idiosyncratic hepatotoxicity.
1.1 Isolated hepatocytes in studying drug-induced hepatotoxicity
The liver is the chief organ involved in the metabolism of xenobiotics. Xenobiotic compounds
are taken up by hepatocytes and metabolized to pharmacologically inactive, active or sometimes
toxic products. Liver parenchymal cells are richly endowed with drug-metabolizing enzymes
which are conveniently divided into two groups. Phase I reactions generally include oxidative,
reductive and hydrolytic processes. Oxidation is usually catalyzed by cytochrome P450-
dependent monooxygenases located in the endoplasmic reticulum (ER). Phase I reactions
provide the necessary functional group for Phase II reactions, which are generally conjugations
with sulfate or glucuronic acid (Guillouzo et al, 1993). The complexity of hepatic metabolic
processes makes it difficult to distinguish the primary effects of a compound. This explains why

3
many investigators have turned to simpler models than the whole animal for studying drug
metabolism and other liver functions. The most frequently used and simpler liver preparations
include isolated perfused organs, subcellular fractions and isolated hepatocytes.
Isolated hepatocytes and hepatocyte suspensions are a successful example of a cellular model
that is used routinely during the development of new drugs and in the investigation of metabolic
or toxic effects of xenobiotics (Castell et al, 2006; Davila and Morris, 1999; LeCluyse, 2001).
Primary hepatocytes represent a unique system since they are able to retain Phase I and II
enzyme activities, as well as the inducibility of Phase I and II enzymes by xenobiotics (Davila
and Morris, 1999).
1.2 Accelerated cytotoxic mechanism screening (ACMS) with hepatocytes
The accelerated cytotoxicity mechanism screening (ACMS) method determines the molecular
cytotoxic mechanisms of drugs or xenobiotics when incubated for 2 hours with freshly isolated
hepatocytes from Sprague-Dawley male rats. ACMS is useful for identifying the hepatocyte
metabolizing enzymes by comparing the effects of specific inhibitors of metabolizing enzymes in
modulating the loss of cell viability caused by the drug/xenobiotic being investigated. This
functionomic approach is useful for understanding the molecular cytotoxic mechanism, e.g., the
effects of metabolizing enzyme inhibitors or substrates on the loss of cell viability induced by the
drug/xenobiotic were investigated. The following procedures have been used:
1) Determine the concentration of drug/xenobiotics required to induce a 50% loss of membrane
integrity (LD50) of freshly isolated rat hepatocytes in 2 hrs using the trypan blue exclusion assay.
A major assumption with ACMS was that high dose/short time (in vitro) exposure simulates low
dose/long time (in vivo) exposure. With 24 halobenzenes, it was found that the relative LD50

4
concentration required to cause 50% cytotoxicity in 2 hrs determined with hepatocytes isolated
from phenobarbital-induced Sprague-Dawley rats correlated with hepatotoxicity in vivo at 24-54
h (Chan et al, 2007). Moreover, using these techniques the molecular hepatocytotoxic
mechanisms found in vitro for seven classes of xenobiotics/drugs were found to be similar to the
rat hepatotoxic mechanisms reported in vivo (O'Brien et al, 2004).
2) The effect on the cytotoxic effectiveness of xenobiotics by inhibiting or inducing
metabolizing enzymes which activate or detoxify the xenobiotic was then determined. In this
way, the major metabolic pathways and metabolizing enzymes of xenobiotics can be rapidly
identified. Although it is generally agreed that hepatocytes are the gold standard for hepatic drug
metabolism, ACMS techniques were used to show that the drug metabolic pathways at cytotoxic
drug concentrations in vitro in 2 hrs were similar to those that occur in vivo in 24-36 hrs (Chan et
al, 2007; O'Brien et al, 2004).
3) The hepatocyte molecular cytotoxic mechanism of xenobiotics is determined by following
the changes in bioenergetics (ATP, mitochondrial membrane potential, respiration, glycogen
depletion), oxidative stress (GSH/GSSG levels, lactate/pyruvate ratio, and ROS formation), and
electrophile stress (GSH conjugates, protein/DNA adducts). If oxidative stress caused the
cytotoxicity, then it should precede cytotoxicity and antioxidants, ROS scavengers or redox
therapy should prevent or delay the cytotoxicity. If not, then the oxidative stress likely occurred
as a secondary result of the cytotoxicity. If mitochondrial toxicity caused the cytotoxicity, then
glycolytic substrates should be protective and the membrane potential should be restored.

5
1.3 Biochemistry of Reactive Oxygen Species (ROS)
The term “free radical” describes a chemical species that has one or more unpaired
electrons. Oxygen readily reacts to form partially reduced species, which are generally short-
lived and highly reactive. Oxygen free radicals are products of many biological redox reactions.
ROS include radical species, such as 1) Superoxide anion (O2•–), formed through one electron
reduction of O2:
O2 + e−→ O2•−
2) Hydrogen peroxide (H2O2), which is the non radical oxidant (it has no unpaired electrons), is
formed by several metabolic reactions. For instance, the dismutation reaction of O2•−catalyzed by
superoxide dismutases (SOD), which has as an intermediate the hydroperoxyl radical (HO2•):
O2•− + H+ → HO2
•
2HO2•→ H2O2 + O2
3) The hydroxyl radical (OH•) that can be formed from either the superoxide anion (Haber-
Weiss reaction) or from H2O2:
O2•− + H2O2 → O2 + OH− + OH• (Haber-Weiss reaction)
Fe2+ + H2O2 → Fe3+ + OH− + OH• (Fenton reaction)
Although other transition metal ions are capable of catalyzing this reaction, the iron-catalyzed
Fenton reaction is now considered to be the major mechanism by which the highly reactive
6
hydroxyl radical is generated in biological systems (Liochev, 1999). OH• is, perhaps, the most
toxic from of oxygen as it is highly reactive; therefore it reacts indiscriminately at, or close to,
the site of its formation with most molecules that it encounters (Yu, 1994). This is why this
radical is unlikely to function as a signaling molecule, while both O2•− and H2O2, which are less
reactive and therefore longer-lived, are more appropriate for intra- and even extracellular
signaling (Bright and Porter, 1975; Saran et al, 2000).
In addition to H2O2, some non-radical species also ascribed to ROS, are hypochlorous acid
(HOCl), a powerful antimicrobial agent, fatty acid hydroperoxides and reactive aldehydes
(Halliwell and Gutteridge, 1985).
1.4 Sources of ROS
ROS can be derived from numerous sources in vivo. These include autooxidation,
photochemical and enzymatic reactions, and may involve both endogenous compounds and
various xenobiotics. For example, quinones can undergo redox cycling, generating large amounts
of ROS without themselves being degraded (O'Brien, 1991). Enzymatic sources include NADPH
oxidases located on the cell membrane of polymorphonuclear cells, macrophages and endothelial
cells (Babior, 2000) and cytochrome P450 (CYP)-dependent oxygenases (Coon et al, 1992). The
proteolytic conversion of xanthine dehydrogenase to xanthine oxidase during the ischemic period
provides another enzymatic source for both O2•– and H2O2 (Parks et al, 1988), and has been
proposed to mediate deleterious processes in vivo (Yokoyama et al, 1990). Other endogenous
and exogenous sources of ROS are described below.

7
1.4.1 Mitochondrial sources of ROS
Perhaps the most important in vivo source of ROS is the mitochondrion (Boveris and
Cadenas, 1975; Loschen et al, 1971). The mitochondrial electron transport chain contains several
redox centers, which may leak electrons to molecular oxygen, serving as the primary source for
O2•– production in most tissues (Ott et al, 2007). Mitochondrial electron transport generates O2
•–
as an inevitable by-product and primary ROS at two complexes, Complex I and III (Brand et al,
2004; Cadenas and Davies, 2000). There is growing evidence that most of the O2•– generated by
intact mammalian mitochondria in vitro is produced by Complex I (NADH-coenzyme Q). This
O2•– production occurs primarily on the matrix side of the inner mitochondrial membrane (de
Vries, 1986). Significant O2•– production in Complex I was observed with succinate in the
absence of endogenous Complex I substrates. This ROS formation was due to reversed electron
transfer (Kushnareva et al, 2002; Liu et al, 2002b) and was inhibited by rotenone, an inhibitor of
Complex I (Lambert and Brand, 2004a; Lambert and Brand, 2004b). Complex III contributed to
O2•– generation by auto-oxidation of the ubisemiquinone anion radical (UQ•–), in which one-
electron reduction of oxygen by UQ•– causes O2•– formation. Complex III releases O2
•– to both
sides of the inner membrane (Cadenas and Davies, 2000; Muller et al, 2004).
1.4.2 Cytochrome P450 enzymes
Another major source of ROS, especially in the liver, is a group of enzymes called the CYP
mixed function oxidases. These are membrane bound terminal oxidases present mainly in the
endoplasmic reticulum (ER) as components of a multi-enzyme system, which also includes the
flavin adenine dinucleotide/flavin mononucleotide (FAD/FMN)-containing NADPH-P450
reductase and cytochrome b5. They provide substrate oxidation reactions (oxidation,

8
peroxidation, and/or reduction in O2 and NADPH-dependent manner) of a structurally diverse
group of xenobiotics and endogenous substances (Ortiz de Montellano, 1995).
Active cytochromes (CYPs) produce ROS, namely O2•– and H2O2, that may arise in two
ways. The first possibility is the formation of ROS as intermediates in the CYP-mediated
catalytic cycle, where O2 is reduced instead of being added to the substrate (Jezek and Hlavata,
2005). The second possibility is that an electron can escape to O2 from flavins in the
NADPH:P450 reductase enzyme (Jezek and Hlavata, 2005). Therefore, CYPs should also be
considered as a significant source of ROS and intracellular signals, not only via participation in
metabolic pathways, but also via ROS-mediated signaling (Jezek and Hlavata, 2005).
1.4.3 Peroxisomes
Peroxisomes are subcellular, single, membrane-bound respirator organelles that are present in
virtually all eukaryotic cells, and carry out a wide range of essential functions, including β-
oxidation of fatty acids, biosynthesis of cholesterol, bile acids, and metabolism of ROS (van den
Bosch et al, 1992). Peroxisomes were characterized initially by the presence of several H2O2-
generating flavine oxidase, together with H2O2-degrading catalase (Singh, 1997). In contrast to
mitochondria, peroxisomal β-oxidation is not coupled with oxidative phosphorylation. Rather,
oxygen is stoichiometrically converted into H2O2, and peroxisomal oxidase activity has been
estimated to consume between 10-30% of the oxygen consumed by the liver (De Duve and
Baudhuin, 1966). Over 90% of oxygen consumed by mitochondrial cytochrome oxidase is
reduced by a 4e- reduction to form H2O with the rest forming O2•–. By contrast, the oxygen
consumed by peroxisomes is mostly converted to H2O2 and a relatively small amount to O2•–
with
no H2O formed (Singh, 1996). If catalase is not efficient then H2O2 may escape from

9
peroxisomes. The morphological and biochemical changes that occur during peroxisomal
proliferation are thought to result from such an increase in the synthesis of H2O2 with only a
small increase in H2O2 degradation by catalase (Singh, 1996). This process can happen under
various other conditions. For example, during aging, peroxisomal ROS increases, while its
catalase function may decrease, so that peroxisomes may become a source of cytosolic ROS
(Singh, 1996).
1.4.4 Phagocytic NADPH oxidase
Activated macrophages and neutrophils can produce large amounts of O2•–, H2O2 and its
derivatives via the phagocyte isoform of NADPH oxidase. The enzyme is a heme-containing
protein complex illustrated schematically in Figure1.1:

10
Figure 1.1 Structure of neutrophil NAD(P)H oxidase The enzyme consists of the membrane-bound cytochrome b558 complex comprising gp91phox and p22phox, the cytosolic proteins p47phox and p67phox, and a low-molecular weight G protein of the rac family (Droge, 2002; Griendling et al, 2000).
In an inflammatory response H2O2 is produced by activated macrophages at an estimated rate
of 2-6 × 10-14 mol.h-1 cell-1 and may reach a concentration of 10-100 µM in the vicinity of these
cells (Keisari et al, 1983; Nathan and Root, 1977). The massive production of antimicrobial ROS
in an inflammatory environment is called the “respiratory burst” and plays an important role as a
first line of defense against environmental pathogens. Phagocytic NADPH oxidase becomes
activated upon translocation of cytosolic p47phox, p67phox and a G protein of the rac family to the
membrane-bound cytochrome b558 complex. The cytochrome b558 complex carries a flavin-

11
adenine dinucleotide (FAD) and two heme prosthetic groups that catalyze the NADPH-
dependent reduction of O2 to from O2•–. The flavocytochrome b558 comprises two protein
subunits, the larger of the two is gp91phox and the smaller is referred to as p22phox (Griendling et
al, 2000; Lambeth et al, 2000; Shatwell and Segal, 1996). The physiological relevance of
NADPH oxidase as a defense enzyme is suggested by the observation that mice lacking the
NADPH oxidase components gp91phox or p47 phox exhibit reduced resistance to infection
(Dinauer et al, 1997). The activation of phagocytic NADPH oxidase can be induced by microbial
products such as bacterial lipopolysaccharide (LPS), lipoproteins, or by cytokines such as
interferon-γ or interleukin-1β (Bonizzi et al, 2000).
The combined activities of NADPH oxidase and myeloperoxidase (MPO), in phagocytes
leads to the production of hypochlorous acid (HClO), the strongest physiological oxidant and
antimicrobial agent (Hampton et al, 1998).
The major endogenous and exogenous sources of ROS have been summarized in Figure 1.2:

12
Figure 1.2 Endogenous and exogenous sources of ROS production ROS can be produced by both endogenous and exogenous sources. The endogenous sources of ROS are peroxisomes (the H2O2 detoxyfying process by catalase), mitochondrial electron transport chain, cytochrome P450 and inflammatory cells. The exogenous sources of ROS are radiation, and xenobiotics.
13
1.5 ROS detoxification
ROS have been implicated in a variety of pathologies, including cancer, atherosclerosis,
chronic inflammatory processes, and multiple neurodegenerative diseases (Droge, 2002). In
addition, they play a regulatory role in cellular metabolic processes by activation of various
enzymatic cascades as well as several transcription factors (Khan and Wilson, 1995). Free
radicals and reactive non-radical species derived from radicals exist in biological cells and
tissues at low but measurable concentrations (Halliwell and Gutteridge, 2002). Low levels of
ROS can modulate gene expression, growth factor and second messenger signaling during
cellular activation (Droge, 2002; Remacle et al, 1995). Their concentrations are determined by
the balance between their rates of production and clearance by various antioxidant compounds
and enzymes. Antioxidants have been defined as substances that are able, at relatively low
concentrations, to compete with other oxidizable substrates and thus, to significantly delay or
inhibit the oxidation of these substrates (Halliwell and Gutteridge, 1985). These substances are
divided into enzymatic and non-enzymatic antioxidants. This definition includes the following
enzymes:
1) Superoxide dismutase (SOD) is one of the body’s most important defense mechanisms
against free-radical damage. There are three forms of SOD: the manganese containing SOD
(MnSOD) which is located in the mitochondrial matrix and the more ubiquitous SOD, containing
copper and zinc (CuZnSOD) located in the cytosol, the extracellular space and the mitochondtial
inner membrane (Fridovich, 1995). The third form and the so-called extracellular SOD
(ECSOD) is present on the surface of the cells and also contains a copper-zinc prosthetic group
(Fridovich, 1995). SOD catalyzes the dismutation of O2•− to form H2O2 as shown below:

14
2O2 + 2H+ H2O2 + O2SOD
2) Glutathione peroxidase (GPx) with six isoenzymes (GPx-1 - GPx-6), is a selenium-
dependent enzyme and is located in the cytoplasm and mitochondria (Lei et al, 2007). GPx-1 is
the most abundant selenoperoxidase and is ubiquitously expressed in almost all tissues (Cheng et
al, 1997; Cheng et al, 1998). All GPx isoenzymes use GSH to catalyze the reduction of H2O2 and
lipid hydroperoxides (Lei et al, 2007):
H2O2 + 2GSH GSSG + 2 H2OGPx
3) Catalase is a heme-containing enzyme located in peroxisomes which metabolizes H2O2 to
form water and oxygen, but unlike GPx cannot metabolize lipid peroxides (Singh, 1997).
2H2O2 2H2O + O2Catalase
The body is also equipped with numerous non-enzymatic endogenous antioxidants such as α-
tocopherol (vitamin E), β-carotene, ascorbate (vitamin C), and glutathione (GSH). GSH is an
endogenous tripeptide (glutamyl-cysteinyl-glycine) that serves as a cofactor for an enzyme called
glutathione-S-transferase, which catalyzes the enzymatic conjugation and biotransformation of
xenobiotics.
The schematic shown in Figure 1.3 summarizes pathways involved in ROS production and
detoxification:

15
Xenobiotics Free Radical Intermediate
GSHGSSGPHSP450
Quinone
Semiquinone
LPOPHSP450
Covalent Binding-DNA-Protein
O2
O2
H2O2
Quinone Reductase
SODH2O
GSH GSSG
GSH Peroxidase
GSH Reductase
NADP+ NADPH
G-6-P 6-PhosphogluconateG-6-P-Dehydrogenase
H2O
Catalase
Oxidative Damage-DNA-Protein-Lipids
Fe2+
Figure 1.3 Pathways of ROS production and clearance (modified from (Hayes and McLellan, 1999) LPO: lipoxygenases; PHS: prostaglandin H synthase; G-6-P: glucose-6-phosphate. Under normal conditions, ROS are cleared from the cell by the action of superoxide dismutase (SOD), catalase, or glutathione (GSH) peroxidase. The main damage to cells results from the ROS-induced alteration of macromolecules such as polyunsaturated fatty acids in membrane lipids, essential proteins, and DNA. Additionally, oxidative stress and ROS can originate from xenobiotic bioactivation by prostaglandin H synthases (PHSs) and lipoxygenases (LPOs) or microsomal P450s which can oxidize xenobiotics to free radical intermediates that react directly or indirectly with oxygen to produce reactive oxygen species and oxidative stress.
16
1.6 ROS-induced injury
1.6.1 Oxidative stress
Oxidative stress occurs when the concentration of ROS generated exceeds the antioxidant
capability of the cell. In other words, oxidative stress describes various deleterious processes
resulting from an imbalance between the excessive formation of ROS and limited antioxidant
defenses. Whilst small fluctuations in the steady-state concentration of these oxidants may
actually play a role in intracellular signaling (Droge, 2002), uncontrolled increases in the
concentration of these oxidants lead to free radical-mediated chain reactions which
indiscriminately target proteins (Stadtman and Levine, 2000), lipid (Rubbo et al, 1994) and DNA
(Richter et al, 1988). Oxidative stress plays an important role in many human diseases or
complications associated with atherosclerosis (Cook, 2006), diabetes mellitus (Brownlee, 2005),
Parkinson’s (Gandhi and Wood, 2005) and Alzheimer’s disease (Hajieva and Behl, 2006),
ischemia-reperfusion injury (Hayashi et al, 2004) and carcinogenesis (Valko et al, 2006).
1.6.2 Lipid peroxidation
Lipid peroxidation in tissues and in tissue fractions represents a degradation process which is
the consequence of the production and the propagation of free radical reactions primarily
involving membrane polyunsaturated fatty acids (PUFA) (Poli et al, 1987; Slater, 2008). Highly
reactive free radicals (R•) derived from some chemical agents are capable of abstracting
hydrogen atoms from PUFA on phospholipid membranes, resulting in the formation of a lipid
radical (PUFA•). Reaction with oxygen yields the corresponding peroxy radical (PUFAOO•) and
chain propagation ensues, leading ultimately to degradation of the lipid to a range of products

17
including aldehydes or gases such as ethane and pentane as shown in Figure 1.4 (Cheeseman,
2008).
The peroxidative breakdown of PUFA has been implicated in the pathogenesis of many types of
liver injury in which free radical intermediates are produced in excess of local defense
mechanisms. It involves hepatic damage induced by several toxic substances such as carbon
tetrachloride (Comporti et al, 1965), trichlorobromomethane (Slater, 2008), chloroform (Ekstrom
and Hogberg, 1980) and halothane (Tomasi et al, 1983).

18
R
RH
PUFA
PUFA
O2
PUFA
PUFAOOH + PUFA
Chain Propagation
Scission, fission or rearrangmentLipid degradation products
(e.g., aldehydes, ethane, pentane)
PUFAOO
Figure 1.4 Schematic diagram of the process of lipid peroxidation R•: reactive free radicals; RH: drug/xenobiotics; PUFA: polyunsaturated fatty acids; PUFA•: lipid radical; PUFAOO•: lipid peroxy radical R• derived form xenobiotics starts a chain reaction by abstracting hydrogen atoms from PUFA, which leads to the formation of PUFA• and its subsequent reaction with oxygen to yield the corresponding PUFAOO• and the chain propagation. This ultimatedly results in the degradation of lipid to a wide variety of products including aldehydes and gases such as ethane and pentane (Cheeseman, 2008).

19
1.6.3 Role of Kupffer cells and other inflammatory cells in mediating hepatic injury
The liver consists of the hepatic parenchyma and non-parenchymal cells including sinusoidal
endothelial cells, Ito cells, and the hepatic macrophages known as the Kupffer cells. The
sinusoidal endothelial cells and the sinusoidal space form a barrier, which serves to divide the
liver into functional compartments. Kupffer cells are able to traverse this barrier and are able to
pass in and out of the hepatic space facilitating their signaling functions (Roberts et al, 2007).
Central to this signaling role is the ability of Kupffer cells to respond to local changes by the
release of cytokines and other signaling molecules such as ROS. This activation appears to
modulate acute hepatocyte injury as well as chronic liver responses (Roberts et al, 2007).
Inhibition of Kupffer cell function or depletion of Kupffer cells appears to protect against liver
injury from the alkylating agent melphalan (Kresse et al, 2005), the mycotoxin fumonissin B1
(He et al, 2005), and the industrial chemical thioacetamide (Andres et al, 2003).
1.7 Inflammation and adverse drug reactions (ADRs)
Drugs have been estimated to account for one-third to one-half of acute liver failures. Of
these, about 80% of drug toxicities are predictable ADRs resulting from drug–drug interactions,
dosages too high for a susceptible patient, and direct toxicity by drug/metabolites or simple
pharmacokinetics for the susceptible patient.
Individual susceptibility plays an important role in determining whether or not a person
develops an untoward drug reaction. Among the potential determinants of susceptibility are age,
gender, co-existing disease, co-exposure to other xenobiotic agents, nutritional status, tissue
reserve capacity, and drug metabolism differences. In addition, recent evidence from
experimental models suggests that an episode of inflammation during drug treatment predisposes
20
animals to tissue injury (Buchweitz et al, 2002; Luyendyk et al, 2002). This raises the possibility
that the presence or absence of inflammation is another susceptibility factor for drug toxicity in
humans. This observation presents at least two challenges: The first challenge is to define the
role of inflammation in drug toxicity. The second challenge, is to develop models or methods to
predict which drugs or drug candidates have the potential to cause toxicity through interaction
with inflammation. This knowledge could allow identification of individuals who are susceptible
and a better understanding of the confluence of events required for this type of adverse response.
Inflammatory episodes are common in people and animals and are precipitated by numerous
stimuli such as bacteria, viruses and exposure to toxins produced by microorganisms. Moreover,
episodes of inflammation can be precipitated by the mammalian gastrointestinal (GI) tract. In
particular, endotoxin or its lipopolysacharide (LPS) component released from Gram- negative
bacteria can translocate across the intestinal mucosa into portal venous circulation (Roth et al,
1997). The cell walls of Gram-negative bacteria contain and release a biologically active
component of endotoxin. The rate of LPS translocation and magnitude of exposure can be
modulated by disturbance of the gastrointestinal tract or liver, dietary changes (e.g., protein-
deficient diets), alcohol consumption, surgical trauma and other conditions (Roth et al, 1997).
Before drug-induced liver injury occurs in vivo, an inflammatory response usually occurs and
cells other than hepatocytes (e.g., Kupffer cells) become activated. Immune cells (e.g.,
neutrophils and macrophages) also infiltrate the liver. Numerous studies with animals have
shown that a modest inflammatory response enhanced tissue susceptibility to xenobiotics.
Therefore, it was hypothesized that commonplace inflammation episodes during drug therapy
decreased the threshold for drug toxicity and, thereby, markedly increased the individual’s
susceptibility to some drugs (Roth et al, 1997). Kupffer cells, and resident liver macrophages

21
normally play a role in protecting hepatocytes from xenobiotics by phagocytozing incoming
particles and releasing cytoprotective cytokines (Roberts et al, 2007). Kupffer cell inhibitors,
e.g., gadolinium chloride, also prevented hepatotoxicity induced by some hepatotoxic drugs,
whereas Kupffer cell activators, e.g., retinol or LPS, markedly enhanced hepatotoxicity induced
by acetaminophen, allyl alcohol, diethyldithiocarbamate, halobenzenes, and CCl4 (Buchweitz et
al, 2002; Roth et al, 2003).
It is generally thought that most hepatotoxins are activated by oxidation catalysed by the
endoplasmic reticular (ER) mixed function oxidase activity consisting of hepatocyte P450,
NADPH, P450 reductase and oxygen. However, peroxidase and H2O2 can also oxidatively
activate some drugs. Whilst there is little peroxidase activity in hepatocytes, myeloperoxidase
was located by immunochemistry in Kupffer cells that are resident macrophages of the human
and rodent liver (Brown et al, 2001). Furthermore neutrophil infiltration of the liver in response
to inflammation can result in a 50 to 100-fold increase in hepatic myeloperoxidase activity (Kato
et al, 2000). Indeed, peroxidase activity is a useful marker for measuring neutrophil/macrophage
infiltration as well as the hepatic inflammatory response. Eosinophil infiltration (e.g., following
a parasite infection) can also cause a marked increase in liver eosinophil peroxidase activity
(Gharib et al, 1999). During the inflammatory response H2O2 was also formed by activation of
the NADPH oxidase in the infiltrated cells. It is therefore reasonable to suggest that the large
increase in drug liver susceptibility could also be attributed to peroxidase catalysed drug
oxidation to form reactive pro-oxidant radicals that are toxic to hepatocytes. Drug-induced tissue
toxicity is often preceded by infiltration of the tissues by neutrophils, e.g., indomethacin-induced
kidney toxicity. This results in a marked increase in hepatic oxygen radicals generated by

22
neutrophils and a sevenfold increase in hepatic myeloperoxidase activity (Basivireddy et al,
2004).
1.8 Idiosyncratic drug reactions (IDRs) and in vitro hepatocyte inflammation model
IDRs occur in less than 0.1% of the general population but account for approximately 14,000
deaths in North America annually. More than 75% of cases of IDRs result in liver transplantation
or death (Ostapowicz et al, 2002). IDRs appear to be independent of dose, and the onset of injury
varies relative to the onset of drug treatment. Each year new drugs have to be withdrawn from
the market or their use is severely restricted because they are found to be associated with a risk
of idiosyncratic toxicity.
There are two conventional hypotheses to explain IDRs. One is that the reactions occur as a
consequence of drug metabolism polymorphisms, which result in different levels of toxic drug
metabolites among patients (Williams and Park, 2003). The other one argues that they arise from
a specific immune response to a hapten formed by a drug or its metabolites (Pirmohamed et al,
2002). However, convincing evidence for this hypothesis is lacking for the majority of drugs
associated with idiosyncratic toxicity. It is equally plausible that other unrecognized events
render tissues susceptible to toxicity during drug therapy. Unfortunately, the mechanisms of
idiosyncratic reactions are poorly understood despite the large number of drugs associated with
these reactions. One of the most common targets of idiosyncratic drug toxicity is the liver.
In order to simulate the marked increase of drug-induced hepatotoxicity caused by
inflammation in vivo, and assess the potential in vivo hepatotoxicity risk of various drugs, we
used an in vitro hepatocyte screening system. In this system, glucose and glucose oxidase were
used for the continuous infusion of H2O2, in the absence and presence of horseradish peroxidase

23
(HRP). HRP was used to effect in situ activation of drugs and to simulate myeloperoxidase.
Although HRP and myeloperoxidase are not homologous in structure, the catalytically active
amino acid residues are positioned in a similar manner (Welinder, 1985) and the metabolites
produced are qualitatively similar (Eastmond et al, 1986). HRP belongs to the heme-containing
plant analogue peroxidases which contain an iron(III)protoporphyrin prosthetic group at their
catalytic site (O'Brien, 2000). The H2O2 acts by increasing the oxidation state of the ferric ion
which then oxidizes the peroxidase substrates. Furthermore, HRP is a mannose-terminated
glycoprotein (Clarke and Shannon, 1976), and is believed to be taken up by fluid-phase
endocytosis by hepatocytes (Scharschmidt et al, 1986; Straus, 1981).
Using this model, we were able to mimic the products formed by the inflammatory immune
cells and study the mechanism of inflammation-enhanced drug-induced cytotoxicity.
1.9 Hypotheses
Hypothesis 1: Drugs such as troglitazone, isoniazid, hydralazine and amodiaquine, developed
for chronic use, cause oxidative stress when oxidized by H2O2 or peroxidase/H2O2 to phenoxyl,
hydrazyl or semiquinone radicals. In the absence of peroxidase/H2O2, these drugs are much less
cytotoxic and the cytotoxicity mechanisms do not involve oxidative stress.
Hypothesis 2: Drugs or xenobiotic radicals can increase cell vulnerability to inflammation by
increasing H2O2 formation or by decreasing cellular resistance to H2O2.

24
1.10 Organization of thesis chapters
As discussed previously, a modest inflammatory response can enhance tissue sensitivity to a
variety of chemicals. These observations have led to the hypothesis that inflammation during
therapy may decrease the threshold for toxicity and render an individual susceptible to a reaction
that might not otherwise occur, or if it occurred might not be serious. To date there are no
predictive models to assess the potential of new drug candidates to cause idiosyncratic toxicities.
In the following chapters, the in vitro mechanism and toxicity of known idiosyncratic drugs
in a hepatocyte inflammation model were investigated, in order to correlate their clinical
toxicological profile with their in vitro metabolic and toxicological profile. Using this in vitro
hepatocyte screening method in Chapter 2, the antioxidant and pro-oxidant activities of 6 vitamin
E analogues (2,2,5,7,8-pentamethyl-6-hydroxychromane (PMC), Trolox C, α-tocopherol, γ-
tocopherol, δ-tocopherol) as well as the idiosyncratic drug, troglitazone were compared.
Troglitazone was first introduced to the market in 1997 for the treatment of insulin-resistant
diabetes. Shortly after its approval, reports of the liver toxicity were received, resulting in a black
box warning which ultimately led to the withdrawal of the drug in March 2000 (Gale, 2001).
In Chapter 3, attention is focused on the anti-tuberculosis drug, isoniazid, which was
associated with a high incidence of hepatic injury and received a black box warning in 1969
(Black et al, 1975). In the in vitro hepatocyte inflammation model, we assessed the involvement
of hydrazine, a major isoniazid metabolite, by studying the molecular mechanism of isoniazid-
induced cytotoxicity.
In Chapter 4, the cytotoxic mechanism of hydralazine, an antihypertensive drug, in the
hepatocyte inflammation model was investigated. Hydralazine long-term use has also been

25
associated with incidences of hepatitis and an autoimmune syndrome resembling systemic lupus
erythematosus (Cameron and Ramsay, 1984; Itoh et al, 1981).
In Chapter 5, the cytotoxic mechanisms of an antimalarial drug, amodiaquine, was
investigated. Amodiaquine use had been associated with life-threatening agranulocytosis and
hepatotoxicity in about 1 in 2000 patients (Rwagacondo et al, 2003).
Finally, in Chapter 6, a conclusion and summary highlights the findings of this thesis research
and identify H2O2, a cellular mediator of inflammation, with peroxidase as potential risk factors
for the manifestation of adverse drug reactions, especially the reactions associated with IDRs.

26
Chapter 2
Pro-oxidant and Antioxidant Activity of Vitamin E Analogues and Troglitazone
Shahrzad Tafazoli, James S. Wright and Peter J. O’Brien
Reproduced with permission from Chemical Research in Toxicology 2005, 18: 1567-1574.
Copyright 2005 American Chemical Society

27
2.1 Abstract
The order of antioxidant effectiveness of low concentrations of vitamin E analogues, in
preventing cumene hydroperoxide-induced hepatocyte lipid peroxidation and cytotoxicity, was
2,2,5,7,8-pentamethyl-6-hydroxychromane (PMC) > troglitazone > Trolox C > α-tocopherol > γ-
tocopherol > δ-tocopherol. However, vitamin E analogues, including troglitazone at higher
concentrations, induced microsomal lipid peroxidation when oxidized to phenoxyl radicals by
peroxidase/H2O2. Ascorbate or glutathione (GSH) was also co-oxidized, and GSH co-oxidation
by vitamin E analogues phenoxyl radicals was also accompanied by extensive oxygen uptake
and oxygen activation. When oxidized by non-toxic concentrations of peroxidase/H2O2, vitamin
E analogues except PMC also caused hepatocyte cytotoxicity, lipid peroxidation, and GSH
oxidation. The pro-oxidant order of vitamin E analogues in catalyzing hepatocyte cytotoxicity,
lipid peroxidation, and GSH oxidation was troglitazone > Trolox C > δ-tocopherol > γ-
tocopherol > α-tocopherol > PMC. A similar order of effectiveness was found for GSH co-
oxidation or microsomal lipid peroxidation but not for ascorbate co-oxidation. Except for
troglitazone, the toxic pro-oxidant activity of vitamin E analogues was therefore inversely
proportional to their antioxidant activity. The high troglitazone pro-oxidant activity could be a
contributing factor to its hepatotoxicity. We have also derived equations for three-parameter
structure-activity relationships (SARs), which described the correlation between antioxidant and
pro-oxidant activity of vitamin E analogues and their lipophilicity (log P), ionization potential
(EHOMO), and dipole moment.

28
2.2 Introduction
Phenolics are one of the major groups of nonessential dietary components that have been
associated with the inhibition of atherosclerosis and cancer (Decker, 1997). They are chemical
compounds characterized by at least one aromatic ring bearing one or more hydroxyl groups.
Tocopherols are a class of lipophilic, phenolic compounds of plant origin. The major tocopherol
found in mammalian tissue is α-tocopherol. Vitamin E (α-tocopherol) is the major lipid soluble
antioxidant of lipoproteins and biomembranes, and its antioxidant activity relies on its
effectiveness at donating hydrogen from the hydroxyl group of the chromanol ring to reactive
chain-propagating radicals, to yield a phenoxyl radical (PhO•). Electron spin resonance (ESR)
studies showed that PhO• oxidized ascorbate (AscH2) and other biomolecules to radicals
(Sharma and Buettner, 1993). However, under some specific conditions, the PhO• of vitamin E
exerted pro-oxidant activity, e.g., lipoprotein oxidation (Bowry et al, 1995). Furthermore, a
recent meta-analysis study of more than 135,000 participants in 19 published randomized,
controlled clinical trials has reported increased mortality among adult patients with chronic
diseases taking high dose vitamin E supplementation of ≥400 U/day for at least a year. The
pooled risk difference for high dosage vitamin E trials reported was 34 per 10,000 patients
(Miller et al, 2005).
Trolox C, a phenolic antioxidant originally designed for food preservation, has a chromane
structure similar to α-tocopherol but without the polyisoprenoid hydrophobic tail (Figure 2.1).
Trolox C is the most hydrophilic vitamin E analogue (Metodiewa et al, 1999) and has been
studied chemically for its stabilizing radical-trapping activity (Davies et al, 1988).
PMC (2,2,5,7,8-pentamethyl-6-hydroxy chromane) is a vitamin E analogue in which the
phytyl chain is replaced by a methyl group. PMC is less hydrophilic than Trolox C but is more

29
hydrophilic than other α-tocopherol derivatives and has potent radical scavenging activity
(Suzuki and Packer, 1993).
Troglitazone, a 2,4-thiazolidinedione with a chromane structure similar to α-tocopherol, was
introduced to the market in 1997 for the treatment of type II diabetes. However, approximately
1.9% of patients developed severe hepatic problems with elevated serum transaminase activities.
In some severe cases, troglitazone caused fulminant hepatic failures leading to death. Because of
numerous reports of liver failure including severe hepatotoxicity and idiosyncratic liver failure,
troglitazone was withdrawn from the market in 2002. However, the hepatotoxic mechanisms of
troglitazone are unknown (Smith, 2003).
Previously, we showed that phenols and dietary polyphenolics (flavonoids) with a phenolic B
ring were metabolized by peroxidase and catalytic amounts of H2O2 to form pro-oxidant PhO•,
which catalyzed the co-oxidation of AscH2, GSH, or reduced nicotinamide adenine dinucleotide
(NADH). Reactive oxygen species (ROS) were formed when GSH or NADH was co-oxidized
(Galati et al, 2002a; O'Brien, 1988). Electron paramagnetic resonance (EPR) studies were used
to show that etoposide, a phenolic anticancer drug, was oxidized by myeloperoxidase/H2O2 in
HL-60 cells to PhO•, which caused oxidative stress toxicity by oxidizing GSH and protein thiols
(not phospholipids) and enhancing etoposide-induced topoisomerase II-DNA covalent complex
formation (Kagan et al, 2001). The PhO• formed when HL-60 cells were incubated with phenol
caused oxidation of intracellular GSH, AscH2, and phospholipids (Ritov et al, 1996). However,
although PhO• formed from the vitamin E analogue PMC oxidized AscH2 to
semidehydroascorbate (Asc•-) radicals, intracellular GSH, protein thiols, and phospholipids were
not oxidized (Kagan et al, 2003).

30
Recently, we have shown that indole-acetic acid derivatives or NSAID drug-induced
cytotoxicity towards hepatocytes was markedly increased by non-cytotoxic concentrations of
peroxidase/H2O2 as a result of GSH oxidation and lipid peroxidation (Galati et al, 2002b;
Tafazoli and O'Brien, 2004). In this study, we have shown that in a cell-free system, vitamin E
analogues and particularly troglitazone but not PMC, when oxidized to PhO• by
peroxidase/H2O2, induced microsomal lipid peroxidation as well as GSH and AscH2 oxidation.
Furthermore, these vitamin E analogues also caused hepatocyte cytotoxicity and lipid
peroxidation and GSH oxidation when oxidized by non-toxic concentrations of peroxidase/H2O2.
The order of toxic effectiveness was troglitazone > Trolox C > δ-tocopherol > γ-tocopherol > α-
tocopherol > PMC. The order of antioxidant and cytoprotective activity of lower concentrations
of vitamin E analogues at preventing hepatocyte oxidative stress, however, was inversely related
to their pro-oxidant activity with the exception of troglitazone. However, troglitazone had the
most pro-oxidant activity, was the most toxic of the tocopherol analogues, but was also an
effective antioxidant.

31
CH2 CH2 S
NHO
OH
Troglitazone
O
CH3
HO
H3CCH3
CH3
CH3 CH3 CH3
α-Tocopherol
PMC
Trolox C
γ-Tocopherol
CH3
O
HO
H3CCH3
CH3 CH3CH3
O
CH3
HO
H3CCH3
CH3
COOH
O
CH3
HO
H3CCH3
CH3
CH3
O
CH3
HO
H3CCH3
CH3
CH3
CH3
δ-Tocopherol
O
HO
CH3
CH3 CH3CH3CH3
CH3
O
Figure 2.1 Structures of the vitamin E analogues used

32
2.3 Material and methods
2.3.1 Chemicals
α-Tocopherol, δ-tocopherol, PMC, Trolox C, glucose (G), glucose oxidase (GO), peroxidase
from horseradish [EC 1.11.1.7; donor, hydrogen peroxide oxidoreductase, horseradish
peroxidase (HRP)], hydrogen peroxide (H2O2), butylated hydroxyanisole (BHA), β-nicotinamide
adenine dinucleotide (reduced form, β-NADH), L-ascorbic acid, thiobarbituric acid,
trichloroacetic acid, 2,4-dinitrofluorobenzene, iodoacetic acid, glutathione (reduced form, GSH),
and cumene hydroperoxide were purchased from Sigma-Aldrich Canada (Oakville, Ontario).
Collagenase (from Clostridium histoloticum) and 4-(2-Hydroxyethyl)-1-
piperazineethanesulfonic acid (HEPES) were purchased from Boehringer-Mannheim (Montreal,
Canada). Troglitazone was purchased from Toronto Research Chemicals. γ-Tocopherol was
kindly provided by Dr. K. U. Ingold who received the material as a gift from Henkel Corporation
(Chicago, U.S.A).
2.3.2 Determination of NADH co-oxidation
To determine the rate of NADH co-oxidation by vitamin E analogue PhO•, the reaction
mixtures contained 1 mL of 0.1 M Tris-HCl buffer, pH 7.4 [containing 2 mM diethylenetriamine
penta-acetic acid (DETAPAC)], 10 µM vitamin E analogue, 100 µM NADH, 100 µM H2O2, and
0.01 µM HRP. The rate of NADH oxidation was then measured at 340 nm using a Pharmacia
Biotech Ultrospec 1000 (England).

33
2.3.3 Determination of AscH2 co-oxidation
To determine the rate of AscH2 co-oxidation by vitamin E analogue PhO•, the reaction
mixture contained 1 mL of 0.1 M Tris-HCl buffer, pH 7.4 (containing 2 mM DETAPAC), 10
µM vitamin E analogue, 50 µM AscH2, 50 µM H2O2, and 0.01 µM HRP. The rate of AscH2
oxidation was then measured at 266 nm using a Pharmacia Biotech Ultrospec 1000 (England).
2.3.4 Determination of oxygen uptake and GSH co-oxidation
Oxygen consumption was measured in a 2 mL reaction chamber using a Clarke type electrode
(Yellow Springs, U.S.A) at room temperature (20 °C). GSH (400 µM), H2O2 (100 µM), and
vitamin E analogue (100 µM) were added to the chamber containing 0.1 Tris-HCl buffer, pH 7.4
(containing 2 mM DETAPAC). The reaction was initiated by the addition of 0.1 µM peroxidase.
2.3.5 Microsomal preparation
Adult male Sprague-Dawley rats, 250-300 g, were anesthetized by sodium pentobarbital (60
mg/kg body). Livers were removed under sterile conditions and perfused with KCl solution
(1.18% w/v, 4 °C). Hepatic microsomes were prepared by differential centrifugation as
previously described (Dallner, 1978). The microsomal pellet was suspended and homogenized in
sterile potassium phosphate buffer:KCl solution [50 mM KH2PO4 and 0.23% (w/v) KCl, pH 7.4]
before storage at -70 °C. Microsomal protein was measured by the method of Joly et al. (Joly et
al, 1975). Care and treatment of the rats were in compliance with the guidelines of the Canadian
Council on Animal care, and the protocol was approved by the University of Toronto Animal
Care Committee.

34
2.3.6 Isolation of hepatocytes and cytotoxicity determination
Hepatocytes were obtained by collagenase perfusion of the liver of male Sprague-Dawley rats
Charles River Laboratories, Montréal, Canada) as described previously (Moldeus et al, 1978).
Approximately 85-90% of the hepatocytes excluded trypan blue. Cells were suspended at a
density of 106 cells/mL in round-bottomed flasks in a water bath maintained at 37 °C in Krebs-
Henseleit buffer, pH 7.4, and supplemented with 12.5 mM HEPES under an atmosphere of 95
O2:5% CO2. Cell viability was determined by measuring the exclusion of trypan blue (final
concentration 0.1% w/v). Hepatocytes were preincubated for 30 min prior to the addition of
chemicals. Stock solutions of chemicals were prepared fresh prior to use. Hepatocyte
cytotoxicity was determined by the trypan blue exclusion test (Moldeus et al, 1978) as the
percentage of cells that take up trypan blue at 2 h following the addition of the vitamin E
analogues to the hepatocytes.
2.3.7 Determination of microsomal or hepatocyte lipid peroxidation
Microsomal lipid peroxidation was determined by measuring the amount of thiobarbituric acid
reactive substances (TBARS) at 532 nm, formed during the decomposition of lipid
hydroperoxides using a Pharmacia Biotech Ultrospec 1000. Briefly, the reaction mixture
contained 1 mL of 0.1 M potassium phosphate buffer (containing 2 mM DETAPAC),
microsomes (1 mg/mL protein), 100 µM vitamin E derivative, 0.1 µM HRP, 0.5 U/mL glucose
oxidase, and 10 mM glucose. Glucose and glucose oxidase were added as a H2O2 generator
system. The test tubes containing the reaction mixture were then incubated at 37 °C in a water
bath with agitation. At different time points, each test tube was treated with 250 µl
trichloroacetic acid (70% w/v) and 1 mL thiobarbituric acid (0.8% w/v). The suspension was

35
then boiled for 20 min and read at 532 nm. Alternatively, hepatocyte lipid peroxidation was
measured by treating 1 mL aliquots of hepatocyte suspension (106 cell/mL) with trichloroacetic
acid (70% w/v) and thiobarbituric acid (0.8% w/v) as described (Smith et al, 1982).
2.3.8 HPLC analysis of hepatocyte GSH/glutathione disulfide (GSSG)
Hepatocyte GSH and GSSG contents were measured by HPLC analysis of deproteinized
samples (5% metaphosphoric acid), after derivatization with iodoacetic acid and 2,4-
dinitrofluorobenzene, by high-performance liquid chromatography (HPLC), using a C18µ
Bondapak NH2 column (Waters Associates, Mildford, MA, U.S.A) (Reed et al, 1980). GSH and
GSSG were used as external standards. A Waters 6000A solvent delivery system equipped with
a model 600 solvent programmer, a Wisp 710 automatic injector, and a Data Module were used
for analysis.
2.3.9 Structure-Activity Relationships (SAR)
SAR equations were derived using Hansch analysis (Hansch et al, 1968), which correlates
physicochemical parameters of the vitamin E analogues with their antioxidant and pro-oxidant
activities, measured as the amount of lipid peroxidation at 1 h when cells treated with 20 and 100
µM chemicals, respectively (Log lipid peroxidation (LPO) , mM). This type of analysis requires
that a congeneric class of compounds (i.e., compounds with a common substructure) be used in
derivation of the SAR equation. The analyses were carried out using log P (lipophilicity),
representing the octanol/water partition coefficient of the vitamin E analogues, ionization
potential (EHOMO), which is comparable to the ease of oxidation or redox potential of the
compound, as well as dipole moment. These parameters were derived using MOPAC 2002 in

36
BioMedCAche 6.1.1 (Fujitsu, U.S.A) after structures were optimized using PM3 Hamiltonian
parameters (Table 2.1). The statistical parameters used in the present study validating the SAR
equation are as follows: n, the number of observations on which the equation is based; r2,
correlation coefficient; s, standard error of the estimate; and p, statistical significance. The most
significant SAR equations are those that contained higher r2, F ratio, and p < 0.05.
Table 2.1 Physico-chemical parameters used to derive SAR for vitamin E analogues pro-oxidant and antioxidant activity
Vitamin E Analogues
EHOMO (eV)
Log P
Dipole Moment (D)
1
α-Tocopherol
-8.37
9.60
0.87
2 γ-Tocopherol -8.42 9.13
1.01
3 δ-Tocopherol -8.49 8.67
1.31
4 PMC -8.30 3.78
0.85
5 TroloxC -8.60 3.23
1.43
6 Troglitazone -8.49 4.87 1.90
EHOMO: ionization potential; log P: lipophilicity. These parameters were derived using MOPAC 2002 in BioMedCAche 6.1.1 (Fujitsu, U.S.A) after structures were optimized using PM3 Hamiltonian parameters.

37
2.3.10 Statistical analysis
Statistical significance of difference between control and treatment groups in these studies was
determined using one-way analysis of variance (ANOVA). Results represent the means ±
standard errors of mean (SEM) of triplicate samples. The minimal level of significance chosen
was p < 0.05.

38
2.4 Results
The pro-oxidant activity of the PhO• formed by the peroxidase-catalyzed oxidation of the
following vitamin E derivatives, α-tocopherol, γ-tocopherol, δ-tocopherol, PMC, troglitazone,
and Trolox C, has been compared. As shown in Table 2.2, vitamin E analogues at concentrations
as low as 20 µM inhibited cumene hydroperoxide-induced hepatocyte lipid peroxidation and
cytotoxicity. The order of antioxidant activity of vitamin E analogues was PMC > troglitazone >
Trolox C > α-tocopherol > γ-tocopherol > δ-tocopherol.
Table 2.2 Antioxidant activity of low concentrations of vitamin E analogues
Addition
Hepatocyte Lipid
peroxidation (µM)
Cytotoxicity
(%Trypan blue uptake)
Incubation time (min) 60 120 Control (only hepatocytes)
0.096 ± 0.005
20 ± 1
+ Cumene hydroperoxide 90 µM 1.89 ± 0.1 85 ± 4 + δ-Tocopherol 20 µM 1.54 ± 0.08 72 ± 5 + γ-Tocopherol 20 µM 1.35 ± 0.08* 55 ± 3* + α-Tocopherol 20 µM 1.12 ± 0.06* 50 ± 2* + Trolox C 20 µM 0.64 ± 0.05* 47 ± 2* + Troglitazone 20 µM 0.32 ± 0.02* 45 ± 1* + PMC 20 µM 0.21 ± 0.01*
33 ± 2*
The results shown represent the average of three separate experiments ± S.D. *p < 0.05 compared to cumene hydroperoxide-treated hepatocytes.
39
Vitamin E analogues contain the chromane ring of vitamin E, which can be oxidized to a PhO•
in the presence of a peroxidase/H2O2 system (Kagan et al, 2003). Previously, our laboratory
showed that the PhO• of other phenols co-oxidized GSH and AscH2 (Galati et al, 2002a; O'Brien,
1988). As shown in Table 2.3, addition of catalytic amounts of vitamin E analogues resulted in a
marked increase in the oxidation of GSH or AscH2 by peroxidase/H2O2 at pH 7.4. At pH 7.4,
AscH2 or GSH alone was slowly oxidized by HRP/H2O2. GSH oxidation but not AscH2 co-
oxidation was accompanied by extensive oxygen uptake (Table 2.3). H2O2 formed by GSH co-
oxidation contributed to the peroxidase reaction as only catalytic amounts of H2O2 were required
to oxidize GSH (results not shown). The order of effectiveness of vitamin E analogues in
catalyzing GSH or AscH2 co-oxidation was troglitazone > Trolox C > δ-tocopherol > γ-
tocopherol > α-tocopherol. PMC was best at catalyzing AscH2 oxidation and poorest at
catalyzing GSH oxidation. No NADH oxidation occurred with the vitamin E analogues in the
absence or presence of peroxidase/H2O2.
To assess whether the pro-oxidant activity of the PhO• of vitamin E analogues could result in
lipid peroxidation, rat microsomes were incubated with vitamin E analogues in the presence of
peroxidase and H2O2 (generated by glucose/glucose oxidase). As shown in Table 2.3, lipid
peroxidation was induced by vitamin E analogues at pH 7.4 and little lipid peroxidation occurred
in the absence of vitamin E analogues. No malondialdehyde formation was detected when
vitamin E derivatives were incubated with microsomes in the absence of glucose/glucose
oxidase/HRP system. The order of efficiency of vitamin E analogues in catalyzing microsomal
lipid peroxidation was troglitazone > Trolox C > δ-tocopherol > γ-tocopherol > α-tocopherol >
PMC.

40
Table 2.3 Pro-oxidant activity of vitamin E analogues
Addition
Ascorbate oxidation
(k x 103 min-1)
NADH
oxidation (k x 103 min-1)
Microsomal
Lipid Peroxidation
(µM)
60 min
GSH:O2
(µM min-1)
Control 62 ± 3 23 ± 1 0.16 ± 0.01 <2+ Troglitazone 713± 38* 24 ± 1 0.91 ± 0.06* 25 ± 1* + Trolox C 224± 11* 27 ± 1 0.74 ± 0.05* 23 ± 1* + δ-Tocopherol 125 ± 6* 26 ± 1 0.48 ± 0.05* 18 ± 1* + γ-Tocopherol 117 ± 5* 24 ± 1 0.39 ± 0.04* 15 ± 1* + α-Tocopherol 101 ± 5* 24 ± 1 0.31 ± 0.03* 12 ± 1* + PMC
762 ± 35* 26 ± 1 0.18 ± 0.01 7 ± 1*
The results shown represent the average of three separate experiments ± S.D. * p < 0.05 compared to control (buffer only)
As shown in Table 2.4, incubation of Trolox C, α-tocopherol, troglitazone, δ-tocopherol, or γ-
tocopherol with isolated rat hepatocytes in the presence of peroxidase/H2O2 system resulted in
cytotoxicity and lipid peroxidation. The antioxidant, BHA was cytoprotecitve and it also
prevented lipid peroxidation. However, PMC in the presence of peroxidase/H2O2 did not induce
lipid peroxidation and was not cytotoxic. The peroxidase/H2O2 system alone was not cytotoxic
and did not induce lipid peroxidation at the concentrations used. Trolox C, α-tocopherol, γ-
tocopherol, δ-tocopherol, and troglitazone but not PMC caused hepatocyte GSH depletion in the
peroxidase/H2O2 system, and GSH was oxidized to GSSG.

41
Table 2.4 Cytotoxic effects of vitamin E analogues pro-oxidant radicals
Addition
Cytotoxicity (% trypan
blue uptake)
Hepatocyte
Lipid Peroxidation (µM)
Hepatocyte
GSH and GSSG (nmol/106 cells)
GSH GSSG Incubation time (min) 120 60 60 Control (only hepatocytes)
21 ± 1
0.18 ± 0.01
52 ± 2
2 ± 1
+ H2O2 generating system + HRP 25 ± 1 0.24 ± 0.01 44 ± 2 8 ± 2 + Troglitazone 100 µM 35 ± 2 0.28 ± 0.01 47 ± 2 2 ± 1 + H2O2 generating system + HRP 63 ± 3* 0.64 ± 0.03* 21 ± 1* 21 ± 2* + Trolox C 100 µM 24 ± 1 0.22 ± 0.01 51 ± 3 3 ± 1 + H2O2 generating system + HRP 54 ± 3* 0.50 ± 0.02* 38 ± 2 18 ± 3*
+ BHA 50 µM 23 ± 1** 0.21 ± 0.01** 49 ± 2** 9 ± 1** + δ-Tocopherol 100 µM 26 ± 2 0.19 ± 0.01 50 ± 3 3 ± 1 + H2O2 generating system + HRP 59 ± 3* 0.42 ± 0.02* 33 ± 2* 16 ± 3*
+ γ-Tocopherol 100 µM 27 ± 2 0.17 ± 0.01 49 ± 2 3 ± 2 + H2O2 generating system + HRP 58 ± 3* 0.35 ± 0.02* 35 ± 2 15 ± 3* + α-Tocopherol 100 µM 24 ± 2 0.16 ± 0.01 50 ± 2 2 ± 1 + H2O2 generating system + HRP 47 ± 2* 0.29 ± 0.01 38 ± 1 12 ± 1 + PMC 100 µM 23 ± 1 0.19 ± 0.01 49 ± 2 2 ± 1 + H2O2 generating system + HRP 27 ± 2 0.21 ± 0.02 43 ± 1 7 ± 1
The results shown represent the average of three separate experiments ± S.D. * p < 0.05 compared to H2O2 generating system/HRP. ** p < 0.05 compared to vitamin E analogue + H2O2 generating system/HRP.

42
As shown in Table 2.5, we also derived three-parameter SAR equations (Eqs 1 and 2) to
describe the correlation between the antioxidant and the pro-oxidant activity of vitamin E
analogues and their lipophilicity (log P), ionization potential (EHOMO), and dipole moment.
Table 2.5 SAR models derived for vitamin E analogues pro-oxidant and antioxidant activity SAR equation
n
r2
r2adj.
s
F
p
Antioxidant activity (Eq. 1)
Log LPO (mM) = -22.693 – (2.642 * EHOMO) + (0.103 * Log P) – (0.372 * Dipole moment)
6
0.990
0.974
0.056
63.1
0.016
Pro-oxidant activity (Eq. 2)
Log LPO (mM) = -10.970 - (1.186 * EHOMO) + (0.0162 * Log P) + (0.403 * Dipole moment)
6
0.975
0.939
0.063
26.5
0.037
n: number of abservations; s: standard error of the estimate, which is the sum of squared differecens between observed and calculated values; r2: correlation coefficient; r2adj.: adjusted r2, which takes into account the number of independent variables used to derive the relationship; F: F-value, an overall indicator of significance; p: statistical signifiance
In Figure 2.2a, the experimental values for antioxidant activity of vitamin E analogues (Log
lipid peroxidation (Log LPO)) were plotted against the values calculated by Eq 1. Similarly,
Figure 2.2b shows the experimental Log LPO values for pro-oxidant activity of vitamin E
analogues verses their calculated values using Eq 2.

43
Figure 2.2a Calculated versus experimental log LPO values (antioxidant activity) for hepatocytes treated with vitamin E analogues The line represents Eq. (1): Log LPO (mM) = -22.693 – (2.642 * EHOMO) + (0.103 * Log P) – (0.372 * Dipole moment)

44
Figure 2.2b Calculated versus experimental log LPO values (pro-oxidant activity) for hepatocytes treated with vitamin E analogues The line represents Eq. (2): Log LPO (mM) = -10.970 - (1.186 * EHOMO) + (0.0162 * Log P) + (0.403 * Dipole moment)

45
2.5 Discussion
While there have been several studies comparing the antioxidant activity of tocopherol
analogues towards liposomes or phospholipids (Arai et al, 1995; Fukuzawa et al, 1982; Sheu et
al, 1999), this is the first report comparing the antioxidant activity of tocopherol analogues and
cytoprotective activity of tocopherol analogues toward freshly isolated intact cells undergoing
lipid peroxidation. The order of antioxidant and cytoprotective effectiveness toward isolated
hepatocytes found for tocopherol analogues was PMC > troglitazone > Trolox C > α-tocopherol
> γ-tocopherol > δ-tocopherol.
Other investigations have reported that the relative antioxidant activities of tocopherols
against the phosphatidylcholine liposomal membrane oxidation induced by Fe(II)-AscH2 were
α > β > γ > δ-tocopherols (Fukuzawa et al, 1982). Pretreatment of rats with α-tocopherol for 3
days, decreased hepatic necrosis induced by ischemia reperfusion (Marubayashi et al, 1986).
It was also shown that the α-tocopherol analogue, PMC, in which the phytyl chain is replaced
by a methyl group, was more hydrophilic (log P 4.6) than α-tocopherol (log P 12.1) but not
Trolox C (log P 3.2) (Kitazawa et al, 1997). PMC was also reported to have more potent radical
scavenging activity toward iron-induced lipid peroxidation in rat brain homogenates than α-
tocopherol (Sheu et al, 1999). An antioxidant order of effectiveness of PMC > α-tocopherol >
Trolox C was also reported for preventing phosphatidylcholine peroxidation catalyzed by iron or
lipoxygenase (Arai et al, 1995). However, Trolox C was found to be more effective than α-
tocopherol in preventing pro-oxidant cytotoxicity induced by ultraviolet (UV) irradiation, AscH2,
or gallic acid (Satoh et al, 1997).
46
PMC was also shown to be highly effective at preventing carbon tetrachloride-induced
hepatotoxicity in vivo (Hsiao et al, 2001). PMC, therefore, appears to be a promising therapeutic
alternative to α-tocopherol. The high lipophilicity of α-tocopherol and its relatively slow cellular
uptake (Ingold et al, 1987) severely limit its clinical usefulness, especially in emergency. Trolox
C was also more effective than α-tocopherol in protecting rat hearts ex vivo against global
ischaemia (Sagach et al, 2002).
Previously, we described evidence indicating that peroxidase enzymes catalyzed the one-
electron oxidation of phenolics, aniline compounds, NSAIDs, or indole-acetic acid (IAA)
derivatives by H2O2 to form highly reactive free radicals, which catalyzed the co-oxidation of
NADH, GSH and AscH2 resulting in ROS formation occurring during NADH or GSH co-
oxidation but not AscH2 (Galati et al, 2002b; Galati et al, 2002a; O'Brien, 1988; Tafazoli and
O'Brien, 2004). The results presented here showed that vitamin E analogues catalyzed the co-
oxidation of GSH and AscH2 but not NADH, and also resulted in hepatocyte cytotoxicity and
lipid peroxidation.
HRP/H2O2 also catalyzed the one-electron oxidation of PMC, Trolox C, and α-tocopherol
(Nakamura, 1991), and the rate constants for the rate-determining step, (i.e., peroxidase
compound II-catalyzed PhO• formation) decreased in the following order: PMC > Trolox C
>> α-tocopherol (Nakamura, 1991). This was similar to the order of effectiveness of these
vitamin E analogues for catalyzing AscH2 co-oxidation when oxidized by HRP/H2O2 (Table 2.2)
and could partly reflect their redox potential as EHOMO values for PMC, α-tocopherol, δ-
tocopherol, and γ-tocopherol have been reported as -8.31, -8.33, -8.35, and -8.39 (eV),
respectively (Lien et al, 1999). As we have also shown with the SAR Eq 1, the higher the EHOMO,
the better the antioxidant activity (Table 2.5).

47
The following equations explain the co-oxidation of AscH2 catalyzed by the PhO• of vitamin
E analogues. Peroxidase catalyzed a one-electron oxidation of phenolics (PhOH) to form PhO•
(Eq. (1)), which oxidized ascorbate (AscH2) to semidehydroascorbate radicals (Eq. (2)), which
then disproportionate to form dehydroascorbate and ascorbate (Eq.(3)).
The lack of NADH co-oxidation with vitamin E analogues, troglitazone, Trolox C, and PMC
in the peroxidase/H2O2 reaction system may be partly explained by the lower reactivity of the
vitamin E PhO• as a result of their lower one-electron redox potential of 110 mV (Aruoma et al,
1990), as compared to 282 mV for NAD•/NADH (Schafer and Buettner, 2001), whereas the one-
electron redox potential of phenolics, e.g., etoposide that catalyzes NADH co-oxidation, was in
the range of 250-600 mV (Galati et al, 2002a; O'Brien, 1988). However, in the cell reduced
nicotinamide adenine dinucleotide phosphate (NADPH):P450 reductase can catalyze NADPH
oxidation by PMC PhO• radicals (Goldman et al, 1997).
Microsomal lipid peroxidation was also induced by vitamin E analogues but not PMC in the
presence of peroxidase/H2O2, which can be attributed to the pro-oxidant activity of vitamin E
analogues PhO•. Hepatocyte lipid peroxidation was also induced by these vitamin E analogues
resulting in cytotoxicity as both cytotoxicity and lipid peroxidation were inhibited by the
antioxidant butylated hydroxylanisole (BHA). Other investigators also showed that low-density
PhOH + H2O2 PhO + H2O (1)
PhO + AscH2 PhOH + AscH (2)
AscH + AscH AscH2 + Asc (3)
Peroxidase

48
lipoprotein lipid peroxidation was also induced by α-tocopherol when oxidized by
myeloperoxidase/H2O2 (Kalyanaraman et al, 1995; Santanam and Parthasarathy, 1995).
GSH was also oxidized to GSSG when vitamin E analogues, Trolox C, α-tocopherol, γ-
tocopherol, δ-tocopherol, and troglitazone were incubated with peroxidase/H2O2. GSH co-
oxidation by the studied vitamin E analogues PhO• was also accompanied by extensive oxygen
uptake. Hepatocyte GSH was also partly oxidized by these analogues.
PMC PhO• radicals co-oxidized AscH2 but unlike other analogues were poor at co-oxidizing
GSH or inducing lipid peroxidation with peroxidase/H2O2 and caused little cytotoxicity. Other
investigations have also shown that PMC PhO•s did not oxidize intracellular GSH and protein
sulfhydryls in HL-60 cells and did not induce lipid peroxidation but did oxidize intracellular
AscH2 (Kagan et al, 2000; Kagan et al, 2003). EPR and UV spectroscopy studies showed that
PMC (292 nm) was first oxidized to a short-lived PhO• which subsequently formed an ortho-
quinone (274 nm). Ascorbate prevented PMC disappearance and PhO• appearance indicating that
AscH2 co-oxidation to Asc• involved the PhO• (Kagan et al, 2003).
Pulse radiolysis research (O'Brien, 1988) suggests the following equations, which could
explain how PhO•-catalyzed GSH co-oxidation caused superoxide radical anion and H2O2
formation:

49
PhOH + H2O2 PhO + H2O
PhO + GSH PhOH + GS
GS + GS GSSG
GSSG + O2 GSSG + O2
2O2 + 2H H2O2 + O2
Peroxidase
In our study, the relative GSH and/or lipid peroxidation activity of the vitamin E analogues
oxidized by H2O2/peroxidase in a cell-free system seemed to be similar to their relative
hepatocyte GSH oxidation and/or lipid peroxidation activity. The order of pro-oxidant activity
and cytotoxic effectiveness of the vitamin E analogues when oxidized by H2O2/peroxidase was
troglitazone > Trolox C > δ-tocopherol > γ-tocopherol > α-tocopherol > PMC.
However, the order of antioxidant and cytoprotective activity at much lower concentrations of
vitamin E analogues was inversely proportional to the pro-oxidant order of effectiveness found at
higher concentrations with the exception of troglitazone. The antioxidant activity of vitamin E
analogues seems to correlate with their estimated bond dissociation energy (BDE) values, which
have been calculated as follows: 77 kcal/mol for α-tocopherol, PMC, or troglitazone; 79
kcal/mol for γ-tocopherol; and 81 kcal/mol for δ-tocopherol, respectively (calculated by Wright
et al., unpublished data). The higher the BDE values are, the less effective the antioxidant
activity is. This suggests that the relative antioxidant and pro-oxidant activities of the vitamin E
analogues studied may be associated with their O-H bond dissociation enthalpy (Wright et al,
2001). Other investigators have also shown that the pro-oxidant activity of other PhO• generated
by lactoperoxidase/H2O2 in oxidizing NAD(P)H or GSH was inversely related to their
antioxidant ability for quenching 1,1-diphenyl-2-picrylhydrazyl radicals (Ueda et al, 2001).

50
We have also derived SAR equations, which revealed that the most cytotoxic vitamin E
analogues had the highest dipole moments and the lowest EHOMO. However, for antioxidant
activity, it was the opposite where the best antioxidant had the lowest dipole moments and the
highest EHOMO. Log P also correlated with cytoprotection and antioxidant activity, as the more
hydrophilic analogues were better antioxidants.
In conclusion, our results showed that pro-oxidant radicals of vitamin E analogues caused
intracellular lipid peroxidation, GSH oxidation, and cytotoxicity, which were prevented by an
antioxidant. The cytotoxic pro-oxidant activity of the vitamin E analogues was inversely
proportional to their antioxidant activity. PMC was the most effective antioxidant with the lowest
pro-oxidant activity and could have therapeutic advantages over the others. Troglitazone at low
concentrations was an effective antioxidant; however, at higher concentrations, troglitazone was
the most effective pro-oxidant with the highest pro-oxidant activity and caused the most
hepatocyte cytotoxicity suggesting that the troglitazone hepatotoxicity could also involve other
mechanisms, which require further research. It is possible that the 2,4-thiazolidione moiety of
troglitazone could contribute to its hepatotoxicity, as rosiglitazone and pioglitazone in the clinic
were much less hepatotoxic and did not contain the phenolic tocopherol moiety (Tafazoli et al,
2005a). Pro-oxidant PhO• formed by troglitazone could partly explain the life-threatening
hepatotoxicity found in some patients, which resulted in the withdrawal of troglitazone from the
market place.

51
Chapter 3
Role of Hydrazine in Isoniazid-Induced Hepatotoxicity in a Hepatocyte Inflammation Model
Shahrzad Tafazoli, Mariam Mashregi and Peter J. O’Brien
Reprinted from Toxicology and Applied Pharmacology 229(1): 94-101., Copyright (2008)

52
3.1 Abstract
Isoniazid is an anti-tuberculosis drug that can cause hepatotoxicity in 20% of the patients and
often is associated with an inflammatory response. Isoniazid toxicity in isolated rat hepatocytes,
was prevented by 1-aminobenzotriazole, a non-selective P450 inhibitor or by bis-p-nitrophenyl
phosphate (BNPP), an esterase inhibitor. Hepatocytes when exposed to non-toxic levels of H2O2
(to simulate H2O2 formation by inflammatory cells), became twice as sensitive to isoniazid
toxicity and cytotoxicity was prevented by P450 and esterase inhibition. Hydrazine, the
metabolite formed by the amidase-catalyzed hydrolysis of isoniazid, was 16-fold more cytotoxic
with a non-toxic H2O2-generating system. The acetylhydrazine metabolite was found to be much
less cytotoxic than hydrazine in the presence of the H2O2 generating system. Hydrazine,
therefore, seems to be the isoniazid reactive metabolite in this inflammation model. The
molecular mechanism of hydrazine-induced cytotoxicity was attributed to oxidative stress as
reactive oxygen species (ROS) and protein carbonyl formation occurred before the onset of
hepatocyte toxicity. Hydrazine toxicity also involved significant endogenous H2O2 production
which caused lysosomal membrane damage and led to a collapse in the mitochondrial membrane
potential. These results implicated H2O2, a cellular mediator of inflammation, as a potential risk
factor for the manifestation of adverse drug reactions, particularly those caused by hydrazine
containing drugs.

53
3.2 Introduction
Isoniazid (isonicotinic acid hydrazide) introduced in the 1950s, is still the most active agent
against Bacillus tuberculosis and is used both for the treatment and the prophylaxis of
tuberculosis. Currently there are 8 million new patients per year receiving treatment with
isoniazid, which is the most cost-effective treatment for tuberculosis. Despite the therapeutic
benefits of this drug, daily isoniazid administration is also associated with mild elevations of
plasma liver enzyme activities in 20% of patients and severe hepatotoxicity in 1–2% of patients
(Garibaldi et al, 1972; Scharer and Smith, 1969). Isoniazid use has also been associated with
several cases of systemic lupus erythematosus (Dhand et al, 1987; Zingale et al, 1963). Long-
term therapy with hydralazine, another hydrazine containing drug or isoniazid can trigger
systemic lupus erythematosus with an incidence during the first year of 5–8% for hydralazine or
less than 1% for isoniazid (Rubin, 2005). Hydralazine-induced lupus is an autoimmune disease
attributed to hydralazine oxidation by monocytes and neutrophils to form reactive metabolites
that bind covalently to proteins, thus making the protein “foreign” and leading to an immune
response against this hapten (Uetrecht, 2005).
Isoniazid induced lung tumors in mice (Maru and Bhide, 1982; Toth and Shubik, 1966) , and
caused chromosome aberrations and sister chromatid exchanges when incubated with cultured
rodent cells (MacRae and Stich, 1979). Isoniazid-induced unscheduled DNA synthesis and
chromosome aberrations in these cells were also increased by transition metals (Whiting et al,
1979; Zetterberg and Bostrom, 1981) . Isoniazid received a black box warning in 1969 (Black et
al, 1975).
The mechanism of isoniazid-induced hepatotoxicity is unknown. Most of the previous
research has focused on a rat model with the hypothesis that acetylhydrazine, a metabolite of

54
isoniazid, is the cause of the hepatotoxicity (Mitchell et al, 1976; Nelson et al, 1976). However,
there is more recent evidence in animals and humans suggesting that hydrazine is the metabolite
predominately responsible for isoniazid-induced hepatotoxicity (Noda et al, 1983; Woo et al,
1992). A positive correlation between plasma hydrazine levels and severity of isoniazid-induced
hepatic necrosis, steatosis and elevated plasma triglycerides was obtained in rabbits (Sarich et al,
1996). Hydrazine was also found in the urine and plasma of patients following treatment with
isoniazid or hydralazine (Timbrell and Harland, 1979). Evidence for the role of hydrazine in
isoniazid-induced hepatotoxicity in rabbits was that administration of an amidase inhibitor
prevented hepatotoxicity and hepatic triglyceride accumulation and markedly decreased plasma
hydrazine and triglyceride levels (Sarich et al, 1999). Hydrazine has also been shown to be
hepatotoxic when administered to rats (Yard and McKennis, 1955) and sublethal doses of
hydrazine induced fatty liver in monkeys and rats (Amenta and Johnston, 1963; Dominguez et al,
1962). Hydrazine can be formed from isoniazid through two different pathways: 1) a direct
pathway which involves amidase-catalyzed hydrolysis of isoniazid or 2) an indirect pathway of
amidase-catalyzed hydrolysis of acetylhydrazine.
Recent evidence from experimental models suggests that an episode of inflammation during
drug treatment predisposes animals to tissue injury (Buchweitz et al, 2002; Luyendyk et al,
2002). The hepatotoxicities of allyl alcohol and aflatoxin B1 in rats were augmented by liver
inflammation following co-exposure to LPS (Roth et al, 1997). The hepatocellular necrosis in
most of the patients also involved an inflammatory response with a hepatic infiltration of
lymphocytes and plasma cells with some eosinophils and neutrophils (Mitchell et al, 1976).
However, these infiltrates are more likely the consequence rather than the cause of toxicity.
Instead, resident Kupffer cells, stellate cells and hepatocytes, also have NADPH oxidase activity

55
that form H2O2 when activated (Bataller et al, 2003; De Minicis and Brenner, 2007; Diaz-Cruz et
al, 2007; Reinehr et al, 2005). Furthermore, studies also showed that apocynin, an NADPH
oxidase inhibitor, suppressed oxidative stress and inflammatory injuries in rat liver during
hypercholesterolaemia (Lu et al, 2007). Hepatocytes were therefore exposed to a low non-toxic
continuous infusion of H2O2 in the absence and presence of peroxidase. In this way, hepatocyte
vulnerability to isoniazid in the presence of activated immune cells could be simulated. We have
previously used this H2O2 hepatocyte inflammation model, with and without peroxidase, to study
the hepatotoxicity of tolcapone (Tafazoli et al, 2005a), troglitazone (Tafazoli et al, 2005b) and
carbonyl agents (O'Brien et al, 2007). In this model, troglitazone, tolcapone and some carbonyl
agents were shown to be much more cytotoxic, whereas other agents such as 2,2,5,7,8-
pentamethyl-6-hydroxychromane (PMC), a vitamin E analogue, tribromoethanol (Avertin®), an
anesthetic and acetylsalicylic acid (Aspirin®) toxicities were not affected (O'Brien et al, 2007;
Tafazoli et al, 2005a; Tafazoli et al, 2005b).

56
3.3 Materials and methods
3.3.1 Chemicals
Isoniazid, 1-aminobenzotriazole, glucose, glucose oxidase (Type II, 15,000–25,000 U/g
solid), peroxidase from horseradish (EC 1.11.1.7; HRP), 2′,7′-dichlorofluorescein diacetate
(DCFD-DA), rhodamine 123, deferoxamine mesylate, leupeptin hydrochloride, chloroquine
diphosphate salt, methylamine, 4-Hydroxy-2,2,6,6-tetramethylpiperidene-1-oxyl (TEMPOL),
dinitrophenylhydrazine (DNPH), bis-p-nitrophenylphosphate (BNPP), hydrazine hydrate, and
acetylhydrazine were purchased from Sigma-Aldrich Corp. (Oakville, Ontario, Canada).
3.3.2 Animal treatment and hepatocyte preparation
Male Sprague-Dawley rats weighing 275–300 g (Charles River Laboratories, Montréal,
Canada) were housed in ventilated plastic cages over PWI 8-16 hardwood bedding. There were
12 air changes per hour, 12-h light photoperiod (lights on at 0800 h) and an environmental
temperature of 21–23 °C with a 50–60% relative humidity. The animals were fed with a normal
standard chow diet and water ad libitum. Care and treatment of the rats were in compliance with
the guidelines of the Canadian Council on Animal care, and the protocol was approved by the
University of Toronto Animal Care Committee. Hepatocytes were isolated from rats by
collagenase perfusion of the liver as described by (Moldeus et al, 1978). Isolated hepatocytes
(10 mL, 106 cells/mL) were suspended in Krebs–Henseleit buffer (pH 7.4) containing 12.5 mM
HEPES in continually rotating 50 mL round bottom flasks, under an atmosphere of 95% O2 and
5% CO2 in a 37 °C water bath for 30 min. Glucose (10 mM)/glucose oxidase (0.5 U/mL; H2O2
generating system) was used to generate H2O2.

57
3.3.3 Cell viability
Hepatocyte viability was assessed microscopically by plasma membrane disruption as
determined by the trypan blue (0.1%, w/v) exclusion test (Moldeus et al, 1978). Hepatocyte
viability was determined every 30 min during the first hour and then at 2 and 3 h incubation. The
hepatocytes used were at least 85–95% viable before their use.
3.3.4 H2O2 generating system
When H2O2 was added to hepatocytes, most of the H2O2 was metabolized by catalase within
seconds (Ou and Wolff, 1996). Therefore, a H2O2 generating system was employed by adding
glucose 10 mM to the hepatocyte suspension followed by glucose oxidase (0.5 U/mL). This
glucose/glucose oxidase system continuously supplied H2O2 to the hepatocytes over the
experimental period without affecting GSH levels.
3.3.5 H2O2 measurement
H2O2 was measured in hepatocytes by taking aliquots at 30, 90 and 180 min using the FOX 1
reagent (ferrous oxidation of xylenol orange). The FOX 1 reagent consisted of 25 mM sulfuric
acid, 250 µM ferrous ammonium sulfate, 100 µM xylenol orange and 0.1 M sorbitol. At the
given time intervals 50 µL of hepatocytes (1.0 × 10⁶ cells/mL) were added to 950 µL FOX1
reagent and incubated for 30 min at room temperature. The absorbance of the samples was read
at 560 nm and the concentration of H2O2 was determined using the extinction coefficient of
2.67 × 10⁵ M− 1 cm− 1 (Ou and Wolff, 1996).

58
3.3.6 Protein carbonylation assay
Total protein-bound carbonyl content was measured by derivatizing the carbonyl adducts with
DNPH at 30, 90 and 180 min. Briefly an aliquot of the suspension of cells (0.5 mL, 0.5 × 10⁶
cells) was added to an equivalent volume (0.5 mL) of 0.1% DNPH (w/v) in 2.0 N HCl and
allowed to incubate for 1 h at room temperature. This reaction was terminated and total cellular
protein precipitated by the addition of an equivalent 1.0 mL volume of 20% TCA (w/v). Cellular
protein was rapidly pelleted by centrifugation at 50 × g, and the supernatant was discarded.
Excess unincorporated DNPH was extracted three times using an excess volume (0.5 mL) of
ethanol:ethyl acetate (1:1) solution. Following the extraction, the recovered cellular protein was
dried under a stream of nitrogen and solubilized in 1 mL of Tris-buffered 8.0 M guanidine–HCl,
pH 7.2. The resulting solubilized hydrazones were measured at 366–370 nm. The concentration
of 2,4-DNPH derivatized protein carbonyls was determined using the extinction coefficient of
22,000 M− 1 cm− 1 (Hartley et al, 1997).
3.3.7 ROS formation
The rate of hepatocyte ROS generation was determined by adding dichlorofluorescein-
diacetate (DCFH-DA) to the hepatocyte incubation. DCFH-DA penetrates hepatocytes and
becomes hydrolyzed to form non-fluorescent dichlorofluorescein. Dichlorofluorescein then
reacts with ROS to form the highly fluorescent dichlorofluorescein that effluxes the cell (LeBel
et al, 1992). Aliquots (1 mL) were withdrawn at 30, 90 and 180 min after incubation. These
samples were then centrifuged for 1 min at 50 × g. The cells were resuspended in 1 mL of
Krebs–Henseleit media containing 1.6 µM DCFD-DA. The cells were incubated at 37 °C for
10 min. The fluorescence intensity of dichlorofluorescein was measured using a Shimadzu

59
RF5000U fluorescence spectrophotometer (U.S.A.). Excitation and emission wavelengths were
500 and 520 nm, respectively (LeBel et al, 1992).
3.3.8 Mitochondrial membrane potential assay
The uptake and retention of the cationic fluorescent dye, rhodamine 123, has been used for
the estimation of mitochondrial membrane potential. This assay is based on the fact that
rhodamine 123 accumulates selectively in the mitochondria by facilitated diffusion. However,
when the mitochondrial potential is decreased, the amount of rhodamine 123 that enters the
mitochondria is decreased as there is no facilitated diffusion. Thus the amount of rhodamine 123
in the supernatant is increased and the amount in the pellet is decreased. Samples (500 µL) were
taken from the cell suspension incubated at 37 °C at 30, 90 and 180 min, and centrifuged at
50 × g for 1 min. The cell pellet was then resuspended in 2 mL of fresh incubation medium
containing 1.5 µM rhodamine 123 and incubated at 37 °C in a thermostatic bath for 10 min with
gentle shaking. Hepatocytes were separated by centrifugation and the amount of rhodamine 123
appearing in the incubation medium was measured fluorimetrically using Shimadzu RF5000U
fluorescence spectrophotometer set at 490 nm excitation and 520 nm emission wavelengths. The
capacity of mitochondria to take up the rhodamine 123 was calculated as the difference in
fluorescence intensity between control and treated cells (Andersson et al, 1987).
3.3.9 Statistical analysis
Statistical analysis was preformed by a one-way ANOVA (analysis of variance) test and
significance was assessed by employing Tukey's post hoc test.

60
3.4 Results
As shown in Figure 3.1, incubation of isolated hepatocytes with 10 mM isoniazid induced a
50% loss in hepatocyte viability in 2 h as measured by the trypan blue exclusion assay (LC50). To
determine the molecular mechanism for the toxicity, different compounds were added to the
incubation medium to determine their ability to modulate the toxic response. For this purpose the
LC50 of isoniazid (10 mM) was selected.
0
20
40
60
80
100
120
0 20 40 60 80 100 120 140 160 180 200
% C
ytot
oxic
ity (t
rypa
n bl
ue u
ptak
e)
Incubation time (min)
ControlIsoniazid 15 mMIsoniazid 10 mMIsoniazid 8 mMIsoniazid 6 mM
**
*
*
*
*
*
*
*
*
*
*
**
*
Figure 3. 1 Isoniazid-induced cytotoxicity towards isolated rat hepatocytes Refer to Materials and Methods for a description of experiments performed. Means ± SE for three separate experiments are given. * Significant as compared to control (p < 0.05).

61
As shown in Table 3.1, the presence of BNPP, an amidase inhibitor (Buch et al, 1969),
markedly decreased isoniazid cytotoxicity suggesting that hydrazine formed by the amidase-
catalyzed hydrolysis of isoniazid contributed to cytotoxicity. Furthermore, 1-aminobenzotriazole,
a non-selective P450 inhibitor was also cytoprotective, indicating a role for P450 in isoniazid
toxicity. On the other hand, there was about a 2-fold increase in isoniazid toxicity if a non-toxic
(did not affect cell viability or GSH levels significantly) H2O2 generating system, to simulate
inflammation, was added at 1 h (to allow for isoniazid bioactivation), i.e., 6 mM isoniazid now
caused the same degree of cytotoxicity as 10 mM isoniazid without the H2O2 generating system.
Addition of 1-aminobenzotriazole, before the H2O2 generating system, also prevented toxicity
suggesting a role for P450/H2O2 in the increased isoniazid hepatotoxicity. Addition of BNPP to
the hepatocytes prior to the H2O2 generating system, also decreased isoniazid toxicity indicating
that metabolism of isoniazid to hydrazine was necessary for toxicity. In the absence of isoniazid,
none of the modulators at the doses used, affected hepatocyte viability.
A marked increase in isoniazid-induced protein carbonyl formation occurred with the addition
of a H2O2 generating system, whereas isoniazid in the absence of the H2O2 generating system did
not enhance protein carbonylation. P450 inhibition and BNPP both resulted in a marked decrease
in protein carbonylation induced by isoniazid and H2O2 generating system. Endogenous H2O2
levels, as measured using the FOX 1 reagent, was also markedly increased by isoniazid and the
non-toxic H2O2 generating system, but did not increase in the absence of isoniazid or the H2O2
generating system. Inhibition of amidase with BNPP or inhibition of P450 by 1-
aminobenzotriazole prevented the increase in isoniazid toxicity by the H2O2 generating system.
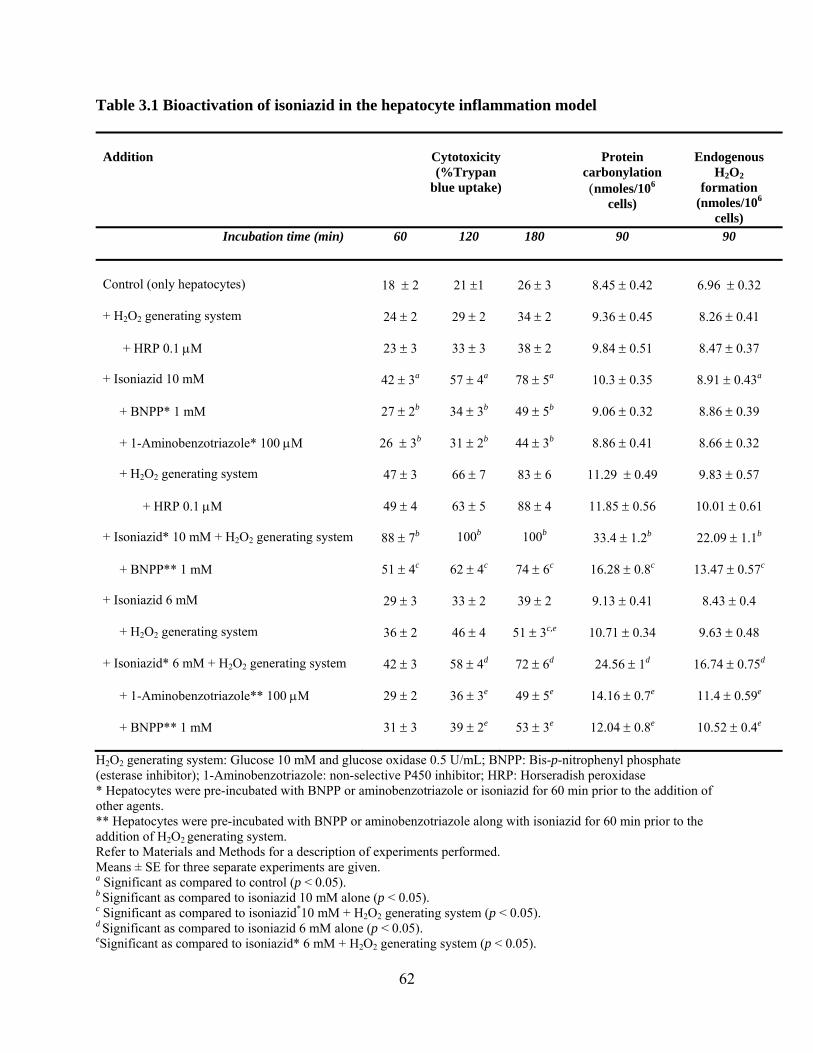
62
Table 3.1 Bioactivation of isoniazid in the hepatocyte inflammation model
H2O2 generating system: Glucose 10 mM and glucose oxidase 0.5 U/mL; BNPP: Bis-p-nitrophenyl phosphate (esterase inhibitor); 1-Aminobenzotriazole: non-selective P450 inhibitor; HRP: Horseradish peroxidase * Hepatocytes were pre-incubated with BNPP or aminobenzotriazole or isoniazid for 60 min prior to the addition of other agents. ** Hepatocytes were pre-incubated with BNPP or aminobenzotriazole along with isoniazid for 60 min prior to the addition of H2O2 generating system. Refer to Materials and Methods for a description of experiments performed. Means ± SE for three separate experiments are given. a Significant as compared to control (p < 0.05). b Significant as compared to isoniazid 10 mM alone (p < 0.05). c Significant as compared to isoniazid*10 mM + H2O2 generating system (p < 0.05). d Significant as compared to isoniazid 6 mM alone (p < 0.05). eSignificant as compared to isoniazid* 6 mM + H2O2 generating system (p < 0.05).
Addition
Cytotoxicity (%Trypan
blue uptake)
Protein
carbonylation (nmoles/106
cells)
Endogenous
H2O2 formation
(nmoles/106 cells)
Incubation time (min)
60 120 180 90 90
Control (only hepatocytes)
18 ± 2
21 ±1
26 ± 3
8.45 ± 0.42
6.96 ± 0.32
+ H2O2 generating system
24 ± 2
29 ± 2
34 ± 2
9.36 ± 0.45
8.26 ± 0.41
+ HRP 0.1 µM
23 ± 3
33 ± 3
38 ± 2
9.84 ± 0.51
8.47 ± 0.37
+ Isoniazid 10 mM
42 ± 3a
57 ± 4a
78 ± 5a
10.3 ± 0.35
8.91 ± 0.43a
+ BNPP* 1 mM
27 ± 2b
34 ± 3b
49 ± 5b
9.06 ± 0.32
8.86 ± 0.39
+ 1-Aminobenzotriazole* 100 µM
26 ± 3b
31 ± 2b
44 ± 3b
8.86 ± 0.41
8.66 ± 0.32
+ H2O2 generating system
47 ± 3
66 ± 7
83 ± 6
11.29 ± 0.49
9.83 ± 0.57
+ HRP 0.1 µM
49 ± 4
63 ± 5
88 ± 4
11.85 ± 0.56
10.01 ± 0.61
+ Isoniazid* 10 mM + H2O2 generating system
88 ± 7b
100b
100b
33.4 ± 1.2b
22.09 ± 1.1b
+ BNPP** 1 mM
51 ± 4c
62 ± 4c
74 ± 6c
16.28 ± 0.8c
13.47 ± 0.57c
+ Isoniazid 6 mM
29 ± 3
33 ± 2
39 ± 2
9.13 ± 0.41
8.43 ± 0.4
+ H2O2 generating system
36 ± 2
46 ± 4
51 ± 3c,e
10.71 ± 0.34
9.63 ± 0.48
+ Isoniazid* 6 mM + H2O2 generating system
42 ± 3
58 ± 4d
72 ± 6d
24.56 ± 1d
16.74 ± 0.75d
+ 1-Aminobenzotriazole** 100 µM
29 ± 2
36 ± 3e
49 ± 5e
14.16 ± 0.7e
11.4 ± 0.59e
+ BNPP** 1 mM
31 ± 3
39 ± 2e
53 ± 3e
12.04 ± 0.8e
10.52 ± 0.4e

63
As shown in Figure 3.2, hydrazine toxicity towards isolated rat hepatocytes was
concentration-dependent and about 8 mM hydrazine was required to cause 50% hepatocyte
cytotoxicity in 2 h (LC50).
0
20
40
60
80
100
120
0 20 40 60 80 100 120 140 160 180 200
% C
ytot
oxic
ity (t
rypa
n bl
ue u
ptak
e)
Incubation time (min)
ControlHydrazine12 mMHydrazine 8 mMHydrazine 4 mMHydrazine 2 mMHydrazine 0.5 mM
*
*
* *
*
*
*
**
**
**
***
*
Figure 3.2 Hydrazine-induced cytotoxicity towards isolated rat hepatocytes Refer to Materials and Methods for a description of experiments performed. Means ± SE for three separate experiments are given. * Significant as compared to control (p < 0.05).

64
Summarized in Table 3.2, two of the major isoniazid metabolites, hydrazine and
acetylhydrazine, were next tested in the hepatocyte inflammation model. Hydrazine toxicity in
the presence of a non-toxic H2O2 generating system was markedly increased and cytotoxicity
was also concentration-dependent. Hydrazine LC50 in the absence of the H2O2 generating system
was 8 mM, and in the presence of the H2O2 generating system it was 0.5 mM, a 16-fold increase.
Hepatocyte oxidative stress was also markedly increased and was accompanied by significant
endogenous ROS and H2O2 formation as well as protein carbonylation. P450 inhibition by 1-
aminobenzotriazole and the ROS scavenger, TEMPOL both prevented hydrazine toxicity, and
ROS formation as well as protein carbonylation. Hepatocyte viability in the absence of hydrazine
was not affected by any of the modulators at the doses shown.

65
Table 3.2 Contribution of hydrazine to isoniazid-induced toxicity in the hepatocyte inflammation model
† Due to oxidation of 2',7'-dichlorofluorescin by peroxidase * Hepatocytes were pre-incubated with aminobenzotriazole, for 60 min prior to the addition of other agents H2O2 generating system: Glucose 10 mM and glucose oxidase 0.5 U/mL; 1-Aminobenzotriazole: non-selective P450 inhibitor; TEMPOL: 4-Hydroxy-2,2,6,6-tetramethylpiperidene-1-oxyl (ROS scavenger) Refer to Materials and Methods for a description of experiments performed. Means ± SE for three separate experiments are given. a Significant as compared to control (P < 0.05). b Significant as compared to hydrazine 8 mM alone (P < 0.05). c Significant as compared to hydrazine 2 mM alone (P < 0.05). d Significant as compared to hydrazine 0.5 mM alone (P < 0.05). f Significant as compared to hydrazine 0.5 mM + H2O2 generating system (P < 0.05).
Addition
Cytotoxicity (%Trypan
blue uptake)
Protein
carbonylation (nmoles/106
cells)
Endogenous
H2O2 formation
(nmoles/106 cells)
ROS
formation (Fluorescent
Intensity)
Incubation time (min) 60 120 180 90 90 90
Control (only hepatocytes)
17 ± 1
22 ± 1
27 ± 2
8.34 ± 0.46
7.01 ± 0.23
102 ± 9
+ H2O2 generating system
23 ± 2
29 ± 2
33 ± 1
8.86 ± 0.53
8.13 ± 0.32
123 ± 11
+ HRP 0.1 µM
25 ± 1
32 ± 2
36 ± 2
9.07 ± 0.58
8.53 ± 0.39
Interference†
+ Hydrazine 8 mM
36 ± 3a
57 ± 4a
68 ± 5a
12.4 ± 0.53a
14.6 ± 0.68a
167 ± 14a
+ H2O2 generating system
100b
100b
100b
46.37 ± 2.1b
37.02 ± 1.8b
391 ± 16b
+ Hydrazine 2 mM
29 ± 2
33 ± 1
37 ± 2
8.45 ± 0.42
7.67 ± 0.31
108 ± 7
+ H2O2 generating system
58 ± 4c
78 ± 6c
100c
36.9 ± 1.5c
30.71 ± 1.5c
352 ± 9c
+ Hydrazine 0.5 mM
22 ± 1
27 ± 3
32 ± 1
8.37 ± 0.36
7.41 ± 0.4
113 ± 7
+ H2O2 generating system
39 ± 5d
56 ± 5d
76 ± 5d
28.31 ± 1.4d
21.64 ± 0.9d
321 ± 15d
+ 1-Aminobenzotriazole*100 µM
25 ± 2e
34 ± 4e
46 ± 3e
11.07 ± 0.5e
16.45 ± 0.7e
257 ± 18e
+ TEMPOL 200 µM
27 ± 3f
37 ± 6f
51 ± 4f
12.3 ± 0.4f
14.7 ± 0.6f
216 ± 13f
+ HRP 0.1 µM
41 ± 3
59 ± 7
79 ± 7
27.09 ± 1.7
22.42 ± 1.1
Interference†
+ Acetylhydrazine 5 mM
36 ± 2a
54 ± 5a
71 ± 6a
11.97 ± 0.58a
10.59 ± 0.5
121 ± 14
+ H2O2 generating system
37 ± 4
57 ± 3
74 ± 5
12.09 ± 0.54
10.71 ± 0.7
129 ± 8

66
Acetylhydrazine cytotoxicity was not increased by the H2O2 generating system, even if
hepatocytes were pre-incubated with acetylhydrazine for 60 min prior to the addition of H2O2
generating system (results not shown). Furthermore, inhibition of amidase by BNPP did not
affect acetylhydrazine cytotoxicity in the presence of H2O2 generating system, indicating that
acetylhydrazine did not undergo deacetylation to form hydrazine (results not shown).
As shown in Figure 3.3, hydrazine toxicity in the inflammation model involved lysosomal
membrane damage as deferoxamine, an iron chelator was cytoprotective as well as methylamine
and chloroquine, lysosomotropic agents. The hepatocyte lysosomal protease inhibitor leupeptin
also prevented hydrazine-induced cytotoxicity in the inflammation model.

67
0
10
20
30
40
50
60
70
80
0 50 100 150 200
% C
ytot
oxic
ity (t
rypa
n bl
ue u
ptak
e)
Incubation time (min)
Control
H2O2 generating system
Hydrazine 0.5 mM + H2O2 generating system
Deferoxamine 0.2 mM + Hydrazine 0.5 mM + H2O2 generating systemLeupeptin 0.1 mM + Hydrazine 0.5 mM + H2O2 generating system
Chloroquine 0.05 mM + Hydrazine 0.5 mM + H2O2 generating systemMethylamine 30 mM + Hydrazine 0.5 mM + H2O2 generating system
*
*
*
*
**
**
**
**
**
**
****
**
**
Figure 3.3 Hydrazine-induced toxicity in the hepatocyte inflammation model involves lysosomal labilization and mitochondrial toxicity
H2O2 generating system: Glucose 10 mM and glucose oxidase 0.5 U/mL; Deferoxamine: iron chelator; Leupeptin: protease inhibitor; Chloroquine and methylamine: lysosomotropic agents Refer to Materials and Methods for a description of experiments performed. Means ± SE for three separate experiments are given. * Significant as compared to H2O2 generating system (p < 0.05). **Significant as compared to hydrazine 0.5 mM + H2O2 generating system (p < 0.05).
68
Furthermore, hydrazine induced a rapid decline of mitochondrial membrane potential which
was prevented by deferoxamine, methylamine, chloroquine and leupeptin indicating that
hydrazine-induced collapse in mitochondrial membrane potential was a consequence of
lysosomal damage (Figure 3.4).

69
0
20
40
60
80
100
120
0 20 40 60 80 100
% M
itoch
ondr
ial m
embr
ane
pote
ntia
l
Incubation time (min)
Control
H2O2 generating system
Hydrazine 0.5 mM + H2O2 generating system
Deferoxamine 0.2 mM + Hydrazine 0.5 mM + H2O2 generating system
Leupeptin 0.1 mM + Hydrazine 0.5 mM + H2O2 generating system
Chloroquine 0.05 mM + Hydrazine 0.5 mM + H2O2 generating system
Methylamine 30 mM + Hydrazine 0.5 mM + H2O2 generating system
*
*
****
******
Figure 3.4 Prevention of hydrazine-induced mitochondrial membrane collapse by lysosomotropic agents, iron chelators and protease inhibitors H2O2 generating system: Glucose 10 mM and glucose oxidase 0.5 U/mL; Deferoxamine: iron chelator; Leupeptin: protease inhibitor; Chloroquine and methylamine: lysosomotropic agents Refer to Materials and Methods for a description of experiments performed. Means ± SE for three separate experiments are given. * Significant as compared to H2O2 generating system (P < 0.05). **Significant as compared to hydrazine 0.5 mM + H2O2 generating system (P < 0.05).

70
3.5 Discussion
Previously we introduced an inflammation hepatocyte model for screening candidate drugs
for idiosyncratic drug reaction hepatotoxicity potential (Tafazoli et al, 2005a; Tafazoli and
O'Brien, 2005). Instead of co-culturing the hepatocytes with Kupffer cells and activating the
Kupffer cells with LPS (Tukov et al, 2006), we have selected to use a slow H2O2 generating
system (glucose/glucose oxidase) that simulates ROS generation by immune cells in the liver
that are activated during inflammation. Hepatocyte GSH levels, protein carbonylation and cell
viability were not affected by the H2O2 generating system. However, it was found that the
hepatotoxicity of several drugs e.g., tolcapone or troglitazone that caused idiosyncratic drug
reaction hepatotoxicity and were withdrawn or received a black box warning, were markedly
increased by this non-toxic slow infusion of H2O2 (Tafazoli et al, 2005a; Tafazoli et al, 2005b).
In this study, we showed that isoniazid cytotoxicity increased by a 2-fold factor in the
hepatocyte inflammation model only when isoniazid was pre-incubated with hepatocytes for 1 h
prior to the H2O2 addition. This pre-incubation time allowed for the metabolism of isoniazid to
its toxic metabolites. BNPP, an amidase inhibitor, prevented isoniazid toxicity both in the
absence and presence of the H2O2 generating system, indicating the role of amidase in isoniazid
toxicity by catalyzing isoniazid hydrolysis to the more toxic hydrazine. Furthermore, toxicity
was preceded by a significant increase in endogenous H2O2 production and protein carbonyl
formation. The isoniazid metabolites hydrazine and acetylhydrazine were then tested using the
hepatocyte inflammation model. Hydrazine toxicity was found to be increased 16-fold in the
presence of H2O2. BNPP administration also prevented in vivo acetylisoniazid-induced
hepatotoxicity which was attributed to the prevention of acetylisoniazid hydrolysis to
acetylhydrazine, the suspected isoniazid-derived hepatotoxin at that time (Mitchell et al, 1975).

71
However, in our hepatocyte inflammation model, acetylhydrazine toxicity was not increased in
the presence of the H2O2 generating system. Previously it was reported that BNPP acts as a
potent amidase inhibitor in vitro, inhibiting the conversion of isoniazid to hydrazine catalyzed by
rat hepatic microsomes (Sendo et al, 1984). Therefore, the prevention of isoniazid-induced
toxicity in our hepatocyte model with BNPP would provide evidence that the mechanism for the
protection is likely due to inhibition of hydrazine formation.
The increased hepatocyte susceptibility to hydrazine by the H2O2 generating system could
result from catalase and superoxide dismutase inactivation by hydrazine (Hussain and Frazier,
2002), as there was a significant increase in endogenous H2O2 levels as measured by FOX 1
reagent. Previously, it was shown that in red blood cells, catalase was inactivated by
phenylhydrazine, another hydrazine with a similar structure, but only if H2O2 was present
(Cohen and Hochstein, 1964). In vitro catalase experiments showed that the inactivation
mechanism involved the catalase-catalyzed oxidation of phenylhydrazine by H2O2 to a radical
cation, phenyl radical and other oxidation products which resulted in a σ-coordination of a
phenyl residue to the catalase prosthetic heme iron (Ortiz de Montellano and Kerr, 1983).
Furthermore, previous evidence also showed that in rabbits, isoniazid-induced hepatocellular
damage correlated with plasma hydrazine levels but not with isoniazid or acetylhydrazine levels
(Sarich et al, 1996). Administration of BNPP, 30 min before the administration of isoniazid, to
rabbits also prevented the elevation of plasma liver enzymes as well as hepatic and plasma
triglyceride levels but decreased plasma hydrazine levels (Sarich et al, 1999).
1-Aminobenzotriazole, a non-selective P450 inhibitor, prevented isoniazid and hydrazine-
induced cytotoxicities in the presence of H2O2, suggesting a role for P450/H2O2 or oxidative
activation of P450 metabolites by H2O2 for isoniazid and hydrazine hepatotoxicities. The

72
microsomal P450/H2O2 system has been shown to catalyze the oxidative metabolism of other
oxidisable substrates such as catechols and phenylenediamines (Anari et al, 1997). Isoniazid
oxidation was catalyzed by a microsomal cytochrome P450 system to form reactive free radical
metabolites that were trapped by spin-trapping agents (Albano and Tomasi, 1987). Hydrazine
metabolism by rat hepatocytes was also increased in P450-induced hepatocytes (phenobarbital)
and hydrazine metabolism was decreased by P450 inhibitors, e.g., metyrapone and piperonyl
butoxide (Timbrell et al, 1982).
An abnormal endogenous production of H2O2, has been shown to result in a rapid decrease in
cell viability preceded by the loss of lysosomal integrity, as judged by the relocalization of
acridine orange, a lysosomotropic weak base (Zdolsek et al, 1993). Influx of H2O2 into the
lysosomal apparatus initiates processes through a primary interaction with lysosomal ferrous iron
resulting in the formation of hydroxyl radicals which lead to disruption of lysosomal normal
stability and leakage of hydrolytic enzymes (Starke et al, 1985; Zdolsek et al, 1993). A marked
increase in endogenous H2O2 formation by hydrazine also caused lysosomal labilization as the
lysosomotropic agents, chloroquine and methylamine, the iron chelator, deferoxamine, as well as
leupeptin, a protease inhibitor, all prevented hydrazine toxicity in the inflammation model. There
was also a significant collapse in mitochondrial membrane potential which was inhibited by the
lysosomotropic agents, methylamine and chloroquine as well as leupeptin and deferoxamine.
This suggests that the lysosomal damage contributed to mitochondrial toxicity.
In summary our results showed that hydrazine is the likely metabolite involved in the
cytotoxic mechanism of isoniazid since inhibition of the amidase that catalyzes the hydrolysis of
isoniazid to hydrazine prevented isoniazid-induced hepatocyte cytotoxicity. Furthermore, a non-
toxic H2O2 generating system to simulate the ROS formation by immune cells increased
73
isoniazid cytotoxicity by two fold whereas hydrazine cytotoxicity was increased 16-fold whilst
acetylhydrazine cytotoxicity was not affected. The molecular cytotoxic mechanism likely
involved lysosomal permeabilization and mitochondrial membrane collapse. The cytotoxic
mechanism also involved extensive oxidative stress as endogenous ROS and H2O2 as well as
protein carbonylation were markedly increased and ROS scavengers that prevented ROS
formation also prevented the ensuing cytotoxicity. ROS formation may also arise from the
reduction of oxygen by hydrazinyl radicals formed by hydrazine oxidation.

74
Chapter 4
Accelerated Cytotoxic Mechanism Screening of Hydralazine Using an In vitro Hepatocyte Inflammatory Cell Peroxidase Model
Shahrzad Tafazoli, and Peter J. O’Brien
Reproduced with permission from Chemical Research in Toxicology 2008, 21: 904-910.
Copyright 2008 American Chemical Society

75
4.1 Abstract
Long-term treatment of hypertensive disorders with hydralazine has resulted in some patients
developing hepatitis and lupus erythematosus, an autoimmune syndrome. The concentration of
hydralazine required to cause 50% cytotoxicity in 2 h (LC50) toward isolated rat hepatocytes was
found to be 8 mM. Cytotoxicity was delayed by the P450 inhibitor, 1-aminobenzotriazole,
suggesting that P450 catalyzed the formation of toxic metabolites from hydralazine. No
hydralazine-induced oxidative stress was apparent as there was little effect on hepatocyte lipid
peroxidation, protein carbonyl formation, intracellular H2O2, or hepatocyte GSH levels and no
effect of butylated hydroxyanisole (BHA) on cytotoxicity. Drug-induced hepatotoxicity in vivo
has often been attributed to infiltrating inflammatory cells, for example, neutrophils or resident
Kupffer cells whose NADPH oxidase generates H2O2, when activated. The effect of a non-toxic
continuous infusion of H2O2 on hydralazine cytotoxicity was investigated. It was found that
H2O2 increased hepatocyte susceptibility to hydralazine 4-fold (LC50, 2 mM). Cytotoxicity was
still prevented by the P450 inhibitor but now involved some oxidative stress as shown by
increased protein carbonyls, endogenous H2O2, and GSH oxidation. Lipid peroxidation was not
increased, and cytotoxicity was not inhibited by BHA. Cytotoxicity, however, was inhibited by
4-hydroxy-2,2,6,6-tetramethylpiperidene-1-oxyl (TEMPOL), a ROS scavenger. Because
neutrophils or Kupffer cells release myeloperoxidase on activation, the effect of adding
peroxidase to the hepatocytes exposed to H2O2 on hydralazine cytotoxicity was also investigated.
It was found that peroxidase/H2O2 increased hepatocyte susceptibility to hydralazine 80-fold
(LC50, 0.1 mM). Furthermore, cytotoxicity occurred following extensive oxidative stress that
included lipid peroxidation, and cytotoxicity that was now prevented by the antioxidant BHA.
These results indicate that three cytotoxic pathways exist for hydralazine: a P450-catalyzed

76
pathway not involving oxidative stress, a P450/H2O2-catalyzed oxidative stress-mediated
cytotoxic pathway not involving lipid peroxidation, and a peroxidase/H2O2-catalyzed lipid
peroxidation-mediated cytotoxic pathway.

77
4.2 Introduction
Hydralazine, an aromatic hydrazine derivative, has been in clinical use since 1950 for the
long-term treatment of hypertensive disorders. Associated with hydralazine exposure is the
development of hepatitis with confluent centrilobular necrosis (Itoh et al, 1981; Murata et al,
2007). Circulating autoantibodies reacting with liver CYP1A2 have been found in patients with
dihydralazine-induced hepatitis (Bourdi et al, 1992). An autoimmune syndrome resembling
systemic lupus erythematosus occurred between 2 and 40 months after the start of hydralazine
administration and was dose-related (Cameron and Ramsay, 1984). The reactive metabolites
causing hydralazine side effects are not known, and various reactive metabolites have been
proposed by different investigators (Hofstra et al, 1991; Hofstra and Uetrecht, 1993; Sinha, 1983;
Wong et al, 1988; Yamamoto and Kawanishi, 1991).
Hydralazine has also been shown to induce DNA fragmentation and DNA repair in isolated
rat hepatocytes (Martelli et al, 1995), but no other cytotoxic molecular mechanism studies have
been carried out. There have also been reports of hydralazine mutagenicity found in bacterial test
systems (Parodi et al, 1981) and a modest increase in lung tumors in mice (Toth, 1978).
Hydralazine has also been shown to undergo autoxidation at an alkaline pH catalyzed by the
transition metals Cu(II) or Fe(III), to form phthalazine and nitrogen-centered hydralazyl radical
intermediates, which caused site-specific DNA damage (Sinha, 1983; Yamamoto and Kawanishi,
1991). Leukocyte myeloperoxidase (MPO), H2O2, and chloride ion catalyzed hypochlorite
formation, which oxidized hydralazine to phthlazine (Hofstra and Uetrecht, 1993). A reactive
intermediate was trapped with N-acetyl cysteine, and the adduct was identified as 1-
phthalazylmercapturic acid. The reactive intermediate proposed was the diazonium salt formed
from the diazene intermediate in the phthalazine product pathway (Hofstra and Uetrecht, 1993).

78
Electron spin resonance studies were also used to show that liver microsomes/NADPH catalyzed
hydralazine to phthalazine via a radical pathway catalyzed by P450 (LaCagnin et al, 1986).
Mitochondrial pyruvate dehydrogenase also catalyzed oxidation of the pyruvate hydralazine
hydrazone to form a CO2•− radical (Wong et al, 1988).
Idiosyncratic adverse drug reactions, although rare, can be a cause for removal of the drug
from the market. Liver injury has been induced in rats if the rats were cotreated with
lipopolysaccharide (LPS) when the drug for example, ranitidine or trovafloxacin, was
administered (Deng et al, 2007; Shaw et al, 2007). An immune cell-mediated cytotoxic
mechanism has been proposed in which cytokines, for example, tumor necrosis factor-α and
cytotoxic proteases, were released by the drug and/or LPS(Deng et al, 2007; Shaw et al, 2007).
Liver gene expression in rats showed that the hemostatic system, hypoxia, as well as infiltrated
neutrophils could also be critical mediators of LPS/ranitidine-induced liver injury(Luyendyk et
al, 2006). Neutrophil activation by cytokines, chemokines, and microbial products results in a
massive increase in superoxide radicals and H2O2 formation, probably for host defense against
invading microorganisms (Quinn et al, 2006). LPS also increased cellular NADPH oxidase
transcription, resulting in superoxide radical and H2O2 formation (Kawahara et al, 2005).
Kupffer cells resident in the liver contain high NADPH oxidase activity (Quinn et al, 2006), and
Kupffer cells contribute to drug hepatotoxicity (Tafazoli and O'Brien, 2005).
To find a more robust in vitro screening method for assessing the potential hepatotoxicity risk
of hydralazine, hepatocyte susceptibility to hydralazine was also investigated when hepatocytes
were exposed to a low non-toxic continuous infusion of H2O2 in the absence or presence of
peroxidase such as could be released by activated immune cells. In this way, hepatocyte
vulnerability to hydralazine in the presence of H2O2 generated by oxidative stress or NADPH

79
oxidase of activated immune cells could be simulated. We have previously used this H2O2-
enhanced hepatocyte cytotoxicity model, with or without peroxidase, to study the hepatotoxcity
of tolcapone (Tafazoli et al, 2005a), troglitazone (Tafazoli et al, 2005b), and carbonyl agents
(O'Brien et al, 2007). In this model, troglitazone, tolcapone, and some carbonyl agents were
shown to be much more cytotoxic, whereas other agents such as 2,2,5,7,8-pentamethyl-6-
hydroxychromane (PMC), a vitamin E analogue, tribromoethanol (avertin), an anesthetic, and
acetylsalicylic acid (aspirin) were not affected (O'Brien et al, 2007; Tafazoli et al, 2005a;
Tafazoli et al, 2005b; Tafazoli and O'Brien, 2005).
80
4.3 Material and methods
4.3.1 Chemicals
Hydralazine hydrochloride, catalase, sodium azide, 1-aminobenzotriazole, 6-n-propyl-
thiouracil (PTU), horseradish peroxidase (EC 1.11.1.7; HRP), myeloperoxidase (MPO), 4-
hydroxy-2,2,6,6-tetramethylpiperidene-1-oxyl (TEMPOL), gallic acid, butylated hydroxyanisole
(BHA), 2′,4′-dinitrofluorobenzene (DNFB), thiobarbituric acid, trichloroacetic acid (TCA),
iodoacetic acid, glucose, glucose oxidase, 2′,7′-dichlorofluorescein diacetate (DCFD-DA), and
dinitrophenylhydrazine (DNPH) were purchased from Sigma Aldrich Corp. (Oakville, Ont.,
Canada).
4.3.2 Animal treatment and hepatocyte preparation
Male Sprague–Dawley rats weighing 275–300 g (Charles River Laboratories, Montréal,
Canada) were housed in ventilated plastic cages over PWI 8–16 hardwood bedding. There were
12 air changes per hour, 12 h light photoperiod (lights on at 0800 h), and an environmental
temperature of 21–23 °C with 50–60% relative humidity. The animals were fed a normal
standard chow diet and water ad libitum. Care and treatment of the rats were in compliance with
the guidelines of the Canadian Council on Animal care, and the protocol was approved by the
University of Toronto Animal Care Committee. Hepatocytes were isolated from rats by
collagenase perfusion of the liver as described by Moldeus et al. (Moldeus et al, 1978). Isolated
hepatocytes (10 mL, 106 cells/mL) were suspended in Krebs–Henseleit buffer (pH 7.4)
containing 12.5 mM HEPES in continually rotating 50 mL round-bottom flasks, under an

81
atmosphere of 95% O2 and 5% CO2 in a 37 °C water bath for 30 min. Stock solutions of
chemicals were made in double-distilled water or dimethylsulfoxide (DMSO).
4.3.3 Cell viability
Hepatocyte viability was assessed microscopically by plasma membrane disruption as
determined by the Trypan blue (0.1%, w/v) exclusion test (Moldeus et al, 1978). Hepatocyte
viability was determined every 30 min during the first hour and then at 2 and 3 h of incubation.
Only cell preparations with viabilities of 85–95% were used.
4.3.4 H2O2 generating system
When H2O2 was added to hepatocytes, most of the H2O2 was metabolized by catalase within
seconds (Ou and Wolff, 1996). Therefore, a H2O2 generating system (Antunes and Cadenas,
2001) was employed by adding 10 mM glucose to the hepatocyte suspension followed by
glucose oxidase (0.5 U/mL). The rate of oxygen uptake and hydrogen peroxide formation was
verified using an oxygen electrode to monitor the release of oxygen with catalase. This
glucose/glucose oxidase system continuously supplied H2O2 to the hepatocytes over the
experimental period, without affecting GSH levels.
4.3.5 Hepatocyte lipid peroxidation
Lipid peroxidation was determined by measuring the amount of thiobarbituric acid reactive
substances (TBARS) at 532 nm, formed during the decomposition of lipid hydroperoxides using
a Pharmacia Biotech Ultrospec 1000. At different time points, each test tube containing 1 mL
aliquots of hepatocyte suspension (106 cell/mL) was treated with 250 µL of TCA (70% w/v) and
82
1 mL of thiobarbituric acid (0.8% w/v). The suspension was then boiled for 20 min and read at
532 nm as previously described (Smith et al, 1982). An extinction coefficient of 156 mM−1 cm−1
was used to determine the concentration of malondialdehyde produced.
4.3.6 Cellular GSH and oxidized glutathione (GSSG) content
GSH and GSSG were measured by HPLC analysis of deproteinized samples (25% meta-
phosphoric acid) after derivatization with iodoacetic acid and DNFB as per the method outlined
(Reed et al, 1980). A Waters HPLC system (model 150 pumps, WISP 710B autoinjector, and
model 410 UV–vis detector) equipped with a Waters µBondapak NH2 (10 µm) 3.9 mm × 300
mm column was used. Detection was carried out using UV absorption at 364 nm.
4.3.7 H2O2 measurement
H2O2 levels in hepatocytes were measured by taking samples at 15, 30, 60, and 120 min using
the FOX 1 reagent (ferrous oxidation of xylenol orange). The FOX 1 reagent consisted of 25 mM
sulfuric acid, 250 µM ferrous ammonium sulfate, 100 µM xylenol orange, and 0.1 M sorbitol. At
the given time intervals, 50 µL of hepatocytes (1.0 × 10⁶ cells/mL) was added to 950 µL of FOX
1 reagent and incubated for 30 min at room temperature. The absorbance of the samples was read
at 560 nm, and the concentration of H2O2 was determined using the extinction coefficient of 2.67
× 105 M−1 cm−1 (Ou and Wolff, 1996).
4.3.8 Protein carbonylation assay
The total protein-bound carbonyl content was measured by derivatizing the protein carbonyl
adducts with DNPH. Briefly, an aliquot of the suspension of cells (0.5 mL, 0.5 × 10⁶ cells) at 30,

83
60, and 120 min was added to an equivalent volume (0.5 mL) of 0.1% DNPH (w/v) in 2.0 N HCl
and allowed to incubate for 1 h at room temperature. This reaction was terminated and the total
cellular protein precipitated by the addition of an equivalent of 1.0 mL volume of 20% TCA
(w/v). Cellular protein was pelleted by centrifugation at 50 × g, and the supernatant was
discarded. Excess unincorporated DNPH was extracted three times using an excess volume (0.5
mL) of ethanol:ethyl acetate (1:1) solution. Following extraction, the recovered cellular protein
was dried under a stream of nitrogen and dissolved in 1 mL of Tris-buffered 8.0 M guanidine–
HCl, pH 7.2. The resulting solubilized hydrazones were measured at 366–370 nm. The
concentration of 2,4-DNPH derivatized protein carbonyls was determined using an extinction
coefficient of 22000 M−1 cm−1(Hartley et al, 1997).
4.3.9 Statistical analysis
Statistical analysis was preformed by a one-way ANOVA (analysis of variance) test, and
significance was assessed by employing Tukey’s posthoc test.
84
4.4 Results
As shown in Table 4.1, incubation of isolated hepatocytes with 8 mM hydralazine induced a
50% loss in hepatocyte viability in 2 h (LC50) as measured by the trypan blue exclusion assay.
Hepatocyte susceptibility to hydralazine was also concentration-dependent and increased as the
concentration of hydralazine increased. 1-Aminobenzotriazole, a P450 inhibitor, delayed
hydralazine cytotoxicity; however, BHA, an antioxidant, did not affect hydralazine-induced
cytotoxicity. Furthermore, H2O2 markedly increased hepatocyte cytotoxicity induced by 4 or 1
mM hydralazine. The H2O2 was generated at a rate that caused little cytotoxicity toward control
hepatocytes. Hepatocyte susceptibility to hydralazine in the presence of H2O2 was enhanced as
the dose of hydralazine increased. Hydralazine cytotoxicity was also increased a further 2-fold
when hepatocytes were preincubated with hydralazine for 60 min prior to addition of the H2O2
generating system to allow for hydralazine bioactivation. Moreover, P450 inhibition by 1-
aminobenzotriazole delayed toxicity, suggesting a role for P450 in H2O2-enhanced hydralazine
cytotoxicity. The superoxide scavenger, TEMPOL, delayed cytotoxicity, but the antioxidant
BHA was not cytoprotective.

85
Table 4.1 Hydralazine-induced toxicity in the presence and absence of hepatocyte H2O2 oxidative stress model Addition
Cytotoxicity
(%Trypan blue uptake)
Incubation time (min) 60 120 180 Control (only hepatocytes)
18 ± 2
21 ± 1
26 ± 1
+ Hydralazine 8 mM 42 ± 2a 51 ± 3a 68 ± 5a + 1-Aminobenzotriazole* 100 µM 28 ± 1b 37 ± 2b 48 ± 3b
+ BHA 50 µM 43 ± 3 53 ± 2 70 ± 4 + Hydralazine 4 mM 30 ± 2a 38 ± 2a 44 ± 2a + H2O2 generating system 36 ± 1 59 ± 4c 74 ± 5c
+ 1-Aminobenzotriazole* 100 µM 25 ± 1d 39 ± 3d 53 ± 3d
+ BHA 50 µM 37 ± 2 57 ± 2 78 ± 4 + TEMPOL 200 µM 27 ± 2d 36 ± 2d 53 ± 4d + Hydralazine* 4 mM + H2O2 generating system 86 ± 6c 100c 100c + Hydralazine 1 mM 28 ± 1a 33 ± 2a 37 ± 1a + H2O2 generating system 39 ± 2e 48 ± 3e 64 ± 4e
+ Hydralazine* 1 mM + H2O2 generating system 57 ± 5e 78 ± 7e 100e + H2O2 generating system
24 ± 2 29 ± 2 34 ± 2
H2O2 generating system: Glucose 10 mM and glucose oxidase 0.5 U/mL; BHA (butylated hydroxyanisole): antioxidant; 1-Aminobenzotriazole: P450 inhibitor; TEMPOL: 4-Hydroxy-2,2,6, 6-tetramethylpiperidene-1-oxyl (ROS scavenger) Refer to Materials and Methods for a description of experiments performed. * Hepatocytes were pre-incubated with aminobenzotriazole or hydralazine for 60 min prior to the addition of other agents. Means ± SE for three separate experiments are given. a Significant as compared to control (P < 0.05). b Significant as compared to Hydralazine 8 mM alone (P < 0.05). c Significant as compared to Hydralazine 4 mM alone (P < 0.05). d Significant as compared to Hydralazine 4 mM + H2O2 generating system (P < 0.05). e Significant as compared to Hydralazine 1 mM alone (P < 0.05).

86
As shown in Table 4.2, hydralazine cytotoxicity was not accompanied by oxidative stress as
measured by lipid peroxidation, protein carbonylation, or increased H2O2 levels. Moreover,
hydralazine cytotoxicity in the presence of a H2O2 generating system increased protein
carbonylation and intracellular H2O2 levels, which were partly prevented by TEMPOL but not
BHA. Cytotoxicity did not result in lipid peroxidation. Pre-incubation of hepatocytes with
hydralazine for 60 min prior to addition of the H2O2 generating system further increased protein
carbonyl formation and endogenous H2O2 levels.
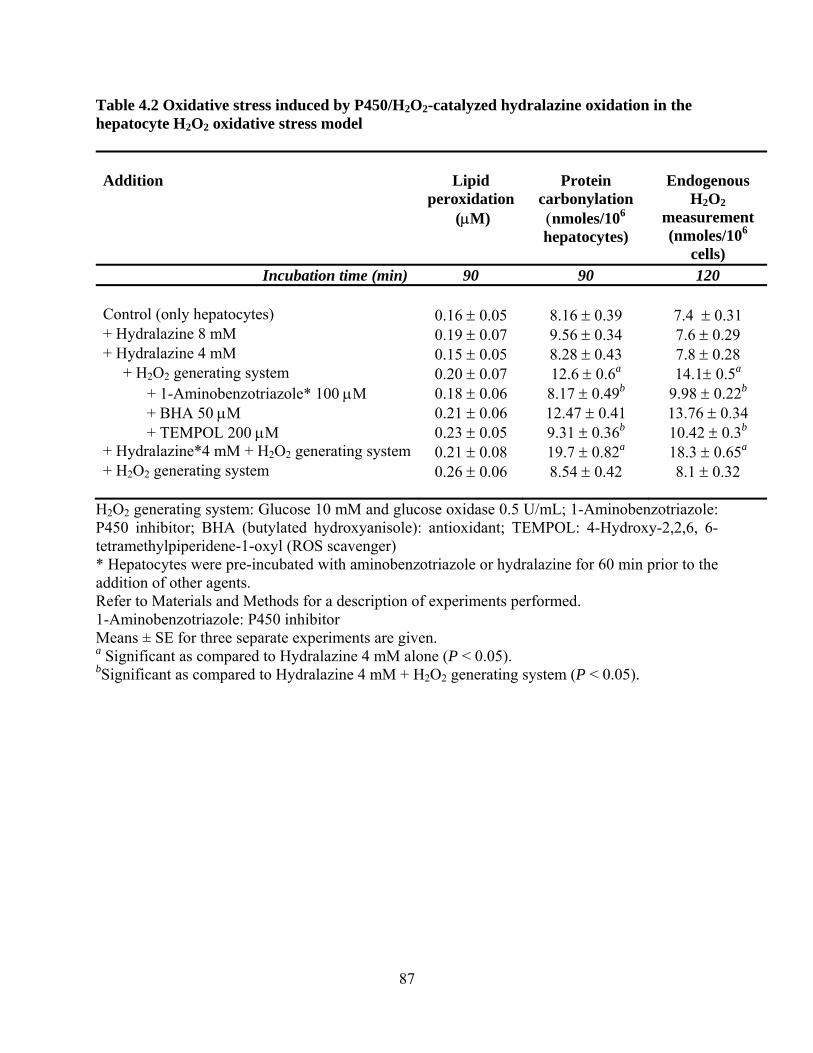
87
Table 4.2 Oxidative stress induced by P450/H2O2-catalyzed hydralazine oxidation in the hepatocyte H2O2 oxidative stress model Addition
Lipid
peroxidation (µM)
Protein
carbonylation (nmoles/106 hepatocytes)
Endogenous
H2O2 measurement (nmoles/106
cells) Incubation time (min) 90 90 120 Control (only hepatocytes)
0.16 ± 0.05
8.16 ± 0.39
7.4 ± 0.31
+ Hydralazine 8 mM 0.19 ± 0.07 9.56 ± 0.34 7.6 ± 0.29 + Hydralazine 4 mM 0.15 ± 0.05 8.28 ± 0.43 7.8 ± 0.28 + H2O2 generating system 0.20 ± 0.07 12.6 ± 0.6a 14.1± 0.5a + 1-Aminobenzotriazole* 100 µM 0.18 ± 0.06 8.17 ± 0.49b 9.98 ± 0.22b
+ BHA 50 µM 0.21 ± 0.06 12.47 ± 0.41 13.76 ± 0.34 + TEMPOL 200 µM 0.23 ± 0.05 9.31 ± 0.36b 10.42 ± 0.3b + Hydralazine*4 mM + H2O2 generating system 0.21 ± 0.08 19.7 ± 0.82a 18.3 ± 0.65a + H2O2 generating system
0.26 ± 0.06 8.54 ± 0.42 8.1 ± 0.32
H2O2 generating system: Glucose 10 mM and glucose oxidase 0.5 U/mL; 1-Aminobenzotriazole: P450 inhibitor; BHA (butylated hydroxyanisole): antioxidant; TEMPOL: 4-Hydroxy-2,2,6, 6-tetramethylpiperidene-1-oxyl (ROS scavenger) * Hepatocytes were pre-incubated with aminobenzotriazole or hydralazine for 60 min prior to the addition of other agents. Refer to Materials and Methods for a description of experiments performed. 1-Aminobenzotriazole: P450 inhibitor Means ± SE for three separate experiments are given. a Significant as compared to Hydralazine 4 mM alone (P < 0.05). bSignificant as compared to Hydralazine 4 mM + H2O2 generating system (P < 0.05).

88
As shown in Figure 4.1a, only a small amount of hepatocyte GSH was depleted by
hydralazine at this concentration. H2O2, however, increased hepatocyte GSH depletion by
hydralazine. This effect was greater, and hydralazine caused about 50% GSH depletion within 30
min if the hepatocytes were preincubated with hydralazine 60 min before the addition of H2O2
generating system. Furthermore, the P450 inhibitor 1-aminobenzotriazole inhibited the GSH
depletion (Figure 4.1a).
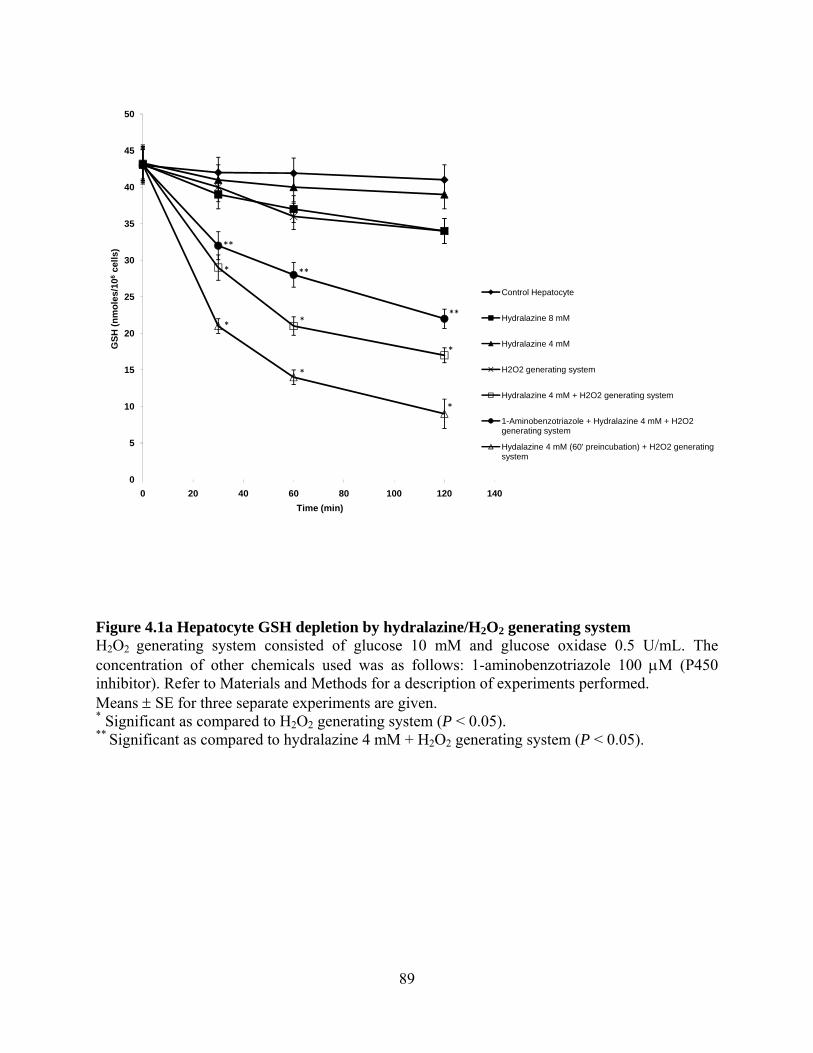
89
0
5
10
15
20
25
30
35
40
45
50
0 20 40 60 80 100 120 140
GSH
(nm
oles
/106
cells
)
Time (min)
Control Hepatocyte
Hydralazine 8 mM
Hydralazine 4 mM
H2O2 generating system
Hydralazine 4 mM + H2O2 generating system
1-Aminobenzotriazole + Hydralazine 4 mM + H2O2 generating system
Hydalazine 4 mM (60' preincubation) + H2O2 generating system
**
**
**
*
*
*
*
*
*
Figure 4.1a Hepatocyte GSH depletion by hydralazine/H2O2 generating system H2O2 generating system consisted of glucose 10 mM and glucose oxidase 0.5 U/mL. The concentration of other chemicals used was as follows: 1-aminobenzotriazole 100 µM (P450 inhibitor). Refer to Materials and Methods for a description of experiments performed. Means ± SE for three separate experiments are given. * Significant as compared to H2O2 generating system (P < 0.05). ** Significant as compared to hydralazine 4 mM + H2O2 generating system (P < 0.05).

90
0
2
4
6
8
10
12
14
0 20 40 60 80 100 120 140
GSS
G (n
mol
es/1
06ce
lls)
Time (min)
Control Hepatocyte
Hydralazine 8 mM
Hydralazine 4 mM
H2O2 generating system
Hydralazine 4 mM + H2O2 generating system
Hydalazine 4 mM (60' preincubation) + H2O2 generating system
Figure 4.1b Hepatocyte GSSG formation by hydralazine/H2O2 generating system H2O2 generating system consisted of glucose 10 mM and glucose oxidase 0.5 U/mL. Refer to Materials and Methods for a description of experiments performed. Means ± SE for three separate experiments are given.

91
As shown in Table 4.3, if hepatocytes were incubated with hydralazine in the presence of a
non-toxic amount of H2O2 and MPO or HRP, only 100 µM hydralazine was required to cause
50% cytotoxicity in 2 h (LC50). Furthermore, this cytotoxicity was delayed by PTU, a peroxidase
inhibitor, the antioxidant BHA, as well as the ROS scavengers, TEMPOL and gallic acid. In the
absence of hydralazine, none of the modulators at the doses used affected hepatocyte viability.

92
Table 4.3 Hydralazine-induced toxicity in the peroxidase oxidative stress-enhanced model Addition
Cytotoxicity
(%Trypan blue uptake)
Incubation time (min) 60 120 180 Control (only hepatocytes)
17 ± 1
21 ± 2
25 ± 2
+ H2O2 generating system + HRP 0.1 µM 23 ± 2 26 ± 2 31 ± 2 + H2O2 generating system + MPO 0.05 µM 26 ± 1 29 ± 1 32 ± 1 + Hydralazine 1 mM 31 ± 1a 34 ± 2a 44 ± 2a + H2O2 generating system + MPO 0.05 µM 100b 100b 100b + H2O2 generating system + HRP 0.1 µM 100b 100b 100b + Hydralazine 500 µM 26 ± 1a 30 ± 1a 34 ± 1a
+ H2O2 generating system + HRP 0.1 µM 57 ± 5c 81 ± 6c 100c
+ Hydralazine 100 µM 23 ± 1 27 ± 1 30 ± 1 + H2O2 generating system + MPO 0.05 µM 41 ± 3d 53 ± 6d 81 ± 5d + H2O2 generating system + HRP 0.1 µM 38 ± 2d 58 ± 4d 74 ± 4d
+ 1-Aminobenzotriazole* 100 µM 32 ± 1 41 ± 2e 59 ± 3e + PTU 5 µM 27 ± 1e 47 ± 3e 58 ± 3e + Gallic Acid 150 µM 25 ± 2 e 39 ± 1e 53 ± 3e + BHA 50 µM 30 ± 1 43 ± 4e 52 ± 2e + TEMPOL 200 µM
31 ± 2 44 ± 2e 49 ± 2e
H2O2 generating system: Glucose 10 mM and glucose oxidase 0.5 U/mL; MPO: Myeloperoxidase; HRP: Horseradish peroxidase; PTU: 6-n-Propyl-thiouracil (peroxidase inhibitor); BHA (butylated hydroxyanisole): Antioxidants; Gallic acid and TEMPOL: 4-Hydroxy-2,2,6, 6-tetramethylpiperidene-1-oxyl (ROS scavenger); 1-Aminobenzotriazole: P450 inhibitor * Hepatocytes were pre-incubated with aminobenzotriazole or hydralazine for 60 min prior to the addition of other agents. Refer to Materials and Methods for a description of experiments performed. Means ± SE for three separate experiments are given. a Significant as compared to control (P < 0.05). b Significant as compared to Hydralazine 1 mM alone (P < 0.05). c Significant as compared to Hydralazine 500 µM alone (P < 0.05). d Significant as compared to Hydralazine 100 µM alone (P < 0.05). e Significant as compared to Hydralazine 100 µM + H2O2 generating system + HRP 0.1 µM (P < 0.05).

93
With peroxidase present, there was a marked increase in lipid peroxidation, protein carbonyl
formation, and endogenous H2O2 levels before cytotoxicity ensued (Table 4.4). These oxidative
stress biomarkers were also delayed by the peroxidase inhibitor PTU and antioxidant BHA or
ROS scavengers TEMPOL and gallic acid.
Table 4.4 Oxidative stress induced by peroxidase/H2O2-catalyzed hydralazine oxidation in the hepatocyte peroxidase oxidative stress model
Addition
Lipid
peroxidation (µM)
Protein
carbonylation (nmoles/106 cells)
EndogenousH2O2
measurement (nmoles/106 cells)
Incubation time (min) 90 90 120 Control (only hepatocytes)
0.16 ± 0.05
8.16 ± 0.39
7.4 ± 0.31
+ H2O2 generating system + HRP 0.1 µM 0.37 ± 0.06 8.67 ± 0.47 8.4 ± 0.31+ H2O2 generating system + MPO 0.05 µM 0.23 ± 0.03 8.58 ± 0.43 8.7 ± 0.30 + Hydralazine 100 µM 0.14 ± 0.06 8.09 ± 0.47 7.5 ± 0.30 + H2O2 generating system + MPO 0.05 µM 1.31 ± 0.07a 32.7 ± 1.4a 29.4 ± 0.1a
+ H2O2 generating system + HRP 0.1 µM 1.87 ± 0.12a 38.5 ± 1.3a 23.2 ± 0.1a + PTU 5 µM 0.74 ± 0.04b 12.7 ± 0.53b 11.3 ± 0.7b + Gallic Acid 150 µM 0.57 ± 0.06b 14.8 ± 0.75b 14.3 ± 0.8b + BHA 50 µM 0.54 ± 0.05b 13.6 ± 0.66b 12.7 ± 0.6b + TEMPOL 200 µM
0.74 ± 0.03b 14.1 ± 0.79b 13.9 ± 0.7b
H2O2 generating system: Glucose 10 mM and glucose oxidase 0.5 U/mL; MPO: Myeloperoxidase; HRP: Horseradish peroxidase; PTU: 6-n-Propyl-thiouracil (peroxidase inhibitor); BHA (butylated hydroxyanisole): Antioxidants; Gallic acid and TEMPOL: 4-Hydroxy-2,2,6, 6-tetramethylpiperidene-1-oxyl (ROS scavenger) Refer to Materials and Methods for a description of experiments performed. Means ± SE for three separate experiments are given. a Significant as compared to Hydralazine 100 µM alone (P < 0.05). c Significant as compared to Hydralazine 100 µM + H2O2 generating system + HRP 0.1 µM

94
As shown in Figure 4.2a, the hepatocyte GSH depletion that occurred with hydralazine and
the H2O2 generating system/peroxidase was extensive and was accompanied by GSSG formation
even though hydralazine concentration was only 100 µM (Figure 4.2b). Furthermore, PTU and
BHA delayed both GSH depletion and GSSG formation. In the absence of hydralazine, the
peroxidase and H2O2 generating system did not affect hepatocyte viability or GSH levels.

95
0
5
10
15
20
25
30
35
40
45
50
0 20 40 60 80 100 120 140
GSH
(nm
oles
/106
cel
ls)
Time (min)
Control Hepatocyte
Hydralazine 0.1 mM
Hydralazine 0.1 mM + H2O2 generating system
Hydralazine 0.1 mM + H2O2 generating system + HRP
PTU + Hydralazine 0.1 mM + H2O2 generating system + HRP
BHA + Hydralazine 0.1 mM + H2O2 generating system + HRP
H2O2 generating system + HRP
H2O2 generating system
**
**
**
**
**
**
*
*
*
Figure 4.2a Hepatocyte GSH oxidation by hydralazine/H2O2 generating system + peroxidase H2O2 generating system consisted of glucose 10 mM and glucose oxidase 0.5 U/mL. The concentration of other chemicals used was as follows: PTU 10 µM (peroxidase inhibitor) and BHA 50 µM (antioxidant). Refer to Materials and Methods for a description of experiments performed. Means ± SE for three separate experiments are given. * Significant as compared to H2O2 generating system + HRP 0.1 µM (P < 0.05). ** Significant as compared to hydralazine 100 µM + H2O2 generating system + HRP 0.1 µM (P < 0.05).

96
0
2
4
6
8
10
12
14
16
18
20
0 20 40 60 80 100 120 140
GSS
G (n
mol
es/1
06ce
lls)
Time (min)
Control Hepatocyte
Hydralazine 0.1 mM
Hydralazine 0.1 mM + H2O2 generating system
Hydralazine 0.1 mM + H2O2 generating system + HRP
PTU + Hydralazine 0.1 mM + H2O2 generating system + HRP
BHA + Hydralazine 0.1 mM + H2O2 generating system + HRP
H2O2 generating system + HRP
H2O2 generating system
*
*
*
****
**
**
**
**
Figure 4.2b Hepatocyte GSSG formation by peroxidase catalyzed hydralazine oxidation H2O2 generating system consisted of glucose 10 mM and glucose oxidase 0.5 U/mL. The concentration of other chemicals used was as follows: PTU 10 µM (peroxidase inhibitor) and BHA 50 µM (antioxidant) Refer to Materials and Methods for a description of experiments performed. Means ± SE for three separate experiments are given. * Significant as compared to H2O2 generating system + HRP 0.1 µM (P < 0.05). ** Significant as compared to hydralazine 100 µM + H2O2 generating system + HRP 0.1 µM (P < 0.05).

97
4.5 Discussion
Hydralazine cytotoxicity toward isolated rat hepatocytes was delayed by the P450 inhibitor,
1-aminobenzotriazole, but oxidative stress was not induced and cytotoxicity was not prevented
by the antioxidant BHA. However, hydralazine was 2-fold more cytotoxic toward hepatocytes
exposed to non-toxic levels of H2O2 and was 4-fold more toxic if the hepatocytes were
preincubated with hydralazine prior to the addition of the H2O2 generating system. This suggests
that a reactive metabolite compromised the hepatocytes resistance to H2O2 or that H2O2
oxidatively activated the hydralazine P450-catalyzed metabolites formed or that P450/H2O2
catalyzed hydralazine oxidation to reactive metabolites (Anari et al, 1997). Furthermore, 1-
aminobenzotriazole, a nonselective P450 inhibitor (Ortiz de Montellano and Mathews, 1981),
prevented hydralazine-induced toxicity and suggested a role for P450 in the H2O2-enhanced
bioactivation of hydralazine. Furthermore, hydralazine toxicity in the presence of H2O2 was
accompanied by some protein carbonylation, GSH depletion with GSSG formation, and an
increase in intracellular H2O2 levels. There was also no lipid peroxidation, and BHA did not
prevent cytotoxicity. Cytotoxicity was, however, prevented by TEMPOL, a superoxide
scavenger and superoxide dismutase mimic, suggesting that reactive oxygen species (ROS)
caused the cytotoxicity.
When hydralazine was incubated with hepatocytes and peroxidase/H2O2, toxicity was
increased up to 80-fold and extensive lipid peroxidation and GSH oxidation occurred. Lipid
peroxidation was likely induced by hydralazyl radicals or diimines that were formed when
hydralazine underwent a one-electron oxidation catalyzed by H2O2/peroxidase (Sinha, 1983;
Yamamoto and Kawanishi, 1991). Moreover, the antioxidant BHA inhibited both lipid
peroxidation and hydralazine cytotoxicity, suggesting that lipid peroxidation was a major
98
contributor to hydralazine-induced cytotoxicity. Cytotoxicity was also prevented by ROS
scavengers or a peroxidase inhibitor.
The lipid peroxidation induced by the peroxidase/H2O2 can be readily explained as we
previously showed that peroxidase enzymes and H2O2 caused the one-electron oxidation of
phenolics, aniline compounds, nonsteroidal anti-inflammatory drugs, indoleacetic acid
derivatives, or vitamin E analogues to form highly reactive free radicals, which co-oxidized
ascorbate, NADH, or GSH or unsaturated fatty acids. When hepatocytes were present,
hepatocyte lipid peroxidation, ROS formation, and GSH oxidation to GSSG ensued (Galati et al,
2002a; O'Brien, 1988; Tafazoli et al, 2005a; Tafazoli et al, 2005b; Tafazoli and O'Brien, 2005).
It is not likely that the large increase in hydralazine cytotoxicity by peroxidase/H2O2 was due
to catalase inactivation as high concentrations of hydralazine (about 2.5 M) were required to
inhibit catalase activity by 50% in cultured fibroblasts (Weglarz et al, 1989). It was also shown
that 1 mM phenylhydrazine caused a 20% catalase inactivation in red blood cells, as long as
H2O2 was present (Cohen and Hochstein, 1964). Liver catalase experiments also showed that the
inactivation mechanism involved a catalase-catalyzed oxidation of phenylhydrazine by H2O2 to a
phenyl radical, which forms an iron−phenyl complex with catalase (Ortiz de Montellano and
Kerr, 1983).
Hydralazine markedly increased hepatocyte endogenous H2O2 levels in the presence of
H2O2/peroxidase. Other investigators showed that hydralazine or phenelzine added to human red
blood cells increased endogenous H2O2 levels (Runge-Morris and Novak, 1993). While
oxyhemoglobin or reduced transition metals could be a source of the H2O2 (Cohen and
Hochstein, 1964; Yamamoto and Kawanishi, 1991), it is more likely that the hydralazyl radicals
and diimine oxidation products reacted with oxygen to form H2O2 as was shown for the

99
peroxidase-catalyzed oxidation of hydralazine or phenylhydralazine (Misra and Fridovich, 1976;
Yamamoto and Kawanishi, 1991).
MPO was more effective than HRP at increasing hydralazine toxicity as only 0.05 µM MPO
(half-of HRP required) was required to cause about 50% hepatocyte death in 2 h and toxicity was
also accompanied by protein carbonylation and significant H2O2 formation. MPO/H2O2/chloride
unlike HRP forms hypochlorite, which could also contribute to MPO-catalyzed hydralazine
cytotoxicity. The lupus erythematosus side effect of hydralazine could involve activation by
hypochlorite generated by neutrophils MPO/H2O2/chloride (Hofstra et al, 1991; Hofstra and
Uetrecht, 1993).
Our results demonstrate that a non-toxic exposure to H2O2 markedly increased hepatocyte
susceptibility to hydralazine, much like the conditions by which asymptomatic inflammation
increases drug-induced hepatotoxicity. These results implicate H2O2, a cellular mediator of
inflammation, as a potential risk factor for the manifestation of adverse drug reactions,
particularly those caused by oxidizable hydrazine-containing drugs. In summary, H2O2-enhanced
hepatocyte system in the presence and absence of peroxidase may prove useful for a more robust
screening of drugs for assessing toxicity risk potential associated with inflammation. The
cytotoxic molecular mechanism involved was dependent on the hydralazine metabolic activation
mechanism and involved oxidative stress if H2O2 was present. The presence of MPO markedly
increased both oxidative stress and cytotoxicity.

100
Chapter 5
Amodiaquine-Induced Oxidative Stress in a Hepatocyte Inflammation Model
Shahrzad Tafazoli, and Peter J. O’Brien
Submitted to Toxicology

101
5.1 Abstract
Amodiaquine is an antimalarial drug, however associated with its use are life-threatening
agranulocytosis and hepatotoxicity in about 1 in 2000 patients, which is usually associated with
an inflammatory response. It was found that the LC50 (2h) of amodiaquine towards isolated rat
hepatocytes was 1 mM. The cytotoxic mechanism involved protein carbonylation as well as
P450 activation to a reactive metabolite. The cytotoxicity, however, was not reactive oxygen
species (ROS)-mediated, as ROS scavengers did not prevent cytotoxicity or protein
carbonylation, and it was not accompanied by glutathione (GSH) oxidation or intracellular H2O2
formation. On the other hand, the cytotoxicity could be attributed to quinoneimine metabolite
formation which formed GSH conjugates as GSH depleted hepatocytes were much more
susceptible to amodiaquine. Furthermore, when a non-toxic H2O2 generating system and
peroxidase was used to mimic the products formed by inflammatory immune cells, only 15 µM
amodiaquine was required to cause 50% cell death. In the absence of amodiaquine, hepatocyte
viability and glutathione (GSH) levels were not affected by the H2O2 generating system with or
without peroxidase. The toxic mechanism of amodiaquine in this hepatocyte H2O2/peroxidase
model involved oxidative stress, as cytotoxicity was accompanied by GSH oxidation, decreased
mitochondrial membrane potential and protein carbonyl formation which were inhibited by ROS
scavengers, 4-hydroxy-2,2,6,6-tetramethylpiperidene-1-oxyl (TEMPOL) or mannitol suggesting
a role for a semiquinoneimine radical and ROS in the amodiaquine-H2O2-mediated cytotoxic
mechanism.
102
5.2 Introduction
Malaria kills between 1 and 2 million people every year especially in Africa. There are few
effective antimalarial drugs and most of Africa still relies on chloroquine because of its low cost,
wide spread availability, and good oral tolerance. Chloroquine however, can no longer be relied
upon for the treatment of Plasmodium falciparum malaria because of the development of
resistance (Wernsdorfer, 1983). Amodiaquine, a chloroquine derivative and a 4-aminoquinoline,
was synthesized in the late 1940s and is used in the prophylaxis and treatment of malaria,
especially against chloroquine-resistant isolates of Plasmodium falciparum (Bepler et al, 1959).
However, amodiaquine use has been associated with hepatotoxicity (Larrey et al, 1986; Neftel et
al, 1986), agranulocytosis (Rhodes et al, 1986) and aplastic anemia (Hatton et al, 1986;
Rwagacondo et al, 2003). Adverse drug reactions are more common with prophylaxis compared
with treatment; so much so, that the drug has now been withdrawn from prophylactic use
(Olliaro et al, 1996). The risk of each of these adverse effects is estimated to be 1:15,500 for
hepatotoxicity, 1:2100 for agranulocytosis and 1:30,000 for aplastic anemia (Hatton et al, 1986;
Rwagacondo et al, 2003). A liver biopsy of patients with amodiaquine-induced hepatitis showed
mild hepatocyte necrosis, inflammatory infiltration, cholestasis and portal fibrosis (Larrey et al,
1986).
Amodiaquine is rapidly absorbed and extensively metabolized upon oral administration. The
main metabolite of amodiaquine is N-desethylamodiaquine with other minor metabolites being
2-hydroxydesethylamodiaquine and N-bisdesethylamodiquine (Churchill et al, 1985; Mount et
al, 1986). CYP2C8 was the main hepatic isoform that was involved in the clearance of
amodiaquine and its hepatic metabolism to N-desethylamodiaquine (Li et al, 2002).
Amodiaquine is readily oxidized to a quinoneimine that reacts rapidly and directly with proteins,

103
forming thio-ether conjugates (Maggs et al, 1987). This facile oxidation is a consequence of the
presence of a p-hydroxyaniline moiety adjacent to an aromatic nucleus in the amodiaquine
molecule (Maggs et al, 1987).
Studies showed a high incidence of anti-amodiaquine antibodies in patients suffering adverse
reactions from amodiaquine (Maggs et al, 1988). Specific IgG anti-amodiaquine antibodies were
detected in the serum from five patients who exhibited serious adverse reaction after
amodiaquine administration at a weekly dose of 400 mg, for several weeks, but not in volunteers
who had not received the drug (Christie et al, 1989).
In order to find a more robust in vitro screening method for assessing the potential
hepatotoxicity risk of amodiaquine, hepatocyte susceptibility to amodiaquine was investigated
where hepatocytes were exposed to a low non-toxic continuous infusion of H2O2 in the absence
or presence of peroxidase such as could be released by activated immune cells. In this way,
hepatocyte vulnerability to amodiaquine in the presence of H2O2 formed during NADPH oxidase
activation of immune cells could be simulated. Hepatocyte injury in the liver induced by a
variety of hepatotoxins in vivo, has been partly attributed to cytokines released from resident
macrophages or infiltrating neutrophils activated by inflammation. The NADPH oxidase of these
cells produced large amounts of ROS during an inflammatory response. Recent evidence from
experimental models suggests that an episode of inflammation during drug treatment predisposes
animals to tissue injury (Buchweitz et al, 2002; Luyendyk et al, 2006). The hepatotoxicities of
allyl alcohol and aflatoxin B1 in rats were augmented by liver inflammation following co-
exposure to LPS (Buchweitz et al, 2002; Roth et al, 1997). We have previously used this H2O2-
enhanced hepatocyte cytotoxicity model, with and without peroxidase, to study the
hepatotoxicity of tolcapone (Tafazoli et al, 2005a), troglitazone (Tafazoli et al, 2005b), isoniazid

104
(Tafazoli et al, 2008), hydralazine (Tafazoli and O'Brien, 2008) and some carbonyl agents
(O'Brien et al, 2007) which were shown to be much more cytotoxic. Other agents such as
2,2,5,7,8-pentamethyl-6-hydroxychromane (PMC, a vitamin E analogue), tribromoethanol
(Avertin®), an anesthetic and acetylsalicylic acid (Aspirin®), though were not affected (O'Brien
et al, 2007; Tafazoli et al, 2005a; Tafazoli et al, 2005b).

105
5.3 Material and methods
5.3.1 Chemicals
Amodiaquine dihydrochloride dihydrate, 1-aminobenzotriazole, 6-n-propyl-thiouracil (PTU),
peroxidase from horseradish (EC 1.11.1.7; HRP), 4-hydroxy-2,2,6,6-tetramethylpiperidene-1-
oxyl (TEMPOL), butylated hydroxyanisole (BHA), mannitol, 3-amino-1,2,4-triazole, 3,3′-
Methylenebis(4-hydroxycoumarin) (dicumarol), 1-bromoheptane, borneol, 2′,4′-
dinitrofluorobenzene (DNFB), thiobarbituric acid, trichloroacetic acid (TCA), iodoacetic acid,
glucose, glucose oxidase, dinitrophenylhydrazine (DNPH), were purchased from Sigma–Aldrich
Corp. (Oakville, Ont., Canada).
5.3.2 Animal treatment and hepatocyte preparation
Male Sprague–Dawley rats weighing 275–300 g (Charles River Laboratories, Montréal,
Canada) were housed in ventilated plastic cages over PWI 8-16 hardwood bedding. There were
12 air changes per hour, 12-h light photoperiod (lights on at 0800 h) and an environmental
temperature of 21–23 °C with a 50–60% relative humidity. The animals were fed a normal
standard chow diet and water ad libitum. Care and treatment of the rats were in compliance with
the guidelines of the Canadian Council on Animal care, and the protocol was approved by the
University of Toronto Animal Care Committee. Hepatocytes were isolated from rats by
collagenase perfusion of the liver as described by Moldeus et al. (Moldeus et al, 1978). Isolated
hepatocytes (10 mL, 106 cells/mL) were suspended in Krebs–Henseleit buffer (pH 7.4)
containing 12.5 mM HEPES in continually rotating 50 mL round bottom flasks, under an
atmosphere of 95% O2 and 5% CO2 in a 37 °C water bath for 30 min.

106
5.3.3 Cell viability
Hepatocyte viability was assessed microscopically by plasma membrane intactness as
determined by the trypan blue (0.1%, w/v) exclusion test (Moldeus et al, 1978). Hepatocyte
viability was determined every 30 min during the first hour and then at 2 and 3 h incubation.
Only cell preparations with viability of 85–95% were used.
5.3.4 Preparation of the enzyme-inhibited hepatocytes
P450-inhibited hepatocytes were prepared by adding the nonspecific suicide inhibitor of
CYP450s, 1-aminobenzotriazole (Balani et al, 2002) to hepatocytes 1 hr prior to the other agents.
GSH-depleted hepatocytes were obtained by preincubating hepatocytes with 1-bromoheptane
(200 µM), 30 min before the start of the experiment as previously described (Khan and O'Brien,
1991).
For NAD(P)H/quinone oxidoreductase (NQO)-inhibited hepatocytes, cells were preincubated
with 20 µM dicumarol for 15 min prior to the addition of other agents (Preusch et al, 1991).
Glucuronidation-inhibited hepatocytes were obtained by incubating cell with 500 µM borneol
for 15 min prior to the addition of other agents (Gregus et al, 1983; Kretz-Rommel and
Boelsterli, 1993).
Peroxidase activity was inhibited by 6-n-propyl-thiouracil (PTU) (Lee et al, 1990) by
incubating it with hepatocytes for 15 min along with HRP, prior to the start of the experiment.
Catalase activity was inhibited by preincubating hepatocytes with 500 µM 3-Amino-1,2,4-
triazole 30 min prior to the addition of other agents (Boutin et al, 1989).

107
Stock solutions of all chemicals were made in water, dimethylsulfoxide (DMSO), or
methanol.
5.3.5 H2O2 generating system
When H2O2 was added as a bolus dose to hepatocytes, most of the H2O2 was metabolized by
catalase within seconds (Ou and Wolff, 1996). Therefore, a H2O2 generating system (Antunes
and Cadenas, 2001) was employed by adding glucose 10 mM to the hepatocyte suspension
followed by glucose oxidase (0.5 U/mL). The rate of oxygen uptake and H2O2 formation was
verified using an oxygen electrode to monitor the release of oxygen with catalase (Tafazoli and
O'Brien, 2004). This glucose/glucose oxidase system continuously supplied H2O2 during the
experimental period, without affecting GSH levels or cell viability.
5.3.6 Cellular GSH and oxidized glutathione (GSSG) content
GSH and GSSG were measured by HPLC analysis of deproteinized samples (25% meta-
phosphoric acid) after derivatization with iodoacetic acid and DNFB as per the method outlined
by Reed et al. (Reed et al, 1980). A Waters HPLC system (Model 150 pumps, WISP 710B auto
injector and model 410 UV–vis detector) equipped with waters µBondapak® NH2 (10 µm)
3.9 × 300 mm column was used and detection was followed at 364 nm.
5.3.7 H2O2 measurement
H2O2 was measured in hepatocytes by taking samples at 15, 30 and 60 and 120 min and
adding the FOX 1 reagent (ferrous oxidation of xylenol orange). The FOX 1 reagent consisted of
25 mM sulfuric acid, 250 µM ferrous ammonium sulfate, 100 µM xylenol orange and 0.1 M
108
sorbitol. At the given time intervals 50 µL of hepatocytes (1.0 × 10⁶ cells/mL) were added to
950 µL FOX 1 reagent and incubated for 30 min at room temperature. The absorbance of the
samples were read at 560 nm and the concentration of H2O2 was determined using the extinction
coefficient of 2.67 x 10⁵ M-1.cm-1 (Ou and Wolff, 1996).
5.3.8 Protein carbonylation assay
Total protein-bound carbonyl content was measured by derivatizing the carbonyl adducts with
dinitrophenylhydrazine (DNPH). Briefly an aliquot of the suspension of cells (0.5 mL, 0.5 × 10⁶
cells) was added to an equivalent volume (0.5 mL) of 0.1% DNPH (w/v) in 2.0N HCl and
allowed to incubate for an hour at room temperature with vortexing every 15 min. This reaction
was terminated and total cellular protein precipitated by the addition of an equivalent 1.0 mL
volume of 20% TCA (w/v). Cellular protein was rapidly pelleted by centrifugation at
10,000 rpm, and the supernatant was discarded. Excess unincorporated DNPH was extracted
three times using an excess volume (0.5 mL) of ethanol:ethyl acetate (1:1) solution. Following
the extraction, the recovered cellular protein was dried under a stream of nitrogen and solubilized
in 1 mL of Tris-buffered 8.0 M guanidine–HCl, pH 7.2. The resulting solubilized hydrazones
were measured at 366–370 nm. The concentration of 2,4-DNPH derivatized protein carbonyls
was determined using an extinction coefficient of 22000 M-1.cm-1 (Hartley et al, 1997).
5.3.9 Mitochondrial membrane potential assay
The uptake and retention of the cationic fluorescent dye, rhodamine 123, has been used for
the estimation of mitochondrial membrane potential. This assay is based on the fact that
rhodamine 123 accumulates selectively in the mitochondria by facilitated diffusion. However,

109
when the mitochondrial potential is decreased, the amount of rhodamine 123 that enters the
mitochondria is decreased as there is no facilitated diffusion. Thus the amount of rhodamine 123
in the supernatant is increased and the amount in the pellet is decreased. Samples (500 µL) were
taken from the cell suspension incubated at 37 °C, and centrifuged at 1000 rpm for 1 min. The
cell pellet was then resuspended in 2 mL of fresh incubation medium containing 1.5 µM
rhodamine 123 and incubated at 37 °C in a thermostatic bath for 10 min with gentle shaking.
Hepatocytes were separated by centrifugation and the amount of rhodamine 123 appearing in the
incubation medium was measured fluorimeterically using a Shimadzu RF5000U fluorescence
spectrophotometer set at 490 nm excitation and 520 nm emission wavelengths. The capacity of
mitochondria to take up the rhodamine 123 was calculated as the difference in fluorescence
intensity between control and treated cells (Andersson et al, 1987).
5.3.10 Statistical analysis
Statistical analysis was preformed by a one-way ANOVA (analysis of variance) test and
significance was assessed by employing Tukey's post hoc test.
110
5.4 Results
As shown in Figure 5.1, amodiaquine toxicity towards isolated rat hepatocytes was
concentration-dependent with 1 mM amodiaquine causing about 50% death in two hours (LC50)
as measured by the trypan blue exclusion assay To determine the molecular cytotoxic
mechanism, different compounds were added to the incubation medium to determine their ability
to modulate the toxic response. For this purpose the LC50 of amodiaquine (1 mM) was selected.

111
0
20
40
60
80
100
120
0 20 40 60 80 100 120 140 160 180 200
% C
ytot
oxic
ity (T
rypa
n bl
ue u
ptak
e)
Incubation time (min)
Control
Amodiaquine 2 mM
Amodiaquine 1 mM
Amodiaquine 0.5 mM
Amodiaquine 0.1 mM
*
*
*
*
*
*
*
**
*
*
Figure 5.1 Dose response of amodiaquine-induced cytotoxicity towards isolated rat hepatocytes Refer to Materials and Methods for a description of experiments performed. Means ± SE for three separate experiments are given. * Significant as compared to control (P < 0.05).

112
As shown in Figure 5.2, the non-selective P450 inhibitor (Balani et al, 2002) , 1-
aminobenzotriazole delayed amodiaquine toxicity suggesting a role for P450 in activating
amodiaquine to a toxic metabolite. On the other hand, dicumarol, a NAD(P)H/quinone
oxidoreductase (NQO) inhibitor (Preusch et al, 1991), borneol, a glucuronidation inhibitor
(Gregus et al, 1983; Kretz-Rommel and Boelsterli, 1993) and GSH depletion by bromoheptane
(Gregus et al, 1983; Kaderlik et al, 1994; Khan and O'Brien, 1991) all resulted in a significant
increase in amodiaquine-induced cytotoxicity. ROS scavengers, TEMPOL and mannitol, and
antioxidants BHA and quercetin, however, did not affect cytotoxicity (results not shown).

113
0
20
40
60
80
100
120
0 20 40 60 80 100 120 140 160 180 200
% C
ytot
oxic
ity (T
rypa
n bl
ue u
ptak
e)
Incubation time (min)
Control
Amodiaquine 1 mM
+ 1-Aminobenzotriazole 1 mM
+ Dicumarol 0.02 mM
+ GSH-depleted hepatocytes
+ Borneol 0.5 mM
**
**
**
*
*
*
*
**
**
**
**
**
**
**
**
**
**
Figure 5.2 Modulating amodiaquine-induced cytotoxicity by chelators, NQO, P450 or glucuronidation inhibitors and GSH depletion Refer to Materials and Methods for a description of experiments performed. Dicumarol: a NAD(P)H/quinone oxidoreductase (NQO) inhibitor; 1-Aminobenzotriazole: P450 inhibitor; GSH-depleted hepatocytes were prepared by pre-incubation of hepatocytes for 30 min with 200 µM bromoheptane before the addition of other agents. Means ± SE for three separate experiments are given. * Significant as compared to control (P < 0.05). ** Significant as compared to amodiaquine-treated hepatocytes (P < 0.05).

114
As summarized in Figure 5.3, amodiaquine cytotoxicity was accompanied by a decrease in
the mitochondrial membrane potential which was partly prevented by the P450 inhibitor, 1-
aminobenzotriazole. NQO, GSH depletion and glucuronidation inhibition all increased
amodiaquine toxicity. ROS scavengers did not have an effect in preventing the decrease in the
mitochondrial membrane potential (results not shown).

115
0
20
40
60
80
100
120
0 20 40 60 80 100 120 140
% M
itoch
ondr
ial m
embr
ane
pote
ntia
l (re
lativ
e to
con
trol
)
Time (min)
Control
Amodiaquine 1 mM
+ 1-aminobenzotriazole 1 mM
+ Dicumarol 0.02 mM
+ GSH-depleted hepatocytes
+ Borneol 0.5 mM
****
**
********
**
Figure 5.3 Modulating amodiaquine-induced mitochondrial membrane potential collapse by NQO, P450 or glucuronidation inhibitors and GSH depletion Refer to Materials and Methods for a description of experiments performed. Dicumarol: a NAD(P)H/quinone oxidoreductase (NQO) inhibitor; GSH-depleted hepatocytes were prepared by pre-incubation of hepatocytes for 30 min with 200 µM bromoheptane before the addition of other agents; 1-Aminobenzotriazole: P450 inhibitor Means ± SE for three separate experiments are given. * Significant as compared to control (P < 0.05). ** Significant as compared to amodiaquine-treated hepatocytes (P < 0.05).

116
As shown in Figure 5.4, protein carbonylation was markedly increased by the glucuronidation
inhibitor, GSH depletion or NQO inhibition. Protein carbonylation by amodiaquine, however,
was not delayed by the ROS scavengers TEMPOL and mannitol (results not shown).
0
2
4
6
8
10
12
14
16
18
20
Prot
ein
carb
onyl
atio
n (n
mol
es/1
06ce
lls)
Time (30 min)
*
**
**
****
Figure 5.4 Modulating amodiaquine-induced protein carbonylation by NQO, P450 or glucuronidation inhibitors and GSH depletion Refer to Materials and Methods for a description of experiments performed. Dicumarol: a NAD(P)H/quinone oxidoreductase (NQO) inhibitor; GSH-depleted hepatocytes were prepared by pre-incubation of hepatocytes for 30 min with 200 µM bromoheptane before the addition of other agents; 1-Aminobenzotriazole: P450 inhibitor Means ± SE for three separate experiments are given. * Significant as compared to control (P < 0.05). ** Significant as compared to amodiaquine-treated hepatocytes (P < 0.05).

117
As shown in Table 5.1, the H2O2-enhanced hepatocyte model in the absence of peroxidase did
not affect amodiaquine cytotoxicity. However, when peroxidase was added, only 15 µM
amodiaquine was required to cause about 50% cell death in two hours (LC50) representing a 66-
fold increase in toxicity. Amodiaquine toxicity in the presence of the H2O2 generating system
and peroxidase was also dependent on the amodiaquine concentration. Hepatocyte viability in
the absence of amodiaquine was not affected by H2O2 generating system in the presence or
absence of peroxidase. Amodiaquine cytotoxicity was delayed by PTU, a peroxidase inhibitor,
suggesting that peroxidase was required for the oxidative stress-induced amodiaquine toxicity.
The ROS scavengers TEMPOL and mannitol both delayed amodiaquine-induced cytotoxicity
with peroxidase and the H2O2 generating system. Furthermore, catalase inactivation with 3-
amino-1,2,4-triazole resulted in a significant increase in hepatocyte susceptibility to
amodiaquine. The antioxidants BHA and quercetin or P450 inhibition by 1-aminobenzotriazole,
however, did not affect amodiaquine-induced toxicity in this hepatocyte cytotoxicity model
(results not shown). In the absence of amodiaquine, none of the modulators at the doses used,
affected hepatocyte viability.

118
Table 5.1 Amodiaquine-induced cytotoxicity in the hepatocyte inflammation model
* Hepatocytes were preincubated with HRP for 30 min prior to the addition of other agents. H2O2 generating system: Glucose 10 mM and glucose oxidase 0.5 U/mL; HRP: Horseradish peroxidase; PTU: 6-n-Propyl-thiouracil (peroxidase inhibitor); TEMPOL: 4-hydroxy-2,2,6,6-tetramethylpiperidene-1-oxyl (ROS scavenger). Dicumarol: a NAD(P)H/quinone oxidoreductase (NQO) inhibitor; 1-Bromoheptane: GSH depletor Refer to Materials and Methods for a description of experiments performed. Means ± SE for three separate experiments are given. a Significant as compared to control (P < 0.05). b Significant as compared to amodiaquine 1 mM (P < 0.05). c Significant as compared to amodiaquine 100 µM . d Significant as compared to amodiaquine 15 µM . e Significant as compared to amodiaquine 15 µM + H2O2 generating system + HRP 0.1 µM (P < 0.05).
Addition
Cytotoxicity
(%Trypan blue uptake)
Incubation time (min) 60 120 180 Control (only hepatocytes)
17 ± 2
21 ±1
26 ± 3
+ H2O2 generating system 24 ± 2 27 ± 2 31 ± 1 + HRP 0.1 µM 23 ± 3 29 ± 1 33 ± 2 HRP 0.1 µM* + H2O2 generating system 25 ± 2 31 ± 2 35 ± 1 + Amodiaquine 1 mM 44 ± 5a 56 ± 3a 75 ± 5a + H2O2 generating system 46 ± 4 51 ± 3 79 ± 6 + HRP 0.1 µM 100b 100b 100b
+ Amodiaquine 100 µM 20 ± 1 25 ± 2 29 ± 1 + H2O2 generating system 22 ± 2 25 ± 3 32 ± 2 + HRP 0.1 µM 68 ± 7c 100c 100c
+ Amodiaquine 15 µM 20 ± 2 23 ± 1 25 ± 1 + H2O2 generating system + HRP 0.1 µM 38 ± 2d 57 ± 6d 78 ± 5d
+ PTU 10 µM 29 ± 2 34 ± 2e 48 ± 4e + TEMPOL 200 µM 27 ± 2e 37 ± 2e 56 ± 4e
+ Mannitol 50 mM 25 ± 1e 33 ± 2e 47 ± 3e
+ Dicumarol 20 µM 37 ± 3 56 ± 4 77 ± 6 + Borneol 500 µM 36 ± 2 54 ± 5 81 ± 4 + 3-Amino-1,2,4-triazole 500 µM 66 ± 5e 83 ± 5e 100e
+1-Bromoheptane 200 µM 79 ± 7e 92 ± 7e 100e HRP 0.1 µM* + H2O2 generating system + Amodiaquine 15 µM
65 ± 5d 81 ± 6d 100d

119
As shown in Table 5.2, 15 µM amodiaquine in the presence of the H2O2 generating system and
peroxidase, induced mitochondrial toxicity as shown by a marked decrease in mitochondrial
membrane potential within the first 30 min which was restored by the peroxidase inhibitor PTU
(Lee et al, 1990) and the ROS scavenger mannitol. GSH depletion and catalase inhibition by 3-
amino-1,2,4-triazole both further increased the collapse in mitochondrial potential. Furthermore,
amodiaquine-induced protein carbonylation was significantly increased in the presence of the
H2O2 generating system and peroxidase before cytotoxicity ensued. Peroxidase inhibition was
effective at inhibiting protein carbonyl formation by amodiaquine in the presence of peroxidase
and H2O2 generating system. Protein carbonylation was significantly increased when GSH
depleted hepatocytes were used. The ROS scavenger mannitol or the catalase inactivator 3-
amino-benzo-1,2,4-triazole, however, did not delay amodiaquine-induced protein carbonylation
(Table 5.2).
Moreover, as shown in Table 5.2, amodiaquine toxicity with H2O2 generating system and
peroxidase, resulted in a marked increase in the intracellular H2O2 levels which was delayed by
PTU or mannitol and was increased in GSH depleted or catalase inhibited hepatocytes.
Furthermore, pre-incubation of hepatocytes with HRP for 30 min prior to addition of the H2O2
generating system and amodiaquine, further increased cytotoxicity.

120
Table 5.2 Oxidative stress induced by peroxidase/H2O2-catalyzed amodiaquine oxidation in a hepatocyte inflammation model
H2O2 generating system: Glucose 10 mM and glucose oxidase 0.5 U/mL; HRP: Horseradish peroxidase; PTU: 6-n-Propyl-thiouracil (peroxidase inhibitor); TEMPOL: 4-hydroxy-2,2,6,6-tetramethylpiperidene-1-oxyl (ROS scavenger). Dicumarol: a NAD(P)H/quinone oxidoreductase (NQO) inhibitor Refer to Materials and Methods for a description of experiments performed. Means ± SE for three separate experiments are given. a Significant as compared to control (P < 0.05). b Significant as compared to amodiaquine 1 mM + H2O2 generating system (P < 0.05). c Significant as compared to amodiaquine 100 µM + H2O2 generating system (P < 0.05). d Significant as compared to amodiaquine 15 µM (P < 0.05). e Significant as compared to amodiaquine 15 µM + H2O2 generating system + HRP 0.1 µM (P < 0.05).
Addition
%Mitochondrial
membrane potential
Protein
carbonylation (nmoles/106
cells)
Cellular H2O2 measurement (nmoles/106
cells)
Incubation time (min) 30 30 60 Control (only hepatocytes)
100
8.23 ± 0.31
7.6 ± 0.36
+ H2O2 generating system + HRP 0.1 µM
97 ± 3
8.69 ± 0.41
8.4 ± 0.31
+ Amodiaquine 1 mM
89 ± 4
11.74 ± 0.53a
7.7 ± 0.29
+ H2O2 generating system + HRP 0.1 µM
63 ± 5b
38.1 ± 1.6b
28.3 ± 0.1b
+ Amodiaquine 100 µM
96 ± 2
8.18 ± 0.41
7.5 ± 0.30
+ H2O2 generating system + HRP 0.1 µM
79 ± 4c
33.2 ± 1.3c
21.2 ± 0.1c
+ Amodiaquine 15 µM
98 ± 2
8.07 ± 0.44
7.4 ± 0.33
+ H2O2 generating system + HRP 0.1 µM
84 ± 3d
26.7 ± 1.4d
18.7 ± 0.96d
+ PTU 10 µM
94 ± 2e
12.6 ± 0.63e
10.3 ± 0.7e
+ Mannitol 50 mM
93 ± 3e
27.2 ± 0.9
13.6 ± 0.47e
+ Dicumarol 20 µM
86 ± 3
27.1 ± 0.37e
18.2 ± 0.5
+ Bromoheptane 200 µM
74 ± 2e
36.3. ± 0.31e
24.6 ± 0.42e
+ 3-Amino-1,2,4-triazole 500 µM
91 ± 3e
28.7 ± 0.26
87.4 ± 5.1e
+ Borneol 500 µM
84 ± 3 26.3 ± 0.27 19.4 ± 0.82

121
As shown in Figure 5.5a, incubation of hepatocytes with amodiaquine and the H2O2
generating system/peroxidase caused a time-dependent decrease in hepatocyte GSH levels, with
about 65% GSH depletion occurring after 30 min of incubation that was further inhibited by the
peroxidase inhibitor PTU. Moreover, GSH depletion was accompanied by significant GSSG
formation (Figure 5.5b) indicating that GSH depletion was mainly due to its oxidation to GSSG.
The peroxidase inhibitor, PTU also diminished GSSG formation. In the absence of amodiaquine,
the peroxidase and H2O2 generating system did not affect hepatocyte GSH levels.
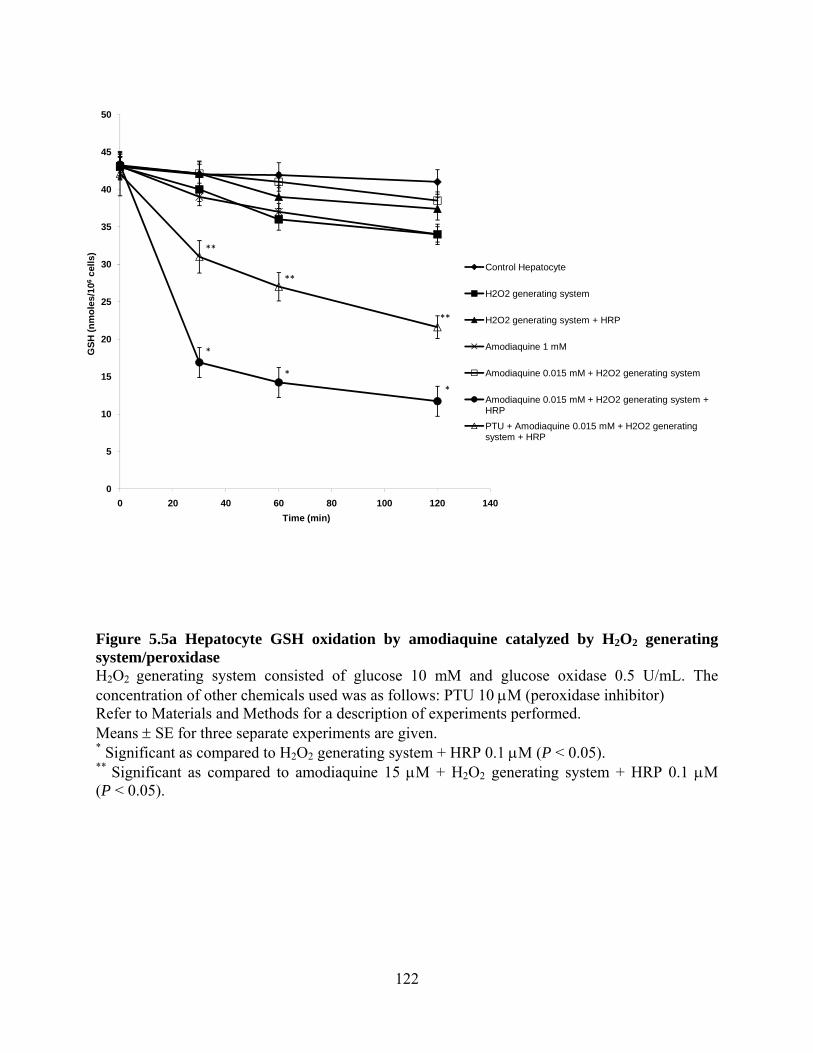
122
0
5
10
15
20
25
30
35
40
45
50
0 20 40 60 80 100 120 140
GSH
(nm
oles
/106
cells
)
Time (min)
Control Hepatocyte
H2O2 generating system
H2O2 generating system + HRP
Amodiaquine 1 mM
Amodiaquine 0.015 mM + H2O2 generating system
Amodiaquine 0.015 mM + H2O2 generating system + HRPPTU + Amodiaquine 0.015 mM + H2O2 generating system + HRP
*
*
*
**
**
**
Figure 5.5a Hepatocyte GSH oxidation by amodiaquine catalyzed by H2O2 generating system/peroxidase H2O2 generating system consisted of glucose 10 mM and glucose oxidase 0.5 U/mL. The concentration of other chemicals used was as follows: PTU 10 µM (peroxidase inhibitor) Refer to Materials and Methods for a description of experiments performed. Means ± SE for three separate experiments are given. * Significant as compared to H2O2 generating system + HRP 0.1 µM (P < 0.05). ** Significant as compared to amodiaquine 15 µM + H2O2 generating system + HRP 0.1 µM (P < 0.05).

123
0
5
10
15
20
25
0 20 40 60 80 100 120 140
GSS
G (n
mol
es/1
06ce
lls)
Time (min)
Control Hepatocyte
H2O2 generating system
H2O2 generating system + HRP
Amodiaquine 1 mM
Amodiaquine 0.015 mM + H2O2 generating system
Amodiaquine 0.015 mM + H2O2 generating system + HRPPTU + Amodiaquine 0.015 mM + H2O2 generating system + HRP
*
*
*
**
**
**
Figure 5.5b Hepatocyte GSSG formation by peroxidase catalyzed hydralazine oxidation H2O2 generating system consisted of glucose 10 mM and glucose oxidase 0.5 U/mL. The concentration of other chemicals used was as follows: PTU 10 µM (peroxidase inhibitor) Refer to Materials and Methods for a description of experiments performed. Means ± SE for three separate experiments are given. * Significant as compared to H2O2 generating system + HRP 0.1 µM (P < 0.05). ** Significant as compared to amodiaquine 15 µM + H2O2 generating system + HRP 0.1 µM (P < 0.05).

124
5.5 Discussion
In this study, amodiaquine cytotoxicity towards isolated rat hepatocytes was found to be
concentration-dependent and a cytotoxic amodiaquine metabolite was generated by P450-
catalyzed amodiaquine oxidation. The amodiaquine oxidation product also formed GSH
conjugates as amodiaquine caused a decrease in GSH levels without GSSG formation (Figure 5.5
a,b) and GSH depleted hepatocytes were more susceptible to toxicity. This was attributed to the
formation of the electrophilic metabolite quinoneimine which was detoxified by the reaction with
GSH.
In rats, amodiaquine is excreted in the bile exclusively as the 5′-thioether conjugates which
suggest that amodiaquine undergoes extensive bioactivation in vivo to form amodiaquine
quinoneimine or semiquinoneimine with subsequent conjugate addition of glutathione resulting
in glutathione depletion (Harrison et al, 1992; Maggs et al, 1988). Covalent binding to tissue
proteins and glutathione conjugates of amodiaquine have been detected in rat bile as well
(Harrison et al, 1992). Enzyme inhibition studies using ketoconazole, a P450 inhibitor, resulted
in a significant decrease in the excretion of thioether metabolites in rat bile (Harrison et al,
1992).
Toxicity, however, was not oxidative stress-mediated as it was not prevented by the
antioxidants BHA and quercetin or the ROS scavenger mannitol, and was accompanied by little
GSH depletion, intracellular H2O2 increase and low mitochondrial toxicity. This can be partly
due to amodiaquine acting as an antioxidant, as only 30 µM amodiaquine was required to cause a
50% inhibition in tert-butylhydroperoxide-induced lipid peroxidation in isolated rat hepatocytes
(results not shown).

125
The two electron reduction pathway catalyzed by DT-diaphorase was considered to be non-
toxic as DT-diaphorase inactivated hepatocytes were much more susceptible to amodiaquine
cytotoxicity indicating that a quinoneimine was involved in amodiaquine-mediated cytotoxic
mechanism. If the DT-diaphorase was inhibited, the ability of the cells to reduce quinoneimine to
amodiaquine was prevented. NQO inhibition by dicumarol also increased amodiaquine-induced
protein carbonylation and further increased the collapse in mitochondrial membrane potential.
ROS scavengers however, were not protective against protein carbonylation and mitochondrial
toxicity, suggesting that the quinoneimine was responsible for protein oxidation and caused
mitochondrial toxicity.
Furthermore, hepatocyte glucuronidation has been shown to be readily inhibited by borneol
(Kretz-Rommel and Boelsterli, 1993). When hepatocytes were pretreated with borneol,
amodiaquine toxicity significantly increased, which suggests that glucuronidation is involved in
the detoxification pathway. Furthermore, the reactive metabolite likely conjugated GSH since
GSH depleted hepatocytes were more susceptible to amodiaquine toxicity. Amodiaquine
metabolism by glucuronidation has not yet been demonstrated.
In previous studies, peroxidase enzymes and H2O2 were shown to catalyze a one-electron
oxidation of phenolics, aniline compounds, non-steroidal anti-inflammatory drugs (NSAIDs),
indole-acetic acid derivatives, troglitazone and other vitamin E analogues to form highly reactive
free radicals which co-oxidized ascorbate, NADH, GSH or unsaturated fatty acids. A continuous
H2O2 generating system and peroxidase was used which was not cytotoxic and did not cause
GSH depletion or oxidation at the concentrations used but became markedly cytotoxic towards
hepatocytes in the presence of a low non-toxic dose of NSAIDs, troglitazone and phenolics.
Furthermore, hepatocyte lipid peroxidation, ROS formation and GSH oxidation to GSSG ensued
126
(Galati et al, 2002b; Galati et al, 2002a; Tafazoli et al, 2005a; Tafazoli and O'Brien, 2004;
Tafazoli and O'Brien, 2005).
Amodiaquine also showed a concentration-dependent toxicity towards hepatocytes in the
presence of a H2O2 generating system and peroxidase. Hepatocyte susceptibility to amodiaquine
was increased by a factor of 66 when peroxidase and a non-toxic H2O2 generating system were
added to the isolated hepatocytes compared to control hepatocytes without H2O2 and peroxidase.
The cytotoxicity further increased once hepatocytes were pre-incubated with HRP for 30 min,
prior to the addition of amodiaquine and the H2O2 generating system. This pre-incubation likely
allowed HRP to be internalized by hepatocytes via endocytosis as previously shown
(Scharschmidt et al, 1986; Straus, 1981). The hepatocyte cytotoxic mechanism involved
oxidative stress as cytotoxicity was preceded by a significant collapse in mitochondrial
membrane potential, GSH oxidation, and protein carbonyl formation which were prevented by
the ROS scavenger, mannitol and the peroxidase inhibitor, PTU. BHA, completely prevents lipid
peroxidation but is poor at scavenging ROS (Robak and Gryglewski, 1988). However, BHA was
not cytoprotective and no malondialdehyde formation was observed (results not shown), which
suggests that lipid peroxidaton was not involved in amodiaquine-induced cytotoxicity and that
membrane phospholipids were not significant cytotoxic targets for the cytotoxic
semiquinoneimine radical.
Moreover, amodiaquine in the presence of peroxidase/H2O2 generating system markedly
increased endogenous H2O2 formation suggesting that peroxidase catalyzed amodiaquine
oxidation to semiquinoneimine radicals which reacted with oxygen to form H2O2. When
hepatocyte catalase was inactivated with 3-amino-1,2,4-triazole, cytotoxicity and intracellular
H2O2 formation markedly increased which suggests that cytotoxicity was due to ROS formation.

127
Primaquine, another antimalarial drug, has been shown to cause oxidative stress in erythrocytes
following its reduction and subsequent autooxidation to from H2O2, which led to hemolysis in
glucose-6-phosphate deficient individuals (Agarwal et al, 1988). The increased hepatocyte
susceptibility to amodiaquine by the H2O2 generating system could also partly result from
catalase inactivation by amodiaquine as there was a significant increase in endogenous H2O2
levels. Following single and multiple dose amodiaquine treatment, activities of superoxide
dismutase and glutathione peroxidase were increased 30% and 133% respectively, while catalase
activity was decreased by 45% (Farombi, 2000).
Hepatocyte NQO inhibition with dicumarol did not affect amodiaquine toxicity in the
presence of H2O2 and peroxidase indicating that the hepatocyte GSH oxidation was more likely
due to semiquinoneimine radical formation which caused GSH oxidation. Protein carbonylation,
also could be associated with protein oxidation by semiquinoneimine radicals and not ROS, as
the ROS scavenger, mannitol and catalase inhibitor 3-amino-1,2,4-triazole did not affect protein
carbonylation. Mannitol, however, restored mitochondrial membrane potential, suggesting that
the collapse in mitochondrial membrane potential was ROS-mediated.
In summary, our results showed that amodiaquine toxicity towards isolated rat hepatocytes
involved two distinct pathways: a non-oxidative stress pathway involving P450-catalyzed
amodiaquine oxidation to a quinoneimine metabolite which caused protein carbonylation,
mitochondrial membrane potential collapse and formed conjugates with GSH. The second
pathway, however, was oxidative stress-mediated and involved peroxidase-catalyzed oxidation
of amodiaquine to semiquinoneimine radicals which caused GSH oxidation, protein
carbonylation and mitochondrial toxicity.

128
In conclusion, a non-toxic exposure to H2O2/peroxidase markedly increased hepatocyte
susceptibility to amodiaquine, much like the conditions of asymptomatic inflammation which
enhanced drug-induced cytotoxicity (Buchweitz et al, 2002; Roth et al, 1997). Therefore, the
peroxidase/H2O2 hepatocyte system seems to be useful for screening drugs for any hepatotoxicity
potential that may be associated with inflammation.

129
Chapter 6
General Conclusions and Summary

130
6.1 Hypotheses revisited
6.1.1 Hypothesis 1: Drugs such as troglitazone, isoniazid, hydralazine and amodiaquine
developed for chronic use, cause oxidative stress when oxidized by H2O2 or peroxidase/H2O2 to
phenoxyl, hydrazyl or semiquinone radicals. In the absence of peroxidase/H2O2, these drugs are
much less cytotoxic and the cytotoxicity mechanisms do not involve oxidative stress.
As described in the Introduction section, a modest inflammatory response can enhance tissue
sensitivity to a variety of chemicals. Using immunohistochemistry, myeloperoxidase and its
oxidation products were located in Kupffer cells of the human liver (Brown et al, 2001). H2O2 is
also formed by the activation of NADPH oxidase in the infiltrating cells during the inflammatory
response. Furtheremore, it has been shown that inactivating neutrophils, macrophages or Kupffer
cells prevents drug-induced hepatotoxicity (Buchweitz et al, 2002; Roth et al, 1997; Roth et al,
2003).
It is therefore reasonable to suggest that the large increase in liver susceptibility to drugs
could be attributed to the H2O2 and/or peroxidases of the infiltrated cells or the resident Kupffer
cells that catalyze the oxidation of drugs (or their P450 metabolites) to form reactive pro-oxidant
radicals that are toxic to hepatocytes.
In this study, we used peroxidase activity as a useful inflammation marker for measuring the
hepatic inflammatory response. Previously we described evidence indicating that peroxidase
enzymes catalyzed the one-electron oxidation of phenolics, non-steroidal anti-inflammatory
drugs (NSAIDs), phenothiazines or anticancer indole-3-acetic acid (IAA) derivatives, in the
presence of H2O2, to form highly reactive free radicals which catalyzed the co-oxidation of
NADH, GSH and ascorbate. Reactive oxygen species formation was shown to occur during

131
NADH or GSH co-oxidation but not ascorbate co-oxidation (Eghbal et al, 2004; Galati et al,
2002b; Tafazoli and O'Brien, 2004).
It was also found that addition of H2O2 or peroxidase/H2O2 to the hepatocytes to simulate an
inflammatory episode markedly increased drug-induced cytotoxicity. These drugs when used in
the clinic were associated with idiosyncratic liver toxicity and included troglitazone, isoniazid,
hydralazine and amodiaquine (Chapters 2-5). However, addition of H2O2 or peroxidase/H2O2
did not increase the cytotoxicity of drugs or xenobiotics that did not cause liver toxicity, e.g.,
tribromoethanol (Avertin®), an anesthetic and acetylsalicylic acid (Aspirin®) (Tafazoli et al,
2005a) (the complete list of drugs that did not form cytotoxic pro-oxidant radicals in the
hepatocyte inflammation model has been summarized in Table AI.1 (Appendix I). These results
were obtained using an in vitro hepatocyte inflammation model, in which a continuous infusion
of H2O2 was created by using glucose and glucose oxidase, in the presence or absence of HRP,
as a model peroxidase.
In Chapter 2, the cytotoxicity of troglitazone, an α-tocopherol derivative, was compared with
other α-tocopherol analogues. Even though α-tocopherol was found to be a good antioxidant, its
phenoxyl radical at higher concentrations had undesirable pro-oxidant activity (Witting et al,
1999). Troglitazone was much more effective at inducing hepatocyte lipid peroxidation, GSH
oxidation, and cytotoxicity when oxidized by peroxidase/H2O2 suggesting that the phenoxyl
radical of troglitazone was much more pro-oxidant and hepatotoxic than α-tocopherol. The
phenoxyl radical reactive metabolite mechanism would explain why other thiazolidinedione
drugs such as rosiglitazone and pioglitazone, which have no phenoxyl radical-forming chroman
ring, were not hepatotoxic. This research also showed that troglitazone cytotoxicity increased 2.5
fold by peroxidase/H2O2. Livers from troglitazone affected patients also had inflammatory

132
infiltrates containing neutrophils so it is likely that peroxidase/H2O2 activity was increased in the
liver of these patients (Fukano et al, 2000). Type 2 diabetes is also likely an inflammatory
disease, as a recent prospective study showed that inflammation biomarkers could be used to
predict the development of type 2 diabetes in a cohort of >27,000 U.S. women (Pradhan et al,
2001). It is not known whether patients with more advanced inflammation, e.g., those with
vascular and circulatory injury, were more susceptible to troglitazone hepatotoxicity.
In Chapter 3, isoniazid-induced cytotoxicity in the hepatocyte inflammation model involved
its major metabolite hydrazine. Hydrazine was shown to be 16-fold more toxic in the presence of
a non-toxic H2O2-generating system but hepatocyte susceptibility was not further increased with
added peroxidase. Acetylhydrazine, which was previously suggested as the toxic metabolite of
isoniazid was much less cytotoxic than hydrazine in this model. The molecular cytotoxic
mechanism of hydrazine-induced toxicity involved hydrazine activation by P450/H2O2 to a
reactive metabolite much likely a hydrazyl radical. Cytotoxicity was also shown to be oxidative
stress-mediated, as ROS and protein carbonyltion occurred before the hepatocyte toxicity
ensued. Isoniazid toxicity in the inflammation model was independent from peroxidase, as added
exogenous peroxidase did not affect cytotoxicity.
Chapter 4 introduced two cytotoxic mechanisms for hydralazine. Using the hepatocyte
inflammation model, we found that hydralazine caused cytotoxicity by a P450/H2O2-catalyzed
oxidative stress-mediated cytotoxic pathway (in the absence of peroxidase) or a
peroxidase/H2O2-catalyzed cytotoxic mechanism, once peroxidase was added to the system. The
peroxidase-mediated pathway most likely involved hydralazyl radicals and it involved extensive
oxidative stress.

133
Chapter 5 further tested this hypothesis with amodiaquine. It was shown that a H2O2
generating system did not affect hepatocyte susceptibility to amodiaquine but susceptibility to
amodiaquine increased 66-fold upon addition of peroxidase. Amodiaquine toxicity in the
inflammation model also involved extensive oxidative stress and the formation of a
semiquinoneimine reactive metabolite which oxidized GSH, resulted in an increase in
mitochondrial membrane potential and formed protein carbonylation.
6.1.2 Hypothesis 2: Drugs or xenobiotic radicals can increase cell vulnerability to inflammation
by increasing H2O2 formation or by decreasing cellular resistance to H2O2.
Under normal conditions, the combined activities of catalase and glutathione peroxidase
handle H2O2 whilst maintaining normal GSH/GSSG ratio. The GSH/GSSG ratio, in turn, is
dependent on the activity of glutathione reductase and the supply of NADPH from the hexose
monophosphate shunt (Cochrane, 1991). Using the in vitro hepatocyte inflammation model, it
was shown that the non-cytotoxic H2O2 generating system used did not affect the GSH/GSSG or
the mitochondrial potential. However, addition of some of the tested drugs was accompanied by
a significant increase in the endogenous H2O2 levels which decreased the GSH/GSSG ratio and
the mitochondrial potential. The source of the endogenous H2O2 is not known and could result
from drug radicals or the inhibition of mitochondrial respiration. This oxidative stress can result
in multiple damaging effects on cell metabolism, function, and structure. H2O2-induced single-
strand breaks of DNA have been suggested to lead to activation of poly(ADP-ribose) polymerase
resulting in depletion of nicotinamide adenine dinucleotide (NAD) (Schraufstatter et al, 1986),
an essential cofactor in glycolysis. It has also been shown that H2O2 toxicity is dependent on
cellular sources of iron (Starke and Farber, 1985), thus suggesting that damage is directly

134
inflicted by hydroxyl radicals generated from H2O2 through a Fenton reaction which is
dependent on the availability of transition metals such as iron or copper in reduced form. The
hydroxyl radical reacts site-specifically at diffusion controlled rates with most biomolecules and
thus the cellular disposition of H2O2 and reactive iron is of great importance in oxidative stress-
induced cellular pathology (Starke and Farber, 1985). This can lead to lysosomal membrane
damage since secondary lysosomes are likely sites for the formation of hydroxyl radicals by
Fenton reactions due to the availability of loosely bound reduced and reactive iron.
Hydrazine-induced toxicity was accompanied by a significant increase in production of H2O2
which resulted in lysosomal membrane damage and led to a collapse in mitochondrial membrane
potential (Chapter 3). The significant increase in endogenous H2O2 formation could result from
hydralazyl radicals and diimine oxidation products reacted with oxygen to form H2O2 (Misra and
Fridovich, 1976; Yamamoto and Kawanishi, 1991) (Chapter 4) or in case of amodiaquine,
peroxidase-catalyzed amodiaquine oxidation to semiquinoneimine radicals which reacted with
oxygen to form H2O2 (Moridani et al, 2003; O'Brien, 1991) (Chapter 5). Increased H2O2
formation occurred in all cases before cytotoxicity ensued.
Furthermore, it was shown that peroxidase/H2O2 or P450/H2O2-catalyzed oxidation of
hydralazine, hydrazine (isoniazid metabolite) and amodiaquine all resulted in a significant
decrease in mitochondrial membrane potential as an indicator of mitochondrial toxicity due to
oxidative stress. However, non-toxic, low level H2O2 generating system or peroxidase/H2O2 by
itself did not affect mitochondrial membrane potential, suggesting that the collapse in
mitochondrial membrane potential was ROS-mediated. This could be due to a pro-oxidant drug
radical or high toxic levels of H2O2-mediated peroxidation of the phospholipid cardiolipin which
results in the mitochondrial permeabilization and release of cytochrome c and other pro-

135
apoptotic factors into the cytosol (Goldman et al, 1999; Kagan et al, 2005; Tyurina et al, 2006)
which can trigger caspase activation and apoptosis-mediated cell death (Orrenius, 2007).
The schematic in Figure 6.1 depicts a summary of our results that answer the two hypotheses
raised in Chapter 1.

136
Figure 6.1 Schematic of drug-induced oxidative stress in the hepatocyte inflammation model. This illustration shows that the idiosyncratic drugs researched in the chapters of this thesis (Troglitazone, Isoniazid, Hydralazine and Amodiaquine) can be activated by the immune cell products such as H2O2 and peroxidase to pro-oxidant radicals which can cause oxidative stress in hepatocytes (Hypothesis 1, H1). The mechanism of the drug-induced oxidative stress involved mitochondrial toxicity, lipid peroxidation, ROS formation or lysosomal damage. The lysosomal damage led to the decreased cellular resistance to H2O2-induced cytotoxicity via Fenton reaction and ROS formation (Hypothesis 2, H2).
137
6.2. Future directions
6.2.1 An in vivo animal inflammation model
Using an in vitro or an in vivo animal model may clarify mechanisms to minimize injury or to
determine if alternative drug candidates that do not have similar potential for toxicity would be
better utilized. The ultimate goal will be to design an animal model that could predict
idiosyncratic reactions to detect potential problems early in drug development and could be used
to help design appropriate human clinical trials. Clearly, further exploration and validation are
needed to determine how universally applicable the hypothesis is and whether predictive animal
models are plausible. Such studies should include the use of a wide variety of drugs from
numerous pharmacologic classes that have various propensities to cause idiosyncratic reactions
in people.
A preliminary in vivo animal study was carried out in which tert-butyl hydroperoxide (t-
BHP) was used to assess the effect of inflammation on increased hydrazine-induced
hepatotoxicity. t-BHP, is a short chain analog of lipid hydroperoxide which is not removed by
catalase and has therefore often been used as a model to investigate the mechanism of cell injury
initiated by acute oxidative stress (Hwang et al, 1996; Joyeux et al, 1990). It has been shown by
other laboratories that treatment of rats with t-BHP caused liver necrosis with inflammatory cell
(neutrophils) infiltration, serum liver enzyme elevation, and liver GSH oxidation (Hwang et al,
1996; Joyeux et al, 1990). Based on these findings, t-BHP seemed to be a good candidate for an
oxidative stress model which is also associated with inflammation. On the other hand, the
chemical hydrazine has been chosen as it is a known hepatotoxin and also a major and minor
metabolite of isoniazid and hydralazine, respectively (Timbrell et al, 1982; Timbrell and
138
Harland, 1979). Furthermore, the cytotoxic mechanism of hydrazine has already been studied in
the hepatocyte inflammation model, as described in Chapter 3. The procedure and results of this
preliminary experiment has been summarized in Appendix II.
In summary, the results from these preliminary experiments clearly showed that an otherwise
non-toxic dose of hydrazine when administered simultaneously or after a non-toxic dose of t-
BHP caused a significant elevation in serum alanine aminotranferease (ALT) and aspartate
aminotransferase (AST) levels, as an indicator of hepatotoxicity. Furthermore, pretreatment of
rats with non-toxic doses of t-BHP, prior to the non-toxic administration of hydrazine caused a
significant decrease in the liver tissue GSH levels when compared to hydrazine or t-BHP alone.
Further research could determine the mechanism by which toxicity may be occurring by
measuring the following indicators of oxidative stress or cell susceptibility to oxidative stress:
protein nitrotyrosine residues in liver homogenate, protein carbonyls or F2-isoprostanes as an
oxidative damage marker.
These preliminary results are a small step towards a bigger study required to show that the
administration of non-injurious concentrations of an inflammagen (e.g., LPS) or cytokines can
markedly increase hepatocyte susceptibility to some drugs or xenobiotics thereby confirming a
role for inflammation in oxidative stress-induced hepatotoxicity.
6.2.2 Limitations and knowledge gaps
Using an in vitro or an in vivo animal model may clarify mechanisms to minimize drug side
effects or toxicity to determine if alternative drug candidates are likely to be safer. The ultimate
goal will be to design an animal model that could predict idiosyncratic reactions to detect
potential problems early in drug development and could be used to help design appropriate

139
human clinical trials. For example, a rat model of endotoxin-induced mild acute inflammation
will delineate the impact of inflammation or oxidative stress at increasing drug-induced
hepatotoxicity. To test this, the development of liver injury will be evaluated in rats co-treated
with doses of LPS/ inflammagen and the tested drug, which were non-injurious when given
alone.
Clearly, further exploration and validation are needed to determine how universally applicable
the hypothesis is and whether predictive animal models are plausible. It needs to be established
whether oxidative stress-enhanced drug toxicity also correlates with the hepatotoxicity of these
drugs that cause idiosyncratic hepatoxicity.
However, although systemic exposure to LPS within a few hours of a xenobiotic agent
appears to cause a potentiated response, LPS exposure one or two days earlier is more likely to
produce tolerance to the potentially toxic agent (Calcamuggi et al, 1992). For example, people
experiencing chronic inflammation might be less, rather than more, susceptible to drug
idiosyncrasy due to development of tolerance. Similarly, people with bacterial infections might
develop tolerance to LPS exposure before administration of an antibiotic, and this might
temporarily reduce the potential for idiosyncratic responses to antibiotic drugs.
The role of polymorphism or inborn errors of metabolism may also be important as risk
factors for idiosyncratic reactions. These include genes that encode for or control the expression
of inflammatory factors such as cytokines, reactive oxygen species, lipid mediators, proteases,
adhesion molecules or Toll-like receptors. Such genes are expected to control the magnitude of
the pro-inflammatory response to a particular amount of LPS or other inflammatory stimuli.
Other genes that would be expected to have important influences are those that determine target
cell sensitivity to inflammatory factors. As examples, genes controlling hepatocellular

140
glutathione or other antioxidants, and signal transduction might fall into this category. If this
connection proves to be correct, then genetic differences would render some people more likely
than others to develop an idiosyncratic response from the same exposure to drug and
inflammagen. Looking to the future, genotypic analysis could be used to identify at-risk
individuals before drug therapy is initiated.
Furthermore, the focus of this study was on hepatic idiosyncratic reactions, since the liver is
the most frequent drug target. Numerous other organ targets exist (skin in case of skin rashes or
bone marrow associated agranulocytois), and consideration should be given to the possibility that
modest, concurrent inflammation may also underlie their involvement in idiosyncrasy.
By broadening our thinking regarding the basis for drug idiosyncrasy, doors may open to
increase our understanding of toxicity mechanisms and to find ways for predicting or avoiding
such untoward reactions to otherwise useful drugs.

141
Reference List
Agarwal, S., Gupta, U. R., Gupta, R. C., Anand, N., and Agarwal, S. S., 1988. Susceptibility of glucose-6-phosphate dehydrogenase deficient red cells to primaquine enantiomers and two putative metabolites--I. Effect on reduced glutathione, methemoglobin content and release of hemoglobin. Biochem. Pharmacol. 37, 4605-4609.
Albano, E. and Tomasi, A., 1987. Spin trapping of free radical intermediates produced during the metabolism of isoniazid and iproniazid in isolated hepatocytes. Biochem. Pharmacol. 36, 2913-2920.
Amenta, J. S and Johnston, E. H, 1963. The Effects of hydrazine upon the metabolism of amino acids in the rat liver. Lab Invest 12, 921-928.
Anari, M. R., Khan, S., Jatoe, S. D., and O'Brien, P. J., 1997. Cytochrome P450 dependent xenobiotic activation by physiological hydroperoxides in intact hepatocytes. Eur. J. Drug Metab Pharmacokinet. 22, 305-310.
Andersson, B. S., Aw, T. Y., and Jones, D. P., 1987. Mitochondrial transmembrane potential and pH gradient during anoxia. Am. J. Physiol 252, C349-C355.
Andres, D., Sanchez-Reus, I., Bautista, M., and Cascales, M., 2003. Depletion of Kupffer cell function by gadolinium chloride attenuates thioacetamide-induced hepatotoxicity. Expression of metallothionein and HSP70. Biochem. Pharmacol. 66, 917-926.
Antunes, F. and Cadenas, E., 2001. Cellular titration of apoptosis with steady state concentrations of H(2)O(2): submicromolar levels of H(2)O(2) induce apoptosis through Fenton chemistry independent of the cellular thiol state. Free Radic. Biol. Med. 30, 1008-1018.
Arai, H., Nagao, A., Terao, J., Suzuki, T., and Takama, K., 1995. Effect of d-alpha-tocopherol analogues on lipoxygenase-dependent peroxidation of phospholipid-bile salt micelles. Lipids 30, 135-140.
Aruoma, O. I., Evans, P. J., Kaur, H., Sutcliffe, L., and Halliwell, B., 1990. An evaluation of the antioxidant and potential pro-oxidant properties of food additives and of trolox C, vitamin E and probucol. Free Radic. Res. Commun. 10, 143-157.
Babior, B. M., 2000. The NADPH oxidase of endothelial cells. IUBMB. Life 50, 267-269.
Balani, S. K., Zhu, T., Yang, T. J., Liu, Z., He, B., and Lee, F. W., 2002. Effective dosing regimen of 1-aminobenzotriazole for inhibition of antipyrine clearance in rats, dogs, and monkeys. Drug Metab Dispos. 30, 1059-1062.
Basivireddy, J., Jacob, M., Pulimood, A. B., and Balasubramanian, K. A., 2004. Indomethacin-induced renal damage: role of oxygen free radicals. Biochem. Pharmacol. 67, 587-599.

142
Bataller, R., Schwabe, R. F., Choi, Y. H., Yang, L., Paik, Y. H., Lindquist, J., Qian, T., Schoonhoven, R., Hagedorn, C. H., Lemasters, J. J., and Brenner, D. A., 2003. NADPH oxidase signal transduces angiotensin II in hepatic stellate cells and is critical in hepatic fibrosis. J. Clin. Invest 112, 1383-1394.
Bepler, CR, Baier, HN, McCracken, S, Rentschler, CL, Rogers, FB, and Lansbury, J, 1959. A 15 month controlled study of the effects of amodiaquine (camoquin) in rheumatoid arthritis. Arthritis Rheum. 403-413.
Black, M., Mitchell, J. R., Zimmerman, H. J., Ishak, K. G., and Epler, G. R., 1975. Isoniazid-associated hepatitis in 114 patients. Gastroenterology 69, 289-302.
Bonizzi, G., Piette, J., Merville, M. P., and Bours, V., 2000. Cell type-specific role for reactive oxygen species in nuclear factor-kappaB activation by interleukin-1. Biochem. Pharmacol. 59, 7-11.
Bourdi, M., Gautier, J. C., Mircheva, J., Larrey, D., Guillouzo, A., Andre, C., Belloc, C., and Beaune, P. H., 1992. Anti-liver microsomes autoantibodies and dihydralazine-induced hepatitis: specificity of autoantibodies and inductive capacity of the drug. Mol. Pharmacol. 42, 280-285.
Boutin, J. A., Kass, G. E., and Moldeus, P., 1989. Drug-induced hydrogen peroxide production in isolated rat hepatocytes. Toxicology 54, 129-137.
Boveris, A. and Cadenas, E., 1975. Mitochondrial production of superoxide anions and its relationship to the antimycin insensitive respiration. FEBS Lett. 54, 311-314.
Bowry, V. W., Mohr, D., Cleary, J., and Stocker, R., 1995. Prevention of tocopherol-mediated peroxidation in ubiquinol-10-free human low density lipoprotein. J. Biol. Chem. 270, 5756-5763.
Brand, M. D., Affourtit, C., Esteves, T. C., Green, K., Lambert, A. J., Miwa, S., Pakay, J. L., and Parker, N., 2004. Mitochondrial superoxide: production, biological effects, and activation of uncoupling proteins. Free Radic. Biol. Med. 37, 755-767.
Bright, H. J. and Porter, D. J., Boyer PD, 1975. Flavoprotein Oxidases. 421-503.
Brown, K. E., Brunt, E. M., and Heinecke, J. W., 2001. Immunohistochemical detection of myeloperoxidase and its oxidation products in Kupffer cells of human liver. Am. J. Pathol. 159, 2081-2088.
Brownlee, M., 2005. The pathobiology of diabetic complications: a unifying mechanism. Diabetes 54, 1615-1625.
Buch, H., Buzello, W., Heymann, E., and Krisch, K., 1969. Inhibition of phenacetin- and acetanilide-induced methemoglobinemia in the rat by the carboxylesterase inhibitor bis-[p-nitrophenyl] phosphate. Biochem. Pharmacol. 18, 801-811.

143
Buchweitz, J. P., Ganey, P. E., Bursian, S. J., and Roth, R. A., 2002. Underlying endotoxemia augments toxic responses to chlorpromazine: is there a relationship to drug idiosyncrasy? J. Pharmacol. Exp. Ther. 300, 460-467.
Cadenas, E. and Davies, K. J., 2000. Mitochondrial free radical generation, oxidative stress, and aging. Free Radic. Biol. Med. 29, 222-230.
Calcamuggi, G., Lanzio, M., Dughera, L., Babini, G., and Emanuelli, G., 1992. Endotoxin tolerance and polymyxin B modify liver damage and cholestasis induced by a single dose of alpha-naphthylisothiocyanate in the rat. Arch. Toxicol. 66, 126-130.
Cameron, H. A. and Ramsay, L. E., 1984. The lupus syndrome induced by hydralazine: a common complication with low dose treatment. Br. Med. J. (Clin. Res. Ed) 289, 410-412.
Castell, J. V., Jover, R., Martinez-Jimenez, C. P., and Gomez-Lechon, M. J., 2006. Hepatocyte cell lines: their use, scope and limitations in drug metabolism studies. Expert. Opin. Drug Metab Toxicol. 2, 183-212.
Chan, K., Jensen, N. S., Silber, P. M., and O'Brien, P. J., 2007. Structure-activity relationships for halobenzene induced cytotoxicity in rat and human hepatoctyes. Chem. Biol. Interact. 165, 165-174.
Cheeseman, K. H., McBrien, B. C. H. and Slater, T. F., 2008. Free Radicals, Lipid Peroxidation and Cancer. 197-214.
Cheng, W. H., Combs, G. F., Jr., and Lei, X. G., 1998. Knockout of cellular glutathione peroxidase affects selenium-dependent parameters similarly in mice fed adequate and excessive dietary selenium. Biofactors 7, 311-321.
Cheng, W. H., Ho, Y. S., Ross, D. A., Valentine, B. A., Combs, G. F., and Lei, X. G., 1997. Cellular glutathione peroxidase knockout mice express normal levels of selenium-dependent plasma and phospholipid hydroperoxide glutathione peroxidases in various tissues. J. Nutr. 127, 1445-1450.
Christie, G., Breckenridge, A. M., and Park, B. K., 1989. Drug-protein conjugates--XVIII. Detection of antibodies towards the antimalarial amodiaquine and its quinone imine metabolite in man and the rat. Biochem. Pharmacol. 38, 1451-1458.
Churchill, F. C., Patchen, L. C., Campbell, C. C., Schwartz, I. K., Nguyen-Dinh, P., and Dickinson, C. M., 1985. Amodiaquine as a prodrug: importance of metabolite(s) in the antimalarial effect of amodiaquine in humans. Life Sci. 36, 53-62.
Clarke, J. and Shannon, L. M., 1976. The isolation and characterization of the glycopeptides from horseradish peroxidase isoenzyme C. Biochim. Biophys. Acta 427, 428-442.
Cochrane, C. G., 1991. Mechanisms of oxidant injury of cells. Mol. Aspects Med. 12, 137-147.

144
Cohen, G and Hochstein, P, 1964. Generation of hydrogen peroxide in erythrocytes by hemolytic agents. Biochemistry 3, 895-900.
Comporti, M., Saccocci, C., and Dianzani, M. U., 1965. Effect of CCl-4 in vitro and in vivo on lipid peroxidation of rat liver homogenates and subcellular fractions. Enzymologia. 29, 185-204.
Cook, S., 2006. Coronary artery disease, nitric oxide and oxidative stress: the "Yin-Yang" effect--a Chinese concept for a worldwide pandemic. Swiss. Med. Wkly. 136, 103-113.
Coon, M. J., Ding, X. X., Pernecky, S. J., and Vaz, A. D., 1992. Cytochrome P450: progress and predictions. FASEB J. 6, 669-673.
Dallner, G., 1978. Isolation of microsomal subfractions by use of density gradients. Methods Enzymol. 52, 71-82.
Davies, M. J., Forni, L. G., and Willson, R. L., 1988. Vitamin E analogue Trolox C. E.s.r. and pulse-radiolysis studies of free-radical reactions. Biochem. J. 255, 513-522.
Davila, J. C. and Morris, D. L., 1999. Analysis of cytochrome P450 and phase II conjugating enzyme expression in adult male rat hepatocytes. In Vitro Cell Dev. Biol. Anim 35, 120-130.
De Duve, C. and Baudhuin, P., 1966. Peroxisomes (microbodies and related particles). Physiol Rev. 46, 323-357.
De Minicis, S. and Brenner, D. A., 2007. NOX in liver fibrosis. Arch. Biochem. Biophys. 462, 266-272.
de Vries, S., 1986. The pathway of electron transfer in the dimeric QH2: cytochrome c oxidoreductase. J. Bioenerg. Biomembr. 18, 195-224.
Decker, E. A., 1997. Phenolics: prooxidants or antioxidants? Nutr. Rev. 55, 396-398.
Deng, X., Luyendyk, J. P., Zou, W., Lu, J., Malle, E., Ganey, P. E., and Roth, R. A., 2007. Neutrophil interaction with the hemostatic system contributes to liver injury in rats cotreated with lipopolysaccharide and ranitidine. J. Pharmacol. Exp. Ther. 322, 852-861.
Dhand, R., Gilhotra, R., Sehgal, S., and Malik, S. K., 1987. Incidence of isoniazid-induced antinuclear antibodies in patients of tuberculosis. Indian J. Med. Res. 85, 503-507.
Diaz-Cruz, A., Guinzberg, R., Guerra, R., Vilchis, M., Carrasco, D., Garcia-Vazquez, F. J., and Pina, E., 2007. Adrenaline stimulates H2O2 generation in liver via NADPH oxidase. Free Radic. Res. 41, 663-672.
Dinauer, M. C., Deck, M. B., and Unanue, E. R., 1997. Mice lacking reduced nicotinamide adenine dinucleotide phosphate oxidase activity show increased susceptibility to early infection with Listeria monocytogenes. J. Immunol. 158, 5581-5583.

145
Dominguez, A. M, Amenta, J. S, Hill, C. S, and Domanski, T. J, 1962. Morphologic and biochemical alteration in the kidney of the hydrazine-treated rat. Aeromed. Acta 22, 1094-1097.
Droge, W., 2002. Free radicals in the physiological control of cell function. Physiol Rev. 82, 47-95.
Eastmond, D. A., Smith, M. T., Ruzo, L. O., and Ross, D., 1986. Metabolic activation of phenol by human myeloperoxidase and horseradish peroxidase. Mol. Pharmacol. 30, 674-679.
Eghbal, M. A., Tafazoli, S., Pennefather, P., and O'Brien, P. J., 2004. Peroxidase catalysed formation of cytotoxic prooxidant phenothiazine free radicals at physiological pH. Chem. Biol. Interact. 151, 43-51.
Ekstrom, T. and Hogberg, J., 1980. Chloroform-induced glutathione depletion and toxicity in freshly isolated hepatocytes. Biochem. Pharmacol. 29, 3059-3065.
Farombi, E. O., 2000. Influence of amodiaquine treatment on microsomal lipid peroxidation and antioxidant defense systems of rats. Pharmacol. Toxicol. 87, 249-254.
Fridovich, I., 1995. Superoxide radical and superoxide dismutases. Annu. Rev. Biochem. 64, 97-112.
Fukano, M., Amano, S., Sato, J., Yamamoto, K., Adachi, H., Okabe, H., Fujiyama, Y., and Bamba, T., 2000. Subacute hepatic failure associated with a new antidiabetic agent, troglitazone: a case report with autopsy examination. Hum. Pathol. 31, 250-253.
Fukuzawa, K., Tokumura, A., Ouchi, S., and Tsukatani, H., 1982. Antioxidant activities of tocopherols on Fe2+-ascorbate-induced lipid peroxidation in lecithin liposomes. Lipids 17, 511-513.
Galati, G., Sabzevari, O., Wilson, J. X., and O'Brien, P. J., 2002a. Prooxidant activity and cellular effects of the phenoxyl radicals of dietary flavonoids and other polyphenolics. Toxicology 177, 91-104.
Galati, G., Tafazoli, S., Sabzevari, O., Chan, T. S., and O'Brien, P. J., 2002b. Idiosyncratic NSAID drug induced oxidative stress. Chem. Biol. Interact. 142, 25-41.
Gale, E. A., 2001. Lessons from the glitazones: a story of drug development. Lancet 357, 1870-1875.
Gandhi, S. and Wood, N. W., 2005. Molecular pathogenesis of Parkinson's disease. Hum. Mol. Genet. 14 Spec No. 2, 2749-2755.
Garibaldi, R. A., Drusin, R. E., Ferebee, S. H., and Gregg, M. B., 1972. Isoniazid-associated hepatitis. Report of an outbreak. Am. Rev. Respir. Dis. 106, 357-365.

146
Gharib, B., Abdallahi, O. M., Dessein, H., and De Reggi, M., 1999. Development of eosinophil peroxidase activity and concomitant alteration of the antioxidant defenses in the liver of mice infected with Schistosoma mansoni. J. Hepatol. 30, 594-602.
Goldman, R., Claycamp, G. H., Sweetland, M. A., Sedlov, A. V., Tyurin, V. A., Kisin, E. R., Tyurina, Y. Y., Ritov, V. B., Wenger, S. L., Grant, S. G., and Kagan, V. E., 1999. Myeloperoxidase-catalyzed redox-cycling of phenol promotes lipid peroxidation and thiol oxidation in HL-60 cells. Free Radic. Biol. Med. 27, 1050-1063.
Goldman, R., Tsyrlov, I. B., Grogan, J., and Kagan, V. E., 1997. Reactions of phenoxyl radicals with NADPH-cytochrome P-450 oxidoreductase and NADPH: reduction of the radicals and inhibition of the enzyme. Biochemistry 36, 3186-3192.
Gregus, Z., Watkins, J. B., Thompson, T. N., and Klaassen, C. D., 1983. Depletion of hepatic uridine diphosphoglucuronic acid decreases the biliary excretion of drugs. J. Pharmacol. Exp. Ther. 225, 256-262.
Griendling, K. K., Sorescu, D., Lassegue, B., and Ushio-Fukai, M., 2000. Modulation of protein kinase activity and gene expression by reactive oxygen species and their role in vascular physiology and pathophysiology. Arterioscler. Thromb. Vasc. Biol. 20, 2175-2183.
Guillouzo, A., Morel, F., Fardel, O., and Meunier, B., 1993. Use of human hepatocyte cultures for drug metabolism studies. Toxicology 82, 209-219.
Hajieva, P. and Behl, C., 2006. Antioxidants as a potential therapy against age-related neurodegenerative diseases: amyloid Beta toxicity and Alzheimer's disease. Curr. Pharm. Des 12, 699-704.
Halliwell, B and Gutteridge, J. M. C., 2002. Free Radicals in Biology and Medicine. 3rd, 936-
Halliwell, B. and Gutteridge, J. M., 1985. The importance of free radicals and catalytic metal ions in human diseases. Mol. Aspects Med. 8, 89-193.
Hampton, M. B., Kettle, A. J., and Winterbourn, C. C., 1998. Inside the neutrophil phagosome: oxidants, myeloperoxidase, and bacterial killing. Blood 92, 3007-3017.
Hansch, C., Lien, E. J., and Helmer, F., 1968. Structure--activity correlations in the metabolism of drugs. Arch. Biochem. Biophys. 128, 319-330.
Harrison, A. C., Kitteringham, N. R., Clarke, J. B., and Park, B. K., 1992. The mechanism of bioactivation and antigen formation of amodiaquine in the rat. Biochem. Pharmacol. 43, 1421-1430.
Hartley, D. P., Kroll, D. J., and Petersen, D. R., 1997. Prooxidant-initiated lipid peroxidation in isolated rat hepatocytes: detection of 4-hydroxynonenal- and malondialdehyde-protein adducts. Chem. Res. Toxicol. 10, 895-905.

147
Hatton, C. S., Peto, T. E., Bunch, C., Pasvol, G., Russell, S. J., Singer, C. R., Edwards, G., and Winstanley, P., 1986. Frequency of severe neutropenia associated with amodiaquine prophylaxis against malaria. Lancet 1, 411-414.
Hayashi, T., Saito, A., Okuno, S., Ferrand-Drake, M., Dodd, R. L., and Chan, P. H., 2004. Oxidative injury to the endoplasmic reticulum in mouse brains after transient focal ischemia. Neurobiol. Dis. 15, 229-239.
Hayes, J. D. and McLellan, L. I., 1999. Glutathione and glutathione-dependent enzymes represent a co-ordinately regulated defence against oxidative stress. Free Radic. Res. 31, 273-300.
He, Q., Kim, J., and Sharma, R. P., 2005. Fumonisin B1 hepatotoxicity in mice is attenuated by depletion of Kupffer cells by gadolinium chloride. Toxicology 207, 137-147.
Hissin, P. J. and Hilf, R., 1976. A fluorometric method for determination of oxidized and reduced glutathione in tissues. Anal. Biochem. 74, 214-226.
Hofstra, A. H., Matassa, L. C., and Uetrecht, J. P., 1991. Metabolism of hydralazine by activated leukocytes: implications for hydralazine induced lupus. J. Rheumatol. 18, 1673-1680.
Hofstra, A. H. and Uetrecht, J. P., 1993. Reactive intermediates in the oxidation of hydralazine by HOCl: the major oxidant generated by neutrophils. Chem. Biol. Interact. 89, 183-196.
Hsiao, G., Lin, Y. H., Lin, C. H., Chou, D. S., Lin, W. C., and Sheu, J. R., 2001. The protective effects of PMC against chronic carbon tetrachloride-induced hepatotoxicity in vivo. Biol. Pharm. Bull. 24, 1271-1276.
Hussain, S. M. and Frazier, J. M., 2002. Cellular toxicity of hydrazine in primary rat hepatocytes. Toxicol. Sci. 69, 424-432.
Hwang, J. M., Tseng, T. H., Hsieh, Y. S., Chou, F. P., Wang, C. J., and Chu, C. Y., 1996. Inhibitory effect of atractylon on tert-butyl hydroperoxide induced DNA damage and hepatic toxicity in rat hepatocytes. Arch. Toxicol. 70, 640-644.
Ingold, K. U., Burton, G. W., Foster, D. O., Hughes, L., Lindsay, D. A., and Webb, A., 1987. Biokinetics of and discrimination between dietary RRR- and SRR-alpha-tocopherols in the male rat. Lipids 22, 163-172.
Itoh, S., Ichinoe, A., Tsukada, Y., and Itoh, Y., 1981. Hydralazine-induced hepatitis. Hepatogastroenterology 28, 13-16.
Jezek, P. and Hlavata, L., 2005. Mitochondria in homeostasis of reactive oxygen species in cell, tissues, and organism. Int. J. Biochem. Cell Biol. 37, 2478-2503.
Joly, J. G., Doyon, C., and Peasant, Y., 1975. Cytochrome P-450 measurement in rat liver homogenate and microsomes. Its use for correction of microsomal losses incurred by differential centrifugation. Drug Metab Dispos. 3, 577-586.

148
Joyeux, M., Rolland, A., Fleurentin, J., Mortier, F., and Dorfman, P., 1990. tert-Butyl hydroperoxide-induced injury in isolated rat hepatocytes: a model for studying anti-hepatotoxic crude drugs. Planta Med. 56, 171-174.
Kaderlik, K. R., Mulder, G. J., Shaddock, J. G., Casciano, D. A., Teitel, C. H., and Kadlubar, F. F., 1994. Effect of glutathione depletion and inhibition of glucuronidation and sulfation on 2-amino-1-methyl-6-phenylimidazo[4,5-b]pyridine (PhIP) metabolism, PhIP-DNA adduct formation and unscheduled DNA synthesis in primary rat hepatocytes. Carcinogenesis 15, 1711-1716.
Kagan, V. E., Kuzmenko, A. I., Shvedova, A. A., Kisin, E. R., Li, R., Martin, I., Quinn, P. J., Tyurin, V. A., Tyurina, Y. Y., and Yalowich, J. C., 2003. Direct evidence for recycling of myeloperoxidase-catalyzed phenoxyl radicals of a vitamin E homologue, 2,2,5,7,8-pentamethyl-6-hydroxy chromane, by ascorbate/dihydrolipoate in living HL-60 cells. Biochim. Biophys. Acta 1620, 72-84.
Kagan, V. E., Kuzmenko, A. I., Shvedova, A. A., Kisin, E. R., Tyurina, Y. Y., and Yalowich, J. C., 2000. Myeloperoxidase-catalyzed phenoxyl radicals of vitamin E homologue, 2,2,5,7,8-pentamethyl- 6-hydroxychromane, do not induce oxidative stress in live HL-60 cells. Biochem. Biophys. Res. Commun. 270, 1086-1092.
Kagan, V. E., Kuzmenko, A. I., Tyurina, Y. Y., Shvedova, A. A., Matsura, T., and Yalowich, J. C., 2001. Pro-oxidant and antioxidant mechanisms of etoposide in HL-60 cells: role of myeloperoxidase. Cancer Res. 61, 7777-7784.
Kagan, V. E., Tyurin, V. A., Jiang, J., Tyurina, Y. Y., Ritov, V. B., Amoscato, A. A., Osipov, A. N., Belikova, N. A., Kapralov, A. A., Kini, V., Vlasova, I. I., Zhao, Q., Zou, M., Di, P., Svistunenko, D. A., Kurnikov, I. V., and Borisenko, G. G., 2005. Cytochrome c acts as a cardiolipin oxygenase required for release of proapoptotic factors. Nat. Chem. Biol. 1, 223-232.
Kalyanaraman, B., Darley-Usmar, V., Struck, A., Hogg, N., and Parthasarathy, S., 1995. Role of apolipoprotein B-derived radical and alpha-tocopheroxyl radical in peroxidase-dependent oxidation of low density lipoprotein. J. Lipid Res. 36, 1037-1045.
Kato, A., Yoshidome, H., Edwards, M. J., and Lentsch, A. B., 2000. Regulation of liver inflammatory injury by signal transducer and activator of transcription-6. Am. J. Pathol. 157, 297-302.
Kawahara, T., Kohjima, M., Kuwano, Y., Mino, H., Teshima-Kondo, S., Takeya, R., Tsunawaki, S., Wada, A., Sumimoto, H., and Rokutan, K., 2005. Helicobacter pylori lipopolysaccharide activates Rac1 and transcription of NADPH oxidase Nox1 and its organizer NOXO1 in guinea pig gastric mucosal cells. Am. J. Physiol Cell Physiol 288, C450-C457.
Keisari, Y., Braun, L., and Flescher, E., 1983. The oxidative burst and related phenomena in mouse macrophages elicited by different sterile inflammatory stimuli. Immunobiology 165, 78-89.

149
Khan, A. U. and Wilson, T., 1995. Reactive oxygen species as cellular messengers. Chem. Biol. 2, 437-445.
Khan, S. and O'Brien, P. J., 1991. 1-bromoalkanes as new potent nontoxic glutathione depletors in isolated rat hepatocytes. Biochem. Biophys. Res. Commun. 179, 436-441.
Kitazawa, M., Podda, M., Thiele, J., Traber, M. G., Iwasaki, K., Sakamoto, K., and Packer, L., 1997. Interactions between vitamin E homologues and ascorbate free radicals in murine skin homogenates irradiated with ultraviolet light. Photochem. Photobiol. 65, 355-365.
Kresse, M., Latta, M., Kunstle, G., Riehle, H. M., van Rooijen, N., Hentze, H., Tiegs, G., Biburger, M., Lucas, R., and Wendel, A., 2005. Kupffer cell-expressed membrane-bound TNF mediates melphalan hepatotoxicity via activation of both TNF receptors. J. Immunol. 175, 4076-4083.
Kretz-Rommel, A. and Boelsterli, U. A., 1993. Diclofenac covalent protein binding is dependent on acyl glucuronide formation and is inversely related to P450-mediated acute cell injury in cultured rat hepatocytes. Toxicol. Appl. Pharmacol. 120, 155-161.
Kushnareva, Y., Murphy, A. N., and Andreyev, A., 2002. Complex I-mediated reactive oxygen species generation: modulation by cytochrome c and NAD(P)+ oxidation-reduction state. Biochem. J. 368, 545-553.
LaCagnin, L. B., Colby, H. D., and O'Donnell, J. P., 1986. The oxidative metabolism of hydralazine by rat liver microsomes. Drug Metab Dispos. 14, 549-554.
Lambert, A. J. and Brand, M. D., 2004a. Inhibitors of the quinone-binding site allow rapid superoxide production from mitochondrial NADH:ubiquinone oxidoreductase (complex I). J. Biol. Chem. 279, 39414-39420.
Lambert, A. J. and Brand, M. D., 2004b. Superoxide production by NADH:ubiquinone oxidoreductase (complex I) depends on the pH gradient across the mitochondrial inner membrane. Biochem. J. 382, 511-517.
Lambeth, J. D., Cheng, G., Arnold, R. S., and Edens, W. A., 2000. Novel homologs of gp91phox. Trends Biochem. Sci. 25, 459-461.
Larrey, D., Castot, A., Pessayre, D., Merigot, P., Machayekhy, J. P., Feldmann, G., Lenoir, A., Rueff, B., and Benhamou, J. P., 1986. Amodiaquine-induced hepatitis. A report of seven cases. Ann. Intern. Med. 104, 801-803.
LeBel, C. P., Ischiropoulos, H., and Bondy, S. C., 1992. Evaluation of the probe 2',7'-dichlorofluorescin as an indicator of reactive oxygen species formation and oxidative stress. Chem. Res. Toxicol. 5, 227-231.
LeCluyse, E. L., 2001. Human hepatocyte culture systems for the in vitro evaluation of cytochrome P450 expression and regulation. Eur. J. Pharm. Sci. 13, 343-368.

150
Lee, E., Miki, Y., Katsura, H., and Kariya, K., 1990. Mechanism of inactivation of myeloperoxidase by propylthiouracil. Biochem. Pharmacol. 39, 1467-1471.
Lei, X. G., Cheng, W. H., and McClung, J. P., 2007. Metabolic regulation and function of glutathione peroxidase-1. Annu. Rev. Nutr. 27, 41-61.
Li, X. Q., Bjorkman, A., Andersson, T. B., Ridderstrom, M., and Masimirembwa, C. M., 2002. Amodiaquine clearance and its metabolism to N-desethylamodiaquine is mediated by CYP2C8: a new high affinity and turnover enzyme-specific probe substrate. J. Pharmacol. Exp. Ther. 300, 399-407.
Lien, E. J., Ren, S., Bui, H. H., and Wang, R., 1999. Quantitative structure-activity relationship analysis of phenolic antioxidants. Free Radic. Biol. Med. 26, 285-294.
Liochev, S. I., 1999. The mechanism of "Fenton-like" reactions and their importance for biological systems. A biologist's view. Met. Ions. Biol. Syst. 36, 1-39.
Liu, C. L., Wang, J. M., Chu, C. Y., Cheng, M. T., and Tseng, T. H., 2002a. In vivo protective effect of protocatechuic acid on tert-butyl hydroperoxide-induced rat hepatotoxicity. Food Chem. Toxicol. 40, 635-641.
Liu, Y., Fiskum, G., and Schubert, D., 2002b. Generation of reactive oxygen species by the mitochondrial electron transport chain. J. Neurochem. 80, 780-787.
Loschen, G., Flohe, L., and Chance, B., 1971. Respiratory chain linked H(2)O(2) production in pigeon heart mitochondria. FEBS Lett. 18, 261-264.
Lu, L. S., Wu, C. C., Hung, L. M., Chiang, M. T., Lin, C. T., Lin, C. W., and Su, M. J., 2007. Apocynin alleviated hepatic oxidative burden and reduced liver injury in hypercholesterolaemia. Liver Int. 27, 529-537.
Luyendyk, J. P., Lehman-McKeeman, L. D., Nelson, D. M., Bhaskaran, V. M., Reilly, T. P., Car, B. D., Cantor, G. H., Maddox, J. F., Ganey, P. E., and Roth, R. A., 2006. Unique gene expression and hepatocellular injury in the lipopolysaccharide-ranitidine drug idiosyncrasy rat model: comparison with famotidine. Toxicol. Sci. 90, 569-585.
Luyendyk, J. P., Shores, K. C., Ganey, P. E., and Roth, R. A., 2002. Bacterial lipopolysaccharide exposure alters aflatoxin B(1) hepatotoxicity: benchmark dose analysis for markers of liver injury. Toxicol. Sci. 68, 220-225.
MacRae, W. D. and Stich, H. F., 1979. Induction of sister-chromatid exchanges in Chinese hamster ovary cells by thiol and hydrazine compoudns. Mutat. Res. 68, 351-365.
Maggs, J. L., Kitteringham, N. R., Breckenridge, A. M., and Park, B. K., 1987. Autoxidative formation of a chemically reactive intermediate from amodiaquine, a myelotoxin and hepatotoxin in man. Biochem. Pharmacol. 36, 2061-2062.

151
Maggs, J. L., Tingle, M. D., Kitteringham, N. R., and Park, B. K., 1988. Drug-protein conjugates--XIV. Mechanisms of formation of protein-arylating intermediates from amodiaquine, a myelotoxin and hepatotoxin in man. Biochem. Pharmacol. 37, 303-311.
Martelli, A., Allavena, A., Campart, G. B., Canonero, R., Ghia, M., Mattioli, F., Mereto, E., Robbiano, L., and Brambilla, G., 1995. In vitro and in vivo testing of hydralazine genotoxicity. J. Pharmacol. Exp. Ther. 273, 113-120.
Maru, G. B. and Bhide, S. V., 1982. Effect of antioxidants and antitoxicants of isoniazid on the formation of lung tumours in mice by isoniazid and hydrazine sulphate. Cancer Lett. 17, 75-80.
Marubayashi, S., Dohi, K., Ochi, K., and Kawasaki, T., 1986. Role of free radicals in ischemic rat liver cell injury: prevention of damage by alpha-tocopherol administration. Surgery 99, 184-192.
Metodiewa, D., Jaiswal, A. K., Cenas, N., Dickancaite, E., and Segura-Aguilar, J., 1999. Quercetin may act as a cytotoxic prooxidant after its metabolic activation to semiquinone and quinoidal product. Free Radic. Biol. Med. 26, 107-116.
Miller, E. R., Pastor-Barriuso, R., Dalal, D., Riemersma, R. A., Appel, L. J., and Guallar, E., 2005. Meta-analysis: high-dosage vitamin E supplementation may increase all-cause mortality. Ann. Intern. Med. 142, 37-46.
Misra, H. P. and Fridovich, I., 1976. The oxidation of phenylhydrazine: superoxide and mechanism. Biochemistry 15, 681-687.
Mitchell, J. R., Long, M. W., Thorgeirsson, U. P., and Jollow, D. J., 1975. Acetylation rates and monthly liver function tests during one year of isoniazid preventive therapy. Chest 68, 181-190.
Mitchell, J. R., Zimmerman, H. J., Ishak, K. G., Thorgeirsson, U. P., Timbrell, J. A., Snodgrass, W. R., and Nelson, S. D., 1976. Isoniazid liver injury: clinical spectrum, pathology, and probable pathogenesis. Ann. Intern. Med. 84, 181-192.
Moldeus, P., Hogberg, J., and Orrenius, S., 1978. Isolation and use of liver cells. Methods Enzymol. 52, 60-71.
Moridani, M. Y., Cheon, S. S., Khan, S., and O'Brien, P. J., 2003. Metabolic activation of 3-hydroxyanisole by isolated rat hepatocytes. Chem. Biol. Interact. 142, 317-333.
Mount, D. L., Patchen, L. C., Nguyen-Dinh, P., Barber, A. M., Schwartz, I. K., and Churchill, F. C., 1986. Sensitive analysis of blood for amodiaquine and three metabolites by high-performance liquid chromatography with electrochemical detection. J. Chromatogr. 383, 375-386.
Muller, F. L., Liu, Y., and Van Remmen, H., 2004. Complex III releases superoxide to both sides of the inner mitochondrial membrane. J. Biol. Chem. 279, 49064-49073.

152
Murata, K., Hamada, M., Sugimoto, K., and Nakano, T., 2007. A novel mechanism for drug-induced liver failure: inhibition of histone acetylation by hydralazine derivatives. J. Hepatol. 46, 322-329.
Nakamura, M., 1991. One-electron oxidation of Trolox C and vitamin E by peroxidases. J. Biochem. 110, 595-597.
Nathan, C. F. and Root, R. K., 1977. Hydrogen peroxide release from mouse peritoneal macrophages: dependence on sequential activation and triggering. J. Exp. Med. 146, 1648-1662.
Neftel, K. A., Woodtly, W., Schmid, M., Frick, P. G., and Fehr, J., 1986. Amodiaquine induced agranulocytosis and liver damage. Br. Med. J. (Clin. Res. Ed) 292, 721-723.
Nelson, S. D., Mitchell, J. R., Timbrell, J. A., Snodgrass, W. R., and Corcoran, G. B., III, 1976. Isoniazid and iproniazid: activation of metabolites to toxic intermediates in man and rat. Science 193, 901-903.
Noda, A., Hsu, K. Y., Noda, H., Yamamoto, Y., and Kurozumi, T., 1983. Is isoniazid-hepatotoxicity induced by the metabolite, hydrazine? J. UOEH. 5, 183-190.
O'Brien, P. J., 2000. Peroxidases. Chem. Biol. Interact. 129, 113-139.
O'Brien, P. J., 1988. Radical formation during the peroxidase catalyzed metabolism of carcinogens and xenobiotics: the reactivity of these radicals with GSH, DNA, and unsaturated lipid. Free Radic. Biol. Med. 4, 169-183.
O'Brien, P. J., 1991. Molecular mechanisms of quinone cytotoxicity. Chem. Biol. Interact. 80, 1-41.
O'Brien, P. J., Chan, K., and Silber, P. M., 2004. Human and animal hepatocytes in vitro with extrapolation in vivo. Chem. Biol. Interact. 150, 97-114.
O'Brien, P. J., Tafazoli, S., Chan, K., Mashregi, M., Mehta, R., and Shangari, N., 2007. A hepatocyte inflammation model for carbonyl induced liver injury: drugs, diabetes, solvents, chlorination. In: Weiner, H., Maser, E., Lindahl, R, and Plapp, B. (Eds.), Purdue University Press. West Lafayette, Indiana, pp. 105-112
Olliaro, P., Nevill, C., LeBras, J., Ringwald, P., Mussano, P., Garner, P., and Brasseur, P., 1996. Systematic review of amodiaquine treatment in uncomplicated malaria. Lancet 348, 1196-1201.
Orrenius, S., 2007. Reactive oxygen species in mitochondria-mediated cell death. Drug Metab Rev. 39, 443-455.
Ortiz de Montellano, P. R., 1995. Cytochrome P450. Structure, Mechanism and Biochemistry. 2nd,

153
Ortiz de Montellano, P. R. and Kerr, D. E., 1983. Inactivation of catalase by phenylhydrazine. Formation of a stable aryl-iron heme complex. J. Biol. Chem. 258, 10558-10563.
Ortiz de Montellano, P. R. and Mathews, J. M., 1981. Autocatalytic alkylation of the cytochrome P-450 prosthetic haem group by 1-aminobenzotriazole. Isolation of an NN-bridged benzyne-protoporphyrin IX adduct. Biochem. J. 195, 761-764.
Ostapowicz, G., Fontana, R. J., Schiodt, F. V., Larson, A., Davern, T. J., Han, S. H., McCashland, T. M., Shakil, A. O., Hay, J. E., Hynan, L., Crippin, J. S., Blei, A. T., Samuel, G., Reisch, J., and Lee, W. M., 2002. Results of a prospective study of acute liver failure at 17 tertiary care centers in the United States. Ann. Intern. Med. 137, 947-954.
Ott, M., Gogvadze, V., Orrenius, S., and Zhivotovsky, B., 2007. Mitochondria, oxidative stress and cell death. Apoptosis. 12, 913-922.
Ou, P. and Wolff, S. P., 1996. A discontinuous method for catalase determination at 'near physiological' concentrations of H2O2 and its application to the study of H2O2 fluxes within cells. J. Biochem. Biophys. Methods 31, 59-67.
Parks, D. A., Williams, T. K., and Beckman, J. S., 1988. Conversion of xanthine dehydrogenase to oxidase in ischemic rat intestine: a reevaluation. Am. J. Physiol 254, G768-G774.
Parodi, S., De Flora, S., Cavanna, M., Pino, A., Robbiano, L., Bennicelli, C., and Brambilla, G., 1981. DNA-damaging activity in vivo and bacterial mutagenicity of sixteen hydrazine derivatives as related quantitatively to their carcinogenicity. Cancer Res. 41, 1469-1482.
Pirmohamed, M., Naisbitt, D. J., Gordon, F., and Park, B. K., 2002. The danger hypothesis--potential role in idiosyncratic drug reactions. Toxicology 181-182, 55-63.
Poli, G., Albano, E., and Dianzani, M. U., 1987. The role of lipid peroxidation in liver damage. Chem. Phys. Lipids 45, 117-142.
Pradhan, A. D., Manson, J. E., Rifai, N., Buring, J. E., and Ridker, P. M., 2001. C-reactive protein, interleukin 6, and risk of developing type 2 diabetes mellitus. JAMA 286, 327-334.
Preusch, P. C., Siegel, D., Gibson, N. W., and Ross, D., 1991. A note on the inhibition of DT-diaphorase by dicoumarol. Free Radic. Biol. Med. 11, 77-80.
Quinn, M. T., Ammons, M. C., and Deleo, F. R., 2006. The expanding role of NADPH oxidases in health and disease: no longer just agents of death and destruction. Clin. Sci. (Lond) 111, 1-20.
Reed, D. J., Babson, J. R., Beatty, P. W., Brodie, A. E., Ellis, W. W., and Potter, D. W., 1980. High-performance liquid chromatography analysis of nanomole levels of glutathione, glutathione disulfide, and related thiols and disulfides. Anal. Biochem. 106, 55-62.

154
Reinehr, R., Becker, S., Eberle, A., Grether-Beck, S., and Haussinger, D., 2005. Involvement of NADPH oxidase isoforms and Src family kinases in CD95-dependent hepatocyte apoptosis. J. Biol. Chem. 280, 27179-27194.
Reitman, S. and Frankel, S, 1957. A colorimetric method for the determination of serum glutamic oxalacetic and glutamic pyruvic transaminases. Am. J. Clin. Pathol. 28, 56-63.
Remacle, J., Raes, M., Toussaint, O., Renard, P., and Rao, G., 1995. Low levels of reactive oxygen species as modulators of cell function. Mutat. Res. 316, 103-122.
Rhodes, E. G., Ball, J., and Franklin, I. M., 1986. Amodiaquine induced agranulocytosis: inhibition of colony growth in bone marrow by antimalarial agents. Br. Med. J. (Clin. Res. Ed) 292, 717-718.
Richter, C., Park, J. W., and Ames, B. N., 1988. Normal oxidative damage to mitochondrial and nuclear DNA is extensive. Proc. Natl. Acad. Sci. U. S. A 85, 6465-6467.
Riddles, P. W., Blakeley, R. L., and Zerner, B., 1979. Ellman's reagent: 5,5'-dithiobis(2-nitrobenzoic acid)--a reexamination. Anal. Biochem. 94, 75-81.
Ritov, V. B., Menshikova, E. V., Goldman, R., and Kagan, V. E., 1996. Direct oxidation of polyunsaturated cis-parinaric fatty acid by phenoxyl radicals generated by peroxidase/H2O2 in model systems and in HL-60 cells. Toxicol. Lett. 87, 121-129.
Robak, J. and Gryglewski, R. J., 1988. Flavonoids are scavengers of superoxide anions. Biochem. Pharmacol. 37, 837-841.
Roberts, R. A., Ganey, P. E., Ju, C., Kamendulis, L. M., Rusyn, I., and Klaunig, J. E., 2007. Role of the Kupffer cell in mediating hepatic toxicity and carcinogenesis. Toxicol. Sci. 96, 2-15.
Roth, R. A., Harkema, J. R., Pestka, J. P., and Ganey, P. E., 1997. Is exposure to bacterial endotoxin a determinant of susceptibility to intoxication from xenobiotic agents? Toxicol. Appl. Pharmacol. 147, 300-311.
Roth, R. A., Luyendyk, J. P., Maddox, J. F., and Ganey, P. E., 2003. Inflammation and drug idiosyncrasy--is there a connection? J. Pharmacol. Exp. Ther. 307, 1-8.
Rubbo, H., Radi, R., Trujillo, M., Telleri, R., Kalyanaraman, B., Barnes, S., Kirk, M., and Freeman, B. A., 1994. Nitric oxide regulation of superoxide and peroxynitrite-dependent lipid peroxidation. Formation of novel nitrogen-containing oxidized lipid derivatives. J. Biol. Chem. 269, 26066-26075.
Rubin, R. L., 2005. Drug-induced lupus. Toxicology 209, 135-147.
Runge-Morris, M. and Novak, R. F., 1993. Effects of phenelzine and hydralazine on hydrogen peroxide production and proteolysis in human red blood cells. J. Pharmacol. Exp. Ther. 267, 1401-1406.

155
Rwagacondo, C. E., Niyitegeka, F., Sarushi, J., Karema, C., Mugisha, V., Dujardin, J. C., Van Overmeir, C., van den, Ende J., and D'Alessandro, U., 2003. Efficacy of amodiaquine alone and combined with sulfadoxine-pyrimethamine and of sulfadoxine pyrimethamine combined with artesunate. Am. J. Trop. Med. Hyg. 68, 743-747.
Sagach, V. F., Scrosati, M., Fielding, J., Rossoni, G., Galli, C., and Visioli, F., 2002. The water-soluble vitamin E analogue Trolox protects against ischaemia/reperfusion damage in vitro and ex vivo. A comparison with vitamin E. Pharmacol. Res. 45, 435-439.
Santanam, N. and Parthasarathy, S., 1995. Paradoxical actions of antioxidants in the oxidation of low density lipoprotein by peroxidases. J. Clin. Invest 95, 2594-2600.
Saran, M., Michel, C., Stettmaier, K., and Bors, W., 2000. Arguments against the significance of the Fenton reaction contributing to signal pathways under in vivo conditions. Free Radic. Res. 33, 567-579.
Sarich, T. C., Adams, S. P., Petricca, G., and Wright, J. M., 1999. Inhibition of isoniazid-induced hepatotoxicity in rabbits by pretreatment with an amidase inhibitor. J. Pharmacol. Exp. Ther. 289, 695-702.
Sarich, T. C., Youssefi, M., Zhou, T., Adams, S. P., Wall, R. A., and Wright, J. M., 1996. Role of hydrazine in the mechanism of isoniazid hepatotoxicity in rabbits. Arch. Toxicol. 70, 835-840.
Satoh, K., Kadofuku, T., and Sakagami, H., 1997. Effect of Trolox, a synthetic analog of alpha-tocopherol, on cytotoxicity induced by UV irradiation and antioxidants. Anticancer Res. 17, 2459-2463.
Schafer, F. Q. and Buettner, G. R., 2001. Redox environment of the cell as viewed through the redox state of the glutathione disulfide/glutathione couple. Free Radic. Biol. Med. 30, 1191-1212.
Scharer, L. and Smith, J. P., 1969. Serum transaminase elevations and other hepatic abnormalities in patients receiving isoniazid. Ann. Intern. Med. 71, 1113-1120.
Scharschmidt, B. F., Lake, J. R., Renner, E. L., Licko, V., and Van Dyke, R. W., 1986. Fluid phase endocytosis by cultured rat hepatocytes and perfused rat liver: implications for plasma membrane turnover and vesicular trafficking of fluid phase markers. Proc. Natl. Acad. Sci. U. S. A 83, 9488-9492.
Schraufstatter, I. U., Hinshaw, D. B., Hyslop, P. A., Spragg, R. G., and Cochrane, C. G., 1986. Oxidant injury of cells. DNA strand-breaks activate polyadenosine diphosphate-ribose polymerase and lead to depletion of nicotinamide adenine dinucleotide. J. Clin. Invest 77, 1312-1320.
Sendo, T., Noda, A., Noda, H., Hsu, K. Y., and Yamamoto, Y., 1984. Metabolic hydrolysis of isoniazid by subcellular fractions of rat liver. J. UOEH. 6, 249-255.
156
Sharma, M. K. and Buettner, G. R., 1993. Interaction of vitamin C and vitamin E during free radical stress in plasma: an ESR study. Free Radic. Biol. Med. 14, 649-653.
Shatwell, K. P. and Segal, A. W., 1996. NADPH oxidase. Int. J. Biochem. Cell Biol. 28, 1191-1195.
Shaw, P. J., Hopfensperger, M. J., Ganey, P. E., and Roth, R. A., 2007. Lipopolysaccharide and trovafloxacin coexposure in mice causes idiosyncrasy-like liver injury dependent on tumor necrosis factor-alpha. Toxicol. Sci. 100, 259-266.
Sheu, J. R., Lee, C. R., Hsiao, G., Hung, W. C., Lee, Y. M., Chen, Y. C., and Yen, M. H., 1999. Comparison of the relative activities of alpha-tocopherol and PMC on platelet aggregation and antioxidative activity. Life Sci. 65, 197-206.
Singh, I., 1996. Mammalian peroxisomes: metabolism of oxygen and reactive oxygen species. Ann. N. Y. Acad. Sci. 804, 612-627.
Singh, I., 1997. Biochemistry of peroxisomes in health and disease. Mol. Cell Biochem. 167, 1-29.
Sinha, B. K., 1983. Enzymatic activation of hydrazine derivatives. A spin-trapping study. J. Biol. Chem. 258, 796-801.
Slater, T. F., 2008. Free radical mechanisms in tissue injury.
Smith, M. T., 2003. Mechanisms of troglitazone hepatotoxicity. Chem. Res. Toxicol. 16, 679-687.
Smith, M. T., Thor, H., Hartizell, P., and Orrenius, S., 1982. The measurement of lipid peroxidation in isolated hepatocytes. Biochem. Pharmacol. 31, 19-26.
Stadtman, E. R. and Levine, R. L., 2000. Protein oxidation. Ann. N. Y. Acad. Sci. 899, 191-208.
Starke, P. E. and Farber, J. L., 1985. Ferric iron and superoxide ions are required for the killing of cultured hepatocytes by hydrogen peroxide. Evidence for the participation of hydroxyl radicals formed by an iron-catalyzed Haber-Weiss reaction. J. Biol. Chem. 260, 10099-10104.
Starke, P. E., Gilbertson, J. D., and Farber, J. L., 1985. Lysosomal origin of the ferric iron required for cell killing by hydrogen peroxide. Biochem. Biophys. Res. Commun. 133, 371-379.
Straus, W., 1981. Cytochemical detection of mannose-specific receptors for glycoproteins with horseradish peroxidase as a ligand. Histochemistry 73, 39-47.
Suzuki, Y. J. and Packer, L., 1993. Inhibition of NF-kappa B activation by vitamin E derivatives. Biochem. Biophys. Res. Commun. 193, 277-283.

157
Tafazoli, S., Mashregi, M., and O'Brien, P. J., 2008. Role of hydrazine in isoniazid-induced hepatotoxicity in a hepatocyte inflammation model. Toxicol. Appl. Pharmacol. 229, 94-101.
Tafazoli, S. and O'Brien, P. J., 2004. Prooxidant activity and cytotoxic effects of indole-3-acetic acid derivative radicals. Chem. Res. Toxicol. 17, 1350-1355.
Tafazoli, S. and O'Brien, P. J., 2005. Peroxidases: a role in the metabolism and side effects of drugs. Drug Discov. Today 10, 617-625.
Tafazoli, S. and O'Brien, P. J., 2008. Accelerated cytotoxic mechanism screening of hydralazine using an in vitro hepatocyte inflammatory cell peroxidase model. Chem. Res. Toxicol. 21, 904-910.
Tafazoli, S., Spehar, D. D., and O'Brien, P. J., 2005a. Oxidative stress mediated idiosyncratic drug toxicity. Drug Metab Rev. 37, 311-325.
Tafazoli, S., Wright, J. S., and O'Brien, P. J., 2005b. Prooxidant and antioxidant activity of vitamin E analogues and troglitazone. Chem. Res. Toxicol. 18, 1567-1574.
Timbrell, J. A. and Harland, S. J., 1979. Identification and quantitation of hydrazine in the urine of patients treated with hydralazine. Clin. Pharmacol. Ther. 26, 81-88.
Timbrell, J. A., Scales, M. D., and Streeter, A. J., 1982. Studies on hydrazine hepatotoxicity. 2. Biochemical findings. J. Toxicol. Environ. Health 10, 955-968.
Tomasi, A., Billing, S., Garner, A., Slater, T. F., and Albano, E., 1983. The metabolism of halothane by hepatocytes: a comparison between free radical spin trapping and lipid peroxidation in relation to cell damage. Chem. Biol. Interact. 46, 353-368.
Toth, B., 1978. Tumorigenic effect of 1-hydrazinophthalazine hydrochloride in mice. J. Natl. Cancer Inst. 61, 1363-1365.
Toth, B. and Shubik, P., 1966. Carcinogenesis in Swiss mice by isonicotinic acid hydrazide. Cancer Res. 26, 1473-1475.
Tukov, F. F., Maddox, J. F., Amacher, D. E., Bobrowski, W. F., Roth, R. A., and Ganey, P. E., 2006. Modeling inflammation-drug interactions in vitro: a rat Kupffer cell-hepatocyte coculture system. Toxicol. In Vitro 20, 1488-1499.
Tyurina, Y. Y., Kini, V., Tyurin, V. A., Vlasova, I. I., Jiang, J., Kapralov, A. A., Belikova, N. A., Yalowich, J. C., Kurnikov, I. V., and Kagan, V. E., 2006. Mechanisms of cardiolipin oxidation by cytochrome c: relevance to pro- and antiapoptotic functions of etoposide. Mol. Pharmacol. 70, 706-717.
Ueda, J., Tsuchiya, Y., and Ozawa, T., 2001. Relationship between effects of phenolic compounds on the generation of free radicals from lactoperoxidase-catalyzed oxidation of NAD(P)H or GSH and their DPPH scavenging ability. Chem. Pharm. Bull. (Tokyo) 49, 299-304.

158
Uetrecht, J., 2005. Current trends in drug-induced autoimmunity. Autoimmun. Rev. 4, 309-314.
Valko, M., Rhodes, C. J., Moncol, J., Izakovic, M., and Mazur, M., 2006. Free radicals, metals and antioxidants in oxidative stress-induced cancer. Chem. Biol. Interact. 160, 1-40.
van den Bosch, H., Schutgens, R. B., Wanders, R. J., and Tager, J. M., 1992. Biochemistry of peroxisomes. Annu. Rev. Biochem. 61, 157-197.
Weglarz, L., Drozdz, M., Wardas, M., and Goss, M., 1989. Activities of antioxidant enzymes in fibroblasts cultured in vitro in the presence of hydralazine. Biomed. Biochim. Acta 48, 489-493.
Welinder, K. G., 1985. Plant peroxidases. Their primary, secondary and tertiary structures, and relation to cytochrome c peroxidase. Eur. J. Biochem. 151, 497-504.
Wernsdorfer, W. H., 1983. Urgent efforts needed to combat drug-resistant malaria. WHO Chron. 37, 11-13.
Whiting, R. F., Wei, L., and Stich, H. G., 1979. Enhancement by transition metals of unscheduled DNA synthesis induced by isoniazid and related hydrazines in cultured normal and xeroderma pigmentosum human cells. Mutat. Res. 62, 505-515.
Williams, D. P. and Park, B. K., 2003. Idiosyncratic toxicity: the role of toxicophores and bioactivation. Drug Discov. Today 8, 1044-1050.
Witting, P. K., Mohr, D., and Stocker, R., 1999. Assessment of prooxidant activity of vitamin E in human low-density lipoprotein and plasma. Methods Enzymol. 299, 362-375.
Wong, P. K., Poyer, J. L., DuBose, C. M., and Floyd, R. A., 1988. Hydralazine-dependent carbon dioxide free radical formation by metabolizing mitochondria. J. Biol. Chem. 263, 11296-11301.
Woo, J., Chan, C. H., Walubo, A., and Chan, K. K., 1992. Hydrazine--a possible cause of isoniazid--induced hepatic necrosis. J. Med. 23, 51-59.
Wright, J. S., Johnson, E. R., and DiLabio, G. A., 2001. Predicting the activity of phenolic antioxidants: theoretical method, analysis of substituent effects, and application to major families of antioxidants. J. Am. Chem. Soc. 123, 1173-1183.
Yamamoto, K. and Kawanishi, S., 1991. Free radical production and site-specific DNA damage induced by hydralazine in the presence of metal ions or peroxidase/hydrogen peroxide. Biochem. Pharmacol. 41, 905-914.
Yard, A. S and McKennis, H. Jr, 1955. Effect of structure on the ability of hydrazino compounds to produce fatty livers. J. Pharmacol. Exp. Ther. 114, 391-397.

159
Yokoyama, Y., Beckman, J. S., Beckman, T. K., Wheat, J. K., Cash, T. G., Freeman, B. A., and Parks, D. A., 1990. Circulating xanthine oxidase: potential mediator of ischemic injury. Am. J. Physiol 258, G564-G570.
Yu, B. P., 1994. Cellular defenses against damage from reactive oxygen species. Physiol Rev. 74, 139-162.
Zdolsek, J., Zhang, H., Roberg, K., and Brunk, U., 1993. H2O2-mediated damage to lysosomal membranes of J-774 cells. Free Radic. Res. Commun. 18, 71-85.
Zetterberg, G. and Bostrom, G., 1981. Mitotic gene conversion induced in yeast by isoniazid. influence of a transition metal and of the physiological conditions of the cells. Mutat. Res. 91, 215-219.
Zingale, S. B, Minzer, L, Rosenberg, B, and Lee, S. L, 1963. Drug induced lupus-like syndrome. Clinical and laboratory syndrome similar to systemic lupus erythematosus following antituberculous therapy: report of a case. Arch. Intern. Med. 112, 63-66.

160
Appendices
161
Appendix I: List of Drugs that did not Form Cytotoxic Radicals in the
Hepatocyte Inflammation Model

162
The toxicity of the following drugs did not increase in the presence of a H2O2 generating
system with or without peroxidase. This could be because 1) these drugs are not oxidized to
radicals by peroxidase/H2O2 or P450/H2O2; 2) rapid Phase II drug metabolism; 3) radicals
readily dimerize or disproportionate; 4) radicals formed are strong antioxidants or 4) the radicals
formed are reduced by P450 reductases. More research is required to further determine the
mechanism(s) involved.
Table AI.1 List of the drugs that did not form cytotoxic pro-oxidant radicals in the hepatocyte inflammation model Name of the drugs tested
Therapeutic use
Dose range tested
Tribromoethanol (Avertin®)
Anesthetic
0.1 – 1 mM
Acetylsalicylic acid (Aspirin®) Analgesic 1 - 5 mM Ranitidine (Zantac®) Antacid 0.5 - 2 mM Naproxen (Naprosyn®, Aleve®) Antipyretic/Analgesic 0.3 - 3 mM Ciglitazone Antidiabetic 0.1 - 1 mM Pioglitazone (Actos®) Antidiabetic 0.1 – 1 mM Leflunomide (Arava®)
Anti-arthritic 0.1 – 1 mM
Hepatocytes (106 cells/mL) were preincubated at 37oC for 30 min in Krebs-Henseleit buffer (pH 7.4). Hepatocytes were treated with different concentrations of drugs and were then exposed to non-toxic H2O2 generating system (10 mM glucose and 0.5 U/mL glucose oxidase), in the presence and absence of 0.1 µM horseradish peroxidase (HRP) to mimic an inflammatory response. Cell viability was determined by trypan blue uptake.

163
Br
BrBr
OH
2,2,2-Tribromoethanol (Avertin)
OH
O
O
CH3O
Acetylsalicylic acid (Aspirin)
N
CH3
H3C O
SNH NH
NO2
CH3
Ranitidine (Zantac)
CH3
O
CO2H
CH3
Naproxen (Aleve)
CH3
O
NHS
O
O
Ciglitazone
N
N
SO
O
H3C
O
Pioglitazone (Actos)
F
F
F
HN
O
O
N
CH3
Leflunomide (Arava)
Figure AI.1 Structure of the drugs that did not form cytotoxic pro-oxidant radicals in the hepatocyte inflammation model

164
Appendix II: A Preliminary In vivo Rat Study

165
The following in vivo animal study was carried out using t-BHP to assess the effect of
inflammation on increased hydrazine-induced hepatotoxicity:
AII. 1 Animal treatment
Male Sprague-Dawley rats (200 ± 10g) were fed standard chow and housed in clear plastic
cages. Care and treatment of the rats were in compliance with the guidelines of the Canadian
Council on Animal Care, and the protocol was approved by the University of Toronto Animal
Care Committee. The following environmental conditions applied throughout the course of the
study; 12 h light/day cycle (lights on at 05:00 h), and an ambient temperature of 21–23 °C with a
50–60% relative humidity. The animals were allowed to acclimatize for 1 week and were fed a
diet of standard rat chow and given water ad libitum. After 1 week the animals were randomized
and divided equally into five groups of three animals each: Group A (control) received vehicle
(0.9% saline solution) only. Group B was given 0.05 mmol/kg t-BHP (dissolved in 0.9% saline)
intraperitoneally (i.p.). Group C was injected i.p. with 10 mg/kg hydrazine hydrate (dissolved in
water). Group D was co-treated with t-BHP and hydrazine and Group E was given t-BHP 2
hours before hydrazine administration. Animal were then anesthetized 18 hrs later by CO2
inhalation as described (Liu et al, 2002a) and the blood samples were collected from abdominal
aorta and plasma was separated by centrifugation and was aliquoted for storage at -20 °C for
later analysis. A small portion of liver was removed for the GSH assay.

166
AII. 2 Hepatotoxicity assessments
The hepatic enzymes, aspartate aminotransferase (AST) and alanine aminotransferase (ALT),
were used as the markers for early acute hepatic damage. The serum activities of AST and ALT
were determined spectrophotometrically using Infinity-ALT reagent from Thermo Electron
Corp. (Louisville, U.S.A) (Reitman and Frankel, 1957), as summarized in Figures AII.1 and 2.
AII.3 GSH assay
Reduced GSH was determined as described by the method of Hissin and Hilf (Hissin and
Hilf, 1976). Briefly, the liver sample was homogenized in 1 mL of 0.2 M phosphate buffer (pH
8), and the mixture was centrifuged at 12,000 × g for 30 min. A supernatant (0.5 mL) was mixed
with 0.5 mL of 4% 5-sulfosalicylic acid, kept 5 min at 4 °C, and centrifuged again at 3000 × g
for 10 min. The supernatant obtained (0.5 mL) was mixed with 2 mL of 0.2 M phosphate buffer
and 10 mL of 10 mM Ellman’s reagent, 5,5′-dithiobis(2-nitrobenzoic acid) (DTNB). The
absorbance was measured at 412 nm. The procedure is based on the reaction of the thiol with
DTNB to give the mixed disulfide and 2-nitro-5-thiobenzoic acid (TNB) which is quantified by
the absorbance of the dianion (TNB2-) at 412 nm. The molar absorption coefficient of purified
TNB2- at 412 nm (14,150 M-1 cm-1) was used to calculate the concentration of GSH (Riddles et
al, 1979). The results are shown in Figure AII.3.
AII.4 Statistical analysis
Statistical analysis was performed by one-way ANOVA.

167
0
100
200
300
400
500
600
700
800
900
1000
18 h
ALT
(U/L
)Group A: Control (vehicle only)
Group B: t-BHP only
Group C: Hydrazine only
Group D: t-BHP + Hydrazine (co-treatment)
Group E: t-BHP (pretreated for 2 h) + Hydrazine
*
*
Figure AII.1 Hydroperoxide oxidative stress increased hydrazine-induced hepatotoxicity in vivo (using ALT as a biomarker) Hepatotoxicity was followed by increased serum alanine aminotransferase (ALT) activity assayed spectrophotometrically using Infinity-ALT reagent. The animals were randomized and divided equally into five groups of three animals and the i.p. treatments were as follows: Group A (control): vehicle (0.9% saline solution) only; Group B: 0.05 mmol/kg t-BHP (dissolved in 0.9% saline); Group C: 10 mg/kg hydrazine hydrate (dissolved in water); Group D: Co-treatment with t-BHP and hydrazine; Group E: Pretreatment with 0.05 mmol/kg t-BHP 2 hours before 10 mg/kg hydrazine. *Significant as compared to animals treated with vehicle only (P < 0.05). Means ± SE of 3 animals were used.

168
0
100
200
300
400
500
600
700
800
18 h
AST
(U/L
)Group A: Control (vehicle only)
Group B: t-BHP only
Group C: Hydrazine only
Group D: t-BHP + Hydrazine (co-treatment)
Group E: t-BHP (pretreated for 2 h) + Hydrazine
*
*
Figrue AII.2 Hydroperoxide oxidative stress increased hydrazine-induced hepatotoxicity in vivo (using AST as a biomarker) Hepatotoxicity was followed by increased serum aspartate aminotransferase (AST) activity assayed spectrophotometrically using Infinity-AST reagent. The animals were randomized and divided equally into five groups of three animals and the i.p. treatments were as follows: Group A (control): vehicle (0.9% saline solution) only; Group B: 0.05 mmol/kg t-BHP (dissolved in 0.9% saline); Group C: 10 mg/kg hydrazine hydrate (dissolved in water); Group D: Co-treatment with t-BHP and hydrazine; Group E: Pretreatment with 0.05 mmol/kg t-BHP 2 hours before 10 mg/kg hydrazine. *Significant as compared to animals treated with vehicle only (P < 0.05). Means ± SE of 3 animals were used.

169
0
10
20
30
40
50
60
70
80
90
18 h
[GSH
] uM
/mg
prot
ein
Group A: Control (vehicle only)
Group B: t-BHP only
Group C: Hydrazine only
Group D: t-BHP + Hydrazine (co-treatment)
Group E: t-BHP (pretreated for 2 h) + Hydrazine
*
*
Figure AII.3 Effects of t-BHP and hydrazine co-treatment on hepatic levels of GSH (µg/mg protein) The concentration of GSH was calculated by using the extinction coefficient of 14,150 M-1 cm-1 following the addition of DTNB (Ellman’s reagent). The animals were randomized and divided equally into five groups of three animals and the intraperitoneally treatments were as follows: Group A (control): vehicle (0.9% saline solution) only; Group B: 0.05 mmol/kg t-BHP (dissolved in 0.9% saline); Group C: 10 mg/kg hydrazine hydrate (dissolved in water); Group D: Co-treatment with t-BHP and hydrazine; Group E: Pretreatment with 0.05 mmol/kg t-BHP 2 hours before 10 mg/kg hydrazine. *Significant as compared to animals treated with vehicle only (P < 0.05). Means ± SE of 3 animals were used.

170
Appendix III: The Cytotoxic Pathways of the Idiocyncratic Drugs Researched
in the Thesis Chapters

171
HO
OO
NHS
O
OTroglitazone
O
OO
NHS
O
OTroglitazone quinone
OHCYP3A4
HRP/H2O2
O
OO
NHS
O
OPhenoxy radical
GSH
GS
O2
O2 H2O2AscH2
AscH
Figure AIII.1 Proposed troglitazone-induced toxicity in the hepatocyte inflammation model (Chapter 2)

172
Oxidative Stress
N
CO NH-NH2
NH2-NH2
Hydrazine
Isoniazid
N
CO OH
Isonicotinic acid
+
Amidase
P450/H2O2
Reactive intermediatee.g., Hydrazyl radical
O2 O2
H2O2
Protein carbonylation ROS
Figure AIII.2 Proposed mechanism of isoniazid cytotoxicity in the inflammation model: Role of hydrazine (Chapter 3)

173
N
N
NHNH2
Hydralazine
2Glucose + O2 +2H2O 2Gluconic acid + 2 H2O2 PeroxidaseGOx
Reactive intermediates i.e.hydralazyl radical & diimine
Extracellular
Intracellular
Reactive intermediates i.e.hydralazyl radical & diimine
Lipid peroxidation
Protein carbonylation
O2O2
H2O2ROS
Catalase inactivation
Oxidative Stress
Figure AIII.3 Hydralazine-induced oxidative stress in the hepatocyte peroxidase inflammation model (Chapter 4)

174
ROS scavengers
OHCH2N
NH
C2H5
C2H5
NClAmodiaquine
CH2N
NH
C2H5
C2H5
NCl
O
Quinoneimine
CYP450
NADHNAD+
DT-diaphorase
HRP/H2O2
O
CH2N
NH
C2H5
C2H5
NCl
O2
Semiquinoneimine
O2
H2O2GSH
GSSG
Protein Carbonylation
Glutathione conjugate
Amodiaquine glucuronide
Mitochondrial toxicity
Dicumarol
ABTBorneol
Figure AIII.4 Proposed mechanism of amodiaquine-induced cytotoxicity in the hepatocyte inflammation model (Chapter 5)


