
Website:http://www.megaholdings.com.tw
Mega Financial Holding Co., Ltd.
Annual Report 2012
Stock Code:2886

Spokesperson Dun-Jin Luh, Executive Vice PresidentTel: +886-2-2563-3156 ext.2662Email: [email protected]
Deputy SpokespersonJui-Ying Tsai, Vice President & Head of Treasury DepartmentTel: +886-2-2357-8888 ext. 500Email: [email protected]
HeadquartersMega Financial Holding Co., Ltd.Address: 14-16F, No. 123, Jhongsiao E. Road, Sec. 2, Taipei 100, Taiwan, R.O.C.Tel: +886-2-2357-8888 Fax: +886-2-3393-8755 Website: http://www.megaholdings.com.tw
Stock Transfer AgentMega Securities Co., Ltd.Address: 1F, No. 95, Jhongsiao E. Road, Sec. 2, Taipei 100, TaiwanTel: +886-2-3393-0898Website: http://www.emega.com.tw
Credit Rating AgencyTaiwan Ratings Corp.Address: 49F, No. 7, Shinyi Road, Sec. 5, Taipei 110, TaiwanTel: +886-2-8722-5800
Moody's Investors Service Hong Kong Limited Address: 24/F One Pacific Place, 88 Queensway, Admiralty, Hong KongTel: +1-212-553-0300
Auditors PricewaterhouseCoopers, TaiwanAddress: 27F, No. 333, Keelung Road, Sec. 1, Taipei 110, TaiwanTel: +886-2-2729-6666Website:http://www.pwc.com/tw

2012 ANNUAL REPORT
Letter to Shareholders 1.1 Review of Business Operations in 2012 1.2 Business Plan for 2013 1.3 Future Development Strategies 1.4 Impact from External Competition, Rules and Regulations, and the Overall
Operation Environment1.5 Credit Ratings
Company Profile 2.1 Date of Incorporation 2.2 Company History
Corporate Governance Report 3.1 Organization 3.2 Directors, Supervisors and Management Team 3.3 Implementation of Corporate Governance 3.4 Information Regarding Independent Auditor3.5 Changes in Shareholding of Directors, Supervisors, Executives and Major Shareholders3.6 Information Disclosing the Relationship between any of the Company’s Top Ten
Shareholders 3.7 Long-term Investment Ownership
Capital Overview 4.1 Capital and Shares 4.2 Issuance of Corporate Bonds 4.3 Preferred Stock 4.4 Depositary Receipts4.5 Employee Stock Options4.6 New Restricted Employee Shares 4.7 Merger and Acquisition of Other Financial Institutions4.8 Financing Plans and Implementation
Operational Overview 5.1 Business Overview 5.2 Operating Policies in 2013 5.3 Industry Overview 5.4 Market Supply and Demand Forecast 5.5 Human Resources
Financial Information 6.1 Five-Year Financial Summary 6.2 Five-Year Financial Analysis6.3 Consolidated Financial Statements
Review of Financial Conditions, Operating Results, and Risk Management7.1 Analysis of Financial Status 7.2 Analysis of Operational Results 7.3 Analysis of Cash Flow 7.4 Investment Policies in 2012 7.5 Review of Investment Performance 7.6 Investment Plans for 2013 7.7 Analysis of Risk Management
Special Disclosure8.1 Affiliated Companies Chart 8.2 Summary of Affiliated Companies 8.3 Operational Highlights of Affiliated Companies
CO
NT
EN
TS
Contents
24
10131011
1112
131414
1617
4418354950
5152
535458606060606060
616266676970
71727678
196197197198198199200200
207208209211

OUR VISION—being your best financial service partner2
Letter to ShareholdersLetter to Shareholders
Letter to Shareholders
32012 ANNUAL REPORT
Letter to Shareholders
The continuous effect of the Eurozone debt crisis,
together with factors such as fiscal deficits and severe
unemployment problems of advanced countries, has
caused international financial unrest and weak global
demand. The global economy of 2012 continued
the downturn situation of the second half of 2011.
Besides, general economic growth remained weak.
Main international economic institutions lowered
their forecasts on the global economic growth rate
on several occasions. The International Monetary
Foundation (IMF) announced, in April, 2013, that
the global economic growth rate for 2012 was 3.2%,
lower than the figure for 2011 of 3.9%. Looking
forward to 2013, if the Eurozone debt crisis and
the US’s fiscal deficit can be relieved, the global
economic growth rate could slightly increase to 3.3%.
Economic growth momentum remains moderate.
Affected by the drop in the expansion momentum
of global economy, Taiwan’s foreign exports for the first half of 2012 declined, dragging down private
consumption and investment. However, the global economy become more stable after September 2012.
As the demand for telecommunication products and mobile devices flourished, foreign trade, industrial
production and export orders improved. Annual growth rate of the CPI showed a slight increase; followed
by a decrease in the unemployment rate. Directorate General of Budget, Accounting and Statistics
announced an economic growth rate for 2012 of 1.32%. Benefiting from a more stable global economy
and innovation of smart phones, tablet PCs and large-size digital TVs, etc., business of related industries
such as semiconductors, electronic components & parts and TFT-LCD industries have seen good growth.
Continuous increase in investment by semiconductors industry and the returned overseas Taiwanese
businessmen has also pushed up domestic production capacity, increasing the overall value of exports and
investments. Therefore, Taiwan’s economic growth rate in 2013 is expected to be higher than that in 2012.
Looking back on 2012, while facing the unfavorable conditions brought about by the continuous
decline of the international economy and a stagnant domestic economy, the Company and its subsidiaries
have achieved the best performance seen in recent years, stabilizing its position as an outstanding financial
holding company in Taiwan.
In 2012, the Company posted an annual consolidated net profit after taxes of NT$21,544 million, an
increase of 21.88% from year 2011, and an EPS after taxes of NT$1.88, attaining top industry ranking. The
operation results of the Company in 2012 are shown below:
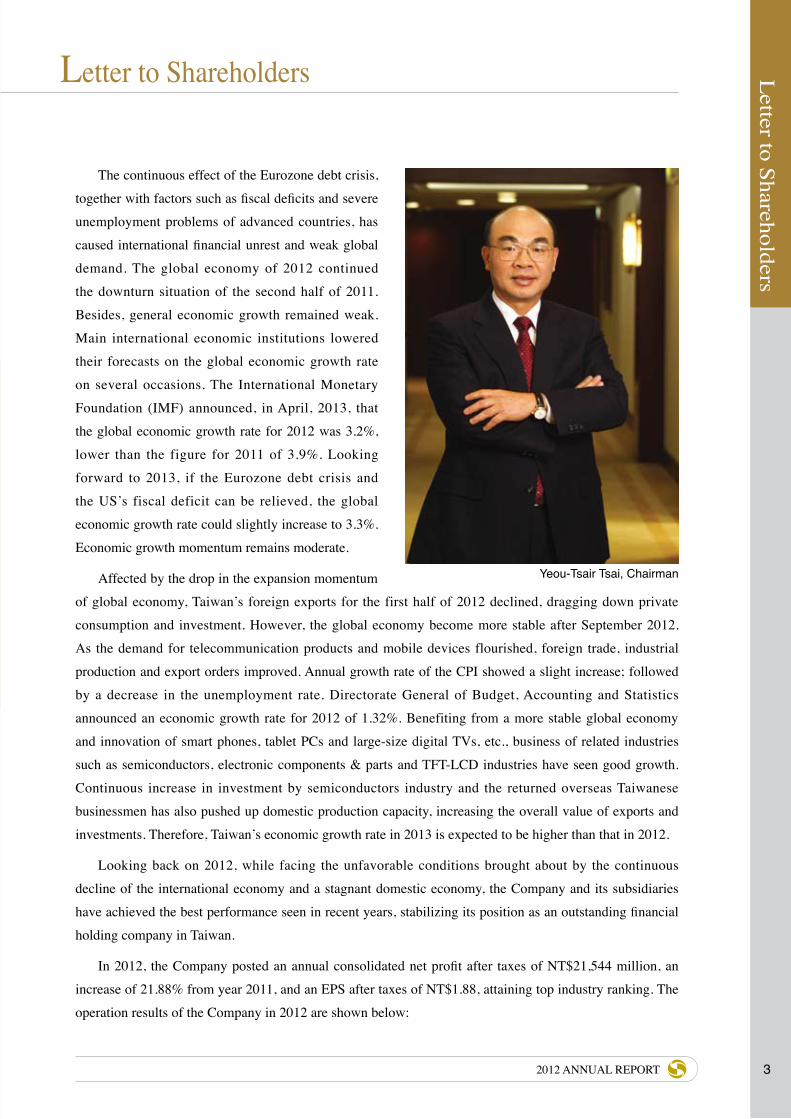
Yeou-Tsair Tsai, Chairman
Letter to Shareholders

OUR VISION—being your best financial service partner4
Letter to ShareholdersLetter to Shareholders
1.1 Review of Business Operations in 2012
1.1.1 Global and Domestic Financial Environment
In 2012, although the Eurozone debt crisis slightly improved, Eurozone economies are still weak. China’s economic growth remained slow and likewise the U.S. economy had little momentum, thus the global economy still faced risk of further downturn. The major economy such as Europe, the U.S., and Japan all adopted Quantitative Easing (QE) policy, in an effort to improve economic conditions, despite the existing low interest rates environment. Meanwhile, due to factors like stable consumer prices, a high unemployment rate, low economic growth momentum and the Federal Fund Rate approaching zero, the U.S. government executed QE3. This had a substantial effect on international economy and finance. The prime minister of Japan, Abe Shinzo, since being elected president of the Liberty Democratic Party, has declared depreciating the yen, lifting inflation target as well as easing fiscal and monetary policies, the so-called Abenomics. Since economic conditions in Europe & U.S. are increasingly stable, and the Japanese trade deficit continues, the heavy depreciation of yen will likely cause currency battles within Asian countries.
For the domestic economy, due to considerations of global economic uncertainty, which may stunt domestic economic growth, the Central Bank maintained the existing rediscount rate for five consecutive quarters from September, 2011. The consumer price index in 2012 increased 1.93% YoY; overall price level remained stable. For the foreign exchange market, the exchange rate for NTD against USD has fluctuated in a narrow range; the average exchange rate of NTD against USD, in 2012 was 29.608, depreciating 0.49% on 2011. The equity market after April, 2012, was dragged down by the decline of international stock markets, the proposed capital gains tax and the hike in both oil and electricity prices. The stock index of Taiwan Stock Exchange fell below 6,900 in June, while fluctuating between 7,000~7,800 between July and December.
1.1.2 Organization Integration
As of the end of 2012, the number of subsidiary companies, in which the Company has direct controlling interest, remains the same as it is in 2011. The subsidiary companies are Mega International Commercial Bank Co., Ltd., Mega Securities Co., Ltd., Mega Bills Finance Co., Ltd., Chung Kuo Insurance Co., Ltd., Mega International Investment Trust Co., Ltd., Mega Asset Management Co., Ltd., Mega Life Insurance Agency Co., Ltd. and Mega
Kuang-Si Shiu, President

52012 ANNUAL REPORT
Letter to Shareholders
Venture Capital Co., Ltd.
1.1.3 Business Operations of the Subsidiaries
According to the Financial Holding Company Act, the business scope of a Financial Holding Company shall be limited to investment in, and management of, its invested enterprise(s). The operation results of our subsidiary companies are summarized as follows:
Mega International Commercial Bank
Corporate banking
Mega International Commercial Bank ranked 2nd in Taiwan’s syndicated loan market with 10.56% of
market share. By the end of 2012, the corporate loans business captured the fourth position among local
banks, with a market share of 7.49%. Loans extended to small and medium sized enterprises had a market
share of 6.54%, ranked 7th among local banks.
Consumer banking and wealth management
Mega International Commercial Bank’s consumer loans outstanding reaching NT$293 billion by the end of 2012, up 4.2% from the previous year. The bank and other subsidiaries of the Company together generated NT$2.47 billion of wealth management fee income in 2012, growing 16.51% from the previous year. Listed below is the average volume of its business:
Units: NT$ million, except foreign exchange in US$ million
YearItem 2012 2011 Change (%)
Deposits 1,611,683 1,520,738 5.98
Loans, import financing and export financing 1,497,498 1,398,950 7.04
Corporate financing 1,208,624 1,125,006 7.43
Consumers financing (Note) 288,874 273,944 5.45
Foreign exchange (US$) 767,763 761,823 0.78
Securities purchased 226,832 233,580 ( 2.89 )
Long-term equity investments 27,617 28,281 ( 2.35 )
Trust assets 289,494 256,508 12.86
Note : Consumers financing excludes credit card loans.
Asset quality
The non-performing loans outstanding at the end of 2012 amounted to NT$3,563 million, representing a non-performing loan ratio of 0.17%, lower than the overall average for Taiwanese domestic banks of 0.40% as disclosed by the FSC. The bank’s bad debt coverage ratio was 641.18%, higher than the overall average 274%.

OUR VISION—being your best financial service partner6
Letter to ShareholdersLetter to Shareholders
Mega Securities Co., Ltd. (MSC)
Mega Securities Co., Ltd. achieved a market share of 3.25% in securities brokerage, raking 10th in the
local securities market. The company issued 1,206 warrants in total with a total amount of NT$5 billion.
The company’s operating volume in 2012 is shown in the following table:
Item 2012 2011 Change (%)
Securities brokerage Market share 3.25% 3.36% ( 3.27 )
Equity underwriting
Number of initial public offering lead managed by MSC 4 issues 4 issues -
Number of subsequent public offering lead managed by MSC 6 issues 6 issues -
Bonds underwritingNumber of issues lead managed by MSC 1 issues 4 issues ( 75.00 )
Amount NT$5 billion NT$12 billion ( 58.33 )
New financial products
Number of warrants issued 1,206 issues 995 issues 21.21
Amount of warrants issued NT$10.5 billion NT$11.6 billion ( 9.48 )
Mega Bills Finance Co., Ltd.
Mega Bills Finance Co., Ltd. topped the industry in the issuance, and guarantee, of commercial paper, with a market share of 31.57% and 35.79%, respectively. Bills trading in secondary markets also held the first position, with a market share of 38.12%. Bond trading had a market share of 27.93%, also topped the industry. As shown in the table below, the company’s business volume in underwriting and purchase of bills rose 4.05%, while guaranteed issues of commercial paper grew 6.14% in 2012. The company’s operating volume in 2012 is shown as follows:
Units: NT$ million
Item 2012 2011 Change (%)
Underwriting and purchase of bills 1,876,115 1,803,100 4.05
Guaranteed issues of commercial paper 1,704,681 1,606,140 6.14
Dealing in bills 9,430,418 9,740,259 ( 3.18 )
Dealing in bonds 4,838,912 5,981,968 ( 19.11 )
Guaranteed issues of commercial paper outstanding 133,996 124,587 7.55
Payments for overdue credits 0 0 0
Percentage of payments for overdue credits (%) 0 0 0

72012 ANNUAL REPORT
Letter to Shareholders
Chung Kuo Insurance Co., Ltd.
Chung Kuo Insurance Company’s direct written premiums grew 8.48% to NT$5,921 million, in 2012,
with inward reinsurance premiums up 11.90%. The company’s operating performance in 2012 is shown as
follows:
Unit: NT$ million
Item 2012 2011 Change (%)
Direct written premiums 5,921 5,458 8.48
Inward reinsurance premiums 743 664 11.90
Total 6,664 6,122 8.85
Mega International Investment Trust Co., Ltd.Unit: NT$ million
Item 2012 2011 Change (%)
Public funds under management 74,587 75,934 ( 1.42 )
Private funds under management 73 69 5.80
Assets of discretionary account 132 105 25.71
Total 75,062 76,108 ( 1.37 )
Mega Asset Management Co., Ltd.Unit: NT$ million
Item 2012 2011 Change (%)
Gains from disposal of NPL and the underlying collateral 768 496 54.84
Rental revenues 42 0 -
Other revenues 112 191 ( 41.36 )
Total 922 687 34.21
Mega Venture Capital Co., Ltd.Unit: NT$ million
Item 2012 2011 Change (%)
Drawdown of long term equity investment 157 305 ( 48.52 )
Original cost of long term equity investment 924 927 ( 0.32 )
Mega Life Insurance Agency Company Co., Ltd.Unit: NT$ million
Item 2012 2011 Change (%)
Commission income 1,214 606 100.33

OUR VISION—being your best financial service partner8
Letter to ShareholdersLetter to Shareholders
1.1.4 Budget Implementation
The CompanyUnit: NT$1,000, except EPS in NT$
Item Final accountingfigure, 2012 Budget figure, 2012 Implemented
(%)
Revenues 22,721,436 18,189,378 124.92
Expenses and losses 712,369 721,449 98.74
Net income before tax from continuing operations 22,009,067 17,467,929 126.00
Net income 21,533,141 17,015,915 126.55
Earnings per share 1.88 1.49 126.17
The Company's SubsidiaryUnit: NT$1,000
Name of subsidiary Net income before tax - actual
Net income before tax - budget
Implemented(%)
Mega International Commercial Bank Co., Ltd. 22,573,398 16,330,233 138.23
Mega Securities Co., Ltd. 126,715 1,089,238 11.63
Mega Bills Finance Co., Ltd. 3,348,559 2,778,650 120.51
Chung Kuo Insurance Co., Ltd. 265,959 371,694 71.55
Mega Asset Management Co., Ltd. 752,570 446,629 168.50
Mega Life Insurance Agency Co., Ltd. 190,074 106,226 178.93
Mega Venture Capital Co., Ltd. 12,421 12,873 96.49
Mega International Investment Trust Co., Ltd. 117,269 132,966 88.19
The pretax profit of Mega Securities Co., Ltd. achieved only 11.63% of its budget goal in 2012. It was mainly because of the adverse effect on the stock market from the Eurozone debt crisis, U.S. deficit problems and the proposed domestic capital gains tax in Taiwan. These caused a sizable drop in trading volume of the stock market, which in turn affected the company’s brokerage fee income.
The income before income tax of Chung Kuo Insurance Co., Ltd. in 2012 achieved 71.55% of its budget goal, mainly due to insurance losses from the Thai floods.
The income before income tax of Mega Venture Capital Co., Ltd. in 2012 failed to reach its budget goal because the gains on disposal of securities did not reach predicted targets.
The budget achievement rate of Mega International Investment Trust Co. Ltd, in 2012 was 88.19%, mainly due to decline of management income from mutual funds under management and increase of indemnity provision on privately offered funds.
1.1.5 Financial ResultsConsolidated net profit before taxation of the Company and its subsidiaries in 2012 was
NT$25,835,677 thousand, an increase of NT$4,720,173 thousand or 22.35% compared to 2011, mainly due to increase of net interest income of NT$2,272,899 thousand and non-interest income of NT$3,251,266 thousand. The growth of consolidated net non-interest revenue was due to increase in gains on disposal of financial assets and foreign exchange gains, offset by the decrease of income from sale of non-performing loans

92012 ANNUAL REPORT
Letter to Shareholders
and gains on disposal of assets. Another factor affecting net profit before tax is the rise in expenditure of NT$803,992 thousand, due to increase of provision for bad debts offset by decrease of operating expenses. A breakdown of the financial results of the Company and its subsidiaries in 2012 are shown in the table below:
Unit: NT$ thousand, except EPS in NT$
Company Net Income Before Tax
Net Income After Tax
Earnings Per Share
Net Income Ratio(%)
Return on Total Assets
(%)
Return on Shareholders'
Equity (%)Mega FHC & Its Subsidiaries 25,835,677 21,543,614 1.88 42.03* 0.81 10.33
Mega FHC (Unconsolidated) 22,009,067 21,533,141 1.88 94.77 9.11 10.34
Mega International Commercial Bank Co., Ltd. 22,573,398 19,333,472 2.80 44.82* 0.82 11.27
Mega Securities Co., Ltd. 126,715 77,190 0.07 2.91 0.23 0.56
Mega Bills Finance Co., Ltd. 3,348,559 2,880,966 2.20 67.44* 1.30 8.81
Chung Kuo Insurance Co., Ltd. 265,959 205,876 0.69 5.00 1.38 4.29
Mega Asset Management Co., Ltd. 752,570 621,075 3.11 68.61 5.79 22.47
Mega Life Insurance Agency Co., Ltd. 190,074 157,761 78.88 13.00 61.76 97.34
Mega Venture Capital Co., Ltd. 12,421 12,412 0.12 7.36 1.73 1.75
Mega International Investment Trust Co., Ltd. 117,269 97,181 1.84 29.65 11.35 11.98
Note: 1.*Net income ratio = Net income after tax / Net revenue 2. Return on assets = Net income after tax / Average total assets; Return on equity = Net income after tax / Average
shareholders’ equity
1.1.6 Research and Development
The Company and its subsidiaries’ research and development progress in 2012 is summarized as follows:
A. The Company
・Assessing the feasibility of merger or acquisition of other financial institutions
B. Bank subsidiary
・Publishing the Mega Bank Monthly, which includes monographs and articles covering the latest international and domestic economic and financial news and is made public periodically on the bank’s website
・Submitting periodical and non-periodical research reports on the development of the global economic and financial situations
C. Securities subsidiary
・Accomplished establishment of Mega Electronic Banking Systems for wealth management, integrating domestic Home Trading System for Securities, Futures, Options, Emerging Stocks and Hong Kong Stocks HTS ( Home Trading System ) trading system.
・Made application to the Central Bank for the license of wealth management services for distribution of overseas mutual funds, by means of Trust. Meanwhile, head office & another 5 branches launched wealth management services by means of Trust.

OUR VISION—being your best financial service partner10
Letter to ShareholdersLetter to Shareholders
・After obtaining license from the Central Bank for issuing foreign stock warrants, the company issued the first listed warrant CMCC (China Mobile Communications Corporation).
D. Bills subsidiary
・Finished organization restructure and modification of performance assessment system.
・Preparing a system structure to meet requirement of Basel III.
E. Non-life insurance subsidiary
・Developing a total of 314 new insurance products in 2012, including 222 “Use and File” products, and 92 “Simple Prior Approval” products
F. Investment trust subsidiary
・Offering one overseas funds, namely, the Mega Global Consumer Fund and the Mega Global Bond Fund of Funds
1.2 Business Plan for 2013
1.2.1 Operating Guidelines
・Cultivate more clients & create synergy within our group.
・Strengthen relationships with institutional investors.
・Concentrate & focus on our core competency, to create the greatest value for our shareholders.
・Enhancing the risk management system and related information system
・Upgrade our management efficiency, and optimize financial performance.
・Strengthen information security of the Group, and raise the ability to manage the information systems.
・Enhancing human resource management to increase organizational effectiveness.
・Fulfilling the energy-saving and carbon emission reduction policy and enhancing group purchase to save administrative expenses.
・Engaging actively in social welfare activities to fulfill the corporate social responsibility and boost corporate image.
・Integrating the Group’s fixed assets utilization to raise overall assets utilization efficiency.
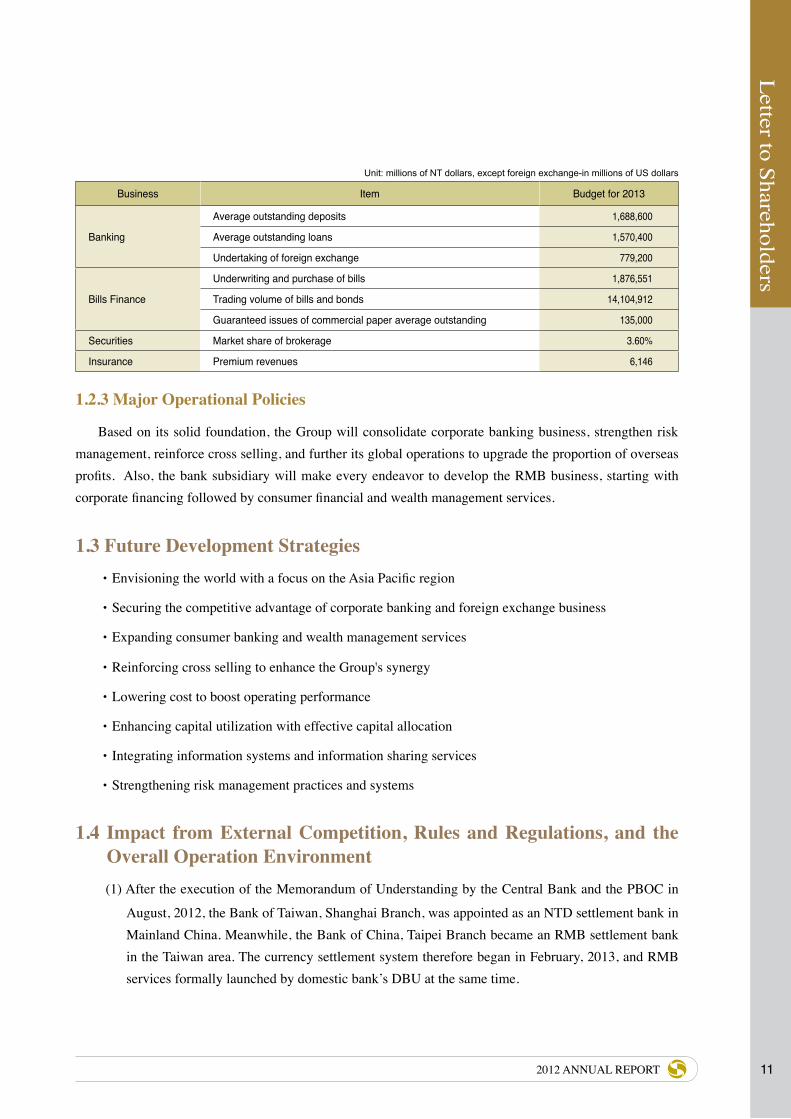
1.2.2 Business Objectives
We strive to maintain stable profitability and leadership in the market so as to consolidate the Group's position as a leading financial institution in Taiwan. Our business objectives for 2013 are as follows:
112012 ANNUAL REPORT
Letter to Shareholders
Unit: millions of NT dollars, except foreign exchange-in millions of US dollars
Business Item Budget for 2013
Banking
Average outstanding deposits 1,688,600
Average outstanding loans 1,570,400
Undertaking of foreign exchange 779,200
Bills Finance
Underwriting and purchase of bills 1,876,551
Trading volume of bills and bonds 14,104,912
Guaranteed issues of commercial paper average outstanding 135,000
Securities Market share of brokerage 3.60%
Insurance Premium revenues 6,146
1.2.3 Major Operational Policies
Based on its solid foundation, the Group will consolidate corporate banking business, strengthen risk management, reinforce cross selling, and further its global operations to upgrade the proportion of overseas profits. Also, the bank subsidiary will make every endeavor to develop the RMB business, starting with corporate financing followed by consumer financial and wealth management services.
1.3 Future Development Strategies・Envisioning the world with a focus on the Asia Pacific region
・Securing the competitive advantage of corporate banking and foreign exchange business
・Expanding consumer banking and wealth management services
・Reinforcing cross selling to enhance the Group's synergy
・Lowering cost to boost operating performance
・Enhancing capital utilization with effective capital allocation
・Integrating information systems and information sharing services
・Strengthening risk management practices and systems
1.4 Impact from External Competition, Rules and Regulations, and the Overall Operation Environment(1) After the execution of the Memorandum of Understanding by the Central Bank and the PBOC in
August, 2012, the Bank of Taiwan, Shanghai Branch, was appointed as an NTD settlement bank in Mainland China. Meanwhile, the Bank of China, Taipei Branch became an RMB settlement bank in the Taiwan area. The currency settlement system therefore began in February, 2013, and RMB services formally launched by domestic bank’s DBU at the same time.

OUR VISION—being your best financial service partner12
Letter to ShareholdersLetter to Shareholders
(2) Ever since the cross-strait currency settlement system has been established, restrictions on RMB business are continuously being lifted. This will benefit the growth of corporate financing and wealth management business of domestic banks, bringing in more profits.
1.5 Credit RatingsAs of the end of April 30, 2013, the Company and its subsidiaries retained the same credit rating as
granted in 2012. Set forth below are the summary of our credit ratings:
Company Credit Rating Agency Long-Term Short-Term Outlook Date of Issuance
Mega Financial Holding CompanyTaiwan Ratings Corp. twAA- twA-1+ Stable Oct. 19, 2012
Moody's A3 - Stable Feb. 7, 2013
Mega International Commercial Bank
Taiwan Ratings Corp. twAA+ twA-1+ Stable Oct. 19, 2012
Moody's A1 P-1 Stable Feb. 7, 2013
S & P A A-1 Stable Oct. 19, 2012
FitchAA(twn) F1+(twn) Stable Feb. 5, 2013
A- F2 Stable Feb. 5, 2013
Mega Bills Finance Co., Ltd. Taiwan Ratings Corp. twAA twA-1+ Stable Oct. 22, 2012
Mega Securities Co., Ltd. Taiwan Ratings Corp. twAA- twA-1+ Stable Oct. 22, 2012
Chung Kuo Insurance Co., Ltd.
Taiwan Ratings Corp. twAA- - Stable Oct. 25, 2012
Moody's A3 - Stable Dec. 10, 2012
S & P BBB+ - Stable Oct. 23, 2012
Looking forward to 2013, factors such as the risk of Eurozone debt, U.S. fiscal deficit issues, weak
growth momentum in China, and economic and trade tension caused by Quantitative Easing policies for
the yen still prevail. Global economy is facing lots of challenges. We must pay more attention to impact of
these tensions on Taiwan’s foreign trades. For domestic demand, real wages have not been raised, volume
of stock transactions is low, government consumption and expenditure is simplified. These factors may
contract private consumption. In short, though the overall economic environment is better than the previous
year, there are still many uncertainties. Thus, the Company will be more prudent in risk management, while
looking for business opportunities with a more aggressive attitude in a hope to extend the past excellent
performance. Meanwhile, the Company looks forward to your continuous support and advice.
Chairman of the Board President

Com
pany Profile
132012 ANNUAL REPORT
Company Profile

Com
pany Profile
14 OUR VISION—being your best financial service partner
Company Profile
2.1 Date of Incorporation: February 4, 2002
2.2 Company History
Date Milestones
February 4, 2002
Founded by Chiao Tung Bank Co., Ltd. (“CTB”) and International Securities Co., Ltd. (“IS”) through
the exchange of shares, and simultaneously listed on the Taiwan Stock Exchange with the name of
CTB Financial Holding Company (Code 2886)
August 22, 2002Acquired a 100% equity stake in Chung Hsing Bills Finance Corporation (now renamed as Mega Bills
Finance Co., Ltd.) and Barits Securities Corp. (“BS”) through a share swap
November 7, 2002Acquired a 28.01% equity stake in the International Commercial Bank of China (“ICBC”, now renamed
as Mega International Commercial Bank Co., Ltd.)
December 31, 2002
Acquired a 100% equity stake in both ICBC and Chung Kuo Insurance Co., Ltd. (“CKI”) through a
share swap, and change the the Company’s name from CTB Financial Holding Co., Ltd. to Mega
Financial Holding Co., Ltd.
January 31, 2003
IS merged with BS and Chung Hsing Securities Corp., a subsidiary of Chung Hsing Bills Finance
Corp., and renaming Barits International Securities Co., Ltd. (now known as Mega Securities Co., Ltd.
(MSC))
May 29, 2003
Upgraded the Central Securities Investment Trust Corporation (CSITC), originally an investee of
MSC, to become the Company's direct subsidiary through cash purchase of controlling shares, and
changed CSITC’s name into Mega Investment Trust Corp. (“MITC”)
December 5, 2003Set up a wholly owned subsidiary - Mega Asset Management Co., Ltd., with an issued capital of
NT$2,000 million
September 23, 2005
Upgraded Chung Yin Insurance Agency Company, originally a wholly-owned subsidiary of ICBC, to
the Company’s direct subsidiary by acquiring its 100% shares in cash and renamed it as Mega Life
Insurance Agency Co., Ltd.
December 13, 2005Established a wholly owned subsidiary - Mega CTB Venture Capital Co., Ltd., (now renamed as Mega
Venture Capital Co., Ltd.,) with an issued capital of NT$1,000 million
December 16, 2005 The Board of Directors resolved to acquire 5% to 26% stake of the Taiwan Business Bank
May 23, 2006Subscribed new shares of International Investment Trust Co., Ltd. (IIT) in which ICBC originally
owned 59.13% equity interest, and achieved a combined equity interest of 97.76% with ICBC
July – August 2006All direct subsidiaries were renamed “Mega”, except the English name of insurance subsidiary -
Chung Kuo Insurance Co., Ltd.
August 21, 2006
The two banking units, the International Commercial Bank of China (“ICBC”) and Chiao Tung Bank
(“CTB”), were merged, with ICBC as the surviving company renamed Mega International Commercial
Bank

Corporate G
overnance Report
152012 ANNUAL REPORT
Date Milestones
September 17, 2007The two security investment trust subsidiaries, IIT and MITC, were merged, with IIT as the surviving
company renamed Mega International Investment Trust Co., Ltd.
December 30, 2008Mega International Investment Trust Co., Ltd. (MIIT) becomes a wholly owned subsidiary of the
Company, after the reduction and increase of capital by MIIT to offset loss
April 7, 2009 Mega CTB Venture Capital Co., Ltd. was renamed as Mega Venture Capital Co., Ltd.
April 26, 2011The Board of Directors resolved to issue exchangeable bonds to dispose of the shareholding of
Taiwan Business Bank
Corporate G
overnance Report
16
Corporate Governance Report
OUR VISION—being your best financial service partner
Corporate Governance Report

Corporate G
overnance Report
172012 ANNUAL REPORT
3.1 Organization
Major Corporate Functions
Business Development Department・Corporate planning, strategic investment・Business strategy and development・Institutional investor relations
Risk Management Department・Risk management
Electronic Data Processing Department・IT development and operation
Administration Department・Human resources management and staff training ・Corporate legal affairs, documentation, procurement and public relations
Treasury Department ・Finance and accounting services including treasury, tax, and financial and accounting management
Auditing Office・Internal audit and process compliance
Corporate Governance Report
Electronic Data Processing Department
Treasury Department
Administration Department
General Shareholders’
Meeting
Auditing Office
Chief Internal Auditor
Business Development Department
Risk Management Department
Executive Vice President
President
Audit Committee
Board of Directors
Remuneration Committee
Organization Chart
Risk Management Committee
Chairman

Corporate G
overnance Report
18
Corporate Governance Report
OUR VISION—being your best financial service partner
3.2 Directors, Supervisors and Management Team3.2.1 Directors and Supervisors
Title Name Date Elected
Term(Years)
Date First Elected
Shareholding when Elected
Current Shareholding
Spouse &Minor
Shareholding
Shareholding by NomineeArrangement Experience & Education Other Position
Executives, Directors or Supervisors
who are spouses or within two degrees of kinship
Shares % Shares % Shares % Shares % Title Name Relation
Chairman
Yeou-Tsair Tsai( Representative of the Ministry of Finance, ROC )
06/15/2012 3 07/01/2010 1,126,151,609 9.98 1,143,043,883 9.98 0 0 0 0
President of Taiwan Cooperative Bank, President of the Int’l Commercial Bank of China, Chairman of Mega Int’l Commercial Bank Co., Ltd., President of Mega Financial Holding Co., Ltd., Chairman of Mega Int’l Investment Trust Co., Ltd., Chairman of Bank SinoPac, Chief Executive Officer of SinoPac Holdings
M.A. in Public Finance,National Chengchi University
Chairman of Mega Int’l Commercial Bank Co., Ltd., Director of Taiwan Stock Exchange Corporation, Director of Taipei Financial Center Corporation, Director of Taiwan Asset Management Corporation, Director of National Credit Card Center of R.O.C., Managing Director of The Bankers Association of The Republic of China, Director of Chinese International Economic Cooperation Association, Chairman of Mega Charity Foundation, Director of The Int’l Commercial Bank of China Cultural and Educational Foundation, Director of Taiwan Academy of Banking and Finance, Chairman of Financial Planning Association of Taiwan
None None None
DirectorKuang-Si Shiu( Representative of the Ministry of Finance, ROC )
06/15/2012 3 07/15/2008 1,126,151,609 9.98 1,143,043,883 9.98 283,855 0.00 0 0Executive Vice President of Chiao Tung Bank, Executive Vice President of Mega Financial Holding Co., Ltd.
MBA, Indiana University, Indiana, U.S.A.
Managing Director and President of Mega Int’l Commercial Bank Co., Ltd., Chairman of Mega Int’l Commercial Bank (Canada), Director of Mega Int’l Investment Trust Co., Ltd., Director of ICBC Assets Management & Consulting Co., Ltd., Director of Mega Int’l Commercial Bank Public Co., Ltd., Director of Taiwan Finance Corp., Director of Financial Information Service Co., Ltd., Director of The Int’l Commercial Bank of China Cultural and Educational Foundation, Director of Mega Charity Foundation, Supervisor of Trade-Van Information Services Co., Ltd., Supervisor of the Institute for Information Industry
None None None
Director
Ching-Tsai Chen ( Representative of the Ministry of Finance, ROC )
06/15/2012 3 09/25/2008 1,126,151,609 9.98 1,143,043,883 9.98 0 0 0 0
Deputy Minister, Directorate General of Budget, Accounting and Statistics (DGBAS), Executive Yuan, R.O.C.
M.A. in Accounting,National Chengchi University
Deputy Secretary-General, Executive Yuan, R.O.C.Managing Director of Small and Medium Enterprise Credit Guarantee Fund of Taiwan
None None None
Director
Ying-Wei Peng( Representative of the Ministry of Finance, ROC )
07/15/2012 2.92 07/15/2012 1,126,151,609 9.98 1,143,043,883 9.98 0 0 0 0Executive Secretary / Senior Officer, Legal Committee, Ministry of Finance, R.O.C.
M.A. in Laws, National Chengchi University
Director-General, Department of Legal Affairs,Ministry of Finance, R.O.C.Director of Mega Int’l Commercial Bank Co., Ltd.
None None None
Director
Joanne Ling( Representative of the Ministry of Finance, ROC )
06/15/2012 3 06/15/2012 1,126,151,609 9.98 1,143,043,883 9.98 657 0.00 0 0
Chief Secretary, Ministry of Finance, R.O.C.Director-General, National Tax Administration of Northern Taiwan Province, Ministry of Finance, R.O.C.Director-General, Taipei National Tax Administration, Ministry of Finance, R.O.C.
M.A. in Public Finance, National Chengchi University
Director-General, National Treasury Agency, Ministry of Finance, R.O.C.Director of Financial Information Service Co., Ltd.
None None None
Director
Tzong-Yau Lin( Representative of the Ministry of Finance, ROC )
06/15/2012 3 02/20/2012 1,126,151,609 9.98 1,143,043,883 9.98 0 0 0 0
Representative of New York Representative Office, Central Bank of the R.O.C.Advisor / Deputy Director General, Department of Economic Research, Central Bank of the R.O.C.
Ph.D. in Economics, University of Southern California, U.S.A.
Director General, Department of Economic Research, Central Bank of the R.O.C.Director of Taiwan Academy of Banking and Finance
None None None
Director
Hung-Wen Chien( Representative of the Ministry of Finance, ROC )
06/15/2012 3 06/15/2012 1,126,151,609 9.98 1,143,043,883 9.98 1,147,827 0.010 0 0
Director of Taiwan Depository & Clearing CorporationDirector of Taiwan Stock Exchange Corporation (TWSE)Chairman of Taiwan Securities Association
EMBA program in Finance, National Taiwan University
Chairman of Taiwan Integrated Shareholder Service Company, Director of GreTai Sercurities Market, Director of Mega International Commercial Co., Ltd., Director of Mega Futures Co., Ltd., Director of Mega Charity Foundation, Director of Ho Tie Investment Co., Ltd.,Chairman of Ho Kao Shan Int’l Investment Co., Ltd.
None None None

Corporate G
overnance Report
192012 ANNUAL REPORT
3.2 Directors, Supervisors and Management Team3.2.1 Directors and Supervisors
Title Name Date Elected
Term(Years)
Date First Elected
Shareholding when Elected
Current Shareholding
Spouse &Minor
Shareholding
Shareholding by NomineeArrangement Experience & Education Other Position
Executives, Directors or Supervisors
who are spouses or within two degrees of kinship
Shares % Shares % Shares % Shares % Title Name Relation
Chairman
Yeou-Tsair Tsai( Representative of the Ministry of Finance, ROC )
06/15/2012 3 07/01/2010 1,126,151,609 9.98 1,143,043,883 9.98 0 0 0 0
President of Taiwan Cooperative Bank, President of the Int’l Commercial Bank of China, Chairman of Mega Int’l Commercial Bank Co., Ltd., President of Mega Financial Holding Co., Ltd., Chairman of Mega Int’l Investment Trust Co., Ltd., Chairman of Bank SinoPac, Chief Executive Officer of SinoPac Holdings
M.A. in Public Finance,National Chengchi University
Chairman of Mega Int’l Commercial Bank Co., Ltd., Director of Taiwan Stock Exchange Corporation, Director of Taipei Financial Center Corporation, Director of Taiwan Asset Management Corporation, Director of National Credit Card Center of R.O.C., Managing Director of The Bankers Association of The Republic of China, Director of Chinese International Economic Cooperation Association, Chairman of Mega Charity Foundation, Director of The Int’l Commercial Bank of China Cultural and Educational Foundation, Director of Taiwan Academy of Banking and Finance, Chairman of Financial Planning Association of Taiwan
None None None
DirectorKuang-Si Shiu( Representative of the Ministry of Finance, ROC )
06/15/2012 3 07/15/2008 1,126,151,609 9.98 1,143,043,883 9.98 283,855 0.00 0 0Executive Vice President of Chiao Tung Bank, Executive Vice President of Mega Financial Holding Co., Ltd.
MBA, Indiana University, Indiana, U.S.A.
Managing Director and President of Mega Int’l Commercial Bank Co., Ltd., Chairman of Mega Int’l Commercial Bank (Canada), Director of Mega Int’l Investment Trust Co., Ltd., Director of ICBC Assets Management & Consulting Co., Ltd., Director of Mega Int’l Commercial Bank Public Co., Ltd., Director of Taiwan Finance Corp., Director of Financial Information Service Co., Ltd., Director of The Int’l Commercial Bank of China Cultural and Educational Foundation, Director of Mega Charity Foundation, Supervisor of Trade-Van Information Services Co., Ltd., Supervisor of the Institute for Information Industry
None None None
Director
Ching-Tsai Chen ( Representative of the Ministry of Finance, ROC )
06/15/2012 3 09/25/2008 1,126,151,609 9.98 1,143,043,883 9.98 0 0 0 0
Deputy Minister, Directorate General of Budget, Accounting and Statistics (DGBAS), Executive Yuan, R.O.C.
M.A. in Accounting,National Chengchi University
Deputy Secretary-General, Executive Yuan, R.O.C.Managing Director of Small and Medium Enterprise Credit Guarantee Fund of Taiwan
None None None
Director
Ying-Wei Peng( Representative of the Ministry of Finance, ROC )
07/15/2012 2.92 07/15/2012 1,126,151,609 9.98 1,143,043,883 9.98 0 0 0 0Executive Secretary / Senior Officer, Legal Committee, Ministry of Finance, R.O.C.
M.A. in Laws, National Chengchi University
Director-General, Department of Legal Affairs,Ministry of Finance, R.O.C.Director of Mega Int’l Commercial Bank Co., Ltd.
None None None
Director
Joanne Ling( Representative of the Ministry of Finance, ROC )
06/15/2012 3 06/15/2012 1,126,151,609 9.98 1,143,043,883 9.98 657 0.00 0 0
Chief Secretary, Ministry of Finance, R.O.C.Director-General, National Tax Administration of Northern Taiwan Province, Ministry of Finance, R.O.C.Director-General, Taipei National Tax Administration, Ministry of Finance, R.O.C.
M.A. in Public Finance, National Chengchi University
Director-General, National Treasury Agency, Ministry of Finance, R.O.C.Director of Financial Information Service Co., Ltd.
None None None
Director
Tzong-Yau Lin( Representative of the Ministry of Finance, ROC )
06/15/2012 3 02/20/2012 1,126,151,609 9.98 1,143,043,883 9.98 0 0 0 0
Representative of New York Representative Office, Central Bank of the R.O.C.Advisor / Deputy Director General, Department of Economic Research, Central Bank of the R.O.C.
Ph.D. in Economics, University of Southern California, U.S.A.
Director General, Department of Economic Research, Central Bank of the R.O.C.Director of Taiwan Academy of Banking and Finance
None None None
Director
Hung-Wen Chien( Representative of the Ministry of Finance, ROC )
06/15/2012 3 06/15/2012 1,126,151,609 9.98 1,143,043,883 9.98 1,147,827 0.010 0 0
Director of Taiwan Depository & Clearing CorporationDirector of Taiwan Stock Exchange Corporation (TWSE)Chairman of Taiwan Securities Association
EMBA program in Finance, National Taiwan University
Chairman of Taiwan Integrated Shareholder Service Company, Director of GreTai Sercurities Market, Director of Mega International Commercial Co., Ltd., Director of Mega Futures Co., Ltd., Director of Mega Charity Foundation, Director of Ho Tie Investment Co., Ltd.,Chairman of Ho Kao Shan Int’l Investment Co., Ltd.
None None None
December 31, 2012

Corporate G
overnance Report
20
Corporate Governance Report
OUR VISION—being your best financial service partner
Title Name Date Elected
Term(Years)
Date First Elected
Shareholding when Elected
Current Shareholding
Spouse &Minor
Shareholding
Shareholding by NomineeArrangement Experience & Education Other Position
Executives, Directors or Supervisors
who are spouses or within two degrees of kinship
Shares % Shares % Shares % Shares % Title Name Relation
DirectorYaw-Chung Liao( Representative of the Ministry of Finance, R.O.C. )
06/15/2012 3 06/15/2012 1,126,151,609 9.98 1,143,043,883 9.98 0 0 0 0Director-General, Dept. of Overall Planning, Council for Economic Planning and Development, Executive Yuan, R.O.C.
Ph.D. in Agricultural Economics, National Taiwan University
Counselor, Executive Yuan, R.O.C.Director, CPC Corporation, Taiwan None None None
Director
Hsiao-Hung Chen( Representative of National Development Fund, Executive Yuan, R.O.C. )
12/10/2012 2.75 12/10/2012 689,434,483 6.11 699,776,000 6.11 0 0 0 0
Dean, College of Social Sciences, National Chengchi University
M.S. in Community Development,School of Social and Community Services, University of Missouri -Columbia, U.S.A. Ph.D. in Economic & Social Development (major) and Urban & Regional Planning (minor) at the Graduate School of Public & International Affairs, University of Pittsburgh, U.S.A.
Deputy Minister, Council of Economic Planning and Development, Executive Yuan, R.O.C. Emeritus professor, Department & Graduate Institute of Sociology, National Chengchi University
None None None
DirectorOliver Fang-Lai Yu( Representative of Chunghwa Post Co., Ltd. )
06/15/2012 3 06/23/2009 307,830,465 2.73 312,447,921 2.73 0 0 0 0
Director General of Civil Aeronautics Administration, Ministry of Transportation And CommunicationsAdministrative / Political Deputy Minister of Ministry of Transportation and Communications, Executive Yuan, R.O.C.
MBA, Institute of Management Science, National Chiao Tung University
Chairman, Chunghwa Post Co., Ltd. None None None
DirectorJustin Jan-Lin Wei( Representative of Bank of Taiwan )
06/15/2012 3 06/15/2012 282,714,082 2.51 286,954,793 2.51 0 0 0 0Senior Vice President and General Manager, Dept. of Treasury, Bank of Taiwan
M.A. in Economics, Soochow UniversityExecutive Vice President, Bank of Taiwan None None None
Director
Chung Hsiang Lin( Representative of the Labor Union of Mega International Commercial Bank Co., Ltd. )
06/15/2012 3 06/23/2009 1,831,672 0.02 1,871,300 0.02 165,576 0.00 0 0
Chairman of The Labor Union of Mega Int’l Commercial Bank Co., Ltd.Assistant Vice President of Mega Int’l Commercial Bank Co., Ltd., Chung Ho Branch
B.A. in Business Administration, Soochow University
Vice President & Deputy General Manager, Mega Int’l Commercial Bank Co., Ltd., Chung Ho Branch Chairman, The Employee Welfare Committee, Mega Int’l Commercial Bank Co., Ltd. Director, The National Federation of Bank Employees Unions
None None None
Independ-ent Director Tsun-Siou Li 06/15/2012 3 06/15/2012 0 0 0 0 0 0 0 0
EMBA Program Director, National Taiwan UniversityChairman, Department of Finance, National Taiwan University
Ph.D. in Finance, University of California , Berkeley
Professor, Department of Finance, National Taiwan UniversityDirector, Taiwan Future Exchange Corporation
None None None
Independ-ent Director Shean-Bii Chiu 06/15/2012 3 06/15/2012 0 0 0 0 0 0 0 0
Chairman of Department of Finance, National Taiwan UniversityChairman of Pension Fund Association, R.O.C.Visiting Professor, Hitotsubashi University, JapanDirector of the Board, Securities and Futures InstituteIndependent Director, First Financial Holding Co., Ltd.
Ph.D. in Finance, University of Washington (Seattle) U.S.A.
Professor, Department of Finance, National Taiwan UniversityIndependent Director of Airmate (Cayman) International Co., Ltd.Independent Director of KD Holding CorporationDirector of Aver Technology Co., Ltd.
None None None
Independ-ent Director Chi-Hung Lin 06/15/2012 3 06/15/2012 0 0 0 0 0 0 0 0
Associate Professor of Laws, Soochow Law SchoolSenior Attorney, Lee & Li Attorneys-At-Law
Ph.D. in Juridical Science, National Chengchi University
Managing Partner of Lin & Partners Attorneys at LawLegal Counsel, Credit Card Committee of Bankers Association of the R.O.C.Member of Advisory Board, Central Deposit Insurance CorporationDirector of Sen Yang Venture Capital Co., Ltd.
None None None
Note : 1. National Development Fund, Executive Yuan, R.O.C. re-designated Ms. Hsiao-Hung Chen as its representative on December 10, 2012. 2. Chunghwa Post Co., Ltd. reappointed Ms. Jih-Chu Lee to replace Mr. Oliver Fang-Lai Yu as its representative on March 19, 2013.

Corporate G
overnance Report
212012 ANNUAL REPORT
Title Name Date Elected
Term(Years)
Date First Elected
Shareholding when Elected
Current Shareholding
Spouse &Minor
Shareholding
Shareholding by NomineeArrangement Experience & Education Other Position
Executives, Directors or Supervisors
who are spouses or within two degrees of kinship
Shares % Shares % Shares % Shares % Title Name Relation
DirectorYaw-Chung Liao( Representative of the Ministry of Finance, R.O.C. )
06/15/2012 3 06/15/2012 1,126,151,609 9.98 1,143,043,883 9.98 0 0 0 0Director-General, Dept. of Overall Planning, Council for Economic Planning and Development, Executive Yuan, R.O.C.
Ph.D. in Agricultural Economics, National Taiwan University
Counselor, Executive Yuan, R.O.C.Director, CPC Corporation, Taiwan None None None
Director
Hsiao-Hung Chen( Representative of National Development Fund, Executive Yuan, R.O.C. )
12/10/2012 2.75 12/10/2012 689,434,483 6.11 699,776,000 6.11 0 0 0 0
Dean, College of Social Sciences, National Chengchi University
M.S. in Community Development,School of Social and Community Services, University of Missouri -Columbia, U.S.A. Ph.D. in Economic & Social Development (major) and Urban & Regional Planning (minor) at the Graduate School of Public & International Affairs, University of Pittsburgh, U.S.A.
Deputy Minister, Council of Economic Planning and Development, Executive Yuan, R.O.C. Emeritus professor, Department & Graduate Institute of Sociology, National Chengchi University
None None None
DirectorOliver Fang-Lai Yu( Representative of Chunghwa Post Co., Ltd. )
06/15/2012 3 06/23/2009 307,830,465 2.73 312,447,921 2.73 0 0 0 0
Director General of Civil Aeronautics Administration, Ministry of Transportation And CommunicationsAdministrative / Political Deputy Minister of Ministry of Transportation and Communications, Executive Yuan, R.O.C.
MBA, Institute of Management Science, National Chiao Tung University
Chairman, Chunghwa Post Co., Ltd. None None None
DirectorJustin Jan-Lin Wei( Representative of Bank of Taiwan )
06/15/2012 3 06/15/2012 282,714,082 2.51 286,954,793 2.51 0 0 0 0Senior Vice President and General Manager, Dept. of Treasury, Bank of Taiwan
M.A. in Economics, Soochow UniversityExecutive Vice President, Bank of Taiwan None None None
Director
Chung Hsiang Lin( Representative of the Labor Union of Mega International Commercial Bank Co., Ltd. )
06/15/2012 3 06/23/2009 1,831,672 0.02 1,871,300 0.02 165,576 0.00 0 0
Chairman of The Labor Union of Mega Int’l Commercial Bank Co., Ltd.Assistant Vice President of Mega Int’l Commercial Bank Co., Ltd., Chung Ho Branch
B.A. in Business Administration, Soochow University
Vice President & Deputy General Manager, Mega Int’l Commercial Bank Co., Ltd., Chung Ho Branch Chairman, The Employee Welfare Committee, Mega Int’l Commercial Bank Co., Ltd. Director, The National Federation of Bank Employees Unions
None None None
Independ-ent Director Tsun-Siou Li 06/15/2012 3 06/15/2012 0 0 0 0 0 0 0 0
EMBA Program Director, National Taiwan UniversityChairman, Department of Finance, National Taiwan University
Ph.D. in Finance, University of California , Berkeley
Professor, Department of Finance, National Taiwan UniversityDirector, Taiwan Future Exchange Corporation
None None None
Independ-ent Director Shean-Bii Chiu 06/15/2012 3 06/15/2012 0 0 0 0 0 0 0 0
Chairman of Department of Finance, National Taiwan UniversityChairman of Pension Fund Association, R.O.C.Visiting Professor, Hitotsubashi University, JapanDirector of the Board, Securities and Futures InstituteIndependent Director, First Financial Holding Co., Ltd.
Ph.D. in Finance, University of Washington (Seattle) U.S.A.
Professor, Department of Finance, National Taiwan UniversityIndependent Director of Airmate (Cayman) International Co., Ltd.Independent Director of KD Holding CorporationDirector of Aver Technology Co., Ltd.
None None None
Independ-ent Director Chi-Hung Lin 06/15/2012 3 06/15/2012 0 0 0 0 0 0 0 0
Associate Professor of Laws, Soochow Law SchoolSenior Attorney, Lee & Li Attorneys-At-Law
Ph.D. in Juridical Science, National Chengchi University
Managing Partner of Lin & Partners Attorneys at LawLegal Counsel, Credit Card Committee of Bankers Association of the R.O.C.Member of Advisory Board, Central Deposit Insurance CorporationDirector of Sen Yang Venture Capital Co., Ltd.
None None None
December 31, 2012
Corporate G
overnance Report
22
Corporate Governance Report
OUR VISION—being your best financial service partner
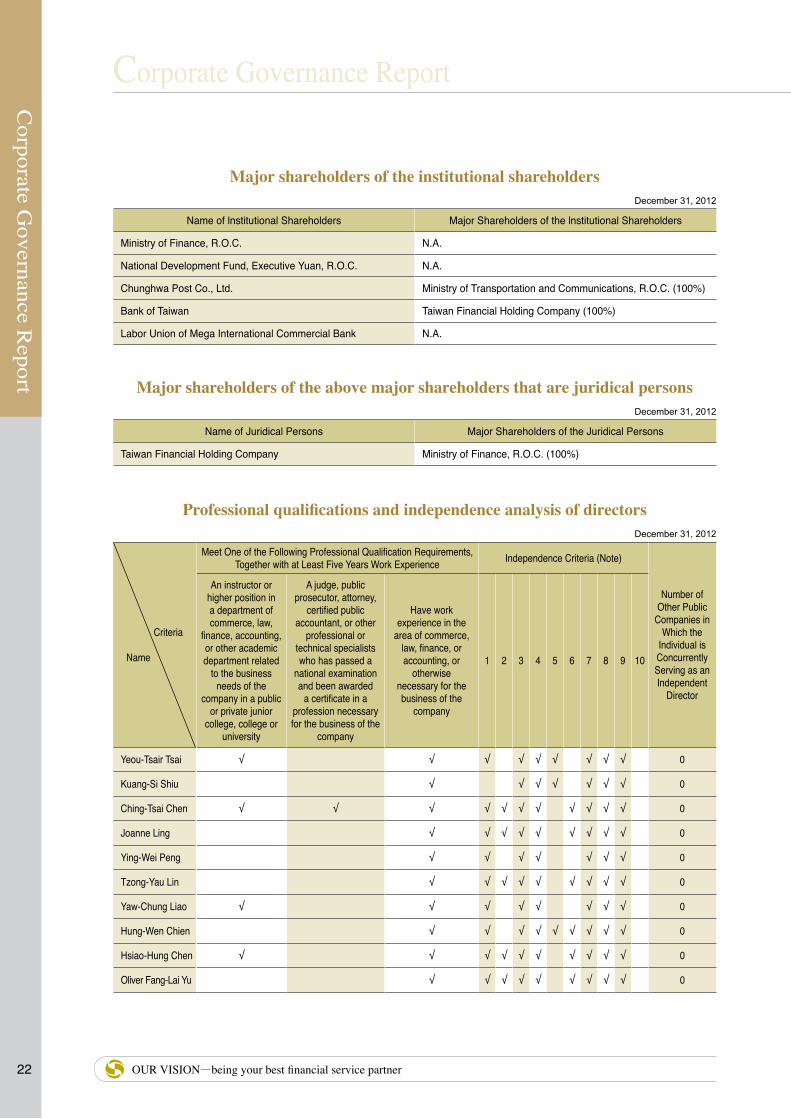
Major shareholders of the institutional shareholdersDecember 31, 2012
Name of lnstitutional Shareholders Major Shareholders of the lnstitutional Shareholders
Ministry of Finance, R.O.C. N.A.
National Development Fund, Executive Yuan, R.O.C. N.A.
Chunghwa Post Co., Ltd. Ministry of Transportation and Communications, R.O.C. (100%)
Bank of Taiwan Taiwan Financial Holding Company (100%)
Labor Union of Mega International Commercial Bank N.A.
Major shareholders of the above major shareholders that are juridical personsDecember 31, 2012
Name of Juridical Persons Major Shareholders of the Juridical Persons
Taiwan Financial Holding Company Ministry of Finance, R.O.C. (100%)
Professional qualifications and independence analysis of directors December 31, 2012
Criteria
Name
Meet One of the Following Professional Qualification Requirements, Together with at Least Five Years Work Experience Independence Criteria (Note)
Number of Other Public
Companies in Which the
Individual is Concurrently Serving as an Independent
Director
An instructor or higher position in a department of commerce, law,
finance, accounting, or other academic department related
to the business needs of the
company in a public or private junior
college, college or university
A judge, public prosecutor, attorney,
certified public accountant, or other
professional ortechnical specialists who has passed a
national examination and been awarded
a certificate in a profession necessary for the business of the
company
Have work experience in the
area of commerce,law, finance, or accounting, or
otherwisenecessary for the business of the
company
1 2 3 4 5 6 7 8 9 10
Yeou-Tsair Tsai � � � � � � � � � 0
Kuang-Si Shiu � � � � � � � 0
Ching-Tsai Chen � � � � � � � � � � � 0
Joanne Ling � � � � � � � � � 0
Ying-Wei Peng � � � � � � � 0
Tzong-Yau Lin � � � � � � � � � 0
Yaw-Chung Liao � � � � � � � � 0
Hung-Wen Chien � � � � � � � � � 0
Hsiao-Hung Chen � � � � � � � � � � 0
Oliver Fang-Lai Yu � � � � � � � � � 0

Corporate G
overnance Report
232012 ANNUAL REPORT
Criteria
Name
Meet One of the Following Professional Qualification Requirements, Together with at Least Five Years Work Experience Independence Criteria (Note)
Number of Other Public
Companies in Which the
Individual is Concurrently Serving as an Independent
Director
An instructor or higher position in a department of commerce, law,
finance, accounting, or other academic department related
to the business needs of the
company in a public or private junior
college, college or university
A judge, public prosecutor, attorney,
certified public accountant, or other
professional ortechnical specialists who has passed a
national examination and been awarded
a certificate in a profession necessary for the business of the
company
Have work experience in the
area of commerce,law, finance, or accounting, or
otherwisenecessary for the business of the
company
1 2 3 4 5 6 7 8 9 10
Justin Jan-Lin Wei � � � � � � � � � � 0
Chung Hsiang Lin � � � � � � � � 0
Tsun-Siou Li � � � � � � � � � � � � 0
Shean-Bii Chiu � � � � � � � � � � � � 2
Chi-Hung Lin � � � � � � � � � � � � � 0
Note : Please tick the corresponding boxes if directors or supervisors have been any of the following during the two years prior to being elected or during the term of office:
1. Not an employee of the Company or any of its affiliates.
2. Not a director or supervisor of the Company or any of its affiliates. The same does not apply, however, in cases where the person is an independent director of the Company, its parent company, or any subsidiary in which the Company holds, directly or indirectly, more than 50% of the voting shares.
3. Not a natural-person shareholder who holds shares, together with those held by the person’s spouse, minor children, or held by the person under others’ names, in an aggregate amount of 1% or more of the total number of outstanding shares of the Company or ranking in the top 10 in holdings.
4. Not a spouse, relative within the second degree of kinship, or lineal relative within the fifth degree of kinship, of any of the persons in the preceding three subparagraphs.
5. Not a director, supervisor, or employee of a corporate shareholder that directly holds 5% or more of the total number of outstanding shares of the Company or that holds shares ranking in the top five in holdings.
6. Not a director, supervisor, officer, or shareholder holding 5% or more of the share, of a specified company or institution that has a financial or business relationship with the Company.
7. Not a professional individual who, or an owner, partner, director, supervisor, or officer of a sole proprietorship, partnership, company, or institution that, provides commercial, legal, financial, accounting services or consultation to the Company or to any affiliate of the Company, or a spouse thereof. However Remuneration Committee members who exercise their powers as defined in Article 7 of the “Regulations Governing the Appointment and Exercise of Powers by the Remuneration Committee of a Company Whose Stock is listed on the Exchange or Traded Over the Counter” are not limited therein.
8. Not having a marital relationship, or a relative within the second degree of kinship to any other director of the Company.
9. Not been a person of any conditions defined in Article 30 of the Company Act.
10. Not a governmental, juridical person or its representative as defined in Article 27 of the Company Act..

Corporate G
overnance Report
24
Corporate Governance Report
OUR VISION—being your best financial service partner
3.2.2 Management TeamDecember 31, 2012
Title Name Date Appointed
Shareholding Spouse & Minor Shareholding
Shareholding by NomineeArrangement Experience & Education Other Position
Managers who are Spouses or Within
Two Degrees of Kinship
Shares % Shares % Shares % Title Name Relation
President Kuang-Si Shiu 07/24/2008 283,855 0.002 0 0 0 0
Executive Vice President of Chiao Tung Bank,Executive Vice President of Mega Financial Holding Co., Ltd.
MBA, Indiana University, Indiana, U.S.A.
Managing Director and President of Mega Int’l Commercial Bank Co., Ltd., Chairman of Mega Int’l Commercial Bank (Canada), Director of Mega Int’l Investment Trust Co., Ltd., Director of ICBC Assets Management & Consulting Co., Ltd., Director of Mega Int’l Commercial Bank Public Co., Ltd., Director of Taiwan Finance Corp., Director of Financial Information Service Co., Ltd., Director of The Int’l Commercial Bank of China Cultural and Educational Foundation, Director of Mega Charity Foundation, Supervisor of Trade-Van Information Services Co., Ltd., Supervisor of the Institute for Information Industry
None None None
Executive Vice President Jui-Yun Lin 09/08/2006 53,411 0.000 0 0 0 0
Senior Vice President & General Manager of Chiao Tung Bank,Senior Vice President of Mega Financial Holding Co., Ltd.
M.A. in Public Finance, National Chengchi University
Chairman of Chung Kuo Insurance Co., Ltd.,Chairman and President of Mega Venture Capital Co., Ltd., Director of Mega Bills Finance Co., Ltd., Director of Taipei Financial Center Corp., Chair of Nuclear Energy Insurance Pool, R.O.C.
None None None
Executive Vice President
Chung-Hsing Chen 10/01/2010 0 0 0 0 0 0
Senior Executive Vice President of Fuhwa Financial Holding Company and President of Fuhwa Commercial Bank Company, Chairman of BOOC Leasing International Co., Ltd.,Vice President of Xinhua Finance Ltd. and Vice Chairman of Shanghai Far East Credit Rating Agency,President of Global Financial Services Co., Ltd.
SJD., LL.M., Southern Methodist University
Supervisor of Chung Kuo Insurance Co., Ltd., Supervisor of Mega Int’l Investment Trust Co., Ltd. None None None
Executive Vice President Chao-Hsien Lai 01/01/2012 3,265 0.000 0 0 0 0
Senior Vice President & General Manager of Mega Int'l Commercial Bank Co., Ltd.
M.S. in Management, Arthur D. Little Management Education Institute
Director and Senior Executive Vice President of Mega Int’l Commercial Bank Co., Ltd., Director of Mega Bills Finance Co., Ltd., Chairman of the Mega Asset Management Co., Ltd., Director of ICBC Assets Management & Consulting Co., Ltd.
None None None
Executive Vice President
Meei-Yeh Wei 01/01/2012 146,205 0.001 0 0 0 0
Senior Vice President & General Manager of Mega Int'l Commercial Bank Co., Ltd.
M.A. in Finance,National Taiwan University
Managing Director and Senior Executive Vice President of Mega Int’l Commercial Bank Co., Ltd., Director of Mega Int’l Investment Trust Co., Ltd., Chairman of Ramlett Finance Holdings Inc., Director of Mega Int’l Commercial Bank (Canada), Director of Mega Int’l Commercial Bank Public Co., Ltd., Chairman of Cathay Investment & Development Corp. (Bahamas), Chairman of Mega I Venture Capital Co., Ltd., Director of ICBC Assets Management & Consulting Co., Ltd., Chairman of The Int’l Commercial Bank of China Cultural and Educational Foundation, Supervisor of National Credit Card Center of R.O.C., Director of China Development Industrial Bank, Chairman of Global Venture Capital Co., Ltd., Director of H&H Venture Capital Investment Corp. under custody of Mega Int’l Commercial Bank Co., Ltd., Chairman of Cathay Investment & Warehousing Ltd., Director of China Development Financial Holding Corporation
None None None

Corporate G
overnance Report
252012 ANNUAL REPORT
3.2.2 Management TeamDecember 31, 2012
Title Name Date Appointed
Shareholding Spouse & Minor Shareholding
Shareholding by NomineeArrangement Experience & Education Other Position
Managers who are Spouses or Within
Two Degrees of Kinship
Shares % Shares % Shares % Title Name Relation
President Kuang-Si Shiu 07/24/2008 283,855 0.002 0 0 0 0
Executive Vice President of Chiao Tung Bank,Executive Vice President of Mega Financial Holding Co., Ltd.
MBA, Indiana University, Indiana, U.S.A.
Managing Director and President of Mega Int’l Commercial Bank Co., Ltd., Chairman of Mega Int’l Commercial Bank (Canada), Director of Mega Int’l Investment Trust Co., Ltd., Director of ICBC Assets Management & Consulting Co., Ltd., Director of Mega Int’l Commercial Bank Public Co., Ltd., Director of Taiwan Finance Corp., Director of Financial Information Service Co., Ltd., Director of The Int’l Commercial Bank of China Cultural and Educational Foundation, Director of Mega Charity Foundation, Supervisor of Trade-Van Information Services Co., Ltd., Supervisor of the Institute for Information Industry
None None None
Executive Vice President Jui-Yun Lin 09/08/2006 53,411 0.000 0 0 0 0
Senior Vice President & General Manager of Chiao Tung Bank,Senior Vice President of Mega Financial Holding Co., Ltd.
M.A. in Public Finance, National Chengchi University
Chairman of Chung Kuo Insurance Co., Ltd.,Chairman and President of Mega Venture Capital Co., Ltd., Director of Mega Bills Finance Co., Ltd., Director of Taipei Financial Center Corp., Chair of Nuclear Energy Insurance Pool, R.O.C.
None None None
Executive Vice President
Chung-Hsing Chen 10/01/2010 0 0 0 0 0 0
Senior Executive Vice President of Fuhwa Financial Holding Company and President of Fuhwa Commercial Bank Company, Chairman of BOOC Leasing International Co., Ltd.,Vice President of Xinhua Finance Ltd. and Vice Chairman of Shanghai Far East Credit Rating Agency,President of Global Financial Services Co., Ltd.
SJD., LL.M., Southern Methodist University
Supervisor of Chung Kuo Insurance Co., Ltd., Supervisor of Mega Int’l Investment Trust Co., Ltd. None None None
Executive Vice President Chao-Hsien Lai 01/01/2012 3,265 0.000 0 0 0 0
Senior Vice President & General Manager of Mega Int'l Commercial Bank Co., Ltd.
M.S. in Management, Arthur D. Little Management Education Institute
Director and Senior Executive Vice President of Mega Int’l Commercial Bank Co., Ltd., Director of Mega Bills Finance Co., Ltd., Chairman of the Mega Asset Management Co., Ltd., Director of ICBC Assets Management & Consulting Co., Ltd.
None None None
Executive Vice President
Meei-Yeh Wei 01/01/2012 146,205 0.001 0 0 0 0
Senior Vice President & General Manager of Mega Int'l Commercial Bank Co., Ltd.
M.A. in Finance,National Taiwan University
Managing Director and Senior Executive Vice President of Mega Int’l Commercial Bank Co., Ltd., Director of Mega Int’l Investment Trust Co., Ltd., Chairman of Ramlett Finance Holdings Inc., Director of Mega Int’l Commercial Bank (Canada), Director of Mega Int’l Commercial Bank Public Co., Ltd., Chairman of Cathay Investment & Development Corp. (Bahamas), Chairman of Mega I Venture Capital Co., Ltd., Director of ICBC Assets Management & Consulting Co., Ltd., Chairman of The Int’l Commercial Bank of China Cultural and Educational Foundation, Supervisor of National Credit Card Center of R.O.C., Director of China Development Industrial Bank, Chairman of Global Venture Capital Co., Ltd., Director of H&H Venture Capital Investment Corp. under custody of Mega Int’l Commercial Bank Co., Ltd., Chairman of Cathay Investment & Warehousing Ltd., Director of China Development Financial Holding Corporation
None None None

Corporate G
overnance Report
26
Corporate Governance Report
OUR VISION—being your best financial service partner
Title Name Date Appointed
Shareholding Spouse & Minor Shareholding
Shareholding by NomineeArrangement Experience & Education Other Position
Managers who are Spouses or Within
Two Degrees of Kinship
Shares % Shares % Shares % Title Name Relation
Executive Vice President Dan-Hun Lu 01/01/2012 8,097 0.000 0 0 0 0
Senior Vice President & General Manager of Chiao Tung Bank Co., Ltd.,Senior Vice President & General Manager of Mega Int’l Commercial Bank Co., Ltd.
M.A. in Public Finance, National Chengchi University
Senior Executive Vice President of Mega Int’l Commercial Bank Co., Ltd., Supervisor of Mega Bills Finance Co., Ltd., Chairman of Win Card Co., Ltd., Director of Mega Int'l Commercial Bank Public Co., Ltd., Director of Cathay Investment & Development Corp. (Bahamas), Director of Mega I Venture Capital Co., Ltd., Supervisor of Waterland Financial Holding Co., Ltd.
None None None
Executive Vice President
Jin-Fu Ma(Note) 01/01/2012 37,897 0.000 0 0 0 0
Senior Executive Vice President of Mega Int’l Commercial Bank Co., Ltd.
EMBA, National Cheng Kung University
Chairman of Mega Int’l Investment Trust Co., Ltd. None None None
Executive Vice President Chii-Bang Wang 01/01/2012 1,386 0.000 0 0 0 0
Executive Vice President of Mega Int’l Commercial Bank Co., Ltd., President of Mega Int’l Commercial Bank Public Co., Ltd., Executive Vice President of SinoPac Holdings and President of Far East National Bank
B.A. in Int’l Trade, Tamkang University
President of Mega Bills Finance Co., Ltd., Supervisor of Mega Int’l Commercial Bank Co., Ltd., Director of Mega Charity Foundation
None None None
Executive Vice President Ming-Jye Chang 01/01/2012 785,018 0.006 149,242 0.001 0 0
Chair of Wealth Management Committee, Taiwan Securities AssociationChair of Bond Market Committee, Taiwan Securities Association
MBA, State University of New Jersey
Director and President of Mega Securities Co., Ltd., Director of Mega Securities Holdings Co., Ltd., Director of Mega Futures Co., Ltd., Supervisor of Taiwan Securities Association
None None None
.Chief Internal Auditor
Yung-Ming Chen 09/08/2006 190 0.000 0 0 0 0
Senior Vice President & General Manager of Chiao Tung Bank Senior Vice President of Mega Financial Holding Co., Ltd.
B.A. in Int’l Trade, National Taichung Institute of Technology
Supervisor of Mega International Commercial Bank Co., Ltd., Supervisor of Mega Asset Management Co., Ltd.,Director of Taipei Financial Center Corp.
None None None
Note: Mr. Jin-Fu Ma has been replaced by Ms. Ying-Ying Chang, Senior Executive Vice President of Mega International Commercial Bank Co., Ltd. as the Company’s Executive Vice President concurrently on February 1, 2013.

Corporate G
overnance Report
272012 ANNUAL REPORT
Title Name Date Appointed
Shareholding Spouse & Minor Shareholding
Shareholding by NomineeArrangement Experience & Education Other Position
Managers who are Spouses or Within
Two Degrees of Kinship
Shares % Shares % Shares % Title Name Relation
Executive Vice President Dan-Hun Lu 01/01/2012 8,097 0.000 0 0 0 0
Senior Vice President & General Manager of Chiao Tung Bank Co., Ltd.,Senior Vice President & General Manager of Mega Int’l Commercial Bank Co., Ltd.
M.A. in Public Finance, National Chengchi University
Senior Executive Vice President of Mega Int’l Commercial Bank Co., Ltd., Supervisor of Mega Bills Finance Co., Ltd., Chairman of Win Card Co., Ltd., Director of Mega Int'l Commercial Bank Public Co., Ltd., Director of Cathay Investment & Development Corp. (Bahamas), Director of Mega I Venture Capital Co., Ltd., Supervisor of Waterland Financial Holding Co., Ltd.
None None None
Executive Vice President
Jin-Fu Ma(Note) 01/01/2012 37,897 0.000 0 0 0 0
Senior Executive Vice President of Mega Int’l Commercial Bank Co., Ltd.
EMBA, National Cheng Kung University
Chairman of Mega Int’l Investment Trust Co., Ltd. None None None
Executive Vice President Chii-Bang Wang 01/01/2012 1,386 0.000 0 0 0 0
Executive Vice President of Mega Int’l Commercial Bank Co., Ltd., President of Mega Int’l Commercial Bank Public Co., Ltd., Executive Vice President of SinoPac Holdings and President of Far East National Bank
B.A. in Int’l Trade, Tamkang University
President of Mega Bills Finance Co., Ltd., Supervisor of Mega Int’l Commercial Bank Co., Ltd., Director of Mega Charity Foundation
None None None
Executive Vice President Ming-Jye Chang 01/01/2012 785,018 0.006 149,242 0.001 0 0
Chair of Wealth Management Committee, Taiwan Securities AssociationChair of Bond Market Committee, Taiwan Securities Association
MBA, State University of New Jersey
Director and President of Mega Securities Co., Ltd., Director of Mega Securities Holdings Co., Ltd., Director of Mega Futures Co., Ltd., Supervisor of Taiwan Securities Association
None None None
.Chief Internal Auditor
Yung-Ming Chen 09/08/2006 190 0.000 0 0 0 0
Senior Vice President & General Manager of Chiao Tung Bank Senior Vice President of Mega Financial Holding Co., Ltd.
B.A. in Int’l Trade, National Taichung Institute of Technology
Supervisor of Mega International Commercial Bank Co., Ltd., Supervisor of Mega Asset Management Co., Ltd.,Director of Taipei Financial Center Corp.
None None None

Corporate G
overnance Report
28
Corporate Governance Report
OUR VISION—being your best financial service partner
3.2.3 Remuneration of Directors, Supervisors, President, and Executive Vice PresidentsDirectors' Compensations and Remuneration
Unit: NT$ thousands
Title Name
Compensations Ratio of Total Remuneration (A+B+C+D)
to Net Income (%)
Relevant remuneration received by directors who are also employees Ratio of Total Compensation
(A+B+C+D+E+F+G) to Net Income (%)
Any Other Compensations from
Other Investees
Base Compensation(A)
Severance Pay (B)
Remuneration to Directors (C)
Allowances (D)
Salary, Bonuses, and Allowances
(E) Severance Pay
(F)Employee Profit Sharing
(G)
Exercisable Employee Stock
Options (H)New Restricted
Employee Shares
Thecompany
All consolidated
entitiesThe
companyAll
consolidated entities
The company
All consolidated
entitiesThe
companyAll
consolidated entities
The company
All consolidated
entitiesThe
companyAll
consolidated entities
The company
All consolidated
entities
The company All consolidated entities The
companyAll
consolidated entities
The company
All consolidated
entitiesThe
companyAll
consolidated entitiesCash Stock Cash Stock
Chairman Ministry of FinanceYeou-Tsair Tsai
Director(Representative of Ministry of Finance)
Kuang-Si ShiuChing-Tsai ChenYaw-Chung LiaoTzong-Yau LinJoanne LingYing-Wei PengHung-Wen ChienFang-Yu KuoMing-Chung TsegnSheng-Chung LinYi-Ho Cheng Tzung-Ta YenMing-Hui TangDun-Jin LuhHsi-Chin Huang
DirectorNational Development FundKuo-Hui HsiaoHsiao-Hung Chen
Director Chunghwa Post Co., Ltd.Oliver Fang-Lai Yu
Director Bank of TaiwanJustin Jan-Lin Wei
Director
Labor Union of Mega International Commercial Bank Co., Ltd.Chung Hsiang Lin
Independent Director
Chun-Tien ChengChun Mei MaSong-Chin Su
Independent Director
Tsun-Siou LiShean-Bii ChiuChi-Hung Lin
Total 1,832 9,997 0 891 82,870 82,870 2,918 6,635 0.41 0.47 0 8,215 0 972 0 0 231 0 0 0 0 0 0.41 0.51 1,126Note: 1. Mr. Ming-Chung Tsegn and Hsi-Chin Huang retired from the Board on March 8, 2012 and March 16, 2012, respectively. Mr. Yi-Ho Cheng took the position as a director on Feb. 1,
2012 and retired on June 15, 2012. 2. Mr. Tzung-Ta Yen was replaced by Mr. Tzong-Yau Lin on February 20, 2012. Mr. Sheng-Chung Lin was replaced by Mr. Ying-Wei Peng on July 15, 2012. 3. Mr. Fang-Yu Kuo, Mr. Dun-Jin Luh and Mr. Ming-Hui Tang retired from the Board on June 15, 2012. Mr. Yaw-Chung Liao, Mr. Hung-Wen Chien, Mr. Justin Jan-Lin Wei, Mr. Oliver Fang-Lai Yu and Ms. Joanne Ling take their position as directors starting on June 15, 2012. Chunghwa Post Co., Ltd. reappointed Ms. Jih-Chu Lee to replace Mr. Oliver
Fang-Lai Yu as its representative on March 19, 2013. 4. Mr. Kuo-Hui Hsiao took his position as a director on June 15, 2012 and retired on Dec. 10, 2012. Ms. Hsiao-Hung Chen takes the position on the same day. 5. Independent Directors Mr. Chun-Tien Cheng, Ms. Chun Mei Ma and Mr. Song-Chin Su retired on June 15, 2012. Mr. Tsun-Siou Li, Mr. Shean-Bii Chiu and Mr. Chi-Hung Lin take
their positions as Independent Directors on the same day. 6. Allowances (D) include payment for house rent and company cars. Compensation paid to company drivers by all consolidated entities totaled NT$1,233 thousand. 7. Salary, Bonuses, and Allowances (E) includes payment for allowances for house rent and company cars. Compensation paid to company drivers amounted to NT$986 thousand. 8. Remuneration to Directors (C) and Employee Profit Sharing (G) will be subject to approval of the Annual General Shareholders’ Meeting on June 21, 2013. 9. The Company does not issue any employee stock options or new restricted employee shares.

Corporate G
overnance Report
292012 ANNUAL REPORT
3.2.3 Remuneration of Directors, Supervisors, President, and Executive Vice PresidentsDirectors' Compensations and Remuneration
Unit: NT$ thousands
Title Name
Compensations Ratio of Total Remuneration (A+B+C+D)
to Net Income (%)
Relevant remuneration received by directors who are also employees Ratio of Total Compensation
(A+B+C+D+E+F+G) to Net Income (%)
Any Other Compensations from
Other Investees
Base Compensation(A)
Severance Pay (B)
Remuneration to Directors (C)
Allowances (D)
Salary, Bonuses, and Allowances
(E) Severance Pay
(F)Employee Profit Sharing
(G)
Exercisable Employee Stock
Options (H)New Restricted
Employee Shares
Thecompany
All consolidated
entitiesThe
companyAll
consolidated entities
The company
All consolidated
entitiesThe
companyAll
consolidated entities
The company
All consolidated
entitiesThe
companyAll
consolidated entities
The company
All consolidated
entities
The company All consolidated entities The
companyAll
consolidated entities
The company
All consolidated
entitiesThe
companyAll
consolidated entitiesCash Stock Cash Stock
Chairman Ministry of FinanceYeou-Tsair Tsai
Director(Representative of Ministry of Finance)
Kuang-Si ShiuChing-Tsai ChenYaw-Chung LiaoTzong-Yau LinJoanne LingYing-Wei PengHung-Wen ChienFang-Yu KuoMing-Chung TsegnSheng-Chung LinYi-Ho Cheng Tzung-Ta YenMing-Hui TangDun-Jin LuhHsi-Chin Huang
DirectorNational Development FundKuo-Hui HsiaoHsiao-Hung Chen
Director Chunghwa Post Co., Ltd.Oliver Fang-Lai Yu
Director Bank of TaiwanJustin Jan-Lin Wei
Director
Labor Union of Mega International Commercial Bank Co., Ltd.Chung Hsiang Lin
Independent Director
Chun-Tien ChengChun Mei MaSong-Chin Su
Independent Director
Tsun-Siou LiShean-Bii ChiuChi-Hung Lin
Total 1,832 9,997 0 891 82,870 82,870 2,918 6,635 0.41 0.47 0 8,215 0 972 0 0 231 0 0 0 0 0 0.41 0.51 1,126

Corporate G
overnance Report
30
Corporate Governance Report
OUR VISION—being your best financial service partner
Dir
ecto
rs' C
ompe
nsat
ions
and
Rem
uner
atio
n
Brac
ket
Nam
e of
Dire
ctor
s
Tota
l of (
A+B+
C+D)
Tota
l of (
A+B+
C+D+
E+F+
G)
The
com
pany
All I
nves
tee
Com
pani
es
The
com
pany
All I
nves
tee
Com
pani
es
Unde
r NT$
2,00
0,000
Yeou
-Tsair
Tsai,
Kua
ng-S
i Shiu
, Ch
ing-Ts
ai Ch
en, Y
aw-C
hung
Liao
, Tz
ong-
Yau L
in, Jo
anne
Ling
, Yi
ng-W
ei Pe
ng, H
ung-
Wen
Chie
n, Fa
ng-Y
u Kuo
, Ming
-Chu
ng Ts
egn,
Shen
g-Ch
ung L
in, Y
i-Ho C
heng
, Tz
ung-
Ta Ye
n, Mi
ng-H
ui Ta
ng,
Dun-
Jin Lu
h, Hs
i-Chin
Hua
ng,
Chun
g-Hs
iang L
in, K
uo-H
ui Hs
iao,
Hsiao
-Hun
g Che
n, Ol
iver F
ang-
Lai Y
u, Ju
stin J
an-L
in W
ei, Ts
un-S
iou Li
, Sh
ean-
Bii C
hiu, C
hi-Hu
ng Li
n, Ch
un-T
ien C
heng
, Chu
n-Me
i Ma,
Song
-Chin
Su
Kuan
g-Si
Shiu
, Chin
g-Ts
ai Ch
en,
Yaw-
Chun
g Liao
, Tzo
ng-Y
au Li
n, Jo
anne
Ling
, Ying
-Wei
Peng
, Fa
ng-Y
u Kuo
, Ming
-Chu
ng Ts
egn,
Shen
g-Ch
ung L
in, Y
i-Ho C
heng
, Tz
ung-
Ta Ye
n, Mi
ng-H
ui Ta
ng,
Dun-
Jin Lu
h, Hs
i-Chin
Hua
ng,
Chun
g-Hs
iang L
in, K
uo-H
ui Hs
iao,
Hsiao
-Hun
g Che
n, Ol
iver F
ang-
Lai Y
u, Ju
stin J
an-L
in W
ei, Ts
un-S
iou Li
, Sh
ean-
Bii C
hiu, C
hi-Hu
ng Li
n, Ch
un-T
ien C
heng
, Chu
n-Me
i Ma,
Song
-Chin
Su
Yeou
-Tsair
Tsai,
Kua
ng-S
i Shiu
, Ch
ing-Ts
ai Ch
en, Y
aw-C
hung
Liao
, Tz
ong-
Yau L
in, Jo
anne
Ling
, Yi
ng-W
ei Pe
ng, H
ung-
Wen
Chie
n, Fa
ng-Y
u Kuo
, Ming
-Chu
ng Ts
egn,
Shen
g-Ch
ung L
in, Y
i-Ho C
heng
, Tz
ung-
Ta Ye
n, Mi
ng-H
ui Ta
ng,
Dun-
Jin Lu
h, Hs
i-Chin
Hua
ng,
Chun
g-Hs
iang L
in, K
uo-H
ui Hs
iao,
Hsiao
-Hun
g Che
n, Ol
iver F
ang-
Lai Y
u, Ju
stin J
an-L
in W
ei, Ts
un-S
iou Li
, Sh
ean-
Bii C
hiu, C
hi-Hu
ng Li
n, Ch
un-T
ien C
heng
, Chu
n-Me
i Ma,
Song
-Chin
Su
Ching
-Tsai
Chen
, Yaw
-Chu
ng Li
ao,
Tzon
g-Ya
u Lin,
Joan
ne Li
ng,
Ying
-Wei
Peng
, Fan
g-Yu
Kuo
, Mi
ng-C
hung
Tseg
n, Sh
eng-
Chun
g Lin,
Yi
-Ho C
heng
, Tzu
ng-Ta
Yen,
Ming
-Hui
Tang
, Dun
-Jin L
uh,
Hsi-C
hin H
uang
, Kuo
-Hui
Hsiao
, Hs
iao-H
ung C
hen,
Olive
r Fan
g-La
i Yu,
Justi
n Jan
-Lin
Wei,
Tsun
-Siou
Li,
Shea
n-Bi
i Chiu
, Chi-
Hung
Lin,
Chun
-Tien
Che
ng, C
hun-
Mei M
a, So
ng-C
hin S
u
NT$2
,000,0
00 ~
NT$
5,000
,000
Natio
nal D
evelo
pmen
t Fun
dCh
ungh
wa P
ost C
o., Lt
d.Ba
nk of
Taiw
an
Hung
-Wen
Chie
nNa
tiona
l Dev
elopm
ent F
und
Chun
ghwa
Pos
t Co.,
Ltd.
Bank
of Ta
iwan
Natio
nal D
evelo
pmen
t Fun
dCh
ungh
wa P
ost C
o., Lt
d.Ba
nk of
Taiw
an
Hung
-Wen
Chie
nCh
ung-
Hsian
g Lin
Natio
nal D
evelo
pmen
t Fun
dCh
ungh
wa P
ost C
o., Lt
d.Ba
nk of
Taiw
an
NT$5
,000,0
00 ~
NT$
10,00
0,000
Labo
r Unio
n of M
ega I
ntern
ation
al Co
mmer
cial B
ank C
o., Lt
d.Ye
ou-Ts
air Ts
ai La
bor U
nion o
f Meg
a Inte
rnati
onal
Comm
ercia
l Ban
k Co.,
Ltd.
Yeou
-Tsair
Tsai,
Kua
ng-S
i Shiu
Labo
r Unio
n of M
ega I
ntern
ation
al Co
mmer
cial B
ank C
o., Lt
d.
NT$1
0,000
,000 ~
NT$
15,00
0,000
NT$1
5,000
,000 ~
NT$
30,00
0,000
NT$3
0,000
,000 ~
NT$
50,00
0,000
NT$5
0,000
,000 ~
NT$
100,0
00,00
0Mi
nistry
of F
inanc
eMi
nistry
of F
inanc
eMi
nistry
of F
inanc
eMi
nistry
of F
inanc
e
Over
NT$
100,0
00,00
0
Total
3232
3232
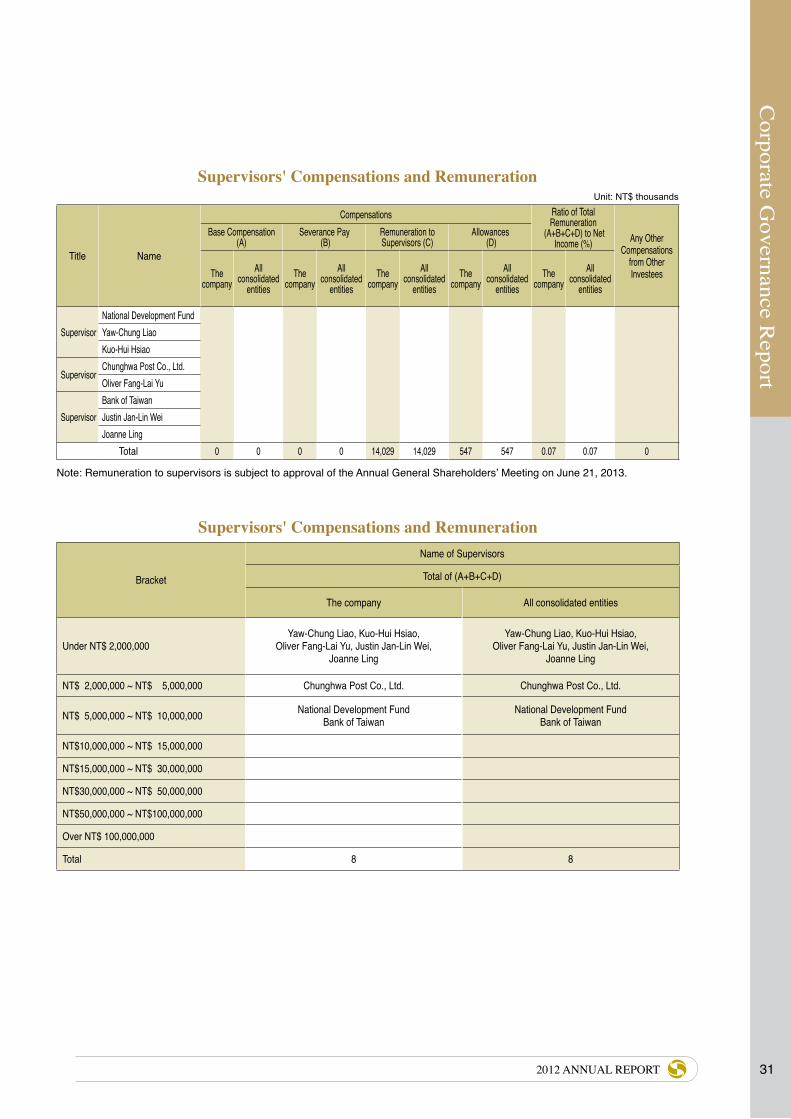
Corporate G
overnance Report
312012 ANNUAL REPORT
Supervisors' Compensations and RemunerationUnit: NT$ thousands
Title Name
Compensations Ratio of Total Remuneration
(A+B+C+D) to Net Income (%) Any Other
Compensations from Other Investees
Base Compensation(A)
Severance Pay (B)
Remuneration to Supervisors (C)
Allowances (D)
Thecompany
All consolidated
entitiesThe
companyAll
consolidated entities
The company
All consolidated
entitiesThe
companyAll
consolidated entities
The company
All consolidated
entities
SupervisorNational Development FundYaw-Chung LiaoKuo-Hui Hsiao
SupervisorChunghwa Post Co., Ltd.Oliver Fang-Lai Yu
SupervisorBank of Taiwan Justin Jan-Lin WeiJoanne Ling
Total 0 0 0 0 14,029 14,029 547 547 0.07 0.07 0
Note: Remuneration to supervisors is subject to approval of the Annual General Shareholders’ Meeting on June 21, 2013.
Supervisors' Compensations and Remuneration
Bracket
Name of Supervisors
Total of (A+B+C+D)
The company All consolidated entities
Under NT$ 2,000,000Yaw-Chung Liao, Kuo-Hui Hsiao,
Oliver Fang-Lai Yu, Justin Jan-Lin Wei,Joanne Ling
Yaw-Chung Liao, Kuo-Hui Hsiao,Oliver Fang-Lai Yu, Justin Jan-Lin Wei,
Joanne Ling
NT$ 2,000,000 ~ NT$ 5,000,000 Chunghwa Post Co., Ltd. Chunghwa Post Co., Ltd.
NT$ 5,000,000 ~ NT$ 10,000,000 National Development Fund Bank of Taiwan
National Development Fund Bank of Taiwan
NT$10,000,000 ~ NT$ 15,000,000
NT$15,000,000 ~ NT$ 30,000,000
NT$30,000,000 ~ NT$ 50,000,000
NT$50,000,000 ~ NT$100,000,000
Over NT$ 100,000,000
Total 8 8

Corporate G
overnance Report
32
Corporate Governance Report
OUR VISION—being your best financial service partner
Title Name
Salary (A)
Severance Pay (B)
Bonuses and Allowances (C)
Employee Profit Sharing(D)
Ratio of Total Compensation
(A+B+C+D) to Net Income (%)Exercisable Employee
Stock OptionsNew Restricted
Employee SharesAny Other
Compensations from Other InvesteesThe
companyAll
consolidated entities
The company
All consolidated
entitiesThe
companyAll
consolidated entities
The company
All consolidated
entitiesThe
companyAll
consolidated entities
The company
All consolidated
entitiesThe
companyAll
consolidated entities
Cash Stock Cash Stock
President Kuang-Si Shiu
Executive Vice President Jui-Yun Lin
Executive Vice President Chung-Hsing Chen
Executive Vice President Meei-Yeh Wei
Executive Vice President Chao-Hsien Lai
Executive Vice President Jin-Fu Ma
Executive Vice President Dan-Hun Lu
Executive Vice President Chii-Bang Wang
Executive Vice President Ming-Jye Chang
Chief Internal Auditor Yung-Ming Chen
8,080 27,931 1,036 2,784 5,765 23,532 1,003 0 1,688 0 0.07 0.26 0 0 0 0 1,920
Compensation of President and Executive Vice Presidents
Note: 1. Bonuses and Allowances (C) include payment for house rent and company cars. Compensation paid to company drivers by all consolidated entities totaled NT$8,889 thousand.
2. Employee Profit Sharing (D) is preliminary and subject to the approval by the Annual Shareholders’ Meeting on June 21, 2013.
3. The Company does not issue any employee stock options or new restricted employee shares.
Compensation Paid to President and Executive Vice Presidents
BracketName of President and Executive Vice Presidents
The company All Investee Companies
Under NT$ 2,000,000Kuang-Si Shiu, Meei-Yeh Wei,
Chao-Hsien Lai, Chii-Bang Wang, Dan-Hun Lu, Ming-Jye Chang,
Jin-Fu Ma
NT$ 2,000,000 ~ NT$ 5,000,000 Chung-Hsing ChenChung-Hsing Chen,
Ming-Jye Chang,Chao-Hsien Lai
NT$ 5,000,000 ~ NT$ 10,000,000 Jui-Yun Lin , Yung-Ming ChenKuang-Si Shiu, Jui-Yun Lin,
Yung-Ming Chen, Dan-Hun Lu, Chii-Bang Wang,
Meei-Yeh Wei, Jin-Fu Ma,NT$10,000,000 ~ NT$ 15,000,000 NT$15,000,000 ~ NT$ 30,000,000NT$30,000,000 ~ NT$ 50,000,000NT$50,000,000 ~ NT$100,000,000Over NT$ 100,000,000Total 10 10

Corporate G
overnance Report
332012 ANNUAL REPORT
Title Name
Salary (A)
Severance Pay (B)
Bonuses and Allowances (C)
Employee Profit Sharing(D)
Ratio of Total Compensation
(A+B+C+D) to Net Income (%)Exercisable Employee
Stock OptionsNew Restricted
Employee SharesAny Other
Compensations from Other InvesteesThe
companyAll
consolidated entities
The company
All consolidated
entitiesThe
companyAll
consolidated entities
The company
All consolidated
entitiesThe
companyAll
consolidated entities
The company
All consolidated
entitiesThe
companyAll
consolidated entities
Cash Stock Cash Stock
President Kuang-Si Shiu
Executive Vice President Jui-Yun Lin
Executive Vice President Chung-Hsing Chen
Executive Vice President Meei-Yeh Wei
Executive Vice President Chao-Hsien Lai
Executive Vice President Jin-Fu Ma
Executive Vice President Dan-Hun Lu
Executive Vice President Chii-Bang Wang
Executive Vice President Ming-Jye Chang
Chief Internal Auditor Yung-Ming Chen
8,080 27,931 1,036 2,784 5,765 23,532 1,003 0 1,688 0 0.07 0.26 0 0 0 0 1,920
Unit: NT$ thousands
Employee Profit Sharing of 2012 to Executive Vice PresidentsUnit: NT$ thousands
Title NameEmployee Bonus
- in Stock(Fair Market Value)
Employee Bonus
- in CashTotal
Ratio of Total Amount to Net
Income (%)
Executive Vice President Jui-Yun Lin
Executive Vice President Chung-Hsing Chen
Chief Internal Auditor Yung-Ming Chen
Total 0 1,003 1,003 0.047
Note: The amount of employee profit sharing is preliminary and subject to the approval by shareholders at the Annual Shareholder Meeting on June 21, 2013.

Corporate G
overnance Report
34
Corporate Governance Report
OUR VISION—being your best financial service partner
3.2.4 Remuneration for Directors, Supervisors, Presidents and Executive Vice Presidents
A. The ratio of total remuneration paid by the company and by all companies included in the consolidated financial statements for the last two years to directors, supervisors, presidents and executive vice presidents of the Company, to the net income
Year
Total remuneration paid to directors, supervisors, president and executive vice presidents
Ratio of total remuneration paid to directors, supervisors, president and executive vice presidents to
net income (%)
The company All consolidated entities The company All consolidated entities
2012 118,079,549 180,322,195 0.55% 0.84%
2011 100,525,503 131,295,690 0.57% 0.74%
Total remuneration paid by the Company to its directors, supervisors and executives as a percentage of net income after tax was 0.55% in 2012, compared with 0.57% in 2011. Total remuneration paid to directors, supervisors and executives, by all consolidated entities, as a percentage of consolidated net income after tax rose slightly to 0.84% from 0.74% in 2011.
B. Remuneration policies, the procedures for determining remuneration, and the correlation with business performance
Remuneration to directors, supervisors and executives is appropriated according to the Articles of Incorporation and the business performance of the company in the year, while the market average is taken into consideration. The annual earning distribution proposal shall be submitted to the board meeting for discussion before being sent to the shareholders’ meeting for resolution.
The remuneration paid to directors and supervisors as a percentage of net income grew 19.93% in 2012, while the net income grew 21.79% compared to 2011. Meanwhile, the remuneration paid to directors and supervisors as a percentage of the consolidated net income grew 18.07% in 2012, with consolidated net income rising 21.81% from the previous year.

Corporate G
overnance Report
352012 ANNUAL REPORT
3.3 Implementation of Corporate Governance
3.3.1 Board of Directors
A total of 13 (A) meetings of the board of directors were held in 2012. Director attendance was as follows:
Title Name Attendance in Person (B)
By Proxy
Attendance Rate (%)( B / A ) Remarks
Chairman Yeou-Tsair Tsai(Representative of Ministry of Finance ) 13 0 100.00
Director Kuang-Si Shiu (Representative of Ministry of Finance ) 13 0 100.00
Independentdirector Chun-Tien Cheng 5 0 100.00 retired on Jun. 15, 2012
Independentdirector Chun Mei Ma 5 0 100.00 retired on Jun. 15, 2012
Independentdirector Song-Chin Su 5 0 100.00 retired on Jun. 15, 2012
Independentdirector Tsun-Siou Li 8 0 100.00 elected on Jun. 15, 2012
Independentdirector Shean-Bii Chiu 8 0 100.00 elected on Jun. 15, 2012
Independentdirector Chi-Hung Lin 8 0 100.00 elected on Jun. 15, 2012
Director Ming-Chung Tsegn(Representative of Ministry of Finance) 2 0 100.00 retired on Mar. 8, 2012
Director Sheng-Chung Lin(Representative of Ministry of Finance) 4 3 57.14 retired on Jul. 15, 2012
Director Ching-Tsai Chen(Representative of Ministry of Finance) 9 4 69.23
Director Dun-Jin Luh(Representative of Ministry of Finance) 4 1 80.00 retired on Jun. 15, 2012
Director Yi-Ho Cheng(Representative of Ministry of Finance) 4 0 100.00 took office on Feb. 1, 2012
retired on Jun. 15, 2012
Director Fang-Yu Kuo(Representative of Ministry of Finance) 4 1 80.00 retired on Jun. 15, 2012
Director Tzung-Ta Yen (Representative of Ministry of Finance) 1 0 100.00 retired on Feb. 20, 2012
Director Tzong-Yau Lin(Representative of Ministry of Finance) 10 2 83.33 takes office on Feb. 20, 2012
Director Ming-Hui Tang(Representative of Ministry of Finance) 4 1 80.00 retired on Jun. 15, 2012
Director Hsi-Chin Huang(Representative of Ministry of Finance) 1 0 50.00 resigned on Mar. 16, 2012
Director Ying-Wei Peng(Representative of Ministry of Finance) 6 0 100.00 takes office on Jul. 15, 2012
Director Joanne Ling(Representative of Ministry of Finance) 7 1 87.75 elected on Jun. 15, 2012
Director Hung-Wen Chien(Representative of Ministry of Finance) 8 0 100.00 elected on Jun. 15, 2012
Director Yaw-Chung Liao(Representative of Ministry of Finance) 8 0 100.00 elected on Jun. 15, 2012
Director Kuo-Hui Hsiao(Representative of National Development Fund ) 7 0 100.00 took office on Jun. 15, 2012
retired on Dec. 10, 2012
Director Hsiao-Hung Chen(Representative of National Development Fund ) 1 0 100.00 takes office on Dec. 10, 2012
Director Oliver Fang-Lai Yu(Representative of Chunghwa Post Co., Ltd.) 8 0 100.00 elected on Jun. 15, 2012
Director Justin Jan-Lin Wei(Representative of Bank of Taiwan) 8 0 100.00 elected on Jun. 15, 2012
Director Chung-Hsiang Lin(Representative of Labor Union of Mega Int’l Commercial Bank) 13 0 100.00
Note: Percentages (%) for individual attendance are based on the number of board meetings held while each respective board member holds a seat and the number of meetings he or she attended in person.
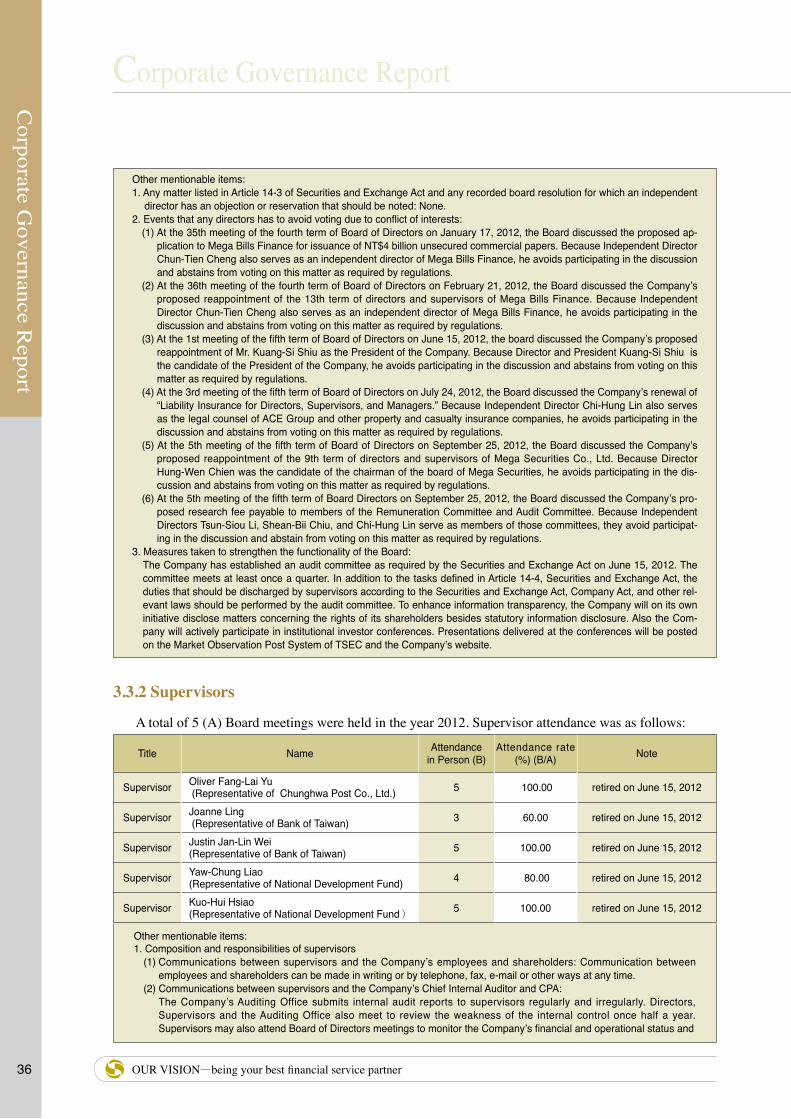
Corporate G
overnance Report
36
Corporate Governance Report
OUR VISION—being your best financial service partner
Other mentionable items:1. Any matter listed in Article 14-3 of Securities and Exchange Act and any recorded board resolution for which an independent
director has an objection or reservation that should be noted: None. 2. Events that any directors has to avoid voting due to conflict of interests:
(1) At the 35th meeting of the fourth term of Board of Directors on January 17, 2012, the Board discussed the proposed ap-plication to Mega Bills Finance for issuance of NT$4 billion unsecured commercial papers. Because Independent Director Chun-Tien Cheng also serves as an independent director of Mega Bills Finance, he avoids participating in the discussion and abstains from voting on this matter as required by regulations.
(2) At the 36th meeting of the fourth term of Board of Directors on February 21, 2012, the Board discussed the Company’s proposed reappointment of the 13th term of directors and supervisors of Mega Bills Finance. Because Independent Director Chun-Tien Cheng also serves as an independent director of Mega Bills Finance, he avoids participating in the discussion and abstains from voting on this matter as required by regulations.
(3) At the 1st meeting of the fifth term of Board of Directors on June 15, 2012, the board discussed the Company’s proposed reappointment of Mr. Kuang-Si Shiu as the President of the Company. Because Director and President Kuang-Si Shiu is the candidate of the President of the Company, he avoids participating in the discussion and abstains from voting on this matter as required by regulations.
(4) At the 3rd meeting of the fifth term of Board of Directors on July 24, 2012, the Board discussed the Company’s renewal of “Liability Insurance for Directors, Supervisors, and Managers.” Because Independent Director Chi-Hung Lin also serves as the legal counsel of ACE Group and other property and casualty insurance companies, he avoids participating in the discussion and abstains from voting on this matter as required by regulations.
(5) At the 5th meeting of the fifth term of Board of Directors on September 25, 2012, the Board discussed the Company’s proposed reappointment of the 9th term of directors and supervisors of Mega Securities Co., Ltd. Because Director Hung-Wen Chien was the candidate of the chairman of the board of Mega Securities, he avoids participating in the dis-cussion and abstains from voting on this matter as required by regulations.
(6) At the 5th meeting of the fifth term of Board Directors on September 25, 2012, the Board discussed the Company’s pro-posed research fee payable to members of the Remuneration Committee and Audit Committee. Because Independent Directors Tsun-Siou Li, Shean-Bii Chiu, and Chi-Hung Lin serve as members of those committees, they avoid participat-ing in the discussion and abstain from voting on this matter as required by regulations.
3. Measures taken to strengthen the functionality of the Board: The Company has established an audit committee as required by the Securities and Exchange Act on June 15, 2012. The committee meets at least once a quarter. In addition to the tasks defined in Article 14-4, Securities and Exchange Act, the duties that should be discharged by supervisors according to the Securities and Exchange Act, Company Act, and other rel-evant laws should be performed by the audit committee. To enhance information transparency, the Company will on its own initiative disclose matters concerning the rights of its shareholders besides statutory information disclosure. Also the Com-pany will actively participate in institutional investor conferences. Presentations delivered at the conferences will be posted on the Market Observation Post System of TSEC and the Company’s website.
3.3.2 Supervisors
A total of 5 (A) Board meetings were held in the year 2012. Supervisor attendance was as follows:
Title Name Attendance in Person (B)
Attendance rate (%) (B/A) Note
Supervisor Oliver Fang-Lai Yu (Representative of Chunghwa Post Co., Ltd.) 5 100.00 retired on June 15, 2012
Supervisor Joanne Ling (Representative of Bank of Taiwan) 3 60.00 retired on June 15, 2012
Supervisor Justin Jan-Lin Wei (Representative of Bank of Taiwan) 5 100.00 retired on June 15, 2012
Supervisor Yaw-Chung Liao (Representative of National Development Fund) 4 80.00 retired on June 15, 2012
Supervisor Kuo-Hui Hsiao (Representative of National Development Fund) 5 100.00 retired on June 15, 2012
Other mentionable items:1. Composition and responsibilities of supervisors
(1) Communications between supervisors and the Company’s employees and shareholders: Communication between employees and shareholders can be made in writing or by telephone, fax, e-mail or other ways at any time.
(2) Communications between supervisors and the Company’s Chief Internal Auditor and CPA: The Company’s Auditing Office submits internal audit reports to supervisors regularly and irregularly. Directors,
Supervisors and the Auditing Office also meet to review the weakness of the internal control once half a year. Supervisors may also attend Board of Directors meetings to monitor the Company’s financial and operational status and

Corporate G
overnance Report
372012 ANNUAL REPORT
implementation of internal audits as well as to communicate with Directors, Chief Internal Auditor and managements on proposals and operating strategies. The Company’s CPA also attends Board of Directors meetings on a regular basis to report to directors and supervisors on the results of financial statements and implementation of internal control. The suggestion given by directors and supervisors on enhancement of the disclosure of financial statements was implemented.
2. If a supervisor expresses an opinion during a meeting of the Board of Directors, the dates of meetings, sessions, contents of motions, resolutions of the directors’ meetings and the Company’s response to supervisor’s opinion should be specified: (1) At the 38h meeting of the fourth term of Board of Directors on April 24, 2012, the Board reported the implementation
status of our group’s mid- and long-term operational and financial goals set in 2011. Mr. Oliver Fang-Lai Yu suggested that we align our mid- and long-term operational and financial goals with earnings targets so that we can make the goals more meaningful. It was resolved that the management should only adopted meaningful performance indicators while setting goals for 2012.
(2) At the 39th meeting of the fourth term of Board of Directors on May 22, 2012, Mega Securities Company reported its improvement on repeated submission of the company’s brokerage orders on April 25, 2012 due to computer shutdown. Supervisor Oliver Fang-Lai Yu suggested that the securities subsidiary increase the information system’s capacity, strengthen its back-up systems and enhance training on SOPs for operational risk incidents. Supervisor Yaw-Chung Liao suggested the company replace and restructure the hard drives more frequently. It was resolved that the Mega Securities Company should investigate and improve upon this matter, and Mega Financial Holding Company should follow up and examine whether the computer systems at other subsidiaries are at risk of similar situations. Discussion with the IT departments of all subsidiaries for prevention methods is also required.
3.3.3 Audit Committee MeetingThe Company’s Audit Committee held 5 meetings in 2012, with the following attendance:
Title Name Attendance in Person By Proxy Attendance Rate (%) Remarks
Chair Tsun-Siou Li 5 0 100.00 Elected on June 15, 2012Member Shean-Bii Chiu 4 1 80.00 Elected on June 15, 2012Member Chi-Hung Lin 5 0 100.00 Elected on June 15, 2012
Annotations:1. There was no Securities and Exchange Act 14-5 resolution which was not approved by the Audit Committee but was
approved by two thirds or more of all directors in 2012.2. There were no recusals of independent directors due to conflict of interests in 2012.3. Descriptions of the communications between the independent directors, the internal auditors, and the independent
auditors in 2012 (e.g. the channels, items and/or results of the audits on the corporate finance and/or operations, etc.):(1) The Company’s auditing office submits its annual audit plans to the audit committee for review every year. In addi-
tion, it submitted Financial Supervisory Commission’s inspection reports and all internal audit reports to independent directors regularly and irregularly. The deficiencies identified in internal audit reports, and the status of improvements thereof, are reported at each audit committee meeting. Internal audit officers at relevant subsidiaries also attended those meetings to explain the situations. Subsidiaries have always complied with audit committee’s resolutions, such as reviewing the warning signals and stop loss levels of publicly traded securities as required by the Audit Committee.
(2) Aside from communication with independent auditors, independent directors are also required to discuss the semi-an-nual and annual financial statements and other legally required issues (such as the revision of the accounting system, the appointment of independent auditors, and the implementation status of internal controls) with relevant personnel. The communication channel between the Audit Committee and the internal auditor functioned well.
3.3.4 Corporate Governance Execution Status and Deviations from “Corporate Governance Best-Practice Principles for Financial Holding Companies”
As a financial holding company (FHC), the Company is increasing its commitment to Corporate Governance Best-Practice Principles for Financial Holding Companies. Set forth below are the implementation status of our corporate governance, compared with the Corporate Governance Best-Practice Principles for Financial Holding Companies, promulgated by the Bankers Association of The Republic of China, and reasons for non-implementation.

Corporate G
overnance Report
38
Corporate Governance Report
OUR VISION—being your best financial service partner
Item Implementation Status
Deviations From “Corporate Governance Best-Practice
Principles for Financial Holding Companies”
and reasons
1. Shareholding structure and shareholders’ rights
(1) Method of handling shareholder suggestions or complaints
(2) The company’s possession of a list of major shareholders and a list of ultimate owners of these major shareholders
(3) Risk management mechanism and “firewall” between the company and its affiliates
The Company has designated appropriate personnel to handle shareholder suggestions, inquiries or complaints to protect shareholders’ rights. The investor contact information is available on the Company’s website.
The Company tracks the shareholdings of directors, officers, and shareholders holding more than 1% of the outstanding shares of the Company from time to time.
The Company clearly defines the right and responsibility between itself and the subsidiaries concerning the management of staff, assets, and financial affairs in the following rules and policies: Rules for Monitoring Operations of the Subsidiaries, Related Parties Transactions Guidelines, The Group Policy and Guidelines on Risk Management, and Group Firewall Policy Between The Company and Its Subsidiaries. Banking, insurance and securities subsidiaries also established an independent risk management unit in charge of risk control.
None
None
None
2. Composition and responsibilities of the Board of Directors(1) Independent Directors
(2) Regular evaluation of CPAs’ independence
The Company has elected three independent directors according to the Securities and Exchange Act and the Company’s Article of Incorporation.
The Company assesses the independence of its external auditor every year before submitting to the Board for approval.
None
None
3. Communication channels with stakeholders
Communication between the Company and its stakeholders can be made through meeting, letter, telephone, facsimile and e-mail. The Company’s subsidiaries also operate a service hotline to answer enquiries from their customers.
None
4. Information Disclosure (1) Establishment of a corporate
website to disclose information regarding the company’s financial, business and corporate governance status
(2) Other information disclosure channels
The Company has set up a website to disclose financial and business information, as well as corporate governance information. Dedicated personnel are designated to maintain and update the website.
Other channels of disclosure include: setting up an English website, designation of dedicated personnel responsible for collection and disclosure of the Company’s information, full implementation of the spokesperson system, and disclosing the information of investor conference on the Company’s website.
None
None
5. Operations of the company’s nomination committee, remuneration committee, or other committees of the Board of Directors
1. The Company has set up a Risk Management Committee which meets every two months to discuss the Group’s risk management policy and monitor its risk position.
2. Effective from August 2011, a remuneration committee was established by the Company. It meets at least twice every year to set up and review the remuneration policy, standard, structure and compensation of Board of Directors and senior management.
None

Corporate G
overnance Report
392012 ANNUAL REPORT
3. The Company has established an audit committee as per the Securities and Exchange Act starting from June 15, 2012. The committee meets at least once a quarter. In addition to the tasks defined in Article 14-4, Securities and Exchange Act, the duties that should be discharged by supervisors according to the Securities and Exchange Act, Company Act, and other laws may be performed by the audit committee.
6. Explain the status of the Company’s corporate governance, its deviations from the Corporate Governance Best-Practice Principles for Financial Holding Companies, and the reasons for the deviations: No deviation.
7. Other information that would help understand the status of the company’s corporate governance:
(1) Employee rights, employee wellness, investor relations, rights of stakeholders
The Company’s human resources guidelines follow the standards of the Labor Standards Law and other relevant regulations. An Employee Welfare Committee is in place to put into practice employee care and assistance. As for investor relations, the Company appoints a dedicated team to answer investor’s questions and attend investor conference from time to time. The time, location and presentation of investor conferences are posted on the Company’s website and the Market Observation Post System of Taiwan Stock Exchange. The Company maintains open channels of communications with stakeholders. Stakeholders’ legal rights are fully respected. Should their legal rights be violated, the company will take responsibility and deal with the problem properly.
(2) Directors’ and supervisors’ training records
To enhance the competency of the Board of Directors, the Company provides directors and supervisors with education opportunities whenever there are relevant courses available. For detailed information on the continuing education for individual director and supervisor of the Company, please log on to the Market Observation Post System of Taiwan Stock Exchange. (http://newmops.twse.com.tw)
(3) Implementation of risk management policies and risk evaluation measures
In addition to fully compliance of government regulations, the Company aims at establishing a risk management mechanism that conforms to international standards. Currently, the Company established the Group’s Policy and Guidelines on Risk Management, which clearly described the guidelines on management of credit risk, market risk, operational risk, liquidity risk, legal compliance, human resource risk, and emergency crisis. On credit risk, the Company set up the Group’s Guidelines on Credit Risk Management to avoid over-concentration of risk. The Guidelines requires that the credit risk exposure of the Group be divided into different categories by industries, clients as well as country, and be reviewed and reported on a regular basis. In addition, the Company has completed the Internal Rating Model Buildup project which is now gradually put into practice by the subsidiaries to meet the Basel requirement on credit risk management mechanism based on quantitative approach. On market risk, the Company collects and reviews the Group’s market risk position and its evaluation profit/loss on a regular basis. To maintain the market risk within the tolerable limit, subsidiaries of the Company are encouraged to set up an advanced risk management system monitoring the daily change of Value at risk. On operational risk, the Company periodically collects operational risk event data to build up an internal loss data mart. An operational risk reporting system and self-assessment mechanism have been established by its subsidiaries. The Company will further encourage its subsidiaries to adopt key risk indicators in operational risk management to find out any impending risk events in time.
(4) Implementation of consumer-and customer-protection policy
Processing of personal information is managed according to the Personal Information Protection Act and Financial Holding Company Act. In addition to the Group Firewall Policy, the Company has set up Guidelines for Client Data Processing and Privacy Policy on Client Information. No disclosure, referral, or exchange of client data by the Company would be carried out without an agreement signed by or written consent from the client, in accordance with relevant statutory requirements in force. Besides, the subsidiaries set up client hotlines to handle customer complaints in a timely manner.
8. If the company has implemented a self corporate governance evaluation or has authorized any other professional organization to conduct such an evaluation, the evaluation results, major deficiencies or suggestions, and improvements are stated as follows: None.

Corporate G
overnance Report
40
Corporate Governance Report
OUR VISION—being your best financial service partner
3.3.5 Operation Status of the Remuneration Committee
A. Members of the remuneration committee
Title
Criteria
Name
Meet One of the Following Professional Qualification Requirements, Together with at Least Five Years Work Experience Independence Criteria (Note)
Number ofOtherPublic
Companieswhere theMembersServe as
Member ofRemuneration
Committee
An Instructor or Higher Position in a Department
of Commerce, Law, Finance, Accounting, or Other Academic
Department Related to the Business Needs of
the Company in a Public or Private Junior College,
College or University
A Judge, Public Prosecutor, Attorney, Certified Public
Accountant, or Other Professional or Technical
Specialists Who Has Passed a National Examination and
Been Awarded a Certificate in a Profession Necessary for the
Business of theCompany
Have Work Experience in the
Area of Commerce,Law, Finance, or Accounting, or Otherwise
Necessary for the Business of the
Company
1 2 3 4 5 6 7 8
Chair Shean-Bii Chiu V V V V V V V V V V 3Member Tsun-Siou Li V V V V V V V V V V 2Member Chi-Hung Lin V V V V V V V V V V V 0
Note: Please tick the corresponding boxes if members have been any of the following during the two years prior to being elected or during the term of office:(1) Not an employee of the Company or any of its affiliates.(2) Not a director or supervisor of the Company or any of its affiliates. The same does not apply, however, in cases where
the person is an independent director of the Company, its parent company, or any subsidiary in which the Company holds, directly or indirectly, more than 50% of the voting shares.
(3) Not a natural-person shareholder who holds shares, together with those held by the person’s spouse, minor children, or held by the person under others’ names, in an aggregate amount of 1% or more of the total number of outstanding shares of the Company or ranking in the top 10 in holdings.
(4) Not a spouse, relative within the second degree of kinship, or lineal relative within the fifth degree of kinship, of any of the persons in the preceding three subparagraphs.
(5) Not a director, supervisor, or employee of a corporate shareholder that directly holds 5% or more of the total number of outstanding shares of the Company or that holds shares ranking in the top five in holdings.
(6) Not a director, supervisor, officer, or shareholder holding 5% or more of the share, of a specified company or institution that has a financial or business relationship with the Company.
(7) Not a professional individual who, or an owner, partner, director, supervisor, or officer of a sole proprietorship, partnership, company, or institution that, provides commercial, legal, financial, accounting services or consultation to the Company or to any affiliate of the Company, or a spouse thereof.
(8) Not been a person of any conditions defined in Article 30 of the Company Act.
B. Remuneration Committee Meeting Status
The Company’s Remuneration Committee has 3 members. The current Committee’s term of office is from June 26, 2012 to June 14, 2015. In 2012, the last term and current term of Committee held 3 meetings and 1 meeting respectively, with the following attendance:
Title Name Attendance in Person By Proxy Attendance Rate (%) Remarks
Chair Chun-Tien Cheng 3 0 100Retired on June 15, 2012Member Chun Mei Ma 2 1 66.67
Member Song-Chin Su 3 0 100Chair Tsun-Siou Li 1 0 100
Take office on June 26, 2012Member Shean-Bii Chiu 1 0 100Member Chi-Hung Lin 1 0 100Annotations:1. If the board of directors declined to adopt, or modified, a recommendation of the remuneration committee, the date of the Board
meeting, agenda item, resolutions made by the Board, and the Company’s response to the opinions of the Remuneration Committee shall be clearly stated: None.
2. If members expressed objection or reservation that has been included in records or state in writing, the date of the meeting, agenda item, decisions made by the committee meeting, the opinions of members of the committee and the Company’s response to the opinions of the remuneration committee shall be clearly stated: None.

Corporate G
overnance Report
412012 ANNUAL REPORT
3.3.6 Corporate Social Responsibility
Item Implementation Status
Deviations from “Corporate Social
Responsibility Best Practice Principles for TWSE/GTSM Listed
Companies” and reasons
1. Exercising corporate governance(1) The company declares its
corporate social responsibility policy and examines the implementation status.
(2) The company establishes exclusively (or concurrently) dedicated units to be in charge of proposing and enforcing the corporate social responsibility policies.
(3) The company organizes regular training and promotion on business ethics for directors, supervisors and employees, and should incorporate the foregoing into its employee performance appraisal system to establish a clear and effective reward and discipline system.
The business entities of the Group have been actively participating in charity works and environment protection even though the corporate social responsibility policy of the Company has not yet been established. The Administration Department is currently in charge of the evaluation, planning, and execution of the charity activities of the Company.
The Company’s “Service Guidelines” clearly prescribe business ethics which are promoted to employee in due course. The Company has set up rules governing rewards and punishment to enhance employee performance. The appraisal factors include integrity, team spirit, moral behaviors, etc.
None
None
None
2. Fostering a sustainable environment(1) The company endeavors to utilize
all resources more efficiently and uses renewable materials which have a low impact on the environment.
(2) The company establishes proper environmental management systems based on the characteristics of their industries.
(3) The company establishes dedicated units or assigns dedicated personnel for environment management to maintain the environment.
(4) The company monitors the impact of climate change on its operations and should establish company strategies for energy conservation and carbon and greenhouse gas reduction.
The Company uses high performance green building materials for its construction projects to save energy and reduce carbon emissions.
As a financial service provider, the Company ensures that its business operation is friendly to the environment, and promotes energy saving, carbon reduction and resource sorting.The Company has appointed the Administration Dept. to take care of environment management.
The Company sets two degree higher for the central air conditioner of the building (between 26 – 28 degree Celsius), and limits the total electricity output within 90%. The Group’s energy saving and carbon reduction performance in terms of consumption of water, electricity, and gasoline are reviewed on a quarterly basis.
None
None
None
None
3. Preserving public welfare(1) The company complies with
relevant labor regulations and respect in principles governing basic labor rights as agreed by the international community in terms of employee rights protection and non-discriminatory employment, as well as development status of appropriate management approach and procedures, and execution.
The Company’s human resources guidelines follow the standards of the Labor Standards Law and are not in violation of internationally affirmed basic human rights. An Employee Welfare Committee is in place to put into practice employee care and assistance. A pension plan is available to all employees. The hiring policies are in compliance with the Employment Services Act, without discrimination on the grounds of ethnicity, gender, or religion.
None
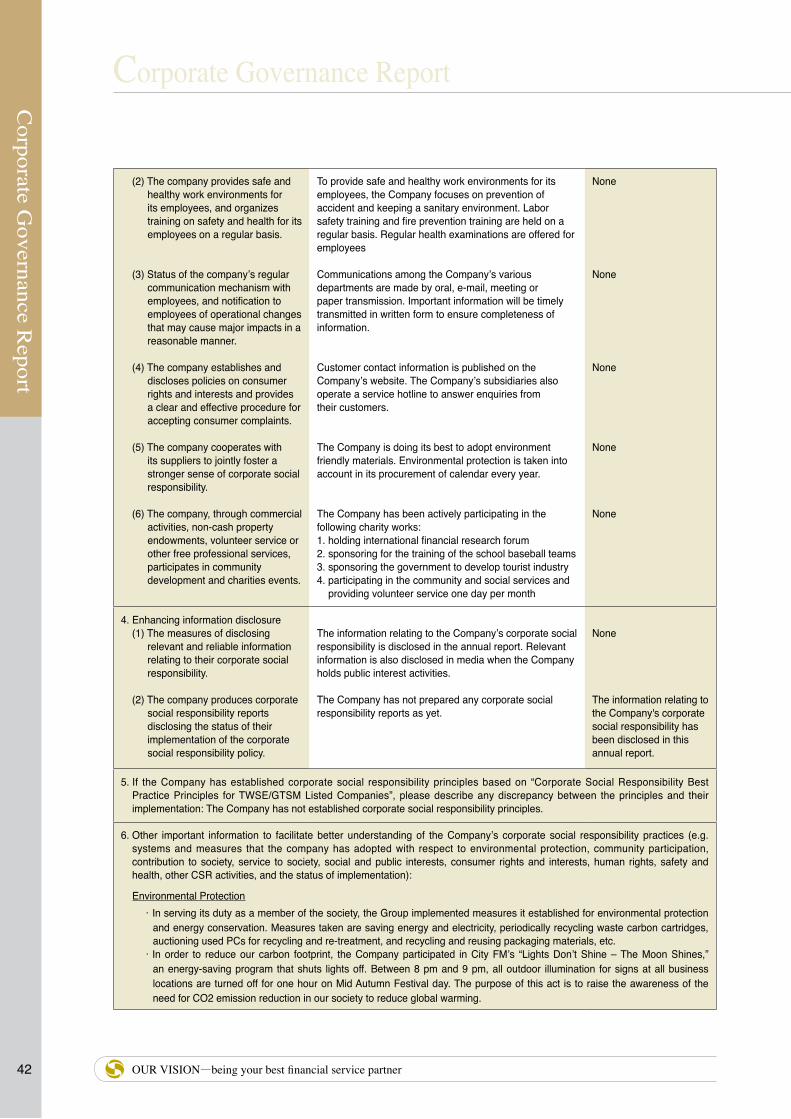
Corporate G
overnance Report
42
Corporate Governance Report
OUR VISION—being your best financial service partner
(2) The company provides safe and healthy work environments for its employees, and organizes training on safety and health for its employees on a regular basis.
(3) Status of the company’s regular communication mechanism with employees, and notification to employees of operational changes that may cause major impacts in a reasonable manner.
(4) The company establishes and discloses policies on consumer rights and interests and provides a clear and effective procedure for accepting consumer complaints.
(5) The company cooperates with its suppliers to jointly foster a stronger sense of corporate social responsibility.
(6) The company, through commercial activities, non-cash property endowments, volunteer service or other free professional services, participates in community development and charities events.
To provide safe and healthy work environments for its employees, the Company focuses on prevention of accident and keeping a sanitary environment. Labor safety training and fire prevention training are held on a regular basis. Regular health examinations are offered for employees
Communications among the Company’s various departments are made by oral, e-mail, meeting or paper transmission. Important information will be timely transmitted in written form to ensure completeness of information.
Customer contact information is published on the Company’s website. The Company’s subsidiaries also operate a service hotline to answer enquiries from their customers.
The Company is doing its best to adopt environment friendly materials. Environmental protection is taken into account in its procurement of calendar every year.
The Company has been actively participating in the following charity works:1. holding international financial research forum2. sponsoring for the training of the school baseball teams3. sponsoring the government to develop tourist industry4. participating in the community and social services and
providing volunteer service one day per month
None
None
None
None
None
4. Enhancing information disclosure (1) The measures of disclosing
relevant and reliable information relating to their corporate social responsibility.
(2) The company produces corporate social responsibility reports disclosing the status of their implementation of the corporate social responsibility policy.
The information relating to the Company’s corporate social responsibility is disclosed in the annual report. Relevant information is also disclosed in media when the Company holds public interest activities.
The Company has not prepared any corporate social responsibility reports as yet.
None
The information relating to the Company's corporate social responsibility has been disclosed in this annual report.
5. If the Company has established corporate social responsibility principles based on “Corporate Social Responsibility Best Practice Principles for TWSE/GTSM Listed Companies”, please describe any discrepancy between the principles and their implementation: The Company has not established corporate social responsibility principles.
6. Other important information to facilitate better understanding of the Company’s corporate social responsibility practices (e.g. systems and measures that the company has adopted with respect to environmental protection, community participation, contribution to society, service to society, social and public interests, consumer rights and interests, human rights, safety and health, other CSR activities, and the status of implementation):
Environmental Protection.In serving its duty as a member of the society, the Group implemented measures it established for environmental protection
and energy conservation. Measures taken are saving energy and electricity, periodically recycling waste carbon cartridges, auctioning used PCs for recycling and re-treatment, and recycling and reusing packaging materials, etc.
.In order to reduce our carbon footprint, the Company participated in City FM’s “Lights Don’t Shine – The Moon Shines,” an energy-saving program that shuts lights off. Between 8 pm and 9 pm, all outdoor illumination for signs at all business locations are turned off for one hour on Mid Autumn Festival day. The purpose of this act is to raise the awareness of the need for CO2 emission reduction in our society to reduce global warming.

Corporate G
overnance Report
432012 ANNUAL REPORT
Social Contribution.International Academic Conferences
In order to grasp trends and changes in the global economy, the Company co-hosted an international academic seminar with Global View Magazine for which Dr. Lawrence H. Summers, former Treasury Secretary of the United States, was invited to deliver the keynote address in May 2012. The topic of Dr. Summers’ speech was “The Global Economy, and the Role of the US, China, and Taiwan.” Dr. Summers shared his insightful analysis on the economic changes facing Taiwan, the US, and China and interacted with leaders of various industries in Taiwan. This seminar opened our eyes to events in the international arena and promoted the Company’s name recognition and visibility. Additionally, in order to enhance the global view of our citizens and promote traditional culture, Mega International Commercial Bank hosted many public interest lectures and musical performances in rural areas, in the hope of raising the awareness of education and concern for disadvantaged children in rural areas.
.Sports Events.The Company sponsored the “2012 Sunrise LPGA Taiwan Championship”, the most high-profile female professional
golf tour. Through media and television, the championship draws hundreds of millions of spectators and enhances the international recognition of the Company and country.
.In support of the government’s Baseball Promotion Master Plan, the Group sponsored for the training of the school baseball teams of both Hsinchu Municipal Middle School and Elementary School for four consecutive years from 2010 to 2013.
.Arts and Cultural EventsOur group sponsors various artistic events, heeding the government’s call for the promotion of local arts and the public interest oriented image of government directed companies, including:.The Group sponsored the 2012 Taiwan Lantern Festival, hosted by the County Government of Changhwa, for the promotion
of Taiwan’s tourism industry and traditional lantern art..The Group sponsored Taiwanese director Li Chinghhui’s production of the domestic documentary “Money and Honey,” which
won Korea’s Busan International Film Festival’s and Distribution Support Fund. The Group has block booked cinema venues and invited public interest groups to see the film.
.The Group hosted three “Taiwanese opera” performances in northern and central Taiwan, with VIP guests and clients in attendance. In order to promote local arts and culture, the Group hosted a Mid Autumn Night music festival at the circular square of Kaohsiung Cultural Center, drawing an audience of more than 15,000 on September 22, 2012.
.Sponsoring the “Golden Bough Theatre,” a promising theatrical performance organization that best represents the vision of Taiwan’s cultural development. The theatre toured Taiwan, performing at a different county or city every month.
Community Participation and Social Services.Since the Mega Charity Foundation set up in 2005, the foundation started a one-day-a-month volunteer program to help
feeding and accompanying mentally and physically disabled children at Yo An Home for the Disabled Children in Miaoli and Bali-Ai Hsin Home for Person with Disabilities. In 2011, the foundation began serving the elderly at a Catholic Nursing Home in Bali, New Taipei City by accompanying them in doing leisure activities such as singing.
.In November 2012 we invited senior citizens at the Catholic Nursing Home in Bali, New Taipei City to watch the stage play “New Havoc in the Dragon Palace” which performed by Contemporary Legend Theatre at Chiang Kai-shek Memorial Hall. The stunts and the havoc wreaked by the main characters in the play delighted the senior citizens.
Social Charity Work.Our group’s public welfare activities are handled by the Company, its subsidiaries, Mega Charity Foundation and
International Commercial Bank of China Cultural and Educational Foundation. Examples include: Sponsoring the 2012 Government Unified Invoice Run (Taichung) and the collection and donation of Government Unified Invoices, which are also lottery tickets, to five welfare organizations in Taichung City.
.In order to show our concern for the disadvantaged, Mega Int'l Commercial Bank visited four welfare organizations in northern, central, and southern Taiwan and the Taoyuan-Hsinchu-Miaoli area and presented cash and holiday gifts at the end of lunar year.
.To enhance workplace cohesion, improve family relations, help the disadvantaged, and improve employer-employee relations, the Company hosted public welfare events in four stages. We also invited children from orphanages and donated to 12 public welfare groups in the events, in the hope that our good deeds beget more good deeds, and that society can devote more resources to care for the disadvantaged.
.As a response to the “2012 Joint Promotion of Charitable Mid Autumn Gifts” that the Ministry of the Interior sponsored for organizations that serve those with disabilities, we purchased Mid Autumn mooncake packages from several sheltered workshops and re-gifted them to groups that serve disadvantaged people.
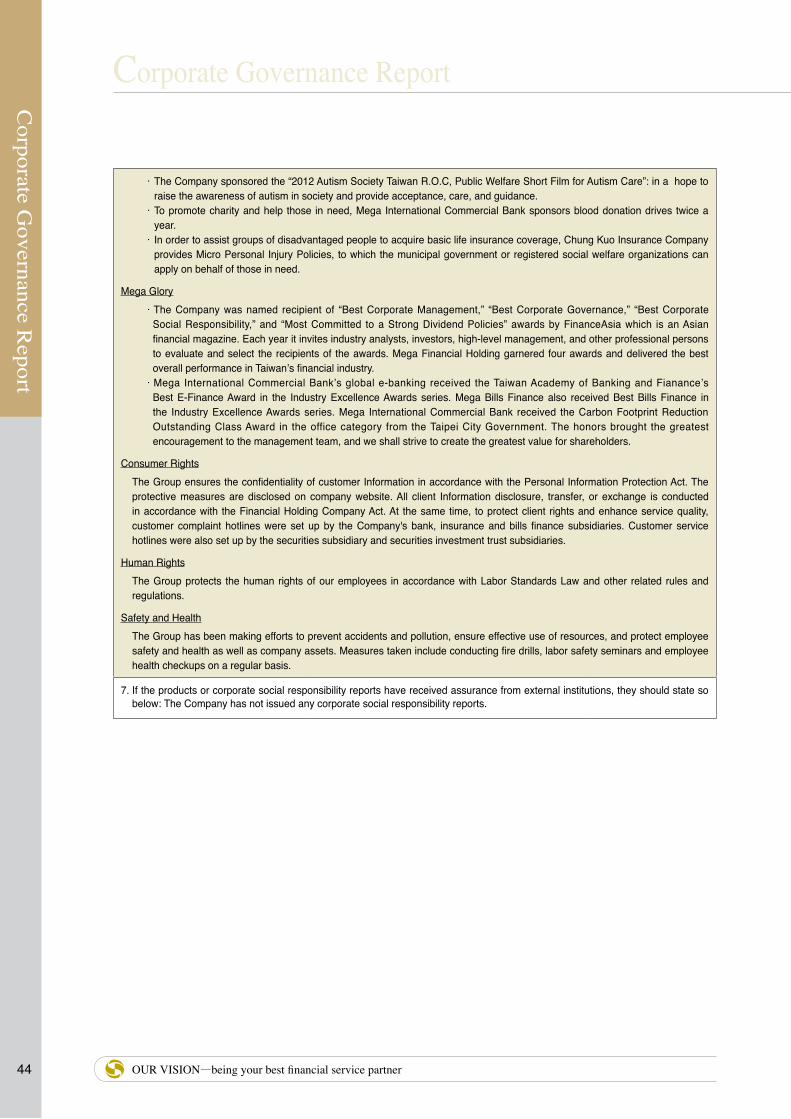
Corporate G
overnance Report
44
Corporate Governance Report
OUR VISION—being your best financial service partner
. The Company sponsored the “2012 Autism Society Taiwan R.O.C, Public Welfare Short Film for Autism Care”: in a hope to raise the awareness of autism in society and provide acceptance, care, and guidance.
. To promote charity and help those in need, Mega International Commercial Bank sponsors blood donation drives twice a year.
. In order to assist groups of disadvantaged people to acquire basic life insurance coverage, Chung Kuo Insurance Company provides Micro Personal Injury Policies, to which the municipal government or registered social welfare organizations can apply on behalf of those in need.
Mega Glory .The Company was named recipient of “Best Corporate Management,” “Best Corporate Governance,” “Best Corporate
Social Responsibility,” and “Most Committed to a Strong Dividend Policies” awards by FinanceAsia which is an Asian financial magazine. Each year it invites industry analysts, investors, high-level management, and other professional persons to evaluate and select the recipients of the awards. Mega Financial Holding garnered four awards and delivered the best overall performance in Taiwan’s financial industry..Mega International Commercial Bank’s global e-banking received the Taiwan Academy of Banking and Fianance’s
Best E-Finance Award in the Industry Excellence Awards series. Mega Bills Finance also received Best Bills Finance in the Industry Excellence Awards series. Mega International Commercial Bank received the Carbon Footprint Reduction Outstanding Class Award in the office category from the Taipei City Government. The honors brought the greatest encouragement to the management team, and we shall strive to create the greatest value for shareholders.
Consumer RightsThe Group ensures the confidentiality of customer Information in accordance with the Personal Information Protection Act. The protective measures are disclosed on company website. All client Information disclosure, transfer, or exchange is conducted in accordance with the Financial Holding Company Act. At the same time, to protect client rights and enhance service quality, customer complaint hotlines were set up by the Company's bank, insurance and bills finance subsidiaries. Customer service hotlines were also set up by the securities subsidiary and securities investment trust subsidiaries.
Human RightsThe Group protects the human rights of our employees in accordance with Labor Standards Law and other related rules and regulations.
Safety and HealthThe Group has been making efforts to prevent accidents and pollution, ensure effective use of resources, and protect employee safety and health as well as company assets. Measures taken include conducting fire drills, labor safety seminars and employee health checkups on a regular basis.
7. If the products or corporate social responsibility reports have received assurance from external institutions, they should state so below: The Company has not issued any corporate social responsibility reports.

Corporate G
overnance Report
452012 ANNUAL REPORT
3.3.7 Ethical Corporate Management and Approach Adopted
Ethical Corporate Management Implementation
Item Implementation status
Deviations from "EthicalCorporate ManagementBest Practice Principlesfor TWSE/GTSM Listed
Companies” and reasons
1. Development of ethical corporate management policy and approach(1) Status of the company’s clear statement of
ethical corporate management in its internal policy and external documents, as well as the company’s promise to execute ethical corporate management in the Board and management.
The articles of the Ethical Corporate Management Best Practice Principles are included in the Company’s relevant internal guidelines. The Board and management often emphasize the importance of ethics in business operations and lead by example.
None
(2) Status of the company developing measures preventing unethical conduct and setup of operating procedures, behaviors guide and trainings.
The Company has written operation manuals for each line of business, which are periodically updated. The operation manuals clearly define the nature and content of the business, procedures, and important issues. This measure may prevent unethical behavior.
None
(3) Status of the company's preventative measures against bribery and illegal political donations related to businesses more prone to unethical risks when designing programs against unethical behavior.
The Company has a “Service Guideline” that bans employees from receiving commissions, rewards, or other inappropriate benefit from counterparties of transactions, or clients of the Company, or its subsidiaries. Punishments have been codified for those who are found to be in breach of such ban. Additionally, the Company does not make political contributions.
None
2. Execution of ethical corporate management (1) Status of the company’s business activities
that avoid dealings with parties who have unethical behavior track record. The business contract shall stipulate rules related to ethical conduct.
The Company has avoided transactions with companies tainted by unethical practices. Ethical practice clauses are included in the contracts we enter into.
None
(2) Operations of the department solely (or partially) responsible for promoting ethical corporate management, and supervision from the board
The Administration Department is responsible for establishment and promotion of the ethical corporate management policy. Relevant proposal, if any, will be submitted to the board meeting.
None
(3) Status of the company developing policies that prevents conflict of interests and provides channels for appropriate statement
The Company has set up the “Procedure for Board of Directors Meetings” which stipulates that if any director or a juristic person represented by a director is an interested party with respect to any agenda item, the director may state his opinion and respond to questions at the respective meeting. When the relationship is likely to prejudice the interests of the company, the director may not participate in
None

Corporate G
overnance Report
46
Corporate Governance Report
OUR VISION—being your best financial service partner
Item Implementation status
Deviations from "EthicalCorporate ManagementBest Practice Principlesfor TWSE/GTSM Listed
Companies” and reasons
discussion or voting on that agenda item, and further, shall enter recusal during discussion and voting on that item and may not act as another director’s proxy to exercise voting rights on that matter. This rule has been well enforced and practiced.
(4) Operations of accounting system and internal control set up for the purpose of ethical corporate management, and auditing results of internal auditors
In order to enforce ethical business practices, the Company has established an effective accounting system, an internal control system, and an internal audit system. Additionally, to ensure adherence to the internal control system, aside from internal audits performed by the internal audit staff, each department performs a self review on the internal control system at least once a year. The results of such internal audits and self reviews show no violations of ethical business practices.
None
3. Status of reporting channels and penalty related to unethical corporate management, as well as the implementation status of the appeal system
The Company’s external website clearly states the point of contact and telephone numbers of the Company and its subsidiaries for complaints and grievances. Additionally, the Company has codified a “Service Guideline” that bans employees from receiving commissions, rewards, or other inappropriate benefit from the counterparties of transactions or clients of the Company or its subsidiaries. Punishments have been codified for those who are found to be in breach of such ban.
None
4. Information Disclosure(1) Establishment of the company’s website to
disclosure information regarding the company’s ethical corporate management status
(2) Other information disclosure channels (e.g. setting up an English website, designating people to handle information collection and disclosure etc.)
The Company has not disclosed information regarding the Company’s ethical corporate management status on the Company’s website.
The Company has designated people to collect relevant information to enhance information disclosure regarding ethical corporate management.
5. If the Company has established Ethical Corporate Management Standards Principles based on "Ethical Corporate Management Best Practice Principles for TWSE/GTSM Listed Companies", please describe any discrepancy between the principles and their implementation: Although he Company has not established Ethical Corporate Management Standards Principles, it follows the requirements of "Ethical Corporate Management Best Practice Principles for TWSE/GTSM Listed Companies".
6. Other important information to facilitate better understanding of the Company's Ethical Corporate Management: (Status of the company promoting its determination and policy of ethical corporate management to its business counterparties, and inviting them to join trainings and discussions in how the company can further revise its ethical corporate management principles): Before commencing a business transaction, the Company takes into consideration the legal compliance records and reputation of the counterparties of transactions. We avoid transactions with businesses that have a history of unethical practices. Ethical practice clauses are included in the contracts we enter into.

Corporate G
overnance Report
472012 ANNUAL REPORT
3.3.8 Items should be Disclosured for any Major Law-breaking Deficiencies in the Recent 2 years and Related Improvement Plans
A. A responsible person or employee was indicted by the prosecution for allegedly committing a crime on the job: None.
B. The Company (or any of its subsidiaries) was fined by the Financial Supervisory Commission (FSC) for violations of regulations:
(1) Hard drives that should have been destroyed at Mega International Commercial Bank’s Keelung branch were released into the used goods market. The competent authority has fined the bank NT$2,000,000 on the grounds of failing to establish and enforce the internal control system on June 7, 2012.
(2) Mega Securities Company did not clearly state the renewal cycles of investment analysis reports in the internal control guidelines. As a result, the managers of the discretionary account sometimes made investment decisions based on outdated investment analysis reports, or before updating their analysis reports. The FSC has fined the company NT$120,000 on September 30, 2011 for such breaches. These breaches have been remedied.
(3) Some of the client’s basic information was not filled out by a client in person during the account opening process at Mega Securities Company’s Chungli branch. This situation was a violation of relevant laws governing futures trading. The FSC has fined the company NT$120,000 on March 6, 2012 for such breaches. The above deficiencies have been communicated to its employees and employees are required to follow those rules.
(4) Chung Kuo Insurance Company has been found to be in breach of the Insurance Act and Compulsory Automobile Liability Insurance Act in its insurance and compulsory automobile insurance operations and was reprimanded and fined by the FSC for NT$1,260,000 on August 26, 2011. The fine has been paid and the deficiencies remedied.
C. The Company (or any of its subsidiaries) was reprimanded by the FSC for deficiencies in business operations: None
D. The Company (or any of its subsidiaries) was disciplined by the FSC pursuant to Paragraph 1, Article 54 of the Financial Holding Company Act:
The FSC has reprimanded the Company because it failed to dispose of its shareholding in Taiwan Business Bank (TBB) within the required period and did not draft a concrete plan to ensure the timely disposal of said shareholding. This fact was found to be a hindrance to prudent management. The FSC has reprimanded the Company according to Paragraph 1 of the Article 54 of the Financial Holding Company Act and, according to Paragraph 7 of the Article 54, banned The Company from applying for investments defined under Articles 36 and 37 of the same Act. If said stock holdings still have not been transferred to a trustee upon the expiration of the six month ban, said investment will continue to be banned until said stock holding is transferred to a trustee. In order to comply with the FSC’s regulations, the Company on April 16, 2013 has entered into a
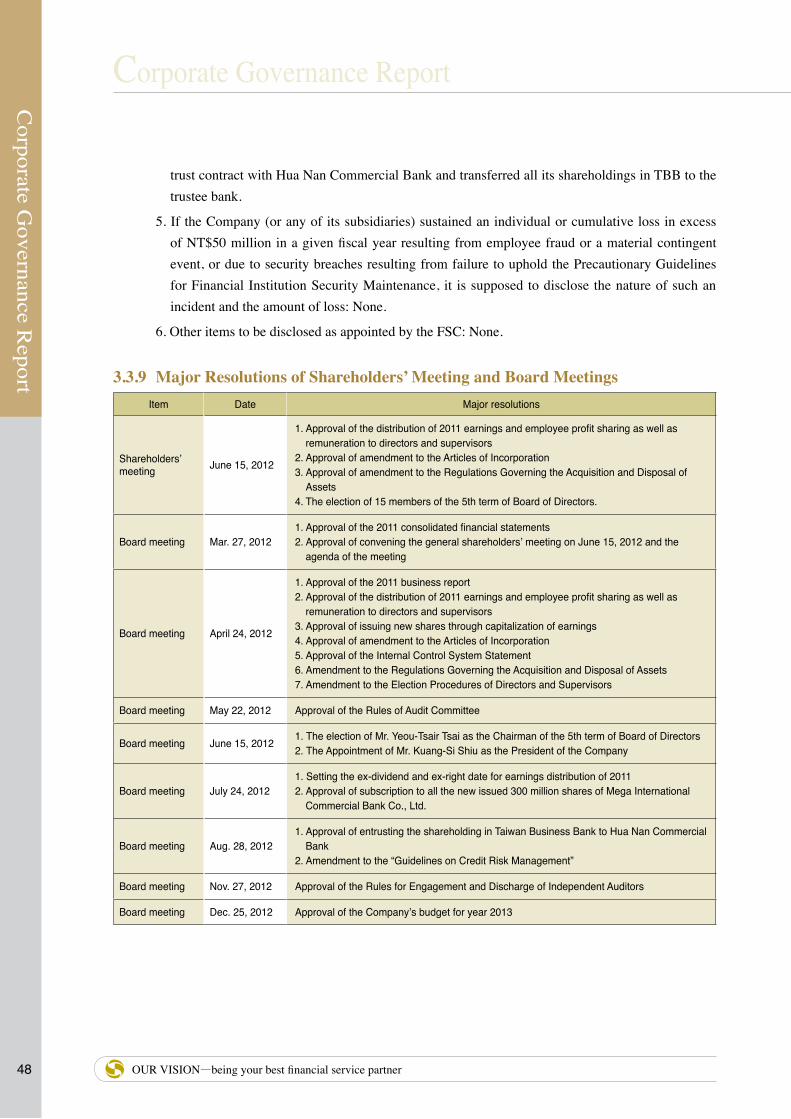
Corporate G
overnance Report
48
Corporate Governance Report
OUR VISION—being your best financial service partner
trust contract with Hua Nan Commercial Bank and transferred all its shareholdings in TBB to the trustee bank.
5. If the Company (or any of its subsidiaries) sustained an individual or cumulative loss in excess of NT$50 million in a given fiscal year resulting from employee fraud or a material contingent event, or due to security breaches resulting from failure to uphold the Precautionary Guidelines for Financial Institution Security Maintenance, it is supposed to disclose the nature of such an incident and the amount of loss: None.
6. Other items to be disclosed as appointed by the FSC: None.
3.3.9 Major Resolutions of Shareholders’ Meeting and Board MeetingsItem Date Major resolutions
Shareholders’ meeting June 15, 2012
1. Approval of the distribution of 2011 earnings and employee profit sharing as well as remuneration to directors and supervisors
2. Approval of amendment to the Articles of Incorporation3. Approval of amendment to the Regulations Governing the Acquisition and Disposal of
Assets4. The election of 15 members of the 5th term of Board of Directors.
Board meeting Mar. 27, 20121. Approval of the 2011 consolidated financial statements2. Approval of convening the general shareholders’ meeting on June 15, 2012 and the
agenda of the meeting
Board meeting April 24, 2012
1. Approval of the 2011 business report2. Approval of the distribution of 2011 earnings and employee profit sharing as well as
remuneration to directors and supervisors3. Approval of issuing new shares through capitalization of earnings 4. Approval of amendment to the Articles of Incorporation5. Approval of the Internal Control System Statement6. Amendment to the Regulations Governing the Acquisition and Disposal of Assets7. Amendment to the Election Procedures of Directors and Supervisors
Board meeting May 22, 2012 Approval of the Rules of Audit Committee
Board meeting June 15, 2012 1. The election of Mr. Yeou-Tsair Tsai as the Chairman of the 5th term of Board of Directors2. The Appointment of Mr. Kuang-Si Shiu as the President of the Company
Board meeting July 24, 20121. Setting the ex-dividend and ex-right date for earnings distribution of 20112. Approval of subscription to all the new issued 300 million shares of Mega International
Commercial Bank Co., Ltd.
Board meeting Aug. 28, 20121. Approval of entrusting the shareholding in Taiwan Business Bank to Hua Nan Commercial
Bank2. Amendment to the “Guidelines on Credit Risk Management”
Board meeting Nov. 27, 2012 Approval of the Rules for Engagement and Discharge of Independent Auditors
Board meeting Dec. 25, 2012 Approval of the Company’s budget for year 2013

Corporate G
overnance Report
492012 ANNUAL REPORT
3.3.10 Major Issues of Record or Written Statements Made by Any Director or Supervisor Dissenting to Important Resolutions Passed by the Board of Directors: None
3.3.11 Resignation or Dismissal of Personnel Involved in Preparation of Financial Reports: None
3.4 Information Regarding Independent Auditor
3.4.1 Audit Fees
Accounting Firm Name of CPAs Audit period Remarks
PricewaterhouseCoopers, Taiwan (PWC) Chien-Hung Chou Hsiu-Ling Lee January 1, 2012 –
December 31, 2012
The financial statements of the first three quarters of 2012 are reviewed or audited by CPA, Chang-Chou Li and Hsiu-Ling Lee, of PWC. The year-end financial statements of 2012 are audited by CPA, Chien-Hung Chou and Hsiu-Ling Lee, of PWC due to job adjustment in the firm.
Unit: NT$1,000
Item Bracket Audit fee Non-audit fee Total
1 Under NT$2,000,000 V
2 NT$2,000,000 (inclusive) ~ NT$ 4,000,000 V V
3 NT$4,000,000 (inclusive) ~ NT$ 6,000,000
4 NT$6,000,000 (inclusive) ~ NT$ 8,000,000
5 NT$8,000,000 (inclusive) ~ NT$10,000,000
6 Over NT$10,000,000
3.4.2 Information Regarding the Replacement of Independent Auditor: N.A.
3.4.3 Any Positions within the Company’s Independent Audit Firm or its Affiliates Have Been Held by the Company's Chairman, President, CFO or Managers in Charge of Finance or Accounting Operations in 2012: None.
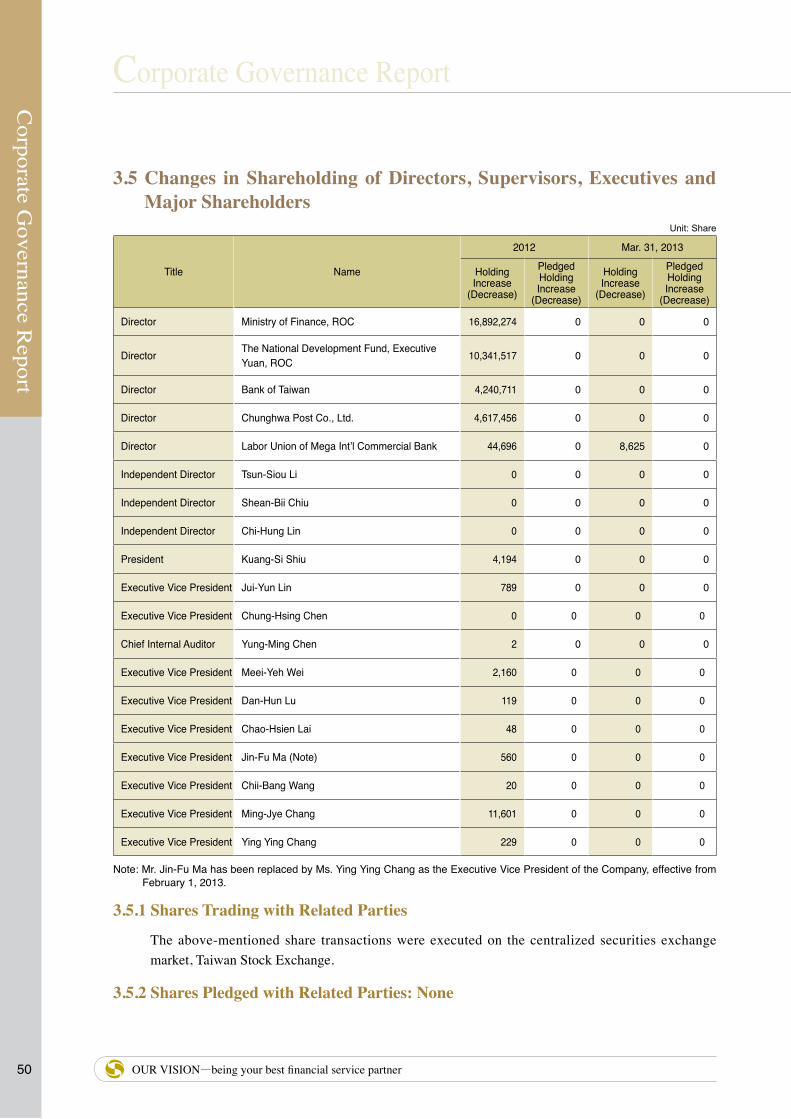
Corporate G
overnance Report
50
Corporate Governance Report
OUR VISION—being your best financial service partner
3.5 Changes in Shareholding of Directors, Supervisors, Executives and Major Shareholders
Unit: Share
Title Name
2012 Mar. 31, 2013
HoldingIncrease
(Decrease)
PledgedHoldingIncrease
(Decrease)
HoldingIncrease
(Decrease)
PledgedHoldingIncrease
(Decrease)
Director Ministry of Finance, ROC 16,892,274 0 0 0
Director The National Development Fund, Executive Yuan, ROC 10,341,517 0 0 0
Director Bank of Taiwan 4,240,711 0 0 0
Director Chunghwa Post Co., Ltd. 4,617,456 0 0 0
Director Labor Union of Mega Int’l Commercial Bank 44,696 0 8,625 0
Independent Director Tsun-Siou Li 0 0 0 0
Independent Director Shean-Bii Chiu 0 0 0 0
Independent Director Chi-Hung Lin 0 0 0 0
President Kuang-Si Shiu 4,194 0 0 0
Executive Vice President Jui-Yun Lin 789 0 0 0
Executive Vice President Chung-Hsing Chen 0 0 0 0
Chief Internal Auditor Yung-Ming Chen 2 0 0 0
Executive Vice President Meei-Yeh Wei 2,160 0 0 0
Executive Vice President Dan-Hun Lu 119 0 0 0
Executive Vice President Chao-Hsien Lai 48 0 0 0
Executive Vice President Jin-Fu Ma (Note) 560 0 0 0
Executive Vice President Chii-Bang Wang 20 0 0 0
Executive Vice President Ming-Jye Chang 11,601 0 0 0
Executive Vice President Ying Ying Chang 229 0 0 0
Note: Mr. Jin-Fu Ma has been replaced by Ms. Ying Ying Chang as the Executive Vice President of the Company, effective from February 1, 2013.
3.5.1 Shares Trading with Related Parties
The above-mentioned share transactions were executed on the centralized securities exchange market, Taiwan Stock Exchange.
3.5.2 Shares Pledged with Related Parties: None

Capital O
verview
512012 ANNUAL REPORT
3.6 Information Disclosing the Relationship between any of the Company's Top Ten Shareholders
As of December 31, 2012
NameShareholding Spouse & Minor
Shareholdingby NomineeArrangement
The relationship betweenany of the Company’sTop Ten Shareholders Remarks
Shares % Shares % Shares % Name Relation
Shareholders Resident in China of Int'l Commercial Bank of China 1,358,511,907 11.86 0 0 0 0 - - -
Ministry of Finance, ROC(Representative: Sheng-Ford Chang)
1,143,043,883 9.98 0 0 0 0
Bank of Taiwan , a
wholly-owned subsidiary of Taiwan Financial
Holding Co., Ltd.
Taiwan Financial
Holding Co., Ltd. is wholly-
owned by Ministry of Finance
-
National Development Fund, Executive Yuan, ROC (Representative: Mr. Chi-Ming Yin )
699,776,000 6.11 0 0 0 0 Bank of Taiwan Trustee -
Bank of Taiwan Trust Account(Representative: Mr.Teng-Cheng Liu)
364,386,046 3.18 0 0 0 0 - - -
Chunghwa Post Co., Ltd.(Representative: Mr. Oliver Fang-Lai Yu)
312,447,921 2.73 0 0 0 0 - - -
Bank of Taiwan(Representative: Mr. Teng-Cheng Liu) 286,954,793 2.51 0 0 0 0 Ministry of
Finance
Taiwan Financial
Holding Co., Ltd. is wholly owned by the
Ministry of Finance
-
Fubon Life Insurance Co., Ltd.(Representative: Mr. Pen-Yuan Cheng)
271,504,156 2.37 0 0 0 0 - - -
Vanguard emerging markets stock index fund 187,052,101 1.63 0 0 0 0 - - -
Pou Chen Corporation (Representative: Mr. C. C. Tsai) 164,256,622 1.43 0 0 0 0 - - -
Cathay Life Insurance Co., Ltd.(Representative: Mr. Hong-Tu Tsai ) 158,603,208 1.39 0 0 0 0 - - -

Capital O
verview
52
Capital Overview
OUR VISION—being your best financial service partner
3.7 Long-term Investment OwnershipAs of December 31, 2012
CompanyOwnership by Mega FHC
( 1 )
Direct / Indirect Ownership by Directors,
Supervisors and Management ( 2 )
Total Ownership ( 1 ) + ( 2 )
Shares % Shares % Shares %Mega International Commercial Bank Co., Ltd. 7,100,000,000 100.00 0 0 7,100,000,000 100.00Mega Securities Co., Ltd. 1,160,000,000 100.00 0 0 1,160,000,000 100.00Mega Bills Finance Co., Ltd. 1,311,441,084 100.00 0 0 1,311,441,084 100.00Chung Kuo Insurance Co., Ltd. 300,000,000 100.00 0 0 300,000,000 100.00Mega Int’l Investment Trust Co., Ltd. 52,700,000 100.00 0 0 52,700,000 100.00Mega Asset Management Co., Ltd. 200,000,000 100.00 0 0 200,000,000 100.00Mega Life Insurance Agency Co., Ltd. 2,000,000 100.00 0 0 2,000,000 100.00Mega Venture Capital Co., Ltd. 100,000,000 100.00 0 0 100,000,000 100.00Taiwan Depository & Clearing Corp. 1,298,987 0.40 3,856,034 1.20 5,155,021 1.60Taipei Financial Center Corp. 73,500,000 5.00 40,005,999 2.72 113,505,999 7.72Taiwan Business Bank 588,463,090 12.01 951,739,532 19.43 1,540,202,622 31.44China Products Trading Company 0 0 68,274 68.27 68,274 68.27Mega I Venture Capital Co., Ltd. 0 0 39,000,000 65.00 39,000,000 65.00Yung-Shing Industries Company 0 0 1,350,419 99.56 1,350,419 99.56Win Card Co., Ltd. 0 0 500,000 100.00 500,000 100.00Mega Management & Consulting Co., Ltd. 0 0 1,000,000 100.00 1,000,000 100.00Mega Futures Co., Ltd. 0 0 40,000,000 100.00 40,000,000 100.00Mega Global Asset Management Co., Ltd. 0 0 8,740,000 100.00 8,740,000 100.00Mega International Investment Services Co., Ltd. 0 0 2,000,000 100.00 2,000,000 100.00Mega Securities Holdings Co., Ltd. 0 0 25,990,337 100.00 25,990,337 100.00Mega Capital (Asia) Co., Ltd. 0 0 80,000,000 100.00 80,000,000 100.00Mega Securities (Hong Kong) Co., Ltd. 0 0 140,000 100.00 140,000 100.00Mega International Commercial Bank (Canada) 0 0 230,000 100.00 230,000 100.00Mega International Commercial Bank Public Co., Ltd. 0 0 400,000,000 100.00 400,000,000 100.00Cathay Investment & Development Corp. ( Bahamas) 0 0 5,000 100.00 5,000 100.00Cathay Investment & Warehousing Ltd. 0 0 1,000 100.00 1,000 100.00Ramlett Finance Holdings Inc. 0 0 1,500 100.00 1,500 100.00ICBC Assets Management & Consulting Co., Ltd. 0 0 28,538,800 100.00 28,538,800 100.00ICBCAMC Offshore Ltd. 0 0 1 100.00 1 100.00ICBCAMC Offshore (Taiwan) II Ltd. 0 0 1 100.00 1 100.00Junior Preference Share Company (Taiwan) II Ltd. 0 0 1 100.00 1 100.00Junior Preference Share Company Ltd. 0 0 1 100.00 1 100.00IP Fund Seven Ltd. 0 0 20,000,000 25.00 20,000,000 25.00An Fang Co., Ltd. 0 0 900,000 30.00 900,000 30.00Taiwan Finance Corporation 0 0 126,713,700 24.55 126,713,700 24.55United Venture Capital Corp. 0 0 4,790,016 25.31 4,790,016 25.31Everstrong Iron Steel & Foundry & Mfg Corp. 0 0 1,760,000 22.22 1,760,000 22.22China Real Estate Management Co., Ltd. 0 0 9,000,000 20.00 9,000,000 20.00China Insurance Co. (SIAM), Ltd. 0 0 1,515,000 25.25 1,515,000 25.25
Note 1: TaiwanPay Corporation was dissolved on Feb.1, 2012Note 2: Mega International Asset Management Co., Ltd was dissolved on May 4, 2012

Capital O
verview
532012 ANNUAL REPORT
Capital Overview

Capital O
verview
54 OUR VISION—being your best financial service partner
Capital Overview
4.1 Capital and Shares
4.1.1 Issued SharesAs of April 30, 2013
Month/Year
Par value (NTD)
Authorized Capital Paid-in Capital Remark
Shares Amount(NTD) Shares Amount
(NTD) Sources of Capital Other
Aug. 2012 10 12,000,000,000 120,000,000,000 11,449,823,983 114,498,239,830 Capitalization of retained earnings for NT$1,692,092,210 Note
Note: The capitalization was approved by the letter No. 1010031536 dated July 23, 2012 issued by the Financial Supervisory Committee.
Type of Stock As of April 30, 2013
Type of StockAuthorized Capital
RemarkIssued Shares (Note) Unissued Shares Total
Common Stock 11,449,823,983 550,176,017 12,000,000,000 NoteNote: All issued shares are listed on the Taiwan Stock Exchange.
4.1.2 Status of Shareholders As of April 23, 2013
Type of Shareholders Government Agencies
Financial Institutions
Other Juridical Persons
Domestic Natural Persons
Foreign Institutions & Natural Persons Total
Number of Shareholders 16 122 706 269,670 802 271,316Shareholding (shares) 2,226,855,043 1,974,078,129 967,193,282 1,991,922,099 4,289,775,430 11,449,823,983Holding Percentage (%) 19.45 17.24 8.45 17.40 37.46 100.00
4.1.3 Distribution Profile of Share Ownership Par value per share: NT$10 As of April 23, 2013
Shareholder Ownership (Unit: Share) Number of Shareholders Shareholding (Shares) Percentage (%) 1 ~ 999 103,710 31,033,684 0.27 1,000 ~ 5,000 98,530 223,618,739 1.95 5,001 ~ 10,000 30,476 212,210,135 1.85 10,001 ~ 15,000 14,045 163,164,988 1.43 15,001 ~ 20,000 5,869 102,102,493 0.89 20,001 ~ 30,000 6,808 161,405,916 1.41 30,001 ~ 40,000 3,077 104,661,148 0.91 40,001 ~ 50,000 1,864 83,321,254 0.73 50,001 ~ 100,000 3,620 246,403,921 2.15 100,001 ~ 200,000 1,745 235,765,136 2.06 200,001 ~ 400,000 645 176,008,255 1.54 400,001 ~ 600,000 213 104,156,427 0.91 600,001 ~ 800,000 117 81,605,478 0.71 800,001 ~ 1,000,000 95 86,052,704 0.751,000,001 ~ 1,200,000 59 64,544,171 0.561,200,001 ~ 1,400,000 35 45,306,483 0.401,400,001 ~ 1,600,000 36 54,034,072 0.471,600,001 ~ 1,800,000 22 37,744,893 0.331,800,001 ~ 2,000,000 23 43,683,112 0.38
Over 2,000,001 327 9,193,000,974 80.30Total 271,316 11,449,823,983 100.00

Capital O
verview
552012 ANNUAL REPORT
4.1.4 Major Shareholders As of April 23, 2013
Name of Shareholder Number of Common Shares
Percentage of VotingShares (%)
Shareholders Resident in China of Int'l Commercial Bank of China 1,358,511,907 11.86
Ministry of Finance, ROC 1,143,043,883 9.98
National Development Fund, Executive Yuan, ROC 699,776,000 6.11
Bank of Taiwan Trust Account 364,386,046 3.18
Chunhwa Post Co., Ltd. 312,447,921 2.73
Bank of Taiwan 286,954,793 2.51
Fubon Life Insurance Co., Ltd. 271,504,156 2.37
Vanguard emerging markets stock index fund 187,052,101 1.63
Pou Chen Corporation 164,256,622 1.43
Cathay Life Insurance Co., Ltd. 158,603,208 1.39
Dimensional emerging markets value fund 124,743,381 1.09
China Life Insurance Company, Ltd. 116,831,794 1.02
4.1.5 Market Price, Net Worth, Earnings, and Dividends Per ShareUnit: NT$
YearItem 2012 2011 March 31, 2013
Market Price Per Share ( Note 1 )
High 24.50 29.55 25.90
Low 18.95 17.60 22.60
Average 21.92 23.07 24.41
Net Worth Per Share ( Note 2 )
Before Distribution 18.67 17.99 19.02
After Distribution (Note 6) 17.72 -
Earnings Per Share
The Weighted Average of Outstanding Shares (Unit: shares) 11,449,823,983 11,280,614,762 11,449,823,983
Earnings Per ShareBefore Adjustment 1.91 1.60 0.54
After Adjustment 1.88 1.57 -
Dividends Per Share
Cash Dividends 1.10 0.85 (Note 6)
Stock Dividends Earnings - 0.15 -
Capital Surplus - - -
Cumulative Undistributed Dividends - - -
InvestmentReturn Analysis
PE Ratio ( Note 3 ) 11.66 14.69 45.20
Price-Dividend Ratio ( Note 4 ) 19.93 23.07 -
Cash Dividend Yield ( % ) ( Note 5 ) 5.02% 4.33% -
Note: 1. Average market price = trading value / trading volume2. Net worth per share = net worth / total number of shares outstanding 3. PE ratio = average closing price / earnings per share4. Price-dividend ratio = average closing price / cash dividends per share5. Cash dividend yield = cash dividends per share / average closing price6. The proposal for distribution of 2012 profits will be submitted at the annual shareholders meeting on June 21, 2013.

Capital O
verview
56
Capital Overview
OUR VISION—being your best financial service partner
4.1.6 Dividend Policy and Implementation Status
A. Dividend Policy
According to its Articles of Incorporation, the Company’s dividend policy is described as follows:
After paying all taxes and offsetting its accumulated losses of prior years in accordance with the laws, the Company shall set aside a legal reserve in accordance with the laws. Aside from the aforesaid legal reserve, the Company may set aside special reserve, in accordance with laws or its actual needs. The Company may also retain certain earnings. The remainder (including reversible special reserve ) shall be distributed as follows: (1) employee profit sharing between 0.02% and 0.16%, (2) remuneration to directors and supervisors not exceeding 0.5%. Any remaining balance of net earnings, including undistributed earnings from previous fiscal years, shall be distributed or retained in accordance with the Board of Directors’ proposal, subject to resolutions of the Annual Shareholders’ Meeting.
Unless otherwise approved by the shareholsers' meeting, at least 50% of the shareholders’ dividends shall be paid in cash, and the rest paid in the form of stock dividend. The aforesaid employee profit sharing shall be distributed in cash or stock subject to the approval of shareholders’ meeting. The employees of subsidiaries of the Company may also be entitled to the employee stock bonus, subject to the rules set forth by the Board of Directors.
B. Proposed Distribution of 2012 Profits
It is proposed to submit to the Company’s Annual Shareholders’ Meeting, to be held on June 21, 2013, for its approval of the distribution of NTD 12,594,806,381 cash dividends (NTD 1.10 per share), NTD 10,240,000 cash as employee profit sharing, and NTD 96,899,000 remuneration for directors and supervisors.
4.1.7 Impact to 2012 Business Performance and EPS Resulting from Stock Dividend Distribution
The Company will not distribute any stock dividend for earning of 2012.
4.1.8 Employee Profit Sharing and Remuneration for Directors and Supervisors
A. Employee profit sharing and remunerations for directors and supervisors as prescribed by the Company’s Articles of Incorporation
Please refer to 4.1.6 (A) Dividend Policy.
B. The accounting assumptions for employee profit sharing and remuneration to directors and supervisors for the year 2012
The Company’s 2012 earnings distribution proposal is expected to submit to the shareholders’ meeting on June 21, 2013. The proposed employees’ profit sharing and remuneration to directors

Capital O
verview
572012 ANNUAL REPORT
and supervisors are NTD 10,240,000 and NTD 96,899,000, respectively. The remuneration to directors and supervisors is appropriated at the ratio of 0.5% stipulated in the Company’s Articles of Incorporation, based on NTD 19,379,826,121, the net balance of net income for NTD 21,533,140,135 deducting 10% legal reserve. The employees’ profit sharing is appropriated at the ratio of 0.0528% based on the above-mentioned amount of NTD 19,379,826,121.
C. Information on employee profit sharing being proposed by the Board of Directors
The remuneration to directors and supervisors in cash of NTD 96,899,000 and employee profit sharing in cash for NTD 10,240,000 have been recognized as 2012 expenses. Remuneration to directors increases NTD 95,952 versus booking amount due to CPA’s adjustment of 2012 earning, and employee profit sharing decreases NTD 20,736,975 versus booking amount due to employee profit sharing percentage adjustment. The differences would be treated as changes in accounting estimation of 2013.
Starting from January 1, 2008, the aforesaid profit sharing for directors, supervisors and employees’ profit sharing has been accounted for as expenses. The earnings per share for 2012 is NTD 1.88. Set forth below are details of the proposed profit distribution for 2012 and distributed profits for 2011:
Unit: NT$
Item 2012 2011
Cash dividends to common shareholders $12,594,806,381 $9,588,522,548
Stock dividends to common shareholders 0 1,692,092,210
Remuneration for directors and supervisors 96,899,000 79,559,000
Employee’ profit sharing in cash 10,240,000 10,185,989
D. Distribution of earnings for the year 2011 as employee profit sharing and remunerations for directors and supervisors
With respect to the earnings distribution for the year 2011, the actual distribution of employee profit sharing and remunerations for directors and supervisors is the same as the distribution proposal approved by the board of directors and shareholders meeting. Remuneration to directors and supervisors decreases NTD 242,424 versus booking amount due to CPA’s adjustment of 2011 earning, and employee profit sharing decreases NTD 15,350,467 versus booking amount due to employee profit sharing percentage adjustment. The differences have been treated as changes in accounting estimation of 2012.
4.1.9 Buyback of Company Shares
The Company did not undertake any stock buyback during the year 2012 and up to the date of publication of this annual report.

Capital O
verview
58
Capital Overview
OUR VISION—being your best financial service partner
4.2 Issuance of Corporate Bonds
Issue 2011-1 Exchangeable Bond
Issue Date July 11, 2011
Denomination NT$100,000
Issue / Transaction Place Taiwan
Issue Price 102% of the nominal amount
Issue Amount (Nominal amount) NT$6,000,000,000
Coupon Rate 0%
Maturity 2.5 years (due January 11, 2014)
Repayment Priority Senior, unsubordinated
Guarantor None
Trustee Taipei Fubon Commercial Bank
Underwriter KGI Securities Co., Ltd.
Certifying Attorney Chung-Chieh Wei Law Office
Auditor PricewaterhouseCoopers, Taiwan
Repayment Unless previously purchased and cancelled, redeemed or exchanged, the bonds will be redeemed in cash at 100% of the principal amount at the maturity date.
Outstanding Principal NT$6,000,000,000
Redemption at the Option of the Issuer
a) From October 12, 2011 to December 2, 2013, if the closing price of TBB common stocks exceeds 30% of the exchange price in continuous 30 business days, the Company may redeem the bonds at principal amount in the terms of exchange by cash within 30 business days.
b) From October 12, 2011(the first day after bonds issued for 3 months) to December 2, 2013 (40 days before maturity), the Company may redeem the bonds at principal amount in the terms of exchange by cash if at least 90% in principal amount of the bonds has already been exchanged, redeemed or purchased and cancelled.
Restriction Clause None
Whether Included in Eligible Capital No
Credit Rating Rated twAA by Taiwan Ratings Corp. on May 17, 2011
Other Rights of
Bondholders
Amount of Converted or Exchanged Common Shares, DRs or Other Securities
None
Terms of Issuance and Exchange (or Conversion)
Please refer to the note of the Company’s financial statements of 2012
Dilution Effect and Other Adverse Effects on Existing Shareholders None
Custodian of the Underlying Securities Taiwan Depository & Clearing Corporation

Capital O
verview
592012 ANNUAL REPORT
Issue 2007-2Domestic Unsecured Bond
2008-1 Domestic Unsecured Bond
2008-2 Domestic Unsecured Subordinated Bond
Issue Date February 4, 2008 May 13, 2008 December 26, 2008
Denomination NT$1,000,000 NT$1,000,000 NT$1,000,000
Issue / Transaction Place Taiwan Taiwan Taiwan
Issue Price Par Par Par
Issue Amount
NT$3,700,000,000 (including Tranche A for NT$1,300,000,000, Tranche B for NT$400,000,000 and Tranche C for NT$2,000,000,000)
NT$5,750,000,000 (including Tranche A for NT$2,400,000,000, Tranche B for NT$1,250,000,000, Tranche C for NT$1,800,000,000 and Tranche D for NT$300,000,000 )
NT$6,000,000,000
Coupon Rate
Tranche A: 2.68% p.a.Tranche B: 90-day TWD BACP + 0.22% p.a.Tranche C: 2.78% p.a.
Tranche A: 2.58% p.a. Tranche B: 90-day TWD BACP + 0.20% p.a.Tranche C: 2.75% p.a. Tranche D: 90-day TWD BACP + 0.25% p.a.
3.26% p.a.
Maturity
Tranche A & B: 3 years (due 02/04/2011)Tranche C: 5 years (due 02/04/2013)
Tranche A & B: 3 years (due 05/13/2011)Tranche C & D: 5 years (due 05/13/2013)
7 years (due 12/26/2015)
Repayment Priority Senior, unsubordinated Senior, unsubordinated Subordinated
Guarantor None None None
Trustee Bank SinoPac Bank SinoPac Taipei Fubon Commercial Bank
Underwriter None None None
Certifying Attorney Shing Tai Law Office Shing Tai Law Office Shing Tai Law Office
Auditor PricewaterhouseCoopers, Taiwan PricewaterhouseCoopers, Taiwan PricewaterhouseCoopers, Taiwan
Repayment Principal to be repaid in lump sum atmaturity based on the face value
Principal to be repaid in lump sum at maturity based on the face value
Principal to be repaid in lump sum at maturity based on the face value
Outstanding Principal NT$2,000,000,000 NT$2,100,000,000 NT$6,000,000,000
Redemption or Early Repayment Clause None None None
Restriction Clause None None Note
Whether Included in Eligible Capital No No Yes
Credit Rating Rated twAA by Taiwan Ratings Corp. on December 21, 2007
Rated twAA by Taiwan Ratings Corp. on April 9, 2008
Rated twA+ by Taiwan Ratings Corp. on November 27, 2008
Other Rights
ofBondholders
Amount of Converted or Exchanged Common Shares, DRs or Other Securities
None None None
Terms of Issuance and Exchange (or Conversion)
Not Applicable Not Applicable Not Applicable
Dilution effect and other adverse effects on existing shareholders None None None
Custodian of the underlying securities None None None
Note: If the Company's capital adequacy ratio is lower than the minimum requirements stipulated by the competent authorities due to payment of interest and repayment of principal of corporate bonds, the Company will cease payment of interest and principal until the ratio meets the stipulated requirements. (Interest is added, and interest and rollover of principal is calculated at coupon rate.)

Capital O
verview
60
Capital Overview
OUR VISION—being your best financial service partner
Information of the Exchangeable Bonds
Bond Category 2011-1 Exchangeable Bonds
YearItem
Issue date(July 11, 2011) December 31, 2011 December 31, 2012 March 31, 2013
Shareholding of Underlying Common Shares 541,464,015 shares 565,829,895 shares 588,463,090 shares 588,463,090 shares
Exchange Price 13.00 12.40 11.60 11.60
Market Price of the Exchangeable Bonds
Highest 102.00 102.00 100.90 100.40
Lowest 101.00 97.00 97.40 98.85
Average 101.20 99.86 99.13 99.67
Issue Date July 11, 2011
Underlying Securities Common Shares of Taiwan Business Bank
4.3 Preferred Stock: None.
4.4 Depositary Receipts: None.
4.5 Employee Stock Options: None.
4.6 New Restricted Employee Shares: None.
4.7 Mergers and Acquisitions of Other Financial Institutions: None.
4.8 Financing Plans and Implementation The Company’s financing plans through issuance of corporate bonds have already implemented with expected effect.

Operational O
verview
612012 ANNUAL REPORT
Operational Overview

Operational O
verview
62 OUR VISION—being your best financial service partner
Operational Overview
5.1 Business OverviewMega Financial Holding Company
According to Taiwan’s Financial Holding Company Act, the business of a financial holding company shall be limited to investment in, and management of, its invested enterprise(s). Business scope of the Company’s subsidiaries includes banking, securities, bills finance, property and casualty insurance, asset management, venture capital, securities investment trust, insurance agency. Nearly all of the Company’s revenues are derived from subsidiaries.
Revenue BreakdownUnit: NT$1,000
YearItem
2012 2011Amount % Amount %
Investment income from equity investments accounted for by the equity method 22,661,062 99.73 18,111,631 98.42
Other operating revenue 60,374 0.27 290,135 1.58
Total 22,721,436 100.00 18,401,766 100.00
Mega International Commercial Bank Co., Ltd. The bank’s business scope includes commercial banking, consumer banking, wealth management,
investment banking and other services as approved by the competent authority. In 2012, its net revenue amounted to NTD 43,133,328 thousand, an upsurge of 16.54% from the year before. Net interest income and non-interest income grew 11.65% and 26.31%, respectively.
Breakdown of Net RevenueUnit: NT$1,000
YearItem
2012 2011Amount % Amount %
Net interest income 27,535,926 63.84 24,662,404 66.63
Non-interest income 15,597,402 36.16 12,348,846 33.37
Fee income – net 6,618,410 15.34 6,105,673 16.50
Gains on financial assets and liabilities at fair value through profit or loss 2,040,090 4.73 ( 179,329 ) ( 0.48 )
Realized gain on available-for-sale financial assets 1,288,352 2.99 895,664 2.42
Investment income recognized by the equity method 488,349 1.13 213,606 0.58
Foreign exchange gain – net 2,325,755 5.39 1,509,094 4.08
Loss on asset impairment ( 483,955 ) ( 1.12 ) ( 88,829 ) ( 0.24 )
Gains / losses on disposal of properties 2,021 0.00 1,006,072 2.72
Gain on financial assets carried at cost 780,303 1.81 733,582 1.98
Gain on sale of non-performing loans 1,480,426 3.43 1,404,085 3.79
Other non-interest income – net 1,057,651 2.45 749,228 2.02
Net revenue 43,133,328 100.00 37,011,250 100.00
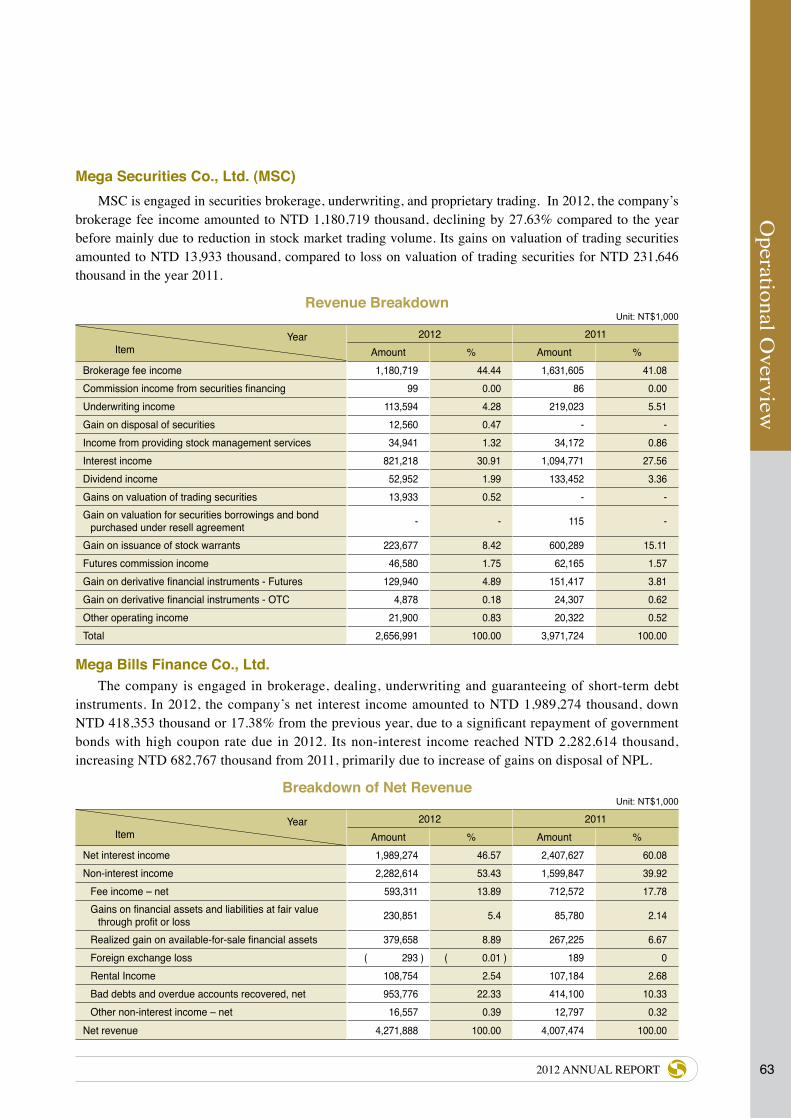
Operational O
verview
632012 ANNUAL REPORT
Mega Securities Co., Ltd. (MSC)MSC is engaged in securities brokerage, underwriting, and proprietary trading. In 2012, the company’s
brokerage fee income amounted to NTD 1,180,719 thousand, declining by 27.63% compared to the year before mainly due to reduction in stock market trading volume. Its gains on valuation of trading securities amounted to NTD 13,933 thousand, compared to loss on valuation of trading securities for NTD 231,646 thousand in the year 2011.
Revenue BreakdownUnit: NT$1,000
YearItem
2012 2011Amount % Amount %
Brokerage fee income 1,180,719 44.44 1,631,605 41.08 Commission income from securities financing 99 0.00 86 0.00 Underwriting income 113,594 4.28 219,023 5.51 Gain on disposal of securities 12,560 0.47 - -Income from providing stock management services 34,941 1.32 34,172 0.86 Interest income 821,218 30.91 1,094,771 27.56 Dividend income 52,952 1.99 133,452 3.36 Gains on valuation of trading securities 13,933 0.52 - -Gain on valuation for securities borrowings and bond
purchased under resell agreement - - 115 -
Gain on issuance of stock warrants 223,677 8.42 600,289 15.11Futures commission income 46,580 1.75 62,165 1.57 Gain on derivative financial instruments - Futures 129,940 4.89 151,417 3.81 Gain on derivative financial instruments - OTC 4,878 0.18 24,307 0.62Other operating income 21,900 0.83 20,322 0.52 Total 2,656,991 100.00 3,971,724 100.00
Mega Bills Finance Co., Ltd. The company is engaged in brokerage, dealing, underwriting and guaranteeing of short-term debt
instruments. In 2012, the company’s net interest income amounted to NTD 1,989,274 thousand, down NTD 418,353 thousand or 17.38% from the previous year, due to a significant repayment of government bonds with high coupon rate due in 2012. Its non-interest income reached NTD 2,282,614 thousand, increasing NTD 682,767 thousand from 2011, primarily due to increase of gains on disposal of NPL.
Breakdown of Net Revenue Unit: NT$1,000
YearItem
2012 2011Amount % Amount %
Net interest income 1,989,274 46.57 2,407,627 60.08Non-interest income 2,282,614 53.43 1,599,847 39.92
Fee income – net 593,311 13.89 712,572 17.78Gains on financial assets and liabilities at fair value
through profit or loss 230,851 5.4 85,780 2.14
Realized gain on available-for-sale financial assets 379,658 8.89 267,225 6.67Foreign exchange loss ( 293 ) ( 0.01 ) 189 0Rental Income 108,754 2.54 107,184 2.68Bad debts and overdue accounts recovered, net 953,776 22.33 414,100 10.33Other non-interest income – net 16,557 0.39 12,797 0.32
Net revenue 4,271,888 100.00 4,007,474 100.00

Operational O
verview
64
Operational Overview
OUR VISION—being your best financial service partner
Chung Kuo Insurance Co., Ltd. The company is a property and casualty insurer. Total direct written premium income for 2012
amounted to NTD 5,920,683 thousand, up 8.48% compared to 2011. Reinsurance premium income for 2012 reached NTD 743,095 thousand, increasing NTD 78,868 thousand from NTD 664,227 thousand in 2011.
Revenue BreakdownUnit: NT$1,000
YearItem
2012 2011
Amount % Amount %
Fire insurance premium 1,523,122 25.73 1,405,906 25.76
Marine cargo insurance premium 269,317 4.55 266,639 4.89
Marine hull insurance premium 471,491 7.96 446,273 8.18
Automobile insurance premium 2,109,252 35.63 1,932,813 35.41
Aviation insurance premium 145,836 2.46 166,002 3.04
Engineering insurance premium 440,788 7.44 395,510 7.25
Accident insurance premium 370,238 6.25 240,576 4.41
Health insurance premium 3,495 0.06 1,330 0.02
Other insurance premium 587,144 9.92 602,698 11.04
Total direct written premium income 5,920,683 100.00 5,457,747 100.00
Inward reinsurance premium income 743,095 - 664,227 -
Total 6,663,778 - 6,121,974 -
Mega International Investment Trust Co., Ltd. The company provides investment management services through the various Mega mutual funds. As
of the end of 2012, the company’s assets under management amounted to NTD 75.06 billion, ranking 10th among the 38 securities investment trust companies. Its management fee income reached NTD 327,748 thousand in 2012, down NTD 19,271 thousand from 2011.
Revenue BreakdownUnit: NT$1,000
YearItem
2012 2011
Amount % Amount %
Management fee income from public issued funds 326,566 99.64 345,780 99.64
Management fee income from private equity funds 144 0.04 156 0.04
Management fee income from discretionary account 1,038 0.32 1,083 0.32
Total 327,748 100.00 347,019 100.00
Mega Asset Management Co., Ltd.The company is a NPL asset management company. In 2012, the net proceeds from disposal of the
purchased NPL amounted to NTD 768,429 thousand, a upsurge of 55.00% compared with the previous year, while other operating revenue declined NTD 79,563 thousand from 2011.

Operational O
verview
652012 ANNUAL REPORT
Revenue BreakdownUnit: NT$1,000
YearItem
2012 2011
Amount % Amount %
Net proceeds from disposal of purchased NPL and Gain on sale of collaterals 768,429 83.35 495,748 72.15
Rental income 41,800 4.53 64 0.01
Other operating revenue 111,706 12.12 191,269 27.84
Operating revenues 921,935 100.00 687,081 100.00
Mega Life Insurance Agency Co., Ltd.
The company provides life insurance agency service to the network of Mega International Commercial Bank and Mega Securities Company. In 2012, the insurance commission income generated by the company amounted to NTD 1,213,988 thousand, an increase of 100.34% from NTD 605,975 thousand recorded in 2011.
Revenue BreakdownUnit: NT$1,000
YearItem
2012 2011
Amount % Amount %
Commission income - traditional policy 1,186,599 97.74 595,232 98.23
Commission income - investment policy 27,389 2.26 10,743 1.77
Total 1,213,988 100.00 605,975 100.00
Mega Venture Capital Co., Ltd.
The company is engaged in venture capital investment. In 2012, the company’s revenue from disposal of long-term securities investment amounted to NTD 152,363 thousand, down 30.27% from 2011, due to poor stock market performance affected by the proposal of capital gain tax on disposal of securities. Its operating revenue amounted to NTD 168,623 thousand, reducing 28.33% from 2011.
Revenue BreakdownUnit: NT$1,000
YearItem
2012 2011
Amount % Amount %
Revenue from disposal of long-term securities investment 152,363 90.36 218,500 92.87
Dividend income 15,397 9.13 15,728 6.69
Other operating revenue 863 0.51 1,037 0.44
Total 168,623 100.00 235,266 100.00

Operational O
verview
66
Operational Overview
OUR VISION—being your best financial service partner
5.2 Operating Policies in 2013
Mega Financial Holding Company
1. Cultivating existing clients to create synergy within our group.
(1) To maintain current client relations and enhance renewal rate of products and services
(2) To enhance resource integration and broaden client penetration for the Group
2. Fortifying relationships with institutional investors.
(1) To strengthen ties with investors and establish a sound relationship based on mutual trust
(2) To respond to investors’ suggestions in a timely manner and take investors’ suggestions into consideration for strategy making
(3) To hold or participate in institutional investment conferences to enhance investor recognition
3. Focusing on core competency to maximize shareholders value to maximize shareholders value
(1) To accelerate internationalization process to raise the proportion of overseas profits
(2) To actively evaluate the feasibility of offering service in South East Asia and continuingly watch the development in Mainland China
(3) To effectively manage and build up a strategic investment portfolio, to optimize profits with minimum risk
4. Strengthening risk management systems
(1) To enhance the Group’s risk early warning system
(2) To supervise our subsidiaries’ policies and rules governing risk management and its implementation
(3) To integrate our subsidiaries' risk management information platforms and enhance the Group's risk management information system
(4) To supervise our subsidiaries' establishment of the risk management mechanisms in an effort to enhance the effectiveness of the Group’s risk management
(5) To supervise all subsidiaries to take measures to strengthen capital and liquidity to meet the requirement of BASEL III
5. Upgrading our management efficiency and optimizing financial performance
(1) To strengthen our core capital and to plan for an optimal capital scale
(2) To take advantage of the profit niche and raise financial performance
(3) To enhance disclosure of financial information and increase transparency on financial information
6. Reinforcing information security and enhancing system operational capability
(1) To strengthen information security management in compliance with the Personal Information Protection Act
(2) To phase out information systems and enhance system operational capability
(3) To utilize smart tools for business and strengthen dynamic management of operational performance
(4) To continue integrating the Group’s network service to create synergy from resource sharing

Operational O
verview
672012 ANNUAL REPORT
7. Strengthening human resource management and improving organizational effectiveness
(1) To streamline human resource and to implement performance-oriented compensation system
(2) To intensify employees training in order to develop professional talents
(3) To continue evaluating and adjusting the organizational structure and enhance operational effectiveness
8. Others
(1) To conserve energy and reduce carbon emissions and reduce administration expenses by carrying out group purchase
(2) To actively participate in social charitable works to fulfill social responsibility and boost corporate image
(3) To make overall arrangement on the Group’s property in order to raise overall assets utilization efficiency
Mega International Commercial Bank
(1) To extend the overseas network, focusing on Asia-Pacific and the Great China(2) To adjust income structure, grasp the movement of major corporate customers’ cash flow, expand
interest spread, increase fee income(3) To reinforce corporate banking business and expand wealth management business(4) To enhance electronic banking platform service functionality to increase transaction volume(5) To intensify risk and crisis management framework to ensure fully legal compliance(6) To maximize group synergy by cross-selling with other subsidiaries of the Group
5.3 Industry Overview
Financial Holding Company
1. Since the enactment of the Financial Holding Company Act in July 2001, there have been one wholly state-owned financial holding corporation and fifteen listed financial holding corporations. However, the fact that the market shares of the banks under these financial holding corporations account for less than 10% shows that the banks are still relatively small in size, which indicates the lack of economies of scale. As a consequence, overbanking is likely to hinder the development of the industry.
2. After the signing of the cross-strait financial MOU and ECFA, other relevant regulations and policies are becoming more favorable for businesses. The cross-strait RMB settlement mechanism and banks’ domestic banking units are allowed to undertake RMB businesses; domestic banks have been aggressively developing financial services such as offshore RMB wire transfer/deposits, lending and sales of financial products, which are based upon cross-strait economic activities and with marked cross-strait features.
3. In order to continuously provide services for Taiwanese enterprises operating overseas, financial institutions have established operations not only in China, but also in Southeast Asian countries such as Thailand, Vietnam, Cambodia, and Indonesia. Already, financial institutes with global vision aiming to become regional financial institutions have been actively expanding in the region.

Operational O
verview
68
Operational Overview
OUR VISION—being your best financial service partner
Banking Industry
1. Domestic bank’s revenue has jumped significantly. Overall income before tax for the year ended 2012 has reached NTD 240.2 billion, breaking the prior year record of NTD 200 billion.
2. As of 2012, domestic banks have maintained healthy asset quality, with an NPL ratio of 0.4%, and a coverage ratio of 274%.
3. The pace of overseas expansion has sped up. Domestic banks have set a record by adding another 23 overseas offices, including 17 branches (or subsidiaries) and 6 representative offices, located mainly in China and Southeast Asia.
4. As of 2012, the 17 banks with high concentrations in real estate lending have significantly reduced their relevant balances, showing signs of improvement. Mortgage loans granted by the 5 major banks have come to a 4-year low, a significant decrease.
5. In February 2013, a cross-border RMB settlement mechanism agreement was signed; following the easing of regulations on OBU in 2011, DBU are also granted the access to RMB business. Domestic banks have seen their RMB business gradually expand after 2011 and commenced RMB business via branches in China in 2012. With restrictions fully lifted, RMB business is expected to grow signifcantly in the coming years.
Securities Industry
1. The primary market has been greatly impacted by the capital gains tax proposal, price hike in oil and electricity as well as the Eurozone debt problems. The number of IPOs this year stood at 22, decreasing from 2011’s 99. In the secondary market, the TAIEX closed at 7,699 at the end of 2012, an increase of 8.87% from 7,072 at the beginning of the year. However, average daily trading volume plummeted to NTD 95.7 billion, from NTD 126.4 billion in 2011. As a result, both brokerage commission fee income and interest income of the securities industry dropped dramatically. Nonetheless, projections for both IPO numbers, TAIEX and trading volume in 2013 are positive, as economic growth and company profits are expected to gradually recover from turbulence.
2. As a whole, domestic securities company have benefitted from stabilizing Cross-Strait relations, a gradual recovery of the economy and easing of regulations by the Taiwanese government. In 2013, domestic securities companies are expected to expand wealth management services and harvest a steady profit from both primary and the secondary market. In addition, the Taiwanese government plans to lift restrictions on offshore securities business, offering greater opportunities for the securities industry.
Bills Finance Industry
1. Competition remains fierce, with a total of 8 specialized domestic bill finance corporations, 3 of which are subsidiaries of financial holding companies, and 43 banks and 5 securities companies engaging in bill finance business.
2. Estimated issuance of government bonds in 2013 equates to NTD 650 billion, on a par with that of 2012. Bonds supply remains steady, with lingering concerns over a possible capital supply decrease in the Taiwanese debt market caused by new RMB business in the financial sector. In addition, a global economic recovery is expected to heat up domestic growth, increasing the likelihood of a bond yield rebound.

Operational O
verview
692012 ANNUAL REPORT
Property Insurance Industry
1. Of the 19 participants in the Taiwanese property insurance market, 14 are local and 5 are branches or subsidiaries of foreign companies. Local companies, with advantageous sales networks, account for 97.78% of GNWPI.
2. Vehicle coverage remains the main source for income while fire insurance posts the greatest increase due to a rise in premium rates in both natural disaster insurance policies of commercial fire insurance and international natural disaster insurance policies.
3. In the short run, the overall performance of the property insurance industry is expected to be weakened by heated price competition, which hampers growth of premium income, and by increasingly strict reinsurance conditions and ever higher premium rates in the reinsurance market.
Securities Investment Trust Industry
As of December 31, 2012, a total of 623 mutual funds totaling NTD 1.85 trillion, 87 private funds totaling NTD 11.9 billion, and 299 discretionary accounts totaling NTD 896.3 billion were managed by 38 domestic securities investment trusts. There are 5 securities investment trust companies which individually have assets under management exceeding NTD 100 billion.
Assets Management Industry
With the NPL ratio hovering around an historical low, the number of auctions and the size of the distressed debt market have continued to shrink. The market landscape is also changing. Non-collateralized distressed debt (including secondary markets) has become the main source for auctions besides specific targeted distressed debt (syndicated loans and non-syndicated loans). Competition remains hot, further driving down margins.
Insurance Agent Industry
Estimated FYP in the life insurance industry for 2012 reached NTD 1,190.4 billion, a 19.62% increase from NTD 995.1 billion in 2011. Bank insurance accounts for 55.93% of the total FYP, or NTD 665.8 billion, up by 17.25% compared to NTD 567.9 billion in 2011.
Venture Capital Industry
At the end of 2012, of 312 registered venture capital firms, 195 are currently in operation, with total capital size of NTD 153.24 billion. Their investment targets have been in industries such as semiconductor, electronics and optoelectronics manufacturing.
5.4 Market Supply and Demand Forecast1. As of the end of 2012, domestic banks’ lending grew by a mere 2.79% from 2011, due to the sluggish
global economy which impacted corporate capital demand and banks’ risk consciousness. Primary drive for growth came from lending to the private sector. To boost capital efficiency, domestic banks focus on businesses that offered relatively high interest spreads, such as small and medium size enterprise loans, as well as international and domestic syndicated loans. Forecasted steady recovery of the economy in 2013 is expected to generate a significant increase in private investment, which will then boost growth of corporate financing.

Operational O
verview
70
Operational Overview
OUR VISION—being your best financial service partner
2. Consumer loans have been affected by the measures introduced in 2011 by the Taiwan government aiming to stabilize the real estate market. Effective August 1, 2012, the implementation of an actual price registration system for real estate transactions cools off the real estate market. As of the end of 2012, the mortgage loans increased NTD 143.2 billion from 2011, a 2.72% annual increase. Construction loan outstanding went up by 6.58%, a higher increase. Growth in the consumer loan market is expected to continue to be slow in 2013, as the government’s selective credit controls affect mortgage loans that account for nearly 80% of total consumer loans.
5.5 Human Resources
YearItem 2012 2011
Number of Employees
Mega FHC 52 52
Mega Int’l Commercial Bank 5,308 5,264
Mega Bills Finance 224 224
Mega Securities 1,522 1,579
Chung Kuo Insurance 735 718
Mega Int’l Investment Trust 88 92
Mega Asset Management 29 29
Mega Life Insurance Agency 21 17
Total 7,979 7,975
Average Age
Mega FHC 47.05 46.05
Mega Int’l Commercial Bank 42.56 42.18
Mega Bills Finance 42.14 41.17
Mega Securities 40.00 39.00
Chung Kuo Insurance 40.70 40.40
Mega Int’l Investment Trust 41.37 40.55
Mega Asset Management 41.00 40.00
Mega Life Insurance Agency 39.13 39.02
Average Years of Services
Mega FHC 8.94 7.93
Mega Int’l Commercial Bank 16.68 16.35
Mega Bills Finance 14.28 13.44
Mega Securities 8.40 7.47
Chung Kuo Insurance 10.45 10.35
Mega Int’l Investment Trust 8.52 7.82
Mega Asset Management 7.00 6.00
Mega Life Insurance Agency 4.26 4.19

Financial Information
712012 ANNUAL REPORT
Financial Information

72
Financial Information
OUR VISION—being your best financial service partner
Financial Information
6.1 Five-Year Financial Summary
6.1.1 Condensed Consolidated Balance Sheet Unit: NT$1,000
YearItem
Five-Year Financial Summary
2012 2011 2010 2009 2008
Cash and cash equivalents, due from the Central Bank and call loans to banks 464,418,701 503,392,393 398,186,065 404,879,166 374,952,541
Financial assets at fair value through profit or loss 184,569,250 188,869,552 162,320,183 127,525,330 198,444,433
Bills and bonds purchased under resell agreements 2,282,053 1,460,685 1,783,691 796,095 1,729,297
Available-for-sale financial assets 220,625,591 161,432,963 185,898,407 233,016,512 232,069,590
Receivables 125,593,058 107,160,487 147,486,410 121,305,198 120,773,646
Bills discounted and Loans 1,502,490,860 1,462,054,154 1,336,834,541 1,281,835,254 1,321,437,849
Held-to-maturity financial assets 160,776,041 131,290,215 217,839,872 263,152,861 96,097,583
Equity investments accounted for by the equity method 2,667,896 2,548,394 2,574,762 2,727,944 2,545,633
Property and equipment 22,705,148 21,416,577 21,139,449 23,176,304 24,786,243
Intangible assets 312,225 297,150 236,768 323,719 94,703
Other financial assets 21,884,597 22,873,366 23,460,086 24,870,737 26,611,797
Other assets 17,623,275 15,605,999 11,947,689 13,922,463 10,069,505
Total assets 2,725,948,695 2,618,401,935 2,509,707,923 2,497,531,583 2,409,612,820
Due to the Central Bank and financial institutions 358,982,635 367,548,678 322,704,165 410,577,424 396,503,184
Deposits and remittances 60,548,901 71,873,400 38,568,640 1,484,004,073 1,316,769,564
Financial liabilities at fair value through profit or loss 14,676,886 21,312,632 30,019,921 35,384,545 51,434,065
Bills and bonds sold under repurchase agreements 187,481,840 199,581,332 181,816,680 171,365,526 248,491,993
Funds borrowed from the Central Bank and other banks 1,718,208,745 1,588,560,967 1,558,573,139 43,320,303 53,185,187
Bonds payable 62,449,668 61,401,059 53,050,000 50,153,000 54,349,347
Preferred stock liabilities 0 0 0 0 0
Reserve for operations and liabilities 14,882,122 13,610,468 14,177,110 14,024,884 13,322,952
Other financial liabilities 18,254,554 19,798,841 27,388,095 23,032,634 12,117,937
Other liabilities 76,378,660 71,535,832 82,169,447 69,373,699 85,404,208
Total liabilities 2,511,864,011 2,415,223,209 2,308,467,197 2,301,236,088 2,231,578,437
Equity attributable to stockholders of the Company
Capital stock
Beforedistribution 114,498,240 112,806,148 110,594,262 110,594,262 110,594,262
After distribution Note 114,498,240 112,806,148 110,594,262 110,594,262
Capital surplus 43,425,270 43,426,403 43,426,403 43,426,403 43,426,403
Retainedearnings
Beforedistribution 52,212,649 41,960,123 35,967,476 31,916,182 20,349,144
After distribution Note 30,679,508 23,802,107 20,856,756 17,584,288
Equity adjustments 3,648,744 4,688,712 10,882,979 9,717,733 3,108,674
Minority interest 299,781 297,340 369,606 640,915 555,900
Total stockholders’ equity
Before distribution 214,084,684 203,178,726 201,240,726 196,295,495 178,034,383
After distribution Note 193,590,203 191,287,243 185,236,069 175,269,527Note The earnings distribution for 2012 has not been resolved by the shareholders’ meeting.

Financial Information
732012 ANNUAL REPORT
6.1.2 Unconsolidated Condensed Balance SheetUnit: NT$1,000
YearItem
Five-Year Financial Summary
2012 2011 2010 2009 2008
Cash and cash equivalents 77,293 4,276,849 2,689,068 3,973,949 1,276,998
Available-for-sale financial assets 5,143,167 5,279,193 7,147,325 4,326,506 3,654,882
Receivables 857,471 715,141 2,182,939 2,109,325 4,368,517
Equity investments accounted for by the equity method 235,347,057 218,167,682 214,061,392 212,270,268 196,065,435
Property and equipment 783,919 784,065 702,490 727,187 759,660
Other financial assets 758,193 762,046 762,046 762,046 762,046
Other assets 14,611 19,173 200,888 264,016 152,512
Total assets 242,981,711 230,004,149 227,746,148 224,433,297 207,040,050
Financial liabilities at fair value through profit or loss 1,200 0 0 0 0
Payables 13,094,955 10,778,190 11,083,061 9,289,859 10,071,386
Bonds payable 16,049,668 16,301,059 15,750,000 19,450,000 19,450,000
Preferred stock liabilities 0 0 0 0 0
Other financial liabilities 0 0 0 0 0
Other liabilities 50,985 43,514 41,967 38,858 40,181
Total liabilitiesBefore distribution 29,196,808 27,122,763 26,875,028 28,778,717 29,561,567
After distribution Note 36,711,286 36,828,511 39,838,143 32,326,423
Capital stockBefore distribution 114,498,240 112,806,148 110,594,262 110,594,262 110,594,262
After distribution Note 114,498,240 112,806,148 110,594,262 110,594,262
Capital surplus 43,425,270 43,426,403 43,426,403 43,426,403 43,426,403
Retained earningsBefore distribution 52,212,649 41,960,123 35,967,476 31,916,182 20,349,144
After distribution Note 30,679,508 23,802,107 20,856,756 17,584,288
Minority interest 3,648,744 4,688,712 10,882,979 9,717,733 3,108,674
Total stockholders’ Equity
Before distribution 213,784,903 202,881,386 200,871,120 195,654,580 177,478,483
After distribution Note 193,292,863 190,917,637 184,595,154 174,713,627
Note : The earnings distribution for 2012 has not been resolved by the shareholders’ meeting.

74
Financial Information
Financial Information
OUR VISION—being your best financial service partner
6.1.3 Condensed Consolidated Income Statement Unit: NT$1,000 ( except EPS in NT$ )
YearItem
Five-Year Financial Summary
2012 2011 2010 2009 2008
Interest income, net 30,552,003 28,279,104 25,063,829 26,475,701 30,523,536
Revenues other than interest, net 20,708,337 17,457,071 16,913,011 19,956,601 813,598
Bad debts expense on loans ( 4,533,347) ( 3,714,335) ( 2,233,788) ( 7,305,574) ( 8,361,560)
Provisions for insurance reserve 13,025 67,136 ( 110,318) ( 22,302) ( 287,055)
Operating expenses ( 20,904,341) ( 20,973,472) ( 20,993,042) ( 20,048,239) ( 19,603,411)
Income from continuing operations - before tax 25,835,677 21,115,504 18,639,692 19,056,187 3,085,108
Consolidated net income from continuing operations - after tax 21,543,614 17,685,682 15,149,618 14,344,870 262,022
Income from discontinued departments 0 0 0 0 0
Extraordinary gain or loss 0 0 0 0 0
Cumulative effect of changes in accounting principles ( after tax ) 0 0 0 0 0
Consolidated net income
Attributable to stockholders of the Company
21,533,141 17,679,892 15,110,720 14,331,894 294,519
Attributable to minority interest 10,473 5,790 38,898 12,976 ( 32,497)
Earnings per shareStockholders of the Company 1.88 1.54 1.34 1.30 0.02
Minority interest 0 0 0 0 0
Note : The consolidated financial statements of 2008 to 2011 were audited by CPA, Chang Chou Li and Hsiu-Ling Lee, of PricewaterCoopers, Taiwan. The consolidated financial statements of 2012 were audited by CPA, Chien-Hung Chou and Hsiu-Ling Lee, of the same firm with unqualified opinion, the audit opinion for 2008 and 2009 are modified unqualified opinion, while the audit opinion for 2010 and 2011 are unqualified opinion.
6.1.4 Condensed Income Statement
Unconsolidated Unit: NT$1,000
Year Item
Five-Year Financial Summary
2012 2011 2010 2009 2008
Investment income from equity investments accounted for by the equity method 22,661,062 18,111,631 16,099,414 15,190,437 858,051
Other income 60,374 290,135 32,523 21,403 49,816
Operating expenses ( 349,077) ( 352,549) ( 339,879) ( 328,786) ( 325,766)
Other expenses and losses ( 363,292) ( 364,912) ( 490,865) ( 514,215) ( 411,000)
Income before income tax 22,009,067 17,684,305 15,301,193 14,368,839 171,101
Net income 21,533,141 17,679,892 15,110,720 14,331,894 294,519
Earnings per share ( before tax ) 1.92 1.54 1.36 1.30 0.02
Earnings per share ( after tax ) 1.88 1.57 1.34 1.30 0.03

Financial Information
752012 ANNUAL REPORT
6.1.5 Quartly Financial Statement Q1 / 2013 of the Group (IFRS)
Item March 31, 2013Cash and cash equivalents, due from the Central Bank and call loans to banks 423,110,180
Financial assets at fair value through profit or loss 188,863,992Available-for-sale financial assets 234,128,871Derivative financial assets for hedge 0Bills and bonds purchased under resell agreements 5,680,453Receivables, net 109,399,732Current income tax assets 810,333Assets held for sale, net 0Bills discounted and loans 1,525,727,058Reinsurance contract assets 3,182,753Held-to-maturity financial assets 161,620,690Equity investments accounted for by the equity method 2,965,546Restricted assets 0Other financial assets, net 26,785,687Property and equipment, net 19,299,519Investment property, net 5,220,935Intangible assets, net 263,487Deferred income tax assets, net 3,654,680Other assets 10,035,445Total assets 2,720,749,361Due to the Central Bank and financial institutions 358,460,730Funds borrowed from the Central Bank and other banks 9,643,436
Financial liabilities at fair value through profit or loss 15,621,479Derivative financial liability for hedge 0Bills and bonds sold under repurchase agreements 179,663,658Commercial paper payable 7,193,143Payables 61,659,386Current income tax liability 7,468,451Liability directly related to assets held for sale 0Deposits and remittances 1,751,919,907Bonds payable 57,961,883Other borrowings 6,554,000Preferred stock liabilities 0Other financial liabilities 12,514,435Reserve for liabilities 22,839,107Deferred income tax liability 1,654,107Other liabilities 9,503,831
Total liabilitiesBefore distribution 2,502,657,512After distribution Note 1
Attributable to equity of parent company 217,786,934Capital stock 114,498,240Capital surplus 43,425,270
Retained earnings Before distribution 58,283,459After distribution Note 1
Other equity 1,579,965Treasury stock 0Non-controlling interest 304,915
Total EquityBefore distribution 218,091,849After distribution Note 1
Condensed Consolidated Balance Sheet-IFRSUnit: NT$1,000
Condensed Consolidated Income Statement-IFRSUnit: NT$1,000
Note: 1.The earnings distribution for 2013 has not been resolved by the shareholders’ meeting.2.The financial statement of March 31, 2013 have been reviewed by CPA, Chien-Hung, Chou and King-Tse, Huang of PricewaterhouseCoopers with a unqualified
review report.
Item The First Quarter of 2013
Interest income 10,894,708Less: interest expenses ( 3,305,903)Interest income, net 7,588,805Revenues other than interest, net 5,686,900Net revenue 13,275,705Bad debts expense on loans and provisions for guarantee ( 861,176)
Net change of insurance liability reserve 97,943Operating expenses ( 5,310,316)Income from continuing operations – before tax 7,202,156
Income tax (expenses) benefits ( 1,014,569)Net income from continuing operations – after tax 6,187,587
Income from discontinued departments 0Net income (loss) 6,187,587Current other comprehensive net income (net of tax) 1,423,501
Current total comprehensive net income 7,611,088Net income attributed to the stockholders of the Company 6,186,420
Net income attributable to non-controlling interest 1,167
Comprehensive income attributable to parent company 7,587,240
Comprehensive income attributable to non-controlling interest 23,848
Earnings per share 0.54

76
Financial Information
Financial Information
OUR VISION—being your best financial service partner
6.2 Five-Year Financial Analysis Unit: NT$1,000; %
Year Item
Financial Analysis in The Past Five Years First Quarter of
20132012 2011 2010 2009 2008
Operating Ability
Total Assets Turnover 0.09 0.08 0.07 0.07 0.004 0.03
Loans to Deposits Ratio of Bank Subsidiary ( % ) 88.80 93.03 86.70 87.31 100.95 -
NPL Ratio of Bank Subsidiary ( % ) 0.17 0.24 0.34 0.95 1.16 -
NPL Ratio of Bills Finance Subsidiary ( % ) 0.00 0.00 0.09 0.38 0.51 -
Average Operating Revenue Per Employee of the Group 6,063 5,399 5,003 5,443 3,563 -
Average Profit Per Employee 2,548 2,087 1,805 1,681 30 -
Profitability
Return on Assets ( % ) 9.23 7.86 6.86 6.82 0.28 2.57
Return on Equity ( % ) 10.34 8.76 7.62 7.68 0.16 2.89
Net Income Margin ( % ) 94.77 96.08 93.67 94.22 32.44 96.77
Earnings Per Share ( NT$ ) 1.88 1.54 1.34 1.30 0.03 0.54
Financial Structure ( % )
Ratio of Liabilities to Assets 12.02 11.79 11.80 12.82 14.28 11.86
Ratio of Liabilities to Net Worth 13.66 13.37 13.38 14.71 16.66 13.45
FHC’s Double Leverage Ratio 112.85 110.51 110.50 111.09 112.96 112.71
Leverage Ratio ( % )
Operating Leverage Ratio 1.00 0.99 1.00 1.00 1.07 1.00
FHC’s Financial Leverage Ratio 1.02 1.02 1.03 1.04 3.39 1.01
Growth Rates ( % )
Growth Rate of Assets 5.64 0.99 1.48 8.40 ( 5.57) 4.71
Growth Rate of Profit 24.46 15.57 6.49 8,297.87 ( 98.98) ( 8.02)
Cash Flow ( % )
Cash Flow Ratio 478.13 1,007.27 581.84 215.68 492.77 -
Cash Flow Adequacy Ratio 112.29 100.60 91.62 79.92 78.22 -
Cash Flow For Operating to Cash Flow From Investing NA NA NA 173.42 NA -
Operating Scale ( % )
Market Share of Assets 9.26 9.63 10.48 10.72 11.57 -
Market Share of Net Worth 9.20 9.64 10.61 10.79 11.50 -
Market Share of Deposits of Bank Subsidiary 5.41 5.22 5.33 5.36 5.09 -
Market Share of Loans of Bank Subsidiary 6.17 6.21 6.16 6.32 6.49 -
Capital of Adequacy Ratio ( % )
Mega International Commercial Bank 11.77 11.56 11.26 11.73 11.20 -
Mega Securities Co., Ltd. 527.70 550.96 364.29 314.34 292.77 -
Mega Bills Finance Co., Ltd. 13.49 14.48 16.22 16.88 14.09 -
Chung Kuo Insurance Co., Ltd. 496.83 560.29 570.01 661.61 584.88 -
Group Capital Adequacy Ratio 125.23 125.55 122.94 126.13 117.96 -
Analysis of financial ratio change in the last two years: 1. Due to write-off of bad debts, NPL ratio of Mega International Commercial Bank declined by 29.17%.2. As the net income after tax increased, the Group's average profit per employee rose by 22.09%.3. The growth rate of assets rose by 469.70% mainly due to growth in equity investments accounted for by the equity method. The growth
rate of profit increased by 57.10% owing to increase of investment income from equity investments accounted for by the equity method. 4. The cash flow ratio slipped by 52.53% in 2012 thanks to increase in payables.

Financial Information
772012 ANNUAL REPORT
Formulas of the above financial analysis are as follows:
1. Operating Ability (1) Total Assets Turnover = Net Revenue / Total Assets(2) Loans to Deposits Ratio of Bank Subsidiary = Total Loans Outstanding of Bank Subsidiary / Total Deposits Outstanding of Bank
Subsidiary(3) NPL Ratio of Bank Subsidiary = Non-Performing Loans of Bank Subsidiary / Total Loans Outstanding of Bank Subsidiary(4) Average Operating Revenue Per Employee of the Group = Net Revenue ( Revenue ) / Total Number of Group’s Employee(5) Average Profit Per Employee of the Group = Net Income / Total Number of the Group’s Employee
2. Profitability (1) Return on Assets = [ Net Income + Interest Expense × ( 1- Tax Rate ) ] / Average Total Assets(2) Return on Equity = Net Income / Average Shareholders’ Equity(3) Net Income Margin = Net Income / Net Revenue(4) Earnings Per Share = ( Net Income - Preferred Stock Dividend ) / Weighted Average Number of Shares Outstanding
3. Financial Structure (1) Ratio of Liabilities to Assets = Total Liabilities / Total Assets(2) Ratio of Liabilities to Net Worth = Total Liabilities / Total Shareholders’ Equity(3) Financial Holding Company’s Double Leverage Ratio = Equity Investment Made Under Paragraph 2 of Article 36 and Article 37 of
Financial Holding Company Act / New Worth
4. Leverage(1) Operating Leverage Ratio = ( Net Sales - Variable Cost ) / Net Income Before Tax(2) Financial Leverage Ratio = ( Income before Tax + Interest Expense ) / Net Income Before Tax
5. Growth Rates(1) Growth Rate of Assets = ( Total Assets - Total Assets of Previous Year ) / Total Assets of Previous Year(2) Growth Rate of Profit = ( Net Income Before Tax - Net Income Before Tax of Previous Year) / Net Income Before Tax of Previous
Year
6. Cash Flow(1) Cash Flow Ratio = Net Cash Provided by Operating Activities / ( Due to Other Banks and Overdrafts + Commercial Paper Payable
+ Financial Liabilities at Fair Value Through Profit or Loss + Bills and Bonds Sold Under Repurchase Agreements + Payables with Maturity within One Year )
(2) Cash Flow Adequacy Ratio = Five-Year Sum of Cash from Operations / Five-Year Sum of Capital Expenditures and Cash Dividend(3) Cash Flow for Operating to Cash Flow from Investing = Net Cash Provided by Operating Activities / Net Cash Provided by
Investing Activities
7. Operating Scale (1) Market Share of Assets = Total Assets / Total Assets of All Financial Holding Companies(2) Market Share of New Worth = New Worth / Total Net Worth of All Financial Holding Companies(3) Market Share of Deposits of Bank Subsidiary = Total Deposits Outstanding / Total Deposits of All Financial Institutions (4) Market Share of Loans of Bank Subsidiary = Total Loans Outstanding / Total Loans of All Financial Institutions
8. BIS Ratio(1) Subsidiary’s Capital Adequacy Ratio = Capital Base / Risk Weighted Assets(2) Group Capital Adequacy Ratio = Group’s Net Eligible Capital / Group’s Statutory Capital Requirement

78
Financial Information
Financial Information
OUR VISION—being your best financial service partner
6.3 Consolidated Financial Statements
Report of Independent AccountantsTo the Board of Directors and Stockholders
Mega Financial Holding Co., Ltd.
We have audited the accompanying consolidated balance sheets of Mega Financial Holding Co., Ltd. and its subsidiaries as of
December 31, 2012 and 2011, and the related consolidated statements of income, of changes in stockholders’ equity and of cash
flows for the years then ended. These consolidated financial statements are the responsibility of the Company’s management. Our
responsibility is to express an opinion on these consolidated financial statements based on our audits.
We conducted our audits in accordance with the “Rules Governing the Audit of Financial Statements of Financial Institutions
by Certified Public Accountants” and generally accepted auditing standards in the Republic of China. Those standards require
that we plan and perform the audit to obtain reasonable assurance about whether the financial statements are free of material
misstatement. An audit includes examining, on a test basis, evidence supporting the amounts and disclosures in the financial
statements. An audit also includes assessing the accounting principles used and significant estimates made by management, as well
as evaluating the overall financial statement presentation. We believe that our audits provide a reasonable basis for our opinion.
In our opinion, the consolidated financial statements referred to above present fairly, in all material respects, the financial
position of Mega Financial Holding Co., Ltd. and its subsidiaries as of December 31, 2012 and 2011, and the results of their
operations and their cash flows for the years then ended in conformity with the “Regulations Governing the Preparation of
Financial Reports by Financial Holding Companies”, “Regulations Governing the Preparation of Financial Reports by Public
Banks”, “Regulations Governing the Preparation of Financial Reports by Public Held Bills Finance Companies”, “Regulations
Governing the Preparation of Financial Reports by Securities Firms”, “Regulations Governing the Preparation of Financial Reports
by Futures Commission Merchants”, “Regulations Governing the Preparation of Financial Reports by Enterprises Engaging in
Insurance”, “Regulations Governing the Preparation of Financial Reports by Securities Issuers” and generally accepted accounting
principles in the Republic of China.
The Company’s financial statements as of and for the year ended December 31, 2012 expressed in US dollars were translated
from the New Taiwan dollar financial statements using the exchange rate of US$1:NT$29.035 at December 31, 2012 solely for
the convenience of the readers. This basis of translation is not in accordance with generally accepted accounting principles in the
Republic of China.
March 27, 2013-------------------------------------------------------------------------------------------------------
The accompanying consolidated financial statements are not intended to present the financial position and results of operations and cash flows in accordance with accounting principles generally accepted in countries and jurisdictions other than the Republic of China. The standards, procedures and practices in the Republic of China governing the review of such consolidated financial statements may differ from those generally accepted in countries and jurisdictions other than the Republic of China. Accordingly, the accompanying consolidated financial statements and review report of independent accountants are not intended for use by those who are not informed about the accounting principles or auditing standards generally accepted in the Republic of China, and their applications in practice.

Financial Information
792012 ANNUAL REPORT
MEGA FINANCIAL HOLDING CO., LTD. AND ITS SUBSIDIARIES CONSOLIDATED BALANCE SHEETSDECEMBER 31, 2012 AND 2011( Expressed in Thousands of Dollars )
December 31, 2012 December 31, 2011ASSETS NT$ US$ (Unaudited-Note 2) NT$
Cash and cash equivalents (Notes 4 (1) and 5) $ 313,462,564 $ 10,796,024 $ 322,992,872
Due from the Central Bank and call loans to banks (Notes 4 (2) and 5) 150,956,137 5,199,109 180,399,521
Financial assets at fair value through profit or loss (Notes 4 (3) and 6) 184,569,250 6,356,785 188,869,552
Bills and bonds purchased under resale agreements 2,282,053 78,597 1,460,685
Receivables, net (Notes 4 (4), (6) and 6) 125,593,058 4,325,575 107,160,487
Bills discounted and loans, net (Notes 4 (5), (6) and 5) 1,502,490,860 51,747,576 1,462,054,154
Available-for-sale financial assets, net (Notes 4 (7) and 6) 220,625,591 7,598,608 161,432,963
Held-to-maturity financial assets, net (Notes 4 (8) and 6) 160,776,041 5,537,318 131,290,215
Equity investments accounted for by the equity method, net (Note 4 (9)) 2,667,896 91,885 2,548,394
Other financial assets, net (Notes 4 (10) and 6) 21,884,597 753,732 22,873,366
Real estate investments, net (Note 6) 333,229 11,477 480,452
Property and equipment, net (Notes 4 (11) and 6) 22,705,148 781,992 21,416,577
Intangible assets, net 312,225 10,753 297,150
Other assets, net (Notes 4 (12), (31), 5 and 6) 17,290,046 595,490 15,125,547
TOTAL ASSETS $ 2,725,948,695 $ 93,884,921 $ 2,618,401,935
The accompanying notes are an integral part of these consolidated financial statements.

80
Financial Information
Financial Information
OUR VISION—being your best financial service partner
December 31, 2012 December 31, 2011LIABILITIES AND STOCKHOLDERS’ EQUITY NT$ US$ (Unaudited-Note 2) NT$
Due to the Central Bank and financial institutions (Notes 4 (13) and 5) $ 358,982,635 $ 12,363,790 $ 367,548,678
Funds borrowed from the Central Bank and other banks (Note 4 (14)) 60,548,901 2,085,376 71,873,400
Commercial paper payable, net (Notes 4 (15) and 5) 1,880,597 64,770 1,749,387
Financial liabilities at fair value through profit or loss (Note 4 (16)) 14,676,886 505,489 21,312,632
Bills and bonds sold under repurchase agreements (Notes 4 (3), (7) and (17)) 187,481,840 6,457,098 199,581,332
Payables (Notes 4 (18), (31) and 5) 61,109,417 2,104,681 58,514,085
Deposits and remittances (Notes 4 (19) and 5) 1,718,208,745 59,177,157 1,588,560,967
Bonds payable (Note 4 (20)) 62,449,668 2,150,841 61,401,059
Other loans (Notes 4 (21) and 6) 6,541,000 225,280 5,429,400
Accrued pension liability (Note 4 (22)) 3,327,664 114,609 2,069,310
Reserve for operations and liabilities (Note 4 (23))
Reserve for insurance 8,270,155 284,834 8,532,270
Other reserves 6,611,967 227,724 5,078,198
Other financial liabilities (Note 4 (24)) 9,832,957 338,659 12,620,054
Other liabilities (Notes 4 (11) and (25)) 11,941,579 411,282 10,952,437
Total Liabilities 2,511,864,011 86,511,590 2,415,223,209
Stockholders' Equity
Capital stock
Common stock ( Note 4 ( 26 ) ) 114,498,240 3,943,456 112,806,148
Capital surplus ( Note 4 ( 27 ) ) 43,425,270 1,495,618 43,426,403
Retained earnings ( Note 4 ( 28 ) )
Legal reserve 20,066,890 691,128 18,298,900
Special reserve 833,091 28,693 833,091
Unappropriated retained earnings 31,312,668 1,078,446 22,828,132
Equity adjustments
Unrealized revaluation increment 3,324,517 114,500 2,206,808
Cumulative translation adjustments 563,235 19,398 1,505,518
Unrealized gains or losses on financial instruments 1,051,731 36,223 1,033,669
Net loss on unrecognized pension cost ( 1,290,739 ) ( 44,456 ) ( 57,283 )
Minority interest 299,781 10,325 297,340
Total Stockholders’ Equity 214,084,684 7,373,331 203,178,726
Commitments and Contingent Liabilities ( Note 7 )
Significant Subsequent Events ( Note 9 )
TOTAL LIABILITIES AND STOCKHOLDERS’ EQUITY $ 2,725,948,695 $ 93,884,921 $ 2,618,401,935
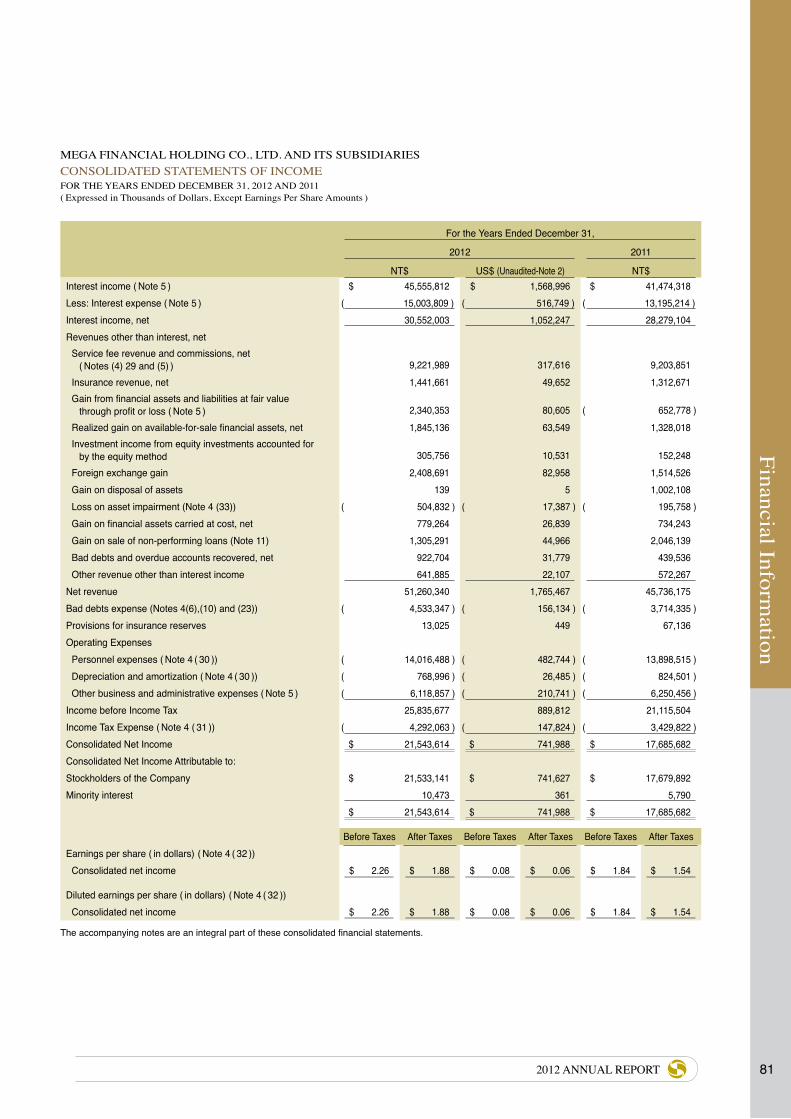
Financial Information
812012 ANNUAL REPORT
MEGA FINANCIAL HOLDING CO., LTD. AND ITS SUBSIDIARIESCONSOLIDATED STATEMENTS OF INCOMEFOR THE YEARS ENDED DECEMBER 31, 2012 AND 2011( Expressed in Thousands of Dollars, Except Earnings Per Share Amounts )
For the Years Ended December 31,
2012 2011
NT$ US$ (Unaudited-Note 2) NT$Interest income ( Note 5 ) $ 45,555,812 $ 1,568,996 $ 41,474,318Less: Interest expense ( Note 5 ) ( 15,003,809 ) ( 516,749 ) ( 13,195,214 )Interest income, net 30,552,003 1,052,247 28,279,104Revenues other than interest, net
Service fee revenue and commissions, net ( Notes (4) 29 and (5) ) 9,221,989 317,616 9,203,851
Insurance revenue, net 1,441,661 49,652 1,312,671Gain from financial assets and liabilities at fair value
through profit or loss ( Note 5 ) 2,340,353 80,605 ( 652,778 )Realized gain on available-for-sale financial assets, net 1,845,136 63,549 1,328,018Investment income from equity investments accounted for
by the equity method 305,756 10,531 152,248Foreign exchange gain 2,408,691 82,958 1,514,526Gain on disposal of assets 139 5 1,002,108Loss on asset impairment (Note 4 (33)) ( 504,832 ) ( 17,387 ) ( 195,758 )Gain on financial assets carried at cost, net 779,264 26,839 734,243Gain on sale of non-performing loans (Note 11) 1,305,291 44,966 2,046,139Bad debts and overdue accounts recovered, net 922,704 31,779 439,536Other revenue other than interest income 641,885 22,107 572,267
Net revenue 51,260,340 1,765,467 45,736,175Bad debts expense (Notes 4(6),(10) and (23)) ( 4,533,347 ) ( 156,134 ) ( 3,714,335 )Provisions for insurance reserves 13,025 449 67,136Operating Expenses
Personnel expenses ( Note 4 ( 30 )) ( 14,016,488 ) ( 482,744 ) ( 13,898,515 )Depreciation and amortization ( Note 4 ( 30 )) ( 768,996 ) ( 26,485 ) ( 824,501 )Other business and administrative expenses ( Note 5 ) ( 6,118,857 ) ( 210,741 ) ( 6,250,456 )
Income before Income Tax 25,835,677 889,812 21,115,504Income Tax Expense ( Note 4 ( 31 )) ( 4,292,063 ) ( 147,824 ) ( 3,429,822 )Consolidated Net Income $ 21,543,614 $ 741,988 $ 17,685,682Consolidated Net Income Attributable to:Stockholders of the Company $ 21,533,141 $ 741,627 $ 17,679,892Minority interest 10,473 361 5,790
$ 21,543,614 $ 741,988 $ 17,685,682
Before Taxes After Taxes Before Taxes After Taxes Before Taxes After TaxesEarnings per share ( in dollars) ( Note 4 ( 32 ))
Consolidated net income $ 2.26 $ 1.88 $ 0.08 $ 0.06 $ 1.84 $ 1.54
Diluted earnings per share ( in dollars) ( Note 4 ( 32 )) Consolidated net income $ 2.26 $ 1.88 $ 0.08 $ 0.06 $ 1.84 $ 1.54
The accompanying notes are an integral part of these consolidated financial statements.

82
Financial Information
Financial Information
OUR VISION—being your best financial service partner
MEGA FINANCIAL HOLDING CO., LTD. AND ITS SUBSIDIARIES CONSOLIDATED STATEMENTS OF CHANGES IN STOCKHOLDERS’ EQUITYFOR THE YEARS ENDED DECEMBER 31, 2012 AND 2011
Retained Earnings UnrealizedRevaluationIncrements
Cumulative Translation
Adjustments
UnrealizedGains or Losses on
Financial Instruments
Net Loss onUnrecognizedPension Cost
MinorityInterest Total
CommonStock
CapitalSurplus
LegalReserve
SpecialReserve
UnappropriatedRetained Earnings
For the year ended December 31, 2011 (Expressed in Thousands of New Taiwan Dollars )Balance, January 1, 2011 $ 110,594,262 $ 43,426,403 $ 16,787,828 $ 354,967 $ 18,824,681 $ 2,319,945 $ 829,397 $ 7,733,637 $ - $ 369,606 $ 201,240,726 Earnings distribution for 2010 (Note)
Legal reserve - - 1,511,072 - ( 1,511,072 ) - - - - - -Cash dividends - - - - ( 9,953,483 ) - - - - - ( 9,953,483 )Stock dividends 2,211,886 - - - ( 2,211,886 ) - - - - - -
Adjustments in other stockholders’ equity arising from long-term equity investments Changes in unrealized gains or losses on available-for-sale financial assets - - - - - - - ( 4,831,835 ) - - ( 4,831,835 ) Changes in cumulative translation adjustments - - - - - - 676,121 - - - 676,121
Default loss reserve transferred as special reserve - - - 195,344 - - - - - - 195,344Trading loss reserve transferred as special reserve - - - 282,780 - - - - - - 282,780Changes in asset revaluation increments - - - - - ( 113,137 ) - - - - ( 113,137 )Net loss on unrecognized pension cost - - - - - - - - ( 57,283 ) - ( 57,283 )Consolidated net income for the year ended December 31, 2011 - - - - 17,679,892 - - - - 5,790 17,685,682 Changes in unrealized gains or losses on available-for-sale financial assets - - - - - - - ( 1,868,133 ) - - ( 1,868,133 )Changes in minority interest - - - - - - - - - ( 78,056 ) ( 78,056 )Balance, December 31, 2011 $ 112,806,148 $ 43,426,403 $ 18,298,900 $ 833,091 $ 22,828,132 $ 2,206,808 $ 1,505,518 $ 1,033,669 ( $ 57,283 ) $ 297,340 203,178,726
For the year ended December 31, 2012 (Expressed in Thousands of New Taiwan Dollars )Balance, January 1, 2012 $ 112,806,148 $ 43,426,403 $ 18,298,900 $ 833,091 $ 22,828,132 $ 2,206,808 $ 1,505,518 $ 1,033,669 ( $ 57,283 ) $ 297,340 $ 203,178,726 Earnings distribution for 2011 (Note)
Legal reserve - - 1,767,990 - ( 1,767,990 ) - - - - - -Cash dividends - - - - ( 9,588,523 ) - - - - - ( 9,588,523 )Stock dividends 1,692,092 - - - ( 1,692,092 ) - - - - - -
Adjustments in other stockholders’ equity arising from long-term equity investments Changes in unrealized gains or losses on available-for-sale financial assets - - - - - - - 154,087 - - 154,087 Adjustments in other stockholders’ equity - ( 1,133 ) - - - - - - - - ( 1,133 ) Changes in cumulative translation adjustments - - - - - - ( 942,283 ) - - - ( 942,283 )
Changes in asset revaluation increments - - - - - 1,117,709 - - - - 1,117,709 Net loss on unrecognized pension cost - - - - - - - - ( 1,233,456 ) - ( 1,233,456 )Consolidated net income for the year ended December 31, 2012 - - - - 21,533,141 - - - - 10,473 21,543,614 Changes in unrealized gains or losses on available-for-sale financial assets - - - - - - - ( 136,025 ) - - ( 136,025 )Changes in minority interest - - - - - - - - - ( 8,032 ) ( 8,032 )Balance, December 31, 2012 $ 114,498,240 $ 43,425,270 $ 20,066,890 $ 833,091 $ 31,312,668 $ 3,324,517 $ 563,235 $ 1,051,731 ( $ 1,290,739 ) $ 299,781 214,084,684
For the year ended December 31, 2011 (Expressed in Thousands of US Dollars )Balance, January 1, 2012 $ 3,885,178 $ 1,495,657 $ 630,236 $ 28,693 $ 786,228 $ 76,005 $ 51,852 $ 35,601 ( $ 1,973 ) $ 10,240 $ 6,997,717Earnings distribution for 2011 (Note)
Legal reserve - - 60,892 - ( 60,892 ) - - - - - -Cash dividends - - - - ( 330,239 ) - - - - - ( 330,239 )Stock dividends 58,278 - - - ( 58,278 ) - - - - - -
Adjustments in other stockholders’ equity arising from long-term equity investments Changes in unrealized gains or losses on available-for-sale financial assets - - - - - - - 5,307 - - 5,307 Adjustments in other stockholders’ equity - ( 39 ) - - - - - - - - ( 39 ) Changes in cumulative translation adjustments - - - - - - ( 32,453 ) - - - ( 32,453 )
Changes in asset revaluation increments - - - - - 38,495 - - - - 38,495Net loss on unrecognized pension cost - - - - - - - - ( 42,483 ) - ( 42,783 )Consolidated net income for the year ended December 31, 2012 - - - - 741,627 - - - - 361 741,988 Changes in unrealized gains or losses on available-for-sale financial assets - - - - - - - ( 4,685 ) - - ( 4,685 )Changes in minority interest - - - - - - - - - ( 276 ) ( 276 )Balance, December 31, 2012 $ 3,943,456 $ 1,495,618 $ 691,128 $ 28,693 $ 1,078,446 $ 114,500 $ 19,398 $ 36,223 ( $ 44,456 ) $ 10,325 7,373,331
Note : Remunerations to directors and supervisors amounting to US$2,342 and US$2,740 thousand and employee bonuses amounting to US$375 and US$351 thousand for 2010 and 2011, respectively, have been deducted from the statement of incom.
The accompanying notes are an integral part of these consolidated financial statements.

Financial Information
832012 ANNUAL REPORT
MEGA FINANCIAL HOLDING CO., LTD. AND ITS SUBSIDIARIES CONSOLIDATED STATEMENTS OF CHANGES IN STOCKHOLDERS’ EQUITYFOR THE YEARS ENDED DECEMBER 31, 2012 AND 2011
Retained Earnings UnrealizedRevaluationIncrements
Cumulative Translation
Adjustments
UnrealizedGains or Losses on
Financial Instruments
Net Loss onUnrecognizedPension Cost
MinorityInterest Total
CommonStock
CapitalSurplus
LegalReserve
SpecialReserve
UnappropriatedRetained Earnings
For the year ended December 31, 2011 (Expressed in Thousands of New Taiwan Dollars )Balance, January 1, 2011 $ 110,594,262 $ 43,426,403 $ 16,787,828 $ 354,967 $ 18,824,681 $ 2,319,945 $ 829,397 $ 7,733,637 $ - $ 369,606 $ 201,240,726 Earnings distribution for 2010 (Note)
Legal reserve - - 1,511,072 - ( 1,511,072 ) - - - - - -Cash dividends - - - - ( 9,953,483 ) - - - - - ( 9,953,483 )Stock dividends 2,211,886 - - - ( 2,211,886 ) - - - - - -
Adjustments in other stockholders’ equity arising from long-term equity investments Changes in unrealized gains or losses on available-for-sale financial assets - - - - - - - ( 4,831,835 ) - - ( 4,831,835 ) Changes in cumulative translation adjustments - - - - - - 676,121 - - - 676,121
Default loss reserve transferred as special reserve - - - 195,344 - - - - - - 195,344Trading loss reserve transferred as special reserve - - - 282,780 - - - - - - 282,780Changes in asset revaluation increments - - - - - ( 113,137 ) - - - - ( 113,137 )Net loss on unrecognized pension cost - - - - - - - - ( 57,283 ) - ( 57,283 )Consolidated net income for the year ended December 31, 2011 - - - - 17,679,892 - - - - 5,790 17,685,682 Changes in unrealized gains or losses on available-for-sale financial assets - - - - - - - ( 1,868,133 ) - - ( 1,868,133 )Changes in minority interest - - - - - - - - - ( 78,056 ) ( 78,056 )Balance, December 31, 2011 $ 112,806,148 $ 43,426,403 $ 18,298,900 $ 833,091 $ 22,828,132 $ 2,206,808 $ 1,505,518 $ 1,033,669 ( $ 57,283 ) $ 297,340 203,178,726
For the year ended December 31, 2012 (Expressed in Thousands of New Taiwan Dollars )Balance, January 1, 2012 $ 112,806,148 $ 43,426,403 $ 18,298,900 $ 833,091 $ 22,828,132 $ 2,206,808 $ 1,505,518 $ 1,033,669 ( $ 57,283 ) $ 297,340 $ 203,178,726 Earnings distribution for 2011 (Note)
Legal reserve - - 1,767,990 - ( 1,767,990 ) - - - - - -Cash dividends - - - - ( 9,588,523 ) - - - - - ( 9,588,523 )Stock dividends 1,692,092 - - - ( 1,692,092 ) - - - - - -
Adjustments in other stockholders’ equity arising from long-term equity investments Changes in unrealized gains or losses on available-for-sale financial assets - - - - - - - 154,087 - - 154,087 Adjustments in other stockholders’ equity - ( 1,133 ) - - - - - - - - ( 1,133 ) Changes in cumulative translation adjustments - - - - - - ( 942,283 ) - - - ( 942,283 )
Changes in asset revaluation increments - - - - - 1,117,709 - - - - 1,117,709 Net loss on unrecognized pension cost - - - - - - - - ( 1,233,456 ) - ( 1,233,456 )Consolidated net income for the year ended December 31, 2012 - - - - 21,533,141 - - - - 10,473 21,543,614 Changes in unrealized gains or losses on available-for-sale financial assets - - - - - - - ( 136,025 ) - - ( 136,025 )Changes in minority interest - - - - - - - - - ( 8,032 ) ( 8,032 )Balance, December 31, 2012 $ 114,498,240 $ 43,425,270 $ 20,066,890 $ 833,091 $ 31,312,668 $ 3,324,517 $ 563,235 $ 1,051,731 ( $ 1,290,739 ) $ 299,781 214,084,684
For the year ended December 31, 2011 (Expressed in Thousands of US Dollars )Balance, January 1, 2012 $ 3,885,178 $ 1,495,657 $ 630,236 $ 28,693 $ 786,228 $ 76,005 $ 51,852 $ 35,601 ( $ 1,973 ) $ 10,240 $ 6,997,717Earnings distribution for 2011 (Note)
Legal reserve - - 60,892 - ( 60,892 ) - - - - - -Cash dividends - - - - ( 330,239 ) - - - - - ( 330,239 )Stock dividends 58,278 - - - ( 58,278 ) - - - - - -
Adjustments in other stockholders’ equity arising from long-term equity investments Changes in unrealized gains or losses on available-for-sale financial assets - - - - - - - 5,307 - - 5,307 Adjustments in other stockholders’ equity - ( 39 ) - - - - - - - - ( 39 ) Changes in cumulative translation adjustments - - - - - - ( 32,453 ) - - - ( 32,453 )
Changes in asset revaluation increments - - - - - 38,495 - - - - 38,495Net loss on unrecognized pension cost - - - - - - - - ( 42,483 ) - ( 42,783 )Consolidated net income for the year ended December 31, 2012 - - - - 741,627 - - - - 361 741,988 Changes in unrealized gains or losses on available-for-sale financial assets - - - - - - - ( 4,685 ) - - ( 4,685 )Changes in minority interest - - - - - - - - - ( 276 ) ( 276 )Balance, December 31, 2012 $ 3,943,456 $ 1,495,618 $ 691,128 $ 28,693 $ 1,078,446 $ 114,500 $ 19,398 $ 36,223 ( $ 44,456 ) $ 10,325 7,373,331

84
Financial Information
Financial Information
OUR VISION—being your best financial service partner
MEGA FINANCIAL HOLDING CO., LTD. AND ITS SUBSIDIARIESCONSOLIDATED STATEMENTS OF CASH FLOWSFOR THE YEARS ENDED DECEMBER 31, 2012 AND 2011( Expressed in Thousands of Dollars )
For the Years Ended December 31,
2012 2011
NT$US$
(Unaudited-Note 2) NT$Cash Flows from Operating ActivitiesConsolidated net income attributable to stockholders of the company $ 21,533,141 $ 741,627 $ 17,679,892Consolidated net income attributable to minority interest 10,473 361 5,790Adjustments to reconcile consolidated net income to net cash (used in) provided by operating
activities:Bad debts expense 4,533,347 156,134 3,714,335Investment income from equity investments accounted for by the equity method ( 305,756 ) ( 10,530 ) ( 152,248 )Cash dividends distributed by equity investments accounted for by the equity method 138,465 4,769 136,306Valuation gain from financial assets and liabilities ( 1,180,352 ) ( 40,653 ) ( 911,730 )Gain from disposal of assets, net ( 139 ) ( 5 ) ( 1,002,108 )Loss on asset impairment 504,832 17,387 195,758Depreciation and amortization 768,996 26,485 824,501Loss on scrapped assets - - 509Reversal of insurance reserves ( 13,025 ) ( 448 ) ( 67,136 )Provisions for other reserves - - 1,509Exchangeable bond discounted amortization 48,609 1,674 22,859Changes in assets and liabilities:
Decrease (increase) in financial assets at fair value through profit or loss 5,480,654 188,760 ( 25,637,639 )(Increase) decrease in bills and bonds purchased under resale agreements ( 821,368 ) ( 28,289 ) 323,006(Increase) decrease in receivables ( 18,454,818 ) ( 635,606 ) 39,702,243Decrease (increase) in other financial assets 344,621 11,869 ( 100,073 )Net change in deferred income tax assets/liabilities ( 319,840 ) ( 11,016 ) 201,029Increase in other assets ( 1,679,620 ) ( 57,848 ) ( 3,230,655 )Decrease in financial liabilities at fair value through profit or loss ( 6,635,746 ) ( 228,543 ) ( 8,707,289 )(Decrease) increase in bills and bonds sold under repurchase agreements ( 12,099,492 ) ( 416,721 ) 17,764,652Increase (decrease) in payables 2,595,332 89,386 ( 12,898,788 )Increase in accrued pension liability 24,898 858 263,751(Decrease) increase in other financial liabilities ( 2,787,097 ) ( 95,991 ) 5,262,355Increase in other liabilities 819,864 28,237 2,132,674 Net cash (used in) provided by operating activities ( 7,494,021 ) ( 258,103 ) 35,523,503
Cash Flows from Investing ActivitiesDecrease (increase) in due from the Central Bank and call loans to banks 29,443,384 1,014,065 ( 53,951,507 )Increase in bills discounted and loans ( 43,863,781 ) ( 1,510,721 ) ( 128,325,506 )Decrease in financial instruments carried at cost 588,956 20,284 74,835(Increase) decrease in available-for-sale financial assets ( 59,741,544 ) ( 2,057,570 ) 16,856,533(Increase) decrease in held-to-maturity financial assets ( 29,485,826 ) ( 1,015,527 ) 86,549,657Proceeds from capital reduction of equity investments accounted for by the equity method 58,064 2,000 26,880Proceeds from disposal of property and equipment 4,237 146 1,107,197Acquisition of property and equipment ( 501,037 ) ( 17,256 ) ( 728,928 )Acquisition of intangible assets ( 52,752 ) ( 1,817 ) ( 88,966 )
Net cash used in investing activities ( 103,550,299 ) ( 3,566,396 ) ( 78,479,805 )
Cash Flows from Financing ActivitiesPayments of cash dividends ( 9,588,523 ) ( 330,240 ) ( 9,953,483 )(Decrease) increase in due to the Central Bank and financial institutions ( 8,566,043 ) ( 295,025 ) 44,844,513(Decrease) increase in funds borrowed from the Central Bank and financial institutions ( 11,324,499 ) ( 390,029 ) 33,304,760Increase (decrease) in commercial papers payable 131,210 4,519 ( 7,113,009 )Increase in deposits and remittances 129,647,778 4,465,224 29,987,828Increase in bonds payable 1,000,000 34,441 8,328,200Increase (decrease) in other loans 1,111,600 38,285 ( 5,738,600 )Increase (decrease) in minority interest 2,441 84 ( 72,266 )
Net cash provided by financing activities 102,413,964 3,527,259 93,587,943Effect of changes in foreign exchange rate ( 899,952 ) ( 30,995 ) 623,239Net (decrease) increase in cash and cash equivalents ( 9,530,308 ) ( 328,235 ) 51,254,880Cash and cash equivalents, beginning of year 322,992,872 11,124,259 271,737,992Cash and cash equivalents, end of year $ 313,462,564 $ 10,796,024 $ 322,992,872
Supplemental cash flow information:Interest paid $ 14,659,167 $ 504,879 $ 12,690,535Income tax paid $ 5,301,164 $ 182,578 $ 5,843,278
Non-cash Investing And Financing ActivitiesPayables - corporate bonds within 1 year of maturity $ 6,600,000 $ 227,312 $ 300,000
The accompanying notes are an integral part of these consolidated financial statements.

Financial Information
852012 ANNUAL REPORT
MEGA FINANCIAL HOLDING CO., LTD. AND ITS SUBSIDIARIESNOTES TO CONSOLIDATED FINANCIAL STATEMENTSDECEMBER 31, 2012 AND 2011( Expressed in Thousands of New Taiwan Dollars, Unless Otherwise Indicated )
1. ORGANIZATION AND OPERATIONS
CTB Financial Holding Co., Ltd. was formed by Chiao Tung Bank Co., Ltd. (“CTB”) and International Securities Co., Ltd. (“IS”) through a share swap on February 4, 2002 pursuant to the Financial Holding Company Act and other related laws. The Company’s shares have been publicly traded on the Taiwan Stock Exchange since February 4, 2002. On August 22, 2002, the Company further acquired Chung Hsing Bills Finance Corporation and Barits Securities Co., Ltd. (“BS”) (which later merged with IS on January 31, 2003, with IS being the surviving entity and was later renamed Barits International Securities Co., Ltd. (“BIS”) as one of the subsidiaries of the Company through a second share swap. On December 31, 2002, the Company also acquired 100% equity stock in both The International Commercial Bank of China (“ICBC”), an investee of the Company originally accounted for by the equity method with a 28% equity interest, and Chung Kuo Insurance Co., Ltd. (“CKI”) through a further share swap and changed its name from CTB Financial Holding Co., Ltd. to Mega Financial Holding Co., Ltd. (the “Company”). During the period from 2003 to 2005, the Company had made investments in Mega Asset Management Co., Ltd. (“MAM”), Mega Investment Trust Co., Ltd. (“MITC”), Mega Life Insurance Agency Co., Ltd. (“MLIAC”) and Mega CTB Venture Capital Co., Ltd. (“Mega CTB Venture Capital”). On May 23, 2006, International Investment Trust Co., Ltd. (“IIT”) was acquired by the Company and ICBC through cash injection of capital.
In order to expand the economic scale of its business operations, two of the Company’s subsidiaries, CTB and ICBC, entered into a merger agreement, effective from August 21, 2006, which is to be implemented by way of “absorption”, with CTB being the dissolving bank and ICBC, later renamed Mega International Commercial Bank Co., Ltd. being the surviving bank. In addition, IIT and MITC entered into a merger agreement, with MITC as the dissolving company and IIT simultaneously renamed Mega International Investment Trust Co., Ltd., being the surviving company, effective from September 17, 2007.
In coordination with the Mega Financial Holding’s group image as well as business development, all subsidiaries have been renamed as “Mega” in 2006. A comparison of the former company names and the new company names is as follows:
Former Company Names New Company Names
Barits International Securities Co., Ltd. Mega Securities Co., Ltd.
Chung Hsing Bills Finance Corporation Mega Bills Finance Co., Ltd.
International Commercial Bank of China Mega International Commercial Bank Co., Ltd.
Barits International Futures Co., Ltd. Mega Futures Co., Ltd.
Barits International Investment Services Corporation Mega International Investment Services Co., Ltd.
International Commercial Bank of Cathay (Canada) Mega International Commercial Bank Co., Ltd. (Canada)
International Commercial Bank Of China Public Co. Ltd.(Thailand) Mega International Commercial Bank Public Co., Ltd.
Barits Holdings Limited Mega Securities Holdings Co., Ltd.
Barits Ho Chong Securities Company Ltd. Mega Securities (Hong Kong) Co., Ltd.
Barits International Asset Management Corporation Mega International Asset Management Co., Ltd.
Barits Securities (Hong Kong) Ltd. Mega Capital (Asia) Co., Ltd.
Barits Global Asset Management Ltd. Mega Global Asset Management Co., Ltd.
CTB I Venture Capital Co., Ltd. Mega I Venture Capital Co., Ltd.
Mega CTB Venture Capital Co., Ltd. Mega Venture Capital Co., Ltd.
CTB Financial Management & Consulting Co., Ltd. Mega Management Consulting Corporation
The Company is mainly engaged in investment activities approved by the governing authorities and management of the investee companies. Background of the Company’s subsidiaries is summarized below :
( 1 ) CTB was established in Mainland China in 1907, five years before the founding of the Republic of China (ROC), and moved to ROC along with the central government of ROC in 1949. CTB resumed its operation in 1960 to continue its role of assisting the ROC government in implementing economic development programs. CTB’s shares were publicly traded on the Taiwan Stock Exchange since September 1996 and the bank completed its privatization process in September 1999. On February 4, 2002, CTB became a wholly- owned subsidiary

86
Financial Information
Financial Information
OUR VISION—being your best financial service partner
of the Company through share swap pursuant to the Financial Holding Company Act and was therefore delisted from the Taiwan Stock Exchange. As an industrial development bank, CTB is mainly engaged in extending medium- and long-term loans, equity and venture capital investments, international banking and trust related business. In line with the government’s economic policy and economic development programs, CTB also assists major industries in developing strategies for improving the industrial infrastructure and promotes industrial development of ROC. As of August 21, 2006, CTB merged with ICBC and was dissolved after the merger.
(2) Mega Securities Co., Ltd. (“MS”; formerly International Securities Co., Ltd.) was incorporated on October 19, 1989, and became a wholly-owned subsidiary of the Company on February 4, 2002 through a share swap agreement. On October 31, 2002, MS’ Board of Directors passed a resolution to merge with BS. On November 28, 2002, the merger was formally approved by the Securities and Futures Commission (“SFC”) with the effective merger date set on January 31, 2003. International Securities Co., Ltd. is the surviving company after the merger and is subsequently renamed as Barits International Securities Co., Ltd. (“BIS”). On January 30, 2003, BIS further acquired all operations and properties of Chung Hsing Securities Corporation. Principal activities of MS include underwriting, brokerage and proprietary trading of securities, margin trading of securities and bills, issuance of stock warrants, brokerage of overseas securities, and futures dealing business.
On March 2, 2009, the Board of Directors (acting on behalf of the stockholders) resolved to decrease its capital by $1,600,000 thousand to reduce its accumulated deficit, effective March 27, 2009. The reduction in capital had been approved by the competent authority on March 24, 2009. The related registration of the capital reduction has been completed.
(3) Mega Securities Holdings Co., Ltd. (“MHL”), registered in the British Virgin Islands, is 100% owned by MS with an investment amount of US$25,845 thousand. MHL is mainly involved in asset management and venture capital activities.
(4) Mega Futures Co., Ltd. (“MF”) is 100% owned by MS with an investment amount of $400,000 thousand. MF is mainly engaged in brokerage of domestic and foreign futures trading, proprietary trading of domestic futures contracts, and settlement and consulting services for domestic futures trading.
(5) Mega Securities (Hong Kong) Co., Ltd., registered in Hong Kong, is 100% owned by MHL with an investment amount of HK$60,000 thousand. Mega Securities (Hong Kong) Co., Ltd. is mainly engaged in brokerage of marketable securities.
(6) Mega International Asset Management Co., Ltd., registered in British Virgin Islands, is 100% owned by MHL with an investment amount of US$15,000 thousand. Mega International Asset Management is mainly engaged in investment consulting services. Starting from August 25, 2011, it has been dissolved by the approval of Mega Securities’ Board of Directors to simplify the investment structure and decrease operating cost. With the approval from competent authorities dated February 9, 2012, Mega International Asset Management Co., Ltd., ceased all operations and initiated the liquidation process which was acknowledged by the authorities in its registered place, British Virgin Islands on May 2, 2012.
(7) Mega Capital (Asia) Co., Ltd., registered in Hong Kong, is 100% owned by MHL with an investment amount of HK$80,000 thousand. Mega Capital (Asia) Co., Ltd. is mainly engaged in investment consulting services.
(8) Mega Global Asset Management Co., Ltd. registered in British Cayman Islands, is 100% owned by MHL with an investment amount of US$33,740 thousand. Mega Global Asset Management Ltd. is mainly engaged in asset management services.
(9) Mega Bills Finance Co., Ltd. (MBF), established on May 3, 1976, became a wholly-owned subsidiary of the Company through a share swap agreement on August 22, 2002 and was delisted from the Taiwan Stock Exchange. MBF is mainly engaged in proprietary trading, brokerage and underwriting of short-term notes and bills and financial bonds, provision of guarantees for short-term notes and bills, arrangement of inter-bank call loans, corporate financial consulting and proprietary trading of government bonds and corporate bonds.
(10) Mega International Commercial Bank Co., Ltd. (“MICB”) (formerly Bank of China), was restructured on December 17, 1971 in accordance with the Chinese commercial banking regulations (abolished in December 2005). Shares were originally traded on the Taiwan Stock Exchange. On December 31, 2002, ICBC MICB became a wholly-owned subsidiary of the Company through share swap and was delisted from the Taiwan Stock Exchange accordingly. The main operating activities consist of businesses in compliance with The Banking Act of the Republic of China, foreign exchange business, credit extension for import and export business and guarantees, other financial businesses related to international trade development, trust business and any other relevant business approved by central competent authorities. On August 21, 2006, it was merged with CTNBANK. In order to adjust the asset structure and further develop business, the subsidiary, MICB resolved to increase cash capital through private equity amounting to $3,000,000 thousand dollars under the resolution of stockholders on behalf of the Board of Directors on July 10, 2012 and issued 300,000 thousand common stocks scheduled to be acquired by the Company at par value of $23.97 dollars each share. The authorized and paid-in capital were both $71,000,000 thousand dollars after the capital increase. The cash capital increase has been approved to be effective by the former FSC with the effective date set on September 5, 2012. After the capital increase, MICB issued 7,100,000 thousand shares at par value of $10 per share amounting to $71,000,000 thousand dollars.
(11) Mega International Commercial Bank (Canada) (“MICB Canada”), a wholly-owned subsidiary of MICB, was established in Canada with a capital base of CAD$23,000 thousand. MICB Canada is mainly engaged in accepting deposits, extension of credits, negotiation of import/export bills, collections and foreign exchange related businesses.

Financial Information
872012 ANNUAL REPORT
(12) Yung Shing Industries Co. (“Yung Shing”) is 99.56% owned by MICB with an investment amount of $95,644 thousand. The principal activities of Yung Shing include agency services for industrial and mining related businesses, import and export related businesses, services requested by customers (e.g. data processing, packaging and printing), editing, binding and copying of documents, and credit card agency services.
(13) Cathay Investment & Development Corporation (Bahamas) (“CIDC Bahamas”), registered in the Commonwealth of the Bahamas, is 100% owned by MICB with an investment amount of US$5 thousand. CIDC Bahamas is mainly engaged in international investment and development activities.
(14) Mega International Commercial Bank Public Co., Ltd. (“MICBPC”), a wholly-owned subsidiary of MICB, was established in Thailand in March 2005 with a capital base of 4 billion Thai baht. MICBCPC is mainly engaged in accepting deposits, negotiation of import/export bills, collections and exchange of foreign currencies and extension of credits.
(15) Mega International Investment Trust Co., Ltd. (“MITC”) is a subsidiary of MICB, in which MICB’s equity interest increased to 59.13% for the six-month period ended June 30, 2005. On May 23, 2006 and September 20, 2006, the Company and MICB participated in cash injection of capital for IIT and in turn achieved an equity interest of 97.76% together. IIT is primarily engaged in investment trust related businesses. Former Mega Investment Trust Co., Ltd. (“MITC”) and International Investment Trust Co., Ltd. (“IIT”) entered into a merger agreement, with MITC as the dissolving company and IIT, simultaneously renamed “Mega International Investment Trust Co., Ltd.”, being the surviving company, effective from September 17, 2007. The equity interest then totaled to 96.31%. On November 26, 2008, MITC’s stockholders resolved to reduce its capital by $591,415 thousand to offset loss and increased its capital by issuing new shares amounting to $1,400,000 thousand to improve its financial structure which was resolved by the Board of Directors on December 17, 2008, and effective from December 23, 2008 and December 30, 2008, respectively. The Company purchased the residual fragmentary shares after the capital reduction. The Company’s total equity interest then totaled to 100%.
On February 20, 2009, the Board of Directors (acting on behalf of the stockholders) resolved to decrease its capital by $873,000 thousand to reduce its accumulated deficit, effective February 27, 2009. The ratio of capital reduction was 62.36%.
(16) Initially established by the Bank of China (predecessor of MICB) in November 1931, Chung Kuo Insurance Co., Ltd. (CKI) merged with the Insurance Department of the Central Trust of China, in February 1972 and became a direct investee company of the Ministry of Finance (MOF). CKI completed its privatization process on May 5, 1994 and became a wholly-owned subsidiary of the Company through share swap on December 31, 2002. CKI is primarily engaged in general insurance business.
(17) Mega Asset Management Co., Ltd. (“MAM”) was established by the Company on December 5, 2003 with a capital base of $2 billion. MAM is primarily engaged in purchases, evaluations, auctions, and management of financial institutions’ loan assets.
(18) Mega I Venture Capital Co., Ltd. (“Mega I Venture Capital”) (formerly CTB I Venture Capital Co., Ltd.) is 40% owned jointly by MICB, MS and CKI with a total investment amount of $240 million. Mega I Venture Capital is primarily engaged in venture capital activities. Although the Company’s equity interest in Mega I Venture Capital is less than 50%, Mega I Venture Capital is regarded as a subsidiary in which the Company has control due to the Company’s significant influence over its financial, operational and personnel policies.
(19) Mega Venture Capital Co., Ltd. (“Mega Venture Capital”) (formerly Mega CTB Venture Capital Co., Ltd.) was established by the Company on December 13, 2005 with an initial investment of $1 billion. Mega CTB Venture Capital is primarily engaged in venture capital investments as well as providing operational, managerial and consulting services.
(20) The number of employees of the Company and its subsidiaries was 8,455 and 8,474 as of December 31, 2012 and 2011, respectively.
2. SUMMARY OF SIGNIFICANT ACCOUNTING POLICIES
The accompanying consolidated financial statements of the Company and its subsidiaries (collectively referred herein as the Group) are prepared in conformity with the “Regulations Governing the Preparation of Financial Reports by Financial Holding Companies”, “Regulations Governing the Preparation of Financial Reports by Public Banks”, “Regulations Governing the Preparation of Financial Reports by Publicly Held Bills Finance Companies”, “Regulations Governing the Preparation of Financial Reports by Securities Firms”, “Regulations Governing the Preparation of Financial Reports by Futures Commission Merchants”, “Regulations Governing the Preparation of Financial Reports by Enterprises Engaging in Insurance”, “Regulations Governing the Preparation of Financial Reports by Securities Issuers” and accounting principles generally accepted in the Republic of China. The accounts on the accompanying consolidated financial statements are not categorized into current and non-current items. Nevertheless, accounts are properly categorized according to the nature of each accounts, and sequenced by their liquidity. The significant accounting policies of the Group are summarized below:

88
Financial Information
Financial Information
OUR VISION—being your best financial service partner
( 1 ) Basis for preparation of consolidated financial statements
A. Beginning January 1, 2005, pursuant to the revised Statement of Financial Accounting Standards (SFAS) No. 7, “Consolidated Financial Statements”, the Company is required to consolidate accounts of the investee companies of which the Company directly or indirectly holds more than 50% of the common stocks, unless the Company considers that the individual total assets or total operating revenue of investees are immaterial. Under the revised SFAS No.7, the prior year financial statements are not required to be restated retroactively.
For investee companies of which the Company holds more than 50% of voting shares (including the Company and its subsidiaries’ potential voting rights readily obtainable through execution and conversion) or which meet the requirements stipulated below, the Company is determined to have controlling interest over them and thus, a parent-subsidiary relationship is established. In this case, not only the equity method should be applied for the valuation of subsidiaries, but also the consolidated financial statements should be prepared.
( a ) Under the agreements entered into by the Company with other investors, the equivalent voting shares of the investee held by the Company exceed 50%.
(b) Under the applicable regulations or agreements, the Company can control the investee’s financial, operational and personnel policies.
(c) The Company has the right to employ or dismiss more than 50% of the members of the Board (or equivalent organization) in which the controlling power over the investee lies.
(d) The Company controls more than 50% of the voting rights in the investee’s Board (or equivalent organization) in which the controlling power over the investee lies.
(e) The Company has controlling power in other matters.
B. All significant inter-company transactions and the respective balances have been eliminated from the consolidated financial statements. Please refer to Note 11 (4) for details.
C. The names of the subsidiaries that are included in the consolidated financial statements and the percentage of Company’s ownership in each subsidiary are set forth below:
Ownership ( % )
Investor Subsidiary December 31, 2012 December 31, 2011The Company MS 100.00 100.00
MS MHL 100.00 100.00
MS MF 100.00 100.00
MHL Mega Securities (Hong Kong) Co., Ltd. 100.00 100.00
MHL Mega International Asset Management Co., Ltd. - 100.00
MHL Mega Capital (Asia) Co., Ltd. 100.00 100.00
MHL Mega Global Asset Management Co., Ltd. 100.00 100.00
The Company MBF 100.00 100.00
The Company MICB 100.00 100.00
MICB MICB Canada 100.00 100.00
MICB Yung Shing 99.56 99.56
MICB CIDC Bahamas 100.00 100.00
MICB MICBPC 100.00 100.00
The Company MITC 100.00 100.00
The Company CKI 100.00 100.00
The Company MAM 100.00 100.00
MICB, MS and CKI Mega I Venture Capital 40.00 40.00
The Company Mega Venture Capital 100.00 100.00
D. Changes in the subsidiaries that are included in the consolidated financial statements as of December 31, 2012 and 2011: None.

Financial Information
892012 ANNUAL REPORT
E. Details of the Company’s subsidiaries that are not included in the consolidated financial statements are set forth below:
Ownership ( % )
Subsidiary December 31, 2012 December 31, 2011 Business ScopeMega Life Insurance Agency Co., Ltd. 100.00 100.00 Insurance brokerageMega Management Consulting Corporation 100.00 100.00 Management consultingMega International Investment Services Co., Ltd. 100.00 100.00 Securities investment consultingCathay Investment & Warehousing Ltd. 100.00 100.00 Storage and warehousing of imported commoditiesChina Products Trading Company 68.27 68.27 Transportation and storage of farming products and by-
products, and investments in the related businessesRamlett Finance Holdings, Inc. 100.00 100.00 Real estate investmentsCathay Insurance Company Inc. (Philippines) - 86.46 General insuranceWin Card Co., Ltd. 100.00 100.00 Business managementICBC Assets Management & Consulting Co., Ltd. 100.00 100.00 Investment consulting
As the individual total assets or operating revenue amounts of the above subsidiaries are immaterial, the accounts of these subsidiaries are not included in the Company’s consolidated financial statements although the Company holds more than 50% equity interest in these subsidiaries.
F. The shares of CTB and IS held by the Company are accounted for in accordance with the rules stipulated by the Letter (90) Chi-Mi-Tze No. 182 of the Accounting Research and Development Foundation of the Republic of China (ARDF), which is summarized below:
Capital expenditure incurred by the Company to acquire equity interest in a financial institution through share swap is stated at the book value of the respective financial institution’s assets less the book value of its liabilities. The par value of the new shares issued is recorded as common stock, and the amount in excess of the par value is recorded as capital surplus.
As ICBC was the Company’s affiliate before joining the Company through share swap, its shares held by the Company are accounted for in accordance with the ARDF’s Letter (91) Chi-Mi-Tze No. 202, which is summarized below:
The Company’s equity investment in a financial institution is stated at the book value of the respective financial institution’s net assets. When the book value of the financial institution’s net assets exceeds the par value of the Company’s issued shares, the excess is recorded as capital surplus. Conversely, when the net assets’ book value is less than the par value of the Company’s issued shares, the difference is accounted for by issuing new shares at a discount.
G. CHBF, BS and CKI were acquired by the Company through a share swap agreement. The business combination of the three subsidiaries was accounted for by the pooling-of-interests method in accordance with the rule stipulated in the ARDF’s Letter (90) Chi-Mi-Tze No.079.
H. The merger of BIS and BS, in which BIS was the surviving entity, was accounted for in accordance with the rule stipulated in the ARDF’s Letter (91) Chi-Mi-Tze No.244. Under the rule, the book value of BIS’ long-term investments in BS was treated as the cost of the new shares issued for acquisition of BS.
I. Two of the 100% wholly-owned subsidiaries of the Company, ICBC and CTB, conducted a merger with ICBC being the acquiring firm and CTB being the targeted firm. ICBC was later renamed Mega International Commercial Bank. The merger of the two subsidiaries was in fact, an organizational restructuring implemented under mutual control of the group; therefore, neither the purchase method nor the pooling-of-interest method is appropriate. In pursuant to the rules stipulated in the ARDF’s Letter (91) Chi-Mi-Tze No. 243, the Company’s carrying value of long-term investments in CTB is recognized as the cost of issuing shares for acquiring ICBC. An assessment for impairment on the carrying value of long-term investment must be conducted and the impairment amount assessed should be recognized immediately as loss, if any.
J. Regarding MITC and IIT merger, wherein IIT became the surviving entity and renamed “Mega Investment Trust Co., Ltd.”, the related accounting treatments for the Company’s carrying value of long-term investments in MITC is recognized as the cost of issuing shares for acquiring IIT pursuant to the Explanatory Letter (91) Chi-Mi-Tze No. 244 of the ARDF.
K. If any financial institution which is originally one of the Company’s affiliated companies subsequently becomes the Company’s subsidiary through swap of all their outstanding shares, the new shares are issued at a discount when the book value of the respective financial institutions’ net assets is less than the par value of the Company’s issued shares. The cost of the swapped shares recorded by the respective financial institutions is based on the original book value of the swapped shares. The affiliated companies referred to above are defined as the financial institutions of which the Company holds more than 25% of the total voting shares or total capital, or in which the Company holds more than half of their directors’ seats, either appointed or elected directly or indirectly. For the accounting of financial institutions and financial holding corporations which were non-affiliated companies under the original condition, the accounting principle stipulated in the SFAS No. 25 “Business Combination-Accounting Treatment under Purchase Method” should be applied accordingly.
L. In accordance with Explanatory Note (96) No. 344, capital surplus originally included in subsidiaries’ stockholders’ equity and in which related to assets and liabilities were reclassified to an adjustment account in the stockholders’ equity when parent company recognized the

90
Financial Information
Financial Information
OUR VISION—being your best financial service partner
capital surplus due to share swap. In subsequent periods, when subsidiaries derecognize the asset and liability accounts, the Company also should derecognize the corresponding adjustment account in the stockholders’ equity.
( 2 ) Foreign-currency transactions and translations Foreign currency income and expenses are converted into functional currency at the prevailing exchange rates at the end of each month.
Foreign-currency denominated monetary financial assets or liabilities and other foreign-currency denominated assets or liabilities covered by SFAS No. 34 “Financial Instruments: Recognition and Measurement” and No. 36 “Financial Instruments: Disclosure and Presentation” are translated into functional currency at the prevailing exchange rates at the end of each month. The resulting translation differences are recognized as gain or loss in the current period. However, for translation gains or losses associated with cash flow hedges, foreign net investment hedges and equity investments accounted for by the equity method, cumulative translation adjustments under stockholders’ equity is recognized.
Non-monetary financial assets or liabilities regulated by SFAS No. 34 and No. 36 measured at fair value in foreign currency are translated using the prevailing rates at the end of each month. When a gain or loss on a non-monetary item is recognized directly in equity, any exchange component of that gain or loss shall be recognized directly in equity. Conversely, when a gain or loss on a non-monetary item is recognized in profit or loss, any exchange component of that gain or loss shall be recognized in profit or loss. However, non-monetary items that are measured on a historical cost basis are translated using the exchange rate at the date of the transaction.
( 3 ) Use of estimates In preparing the consolidated financial statements in conformity with generally accepted accounting principles in the R.O.C., the management
is required to make estimates and assumptions that affect the reported amounts of assets and liabilities and disclosures of contingent assets and liabilities as of the date of the consolidated financial statements, and the reported amounts of revenues, costs of revenues, and expenses during the reporting period. Therefore, actual results could differ from those estimates.
( 4 ) The principle of cash flow statement The cash flow statement is made on the basis of cash and cash equivalents.
( 5 ) Cash and cash equivalents Cash and cash equivalents include cash, unrestricted bank deposits, and short-term investments in highly liquid instruments, which can be
readily converted into cash without significant penalty and of which the values will not be significantly affected by fluctuations in the interest rates. The abovementioned short-term investments include treasury bills, negotiable certificates of deposit and bankers acceptances with maturity of three months or less.
( 6 ) Financial assets or liabilities at fair value through profit or lossA. Trade date accounting is applied for equity convertibles, beneficial certificate, derivative instruments and trades occurring before
government bond being issued. Settlement date accounting is applied for bonds (excluding trades occurring before government bond being issued). On the initial recognition, financial product is evaluated at fair value.
B. For financial assets or liabilities at fair value through profit or loss, its variable value is recognized in current profit or loss. Stocks of publicly listed entity are assessed by closing market price of balance sheet date in public market as fair value. Open-ended funds are assessed by net asset value of balance sheet date as fair value. Beneficiary certificate securities are assessed by future cash flow discounted value of balance sheet date or by the quoted price system of Bloomberg, Reuters or quoted market price from competitors as fair value. Fair value of bond investments are assessed by the most recent strike prices of Gre Tai Securities’ Bond bond trading system or the securities trading market, or published prices announced by Gre Tai Securities Market of each period. Other investments are assessed at fair value through current value of discounted cash flow technique on balance sheet date, or through Bloomberg, Reuters and the quoted prices from competitors. Financial derivatives instruments of a trading purpose are assessed at fair value quoted market price of balance sheet date if quoted market prices in the public market is available. If not, fair values are assessed according to the nature and classification of financial derivatives on the balance sheet date through proper evaluation methods, such as discounted cash flow technique, option pricing model, etc.
C. The Company and it subsidiaries engage in long-term foreign exchange contracts, currency exchange, interest rate swap, option, warranty liability and futures trade deposit-financial derivatives transaction of self-owned capital. All these products are initially recognized and evaluated subsequently at fair value. When the criteria of hedge accounting have not been met, the change in fair value of financial derivatives products is recognized as profit and loss. If the fair value is positive, it is recognized as a financial asset; if not, then it is recognized as a financial liability.
D. Financial assets or liabilities designated as at fair value through profit or loss of the Company should satisfy one of the following criteria:
(a) Hybrid instruments;
(b) Designated to eliminate or decrease inconsistency on accounting valuation or recognition;
(c) Designated based on the Company’s risk management policy or investment strategy evaluated on the fair value basis.
E. The original classification of certain financial assets with a purpose of trading (excluding financial derivatives instruments) is reclassified as available-for-sale financial assets after July 1, 2008. Its main purpose is no longer for sale in the short-term in subsequent periods and is classified as available-for-sale financial assets under Paragraph 104 of SFAS No. 34.

Financial Information
912012 ANNUAL REPORT
( 7 ) Available-for-sale financial assetsA. Equity investments adopt trade date accounting while the debt investments adopt settlement date accounting. On initial recognition,
financial assets and liabilities are assessed at fair value. Transaction costs which are attributable to the acquisition should be capitalized.
B. Available-for-sale financial assets are evaluated at fair value with value changes recognized as equity adjustments. When the financial asset is derecognized, the cumulative gain or loss that was previously recognized in equity is recognized in profit or loss in the statement of income. The fair value of listed stocks, OTC stocks and closed-end mutual funds is based on the latest quoted fair prices of the accounting period. The fair value of open-end funds is based on the net asset value at the balance sheet date.
C. An impairment loss is recognized when there is an objective evidence of impairment. If the impairment loss of equity investments decreases in the following period, then the change is recognized as equity adjustment. If the impairment loss of bond investments decreases with objective evidence indicating that an impairment loss has been incurred after the impairment is recognized, the impairment amount is reversed and recognized in current profit and loss.
( 8 ) Held-to-maturity financial assetsA. With settlement date accounting adopted, financial assets are measured at fair value on initial recognition. A transaction cost which is
attributable to the acquisition should be capitalized.
B. Financial assets held to maturity are measured at amortized cost.
C. An impairment loss is recognized when there is an objective evidence of impairment. If the amount of the impairment loss decreases due to an event occurring after the impairment was originally recognized, the previously recognized impairment loss is reversed through profit and loss to the extent that the carrying amounts at book value do not exceed the amortized cost.
( 9 ) Hedge accountingIf all the conditions of applying hedge accounting are satisfied, for the effects through profit and loss between mutually offsetting hedging instruments and hedged items at fair value. The related accounting treatments are as follows:
A. Fair value hedges: When a derivative financial instrument is used as the underlying hedging instrument, fair value is applied for valuation. When a non-derivative financial instrument is used for hedging, any gain or loss arising from change in exchange rates is charged to current income. The carrying amount of the hedged item is adjusted for gains or losses attributable to the risk being hedged.
B. Cash flow hedges: The effective portion of the gain or loss on the hedging instrument is recognized directly in equity. When it is determined that the expected hedged transaction will result in financial assets or financial liabilities, amounts initially recorded in equity are transferred to income in the period in which profit or loss is affected by the related assets or liabilities.
C. Net investment hedge in foreign operations: Gains or losses generated from hedge instruments are recognized as adjustments in equity which are then transferred to profit or loss for the period upon disposal of foreign operations.
( 10 ) Financial assets carried at costA. With trade date accounting adopted, financial assets are measured at fair value on initial recognition; transaction costs which are
attributable to the acquisition should be capitalized.
B. The impairment loss is accounted for when there is objective evidence that a financial asset carried at cost is impaired. Such impairment losses cannot be reversed.
( 11 ) Debt investments with no active marketA. With settlement date accounting adopted, on initial recognition, financial assets are measured at fair value; transaction costs which are
attributable to the acquisition should be capitalized.
B. Bond investment with no active market is measured at amortized costs.
C. An impairment loss is recognized when there is an objective evidence of impairment. If the amount of the impairment loss decreases due to an event occurring after the impairment was originally recognized, the previously recognized impairment loss is reversed through profit and loss to the extent that the carrying amounts at book value do not exceed the amortized cost.
( 12 ) Derecognition of financial assets and liabilitiesA. Financial assets
All or part of a financial asset is derecognized when the contractual rights of the asset expire. When all or part of a financial asset is transferred and contractual rights of the asset is given up, the cash flow received from the clearing house within a certain limit is treated as a sale.
When the transfer of a financial asset does not qualify as a loss of contractual rights, then such transfer of asset is recognized as a guaranteed loan. Reacquiring rights of such assets will no longer be accounted for as derivative financial assets.
B. Financial liabilities
All or part of a financial liability is derecognized when the obligation specified in the contract binding the financial liability is either discharged, cancelled or expired.

92
Financial Information
Financial Information
OUR VISION—being your best financial service partner
Where there has been an exchange between an existing borrower of debt instruments and the Company with substantially different terms, or there has been a substantial modification of the terms of an existing financial liability, then the transaction is accounted for as an extinguishment of the original financial liability and the recognition of a new financial liability. Any gain or loss from extinguishment of the original financial liability is recognized in the statement of income.
( 13 ) Financial asset securitizationA.Under the “Financial Assets Securitization Act”, MICB securitized part of its enterprise loans and transferred those loans to the special
purpose trustee in return for the issuance of the related beneficiary certificates. Having surrendered the control of contractual rights on the loans and transferred to a special purpose trustee, MICB derecognized all the enterprise loans and recorded gain or loss accordingly, except for subordinated beneficiary certificates retained for credit enhancement which were reclassified as other financial assets instead. In accordance with the Explanatory Note (96) No. 0000000304 of the Accounting Research and Development Foundation of the R.O.C., subordinated beneficiary securities retained by the originator represent the originator retains rights and has not lost control. Given that almost all original investments become uncollectible due to factors other than credit deterioration of obligor (e.g. effects for undertaking risks of overall securitization beneficiary securities), the subordinated beneficiary securities should be classified as “available-for-sale financial assets” or “financial assets at fair value through profit or loss”.
B. The gain or loss on the sale of the loans is the difference between the proceeds and carrying amount of the loans. The abovementioned carrying amount of the loans should be allocated in proportion to the fair values of the part retained and the part sold on the date of sale. Since quotes are not available for loans and retained interests, MICB estimates fair value at the present value of expected cash flows, using management’s key assumptions on credit losses and discount rates commensurate to the risks involved.
C. The interest income on the subordinated beneficial securities held by MICB is recognized upon its receipt from the trustees.
( 14 ) Notes, accounts and other receivablesA. Notes and accounts receivable are mainly derived from service sales activities. Other receivables are those receivables other than notes or
accounts receivable.
B. Starting from January 1, 2011, the revised SFAS No. 34 “Financial Instruments: Recognition and Measurement” has been adopted, which indicates that impairment losses (bad debts) of receivables are recognized when there is objective evidence of impairment. For detailed policy of changes in allowance for credit losses of accounts receivable and bills discounted, please refer to Note 2 (15).
( 15 ) Bills discounted and loansA. Bills discounted and loans are recorded at the basis of outstanding principal amounts. Any unsettled loans upon maturity are to be
reclassified to non-accrual loans along with the associated amount of accrued interest previously recorded within six months from the date of the maturity. In addition, interest receivable should no longer be accrued.
B. Non-accrual loans transferred from loans should be recorded under bills discounted and loans. For other non-accrual loans transferred from accounts other than loans, such as guarantees, acceptances and receivables on factoring should be recorded under “other financial assets”.
C. Allowances for probable losses are provided for due from call loans to bank, receivables, bills discounted and loans based on a review of its collectability on the balance sheet date. In accordance with “The Rules for Bank Asset Evaluation, Loss Reserve Provision, and Disposal of Overdue Loans, Non-accrual Loans, and Bad Debts”, reserves set aside for probable loan losses are based on the estimation of potential unrecoverable exposures, net of collateral. A significant degree of management discretion is used in the estimation process, which includes the assessment of the borrower’s ability to pay and of the value of the underlying collateral.
D. In accordance with the “Regulations Governing the Procedures for Banking Institutions to Evaluate Assets and Deal with Non-performing/Non-accrual Loans” of the Financial Supervisory Commission of the Executive Yuan (FSC) and the subsidiary’s “Guidelines to Evaluate Assets and Deal with Non-performing/Non-accrual Loans”, credit assets are classified into various types. Normal credit assets shall be classified as “Category One” and the minimum loan loss provision shall be the sum of 0.5% of the outstanding balance of Category One credit asset’s claim; the remaining unsound credit assets shall be evaluated based on the status of the loan collaterals and the length of time overdue. Assets that require special mention shall be classified as “Category Two,” (2% shall be provided) assets that are substandard shall be classified as “Category Three,” (10% shall be provided) assets that are doubtful shall be classified as “Category Four,” (50% shall be provided) and assets for which there is loss shall be classified as “Category Five” (100% shall be provided). Unrecoverable debts shall be written off after the Board of Directors’ approval and the supervisors have been notified.
E. Starting from January 1, 2011, in accordance with the revised SFAS No. 34, whether objective evidence exists in the Group’s assessment on the balance of loans and receivables (including overdue receivables and interest receivables) on balance sheet date indicates impairment losses on material individual financial assets, and impairment losses generated individually or as a group from non-material individual financial assets. An impairment loss is recognized when there is an objective evidence of impairment. The impairment amount is the difference between the financial assets’ book value and the estimated future cash flow discounted using the original effective interest rate. In the subsequent period, if the amount of the impairment loss decreases due to an event occurring after the impairment was originally recognized, the previously recognized impairment loss is reversed through profit and loss to the extent that the carrying amounts do not exceed the amortized cost that would have been determined had no impairment loss been recognized in prior years.

Financial Information
932012 ANNUAL REPORT
( 16 ) Margin trading of securitiesA. Margin loans extended to stock investors are recorded as “marginal receivables” and the stocks purchased by the borrowers are held by
MS as collateral. The collateral is recorded in the memorandum account and is returned to the borrowers when the loans are repaid.
B. Guarantee deposits received from stock investors on short sales are recorded as “margin deposits on short sales”. The proceeds from short sales (less the securities transaction tax and service charges) are held by MS as guarantee deposits which are recorded as “payables on proceeds from short sales”. The stocks lent to the customers are recorded in the memorandum account. When the stocks are returned to MS, the margin deposits and proceeds from the short sales are returned to the customers accordingly.
C. Loans borrowed by MS from other securities lenders when MS has insufficient fund to conduct margin trading are recorded as “margin loans from other securities lenders”. When MS has insufficient stocks to conduct short selling, the guarantee deposits paid for the stocks borrowed from other securities lenders are recorded as “deposits paid to other securities lenders”. The proceeds from short sales are then paid to the securities lenders as additional guarantees and are recorded as “refinancing guarantees receivable”.
( 17 ) Bills and bonds purchased/ sold under resale/ repurchase agreemensBonds and bills purchased under resale agreements refer to the actual payment made to the counterparty in transactions involving the purchase of securities, subject to an agreement by the purchaser to resell the securities. Such transaction is treated as margin trading. Bonds and bills sold under repurchase agreements refer to the actual receipts from the counterparty in transactions involving the sale of bonds and bills by one party, subject to an agreement by the seller to repurchase the securities. All related interest income or expenses are recognized on an accrual basis.
( 18 ) Margin deposits from clients and futures traders’ equityEngagement of futures business should separate the account of “margin deposit from client” and “futures traders’ equity” to charge traders margin deposits, premium, and the variation of balance at market price. According to daily variation of balance at market price and relevant commission, changes of “margin deposit from client account” and “futures traders’ equity” need to be adjusted. Should there be any balance remaining from the futures transaction, it should be recognized as futures margin deposit receivables.
( 19 ) Asset impairmentPursuant to SFAS No. 35, the Group assesses indicators for impairment for all its assets within the scope of SFAS No. 35 on each balance sheet date. If impairment indicators exist, the Group shall then compare the carrying amount with the recoverable amount of the assets or the cash-generating unit (“CGU”) and write down the carrying amount to the recoverable amount where applicable. Recoverable amount is defined as the higher of fair values less costs to sell and the values in use. For previously recognized losses, the Group shall assess, on each balance sheet date, whether there is any indication that the impairment loss may no longer exist or may have decreased. If there is any such indication, the Group is required to recalculate the recoverable amount of the asset. If the recoverable amount increases as a result of the increase in the estimated service potential of the assets, the Group shall reverse the impairment loss to the extent that the carrying amount after the reversal would not exceed the carrying amount that would have been determined (net of amortization or depreciation) had no impairment loss been recognized for the assets in prior years.
( 20 ) Equity investments accounted for by the equity methodA. Investments in companies, of which the Company holds more than 20% of the voting shares or over which the Company can exercise
significant influence, are accounted for by the equity method. However, effective from January 1, 2006, the principles stated in SFAS No. 1 “Conceptual Framework for Financial Accounting and Preparation of Financial Statements”, No. 5 “Accounting for Long-Term Equity Investments”, No. 25 “Business Combination – Purchase-Price Accounting” is applied for the accounting for difference between the initial investments and the net worth of the respective investee companies. Pursuant to the procedures for the allocation of acquisition cost as stated in SFAS No. 25, an analysis is performed on such differences and such differences attributable to goodwill are no longer amortized.
B. Unrealized gains (losses) resulting from the downstream transactions with the investees accounted for under the equity method are eliminated based on the Company’s percentage of shareholding. Where the Company has controlling power over the investees, the unrealized gains (losses) are fully eliminated and are recognized only upon realization.
C. Unrealized gains (losses) resulting from the upstream transactions with the investees accounted for by the equity method are eliminated based on the Company’s percentage of shareholding.
D. The impairment in the long-term equity investments accounted for by the equity method is accounted for in accordance with SFAS No. 35, “Impairment of Assets”.
E. The cost on disposal of equity investments is calculated using the weighted-average method.
( 21 ) ReinsuranceA. Revenues and expenses of inward and outward reinsurance business are recognized on the date the bills are received. Appropriate methods
should be adopted in estimating payments and income arising from unrecognized reinsurance expense, such as revenues and expenses of reinsurance commission, revenues or expenses of reinsurance surcharge fee, and amortized claim and payment of reinsurance, etc, should all be recognized. Other relevant profit and loss of reinsurance are not deferrable.

94
Financial Information
Financial Information
OUR VISION—being your best financial service partner
B. Starting from January 1, 2011, with the classification of reinsurance contract, the Company assesses the agreements under the deposit accounting given that the objective insurance risks of reinsurance agreements are not transferred to the reinsured.
C. The Company evaluates whether privilege of reinsured is impaired or non-collectable on a regular basis and offers specifically the alternatives such as reinsurance reserve assets, reinsurance claims and payment receivables, reinsurance transaction receivables and outward insurance responsibility reserve fund.
D. When objective evidence indicates that such option being exercised after the initial recognition will possibly lead to the Company being unable to collect all receivables on the contract, and the impact of the receivables from reinsured can be reliably measured with regard to the aforementioned event. The provision for accumulated loss will be recognized if the receivables do not exceed reinsurance reserve asset at book value (starting from January 1, 2011). Recognition should be appropriately made according to the amount for amortizable claim, payment of reinsurance, reinsurance transaction receivables and non-collectable outward reinsurance reserve fund.
( 22 ) Valuation and depreciation of properties and equipmentA. Except for land, all properties and equipment are depreciated on a straight-line basis according to their value after revaluation increment.
Major improvements and renewals are capitalized as cost, and repairs and maintenance are expensed as incurred. Relevant promulgated principles should be applied if impairment exists. Upon sale or disposal of properties and equipment, the related cost, revaluation increment, accumulated depreciation and accumulated impairment loss are written-off, and any gain or loss is credited or charged to non-interest income.
B. When an impairment loss on a specified asset is identified, the related depreciation is recalculated based on the adjusted value over the estimated useful lives. The residual value of a property or equipment that is still in use at the end of the original estimated useful life is depreciated using the straight-line method over its revised estimated useful life. The estimated economic service life of properties and equipment are set forth below.:
Buildings 35 ~ 60 yearsMachinery and equipment 3 ~ 15 yearsOffice equipment 3 ~ 15 yearsComputer equipment 3 ~ 6 yearsTransportation equipment 1 ~ 12 yearsOther equipment 1 ~ 11 yearsLeasehold improvements 1 ~ 15 years
( 23 ) Intangible assetsComputer software expenditures are stated at cost and amortized over the estimated life of 3 to 5 years using the straight-line method.
( 24 ) GoodwillPursuant to the procedures for the allocation of acquisition cost as stated in SFAS No. 25 “Business Combination-Accounting Treatment under Purchase Method”, an analysis is performed on differences between the initial investments and the net worth of the respective investee companies, and such differences attributable to goodwill are no longer amortized. Impairment loss of goodwill recognized in prior years is not recoverable. In subsequent periods, the impairment test on goodwill is performed on a yearly basis in accordance with SFAS No. 35.
( 25 ) Foreclosed propertiesForeclosed properties are stated at the lower of cost or net realizable value on the balance sheet date.
( 26 ) Commercial papers payable and bonds payableWhen issuing bonds, issuing prices are recognized based on issuing terms. Premiums and discounts on bonds payable are valuation accounts and shall be classified as additions to or reductions of bonds payable. Bonds shall be amortized during the period of bond circulation and recorded as an adjustment in interest expense.
When exchangeable bondholders exercise their right to exchange their bonds for reference shares at a fixed price and a fixed amount, the exchangeable bonds shall be assessed by all issuance prices less embedded derivatives at fair value. For the liability components of non-financial derivative instruments, the measurement is accounted for at amortized cost using the effective interest method. Relevant interest or profit and loss on redemption shall be recognized as current profit and loss. If the convertible bondholders exercise their conversion right before maturity, the Company shall adjust the carrying amount of the liability component. The adjusted carrying amount of the liability component shall be the basis of determining profit and loss of the swap items.
( 27 ) Liability on issuance of stock warrants/repurchase of stock warrants issuedIssuance of stock warrants and its subsequent valuation are accounted for by the fair value method and are recorded as “liability on issuance of stock warrants”. For the warrants that are issued under repurchase agreements, the repurchase amount is recorded under “repurchase of stock warrants issued” which is a contra account of “liability on issuance of stock warrants”. At expiration of the stock warrants, the amount of the unexercised warrants is reversed after being revalued by the fair value method. A gain on the unexercised expired stock warrants is recognized accordingly.

Financial Information
952012 ANNUAL REPORT
( 28 ) Reserves for liabilities and lossesReserves for liabilities and losses are mainly provided for guarantee liabilities, unearned premium reserve, claims reserve, special reserve, deficiency reserve, liability adequacy reserve and unqualified reinsurance reserve.
A. Reserve for guarantees
Reserves for guarantees are determined based on the estimated losses arising from default possibility of the ending balances of tariff duties, commodity tax and performance status.
B. Unearned premium reserve
Unearned premium reserve is provided based on various risk calculation for effective contracts yet to mature or covered risks yet to terminate in the coverage period.
C. Claims reserve
Claims reserves are provided based on claim experience and expenses of various insurance types and are calculated with methods based on actuarial principles. Reserves are provided for Claims Reported But Not Paid and Claims Incurred But Not Reported. For Reported But Not Paid Claims, a reserve has been provided on a per-policy-claim-report basis for each type of insurance.
D. Special reserve
Special reserves include “Significant Peril Special Reserve” and “Risk Variation Special Reserve”, which are provided in accordance with the “Regulations Governing the Setting Aside of Various Reserves by Insurance Enterprises”. The above amount to be written off or recovered shall be made under liability reserves starting from January 1, 2011. If such liability reserves are insufficient for write-offs or recoveries, the deficiency less income tax shall be written off or recovered using special reserves under stockholders’ equity.
E. Deficiency reserve
Potential claims and expenses are estimated for effective contracts yet to mature or covered risks yet to terminate in the coverage period. The estimated amount, including the premium deficiency reserve based on the difference between claim reserves/expenses, and unearned premium reserve and the expected premium income shall be recognized.
F. Liability adequacy reserve
Liability adequacy test is performed in accordance with the testing provisions of SFAS No. 40 “Insurance Contracts”. If the test result shows that the insurance liability is inadequate, the deficiency shall be provided as liability adequacy reserve.
G. Unqualified reinsurance reserve
Unqualified reinsurance reserves of received and ceded reinsurance business under ceded reinsurance and other risk assumption mechanism on the ceded date or balance sheet date shall be reserved and disclosed in the notes to the financial statements.
( 29 ) PensionsA. Pensions are accounted for in accordance with SFAS No. 18, “Accounting for Pensions”. Minimum accrued pension liability and net
pension cost are recognized based on actuarial calculations. Prior service costs and pension gain (loss) are amortized on a straight-line basis over the average remaining service years of the employees.
B. The ROC Labor Pension Act (the “Act”), which adopts a defined contribution scheme, takes effect from July 1, 2005. In accordance with the Act, employees of the Company may elect to be subject to either the Act, and maintain their seniority before the enforcement of the Act, or the pension mechanism of the Labor Standards Law. For employees subject to the Act, the Company shall make monthly contributions to the employees’ individual pension accounts based on 6% of the employees’ monthly wages. If the retirement plan is a defined contribution pension plan, the contributions are based on an accrual basis and are recognized as pension costs in the current period.
( 30 ) Capital surplusA. Pursuant to the Company Law, capital surplus arising from share issue premium and donations can be capitalized based on a stockholders’
resolution. However, according to the SFC regulations, capital surplus arising from share issue premium generated by cash injection is allowed to be capitalized only once a year and is subject to a specified limit. In addition, capitalization is prohibited in the year when the cash is injected.
B. As per the rule stipulated by the SFC, capital surplus arising from share swap between financial institutions can be appropriated as cash dividends and capitalized in the year of the share swap according to Section 4 of Article 47 of the Financial Holding Company Act, if the capital surplus arises from the unappropriated earnings generated prior to share swap. In addition, the capitalization amount is not subject to the limit stipulated in Article 8 of the Securities and Exchange Law.
( 31 ) Legal reservePursuant to the Company Law, 10% of the Company’s after-tax net income in the current year must be appropriated as legal reserve until the total amount of the legal reserve equals the issued share capital. This legal reserve can be only used to offset deficits and used for the purpose of dividend distributions. For the legal reserve to be used for issuing new shares or distributing cash dividends, only the portion of the legal reserve exceeding 25% of paid-in capital may be capitalized or released.

96
Financial Information
Financial Information
OUR VISION—being your best financial service partner
( 32 ) Special reserveIf there are any negative stockholders’ equity items recorded by the Company, such as unrealized losses on declines in market value of long-term equity investments and cumulative translation adjustments, the Company is required to set aside a special reserve with an amount equal to the total amount of the negative items but not exceeding the limits listed below before the earnings are appropriated.
A. The special reserve set aside for the negative stockholders’ items which occur in the current year should not exceed the sum of after-tax net income generated in that year plus the unappropriated retained earnings accumulated for previous years.
B. The special reserve set aside for the negative stockholders’ items which occur in previous years should not exceed the amount of the unappropriated retained earnings accumulated for previous years less the amount of special reserve set aside in (A).
In accordance with the Explanatory Note (90) Tai-Cai-Zheng (1) Zhi No. 170010 promulgated by the SFC, the Company is required to set aside a special reserve with an amount equal to the excess of the book value of the Company’s shares held by its subsidiaries over their market value, and the reserve cannot be appropriated. If the market value recovers in the future, the special reserve can be reversed by the recovered amount in proportion to the percentage of shareholding.
( 33 ) Income taxesA. Inter-period and intra-period income taxes are allocated in accordance with SFAS No. 22, “Income Taxes”. Income tax effects arising
from taxable temporary differences are recognized as deferred income tax liabilities. Income tax effects arising from deductible temporary differences, loss carryforwards and income tax credits are recognized as deferred income tax assets, and a valuation allowance is provided based on the expected reliability of the deferred income tax assets. Adjustment of deferred tax liability or asset for enacted change in tax rate measured by the balance sheet date is recognized as tax benefit or expense in the statement of income for the period.
B. In accordance with the “Basic Income Tax Regulation” effective from January 1, 2006, the current income tax recognized is the higher of the basic tax calculated according to such regulation and the income tax assessed by standards of the National Tax Administration.
C. An additional income tax is levied on unappropriated retained earnings, which shall be recognized as income tax expense of the period.
D. Pursuant to Article 49 of the Financial Holding Company Act and the relevant provisions of the Income Tax Law, the tax returns of the Company’s domestic subsidiaries can be filed jointly with the Company if the Company holds more than 90% of the outstanding shares of these subsidiaries and the holding period exceeds twelve months. Under the joint tax return scheme, only the subsidiaries’ returns on corporate income tax and the 10% tax surcharge on surplus retained earnings can be filed jointly with the Company. Other tax matters shall be handled separately by the Company and its domestic subsidiaries.
( 34 ) Earnings per shareA. Earnings per share are computed in accordance with the SFAS No. 24, “Earnings Per Share”. Basic earnings per share are computed
for simple capital structures, and basic and diluted earnings per share are computed for complex capital structures. Basic earnings per share are computed by dividing the net income (loss) attributed to common stockholders by the weighted-average number of common shares outstanding during the period. Diluted earnings per share are computed by dividing the net income (loss) attributed to common stockholders, taking into account the dilutive effects of dividends and interest expense on potential common shares and other income and expenses arising from conversion of the convertible bonds, by the weighted-average number of common shares outstanding plus the weighted-average number of potential common shares to be converted from the convertible bonds.
B. Any capital increase through cash injection is incorporated in the calculation on a weighted-average basis according to the circulation period. Where there is capitalization of retained earnings or capital surplus, basic earnings per share for prior and current years are adjusted retroactively.
( 35 ) Employees’ bonuses and directors’ and supervisors’ remunerationPursuant to EITF 96-052 of the Accounting Research and Development Foundation, R.O.C., dated March 16, 2007, “Accounting for Employees’ Bonuses and Directors’ and Supervisors’ Remuneration”, the costs of employees’ bonuses and directors’ and supervisors’ remuneration are accounted for as expenses and liabilities, provided that such a recognition is required under legal or constructive obligation and those amounts can be estimated reasonably. However, if the accrued amounts for employees’ bonuses and directors’ and supervisors’ remuneration are significantly different from the actual distributed amounts resolved by the stockholders at their annual stockholders’ meeting subsequently, the differences shall be recognized as gain or loss in the following year.
( 36 ) Recognition of revenue and expense
A. The recognition of revenue is in compliance with SFAS No. 32, “Revenue”.
B. Bank subsidiaries and its indirect subsidiaries
Interest income for loans is recognized on an accrual basis except for loans classified as non-accrual loans. The accrual of income from non-accrual loans is discontinued and subsequent interest receipts are credited to income upon collection. In accordance to the regulations established by the Ministry of Finance, interest income arising from emergency loans and renewal of agreements is recorded as deferred revenue and subsequently recognized as income upon interest receipts. Service fee income is recognized when the services are rendered.

Financial Information
972012 ANNUAL REPORT
C. Securities subsidiaries
Interest income and expenses arising from margin trading of securities, bonds sold under repurchase agreements and those purchased under resale agreements, and interest-bearing securities are recorded under the respective accounts in the statement of income. Financial income or expenses derived from activities other than those mentioned above are recorded as non-operating income or expenses.
D. Insurance subsidiaries
The premiums income derived from underwriting business is recognized in the year when the respective policies are issued. The associated expenses such as commissions, agency cost and service charges are recognized accordingly. Claims of direct coverage are recognized based on claims (including claim expenses) applied and paid during the period. Please refer to Note 2 (28) for related details.
E. Expenses are recognized as incurred
( 37 ) Capital expenditure
When the economic benefit generated from the expenditure is limited to the current period or when no economic benefit is expected, the expenditures shall be expensed in the current period. When the economic benefit generated from the expenditure is related to future years, the expenditures shall be capitalized unless the amount of expenditure is immaterial, in which case, the expenditure shall be recognized as current expense regardless of the length of the economic benefit.
( 38 ) Contingent losses
At the balance sheet date, if an asset is considered to be impaired or liability has been incurred, such loss is recorded as contingent losses for the current year where the amount of loss can be reasonably estimated. When the amount of the loss cannot be reasonably estimated or when it is probable that loss has been incurred, the obligation is disclosed as a contingent liability in the notes to the financial statements.
( 39 ) Operating segments
Information of operating segments of the Company is reported in the same method as the internal management report provided to the Chief Operating Decision-Maker (CODM). The CODM is in charge of allocating resources to operating segments and evaluating their performance.
In accordance with SFAS No. 41 “Operating Segments”, the Company discloses segment information in the consolidated financial statements.
( 40 ) Convenience translation into US dollars (Unaudited)
The Company and its subsidiaries maintain their accounting records and prepare their financial statements in New Taiwan dollars. The United States dollar amounts disclosed in the 2012 consolidated financial statements are presented solely for the convenience of the readers and were translated into US dollars using the exchange rate prevailing at December 31, 2012 of US$1:NT$29.035. Such translation amounts are not in compliance with generally accepted accounting principles in the Republic of China and should not be construed as representation that the New Taiwan dollar amounts represent, or have been or could be converted into United States dollars at that or any other rate.
3. CHANGES IN ACCOUNTING PRINCIPLES(1) Starting from January 1, 2011, the Group adopted the revised SFAS No. 34 “Financial Instruments: Recognition and Measurement”, which
indicates that impairment losses (bad debts) of various creditors’ rights, i.e. loans, receivables, notes receivable and other receivables shall be recognized when objective evidence of impairment exists. This change in accounting principle had no significant impact on the net income and earnings per share for the year ended December 31, 2011.
(2) Starting from January 1, 2011, the Group adopted the newly issued SFAS No. 41 “Operating Segments” to replace SFAS No. 20 “Segment Reporting”. At initial adoption, the Group restated the segment information of the previous period pursuant to the accounting standard. This change in accounting principle had no significant impact on the net income and earnings per share for the year ended December 31, 2011.
(3) Starting from January 1, 2011, CKI adopted the newly issued SFAS No. 40 “Insurance Contracts”. The adoption of this standard had no effect on the cumulative change in accounting principles.
(4) Starting from January 1, 2011, the additional special reserve provision calculated less income tax is listed as special reserve under stockholders’ equity after annual closing in accordance with the “Regulations Governing the Setting Aside of Various Reserves by Insurance Enterprises”. This change in accounting principle resulted in an increase of net income before tax amounting to NT $254,879 thousand (US$8,420 thousand) for the year ended December 31, 2011.

98
Financial Information
Financial Information
OUR VISION—being your best financial service partner
4. DETAILS OF SIGNIFICANT ACCOUNTS
( 1 ) Cash and cash equivalents
December 31, 2012 December 31, 2011
NT$ US$ (Unaudited) NT$Due from banks $ 291,458,976 $ 10,038,194 $ 298,382,713
Checks for clearance 838,855 28,891 1,007,914
Cash on hand 13,795,125 475,121 14,636,207
Bank deposits 5,021,785 172,956 6,683,311
Cash equivalents (Note) 2,316,790 79,793 2,254,838
Petty cash 31,033 1,069 27,889
Total $ 313,462,564 $ 10,796,024 $ 322,992,872
Note: Includes short-term bills and bond investments with maturities less then three months held by subsidiaries other than MICB, MS and MBF.
( 2 ) Due from the Central Bank and call loans to banks
December 31, 2012 December 31, 2011
NT$ US$ (Unaudited) NT$Import loans from banks $ 13,042,150 $ 449,187 $ 80,243,433
Call loans to banks 54,714,087 1,884,419 43,699,304
Participate in interbank financing with risk 24,749,186 852,392 -
Reserve for deposits-category A 20,360,016 701,223 19,326,520
Reserve for deposits-category B 31,919,840 1,099,357 31,243,615
Reserve for deposits- foreign currency 470,583 16,207 5,552,885
Reserve for deposits- general 5,700,275 196,324 330,950
Bank overdrafts - - 2,873
Less: Allowance for bad debts - - ( 59 )
Total $ 150,956,137 $ 5,199,109 $ 180,399,521
As required by relevant laws, the reserves for deposits are calculated at prescribed rates on the average balances of various deposit accounts. The reserve for deposits - category A and foreign currency deposits accounts are non-interest bearing and call on demand. Reserve for deposits - category B earns interest but its use is restricted under relevant regulations.
( 3 ) Financial assets at fair value through profit or loss
December 31, 2012 December 31, 2011
NT$ US$ (Unaudited) NT$Financial assets held for trading, net $ 147,871,796 $ 5,092,881 $ 153,655,585
Financial assets designated as at fair value through profit or loss, net 36,697,454 1,263,904 35,213,967
Total $ 184,569,250 $ 6,356,785 $ 188,869,552

Financial Information
992012 ANNUAL REPORT
A. Financial assets held for trading are listed as follows:
December 31, 2012 December 31, 2011
NT$ US$ (Unaudited) NT$Stocks $ 4,207,762 $ 144,920 $ 5,144,175
Commercial papers 93,373,492 3,215,894 96,933,023
Treasury bills 8,549,546 294,457 16,092,460
Bankers’ acceptances 2,681 92 -
Foreign currency bills 11,276 388 11,723
Open-end beneficiary certificates 206,338 7,107 65,192
Negotiable certificates of time deposit 22,788,609 784,867 17,853,217
Corporate bonds 11,021,222 379,584 11,461,186
Government bonds 5,840,572 201,156 2,460,859
Financial bonds 200,142 6,893 200,856
Other bonds - - 613,189
Derivative financial instruments 1,670,156 57,522 2,819,705
Total $ 147,871,796 $ 5,092,881 $ 153,655,585
B. Financial assets designated as at fair value through profit or loss are listed as follows:
December 31, 2012 December 31, 2011
NT$ US$ (Unaudited) NT$Corporate bonds $ 26,170,745 $ 901,352 $ 23,396,815
Government bonds 602,582 20,754 790,899
Financial bonds 7,175,694 247,139 7,513,845
Derivative financial instruments 2,748,433 94,659 3,512,408
Total $ 36,697,454 $ 1,263,904 $ 35,213,967
C. Please refer to Note 6 for details of the aforementioned financial assets at fair value through profit or loss provided as collaterals as of December 31, 2012 and 2011.
D. Please refer to Note 10 for the details of the derivatives contracts information.
E. As of December 31, 2012 and 2011, the above financial assets used as underlying assets for repurchase agreements held by MBF were NT$97,082,867 thousand (US$3,343,650 thousand) and NT$111,774,301 thousand, respectively.
F. As of December 31, 2012 and 2011, the above financial assets used as underlying assets for repurchase agreements held by MS were NT$12,693,774 thousand (US$437,189 thousand) and NT$9,527,979 thousand, respectively.
G. As of December 31, 2012 and 2011, the above financial assets used as financial assets at fair value through profit or loss for repurchase agreements held by MICB were NT$869,040 thousand (US$29,931 thousand) and NT$2,339,038 thousand, respectively.

100
Financial Information
Financial Information
OUR VISION—being your best financial service partner
( 4 ) Receivables, net
December 31, 2012 December 31, 2011
NT$ US$ (Unaudited) NT$Accounts receivable $ 88,358,102 $ 3,043,158 $ 70,257,634Notes receivable 154,056 5,306 118,748Tax refundable 630,350 21,710 630,337Accrued income 634,395 21,849 561,279Interest receivable 4,803,509 165,439 5,340,520Acceptances receivable 12,520,718 431,229 10,714,251Insurance receivable 752,537 25,918 766,548Indemnity refundable on reinsurance 395,959 13,637 470,920Due from reinsurers and ceding companies 165,481 5,699 151,559Margin loans receivable 9,941,396 342,394 10,956,697Recovery of accounts receivable 960,383 33,077 2,127,124Purchase of obligor receivable 6,544,264 225,392 5,080,677Purchase of obligor receivable for acting as assignee 994,414 34,249 1,079,364Purchase of assets for acting as assignee 950,000 32,719 1,000,000
Other receivables 401,372 13,824 283,989
Total 128,206,936 4,415,599 109,539,647
Less: Allowance for bad debts ( 2,613,878 ) ( 90,025 ) ( 2,379,160 )
Receivables, net $ 125,593,058 $ 4,325,575 $ 107,160,487
Please refer to Note 6 for details of the aforementioned receivables provided as collateral as of December 31, 2012 and 2011.
( 5 ) Bills discounted and loans, net
December 31, 2012 December 31, 2011
NT$ US$ (Unaudited) NT$Import/export bills negotiated $ 16,250,164 $ 559,675 $ 16,935,835Bills and notes discounted 64,083 2,207 88,048Short-term loans 276,159,059 9,511,247 270,362,879Short-term secured loans 140,078,634 4,824,475 148,259,275Overdrafts 307,781 10,600 260,820Secured overdrafts 762,624 26,266 1,308,886Medium-term loans 337,876,423 11,636,867 320,334,261Medium-term secured loans 302,754,770 10,427,235 293,117,260Long-term loans 46,109,497 1,588,066 54,718,903Long-term secured loans 396,490,807 13,655,616 369,546,819
Loans transferred to non-accrual loans 2,067,927 71,222 2,890,659
Total 1,518,921,769 52,313,476 1,477,823,645
Less:Allowance for bad debts ( 16,430,909 ) ( 565,900 ) ( 15,769,491 )
Loans, net $ 1,502,490,860 $ 51,747,576 $ 1,462,054,154
A. For the years ended December 31, 2012 and 2011, the subsidiary, MICB, had not written-off bills discounted and loans without initiating any legal proceedings to collect such bills discounted and loans.
B. As of December 31, 2012 and 2011, the subsidiary, MICB’s balances of bills and loans for which interest revenue was no longer accrued amounted to NT$2,067,927 thousand (US$71,222 thousand) and NT$2,890,659 thousand, respectively. The unrecognized interest revenue on the above bills and loans amounted to NT$92,817 thousand (US$3,197 thousand) and NT$74,036 thousand for the years ended December 31, 2012 and 2011, respectively
.
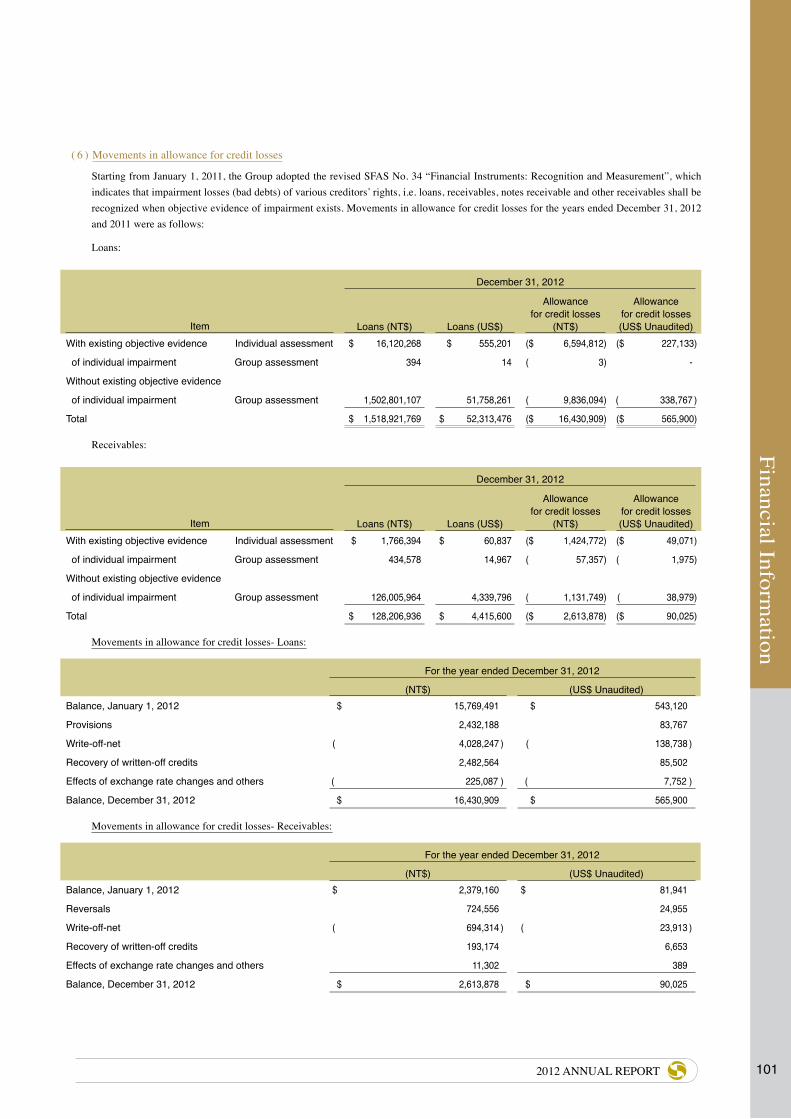
Financial Information
1012012 ANNUAL REPORT
( 6 ) Movements in allowance for credit losses
Starting from January 1, 2011, the Group adopted the revised SFAS No. 34 “Financial Instruments: Recognition and Measurement”, which indicates that impairment losses (bad debts) of various creditors’ rights, i.e. loans, receivables, notes receivable and other receivables shall be recognized when objective evidence of impairment exists. Movements in allowance for credit losses for the years ended December 31, 2012 and 2011 were as follows:
Loans:
Item
December 31, 2012
Loans (NT$) Loans (US$)
Allowancefor credit losses
(NT$)
Allowancefor credit losses(US$ Unaudited)
With existing objective evidence Individual assessment $ 16,120,268 $ 555,201 ($ 6,594,812) ($ 227,133)
of individual impairment Group assessment 394 14 ( 3) -
Without existing objective evidence
of individual impairment Group assessment 1,502,801,107 51,758,261 ( 9,836,094) ( 338,767 )
Total $ 1,518,921,769 $ 52,313,476 ($ 16,430,909) ($ 565,900)
Receivables:
Item
December 31, 2012
Loans (NT$) Loans (US$)
Allowancefor credit losses
(NT$)
Allowancefor credit losses(US$ Unaudited)
With existing objective evidence Individual assessment $ 1,766,394 $ 60,837 ($ 1,424,772) ($ 49,071)
of individual impairment Group assessment 434,578 14,967 ( 57,357) ( 1,975)
Without existing objective evidence
of individual impairment Group assessment 126,005,964 4,339,796 ( 1,131,749) ( 38,979)
Total $ 128,206,936 $ 4,415,600 ($ 2,613,878) ($ 90,025)
Movements in allowance for credit losses- Loans:
For the year ended December 31, 2012
(NT$) (US$ Unaudited)Balance, January 1, 2012 $ 15,769,491 $ 543,120
Provisions 2,432,188 83,767
Write-off-net ( 4,028,247 ) ( 138,738 )
Recovery of written-off credits 2,482,564 85,502
Effects of exchange rate changes and others ( 225,087 ) ( 7,752 )
Balance, December 31, 2012 $ 16,430,909 $ 565,900
Movements in allowance for credit losses- Receivables:
For the year ended December 31, 2012
(NT$) (US$ Unaudited)Balance, January 1, 2012 $ 2,379,160 $ 81,941
Reversals 724,556 24,955
Write-off-net ( 694,314 ) ( 23,913 )
Recovery of written-off credits 193,174 6,653
Effects of exchange rate changes and others 11,302 389
Balance, December 31, 2012 $ 2,613,878 $ 90,025
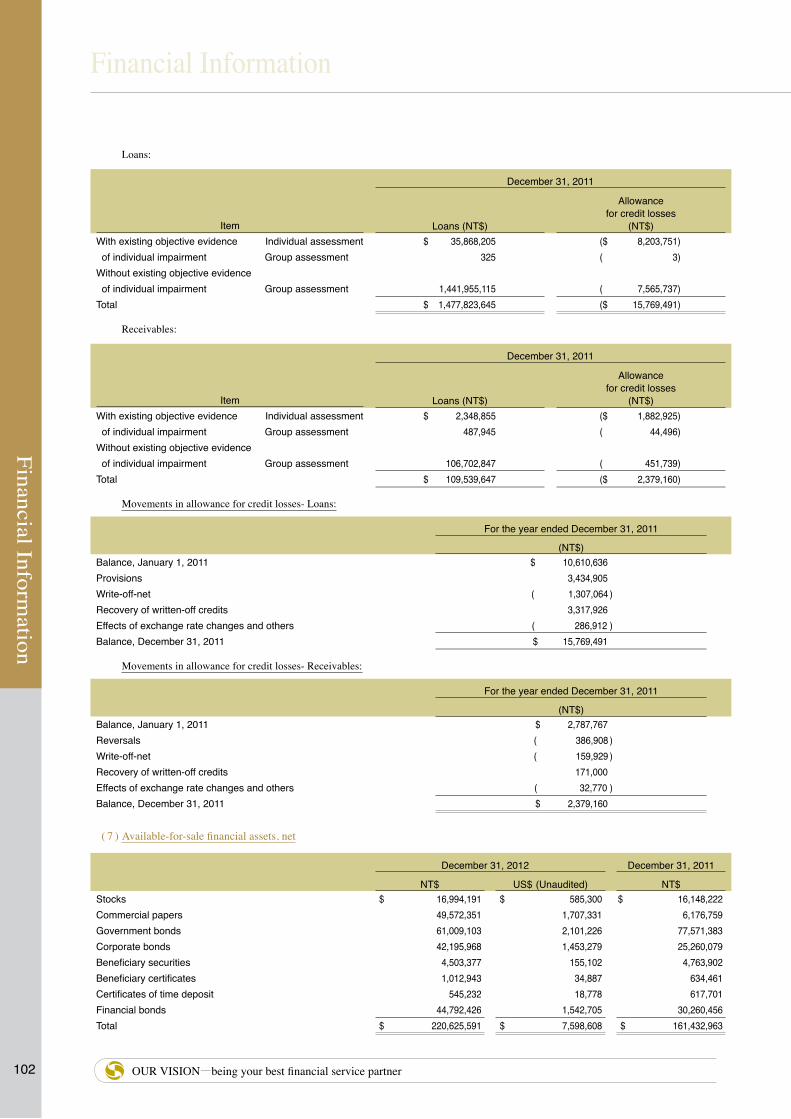
102
Financial Information
Financial Information
OUR VISION—being your best financial service partner
Loans:
Item
December 31, 2011
Loans (NT$)
Allowancefor credit losses
(NT$)With existing objective evidence Individual assessment $ 35,868,205 ($ 8,203,751)
of individual impairment Group assessment 325 ( 3)Without existing objective evidence
of individual impairment Group assessment 1,441,955,115 ( 7,565,737) Total $ 1,477,823,645 ($ 15,769,491)
Receivables:
Item
December 31, 2011
Loans (NT$)
Allowancefor credit losses
(NT$)With existing objective evidence Individual assessment $ 2,348,855 ($ 1,882,925)
of individual impairment Group assessment 487,945 ( 44,496)Without existing objective evidence
of individual impairment Group assessment 106,702,847 ( 451,739) Total $ 109,539,647 ($ 2,379,160)
Movements in allowance for credit losses- Loans:
For the year ended December 31, 2011
(NT$)Balance, January 1, 2011 $ 10,610,636 Provisions 3,434,905Write-off-net ( 1,307,064 ) Recovery of written-off credits 3,317,926Effects of exchange rate changes and others ( 286,912 ) Balance, December 31, 2011 $ 15,769,491
Movements in allowance for credit losses- Receivables:
For the year ended December 31, 2011
(NT$)Balance, January 1, 2011 $ 2,787,767Reversals ( 386,908 ) Write-off-net ( 159,929 ) Recovery of written-off credits 171,000Effects of exchange rate changes and others ( 32,770 ) Balance, December 31, 2011 $ 2,379,160
( 7 ) Available-for-sale financial assets, net
December 31, 2012 December 31, 2011
NT$ US$ (Unaudited) NT$Stocks $ 16,994,191 $ 585,300 $ 16,148,222Commercial papers 49,572,351 1,707,331 6,176,759Government bonds 61,009,103 2,101,226 77,571,383Corporate bonds 42,195,968 1,453,279 25,260,079Beneficiary securities 4,503,377 155,102 4,763,902Beneficiary certificates 1,012,943 34,887 634,461Certificates of time deposit 545,232 18,778 617,701Financial bonds 44,792,426 1,542,705 30,260,456Total $ 220,625,591 $ 7,598,608 $ 161,432,963

Financial Information
1032012 ANNUAL REPORT
A. MICB has available-for-sale financial assets which consists of bonds and bills sold under repurchase agreements amounting to NT$16,495,424 thousand (US$568,122 thousand) and NT$4,203,879 thousand as of December 31, 2012 and 2011, respectively.
B. MBF has available-for-sale financial assets which consists of bonds and bills sold under repurchase agreements amounting to NT$56,094,286 thousand (US$1,931,954 thousand) and NT$65,942,440 thousand as of December 31, 2012 and 2011, respectively.
C. MICB reclassified stocks listed on TSE or OTC, beneficiary certificates and bonds originally classified as at fair value through profit or loss to available-for-sale financial assets amounting to NT$6,540,913 thousand (US$216,071 thousand) for the period from July 1 to December 31, 2008 in accordance with the amended Paragraph 104 of SFAS No. 34. Relevant information was as follows:
( 1 ) Fair value information regarding the reclassified assets that have not been derecognized as of December 31, 2012 and 2011 were as follows:
December 31, 2012 December 31, 2011
Carrying value / fair value Carrying value / fair value
NT$ US$ (Unaudited) NT$Bonds $ 137,086 $ 4,721 $ 368,253
( 2 ) Movements on fair value of the reclassified assets for the years ended December 31, 2012 and 2011 were as follows:
For the year ended December 31, 2012
Recognized in profit and loss Recognized as adjustments in equity
NT$Bonds $ - $ 22,438
For the year ended December 31, 2012
Recognized in profit and loss Recognized as adjustments in equity
US$ (Unaudited)Bonds $ - $ 773
For the year ended December 31, 2011
Recognized in profit and loss Recognized as adjustments in equity
NT$Bonds $ - $ 7,060
( 3 ) If the above reclassified assets were not reclassified as available-for-sale financial assets for the period from July 1, 2008 to December 31, 2008, fair value of the reclassified assets would have been as follows:
NT$ US$ (Unaudited)July 1 ~December 31, 2008 ( $ 240,751 ) ( $ 8,292 )
January 1 ~ December 31, 2009 ( 33,631 ) ( 1,158 )
January 1 ~ December 31, 2010 13,019 448
January 1 ~ December 31, 2011 7,060 243
January 1 ~ December 31, 2012 22,438 773
Total ( $ 231,865 ) ( $ 7,986 )
D. Please refer to Note 6 for details of the aforementioned available-for-sale financial assets provided as collateral as of December 31, 2012 and 2011.
E. On May 12, 2011, the Board of Directors have approved the issuance of the initial unsecured exchangeable corporate bonds at the first time. To be in compliance with relevant regulations regarding issuance and exchange, other than the below mentioned period, the bondholders have the right to exchange their bonds for Taiwan Business Bank (TBB) common stock at any time from October 12, 2011 to January 1, 2014, 15 business days prior to the date of stop transferring date of stock dividends, stop transferring date of cash dividends or

104
Financial Information
Financial Information
OUR VISION—being your best financial service partner
cash capital increase dividend to the rights distribution date. Starting from date of capital decrease proceedings to one day prior to trade date. Other periods cease TBB transferring pursuant to regulations. As a result, the Company has placed the available-for-sale financial asset, 517,242 ordinary shares of TBB with the Taiwan Depository & Clearing Corporation as the underlying exchanges in support of the exchangeable corporate bonds when needed. In addition, TBB common stocks held by the Company are scheduled to enter a trust agreement with Hua Nan Commercial Bank, Ltd. in which the stocks will be fully entrusted.
( 8 ) Held-to-maturity financial assets, net
December 31, 2012 December 31, 2011
NT$ US$ (Unaudited) NT$ Certificate of time deposit by Central Bank $ 141,300,000 $ 4,866,540 $ 118,200,000
Financial bonds 13,128,901 452,175 10,892,492
Government bonds 3,511,481 120,940 1,800,027
Corporate bonds 2,835,659 97,663 397,696
Total $ 160,776,041 $ 5,537,318 $ 131,290,215
A. Please refer to Note 6 for details of the aforementioned held-to-maturity financial assets pledged as collateral as of December 31, 2012 and 2011.
B. MICB has held-to-maturity financial assets which consists of bonds and bills sold under repurchase agreements amounting to NT$0 thousand (US$0 thousand) and NT$796,564 thousand as of December 31, 2012 and 2011, respectively.
( 9 ) Equity investments accounted for by the equity method, net
December 31, 2012 December 31, 2011
Investee Company NT$
US$ (Unaudited)
Percentage ofShareholding NT$
Percentage ofShareholding
Mega Management Consulting Corporation $ 62,541 $ 2,154 100.00 $ 55,578 100.00
Mega International Investment Services Co., Ltd. 23,872 822 100.00 35,355 100.00
Mega Life Insurance Agency Co., Ltd. 202,164 6,963 100.00 121,989 100.00
Win Card Co., Ltd. 68,806 2,370 100.00 68,891 100.00
Cathay Investment & Warehousing Ltd. 89,749 3,091 100.00 96,414 100.00
ICBC Assets management & consulting Co., Ltd. 275,545 9,490 100.00 281,260 100.00
Ramlett Finance Holdings Inc. - - 100.00 - 100.00
Cathay Insurance Co., Inc, (Philippines) (Note) - - - 3,735 86.46
China Products Trading Company 34,460 1,187 68.27 37,046 25.25
United Venture Corporation 32,832 1,131 25.31 26,081 25.31
China Products Trading Company (Thailand) 14,067 484 25.25 31,942 25.25
IP Fundseven Limited 168,495 5,803 25.00 226,248 25.00
An Feng Enterprise Co., Ltd. 11,930 411 25.00 11,803 25.00
Taiwan Bills Finance Corporation 1,406,164 48,430 24.55 1,390,834 24.55
Everstrong Iron & Foundry & Mfg. Corporation 42,262 1,455 22.22 39,509 22.22
China Real Estate Management Co., Ltd. 235,009 8,094 20.00 121,709 20.00
Total $ 2,667,896 $ 91,885 $ 2,548,394Note: Cathay Insurance Company, Inc. has completed the liquidation procedure overseas and is pending for approval of the subsidiary’s Board of Director.
A. The capital surplus arising from changes in capital surplus of investees accounted for by the equity method were NT$377,964 thousand (US$13,018 thousand) and NT$379,097 thousand as of December 31, 2012 and 2011, respectively.
B. As of December 31, 2012 and 2011, equity investments accounted for by the equity method were not pledged as collateral.
C. Part of equity investments accounted for under equity method and investment income and losses as of December 31, 2012 and 2011, are recognized based on unaudited financial statements of the same period. Income and losses recognized as of December 31, 2012 and 2011, amounted to NT$132,994 thousand (US$4,580 thousand) and NT$43,252 thousand, respectively; However, the amounts were not significant.

Financial Information
1052012 ANNUAL REPORT
( 10 ) Other financial assets, net
December 31, 2012 December 31, 2011
NT$ US$ (Unaudited) NT$Financial assets carried at cost $ 17,650,547 $ 607,906 $ 18,239,504
Debt investments with no active market 4,000,000 137,765 4,000,000
Margin deposits from client 1,926,527 66,352 1,953,113
Futures margin deposits 129,631 4,465 -
Remittance purchased 24,335 838 83,953
Non-accrual loans transferred from accounts other than loans 292,304 10,067 709,393
Others 82,431 2,839 25,884
Subtotal 24,105,775 830,232 25,011,847
Less: Accumulated impairment-Financial assets carried at cost ( 2,044,816 ) ( 70,426 ) ( 1,690,982 )
Allowance for bad debts-Remittance purchased ( 206 ) ( 7 ) ( 449 )
Allowance for bad debts-Non-accrual loans transferred from accounts other than loans ( 176,156 ) ( 6,067 ) ( 447,050 )
Subtotal ( 2,221,178 ) ( 76,500 ) ( 2,138,481 )
Net $ 21,884,597 $ 753,732 $ 22,873,366
A. The bad debt expenses of reversal due to remittance acquired and non-loan transferred to overdue accounts for the years ended December 31, 2012 and 2011 amounted to NT$213,895 thousand (US$7,367 thousand) and NT$68,159 thousand, respectively.
B. Please refer to Note 6 for details of the above other financial assets provided as collateral.
( 11 ) Property and equipment, net
December 31, 2012
RevaluationIncrement
Accumulated Depreciation
Accumulated Impairment
Net BookValueCost
( In Thousands of NT Dollars ) Land $ 10,903,821 $ 4,648,659 $ - ( $ 592,261 ) $ 14,960,219
Buildings and structures 12,603,774 37,015 ( 5,953,904 ) ( 49,497 ) 6,637,388
Machinery and computers 4,351,929 - ( 3,628,889 ) - 723,040
Office equipment 22,078 - ( 18,486 ) - 3,592
Transportation equipment 200,710 - ( 167,925 ) - 32,785
Miscellaneous equipment 1,627,830 - ( 1,363,504 ) - 264,326
Leasehold improvements 249,960 - ( 186,651 ) - 63,309
Subtotal 29,960,102 4,685,674 ( 11,319,359 ) ( 641,758 ) 22,684,659
Prepayments for equipment 20,489 - - - 20,489
Total $ 29,980,591 $ 4,685,674 ( $ 11,319,359 ) ( $ 641,758 ) $ 22,705,148

106
Financial Information
Financial Information
OUR VISION—being your best financial service partner
December 31, 2012
CostRevaluationIncrement
Accumulated Depreciation
Accumulated Impairment
Net BookValue
( In Thousands of US Dollars) (Unaudited)Land $ 375,541 $ 160,105 $ - ( $ 20,398 ) $ 515,248
Buildings and structures 434,089 1,275 ( 205,060 ) ( 1,705 ) 228,600
Machinery and computers 149,886 - ( 124,983 ) - 24,902
Office equipment 760 - ( 637 ) - 124
Transportation equipment 6,913 - ( 5,784 ) - 1,129
Miscellaneous equipment 56,064 - ( 46,961 ) - 9,104
Leasehold improvements 8,609 - ( 6,428 ) - 2,180
Subtotal 1,031,862 161,380 ( 389,852 ) ( 22,103 ) 781,287
Prepayments for equipment 705 - - - 705
Total $ 1,032,567 $ 161,380 ( $ 389,852 ) ( $ 22,103 ) $ 781,992
December 31, 2011
RevaluationIncrement
Accumulated Depreciation
Accumulated Impairment
Net BookValueCost
( In Thousands of NT Dollars ) Land $ 10,891,896 $ 3,134,896 $ - ( $ 626,292 ) $ 13,400,500
Buildings and structures 12,513,836 37,015 ( 5,742,163 ) ( 45,583 ) 6,763,105
Machinery and computers 4,281,518 - ( 3,476,180 ) - 805,338
Office equipment 24,459 - ( 20,022 ) - 4,437
Transportation equipment 215,213 - ( 175,931 ) - 39,282
Miscellaneous equipment 1,631,680 - ( 1,337,463 ) - 294,217
Leasehold improvements 244,997 - ( 177,432 ) - 67,565
Subtotal 29,803,599 3,171,911 ( 10,929,191 ) ( 671,875 ) 21,374,444
Prepayments for equipment 42,133 - - - 42,133
Total $ 29,845,732 $ 3,171,911 ( $ 10,929,191 ) ( $ 671,875 ) $ 21,416,577
A. MICB and its indirect subsidiaries revalued the land and other property and equipment based on related government regulations. As of December 31, 2012 and 2011, the revaluation increment for land and other property and equipment amounted to NT$4,685,674 thousand (US$161,380 thousand) and NT$3,171,911 thousand, respectively, and were recorded under “property and equipment”. Reserve for land revaluation increment tax amounted to NT$1,242,402 thousand (US$42,790 thousand) and NT$846,416 thousand, and was recorded under “other liabilities”.
B. Please refer to Note 6 for details of the property and equipment pledged as collateral as of December 31, 2012 and 2011.

Financial Information
1072012 ANNUAL REPORT
( 12 ) Other assets
December 31, 2012 December 31, 2011
NT$ US$ NT$Prepayments $ 6,045,656 $ 208,220 $ 3,004,939
Reinsurance reserve assets 2,748,167 94,650 2,996,956
Refundable deposits 1,363,789 46,971 2,347,561
Restricted assets 916,303 31,559 436,571
Guarantee deposits held for operation and funds for security settlements 1,262,587 43,485 2,071,544
Deferred income tax assets 1,576,967 54,313 1,257,127
Other deferred assets 25,052 863 24,766
Idle assets, net 1,281,952 44,152 1,149,763
Securities brokerage debit accounts, net 41,274 1,421 173,695
Foreclosed properties 88,925 3,062 116,642
Rental assets, net 1,246,102 42,917 620,824
Temporary payments 560,963 19,320 775,024
Others 132,309 4,557 150,135
Total $ 17,290,046 $ 595,490 $ 15,125,547
A. As of December 31, 2012 and 2011, MITC has set aside impairment loss from cash reserves for securitization both amounting to NT$400,620 thousand (US$13,234 thousand).
B. Please refer to Note 6 for details of the above other assets provided as collateral as of December 31, 2012 and 2011.
( 13 ) Due to the Central Bank and financial institutions
December 31, 2012 December 31, 2011
NT$ US$ (Unaudited) NT$Due to the Central Bank $ 270,862,843 $ 9,328,839 $ 291,175,916
Due to Chunghwa Post 4,459,521 153,591 3,824,875
Overdrafts on banks 2,877,754 99,113 246,887
Call loans from banks 56,504,475 1,946,082 63,832,329
Borrowing 24,278,042 836,165 8,468,671
Total $ 358,982,635 $ 12,363,790 $ 367,548,678
( 14 ) Funds borrowed from the Central Bank and other banks
December 31, 2012 December 31, 2011
NT$ US$ (Unaudited) NT$Funds borrowed from the Central Bank $ 7,712,106 $ 265,614 $ 8,988,504
Other funds borrowed from the Central Bank 52,836,795 1,819,762 62,884,896
Total $ 60,548,901 $ 2,085,376 $ 71,873,400
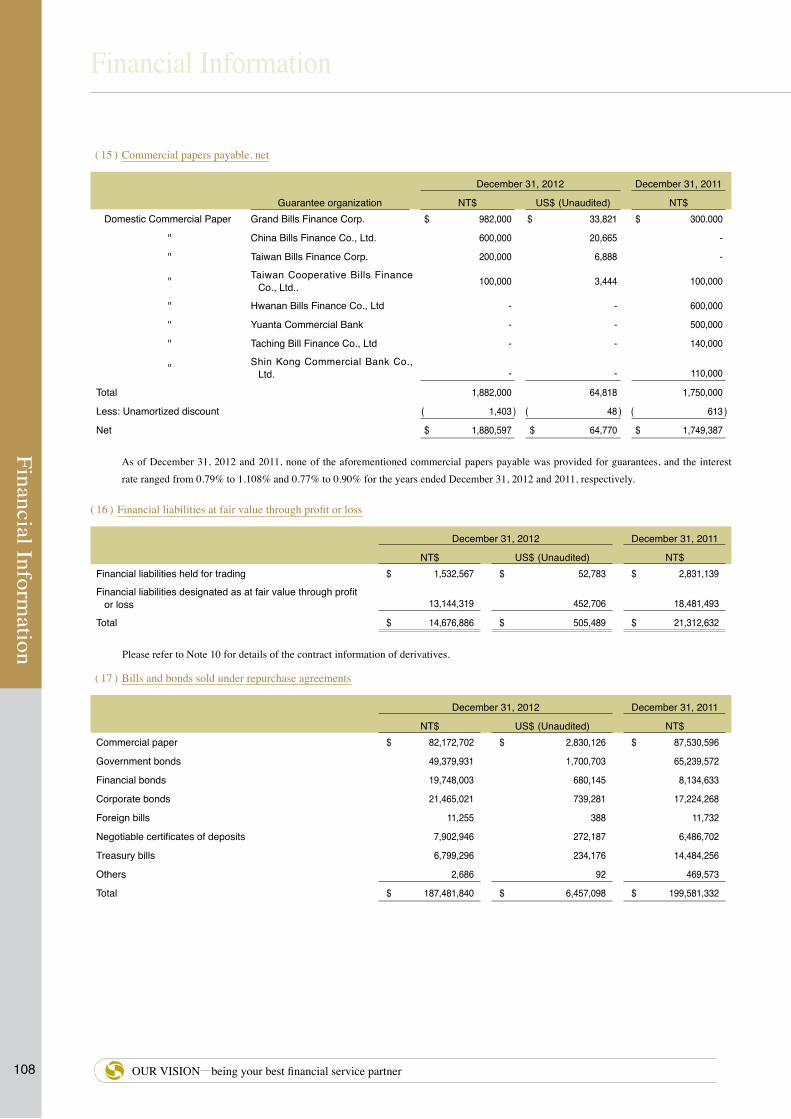
108
Financial Information
Financial Information
OUR VISION—being your best financial service partner
( 15 ) Commercial papers payable, net
December 31, 2012 December 31, 2011
Guarantee organization NT$ US$ (Unaudited) NT$Domestic Commercial Paper Grand Bills Finance Corp. $ 982,000 $ 33,821 $ 300.000
" China Bills Finance Co., Ltd. 600,000 20,665 -
" Taiwan Bills Finance Corp. 200,000 6,888 -
" Taiwan Cooperative Bills Finance Co., Ltd.. 100,000 3,444 100,000
" Hwanan Bills Finance Co., Ltd - - 600,000
" Yuanta Commercial Bank - - 500,000
" Taching Bill Finance Co., Ltd - - 140,000
" Shin Kong Commercial Bank Co., Ltd.
-
-
110,000
Total 1,882,000 64,818 1,750,000
Less: Unamortized discount ( 1,403 ) ( 48 ) ( 613 )
Net $ 1,880,597 $ 64,770 $ 1,749,387
As of December 31, 2012 and 2011, none of the aforementioned commercial papers payable was provided for guarantees, and the interest rate ranged from 0.79% to 1.108% and 0.77% to 0.90% for the years ended December 31, 2012 and 2011, respectively.
( 16 ) Financial liabilities at fair value through profit or loss
December 31, 2012 December 31, 2011
NT$ US$ (Unaudited) NT$Financial liabilities held for trading $ 1,532,567 $ 52,783 $ 2,831,139
Financial liabilities designated as at fair value through profit or loss
13,144,319
452,706
18,481,493
Total $ 14,676,886 $ 505,489 $ 21,312,632
Please refer to Note 10 for details of the contract information of derivatives.
( 17 ) Bills and bonds sold under repurchase agreements
December 31, 2012 December 31, 2011
NT$ US$ (Unaudited) NT$Commercial paper $ 82,172,702 $ 2,830,126 $ 87,530,596
Government bonds 49,379,931 1,700,703 65,239,572
Financial bonds 19,748,003 680,145 8,134,633
Corporate bonds 21,465,021 739,281 17,224,268
Foreign bills 11,255 388 11,732
Negotiable certificates of deposits 7,902,946 272,187 6,486,702
Treasury bills 6,799,296 234,176 14,484,256
Others 2,686 92 469,573
Total $ 187,481,840 $ 6,457,098 $ 199,581,332

Financial Information
1092012 ANNUAL REPORT
( 18 ) Payables
December 31, 2012 December 31, 2011
NT$ US$ (Unaudited) NT$Accounts payable $ 9,692,164 $ 333,810 $ 10,010,836
Accrued expenses 4,523,924 155,809 4,354,990
Interest payable 2,555,678 88,021 2,448,225
Taxes payable 4,383,284 150,966 3,610,255
Dividends payable 16,365,163 563,636 15,367,660
Acceptances 12,586,872 433,507 10,934,044
Collections for others 1,348,041 46,428 1,098,846
Commissions payable 117,873 4,060 132,356
Due from other insurers 968,189 33,345 951,221
Payables on proceeds from short sales 1,578,638 54,370 1,917,298
Margin loans from other securities lenders 1,896,160 65,306 2,224,071
Customers’ purchase payable 56,152 1,934 396,421
Futures traders’ equity 1,895,219 65,273 1,906,168
Other payables 3,142,060 108,216 3,161,694
Total $ 61,109,417 $ 2,104,681 $ 58,514,085
( 19 ) Deposits and remittances
December 31, 2012 December 31, 2011
NT$ US$ (Unaudited) NT$Checking account deposits $ 31,742,251 $ 1,093,241 $ 32,086,542
Demand deposits 493,910,715 17,010,874 455,070,843
Time deposits 631,164,357 21,738,053 568,690,295
Savings deposits 544,493,964 18,753,021 523,506,939
Remittances 16,897,458 581,968 9,206,348
Total $ 1,718,208,745 $ 59,177,157 $ 1,588,560,967
( 20 ) Bonds payable
December 31, 2012 December 31, 2011
NT$ US$ (Unaudited) NT$Domestic unsecured corporate bonds $ 12,600,000 $ 433,959 $ 12,900,000
Unsecured exchangeable corporate bonds 6,000,000 206,647 6,000,000
Less: exchangeable corporate bond discount ( 50,332 ) ( 1,733 ) ( 98,941 )
Subtotal 18,549,668 638,873 18,801,059
Financial bonds, net 43,900,000 1,511,968 42,600,000
Total $ 62,449,668 $ 2,150,841 $ 61,401,059

110
Financial Information
Financial Information
OUR VISION—being your best financial service partner
A. Domestic unsecured corporate bonds were as follows:
The Company
Name of bond Issuingperiod
Interestrate
Total issued amount(NT$)
December 31, 2012(NT$)
December 31, 2012(US$)
December 31, 2011(NT$)
Remark
First domestic unsecured corporate bonds-Bond C
2007.10.25-2012.10.25 2.80% $ 300,000 $ - $ - $ 300,000
Interest is paid yearly. The principal is repaid at maturity.
Second domestic unsecured corporate bonds-Bond C
2008.02.04-2013.02.04 2.78% 2,000,000 2,000,000 68,883 2,000,000
Interest is paid yearly. The principal is repaid at maturity.
First domestic unsecured corporate bonds-Bond C
2008.05.13-2013.05.13 2.75% 1,800,000 1,800,000 61,994 1,800,000
Interest is paid yearly. The principal is repaid at maturity.
First domestic unsecured corporate bonds-Bond D
2008.05.13-2013.05.13
Floating rateNote 1 300,000 300,000 10,332 300,000
Interest is paid quarterly. The principal is repaid at maturity.
Second domestic unsecured corporate bonds-Subordinate
2008.12.26-2015.12.26 3.26% 6,000,000 6,000,000 206,647 6,000,000
Interest is paid yearly. The principal is repaid at maturity.
Total $ 10,100,000 $ 347,856 $ 10,400,000
Note 1: Floating rate + 0.25%. (Note)Note: Floating rate is based on the fixing rate of 90 day TWD BACP based on page 6165 screenshot of Thomson Reuters at 11 a.m.
MS
Name of bond Issuingperiod
Interestrate
Total issued amount(NT$)
December 31, 2012(NT$)
December 31, 2012(US$)
December 31, 2011(NT$)
Remark
First domestic unsecured corporate bonds
2010.02.24-2013.02.14 1.45% $ 2,500,000 $ 2,500,000 $ 86,130 $ 2,500,000
Interest is paid yearly. The principal is repaid at maturity.
B. Unsecured exchangeable corporate bonds were as follows:
The Company
Name of bond Issuingperiod
Interestrate
Total issued amount(NT$)
December 31, 2012(NT$)
December 31, 2012(US$)
December 31, 2011(NT$)
Remark
First domestic unsecured exchangeable corporate bonds
2011.07.11-2014.01.11 0% $ 6,000,000 $ 5,949,668 $ 204,914 $ 5,901,059 Note
Note: the main issue policy and exchange procedure of the swap bonds are as follows:i.Collateral:
The exchangeable bonds are unsecured bonds. In the event that issue of secured exchangeable corporation bond or private equity over the same underlying securities, common stocks of Taiwan Business Bank (hereinafter referred to as TBB), collateral rights of the same degree or foreclosed asset under same priority should be clarified in accordance with the classification of secured exchangeable corporate bond.
ii.Term and date of repayment:The Company shall repay 100% of principal amount of the bonds by cash at maturity. Except for those being redeemed, exchanged, purchased and cancelled.
iii.Underlying securities :Please refer to Note 4(7) for TBB common stocks held by the Company.

Financial Information
1112012 ANNUAL REPORT
iv.Exchange period: Other than the below mentioned periods, the bondholders may exercise the right to exchange their bond for TBB common shares at any time on and after October 12, 2011 (the first day after bonds being issued for 3 months) to January 1, 2014 (10 days before maturity): 15 business days prior to the date of stock dividends stop transferring date, cash dividends or cash capital increase dividend stop transferring date to the right distributed date. Effective date of capital decrease proceedings to one day prior to preference share transaction date. And other periods temporarily cease TBB common stocks from transferring pursuant to regulations.
v.Exchange price and adjustmentWith the effective date of exchange price set on July 1, 2011, choose any average amount of the closing market prices on one business day, three business days or five business days prior to the effective date. Based on the benchmark price and multiply by 118.72% (rounded to one decimal place). If there is any ex-right or ex-dividend being executed before effective date, the closing market price of exchangeable prices adopted should be accounted as price after ex-right or ex-dividend at inception. In the event of ex-right or ex-dividend being executed before the actual issue date or after price being determined, the exchange price should be adjusted by the formula. Pursuant to the above method, the effective price, $10.95 dollars per share was determined at the average closing market price of TTB common stocks on one business day prior to effective date. As of December 31, 2012, the exchange price of the bond was $11.6 dollars per share.
vi. Redemption of the exchangeable bonda) From October 12, 2011 to December 2, 2013, if the closing price of TBB common stocks exceeds 30% of the exchange price in continuous 30
business days, the Company may redeem the bonds at principal amount in the terms of exchange by cash within 30 business days.b) From October 12, 2011(the first day after bonds issued for 3 months) to December 2, 2013 (40 days before maturity), the the Company may
redeem the bonds at principal amount in the terms of exchange by cash if at least 90% in principal amount of the bonds has already been exchanged, redeemed or purchased and cancelled.
vii. As of December 31, 2012, the Company did not repurchase any exchangeable corporation bonds from Gre Tai Securities, nor did any bondholders exercise the option.
C. Financial bonds issued by MICB were as follows:
Name of bond Issuingperiod
Interestrate
Total issued amount(NT$)
December 31, 2012(NT$)
December 31, 2012(US$)
December 31, 2011(NT$)
Remark
96-1Development Financial bond
2007.09.27-2014.09.27
Floating rateNote 1 $ 5,000,000 $ 5,000,000 $ 172,206 $ 5,000,000
Interest is paid yearly. The principal is repaid at maturity.
96-3Development Financial bond
2007.12.28-2014.12.28 2.99% 300,000 300,000 10,332 300,000
Interest is paid yearly. The principal is repaid at maturity.
96-4Development Financial bond
2007.12.28-2014.12.28
Floating rateNote 2 400,000 400,000 13,776 400,000
Interest is paid yearly. The principal is repaid at maturity.
97-4Development Financial bond
2008.06.26-2015.06.26
Floating rateNote 3 6.000,000 6,000,000 206,647 6,000,000
Interest is paid yearly. The principal is repaid at maturity.
97-8Development Financial bond
2008.09.29-2015.09.29 3.00% 1,600,000 1,600,000 55,106 1,600,000
Interest is paid yearly. The principal is repaid at maturity.
97-9Development Financial bond
2008.12.23-2015.12.23 3.00% 6,400,000 6,400,000 220,424 6,400,000
Interest is paid yearly. The principal is repaid at maturity
99-1Development Financial bond
2010.12.24-2017.12.24 1.53% 10,300,000 10,300,000 354,744 10,300,000
Interest is paid yearly. The principal is repaid at maturity
100-1Development Financial bond
2011.04.15-2018.04.15 1.65% 4,700,000 4,700,000 161,874 4,700,000
Interest is paid yearly. The principal is repaid at maturity
100-2Development Financial bond
2011.11.24-2018.11.24 1.65% 7,900,000 7,900,000 272,085 7,900,000
Interest is paid yearly. The principal is repaid at maturity.
101-1Development Financial bond
2012.05.28-2019.05.18 1.48% 1,300,000 1,300,000 44,774 -
Interest is paid yearly. The principal is repaid at maturity.
Total $ 43,900,000 $ 1,511,968 $ 42,600,000Note 1: Floating rate + 0.34% (Note)Note 2: Floating rate + 0.40% (Note)Note 3: Floating rate + 0.43% (Note)Note: Floating rate is based on the fixing rate of 90 day TWD BACP based on page 6165 screenshot of Thomson Reuters at 11 a.m.
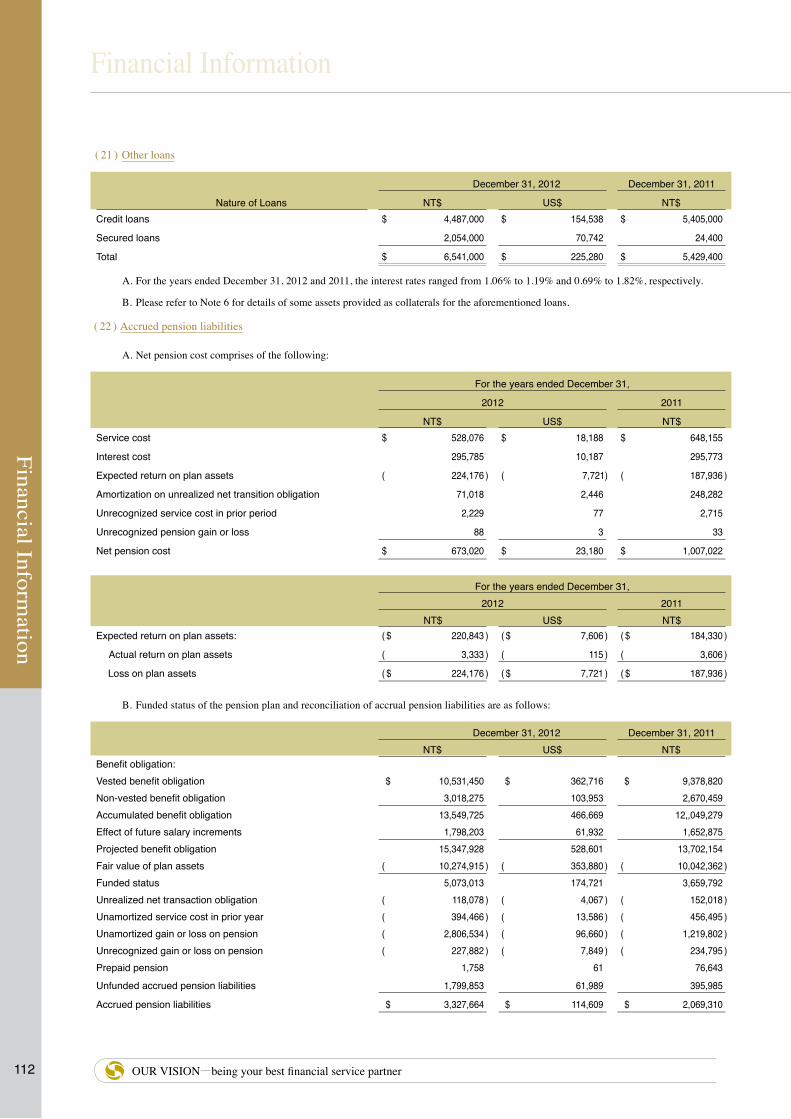
112
Financial Information
Financial Information
OUR VISION—being your best financial service partner
( 21 ) Other loans
December 31, 2012 December 31, 2011
Nature of Loans NT$ US$ NT$ Credit loans $ 4,487,000 $ 154,538 $ 5,405,000
Secured loans 2,054,000 70,742 24,400
Total $ 6,541,000 $ 225,280 $ 5,429,400
A. For the years ended December 31, 2012 and 2011, the interest rates ranged from 1.06% to 1.19% and 0.69% to 1.82%, respectively.
B. Please refer to Note 6 for details of some assets provided as collaterals for the aforementioned loans.
( 22 ) Accrued pension liabilities
A. Net pension cost comprises of the following:
For the years ended December 31,
2012 2011
NT$ US$ NT$Service cost $ 528,076 $ 18,188 $ 648,155
Interest cost 295,785 10,187 295,773
Expected return on plan assets ( 224,176 ) ( 7,721) ( 187,936 )
Amortization on unrealized net transition obligation 71,018 2,446 248,282
Unrecognized service cost in prior period 2,229 77 2,715
Unrecognized pension gain or loss 88 3 33
Net pension cost $ 673,020 $ 23,180 $ 1,007,022
For the years ended December 31, 2012 2011
NT$ US$ NT$Expected return on plan assets: ( $ 220,843 ) ( $ 7,606 ) ( $ 184,330 )
Actual return on plan assets ( 3,333 ) ( 115 ) ( 3,606 )
Loss on plan assets ( $ 224,176 ) ( $ 7,721 ) ( $ 187,936 )
B. Funded status of the pension plan and reconciliation of accrual pension liabilities are as follows:
December 31, 2012 December 31, 2011 NT$ US$ NT$
Benefit obligation:Vested benefit obligation $ 10,531,450 $ 362,716 $ 9,378,820Non-vested benefit obligation 3,018,275 103,953 2,670,459Accumulated benefit obligation 13,549,725 466,669 12,,049,279Effect of future salary increments 1,798,203 61,932 1,652,875Projected benefit obligation 15,347,928 528,601 13,702,154Fair value of plan assets ( 10,274,915 ) ( 353,880 ) ( 10,042,362 ) Funded status 5,073,013 174,721 3,659,792Unrealized net transaction obligation ( 118,078 ) ( 4,067 ) ( 152,018 ) Unamortized service cost in prior year ( 394,466 ) ( 13,586 ) ( 456,495 ) Unamortized gain or loss on pension ( 2,806,534 ) ( 96,660 ) ( 1,219,802 ) Unrecognized gain or loss on pension ( 227,882 ) ( 7,849 ) ( 234,795 ) Prepaid pension 1,758 61 76,643
Unfunded accrued pension liabilities 1,799,853 61,989 395,985
Accrued pension liabilities $ 3,327,664 $ 114,609 $ 2,069,310

Financial Information
1132012 ANNUAL REPORT
C. Actuarial assumptions
December 31, 2012 December 31, 2011Discount rate 1.25%-2.00% 1.50% ~ 2.25%Expected rate of return on plan assets 1.25%-2.00% 1.50% ~ 2.25%Rate of compensation increase 1.16%-2.25% 2.25% ~ 3.00%
D. Effective July 1, 2005, the Company has established a funded defined contribution pension plan (the “New Plan”) under the Labor Pension Act (the “Act”). Employees have the option to be covered under the New Plan. Under the New Plan, the Company contributes monthly an amount based on 6% of the employees’ monthly salaries and wages to the employees’ individual pension accounts at the Bureau of Labor Insurance. The payment of pension benefits is based on the employees’ individual pension fund accounts and the cumulative profit in such accounts, and the employees can choose to receive such pension benefits monthly or in lump sum. The pension costs under the defined contribution pension plan for the years ended December 31, 2012 and 2011 were NT$166,201 thousand (US$5,724 thousand) and NT$148,761 thousand, respectively.
( 23 ) Reserves for operations and liabilities
December 31, 2012 December 31, 2011NT$ US$ NT$
Reserves for insurance business $ 8,270,155 $ 284,834 $ 8,532,270Reserves for guarantee liabilities 6,574,514 226,434 5,032,725Other reserves 37,453 1,290 45,473
Total $ 14,882,122 $ 512,558 $ 13,610,468
Bad debts expense resulting from reserves for guarantee liabilities provided by MICB and MBF for the years ended December 31, 2012 and 2011 amounted to NT$1,584,744 thousand (US$25,830 thousand) and NT$878,267 thousand, respectively.
( 24 ) Other financial liabilities
December 31, 2012 December 31, 2011NT$ US$ NT$
Structured deposits $ 7,764,231 $ 267,409 $ 9,976,851Appropriated loan fund 2,024,132 69,714 2,636,999Appropriations for loans 2 - 6
Structured instruments 44,592 1,536 6,198
Total $ 9,832,957 $ 338,659 $ 12,620,054
( 25 ) Other liabilities
December 31, 2012 December 31, 2011NT$ US$ NT$
Advance receipt $ 2,199,688 $ 75,760 $ 1,893,667Receipts under custody 177,995 6,130 158,631Temporary receipts and suspense accounts 4,213,054 145,103 4,361,280Land increment duty reserves 1,242,402 42,790 846,416Refundable deposits 3,465,624 119,360 3,003,535Other liabilities to be settled 381,868 13,152 395,183Accounts under custody 124,070 4,273 147,625Deferred revenue 108,893 3,750 117,556
Others 27,985 964 28,544
Total $ 11,941,579 $ 411,282 $ 10,952,437

114
Financial Information
Financial Information
OUR VISION—being your best financial service partner
( 26 ) Capital stock
A. As of December 31, 2012 and 2011, the Company’s authorized capital was NT$120 billion for both years and the Company’s issued capital was NT$114,498,240 thousand and NT$112,806,148 consisting of 11,449,824 thousand shares and 11,280,615 thousand shares, respectively, with a par value of NT$10 per share.
B. The stockholders at the stockholders’ meeting on June 15, 2011 resolved that the Company transfer earnings to increase capital by issuing new stocks amounting to NT$1,692,092 thousand (recognized as “stock dividends distributable”) and divided into 169,209 thousand shares. The capital increase has been approved by Jin-Guan-Zheng-Fa-Zi Letter No. 1000031536 dated July 23, 2012. After the capital increase, the paid-in capital amounted to NT$114,498,240 thousand, divided into 11,449,824 thousand shares.
( 27 ) Capital surplus
A. The capital surplus of the Company consisted of consolidation premium from share exchange and accumulated adjustments on paid-in capital from investments under equity method.
December 31, 2012 December 31, 2011NT$ US$ NT$
Consolidation surplus arising from share conversion $ 43,047,306 $ 1,482,600 $ 43,047,306Changes in additional paid-in capital of investees accounted
for by the equity method
377,964
13,018
379,097
$ 43,425,270 $ 1,,495,618 $ 43,426,403
B. As of December 31, 2012, the capital reserve of the Company provided by undistributed earnings of MICB (formerly CTB and ICBC) before conversion has amounted to $3,265,237 thousand. The portion was not used for cash dividends, capital increase or any other purposes for the year ended in December 31, 2012.
C. In accordance with Explanatory Note (96) No. 344, capital surplus originally included in subsidiaries’ stockholders’ equity and in which related to assets and liabilities were reclassified to an adjustment account in the stockholders’ equity when parent company recognized the capital surplus due to share swap. In subsequent periods, when subsidiaries derecognize the asset and liability accounts, the Company also should derecognize the corresponding adjustment account in the stockholders’ equity.
( 28 ) Appropriation of earnings and dividend policy
A. According to the Company’s Articles of Incorporation, the current year’s earnings, if any, shall first be used to pay all taxes and offset prior year’s operating loss, and the remaining amount should then be set aside as legal reserve and special reserve in accordance with provisions under the applicable laws and regulations. The remaining earnings (including reversible special reserve) are then distributed as follows: (1) 0.02% to 0.16% as bonuses to employees (2) not more than 0.5% as remuneration to Directors, and (3) the remaining earnings plus prior year’s accumulated unappropriated earnings are subject to the Board of Directors’ decision to propose a distribution plan and to be submitted for approval of the stockholders at the stockholders’ meeting.
Cash dividends should exceed 50% of the total distributed amount, and the remainder will be in the form of stock dividends.
Bonus to employees range from 0.02% to 0.16% of the total distributed amount and can be distributed in the form of cash or stocks based on the stockholders’ resolution. Employees of the affiliated companies may be entitled to the Company’s stock bonus at the Board’s discretion.
B. The legal reserve is to be used exclusively to offset any deficit or to increase capital by issuing new shares or to distribute cash dividends to original shareholders in proportion to the number of shares being held by each of them and is not to be used for any other purposes. For the legal reserve to be used for issuing new shares or distributing cash dividends, only the portion of the legal reserve exceeding 25% of paid-in capital may be capitalized or released.
C. Under Article 41-1 of the Securities and Exchange Act, special reserve can be used to recover accumulated deficits and under Article 239 of Company Law of the R.O.C., a company shall not use the capital reserve to recover its capital loss, unless the surplus reserve is insufficient to recover such loss. However, the annual net income after income taxes should first be used to recover accumulated deficits, and the remaining amount should then be set aside as special reserve. The remaining earnings are then distributed to stockholders.
D. Appropriation of the 2011 earnings was resolved by the Board of Directors and approved by the stockholders on April 24, 2012 and June 15, 2012, respectively. Appropriation of the 2010 earnings was resolved by the Board of Directors and approved by the stockholders on April 26, 2011 and June 28, 2011, respectively. Details of the earnings appropriation for 2011 and 2010 are set forth below:
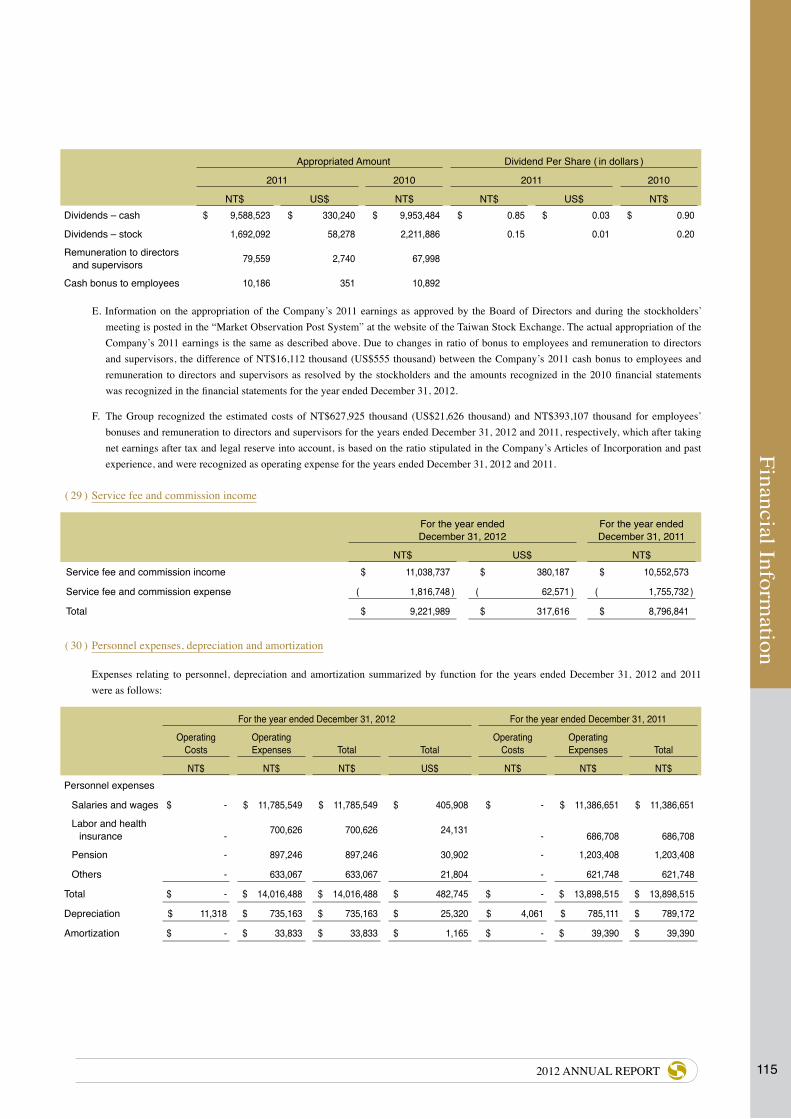
Financial Information
1152012 ANNUAL REPORT
Appropriated Amount Dividend Per Share ( in dollars )
2011 2010 2011 2010
NT$ US$ NT$ NT$ US$ NT$Dividends – cash $ 9,588,523 $ 330,240 $ 9,953,484 $ 0.85 $ 0.03 $ 0.90
Dividends – stock 1,692,092 58,278 2,211,886 0.15 0.01 0.20
Remuneration to directors and supervisors 79,559 2,740 67,998
Cash bonus to employees 10,186 351 10,892
E. Information on the appropriation of the Company’s 2011 earnings as approved by the Board of Directors and during the stockholders’ meeting is posted in the “Market Observation Post System” at the website of the Taiwan Stock Exchange. The actual appropriation of the Company’s 2011 earnings is the same as described above. Due to changes in ratio of bonus to employees and remuneration to directors and supervisors, the difference of NT$16,112 thousand (US$555 thousand) between the Company’s 2011 cash bonus to employees and remuneration to directors and supervisors as resolved by the stockholders and the amounts recognized in the 2010 financial statements was recognized in the financial statements for the year ended December 31, 2012.
F. The Group recognized the estimated costs of NT$627,925 thousand (US$21,626 thousand) and NT$393,107 thousand for employees’ bonuses and remuneration to directors and supervisors for the years ended December 31, 2012 and 2011, respectively, which after taking net earnings after tax and legal reserve into account, is based on the ratio stipulated in the Company’s Articles of Incorporation and past experience, and were recognized as operating expense for the years ended December 31, 2012 and 2011.
( 29 ) Service fee and commission income
For the year endedDecember 31, 2012
For the year endedDecember 31, 2011
NT$ US$ NT$Service fee and commission income $ 11,038,737 $ 380,187 $ 10,552,573
Service fee and commission expense ( 1,816,748 ) ( 62,571 ) ( 1,755,732 )
Total $ 9,221,989 $ 317,616 $ 8,796,841
( 30 ) Personnel expenses, depreciation and amortization
Expenses relating to personnel, depreciation and amortization summarized by function for the years ended December 31, 2012 and 2011 were as follows:
For the year ended December 31, 2012 For the year ended December 31, 2011
OperatingCosts
OperatingExpenses Total Total
Operating Costs
OperatingExpenses Total
NT$ NT$ NT$ US$ NT$ NT$ NT$Personnel expenses
Salaries and wages $ - $ 11,785,549 $ 11,785,549 $ 405,908 $ - $ 11,386,651 $ 11,386,651
Labor and health insurance
- 700,626 700,626 24,131
- 686,708 686,708
Pension - 897,246 897,246 30,902 - 1,203,408 1,203,408
Others - 633,067 633,067 21,804 - 621,748 621,748
Total $ - $ 14,016,488 $ 14,016,488 $ 482,745 $ - $ 13,898,515 $ 13,898,515
Depreciation $ 11,318 $ 735,163 $ 735,163 $ 25,320 $ 4,061 $ 785,111 $ 789,172
Amortization $ - $ 33,833 $ 33,833 $ 1,165 $ - $ 39,390 $ 39,390

116
Financial Information
Financial Information
OUR VISION—being your best financial service partner
( 31 ) Income taxes
The income taxes of the Group is computed in accordance with SFAS No. 22, “Accounting for Income Taxes” on an individual basis. However, their annual returns on corporate income tax and the 10% tax surcharge on surplus retained earnings are filed jointly under Article 49 of the Financial Holding Company Act and the relevant provisions of the Income Tax Law. The receipts (disbursements) arising from the joint tax return scheme are recorded as “other receivables (payables)”, and adjustments are made on a reasonable, systematic, and consistent basis to the current year’s deferred income tax assets (liabilities) or income tax refundable (payable) based on the above amount of receipts (disbursements). The amount recorded under “other receivables (payables)” is eliminated from the consolidated financial statements.
A. The income taxes comprise the following:
For the year endedDecember 31, 2012
For the year endedDecember 31, 2011
Item NT$ US$
NT$Income tax at the statutory tax rate $ 4,392,065 $ 151,268 $ 3,589,636
Tax effect of permanent differences ( 1,884,369 ) ( 64,900 ) ( 620,421 )
Effect of loss reserves transferred as special reserves - - 36,219
10% tax on undistributed earnings 465,075 16,018 144,887
Income tax expenses – foreign branch 794,269 27,356 443,557
Net change in deferred income tax assets and liabilities 319,840 11,016 ( 201,029 )
Prepaid and withholding taxes ( 1,668,997 ) ( 57,483 ) ( 1,503,537 )
Income tax payable 2,417,883 83,275 1,889,312
Separate income tax 53 2 133
Net change in deferred income tax assets and liabilities ( 319,840 ) ( 11,016 ) 201,029
Prepaid and withholding taxes 1,668,997 57,482 1,503,537
Effect of consolidated income tax return system and over provision of prior year’s income tax
524,970 18,081
( 164,189 )
Income tax expense $ 4,292,063 $ 147,824 $ 3,429,822
B. Deferred income taxes as of December 31 2012 and 2011 consisted of deferred income tax assets - net (shown as other assets), as follows:
December 31, 2012 December 31, 2011
NT$ US$ NT$( A ) Total deferred income tax assets $ 2,612,131 $ 89,965 $ 2,097,912
( B ) Total deferred income tax liabilities ($ 630,860 ) ($ 21,728 ) ($ 773,065 )
( C ) Valuation allowance for deferred income tax assets ($ 404,304 ) ($ 13,925 ) ($ 67,720 )
( D ) Temporary differences resulting in deferred income tax assets and liabilities :
Pension expenses $ 1,731,761 $ 59,644 $ 1,326,856
Unrealized foregin exchange gains ( 965,655 ) ( 33,258 ) ( 1,061,056 )
Miscellaneous reserves 13,304 458 8,444
Allowance for doubtful accounts 5,410,862 186,357 3,174,765
Provision for impairment losses 228,812 7,881 219,460
Provision for investments losses 3,993,024 137,524 3,988,264
Foreign investees recognized under equity method ( 2,440,458 ) ( 84,052 ) ( 2,135,701 )
Net changes in deferred income tax assets incurred by foreign branches 1,267,986 43,671 1,590,482
Unrealized gains on financial instruments ( 236,096 ) ( 8,132 ) ( 1,105,095 )
Unrealized expense and loss from structured notes securitization 881,083 30,345 1,017,277
Others 1,769,914 60,958 769,510
$ 11,654,537 $ 401,396 $ 7,793,206

Financial Information
1172012 ANNUAL REPORT
C. Imputation tax credit
December 31, 2012 December 31, 2011
NT$ US$ NT$Balance of imputation tax credit $ 1,748,228 $ 60,211 $ 1,273,599
2011 2010 Estimated (actual) tax credit rate for individual stockholders (Note) 16.55% 19.59%
Note: The tax credit rate for individual stockholders is computed as follows:
Stockholders’ account balance of imputation tax credit as of the dividend distribution date
Cumulative unappropriated retained earnings recorded in the books (including capital surplus arising from the subsidiaries’ unappropriated earnings for 1998 and the years between 1998 and the share swap)
The abovementioned balance of imputation on tax credit and tax credit rate for individual stockholders are from the Company’s information.
D. Unappropriated retained earnings
December 31, 2012 December 31, 2011
NT$ US$ NT$1998 and onwards $ 31,312,668 $ 1,078,446 $ 22,828,132
E. Assessment of income tax returns
( a ) The Company’s profit-seeking enterprise income tax return through 2006 has been assessed by the Tax Authority. According to the assessment, NT$5,129 thousand of additional tax assessed should be made by the Company. As the consolidated tax return system was adopted starting from 2003, the decreased tax refundable for the Company and the consolidated entity during the 2003 to 2006 were NT$201,174 thousand, NT$220,588 thousand and NT$856,968 thousand, respectively with the additional tax payable and increased tax refundable were NT$93,574 thousand, respectively. The Company disagreed with the 2002 to 2005 results and has filed for administrative remedy. The administration litigation in 2002, which has been rejected by the highest court, is seeking a constitutional interpretation. Regarding the re-examination for 2003, some have been rejected by the Tax Authority and is the in process of administrative petition. Re-examination for 2004 and 2005 have been filed.
(b) As of December 31, 2012, MICB’s income tax returns through 2006 have been examined by the NTA. Mega Bank did not agree with the assessment of 2004 to 2005 and the Company filed an appeal for reinvestigation of 2004 and 2005 income tax returns on behalf of MICB.
(c) As of December 31, 2012, MS’s income tax returns through 2006 have been examined by the NTA. MS did not agree with the NTA’s assessment for 2003 to 2005 income tax returns and the Company has filed for a tax appeal for re-investigation of 2004 and 2005 income tax returns. Reinvestigation case of 2003 income tax return was partially rejected and petition has been filed.
An additional income tax of NT$137,118 thousand (US$4,530 thousand) was levied by the NTA for 2000, 2001 and 2002 income tax returns. MS did not agree with the assessments and filed for administrative remedy.
(d) As of December 31, 2012, MBF’s income tax returns through 2006 have been examined by the NTA.
(e) As of December 31, 2012, CKI’s income tax returns through 2006 have been examined by the NTA. CKI did not agree with the NTA’s assessment for 2004 to 2005 income tax returns and the Company has filed for a tax appeal for re-investigation of 2004 to 2005 income tax returns on behalf of CKI.
(f) As of December 31, 2012, MAM’s income tax returns through 2006 have been assessed by the NTA.
(g) As of December 31, 2012, MITC’s income tax returns through 2008 have been assessed by the NTA.
(h) As of December 31, 2012, Mega Venture Capital’s income tax returns through 2006 have been assessed by the NTA.

118
Financial Information
Financial Information
OUR VISION—being your best financial service partner
( 32 ) Earnings per share ( EPS )
Effective January 1, 2008, as employees’ bonus could be distributed in the form of stock, the diluted EPS computation shall include those estimated shares that would be increased from employees’ stock bonus issuance in the weighted-average number of common shares outstanding during the reporting year, which take into account the dilutive effects of stock bonus on potential common shares; whereas, basic EPS shall be calculated based on the weighted-average number of common shares outstanding during the reporting year that include the shares of employees’ stock bonus for the appropriation of prior year earnings, which have already been resolved at the stockholders’ meeting held in the reporting year.
A. Basic earnings per share
( In thousands of shares ) For the year ended December 31, 2012 For the year ended December 31, 2011Weighted-average number of shares outstanding 11,449,824 11,449,824
For the year ended December 31, 2012
For the year endedDecember 31, 2011
Pre-tax After-tax Pre-tax After-tax
( In thousands of dollars ) NT$ US$ NT$ US$ NT$ NT$Consolidated net income $ 25,835,677 $ 889,812 $ 21,543,614 $ 741,988 $ 21,115,504 $ 17,685,682Consolidated net income
attributed to:Stockholders of the Company $ 21,533,141 $ 741,627 $ 17,679,892
Minority interest 10,473 361 5,790
$ 21,543,614 v741,988 $ 17,685,682
For the year ended December 31, 2012
For the year endedDecember 31, 2011
Pre-tax After-tax Pre-tax After-tax
( In dollars ) NT$ US$ NT$ US$ NT$ NT$Basic earnings per share
Consolidated net income $ 2.26 $ 0.08 $ 1.88 $ 0.06 $ 1.84 $ 1.54
For the year ended December 31, 2012For the year endedDecember 31, 2011
( In dollars )NT$ US$ NT$
Consolidated after-tax basic earnings per share attributed to:Stockholders of the Company $ 1.88 $ 0.06 $ 1.54Minority interest - - -
$ 1.88 $ 0.06 $ 1.54
B. Diluted earnings per share
( In thousands of shares ) For the year ended December 31, 2012 For the year ended December 31, 2011
Weighted-average number of shares outstanding 11,450,515 11,451,088
For the year ended December 31, 2012
For the year endedDecember 31, 2011
Pre-tax After-tax Pre-tax After-tax( In thousands of dollars ) NT$ US$ NT$ US$ NT$ NT$Consolidated net income $ 25,835,677 $ 889,812 $ 21,543,614 $ 741,988 $ 21,115,504 $ 17,685,682Consolidated net income
attributed to:Stockholders of the Company $ 17,679,892 $ 608,917 $ 17,679,892
Minority interest 5,790 199 5,790
$ 17,685,682 $ 609,116 $ 17,685,682

Financial Information
1192012 ANNUAL REPORT
For the year ended December 31, 2012
For the year endedDecember 31, 2011
Pre-tax After-tax Pre-tax After-tax
( In dollars ) NT$ US$ NT$ US$ NT$ NT$Basic earnings per share
Consolidated net income $ 2.26 $ 0.08 $ 1.88 $ 0.06 $ 1.87 $ 1.54
For the year ended December 31, 2012For the year endedDecember 31, 2011
( In dollars )NT$ US$ NT$
Consolidated after-tax basic earnings per share attributed to:Stockholders of the Company $ 1.88 $ 0.06 $ 1.54Minority interest - - -
$ 1.88 $ 0.06 $ 1.54
( 33 ) Asset impairment loss
For the year ended December 31, 2012For the year endedDecember 31, 2011
NT$ US$ NT$Financial assets carried at cost $ 501,406 $ 17,269 $ 378,004Recovered gain from property and equipment ( 30,117 ) ( 1,037 ) ( 286,345 )(Recovered gain) impairment loss on idle assets ( 15,640 ) ( 539 ) 17,268Available-for-sale financial assets 49,183 1,694 86,831
$ 504,832 $ 17,387 $ 195,758
( a ) An impairment loss amounting to NT$501,406 thousand (US$17,269 thousand) and NT$378,004 thousand has been recognized by MICB and MBF due to a financial asset carried at cost, investees operating at a loss continually for the years ended December 31, 2012 and 2011.
(b) Impairment reversal gains of fixed assets for the years ended December 31, 2012 and 2011 were recognized in the amounts of NT$30,117 thousand (US$1,037 thousand), and NT$286,345 by MICB and MS because the assessed recoverable amount of land and buildings was higher than the book value. The recoverable amount is based on an external appraisal report adopted by MICB and MS.
(c) Recovered gain of idle assets for the year ended December 31, 2012 was recognized in the amount of NT$15,709 thousand (US$541 thousand), by MICB because the assessed recoverable amount of land and buildings was higher than the book value. Impairment loss of idle assets for the year ended December 31, 2011 was recognized in the amounts of NT$17,268 thousand (US$595 thousand), by MICB because the assessed recoverable amount of land and buildings was lower than the book value. The recoverable amount is based on an external appraisal report adopted by MICB.
(d) Impairment loss of idle assets for the year ended December 31, 2012 was recognized in the amounts of NT$69 thousand (US$2 thousand), by MS because the assessed recoverable amount of land and buildings was lower than the book value. The recoverable amount is based on an external appraisal report adopted by MS.
(e) Owing to the fact that the estimated recoverable amount is lower than the carrying amount of the avaiable-for-sale financial assets, the subsidiary, MICB, recognized impairment loss amounting to NT$49,183 thousand (US$1,694 thousand) and NT$86,831 thousand in 2012 and 2011, respectively.

120
Financial Information
Financial Information
OUR VISION—being your best financial service partner
5. RELATED PARTY TRANSACTIONS( 1 ) Names of the related parties and their relationship with the Company
Names of the related parties Relationship with the Company
Chunghwa Post Co., Ltd. (Chunghwa Post) Supervisor of the Company (Note 1)
Bank of Taiwan (BOT) Supervisor of the Company (Note 1)
Mega Life Insurance Agency Co., Ltd. (MLIAC) Subsidiary of the Company
Mega International Securities Investment Consulting Co., Ltd. (MISIC) Indirect subsidiary of the Company
Win Card Co., Ltd. (Win Card) Indirect subsidiary of the Company
Taiwan Bills Finance Corporation (TFC) MICB is the director of TFC
Taiwan Business Bank (TBB) The Company is TBB’s corporate supervisor (Note 2)
Taiwan Integrated Shareholder Service Company (Taiwan Integrated Shareholder) Taiwan Integrated Shareholder’s chairman is also the chairman of MS
Alexander Leed Risk Services, Inc. (Alexander Leed Risk Services)
Alexander Leed’s chairman is also one of the directors of the Company’s subsidiary (Note 3)
International Bills Finance Corporation (IBF) The Company’s subsidiary is the supervisor of IBF’s parent (Waterland Financial Holdings)
Other related parties The Company’s and subsidiary’s directors, supervisors, managers,their relatives, associated companies and related parties in substance
Note1: Chunghwa Post and BOT were the supervisors of the Company; however, under the resolution of the stockholders’ meeting of the Company, they are nominated as directors starting from June 15, 2012.
Note2: The Company was the corporate supervisor of the Taiwan Business Bank who shall no longer be the related party of the Company after its resignation on May 25, 2012 (please see Note 5(2) for the related transactions summarized as of May 25, 2012).
Note3: Alexander Leed’s chairman was also one of the directors of the Company, but resigned on March 7, 2011; therefore, Alexander Leed is no longer the Company’s related party starting from March 7, 2011.
( 2 ) Significant transactions and balances with related parties
Related party transactions with an amount exceeding $100 million (US$3.10 million) are set forth below:
A. Deposits
Details of the related parties’ deposits placed with MICB and recorded under “deposits and remittances” are as follows:
December 31, 2012 December 31, 2011
NT$ US$ NT$Others ( individual amounts accounting for less than 10%
of the total amount ) $ 64,619,410 $ 2,225,569 $ 56,490,913
B. Credits extended
Details of the credits extended to the related parties by MICB and recorded under “bills, discounts and loans” are as follows:
December 31, 2012 December 31, 2011
NT$ US$ NT$Others ( individual amounts accounting for less than 10%
of the total amount ) $ 116,892,962 $ 4,025,933 $ 129,873,081
C. Bank deposits
December 31, 2012 December 31, 2011
NT$ US$ NT$TBB (Note) $ - $ - $ 65,503
Chunghwa Post 8,130 280 -
BOT 320,981 11,055 545,511
Total $ 329,111 $ 11,335 $ 611,014
Note: As 5(1), TBB is no longer the company’s related party from May 25, 2012.

Financial Information
1212012 ANNUAL REPORT
D. Refundable deposits
December 31, 2012 December 31, 2011
Collaterals NT$ US$ NT$
BOT Available-for-sale financial assets-government bonds $ 100,446 $ 3,460 $ 104,593
E. Purchase of securities and bonds
For the year ended December 31, 2012 For the year ended December 31, 2011
NT$ US$ NT$Chunghwa Post $ 451,389 $ 15,546 $ 52,473
Terms and conditions on the above transactions are not materially different from those with non-related parties.
F. Sales of securities and bonds
For the year ended December 31, 2012 For the year ended December 31, 2011
NT$ US$ NT$BOT $ 52,481,692 $ 1,807,532 $ 61,293,781
Chunghwa Post 99,005,880 3,409,880 68,235,045
Total $ 151,487,572 $ 5,217,412 $ 129,528,826
Terms and conditions on the above transactions are not materially different from those with non-related parties.
G. Securities and bonds with repurchase/ resale agreement
December 31, 2012 December 31, 2011
NT$ US$ NT$BOT $ 1,646,212 $ 56,698 $ 574,597
Others 15,527 535 5,006
Total $ 1,661,739 $ 57,233 $ 579,603
Terms and conditions on the above transactions are not materially different from those with non-related parties.
H. Transactions with other financial institutions
( a ) Due from banks/call loans to banks
December 31, 2012 December 31, 2011
NT$ % of the Account US$ NT$ % of the AccountIBF $ 720,000 0.48 $ 24,798 $ - -
BOT 10,778 0.01 371 21,063 0.01
Total $ 730,778 0.49 $ 25,169 $ 21,063 0.01
( b ) Overdraft on banks
December 31, 2012 December 31, 2011
NT$ % of the Account US$ NT$ % of the AccountChunghwa Post $ 6,374,158 1.78 $ 219,534 $ 3,984,533 1.08
BOT 1,812,750 0.50 62,433 426,310 0.12
Total $ 8,186,908 2.28 $ 281,967 $ 4,410,843 1.20
I. Commercial paper payable
December 31, 2012 December 31, 2011
Institutions of guarantee or acceptance NT$ US$ NT$TFC $ 200,000 $ 6,888 $ -

122
Financial Information
Financial Information
OUR VISION—being your best financial service partner
J. Other payables
December 31, 2012 December 31, 2011
NT$ US$ NT$MISIC $ 3,025 $ 104 $ 3,000
Chunghwa Post 604 21 -
Total $ 3,629 $ 125 $ 3,000
K. Collaterals
December 31, 2012 December 31, 2011
Collaterals NT$ US$ NT$BOT Available-for-sale financial assets – government bonds $ 3,310,218 $ 114,008 $ 4,129,971
Available-for-sale financial assets – corporate bonds 754,360 25,981 -
Total $ 4,064,578 $ 139,989 $ 4,129,971
L. LoansDecember 31, 2012 ( Expressed in thousands of NT dollars )
Types
Number of accounts or names
of related party
Default status Whether terms and conditions of the related party transactions
are different from those of transactions with third parties.
Highest balance
Ending balance
Normal loans
Overdue accounts Collateral
Consumer loans for employees 12 $ 8,107 $ 5,915 V - None None
Home mortgage loans 58 $ 474,521 $ 399,386 V - Real estate None
Other loans 1 $ 285,000 $ 210,000 V - Real estate None
December 31, 2012 ( Expressed in thousands of US dollars )
Types
Number of accounts or names
of related party
Default status Whether terms and conditions of the related party transactions
are different from those of transactions with third parties.
Highest balance
Ending balance
Normal loans
Overdue accounts Collateral
Consumer loans for employees 12 $ 279 $ 204 V - None None
Home mortgage loans 58 $ 16,343 $ 13,755 V - Real estate None
Other loans 1 $ 9,816 $ 7,233 V - Real estate None
December 31, 2011 ( Expressed in thousands of NT dollars )
Types
Number of accounts or names
of related party
Default status Whether terms and conditions of the related party transactions
are different from those of transactions with third parties.
Highest balance
Ending balance
Normal loans
Overdue accounts Collateral
Consumer loans for employees 14 $ 9,492 $ 6,467 V - None None
Home mortgage loans 49 $ 407,656 $ 302,191 V - Real estate None
Other loans 1 $ 339,810 $ 287,000 V - Real estate None
M. Service fee revenues
For the years ended December 31,
2012 2011
NT$ % of the Account US$ NT$ % of the AccountMISIC $ 718,472 7.79 $ 24,745 $ 407,010 4.63
The amount is the service fee revenue from policies sold by MICB on behalf of MLIAC.

Financial Information
1232012 ANNUAL REPORT
N. Interest revenue
For the years ended December 31,
2012 2011
NT$ % of the Account US$ NT$ % of the AccountBOT $ 2,948 0.01 $ 102 $ 4,321 0.01
IBF 2,780 0.01 96 971 -
TBB(Note) 95 - 3 175 -
Total $ 5,823 0.02 $ 201 $ 5,467 0.01
Note: As stated in Note 5(1), TBB is no longer the Company’s related party starting from May 25, 2012.
O. Interest expense
For the years ended December 31,
2012 2011
NT$ % of the Account US$ NT$ % of the AccountBOT $ 16,842 0.11 $ 580 $ 39,265 0.30
Chunghwa Post 61,188 0.42 2,107 62,530 0.47
Total $ 78,030 0.53 $ 2,687 $ 101,795 0.77
P. Income and losses of financial assets and liabilities measured at fair value through profit or loss:
For the years ended December 31,
2012 2011
NT$ % of the Account US$ NT$ % of the AccountBOT $ 7,598 0.32 $ 262 $ 4,314 0.66
Chunghwa Post 14,756 0.63 508 4,161 0.64
Total $ 22,354 0.95 $ 770 $ 8,475 1.30
Q. Information on remunerations to the Company’s key management:
For the years ended December 31,
2012 2011
NT$ US$ NT$Salaries $ 137,574 $ 4,738 $ 140,547
Bonus 57,576 1,983 76,790
Business expenses 23,757 818 25,187
Earnings distribution 103,378 3,561 86,099
Total $ 322,285 $ 11,100 $ 328,623
(a) Salaries represent salary, extra pay for duty, pension and severance pay.
(b) Bonus represents bonuses and rewards. The amounts listed for 2012 are estimated amounts and the amounts listed for 2011 are actual amounts distributed.
(c) Business expenses represent transportation expense, extraneous charges, subsidies and housing benefits and vehicles provided.
(d) Earnings distribution represents estimated remunerations to be paid to supervisors and directors and bonuses to be paid to employees. The amounts listed for 2012 are estimated amounts and the amounts listed for 2011 are actual amounts distributed.
(e) Please refer to the Company’s annual report for relevant information. The key management includes Director, Supervisors, President and Vice President.
R. Guarantees: None.

124
Financial Information
Financial Information
OUR VISION—being your best financial service partner
S. Disposal of non-performing loans for related party: None.
(a) MICB
The Bank put on an auction on May 8, 2012 for the non-performing loans, and signed a contract amounting to $828,511 thousand with Mega Asset on May 15, 2012. As of December 31, 2012, all receivables have been collected. The following table shows the details of non-performing loans:
(Expressed in thousands of NT dollars)
Loan component Loan amount(Note 1)
Carrying amount(Note 2)
Allocation of sale price(Note 3)
CorporateSecured $ 644,179 $ - $ 592,697
Unsecured 250,375 - 235,814
Individual
Secured
Mortgage loan - - -
Auto loan - - -
Others - - -
Unsecured
Credit card - - -
Cash card - - -
Micro credit loan - - -
Others - - -
Total $ 894,554 $ - $ 828,511
(Expressed in thousands of US dollars)
Loan component Loan amount(Note 1)
Carrying amount(Note 2)
Allocation of sale price(Note 3)
CorporateSecured $ 22,186 $ - $ 20,413
Unsecured 8,624 - 8,122
Individual
Secured
Mortgage loan - - -
Auto loan - - -
Others - - -
Unsecured
Credit card - - -
Cash card - - -
Micro credit loan - - -
Others - - -
Total $ 30,810 $ - $ 28,535
Note 1: The loan amount is the amount that a buyer may claim from the creditor, including the sum of balance of disposal on non-performing loan (the carrying amount before the deduction of allowance of doubtful debt) and written-off bad debt.
Note 2: The carrying amount is balance of origin loan amount after deduction of allowance of doubtful debt.Note 3: The sale price, $828,511 thousand (US$28,535 thousand) is the value before deduction of other necessary expenses. In addition,
relevant gains and losses on the transaction have been eliminated in the consolidated financial statements.
(b) MBF
The subsidiary, MBF, entered into a contract amounting to $802,264 thousand for selling the non-performing loans (the underlying loan is $2,468,654 thousand) with the subsidiary, MAM for the first half year in 2012. All payables have been paid and the relevant details are as follows:
(Expressed in thousands of NT dollars)
Loan component Loan amount (Note 1)
Carrying amount(Note 2)
Evaluation of recoveredestimate on loan disposal
Gains and losseson disposal
Secured 3 advancements oncommercial paper guaranteed $ 929,902 $ - $ 802,263 $ 802,263
Unsecured 35 advancements oncommercial papers guaranteed 1,538,752 - 1 1
Total $ 2,468,654 $ - $ 802,264 $ 802,264
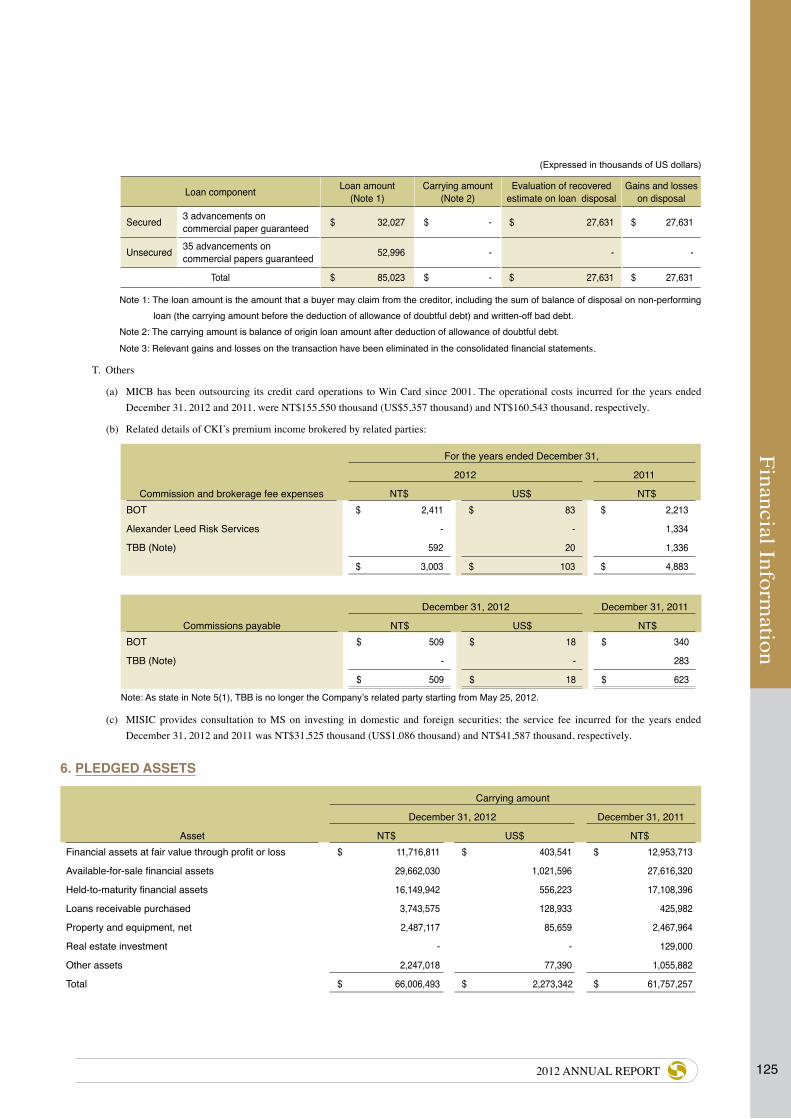
Financial Information
1252012 ANNUAL REPORT
(Expressed in thousands of US dollars)
Loan component Loan amount (Note 1)
Carrying amount(Note 2)
Evaluation of recoveredestimate on loan disposal
Gains and losseson disposal
Secured 3 advancements oncommercial paper guaranteed $ 32,027 $ - $ 27,631 $ 27,631
Unsecured 35 advancements oncommercial papers guaranteed 52,996 - - -
Total $ 85,023 $ - $ 27,631 $ 27,631
Note 1: The loan amount is the amount that a buyer may claim from the creditor, including the sum of balance of disposal on non-performing loan (the carrying amount before the deduction of allowance of doubtful debt) and written-off bad debt.
Note 2: The carrying amount is balance of origin loan amount after deduction of allowance of doubtful debt.Note 3: Relevant gains and losses on the transaction have been eliminated in the consolidated financial statements.
T. Others
(a) MICB has been outsourcing its credit card operations to Win Card since 2001. The operational costs incurred for the years ended December 31, 2012 and 2011, were NT$155,550 thousand (US$5,357 thousand) and NT$160,543 thousand, respectively.
(b) Related details of CKI’s premium income brokered by related parties:
For the years ended December 31,
2012 2011
Commission and brokerage fee expenses NT$ US$ NT$ BOT $ 2,411 $ 83 $ 2,213
Alexander Leed Risk Services - - 1,334
TBB (Note) 592 20 1,336
$ 3,003 $ 103 $ 4,883
December 31, 2012 December 31, 2011
Commissions payable NT$ US$ NT$ BOT $ 509 $ 18 $ 340
TBB (Note) - - 283
$ 509 $ 18 $ 623Note: As state in Note 5(1), TBB is no longer the Company’s related party starting from May 25, 2012.
(c) MISIC provides consultation to MS on investing in domestic and foreign securities; the service fee incurred for the years ended December 31, 2012 and 2011 was NT$31,525 thousand (US$1,086 thousand) and NT$41,587 thousand, respectively.
6. PLEDGED ASSETS
Carrying amount
December 31, 2012 December 31, 2011
Asset NT$ US$ NT$ Financial assets at fair value through profit or loss $ 11,716,811 $ 403,541 $ 12,953,713
Available-for-sale financial assets 29,662,030 1,021,596 27,616,320
Held-to-maturity financial assets 16,149,942 556,223 17,108,396
Loans receivable purchased 3,743,575 128,933 425,982
Property and equipment, net 2,487,117 85,659 2,467,964
Real estate investment - - 129,000
Other assets 2,247,018 77,390 1,055,882
Total $ 66,006,493 $ 2,273,342 $ 61,757,257

126
Financial Information
Financial Information
OUR VISION—being your best financial service partner
7. COMMITMENTS AND CONTINGENT LIABILITIES
( 1 ) The Subsidiaries-MICB
( a ) As of December 31, 2012 and 2011, MICB’s commitments and contingent liabilities were as follows:
December 31, 2012 December 31, 2011
NT$ US$ NT$ Irrevocable arranged financing limit $ 13,115,928 $ 451,728 $ 118,177,482Securities sold under repurchase agreement 17,402,875 599,376 7,344,251Securities purchased under resale agreement 4,430,450 152,590 349,810Credit card line commitments 48,524,062 1,671,227 48,633,007Guarantees issued 245,546,272 8,456,906 253,425,720Accrued guarantees issued 20,500 706 20,500Letters of credit 73,897,743 2,545,126 84,783,914Customers’ securities under custody 162,693,100 5,603,344 168,590,517Properties under custody 3,146,649 108,374 2,583,822Guarantee received 78,734,787 2,711,720 78,859,468Collections for customers 119,332,518 4,109,954 129,974,708Agency loans payable 2,718,707 93,636 3,295,483Travelers’ checks consigned-in 2,030,376 69,929 1,910,638Gold coins consigned-in 455 16 468Payables on consignments-in 2,853 98 3,122Agent for government bonds 128,021,800 4,409,223 124,991,200Short-dated securities under custody 42,262,342 1,455,565 53,279,185Investments for customers 265,016 9,128 265,016Trust liability 461,313,402 15,888,183 438,442,953Certified notes paid 7,751,073 266,956 9,018,776
Risk assumption payment 2,445,515 84,227 -
Total $ 1,413,656,423 $ 48,688,012 $ 1,523,950,040
( b ) Lease agreement is signed respectively with other companies or individuals according to the proportion of office and buildings. The rentals are calculated based on actual housing unit and paid on a monthly, semi-annually basis. All the agreements shall be subsequently due before the end of December 2023 and may be renewed upon maturity. The subsidiary has paid deposits amounting to $131,532 thousand dollars (listed under other assets). Rentals payable for the succeeding five-year period is as follows:
Amount
Year NT$ US$2013 $ 407,148 $ 14,023
2014 300,886 10,363
2015 243,554 8,388
2016 109,346 3,766
2017 and onwards 64,875 2,234
Total $ 1,125,809 $ 38,774
( 2 ) The subsidiaries-MS
( a ) MS has entered into proxy delivery agreements with several securities firms. If MS is unable to fulfill its obligations to the Taiwan Stock Exchange, the proxies must act upon the said obligations. MS has reciprocated by agreeing to act as the proxy for the securities firms.
(b) MS has entered into several operating lease agreements for its branch offices. As of December 31, 2011, the annual minimum rents payable (excluding the adjustments for the consumer price index) for the next five years were as follows:

Financial Information
1272012 ANNUAL REPORT
Amount
Year NT$ US$ 2013 $ 76,330 $ 2,629
2014 45,217 1,557
2015 24,335 838
2016 14,460 498
2017 and onwards 6,883 237
Total $ 167,225 $ 5,759
(c) Hontex International Holdings Company Limited, guaranteed and endorsed by the subsidiary, Mega Capital (Asia) Co. Ltd. (MCA) of the Company’s indirect subsidiary, Mega Securities Holding Co. Ltd, obtained an interim court order to freeze assets on March 30, 2010, as the Securities and Futures Commission (SFC) commenced proceedings against Hontex. Amongst other things, Hontex allegedly contained materially false or misleading information in breach of the “Securities and Futures Ordinance”. In addition, FSC asked LiangXiang, Hong to buy back the subscription of IPO or shares traded in the market from the investors on June 20, 2012. Hontex International Holdings Company Limited issued repurchase invitation to the stockholders on September 24, 2012. As Hontex International Holdings Company Limited has assumed the obligation of repurchase, MCA considered that the possibility to compensate for losses of the investors is highly unlikely.
As a result of the above incident, the indirect subsidiary was forced to revoke the license for providing supervisory financial advice and incurred a HK$42 million fine through the disciplinary action of SFC on April 22, 2012. The indirect subsidiary has recognized the
losses accordingly.
( 3 ) The subsidiaries-MBF
As of December 31, 2012 and 2011, MBF’s commitments and contingent liabilities arising from its normal course of business were as follows:
December 31, 2012 December 31, 2011
NT$ US$ NT$Bills and bonds sold under repurchase agreements $ 159,376,775 $ 5,489,126 $ 184,993,275
Guarantees for commercial papers 141,622,600 4,877,651 134,979,200
Buy fixed rate financial paper 4,531,000 156,053 275,000
Sell fixed rate financial paper 600,000 20,665 -
Buy index rate financial paper 22,090,000 760,806 21,215,000
( 4 ) The subsidiaries-Mega Venture Capital
Mega Management Consulting Corporation acts as an agent to deal with management, investment, assignment and re-investment of all assets on behalf of Mega Venture Capital and conduct enterprise operation, management and consultation service for Mega Venture Capital’s investee companies. In accordance with the contract, Mega Venture Capital should pay 2% per annum of the total issued capital as management fee which is payable quarterly to Mega Management Consulting Corporation. At the end of every fiscal year, 20% of net income calculated based on the terms of contracts are paid as performance-based bonus which is payable within 15 days of the completion of general shareholders’ meeting.
( 5 ) The subsidiaries- Mega I Venture
Mega Management Consulting Corporation acts as an agent to deal with management, investment, assignment and re-investment of all assets on behalf of Mega I Venture and conduct enterprise operation, management and consultation service for Mega I Venture’s investee companies. In accordance with the contract, Mega I Venture should pay 1.7% per annum of average of beginning year and ending year of the total issued capital stock as management fee which is payable quarterly to Mega Management Consulting Corporation. At the end of every fiscal year, 20% of net income calculated based on the terms of contracts are paid as performance-based bonus which is payable within 15 days of the completion of general shareholders’ meeting.
8. SIGNIFICANT DISASTER LOSSNone.

128
Financial Information
Financial Information
OUR VISION—being your best financial service partner
9. SIGNIFICANT SUBSEQUENT EVENTSNone.
10. OTHERS
( 1 ) Presentation of financial statements
Certain accounts of the December 31, 2011 consolidated financial statements have been reclassified to conform to the presentation of the December 31, 2012 consolidated financial statements.
( 2 ) Financial instruments information:
A. Fair Value
December 31, 2012 December 31, 2011
NT$ US$ NT$
CarryingValue
FairValue
CarryingValue
FairValue
CarryingValue
FairValue
Non-derivative financial instrumentsAssets
Cash and cash equivalents $ 313,462,564 $ 313,462,564 $ 10,796,024 $ 10,796,024 $ 322,992,872 $ 322,992,872Due from the Central Bank and call loans to banks 150,956,137 150,956,137 5,199,109 5,199,109 180,399,521 180,399,521Financial assets held for trading
Stocks 4,207,762 4,207,762 144,920 144,920 5,144,175 5,144,175Commercial papers 93,373,492 93,373,492 3,215,894 3,215,894 96,933,023 96,933,023Bankers’ acceptances 2,681 2,681 92 92 - -Treasury bills 8,549,546 8,549,546 294,457 294,457 16,092,460 16,092,460Foreign currency bills 11,276 11,276 388 388 11,723 11,723Beneficiary certificates 206,338 206,338 7,107 7,107 65,192 65,192Negotiable certificates of timedeposit 22,788,609 22,788,609 784,867 784,867 17,853,217 17,853,217Corporate bonds 11,021,222 11,021,222 379,584 379,584 11,461,186 11,461,186Government bonds 5,840,572 5,840,572 201,156 201,156 2,460,859 2,460,859Financial bonds 200,142 200,142 6,893 6,893 200,856 200,856Other bonds - - - - 613,189 613,189
Financial assets designated at fair value through profit or loss
Corporate bonds 26,170,745 26,170,745 901,352 901,352 23,396,815 23,396,815Governments bonds 602,582 602,582 20,754 20,754 790,899 790,899Financial bonds 7,175,694 7,175,694 247,139 247,139 7,513,845 7,513,845
Bills and bonds purchased under resale agreements 2,282,053 2,282,053 78,597 78,597 1,460,685 1,460,685Receivables-net 125,593,058 125,593,058 4,325,575 4,325,575 107,160,487 107,160,487Bills discounted and loans-net 1,502,490,860 1,502,490,860 51,747,576 51,747,576 1,462,054,154 1,462,054,154Available-for-sale financial assets
Stocks 16,994,191 16,994,191 585,300 585,300 16,148,222 16,148,222Commercial papers 49,572,351 49,572,351 1,707,331 1,707,331 6,176,759 6,176,759Governments bonds 61,009,103 61,009,103 2,101,226 2,101,226 77,571,383 77,571,383Corporate bonds 42,195,968 42,195,968 1,453,279 1,453,279 25,260,079 25,260,079Beneficiary certificates 1,012,943 1,012,943 34,887 34,887 634,461 634,461Beneficiary securities 4,503,377 4,503,377 155,102 155,102 4,763,902 4,763,902Certificate of time deposits 545,232 545,232 18,778 18,778 617,701 617,701Financial bonds 44,792,426 44,792,426 1,542,705 1,542,705 30,260,456 30,260,456

Financial Information
1292012 ANNUAL REPORT
December 31, 2012 December 31, 2011
NT$ US$ NT$
CarryingValue
FairValue
CarryingValue
FairValue
CarryingValue
FairValue
Held-to-maturity financial assets 160,776,041 160,776,041 5,537,318 5,537,318 131,290,215 131,290,215Other financial assets 21,884,597 21,884,597 753,732 753,732 23,289,566 23,289,566
LiabilitiesDue to the Central Bank and financial institutions 358,982,635 358,982,635 12,363,790 12,363,790 367,548,678 367,548,678Funds borrowed from the Central Bank and other banks 60,548,901 60,548,901 2,085,376 2,085,376 71,873,400 71,873,400Financial liabilities held for
trading 1,532,567 1,532,567 52,783 52,783 2,831,139 2,831,139
Financial liabilities at fair valuethrough profit or loss 13,144,319 13,144,319 452,706 452,706 18,481,493 18,481,493
Bills and bonds sold under repurchased agreements 187,481,840 187,481,840 6,457,098 6,457,098 199,581,332 199,581,332Commercial papers payable, net 1,880,597 1,880,597 64,770 64,770 1,749,387 1,749,387Payables 61,109,417 61,109,417 2,104,681 2,104,681 58,514,085 58,514,085Deposits and remittances 1,718,208,745 1,718,208,745 59,177,157 59,177,157 1,588,560,967 1,588,560,967Bonds payable 62,449,668 62,449,668 2,150,841 2,150,841 61,401,059 61,401,059Other borrowings 6,541,000 6,541,000 225,280 225,280 5,429,400 5,429,400Other financial liabilities 9,832,957 9,832,957 338,659 338,659 12,620,054 12,620,054
Non-hedging derivative financial instrumentsForward contracts $ 94,123,949 ($ 116,010 ) $ 3,241,741 ($ 3,996 ) $ 79,484,469 $ 435,360Interest rate swap contracts 166,163,236 ( 460,617 ) 5,722,860 ( 15,864 ) 108,790,240 ( 1,199,002 )Cross currency contracts 25,805,287 ( 317,240 ) 888,765 ( 10,926 ) 17,957,654 367,795Asset swap contracts 15,025,844 ( 295,979 ) 517,508 ( 10,194 ) 13,331,909 340,743Options 28,910,447 ( 1,861,530 ) 995,710 ( 64,113 ) 30,514,754 ( 1,370,036 )Credit default swaps 10,346,331 70,235 356,340 2,419 12,108,800 ( 591,180 )Currency swaps 484,847,630 286,329 16,698,730 9,862 461,300,417 584,585Futures trading 185,344 185,344 6,383 6,383 118,554 118,554
B. The assumptions and methods adopted by the Group to estimate the fair values of the above financial instruments are summarized below.
( a ) The fair values of short-term financial instruments are approximated using their carrying value. Since they are either short-term in nature and the estimated future receipts or payments are closely related to their carrying value, it is reasonable that their fair value be determined based on their carrying value. This method applies to cash and cash equivalents, due from the Central Bank and call loans to banks, bills and bonds purchased under resale agreements, receivables, due to the Central Bank and financial institutions, payables, remittances, funds borrowed from the Central Bank and other banks and other financial liabilities.
(b) When there is a quoted market price available in an active market for financial assets at fair value through profit or loss, available-for-sale financial assets and held-to-maturity financial assets, the fair value is determined using the market price. If there is no quoted market price for reference, a valuation technique will be adopted to measure the fair value. The estimation and assumption of the valuation technique used by the Group is consistent with those used by the market participants for financial instrument pricing. The discount rate used is consistent with the expected return rate of the financial instruments that have the same conditions and characteristics. Such conditions and characteristics include the debtor’s credit rating, the remaining period of the fixed interest rate contracts, the remaining period for principal repayment, the payment currency, etc.
For open-end funds, fair value is determined based on the net asset value of the given fund at the balance sheet date. For beneficiary securities, fair value is determined based on the discounted value of expected future cash flows at the balance sheet date or the market price provided by Bloomberg, Reuters or counterparties. For bonds listed on TSE or OTC, fair value is determined based on the latest transaction price of Automatic Order Matching and Execution System in OTC or the “fair value of bonds” bulletined in OTC. For those bonds which are not listed on the TSE or OTC, fair value is determined based on discounted cash flow technique at the balance sheet date or the market price provided by Bloomberg, Reuters or counterparties. For derivative financial instruments held for trading purpose, fair value is determined based on a quoted market price in an active market at the balance sheet date. If a quoted market price in an active market is not available, fair value is determined by applying other valuation techniques, such as discounted cash flow analysis or option pricing models.
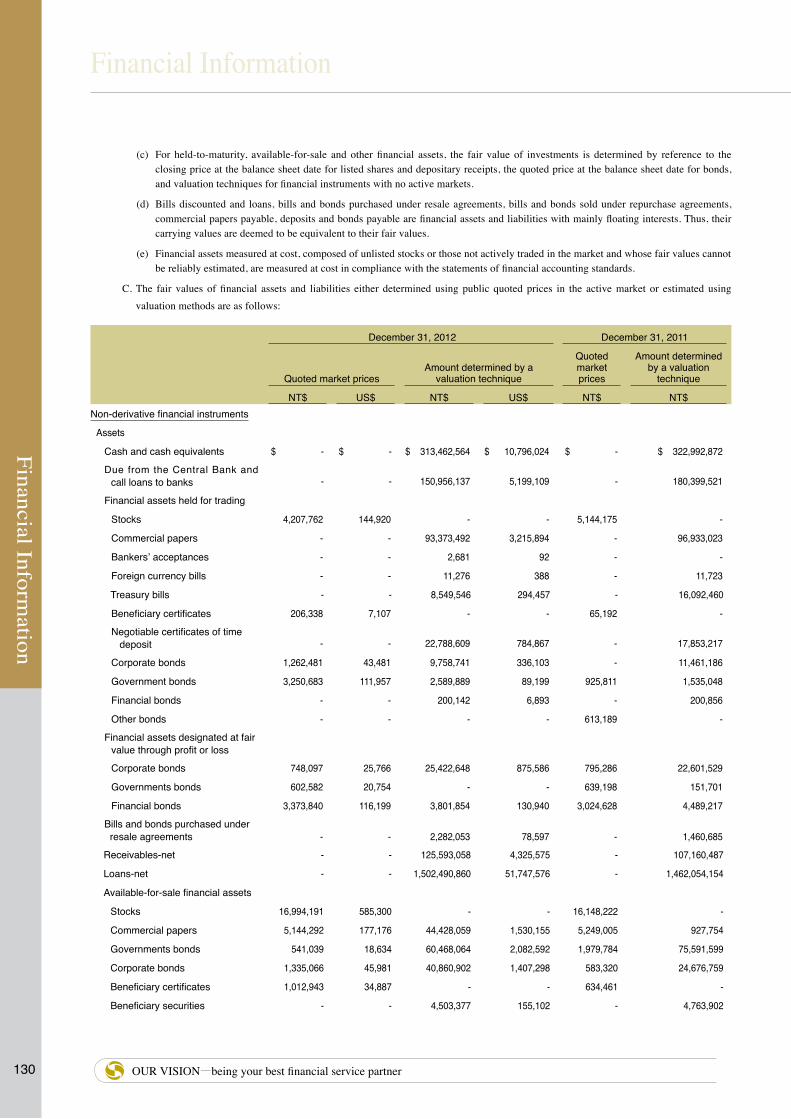
130
Financial Information
Financial Information
OUR VISION—being your best financial service partner
(c) For held-to-maturity, available-for-sale and other financial assets, the fair value of investments is determined by reference to the closing price at the balance sheet date for listed shares and depositary receipts, the quoted price at the balance sheet date for bonds, and valuation techniques for financial instruments with no active markets.
(d) Bills discounted and loans, bills and bonds purchased under resale agreements, bills and bonds sold under repurchase agreements, commercial papers payable, deposits and bonds payable are financial assets and liabilities with mainly floating interests. Thus, their carrying values are deemed to be equivalent to their fair values.
(e) Financial assets measured at cost, composed of unlisted stocks or those not actively traded in the market and whose fair values cannot be reliably estimated, are measured at cost in compliance with the statements of financial accounting standards.
C. The fair values of financial assets and liabilities either determined using public quoted prices in the active market or estimated using valuation methods are as follows:
December 31, 2012 December 31, 2011
Quoted market pricesAmount determined by a
valuation technique
Quoted marketprices
Amount determined by a valuation
technique
NT$ US$ NT$ US$ NT$ NT$Non-derivative financial instruments
Assets
Cash and cash equivalents $ - $ - $ 313,462,564 $ 10,796,024 $ - $ 322,992,872
Due from the Central Bank and call loans to banks
-
-
150,956,137
5,199,109
-
180,399,521
Financial assets held for trading
Stocks 4,207,762 144,920 - - 5,144,175 -
Commercial papers - - 93,373,492 3,215,894 - 96,933,023
Bankers’ acceptances - - 2,681 92 - -
Foreign currency bills - - 11,276 388 - 11,723
Treasury bills - - 8,549,546 294,457 - 16,092,460
Beneficiary certificates 206,338 7,107 - - 65,192 -
Negotiable certificates of time deposit - - 22,788,609 784,867
- 17,853,217
Corporate bonds 1,262,481 43,481 9,758,741 336,103 - 11,461,186
Government bonds 3,250,683 111,957 2,589,889 89,199 925,811 1,535,048
Financial bonds - - 200,142 6,893 - 200,856
Other bonds - - - - 613,189 -
Financial assets designated at fair value through profit or loss
Corporate bonds 748,097 25,766 25,422,648 875,586 795,286 22,601,529
Governments bonds 602,582 20,754 - - 639,198 151,701
Financial bonds 3,373,840 116,199 3,801,854 130,940 3,024,628 4,489,217
Bills and bonds purchased under resale agreements - - 2,282,053 78,597 - 1,460,685
Receivables-net - - 125,593,058 4,325,575 - 107,160,487
Loans-net - - 1,502,490,860 51,747,576 - 1,462,054,154
Available-for-sale financial assets
Stocks 16,994,191 585,300 - - 16,148,222 -
Commercial papers 5,144,292 177,176 44,428,059 1,530,155 5,249,005 927,754
Governments bonds 541,039 18,634 60,468,064 2,082,592 1,979,784 75,591,599
Corporate bonds 1,335,066 45,981 40,860,902 1,407,298 583,320 24,676,759
Beneficiary certificates 1,012,943 34,887 - - 634,461 -
Beneficiary securities - - 4,503,377 155,102 - 4,763,902

Financial Information
1312012 ANNUAL REPORT
December 31, 2012 December 31, 2011
Quoted market pricesAmount determined by a
valuation technique
Quoted marketprices
Amount determined by a valuation
technique
NT$ US$ NT$ US$ NT$ NT$Certificate of deposits - - 545,232 18,778 - 617,701
Financial bonds 12,723,687 438,219 32,068,739 1,104,486 11,874,882 18,385,574
Held-to-maturity financial assets - - 160,776,041 5,537,318 - 131,290,215
Other financial assets - - 21,884,597 753,732 - 23,289,566
Liabilities
Due to the Central Bank and financial institutions - - 358,982,635 12,363,790 - 367,548,678Funds borrowed from the Central Bank and other banks - - 60,548,901 2,085,376 - 71,873,400Financial liabilities for trading
purpose 279,260 9,618 - - 61,098 -Financial liabilities at fair value through profit or loss - - 7,469,569 257,261 - 13,606,240Bills and bonds sold under repurchase agreements - - 187,481,840 6,457,098 - 199,581,332
Commercial papers payable, net - - 1,880,597 64,770 - 1,749,387
Payables - - 61,109,417 2,104,681 - 58,514,085
Deposits - - 1,718,208,745 59,177,157 - 1,588,560,967
Bonds payable - - 62,449,668 2,150,841 - 61,401,059
Other loans - - 6,541,000 225,280 - 5,429,400
Other financial liabilities - - 9,832,957 338,659 - 12,620,054
Derivative financial instruments
Assets
Financial assets held for trading $ 185,344 $ 6,383 $ 1,484,812 $ 51,139 $ 118,603 $ 2,701,102
Financial assets designated at fair value through profit or loss
-
- 2,748,433 94,659
- 3,512,408
Liabilities
Financial liabilities held for trading - - 1,253,307 43,165 - 2,770,041
Financial liabilities designated at fair value through profit or loss
-
- 5,674,750 195,445
- 4,875,253
D. Net loss determined by a valuation technique arising from derivative financial instruments at fair value through profit or loss for the years ended December 31, 2012 and 2011 amounted to NT$584,141 thousand (US$20,119 thousand) and NT$244,631 thousand, respectively.
E. The interest income arising from other than financial assets at fair value through profit or loss for the years ended December 31, 2012 and 2011 amounted to NT$42,498,439 thousand (US$1,670,343 thousand) and NT$38,566,261 thousand, respectively.
F. The adjustment in equity arising from available-for-sale financial assets for the years ended December 31, 2012 and 2011 amounted to (NT$18,062) thousand (US$622 thousand) and NT$6,699,968 thousand, respectively.

132
Financial Information
Financial Information
OUR VISION—being your best financial service partner
( 3 ) Information of fair value hierarchy of financial instruments
A. Information of fair value hierarchy of financial instruments
December 31, 2012 (NT$)
Total Level 1 Level 2 Level 3Non-derivative financial instrumentsAssets
Financial assets at fair value through profit or lossInvestment in stocks $ 4,207,762 $ 4,207,762 $ - $ -Investment in bills 124,725,604 - 124,725,604 -Investment in bonds 17,061,936 4,513,164 12,548,772 -Beneficiary certificates 206,338 206,338 - -Assets designated to be measured at fair value at
initial recognition 33,949,021 4,724,519 29,224,502 -Available-for-sale financial assets
Investment in stocks 16,994,191 16,994,191 - -Investment in bonds 148,413,363 14,599,792 133,813,571 -Beneficiary certificates 1,012,943 1,012,943 - -Others 54,205,094 5,144,292 49,060,802 -
Other financial assetsDebt instrument investment in a non-active market 4,000,000 - 4,000,000 -
LiabilitiesFinancial liabilities at fair value through profit or loss ( 7,748,829 ) ( 277,403) ( 7,471,426 ) -
Derivative financial instrumentsAssets
Financial assets at fair value through profit or loss 4,418,569 3,557,479 860,151 939Liabilities
Financial liabilities at fair value through profit or loss ( 6,928,057 ) ( 5,742,038 ) ( 1,186,019 ) -Total $ 394,517,935 $ 48,941,039 $ 345,575,957 $ 939
December 31, 2012 (US$)
Total Level 1 Level 2 Level 3Non-derivative financial instrumentsAssets
Financial assets at fair value through profit or lossInvestment in stocks $ 144,920 $ 144,920 $ - $ -Investment in bills 4,295,698 - 4,295,698 -Investment in bonds 587,634 155,439 432,195 -Beneficiary certificates 7,107 7,107 - -Assets designated to be measured at fair value at
initial recognition 1,169,245 162,718 1,006,527 -Available-for-sale financial assets
Investment in stocks 585,300 585,300 - -Investment in bonds 5,111,533 502,834 4,608,699 -Beneficiary certificates 34,887 34,887 - -Others 1,866,888 177,176 1,689,712 -
Other financial assetsDebt instrument investment in a non-active market 137,765 - 137,765 -
LiabilitiesFinancial liabilities at fair value through profit or loss ( 266,879 ) ( 9,554) ( 257,325 ) -
Derivative financial instrumentsAssets
Financial assets at fair value through profit or loss 152,181 122,524 29,625 32Liabilities
Financial liabilities at fair value through profit or loss ( 238,611) ( 197,763 ) ( 40,848 ) -Total $ 13,587,668 $ 1,685,588 $ 11,902,048 $ 32

Financial Information
1332012 ANNUAL REPORT
December 31, 2011 (NT$)
Total Level 1 Level 2 Level 3Non-derivative financial instrumentsAssets
Financial assets at fair value through profit or loss
Investment in stocks $ 5,144,175 $ 5,144,175 $ - $ -
Investment in bills 130,890,423 - 130,890,423 -
Investment in bonds 14,736,090 1,539,000 13,197,090 -
Beneficiary certificates 65,192 65,192 - -
Assets designated to be measured at fair value at initial recognition 31,701,559 4,459,112 27,242,447 -
Available-for-sale financial assetsInvestment in stocks 16,148,222 16,148,222 - -
Investment in bonds 133,091,918 14,437,986 118,653,932 -
Others 12,192,823 5,883,466 6,309,357 -
Other financial assetsDebt instrument investment in a non-active market 4,000,000 - 4,000,000 -
Liabilities
Financial liabilities at fair value through profit or loss ( 13,667,338 ) ( 61,098) ( 13,606,240 ) -
Derivative financial instruments
Assets
Financial assets at fair value through profit or loss 6,332,113 118,603 5,488,989 724,521
Liabilities
Financial liabilities at fair value through profit or loss ( 7,645,294 ) - ( 7,261,683 ) ( 383,611 )
Total $ 328,989,883 $ 47,734,658 $ 284,914,315 $ 340,910
Note 1: The table above shows the Group’s measurement method of financial assets and liabilities, which is applicable to financial assets or liabilities at fair value through profit or loss and available-for-sale financial assets, debt instrument investment in a non-active market, derivative financial assets and liabilities for hedging purposes under other financial assets and liabilities.
Note 2: Level 1: In accordance with SFAS No. 34 “Financial Instruments: Recognition and Measurement”, if the market for the financial instrument is active, the fair value of the financial instrument is represented by the quoted prices of the same instruments. An active market refers to a market that meets all of the following conditions:
a. the goods traded in the market are homogeneous; b. willing sellers and buyers can be found at the same time; and c. the price information is available to the public.Note 3: Level 2: Observable prices other than the quoted prices in an active market comprise direct (e.g. prices) or indirect (e.g. introduced by prices)
observable inputs obtained from an active market. a.The quoted prices of similar financial instruments in an active market represent the fair value of the financial instruments held by the Group.
The quoted prices are introduced by recent transaction prices of similar financial instruments, which are decided based on their features and transaction terms. The fair value of financial instruments needs to be adjusted based on observable transaction prices of similar financial instruments; adjustment elements might include time lag of the last financial instrument transactions, differences of transaction terms, transaction prices involving related parties, relevance between observable transaction prices of similar financial instruments and the prices of held financial instruments.
b.Public quotation of the same or similar financial instruments in a non-active market. c.Fair value is measured using an evaluation model, and the inputs (e.g. interest rate, yield curve, volatility rate) used in the model are based on
obtainable data (e.g. observable inputs obtained from market materials, which reflect market participants’ expectation) from the market. d.Most inputs are derived from observable market data, or that the relevance can be verified by observable market data.Note 4: Level 3: The inputs adopted to measure fair value at this level are not based on available data from the markets (non-observable inputs, e.g. option
pricing model using history volatility rate, because history volatility rate cannot represent the expectation value of market participants for future volatility rate).

134
Financial Information
Financial Information
OUR VISION—being your best financial service partner
B. Movements of financial assets classified into Level 3 of fair value are as follows:
( NT$)
January 1, 2012
Valuation gain (loss) recognized as gain (loss) of the period or as stockholders’
equity
Addition Reduction
December 31, 2012
Purchased or issued
Transferred to Level 3
Sold, disposed or
settledTransferred to Level 3
Financial assets at fair value through profit or lossDerivative financial instruments $ 724,521 ($ 95,532 ) $ 8,819 $ - ($ 8,485 ) $ - $ 629,323
Financial liabilities at fair value through profit or lossDerivative financial instruments ( 383,611 ) ( 540,752 ) - - - - ( 924,363 )
( US$)
January 1, 2012
Valuation gain (loss) recognized as gain (loss) of the period or as stockholders’
equity
Addition Reduction
December 31, 2012
Purchased or issued
Transferred to Level 3
Sold, disposed or
settledTransferred to Level 3
Financial assets at fair value through profit or lossDerivative financial instruments $ 24,953 ($ 3,290 ) $ 304 $ - ($ 292 ) $ - $ 21,675
Financial liabilities at fair value through profit or lossDerivative financial instruments ( 13,212 ) ( 18,624 ) - - - - ( 31,836 )
( NT$)
January 1, 2011
Valuation gain (loss) recognized as gain (loss) of the period or as stockholders’
equity
Addition Reduction
December 31, 2011
Purchased or issued
Transferred to Level 3
Sold, disposed or
settledTransferred to Level 3
Financial assets at fair value through profit or lossInvestment in bills and bonds $ 10,297 ($ 297 ) $ - $ - ($ 10,000 ) $ - $ -Assets designated to be measured
at fair value at initial recognition 9,224,811 ( 724,648 ) - 278,868 ( 2,000,000 ) ( 6,779,101 ) -Derivative financial instruments 24,279 263,122 330 444,079 ( 303 ) ( 6,986 ) 724,521
Financial liabilities at fair value through profit or lossAssets designated to be measured
at fair value at initial recognition ( 2,994,451 ) ( 5,549 ) - - 3,000,000 - -Derivative financial instruments ( 2,600,782 ) 702,235 - ( 642,133 ) 500 2,156,569 ( 383,611 )
( 4 ) INFORMATION ON FINANCIAL RISK
A. MICB
( a ) Market risk
Except for fund dispatching, deposit pricing and long-term/medium-term capital funding and usage, the Bank controls market risk, manages indicators of interest rate sensitive assets and liabilities and market risk exposure limits through the treasury department. Regarding the foreign exchange market, foreign currency market, capital market and derivative transactions and so on, the Bank sets regulations on the transaction range and amount, assesses the limitation of the position and estimation of management risk index. Also, sets limitations on daily amount, overnight amount, counterparties amount and stop loss points for the dealing room and dealers. The foreign branches set limitation for foreign exchange which is controlled daily, and monthly reports are presented to the management for reference. The transactions have set limitations and are periodically accrued as unrealized profit or loss, and reports are prepared for management and Board of Directors review.
To measure the risk weighted assets in accordance with the standards set by the authorities.
The interest rate risk is measured based on the “Interest-rate sensitivity gap” and the “Interest rate sensitivity assets and liabilities ratio” and so on, so that the interest rate risk can be maintained within the suitable range. As for the exchange rate and investments in quoted securities exposure amount, the daily estimation of profit or loss is based on the market price and the stop loss point in

Financial Information
1352012 ANNUAL REPORT
order to make sure it is within the range acceptable for risk control.
Derivatives on trading book with hedge or non-hedge transaction characteristics are evaluated on a semi-monthly and weekly basi.
( b ) Credit risk
1. Credit risk represents the risk of loss that the Bank would incur if the counterparty fails to perform MICB’s contractual obligations.
The concentrations of credit risk exist when the counterparty to financial instrument transactions are either concentrated in certain individuals or group of individuals engaged in similar activities or having activities in the same region, which would impair their ability to meet contractual obligations under negative economic or other conditions. MICB has not transacted with one single customer or entered into one single transaction which would expose the Bank to concentration risk. However, MICB is likely exposed to industry concentration risk.
For credit cards, no collateral is required, but the credit status of each cardholder is closely monitored. Depending on the results of credit status monitoring, appropriate measures are adopted, including amending the credit limit.
2. The maximum credit risk exposure amounts of financial instruments held by the MICB are as follows:
December 31, 2012 December 31, 2011
Carrying value Maximum risk exposure amount Carrying valueMaximum risk
exposure amount
Financial assets NT$ US$ NT$ US$ NT$ NT$Financial assets at fair value
through profit or loss $ 40,773,884 $ 1,404,301 $ 40,773,884 $ 1,404,301 $ 41,805,870 $ 41,805,870Available-for-sale financial assets 131,161,550 4,517,360 131,161,550 4,517,360 71,269,770 71,269,770
Bills discounted and loans 1,502,490,860 51,747,576 1,502,490,860 51,747,576 1,462,054,154 1,462,054,154
Held-to-maturity financial assets 159,207,720 5,483,303 159,207,720 5,483,303 130,949,228 130,949,228Off-balance sheet commitments
and guarantees
1,413,656,423
48,688,012
1,413,656,423
48,688,012
1,523,950,040
1,523,950,040
Total $ 3,247,290,437 $ 111,840,552 $ 3,247,290,437 $ 111,840,552 $ 3,230,029,062 $ 3,230,029,062
3. MICB and its subsidiaries strictly assess and evaluate each credit application for loan facility, guarantee and letters of credit. Collaterals, mostly in the form of real estate, cash, inventories and marketable securities, may be required depending on the result of the credit worthiness evaluation. As of December 31, 2012 and 2011, collaterals secured approximately 55.23% and 55.07%, respectively, of total loans (excluding overdue loans). When a borrower defaults, MICB and indirect banks would enforce the foreclosure of the collaterals and guarantees to lower MICB’s credit risk. As disclosing the maximum credit risk exposure amount, MICB would not consider the fair value of collaterals. However, MICB and indirect banks are likely exposed to industry concentration risk. MICB’s and indirect banks’ information on industry concentration of credit risk is as follows:
December 31, 2012 December 31, 2011
Carrying value Maximum risk exposure amount Carrying valueMaximum risk
exposure amountIndustry type NT$ US$ NT$ US$ NT$ NT$Manufacturing $ 538,611,113 $ 18,550,408 $ 539,113,454 $ 18,567,710 $ 531,385,639 $ 531,385,639Financial institution, insurer, real estate and leasing 338,990,843
11,675,249
339,738,095 11,700,985
276,885,680
276,885,680
Wholesale and retail 139,893,820 4,818,110 139,893,820 4,818,110 128,580,082 128,580,082
Transportation and storage 96,091,470 3,309,504 96,091,470 3,309,504 96,763,727 96,763,727
Government institution 10,122,353 348,626 10,122,353 348,626 27,392,970 27,392,970
Individuals 294,296,283 10,135,915 294,930,428 10,157,755 288,777,800 288,777,800
Others ( Note2 ) 359,236,952 12,372,549 357,353,214 12,307,671 392,963,428 392,963,428
Total $ 1,777,242,834 $ 61,210,361 $ 1,777,242,834 $ 61,210,361 $ 1,742,749,326 $ 1,742,749,326
Geographic region
Domestic $ 1,283,582,068 $ 44,208,096 $ 1,281,616,211 $ 44,140,389 $ 1,248,317,413 $ 1,248,317,413
North America 57,263,587 1,972,226 58,294,869 2,007,745 52,568,344 52,568,344
Others ( Note2 ) 436,397,179 15,030,039 437,331,754 15,062,227 441,863,569 441,863,569
Total $ 1,777,242,834 $ 61,210,361 $ 1,777,242,834 $ 61,210,361 $ 1,742,749,326 $ 1,742,749,326
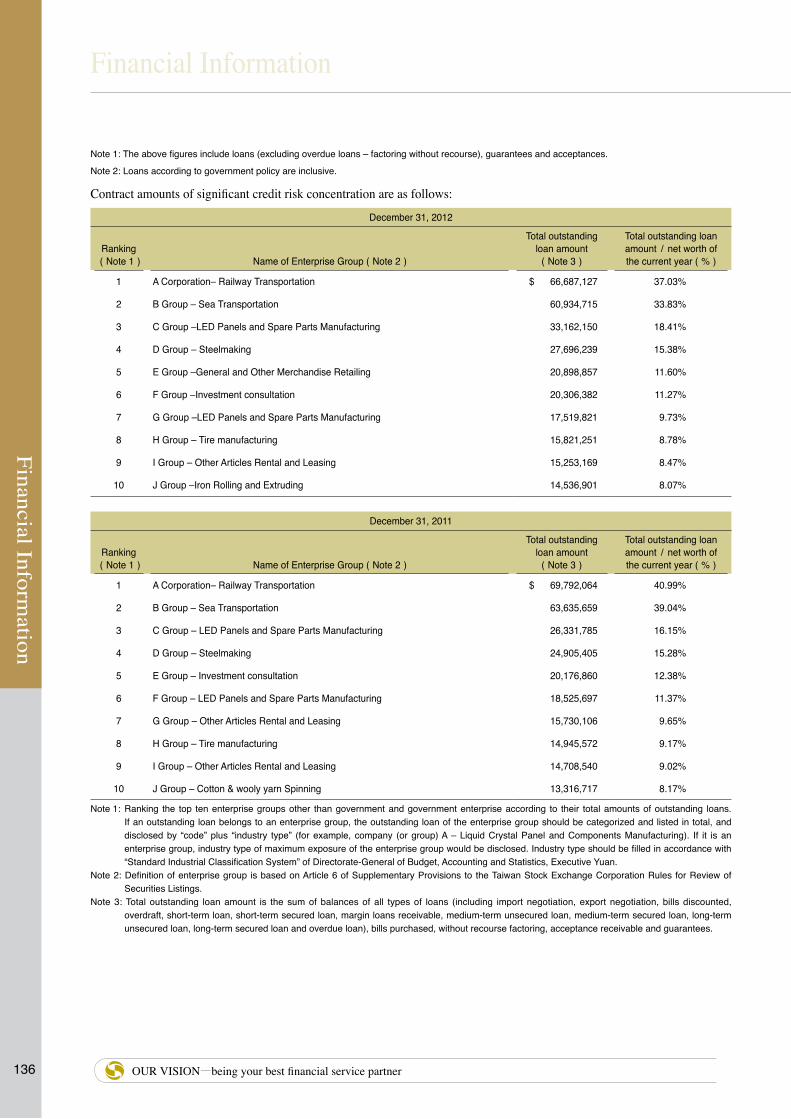
136
Financial Information
Financial Information
OUR VISION—being your best financial service partner
Note 1: The above figures include loans (excluding overdue loans – factoring without recourse), guarantees and acceptances.
Note 2: Loans according to government policy are inclusive.
Contract amounts of significant credit risk concentration are as follows:
December 31, 2012
Ranking ( Note 1 ) Name of Enterprise Group ( Note 2 )
Total outstanding loan amount
( Note 3 )
Total outstanding loan amount / net worth of the current year ( % )
1 A Corporation– Railway Transportation $ 66,687,127 37.03%
2 B Group – Sea Transportation 60,934,715 33.83%
3 C Group –LED Panels and Spare Parts Manufacturing 33,162,150 18.41%
4 D Group – Steelmaking 27,696,239 15.38%
5 E Group –General and Other Merchandise Retailing 20,898,857 11.60%
6 F Group –Investment consultation 20,306,382 11.27%
7 G Group –LED Panels and Spare Parts Manufacturing 17,519,821 9.73%
8 H Group – Tire manufacturing 15,821,251 8.78%
9 I Group – Other Articles Rental and Leasing 15,253,169 8.47%
10 J Group –Iron Rolling and Extruding 14,536,901 8.07%
December 31, 2011
Ranking ( Note 1 ) Name of Enterprise Group ( Note 2 )
Total outstanding loan amount
( Note 3 )
Total outstanding loan amount / net worth of the current year ( % )
1 A Corporation– Railway Transportation $ 69,792,064 40.99%
2 B Group – Sea Transportation 63,635,659 39.04%
3 C Group – LED Panels and Spare Parts Manufacturing 26,331,785 16.15%
4 D Group – Steelmaking 24,905,405 15.28%
5 E Group – Investment consultation 20,176,860 12.38%
6 F Group – LED Panels and Spare Parts Manufacturing 18,525,697 11.37%
7 G Group – Other Articles Rental and Leasing 15,730,106 9.65%
8 H Group – Tire manufacturing 14,945,572 9.17%
9 I Group – Other Articles Rental and Leasing 14,708,540 9.02%
10 J Group – Cotton & wooly yarn Spinning 13,316,717 8.17%
Note 1: Ranking the top ten enterprise groups other than government and government enterprise according to their total amounts of outstanding loans. If an outstanding loan belongs to an enterprise group, the outstanding loan of the enterprise group should be categorized and listed in total, and disclosed by “code” plus “industry type” (for example, company (or group) A – Liquid Crystal Panel and Components Manufacturing). If it is an enterprise group, industry type of maximum exposure of the enterprise group would be disclosed. Industry type should be filled in accordance with “Standard Industrial Classification System” of Directorate-General of Budget, Accounting and Statistics, Executive Yuan.
Note 2: Definition of enterprise group is based on Article 6 of Supplementary Provisions to the Taiwan Stock Exchange Corporation Rules for Review of Securities Listings.
Note 3: Total outstanding loan amount is the sum of balances of all types of loans (including import negotiation, export negotiation, bills discounted, overdraft, short-term loan, short-term secured loan, margin loans receivable, medium-term unsecured loan, medium-term secured loan, long-term unsecured loan, long-term secured loan and overdue loan), bills purchased, without recourse factoring, acceptance receivable and guarantees.

Financial Information
1372012 ANNUAL REPORT
December 31, 2012 December 31, 2011Amount of credit extensions to interested parties (Note 1) $ 82,720,994 $ 83,960,579
Ratio of credit extensions to interested parties (%) (Note 2) 4.71% 4.76%
Ratio of credit extensions secured by stocks (%) (Note 3) 1.81% 1.44%
Industry concentration (%) (Top 3 industries with highest ratio of credit extension amount)
Industry Ratio Industry RatioManufacturing 30.31% Manufacturing 30.49%
Real estate 11.09% Real estate 9.36%
Wholesale and retail sales industry 7.87% Wholesale and retail
sales industry 7.38%
Note 1: Total amount of credit extensions include loans, bills discounted, acceptances receivable, guarantees receivable, and advance accounts for factoring receivable.
Note 2: The ratio of credit extensions to interested parties = the amount of credit extensions to interested parties / the total amount of all credit extensions.Note 3: The ratio of credit extensions secured by stocks = the amount of credit extensions secured by stocks / the total amounts of all credit extensions.
( c ) Liquidity risk
The capital and working capital of the subsidiaries and its indirect subsidiaries were sufficient to execute all the obligation of contracts and had no liquidity risk. The possibility of the derivative financial instruments held by the subsidiaries and its indirect subsidiaries being unable to liquidate quickly with minimal loss in value is low.
The management policy of MICB is to match the contractual maturity profile and interest rate of its assets and liabilities. As a result of the uncertainty, the maturities and interest rates of assets and liabilities usually do not fully match. The gap may result in potential gain or loss. The subsidiaries and its indirect subsidiaries applied the appropriate grouping of assets and liabilities. (Please refer to P. 81-83 of the Consolidated Financial Statements).
( d ) Cash flow risk and fair value risk of interest rate fluctuation
Interest rate risk is the risk to earnings and value of financial instruments caused by fluctuations in interest rate. The risk is considered to be material to MICB, and MICB enters into interest rate swap contracts to manage the risk.
As of December 31, 2012, expected repricing and maturity dates of interest-bearing financial instruments are not affected by dates of related contracts. The interest rate risk of subsidiaries is presented by the book value of financial assets and financial liabilities and is classified by the earlier of the expected repricing date or expected maturity date.
B. MS
( a ) Derivative financial instruments
i. Stock warrants
1 ) Call (Put) warrants issued by the Company are all US or European style warrants. The warrants mature in 6 to 9 months time starting from the trading date and can be exercised either by cash or spot securities. The subsidiaries retain the right to choose either one.
2) The purpose of issuing derivative financial instruments is to generate reasonable profits by controlling the risk within a tolerable limit.
3) Credit risk
As proceeds from the stock warrants issued by MS have all been received, there is no credit risk.
4) Market risk
MS is a short position for the stock warrants issued, which is in reverse to the investors’ position. As the investors may exercise their option rights before expiration of the contracts because of the fluctuations in the underlying securities’ fair values, MS’s position is exposed to market risk. To reduce the uncertainty, MS mainly adopts delta and vega risk hedging strategies which are summarized below.
a ) Delta risk hedging strategy
( i ) Hedge instruments
The hedge instruments are mainly the underlying securities and are supplemented by the title certificates of the underlying securities.

138
Financial Information
Financial Information
OUR VISION—being your best financial service partner
( ii ) Risk hedging strategy
The dynamic hedging method is adopted by referring to the delta risk value calculated using MS’ risk model. Under this method, when the values of the underlying securities fluctuate, MS will trade the underlying securities or the title certificates of those securities to maintain its position in gains (losses) on the stock warrants being neutral to the delta risk.
b ) Vega risk hedging strategy
( i ) Hedge instruments
The hedge instruments are mainly the warrants listed in the domestic market with the same underlying securities (including the warrants issued by MS) and are supplemented by the convertible bonds issued by the companies of the underlying securities.
( ii ) Risk hedging strategy
The strategy adopted in vega hedge is primarily through buying the significantly underpriced stock warrants with the same underlying securities, of which the price volatility will partly offset the price volatility of the stock warrants issued by MS. As convertible bonds inherent the risk of early redemption by the bond issuers, coupled with the liquidity risk (large difference between the buying and selling prices) and the interest rate risk, the hedging strategy would become complicated and inefficient if convertible corporate bonds are used as hedge instruments. Therefore, convertible bonds will not be used as the primary hedge instruments unless the underlying securities of the stock warrants issued show volatile price movements, and the terms on the convertible bonds and their liquidity meet the risk hedging requirements of MS.
5 ) Amount and timing of expected future cash flows
When the options on the stock warrants are exercised by the warrant holders, MS can opt to settle the contracts by cash or by delivery of the underlying securities. As a result, cash inflows or outflows will occur, respectively. The amount and timing of the cash flows depend on the amount of the stock warrants exercised by the warrant holders and the exercise date.
6 ) Accounting policies
Please refer to Note 2(27) for details.
7 ) Fair values and carrying values
The stock warrants issued by MS are all American-style and European-style warrants with the contract periods ranging from six to nine months to one year, starting from the date on which the warrants are listed in the market. The warrants can be settled by either cash or delivery of securities at MS’ discretion.
8 ) Supplementary disclosures
Gain (loss) arising from stock warrant transactions for the years ended December 31, 2012 and 2011 are set forth below.
a ) Valuation gain (loss)
Valuation gain ( loss )
For the year endedDecember 31, 2012
For the year endedDecember 31, 2011 Financial
NT$ US$ NT$ Statement AccountGain on variation in value of liability
on issuance of stock warrants$ 4,853,061 $ 167,145 $ 6,275,616 Gain on issuance of stock warrants
Valuation gain (loss) on repurchase of stock warrants issued
1,279,780 44,077 ( 3,406,296 ) (Loss) gain on issuance of stock warrants
Securities held for risk hedging 12,201 420 ( 18,255 ) Valuation adjustments on securities held for operations
Payables –securities borrowed – hedging
( 6,319 ) ( 218 ) 105 Valuation gain (loss) on securities borrowed and bonds purchased under resale agreements
Loss on futures contract - hedge 388 13 314 Gain (loss) on derivative financial instruments-futures

Financial Information
1392012 ANNUAL REPORT
b ) Gain ( loss ) on sale
Valuation gain ( loss )
For the year endedDecember 31, 2012
For the year endedDecember 31, 2011 Financial
NT$ US$ NT$ Statement AccountLoss on resale of the s tock
warrants repurchased($ 1,020,642 ) ($ 35,152 ) ($ 866,004 ) Loss on issuance of stock warrants
Securities held for risk hedging ( 81,767 ) ( 2,816 ) ( 644,296 ) (Loss) gain on sale of securities - hedging
Repurchase of payable lending - hedge
( 2,371 ) ( 82 )
- Profit from sale of securities - hedge
Payables - securities borrowed - hedging
( 13,847 ) ( 477 )
( 7,339 ) Valuation loss on securities borrowed and bonds purchased under resale agreements
Loss on futures contract - hedge 9,621 331 38,335 Gain (loss) on derivative financial instruments- futures
c ) Gain ( loss ) at maturity
Valuation gain ( loss )
For the year endedDecember 31, 2012
For the year endedDecember 31, 2011 Financial
NT$ US$ NT$ Statement AccountGain on early execution of stock
warrants $ 2 $ - $ 4,019 Gain on issuance of stock warrants
Gain on unexercised expired stock warrants
5,020 173 12,136 Gain on issuance of stock warrants
Maturity gain(loss) – repurchase of re-issued call warrants
( 4,893,544 ) ( 168,539 ) ( 1,419,182 ) Loss on issuance of stock warrants
( b ) Derivative financial instruments – futures and options
i. Futures contracts and options
a ) MS’s details of the futures contracts outstanding as of December 31, 2012 and 2011 are set forth below:
Unit: In thousand of NT dollars
December 31, 2012
Uncover positionContract amount or
paid ( collected ) premiumItem Type of transaction
Buyer / seller
Number of contracts Fair value Note
Futures contract Taiwan Micro Index Futures Buyer 191 $ 72,895 $ 73,315 Hedge
Taiwan Index Futures Seller 15 ( 22,479 ) ( 23,031 ) Non-hedge
Unit: In thousand of US dollars
December 31, 2012
Uncover positionContract amount or
paid ( collected ) premiumItem Type of transaction
Buyer / seller
Number of contracts Fair value Note
Futures contract Taiwan Micro Index Futures Buyer 191 $ 2,511 $ 2,525 Hedge
Taiwan Index Futures Seller 15 ( 774 ) ( 793 ) Non-hedge

140
Financial Information
Financial Information
OUR VISION—being your best financial service partner
Unit: In thousand of NT dollars
December 31, 2011
Uncover positionContract amount or
paid ( collected ) premiumItem Type of transaction
Buyer / seller
Number of contracts Fair value Note
Futures contract Taiwan Micro Index Futures Buyer 4 $ 1,376 $ 1,408 Hedge
Taiwan Index Futures Seller 40 ( 56,793 ) ( 56,312 ) Non-hedge
Option contract Taiwan Index Futures Options – Call option Buyer 4 28 23 Non-hedge
Taiwan Index Futures Options – Put option Seller 4 24 26 Non-hedge
b ) For the years ended December 31, 2012 and 2011, gains and losses from direct and indirect subsidiaries’ engaging in futures contracts and options are as follows :
For the year ended December 31, 2012( Unit: In thousand of NT dollars )
Realized gains ( losses ) Valuation gains ( losses ) Total
Gains on futures contracts $ 121,391 $ 388 $ 121,779
Losses on futures contracts ( 124,352 ) ( 1,033 ) ( 125,385 )
Gains on option trading 8,158 3 8,161
Losses on option trading ( 9,106 ) - ( 9,106 )
( $ 3,909 ) ( $ 642 ) ( $ 4,551 )
For the year ended December 31, 2012( Unit: In thousand of US dollars )
Realized gains ( losses ) Valuation gains ( losses ) Total
Gains on futures contracts $ 4,181 $ 13 $ 4,194
Losses on futures contracts ( 4,283 ) ( 36 ) ( 4,318 )
Gains on option trading 281 - 281
Losses on option trading ( 314 ) - ( 314 )
$ 135 ( $ 22 ) ( $ 157 )
For the year ended December 31, 2011( Unit: In thousand of NT dollars )
Realized gains ( losses ) Valuation gains ( losses ) Total
Gains on futures contracts $ 144,400 $ 647 $ 145,047
Losses on futures contracts ( 105,000 ) - ( 105,000 )
Gains on option trading 6,319 51 6,370
Losses on option trading ( 9,552 ) - ( 9,552 )
$ 36,167 $ 698 $ 36,865
ii. Bond options
1 ) MS has been engaged in trading of bond options since March 2005. As of December 31, 2012 and 2011, MS did not hold any uncovered positions of bond options.
2) The MS’s (loss) profit arising from trading of bond options for the years ended December 31, 2012 and 2011 resulted in (loss) income of (NT$293) thousand (US$10 thousand) and NT$743 thousand, respectively, and is recorded under “Gain (loss) on derivative financial instruments - OTC”.

Financial Information
1412012 ANNUAL REPORT
iii. Credit risk
The credit risk pertains to the risk that the counterparties may default at expiration of the contracts. The option contracts entered into by MS and its indirect subsidiaries are all exchange-traded and can be settled at expiration without default. Therefore, no significant credit risk is expected to arise. Evaluation on credit status for the counterparties of bond option should be made and followed up by regular monitoring to mitigate the credit risk.
iv. Market price risk
The major risk associated with the futures and option trading undertaken by MS and its indirect subsidiaries is the market risk arising from the fluctuations in the market prices of the underlying securities. Losses will be incurred if market index prices and the prices of the underlying securities move in opposite directions. To control the risk within a tolerable limit, a stop-loss mechanism has been established.
Pursuant to the Letter (87) Tai-Tsai-Tseng (2) No.01761 issued by the SFC, securities firms are allowed to undertake futures trading for risk hedging purpose with the approval from the SFC if risk hedging is deemed necessary for the marketable securities held for proprietary trading and underwriting. However, the total market value of the securities firm’s position in the outstanding futures contracts cannot exceed the total market value of the spot securities held on hand nor can it exceed 20% of the securities firm’s net worth. Hence, market risk is assessed to be remote.
v. Liquidity risk
As premiums are paid before futures and option contracts are bought, no funding requirement is expected. In addition, the options written and the outstanding futures contracts can be settled at reasonable prices. Therefore, liquidity risk is assessed to be remote.
vi. Amount and timing of future cash flows
To hedge the risk arising from proprietary trading of stocks, MS has entered into TAIEX Index Futures and TAIEX Index Option contracts. Margin deposits are paid before the transactions take effect. MS’s position in the outstanding futures contracts is marked–to-market daily, and its working capital is assessed to be adequate to support the margin calls. Hence, no cash flow risk or significant cash requirements are expected.
( c ) Derivative financial instruments - interest rate swaps
i. MS has been undertaking interest rate swap contracts for risk hedging and trading purposes. Details of the interest rate swap contracts outstanding as of December 31, 2012 and 2011 are set forth below:
December 31, 2012 Notional principal Fair value
Item NT$ US$ NT$ US$ Nature Risk hedgingCross currency swap (assets) $ 28,765,000 $ 990,701 $ 231,767 $ 7,982 For trading purpose NoneCross currency swap (liabilities) 29,700,000 1,022,903 ( 254,035 ) ( 8,749 ) For trading purpose None
December 31, 2011
Item Notional principal (NT$) Fair value (NT$) Nature Risk hedgingCross currency swap (assets) $ 64,390,000 $ 855,364 For trading purpose None
Cross currency swap (liabilities) 63,925,000 ( 872,450 ) For trading purpose None
ii. Credit risk
The credit risk pertains to the risk that the counterparties may default at expiration of the contracts. The counterparties of MS are all well-known banks, bills companies and securities companies with good credit ratings. Thus, the credit risk is assessed to be remote.
iii. Market risk
The market risk arises from the fluctuations in interest rates. The interest rate swaps are undertaken by MS to hedge the interest rate risk arising from net assets. Thus, the market risk is offset against each other. MS mainly utilizes interest rate swaps when an increase in interest rates is expected. When the interest rate moves in an unfavorable direction, the loss can be controlled within a tolerable limit. As a result, no significant market risk is expected.
iv. Amount and timing of expected future cash flows
Upon settlement of the contracts, the amount of the notional principal multiplied by the interest rate differential is received or paid. As the amount settled is insignificant and the notional principal is not settled, no significant cash requirement is expected.

142
Financial Information
Financial Information
OUR VISION—being your best financial service partner
v. Gain (loss) on derivative financial instruments arising from interest rate swap is as follows :
For the year ended December 31, 2012:
Realized Gain ( Loss ) Valuation Gain ( Loss ) TotalNT$ US$ NT$ US$ NT$ US$
Interest rate swaps ( $ 3,449 ) ( $ 119 ) ( $ 5,182 ) ( $ 178 ) ($ 8,631 ) ($ 297 )
For the year ended December 31, 2011:
Realized Gain ( Loss ) Valuation Gain ( Loss ) TotalNT$ NT$ NT$
Interest rate swaps ( $ 21,670 ) $ 9,080 ( $ 12,590 )
The MS’s profit (loss) arising from interest rate swaps is recorded under “Gain (loss) on derivative financial instruments-OTC”.
( d ) Derivative financial instruments - asset swaps
i. As MS has underwritten convertible bonds on a firm commitment basis, it has entered into convertible bond asset swap option contracts to enhance the liquidity of the remaining convertible bonds held on hand and thereby, reduce the risk of its position in the convertible bonds.
ii. There are no asset swap transactoins as of December 31, 2012. Details of the asset swap-option contracts undertaken by MS as of December 31, 2011 is as follows:
December 31, 2011
Notional Principal / Contract Amount Fair Value
Financial Instrument NT$ NT$Sale of American call options $ 21,035 $ 4,257
iii. Credit risk
The credit risk pertains to the risk that the counterparties may default at expiration of the contracts. The quantitative information of MS’ right to buy or obligation to sell convertible bonds are entered into the information system of the GreTai Securities Market (the over-the-counter market) on the contract date and settlement of the asset swap option contracts is conducted through the Taiwan Depository and Clearing Corporation. Hence, no significant credit risk is expected.
iv. Market price risk
When MS exercises its right to buy or perform its obligation to sell convertible bonds, the related prices are quoted in accordance with the rules specified in the contracts. Therefore, market risk is assessed to be remote.
v. Amount and timing of expected future cash flows
MS’s working capital is assessed to be adequate to support the periodic payment of the specified interest on the convertible corporate asset swaps transaction during the contract period. Hence, no significant funding risk is expected.
vi. Gain (loss) on the convertible bond asset swaps are as follows:
For the year ended December 31, 2012:
Realized Gain ( Loss ) Valuation Gain ( Loss ) Total
NT$ US$ NT$ US$ NT$ US$Asset swap-options ( $ 10,297 ) ( $ 355 ) ( $ 17,048 ) ( $ 587 ) ( $ 27,345 ) ( $ 942 )
For the year ended December 31, 2011:
Realized Gain ( Loss ) Valuation Gain ( Loss ) Total
NT$ NT$ NT$Asset swap-options ( $ 879 ) $ 23,742 $ 22,863
The MS’s profit (loss) arising from trading of asset swaps is recorded under “Gain (loss) on derivative financial instruments-OTC”.

Financial Information
1432012 ANNUAL REPORT
( e ) Derivative financial instruments - structured financial instruments
i. MS obtained the approval from the governing authority in July 2003 to issue structured financial products denominated in New Taiwan dollars, which include equity-linked notes (ELN) and principal-guaranteed notes (PGN). Details of the outstanding contracts of the structured financial instruments as of December 31, 2012 and 2011 are set forth below:
December 31, 2012:
Transaction Contract Principal Cost of Fixed Income
Securities Market Price of Fixed
Income Securities Option Cost Option Value ( In Thousands of NT Dollars )
ELN $ 44,600 $ 44,581 $ 44,592 $ 385 $ 939
Transaction Contract Principal Cost of Fixed Income
Securities Market Price of Fixed
Income Securities Option Cost Option Value ( In Thousands of US Dollars )
ELN $ 1,536 $ 1,535 $ 1,536 $ 13 $ 32
December 31, 2011:
Transaction Contract Principal Cost of Fixed Income
Securities Market Price of Fixed
Income Securities Option Cost Option Value ( In Thousands of NT Dollars )
ELN $ 6,200 $ 6,198 $ 6,199 $ 52 $ 46
ii. Credit risk
The credit risk pertains to the risk that the counterparties may default at expiration of the contracts. As payments for the structured financial instruments are collected from the investors on the contract date and placed in an exclusive account at the custodian institution, no significant credit risk is expected.
iii. Market risk
Payments received from the investors for the structured financial instruments on the contract date are utilized in accordance with the terms and conditions specified in the contract. As the prices of the underlying securities and the fixed income securities invested using the payments from the investors can be referred to the public quoted market prices, market risk is assessed to be remote.
iv. Amount and timing of expected cash flows
Payments received from the investors for the structured financial instruments on the contract date are placed in an exclusive account at the custodian institution, which are separated from MS’s own assets. The terms and conditions on utilization of the investors’ payments are specified in the contract, including the proportion to be invested in fixed income securities. Therefore, no significant cash requirements are expected at expiration of the contract.
v. Gains (losses) on the structured financial instruments for the years ended December 31, 2012 and 2011 are set forth below:
For the year ended December 31, 2012
Realized Gain Valuation Gain Total
NT$ US$ NT$ US$ NT$ US$
ELN $ 4,329 $ 149 $ 549 $ 19 $ 4,878 $ 168
For the year ended December 31, 2011
Realized Gain Valuation Loss Total
NT$ NT$ NT$ELN $ 698 $ 4 $ 702
The MS’s profit (loss) arising from trading of structured financial instruments is recorded under “Gain (loss) on derivative financial instruments-OTC”.
vi. Subsidiaries engage in margin loans and stock loans business. Margin loans given to customers and are collateralized by the securities that the customers purchase and securities lent to customers to sell short as of December 31, 2012 and 2011 are as follows:
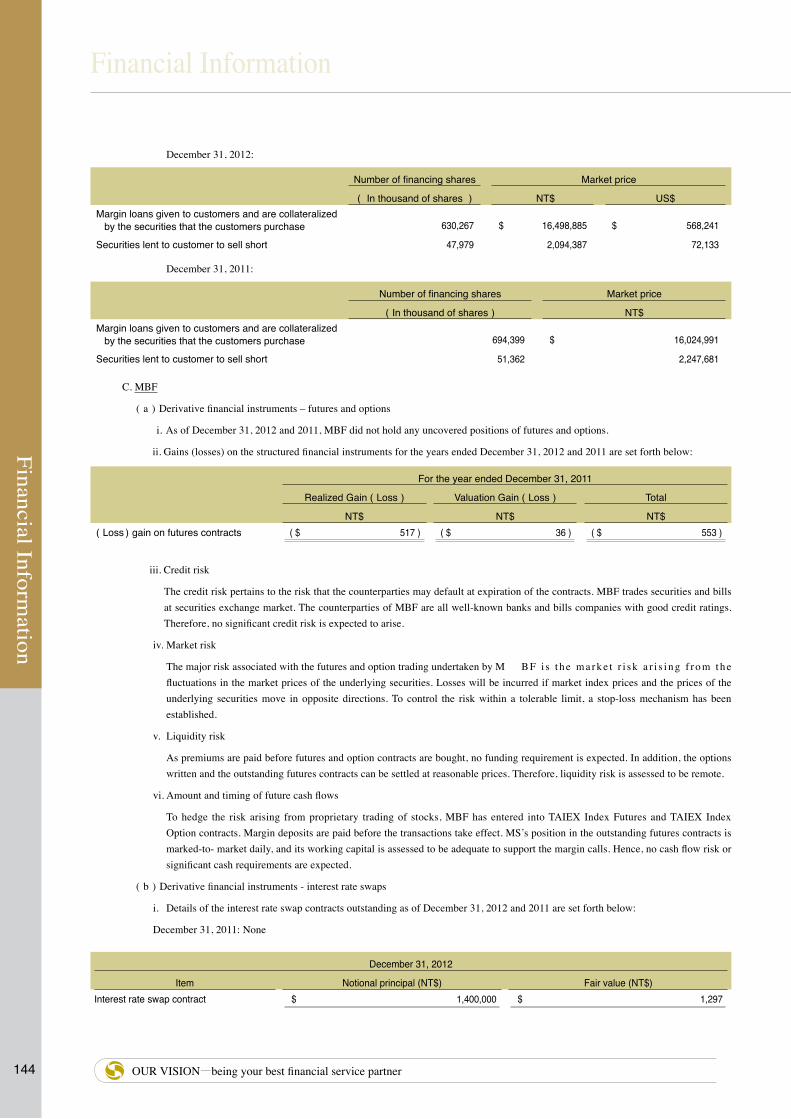
144
Financial Information
Financial Information
OUR VISION—being your best financial service partner
December 31, 2012:
Number of financing shares Market price
( In thousand of shares ) NT$ US$ Margin loans given to customers and are collateralized
by the securities that the customers purchase 630,267 $ 16,498,885 $ 568,241
Securities lent to customer to sell short 47,979 2,094,387 72,133
December 31, 2011:
Number of financing shares Market price
( In thousand of shares ) NT$Margin loans given to customers and are collateralized
by the securities that the customers purchase 694,399 $ 16,024,991
Securities lent to customer to sell short 51,362 2,247,681
C. MBF
( a ) Derivative financial instruments – futures and options
i. As of December 31, 2012 and 2011, MBF did not hold any uncovered positions of futures and options.
ii. Gains (losses) on the structured financial instruments for the years ended December 31, 2012 and 2011 are set forth below:
For the year ended December 31, 2011
Realized Gain ( Loss ) Valuation Gain ( Loss ) Total
NT$ NT$ NT$( Loss ) gain on futures contracts ( $ 517 ) ( $ 36 ) ( $ 553 )
iii. Credit risk
The credit risk pertains to the risk that the counterparties may default at expiration of the contracts. MBF trades securities and bills at securities exchange market. The counterparties of MBF are all well-known banks and bills companies with good credit ratings. Therefore, no significant credit risk is expected to arise.
iv. Market risk
The major risk associated with the futures and option trading undertaken by M B F i s t h e m a r k e t r i s k a r i s i n g f r o m t h e fluctuations in the market prices of the underlying securities. Losses will be incurred if market index prices and the prices of the underlying securities move in opposite directions. To control the risk within a tolerable limit, a stop-loss mechanism has been established.
v. Liquidity risk
As premiums are paid before futures and option contracts are bought, no funding requirement is expected. In addition, the options written and the outstanding futures contracts can be settled at reasonable prices. Therefore, liquidity risk is assessed to be remote.
vi. Amount and timing of future cash flows
To hedge the risk arising from proprietary trading of stocks, MBF has entered into TAIEX Index Futures and TAIEX Index Option contracts. Margin deposits are paid before the transactions take effect. MS’s position in the outstanding futures contracts is marked-to- market daily, and its working capital is assessed to be adequate to support the margin calls. Hence, no cash flow risk or significant cash requirements are expected.
( b ) Derivative financial instruments - interest rate swaps
i. Details of the interest rate swap contracts outstanding as of December 31, 2012 and 2011 are set forth below:
December 31, 2011: None
December 31, 2012
Item Notional principal (NT$) Fair value (NT$)Interest rate swap contract $ 1,400,000 $ 1,297

Financial Information
1452012 ANNUAL REPORT
December 31, 2012
Item Notional principal (US$) Fair value (US$)Interest rate swap contract $ 48,218 $ 45
ii. Gains (losses) on the interest rate swaps for the years ended December 31, 2012 and 2011 are set forth below:
For the year ended December 31, 2012
Realized Gain ( Loss ) Valuation Gain ( Loss ) Total
NT$ US$ NT$ US$ NT$ US$Interest rate swap ( $ 715 ) ( $ 25 ) ( $ 1,297 ) ( $ 45 ) ( $ 2,012 ) ( $ 69 )
For the year ended December 31, 2011
Realized Gain ( Loss ) Valuation Gain ( Loss ) Total
NT$ NT$ NT$Interest rate swap ( $ 1,037 ) $ 893 ( $ 144 )
iii. Credit risk
The credit risk pertains to the risk that the counterparties may default at expiration of the contracts. The counterparties of MBF are all well-known banks and securities companies with good credit ratings. Thus, the credit risk is assessed to be remote.
iv. Market risk
The market risk arises from the fluctuations in interest rates. When the interest rate moves in an unfavorable direction, the loss can be controlled within a tolerable limit. As a result, no significant market risk is expected.
v. Amount and timing of expected future cash flows
Upon settlement of the contracts, the amount of the notional principal multiplied by the interest rate differential is received or paid. As the amount settled is insignificant and the notional principal is not settled, no significant cash requirement is expected.
( c ) Derivative financial instruments - Cross currency swaps
i. As of December 31, 2012 and 2011, there was no transaction of immature currency swap contract.
ii. Gains (losses) on the cross currency swaps for the years ended December 31, 2012 and 2011 are set forth below:
For the year ended December 31, 2012
Realized Gain ( Loss ) Valuation Gain ( Loss ) Total
NT$ US$ NT$ US$ NT$ US$Interest rate swap ( $ 1) $ - $ - $ - ( $ 1) $ -
For the year ended December 31, 2011
Realized Gain ( Loss ) Valuation Gain ( Loss ) Total
NT$ NT$ NT$Interest rate swap ( $ 138 ) $ - ( $ 138 )
iii. Credit risk
The credit risk pertains to the risk that the counterparties may default at expiration of the contracts. The counterparties of MBF are all well-known banks and securities companies with good credit ratings. Thus, the credit risk is assessed to be remote.
iv. Market risk
The currency swap contracts MBF engages in are primarily for hedging exchange rate volatility of foreign currency bills and bonds positions. As the contract positions are similar to current positions in the contractual period, no material market risk is estimated.
v. Amount and timing of expected future cash flows
The amount of currency swaps MBF engages in is the difference received or paid with nominal principal multiplied by the exchange rate difference at maturity; the amount is not significant and the working capital of MBF will be sufficient to cover the amount; thus, there is no material extra cash demand.
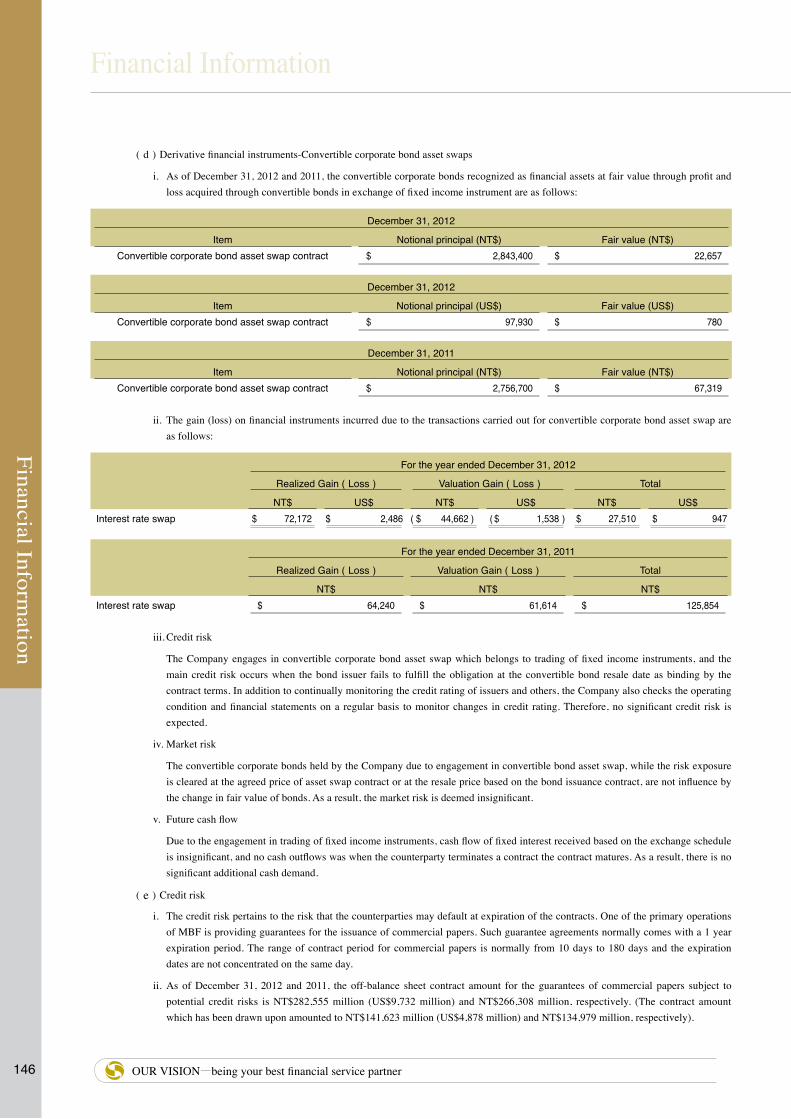
146
Financial Information
Financial Information
OUR VISION—being your best financial service partner
( d ) Derivative financial instruments-Convertible corporate bond asset swaps
i. As of December 31, 2012 and 2011, the convertible corporate bonds recognized as financial assets at fair value through profit and loss acquired through convertible bonds in exchange of fixed income instrument are as follows:
December 31, 2012
Item Notional principal (NT$) Fair value (NT$)Convertible corporate bond asset swap contract $ 2,843,400 $ 22,657
December 31, 2012
Item Notional principal (US$) Fair value (US$)Convertible corporate bond asset swap contract $ 97,930 $ 780
December 31, 2011
Item Notional principal (NT$) Fair value (NT$)Convertible corporate bond asset swap contract $ 2,756,700 $ 67,319
ii. The gain (loss) on financial instruments incurred due to the transactions carried out for convertible corporate bond asset swap are as follows:
For the year ended December 31, 2012
Realized Gain ( Loss ) Valuation Gain ( Loss ) Total
NT$ US$ NT$ US$ NT$ US$Interest rate swap $ 72,172 $ 2,486 ( $ 44,662 ) ( $ 1,538 ) $ 27,510 $ 947
For the year ended December 31, 2011
Realized Gain ( Loss ) Valuation Gain ( Loss ) Total
NT$ NT$ NT$Interest rate swap $ 64,240 $ 61,614 $ 125,854
iii. Credit risk
The Company engages in convertible corporate bond asset swap which belongs to trading of fixed income instruments, and the main credit risk occurs when the bond issuer fails to fulfill the obligation at the convertible bond resale date as binding by the contract terms. In addition to continually monitoring the credit rating of issuers and others, the Company also checks the operating condition and financial statements on a regular basis to monitor changes in credit rating. Therefore, no significant credit risk is expected.
iv. Market risk
The convertible corporate bonds held by the Company due to engagement in convertible bond asset swap, while the risk exposure is cleared at the agreed price of asset swap contract or at the resale price based on the bond issuance contract, are not influence by the change in fair value of bonds. As a result, the market risk is deemed insignificant.
v. Future cash flow
Due to the engagement in trading of fixed income instruments, cash flow of fixed interest received based on the exchange schedule is insignificant, and no cash outflows was when the counterparty terminates a contract the contract matures. As a result, there is no significant additional cash demand.
( e ) Credit risk
i. The credit risk pertains to the risk that the counterparties may default at expiration of the contracts. One of the primary operations of MBF is providing guarantees for the issuance of commercial papers. Such guarantee agreements normally comes with a 1 year expiration period. The range of contract period for commercial papers is normally from 10 days to 180 days and the expiration dates are not concentrated on the same day.
ii. As of December 31, 2012 and 2011, the off-balance sheet contract amount for the guarantees of commercial papers subject to potential credit risks is NT$282,555 million (US$9,732 million) and NT$266,308 million, respectively. (The contract amount which has been drawn upon amounted to NT$141,623 million (US$4,878 million) and NT$134,979 million, respectively).

Financial Information
1472012 ANNUAL REPORT
iii.Since MBF is only subject to payments in the event of default on the issuer of commercial papers in such guarantee contracts, the contract amount for such financial instruments does not represent the expected future cash outflow. In fact, the demand for future cash flow is less than the contract amount. When the guaranteed amount had been drawn upon and the underlying collateral or other collaterals has completely lost its values, the amount of credit risk exposure will equal to the contract amount which is the maximum potential loss.
iv. In granting guarantees for the issuance of commercial papers, MBF undertakes strict credit assessment and also demands appropriate collaterals from the customers as necessary. As of December 31, 2012 and 2011, the percentage of guarantees with collaterals is 52% and 48%, respectively. Collaterals provided normally include real estate properties, circulating securities or other properties, etc. In the event of customer defaults, the MBF assumes rights on such collaterals.
v. For all financial instruments held by the MBF, the maximum credit exposures are as follows:
December 31, 2012 December 31, 2011
Carrying value Maximum risk exposure amount Carrying valueMaximum risk
exposure amountFinancial assets NT$ US$ NT$ US$ NT$ NT$
Financial assets at fair value through profit or loss $ 129,072,587 $ 4,445,414 $ 129,072,587 $ 4,445,414 $ 135,756,870 $ 135,756,870
Receivables 1,261,152 43,436 1,261,152 43,436 1,833,166 1,833,166
Available-for-sale financial assets 81,883,882 2,820,178 81,883,882 2,820,178 83,240,989 83,240,989
Held-to-maturity financial assets 500,000 17,221 500,000 17,221 250,000 250,000
Other financial assets 1,299,398 44,753 1,299,398 44,753 822,684 822,684
Off-balance sheet guarantees 141,622,600 4,877,650 141,622,600 4,877,650 134,979,200 134,979,200
Total $ 355,639,619 $ 12,248,652 $ 355,639,619 $ 12,248,652 $ 356,882,909 $ 356,882,909
The credit exposure amounts stated above are for those with positive fair value as of the balance sheet date and those contracts with off-balance sheet commitments and guarantees. The disclosed maximum credit exposures did not take fair value of collateral into account.
vi. Information on concentrations of assets, liabilities and off-balance sheet items
There will be a significant concentration of credit risk when the counterparty of the financial instruments is highly concentrated in a single customer or a group of counterparties who engage mostly in similar business activities with similar economic nature, and such business activities make their abilities to fulfill the contractual obligations influenced similarly by the economic affairs or other situations. MBF does not engage in transactions that are concentrated significantly in a single customer or counterparty. However, significant credit risk concentrations (including on and off-balance sheet items) for provision of guarantees for commercial papers are as follows:
December 31, 2012 December 31, 2011
Carrying value Maximum risk exposure amount Carrying valueMaximum risk
exposure amountNT$ US$ NT$ US$ NT$ NT$
Manufacturing $ 42,788,200 $ 1,473,677 $ 42,788,200 $ 1,473,677 $ 40,706,000 $ 40,706,000
Financial & insurance 42,550,000 1,465,473 42,550,000 1,465,473 41,604,600 41,604,600
Real estate 25,558,400 880,262 25,558,400 880,262 26,135,600 26,135,600
Wholesale & retail 12,483,800 429,957 12,483,800 429,957 10,227,400 10,227,400
Services 6,189,900 213,187 6,189,900 213,187 5,056,900 5,056,900
Others – less than 5% of balance of guarantees at period end 12,052,300 415,095 12,052,300 415,095 11,248,700 11,248,700
Total $ 141,622,600 $ 4,877,651 $ 141,622,600 $ 4,877,651 $ 134,979,200 $ 134,979,200
vii.The following information is disclosed in accordance with “Guidelines for Preparation of Financial Reports by Publicly Listed Bills Finance Companies”.

148
Financial Information
Financial Information
OUR VISION—being your best financial service partner
1 ) Overview of main business
December 31, 2012 December 31, 2011
Item NT$ US$ NT$Total guarantees and endorsement for short-term bills $ 141,622,600 $ 4,877,651 $ 134,979,200Guarantees and endorsement for short-term bills / Net amount
( after deducting final accounts allotment ) ( Note ) 4.73 4.73 4.52Total bills and bonds sold under repurchase agreements 159,376,775 5,489,126 184,993,275Bills and bonds sold under repurchase agreements / Net amount
( after deducting final accounts allotment ) ( Note ) 5.32 6.19 6.19
2 ) Profile of concentration of credit risk and credit extensions of interested parties ( Expressed In Thousands of NT Dollars, % )
December 31, 2012 December 31, 2011Amount of credit extensions to interested parties $ 545,000 $ 210,000Ratio of credit extensions to interested parties ( % ) ( Note 1 ) 0.38 0.16Ratio of credit extensions secured by stocks ( % ) ( Note 2 ) 17.62 17.97
Industry concentration ( % ) ( Top 3 industries with highest ratio of credit extension amount ) ( Note 3 )
Industry Ratio ( % ) Industry Ratio ( % ) Manufacturing 30.21 Financial & Insurance 30.82Financial & Insurance 30.04 Manufacturing 30.16Real estate 18.05 Real estate 19.36
Note 1 : The ratio of credit extensions to interested parties = the amount of credit extensions to interested parties / the total amount of all credit extensions.Note 2: The ratio of credit extensions secured by stocks = the amount of credit extensions secured by stocks / the total amounts of all credit extensions.Note 3: Total amount of credit extensions include loans, bills discounted, acceptances receivable, guarantees receivable, and advance accounts for
factoring receivable.
3 ) Policy of reserve for losses and movements of allowance for credit losses
MBF has evaluated the allowance and reserves for bills receivable, accounts receivable, overdue loans, and the ending balance guaranteed by commercial papers by considering unrecoverable risks and analyzed the possibility of loss based on “Regulations Governing the Procedures for Bills Finance Companies to Evaluate Assets, Set Aside Loss Reserves, and Handle Non-Performing Credit, Non-Accrual Loans, and Bad Debt”. Movements in allowance and reserves for bills receivable, accounts receivable, overdue loans are as follows:
For the year ended December 31,
2012 2011
NT$ US$ NT$Beginning balance $ 2,911,927 $ 100,290 $ 2,903,376Provisions 126,379 4,353 89,757Write-off ( 44,998 ) ( 1,550 ) ( 111,323 )
Deferred incomes transferred 6,352 219 30,117
Ending balance $ 2,999,660 $ 103,312 $ 2,911,927
( f ) Market risk
Market risk is the risk of potential decrease in values due to changes in interest rate. Fluctuations in market interest rates results in changes in the fair value of debt investments. The market interest rate risks associated with financial instruments held by MBF is appropriately managed within specified quota and limit for potential losses.
( g ) Liquidity risk
i. The operating capital of MBF is sufficient to meet cash flows for all contractual obligations; therefore, there is no liquidity risk regarding inability to raise capital to meet existing contractual obligations.
ii. Since the derivative financial instruments possessed by MBF are primarily associated with major foreign currency contracts, the liquidity risk is low for the possibility of inability to sell such instruments at reasonable price in the market.
iii. MBF’s fundamental management policy is to match the maturity date and interest rate on assets and liabilities and control cap arising from any mismatch. Due to uncertainty of terms and variety of types, maturity date and interest rate on assets and liabilities usually cannot fully match up, such mismatch may result to either potential gain or loss. As of December 31, 2012 and 2011, the carrying amounts of financial assets and financial liabilities are classified according to their time-to-maturity as follows:

Financial Information
1492012 ANNUAL REPORT
( In Thousand of NT Dollars )
December 31, 2012
Less than 1 month
1 to 3months
3 months to 1 year
1 to 2years
2 to 3years
3 to 4years
4 to 5years
Over5 years Total
AssetsFinancial assets at fair value
through profit or loss
Investment in bills $ 59,030,601 $ 44,905,484 $ 21,274,262 $ - $ - $ - $ - $ - $125,210,347Investment in foreign currency bills - - 11,276 - - - - - 11,276Buy Fixed rate commercial paper - - 38 4,064 14,612 - - - 18,714Bond investments-government bonds - - - - - - - 547,892 547,892Bond investments –
convertible corporate bonds - - 73,173 38,448 169,768 45,194 79,141 - 405,724Convertible corporate bond asset swaps 9,000 50,115 939,373 904,279 972,290 - - - 2,875,057
Available-for-sale financial assetsBond investments – government bonds - 13,067,261 1,009,008 10,230,002 8,111,008 8,496,721 6,141,735 5,358,055 52,413,790Bond investments – financial bonds - - - - - 1,196,477 695,799 2,042,429 3,934,705Bond investments – corporate bonds - - 2,065,502 1,670,279 1,403,509 4,685,697 10,976,955 1,015,772 21,817,714Bond investments – foreign
corporate bonds - - 145,162 - - - - - 145,162Beneficiary or asset-backed securities - - - - - 415,866 - - 415,866
Held-to-maturity financial assets - - - - 250,000 250,000 - - 500,000Total assets $ 59,039,601 $ 58,022,860 $ 25,517,794 $ 12,847,072 $ 10,921,187 $ 15,089,955 $ 17,893,630 $ 8,964,148 $208,296,247
LiabilitiesFinancial liabilities at fair value through
profit or lossSell fixed rate commercial paper - - - ( 1,857 ) - - - - ( 1,857 )Derivative interest rate charge - - - - ( 1,297 ) - - - ( 1,297 )Bills and bonds sold under repurchase
agreements ( 138,930,365 ) ( 18,175,014 ) ( 2,271,396 ) - - - - - ( 159,376,775 )Total liabilities ( 138,930,365 ) ( 18,175,014 ) ( 2,271,396 ) ( 1,857 ) ( 1,297 ) - - - ( 159,379,929 )
Net Liquidity Gap ($ 79,890,764 ) $ 39,847,846 $ 23,246,398 $ 12,845,215 $ 10,919,890 $ 15,089,955 $ 17,893,630 $ 8,964,148 $208,296,247
( In Thousand of US Dollars )
December 31, 2012
Less than 1 month
1 to 3months
3 months to 1 year
1 to 2years
2 to 3years
3 to 4years
4 to 5years
Over5 years Total
AssetsFinancial assets at fair value
through profit or loss
Investment in bills $ 2,033,084 $ 1,546,598 $ 732,711 $ - $ - $ - $ - $ - $ 4,312,393Investment in foreign currency bills - - 388 - - - - - 388Buy Fixed rate commercial paper - - 2 140 503 - - - 645Bond investments-government bonds - - - - - - - 18,870 18,870Bond investments –
convertible corporate bonds - - 2,520 1,324 5,847 1,557 2,726 - 13,974Convertible corporate bond asset swaps 310 1,726 32,353 31,144 33,487 - - - 99,020
Available-for-sale financial assetsBond investments – government bonds - 450,052 34,751 352,333 279,353 292,637 211,529 184,538 1,805,193Bond investments – financial bonds - - - - - 41,208 23,964 70,344 135,516Bond investments – corporate bonds - - 71,138 57,527 48,339 161,381 378,059 34,984 751,428Bond investments – foreign
corporate bonds - - 5,000 - - - - - 5,000
Beneficiary or asset-backed securities - - - - - 14,323 - - 14,323Held-to-maturity financial assets - - - - 8,610 8,610 - - 17,220
Total assets $ 2,033,394 $ 1,998,376 $ 878,863 $ 442,468 $ 376,139 $ 519,716 $ 616,278 $ 308,736 $ 7,173,970
LiabilitiesFinancial liabilities at fair value through
profit or lossSell fixed rate commercial paper - - - ( 64 ) - - - - ( 64 )Derivative interest rate charge - - - - ( 45 ) - - - ( 45 )Bills and bonds sold under repurchase
agreements ( 4,784,927 ) ( 625,969 ) ( 78,229 ) - - - - - ( 5,489,125 )Total liabilities ( 4,784,927 ) ( 625,969 ) ( 78,229 ) ( 64 ) ( 45 ) - - - ( 5,489,235 )
Net Liquidity Gap ($ 2,751,533 ) $ 1,372,407 $ 800,634 $ 442,404 $ 376,094 $ 519,716 $ 616,278 $ 308,736 $ 1,684,736

150
Financial Information
Financial Information
OUR VISION—being your best financial service partner
( In Thousand of NT Dollars )
December 31, 2011
Less than 1 month
1 to 3months
3 months to 1 year
1 to 2years
2 to 3years
3 to 4years
4 to 5years
Over5 years Total
AssetsFinancial assets at fair value
through profit or loss
Investment in bills $ 53,159,878 $ 55,178,808 $ 22,632,884 $ - $ - $ - $ - $ - $ 130,971,570Investment in foreign currency bills - - 11,723 - - - - 11,723Fixed rate commercial paper - - - 345 6,676 - - - 7,021Bond investments –
convertible corporate bonds 34,104 - 720,553 91,218 128,921 575,520 350,742 - 1,901,058Convertible corporate bond asset
swaps - 65,280 372,994 1,075,491 1,310,254 - - - 2,824,019
Available-for-sale financial assetsBond investments – government bonds 8,492,452 2,506,905 9,257,815 14,289,273 10,362,460 8,444,583 8,672,807 5,344,585 67,370,880Bond investments – financial bonds - - 50,000 - - - 518,548 1,662,479 2,231,027Bond investments – foreign
financial bonds - - 30,127 - - - --
30,127Bond investments – corporate bonds - - 3,474,447 2,127,345 1,675,078 1,414,534 1,691,614 - 10,383,018Bond investments – foreign
corporate bonds - - - 151,015 - - - - 151,015Beneficiary or asset-backed securities - - - - - - 416,732 - 416,732
Held-to-maturity financial assets - - 250,000 - - - - - 250,000
Total assets $ 61,686,434 $ 57,750,993 $ 36,800,543 $ 17,734,687 $ 13,483,389 $ 10,434,637 $ 11,650,443 $ 7,007,064 $ 216,548,190
LiabilitiesBills and bonds sold under repurchase
agreements ( 137,952,107 ) ( 44,006,887 ) ( 3,034,281 ) - - - - - ( 184,993,275 )Total liabilities ( 137,952,107 ) ( 44,006,887 ) ( 3,034,281 ) - - - - - ( 184,993,275 )
Net Liquidity Gap ($ 76,265,673 ) $ 13,744,106 $ 33,766,262 $ 17,734,687 $ 13,483,389 $ 10,434,637 $ 11,650,443 $ 7,007,064 $ 31,554,915
iv. Supplementary information in accordance with the Regulations
December 31, 2012 Unit : In Millions of NT dollars
1-30 days 31-90 days 91-180 days 181 days to 1 year Over 1 year
Utilization of Capital
Bills 59,031 44,906 16,899 4,386 -
Bonds 9 13,117 639 3,594 65,697
Bank deposits 766 300 - 200 -
Loans extended - - - - -Bills and bonds purchased
under resale agreements - - - - -
Total 59,806 58,323 17,538 8,180 65,697
Sources of Capital
Loans borrowed 20,861 - - - -Bills and bonds sold under
repurchased agreements 138,931 18,175 2,236 35 -
Own capital - - - - 32,819
Total 159,792 18,175 2,236 35 32,819
Net Flow of Capital ( 99,986 ) 40,148 15,302 8,145 32,878
Accumulated Net Flow of Capital ( 99,986 ) ( 59,838 ) ( 44,536 ) ( 36,391 ) ( 3,513 )

Financial Information
1512012 ANNUAL REPORT
December 31, 2012Unit : In Millions of US dollars
1-30 days 31-90 days 91-180 days 181 days to 1 year Over 1 year
Utilization of Capital
Bills 2,033 1,547 582 151 -
Bonds - 452 22 124 2,263
Bank deposits 26 10 - 7 -
Loans extended - - - - -
Bills and bonds purchased under resale agreements - - - - -
Total 2,059 2,009 604 282 2,263
Sources of Capital
Loans borrowed 718 - - - -
Bills and bonds sold under repurchased agreements 4,785 626 77 1 -
Own capital - - - - 1,130
Total 5,503 626 77 1 1,130
Net Flow of Capital ( 3,444 ) 1,383 527 281 1,133
Accumulated Net Flow of Capital ( 3,444 ) ( 2,061 ) ( 1,534 ) ( 1,253 ) ( 121 )
December 31, 2011 Unit : In Millions of NT dollars
1-30 days 31-90 days 91-180 days 181 days to 1 year Over 1 year
Utilization of Capital
Bills 53,160 55,179 15,700 6,944 -
Bonds 8,527 2,572 2,360 11,445 60,654
Bank deposits 671 130 - 200 -
Loans extended - - - - -Bills and bonds purchased
under resale agreements - - - - -
Total 62,358 57,881 18,060 18,589 60,654
Sources of Capital
Loans borrowed 3,416 - - - -Bills and bonds sold under
repurchased agreements 137,952 44,007 2,229 805 -
Own capital - - - - 32,595
Total 141,368 44,007 2,229 805 32,595
Net Flow of Capital ( 79,010 ) 13,874 15,831 17,784 28,059
Accumulated Net Flow of Capital ( 79,010 ) ( 65,136 ) ( 49,305 ) ( 31,521 ) ( 3,462 )
( h ) Cash flow risk and fair value risk associated with movements in interest rates
1 ) As of December 31, 2012 and 2011, a subsidiary holds floating interest-earning assets and floating interest-bearing liabilities. Future cash flows of such assets and liabilities may fluctuate and result in risk due to market interest rate. The following table shows the interest rate risk of the subsidiary, and is presented by the book value of financial assets and financial liabilities and is classified by the earlier of the expected repricing date or expected maturity date:

152
Financial Information
Financial Information
OUR VISION—being your best financial service partner
( In Thousand of NT Dollars )
December 31, 2012
Less than 1 month
1 to 3 months
3 months to 1 year
1 to 2 years
2 to 3 years
3 to 4 years
4 to 5 years
Over 5 years
Total
Assets
Available-for-sale financial assets
Corporate bonds with floating rate $ 10,000 $ 1,200,000 $ - $ - $ - $ - $ - $ - $ 1,210,000
Total assets $ 10,000 $ 1,200,000 $ - $ - $ - $ - $ - $ - $ 1,210,000
LiabilitiesFinancial liabilities at fair value throughprofit or loss ( 1,297 ) - $ - $ - $ - $ - $ - $ - ( 1,297 )
Derivative products-interest rate charge ( 1,297 ) - $ - $ - $ - $ - $ - $ - ( 1,297 )
Total liabilities $ 8,703 $ 1,200,000 $ - $ - $ - $ - $ - $ - $ 1,208,703
( In Thousand of US Dollars )
December 31, 2012
Less than 1 month
1 to 3 months
3 months to 1 year
1 to 2 years
2 to 3 years
3 to 4 years
4 to 5 years
Over 5 years
Total
Assets
Available-for-sale financial assets
Corporate bonds with floating rate $ 344 $ 41,329 $ - $ - $ - $ - $ - $ - $ 41,673
Total assets $ 344 $ 41,329 $ - $ - $ - $ - $ - $ - $ 41,673
LiabilitiesFinancial liabilities at fair value throughprofit or loss ( 44 ) - $ - $ - $ - $ - $ - $ - ( 44 )
Derivative products-interest rate charge ( 44 ) - $ - $ - $ - $ - $ - $ - ( 44 )
Total liabilities $ 300 $ 41,329 $ - $ - $ - $ - $ - $ - $ 41,629
( In Thousand of NT Dollars )
December 31, 2011
Less than 1 month
1 to 3 months
3 months to 1 year
1 to 2 years
2 to 3 years
3 to 4 years
4 to 5 years
Over 5 years
Total
Assets
Available-for-sale financial assets
Corporate bonds with floating rate $ 10,000 $ 700,000 $ 50,000 $ - $ - $ - $ - $ - $ 760,000
Total assets $ 10,000 $ 700,000 $ 50,000 $ - $ - $ - $ - $ - $ 760,000
2 ) Market interest rate (Excluding financial assets held for trading)
Items of financial assets December 31, 2012 December 31, 2011
Available-for-sale financial assets
Bond investments - government bonds 0.5690%-1.5941% 0.7356%-1.7457%
Bond investments - financial bonds 1.2278%-2.0058% 2.1441%-2.4288%
Bond investments - foreign financial bonds - 4.1116%
Bond investments - corporate bonds 0.9585%-1.6527% 0.9012%-1.8473%
Bond investments - foreign corporate bonds 2.7983% 2.9465%
Beneficiary or asset-backed securities 1.1615% 1.3181%
Held-to-maturity financial assets
Bond investments - corporate bonds 2.0000%-2.0800% 3.4000%

Financial Information
1532012 ANNUAL REPORT
D. CKI
CKI holds various types of financial instruments. The goal of risk management of CKI is to achieve optimal asset allocation position, maintain proper liquidity position, and manage all market risk centralized by considering the economic environment, competition condition and impact on market value risk. In order to achieve this goal as well as effectively control and measure market risk, credit risk and liquidity risk, for different financial risks, CKI’s financial risks and control strategies are as follows:
( a ) Interest rate risk
The interest-rate-linked financial products held by CKI are mainly fixed interest rate products and they have no significant interest rate risks. However, the fair value of bonds would change due to fluctuations in market interest rate. CKI undertakes derivative financial instruments such as interest rate swaps to hedge cash flow risk and fair value risk arising from fluctuations in interest rates. To mitigate interest rate risk, CKI also closely monitors interest rate trends and sets a stop-loss amount on the derivatives undertaken.
( b ) Foreign exchange rate risks
The foreign currency quotas of CKI’s utilization of operating capital primarily include time deposits and funds denominated in foreign currencies with strong international influence. CKI observes and researches factors affecting trends of exchange rates including both domestic and international economic environment and interests on a periodic basis. CKI analyzes the variability of New Taiwan dollars in response to foreign exchange rates. In addition, CKI also adopts the method of maintaining a basket of various foreign currencies in order to hedge foreign exchange rate risks.
( c ) Price risks
CKI sets limits to control the transaction volume and stop-loss amount of derivatives to reduce its market risk. CKI is exposed to equity securities price risk because of investments held by CKI, but CKI sets stop-loss amount of derivatives to reduce its market risk.
( d ) Credit risks
Financial instruments held by CKI are exposed to potential loss due to failure of counterparties in meeting obligations when they come due. CKI utilizes capital in compliance to Insurance Law No.146 and related regulations, companies with equivalent credit ratings or issuance and guarantees from reputable financial institutions must be obtained and confirmed prior to entering every transaction for investments. In addition, the amounts of transactions cumulated by each counterparty are bound to strict restrictions established by laws. As a result, CKI should have no significant credit risks.
( e ) Liquidity risks
CKI’s operating capital is adequate in meeting demand for cash outflows, thus there is no liquidity risk regarding inability to raise capital for meeting contractual obligations. CKI’s investments in bonds are traded in active markets; therefore, these financial assets are expected to be sold in the market at prices approximate to their fair values.
( f ) Details of calculation of gross premiums are as follows:Expressed in thousands of NT dollars
For the year ended December 31, 2012
TypePremium
income ( 1 ) Reinsurance
premium ( 2 )
Reinsurance premiums
ceded ( 3 )
Retained insurance premiums
( 4 )=( 1 )+( 2 )-( 3 )
Compulsory insurance $ 409,283 $ 99,763 $ 114,820 $ 394,226
Non-compulsory insurance 5,511,399 643,332 2,952,985 3,201,746
Total $ 5,920,682 $ 743,095 $ 3,067,805 $ 3,595,972
Expressed in thousands of NT dollars
For the year ended December 31, 2012
TypeProvision of reserve for unearned premiums ( 5 )
Reserve released for unearned premiums ( 6 )
Gross premiums ( 7 )=( 4 )-( 5 )+( 6 )
Compulsory insurance $ 164,108 $ 167,757 $ 397,875
Non-compulsory insurance 1,821,024 1,649,450 3,030,172
Total $ 1,985,132 $ 1,817,207 $ 3,428,047

154
Financial Information
Financial Information
OUR VISION—being your best financial service partner
Expressed in thousands of US dollars
For the year ended December 31, 2012
TypePremium
income ( 1 ) Reinsurance
premium ( 2 )
Reinsurance premiums
ceded ( 3 )
Retained insurance premiums
( 4 )=( 1 )+( 2 )-( 3 )
Compulsory insurance $ 14,096 $ 3,436 $ 3,954 $ 13,578
Non-compulsory insurance 189,819 22,157 101,704 110,272
Total $ 203,915 $ 25,593 $ 105,658 $ 123,850
Expressed in thousands of US dollars
For the year ended December 31, 2012
TypeProvision of reserve for unearned premiums ( 5 )
Reserve released for unearned premiums ( 6 )
Gross premiums ( 7 )=( 4 )-( 5 )+( 6 )
Compulsory insurance $ 5,652 $ 5,777 $ 13,703
Non-compulsory insurance 62,718 56,809 104,363
Total $ 68,370 $ 62,586 $ 118,066
Expressed in thousands of NT dollars
For the year ended December 31, 2011
TypePremium
income ( 1 ) Reinsurance
premium ( 2 )
Reinsurance premiums
ceded ( 3 )
Retained insurance premiums
( 4 )=( 1 )+( 2 )-( 3 )
Compulsory insurance $ 426,346 $ 96,098 $ 120,346 $ 402,098
Non-compulsory insurance 5,031,401 568,130 2,848,390 2,751,141
Total $ 5,457,747 $ 664,228 $ 2,968,736 $ 3,153,239
Expressed in thousands of NT dollars
For the year ended December 31, 2011
TypeProvision of reserve for unearned premiums ( 5 )
Reserve released for unearned premiums ( 6 )
Gross premiums ( 7 )=( 4 )-( 5 )+( 6 )
Compulsory insurance $ 167,757 $ 160,660 $ 395,001
Non-compulsory insurance 1,640,750 1,525,581 2,635,972
Total $ 1,808,507 $ 1,686,241 $ 3,030,973
( g ) Details of calculation of net claims are as follows:Expressed in thousands of NT dollars
For the year ended December 31, 2012
TypeClaims
incurred ( 1 )
ReinsuranceClaims
incurred ( 2 )
Claims recoveredfrom
reinsurers ( 3 ) Net claims
( 4 )=( 1 )+( 2 )-( 3 )
Compulsory insurance $ 399,651 $ 109,811 $ 157,088 $ 352,374
Non-compulsory insurance 2,543,326 388,936 1,190,532 1,741,730
Total $ 2,942,977 $ 498,747 $ 1,347,620 $ 2,094,104
Expressed in thousands of US dollars
For the year ended December 31, 2012
TypeClaims
incurred ( 1 )
ReinsuranceClaims
incurred ( 2 )
Claims recoveredfrom
reinsurers ( 3 ) Net claims
( 4 )=( 1 )+( 2 )-( 3 )
Compulsory insurance $ 13,764 $ 3,782 $ 5,410 $ 12,136
Non-compulsory insurance 87,595 13,395 41,003 59,987
Total $ 101,359 $ 17,177 $ 46,413 $ 72,123

Financial Information
1552012 ANNUAL REPORT
Expressed in thousands of NT dollars
For the year ended December 31, 2011
TypeClaims
incurred ( 1 )
ReinsuranceClaims
incurred ( 2 )
Claims recoveredfrom
reinsurers ( 3 ) Net claims
( 4 )=( 1 )+( 2 )-( 3 )
Compulsory insurance $ 314,357 $ 96,874 $ 124,386 $ 286,845
Non-compulsory insurance 2,755,857 255,231 1,520,584 1,490,504
Total $ 3,070,214 $ 352,105 $ 1,644,970 $ 1,777,349
( h ) Details of balance, provisions and reserve released for unearned premiums are as follows:Expressed in thousands of NT dollars
For the year ended December 31, 2012
Compulsory automobile liability insurance for car
Beginningbalance
Provision of reserve for unearned
premiums
Reserve released for unearned
premiums Ending balance
Reserve for unearned premiums $ 141,136 $ 143,837 ($ 141,136 ) $ 143,837
Reserve for catastrophic losses 187,943 - ( 107,941 ) 80,002
Reserve for outstanding losses (Note) 95,814 131,376 ( 95,814 ) 131,376
Total $ 424,893 $ 275,213 ($ 344,891 ) $ 355,215
For the year ended December 31, 2012
Compulsory automobile liability insurance for motorcycle
Beginningbalance
Provision of reserve for unearned
premiums
Reserve released for unearned
premiums Ending balance
Reserve for unearned premiums $ 98,867 $ 88,438 ($ 98,867 ) $ 88,438
Reserve for catastrophic losses 335,140 12,310 - 347,450
Reserve for outstanding losses (Note) 16,597 21,415 ( 16,597 ) 21,415
Total $ 450,604 $ 122,163 ($ 115,464 ) $ 457,303
Expressed in thousands of US dollars
For the year ended December 31, 2012
Compulsory automobile liability insurance for car
Beginningbalance
Provision of reserve for unearned
premiums
Reserve released for unearned
premiums Ending balance
Reserve for unearned premiums $ 4,860 $ 4,954 ($ 4,860 ) $ 4,954
Reserve for catastrophic losses 6,473 - ( 3,718 ) 2,755
Reserve for outstanding losses (Note) 3,300 4,525 ( 3,300 ) 4,525
Total $ 14,634 $ 9,479 ($ 11,878 ) $ 12,234
For the year ended December 31, 2012
Compulsory automobile liability insurance for motorcycle
Beginningbalance
Provision of reserve for unearned
premiums
Reserve released for unearned
premiums Ending balance
Reserve for unearned premiums $ 3,405 $ 3,405 ($ 3,405 ) $ 3,045
Reserve for catastrophic losses 11,543 424 - 11,967
Reserve for outstanding losses (Note) 572 738 ( 572 ) 738
Total $ 15,520 $ 4,207 ($ 3,977 ) $ 15,750

156
Financial Information
Financial Information
OUR VISION—being your best financial service partner
Expressed in thousands of NT dollars
For the year ended December 31, 2011
Compulsory automobile liability insurance for car
Beginningbalance
Provision of reserve for unearned
premiums
Reserve released for unearned
premiums Ending balance
Reserve for unearned premiums $ 138,329 $ 141,136 ($ 138,329 ) $ 141,136
Reserve for catastrophic losses 239,855 - ( 51,912 ) 187,943
Reserve for outstanding losses (Note) 90,128 95,814 ( 90,128 ) 95,814
Total $ 468,312 $ 236,950 ($ 280,369 ) $ 424,893
For the year ended December 31, 2011
Compulsory automobile liability insurance for motorcycle
Beginningbalance
Provision of reserve for unearned
premiums
Reserve released for unearned
premiums Ending balance
Reserve for unearned premiums $ 88,961 $ 98,867 ($ 88,961 ) $ 98,867
Reserve for catastrophic losses 298,127 37,013 - 335,140
Reserve for outstanding losses (Note) 13,716 16,598 ( 13,717 ) 16,597
Total $ 400,804 $ 152,478 ($ 102,678 ) $ 450,604
Note:Including claims on reported but not paid and incurred but not reported.
( i ) Net premiums:
For the years ended December 31, 2012 and 2011, net premiums of the respective insurances are as follows:
For the years ended December 31,
2012 2011
NT$ US$ NT$General fire insurance $ 1,000,000 $ 34,441 $ 1,000,000
Fire & allied perils insurance 1,000,000 34,441 1,000,000
Marine cargo insurance 200,000 6,888 200,000
Marine hull insurance 200,000 6,888 200,000
Fishing vessel insurance 50,000 1,722 50,000
Aviation insurance USD10,000 10,000 USD10,000
Engineering insurance 1,000,000 34,441 1,000,000
Money insurance 300,000 10,332 200,000
Motor physical damage insurance 6,500 224 6,000
Motor third party liability insurance 75,000 2,583 60,000
Motor passengers liability insurance 75,000 2,583 75,000
Compulsory automobile liability insurance for motorcycle All retained All retained All retained
Car driver injury insurance All retained All retained All retained
Driver injury insurance All retained All retained All retained
Liability insurance 200,000 6,888 200,000
Fidelity bond insurance 50,000 1,722 50,000
Engineering bond insurance 200,000 6,888 200,000
Bankers’ bond insurance 500,000 17,221 500,000
Other insurance 200,000 6,888 200,000
Other credit and bond insurance 120,000 4,133 120,000
Nuclear energy insurance 300,000 10,332 200,000
Group accident insurance 20,000 689 20,000
Personal accident insurance 20,000 689 20,000
Travel accident insurance 20,000 689 20,000

Financial Information
1572012 ANNUAL REPORT
( j ) Qualified reinsurance reserve
i. The summarized content in respect of ineligible reinsurance contract and related explanation for each insurance type are as follows:
CKI entered into outward reinsurance contracts with Sunbright Ins. Pte. Ltd. and Walsun Insurance. The scope of the reinsurance contracts is the same as the reinsurance contracts of CKI.
Insurance company / insurance agent Type of outward reinsurance contract
Walsun Insurance Construction insurance
Aon Taiwan Ltd. Fire & allied perils insurance
Marsh Ltd. Taiwan Branch Fire & allied perils insurance
Howden Insurance Brokers Ltd. Taiwan Branch Fire & allied perils insurance
Century International Insurance Broker Co., Ltd. Fire & allied perils insurance
Elite Risk Services Ltd. Fire & allied perils insurance
Formosa Marine & Insurance Service Co., Inc Fire & allied perils insurance
Wiilson Re Hull insurance
ii. The unqualified reinsurance expense was NT$136,383 thousand (US$4,697 thousand) and NT$171,661 for the years ended December 31, 2012 and 2011, respectively.
As of December 31, 2012 and 2011, the unqualified reinsurance reserve are unearned premium reserve. Details are set forth as below:
December 31, 2012 December 31, 2011
NT$ US$ NT$
Unearned premium reserve $ 68,192 $ 2,349 $ 85,830
Reported but not paid ceded reserve $ 2,735 $ 94 $ -
E. MITC
Accounts receivable: management fees and sales fees receivable and other receivables (including related parties)
( a ) Market risk
All receivables of the Company mature within 1 year; hence, no significant market risk is expected.
( b ) Credit risk
The Company’s credit policy should be assessed and procedures confirmed. For receivables- related parties, as debtors are with good credit, no significant credit risk is expected.
( c ) Liquidity risk
All receivables of the Company mature within 1 year; hence, no significant liquidity risk is expected.
( d ) Cash flow risk associated with movement in interest rates
All receivables of the Company mature within 1 year; hence, there is no cash flow risk associated with movement in interest rates.
F. MAM
Financial instruments held by the MAM mainly include cash and cash equivalents, short-term loans, short-term bills payable and long-term loans, etc. MAM takes advantage of such financial instruments to adjust for the demand for operating capitals. In addition, MAM also holds other financial assets and liabilities, such as obligor receivables purchased and payables incurred as a result of operating activities, and rent receivable.
( a ) Cash flow risk associated with movements in interest rates
The following table shows the interest rate risk of MAM, and is presented by the book value of financial instruments and is classified by the earlier of the expected maturity date:

158
Financial Information
Financial Information
OUR VISION—being your best financial service partner
i. Fixed interest rate
Expressed in thousands of NT dollars
Within 1 year 1 ~ 2 years Over 2 years Total
Short-term loans $ 4,487,000 $ - $ - $ 4,487,000
Short-term bills payable 1,514,251 - - 1,514,251
Expressed in thousands of US dollars
Within 1 year 1 ~ 2 years Over 2 years Total
Short-term loans $ 154,538 $ - $ - $ 154,538
Short-term bills payable 52,153 - - 52,153
ii. Floating interest rate
Expressed in thousands of NT dollars
Within 1 year 1 ~ 2 years Over 2 years Total
Bank deposits $ 16,987 $ - $ - $ 16,987
Restricted assets – current 3 - - 3
Short-term loans - - 2,054,000 2,054,000
Expressed in thousands of US dollars
Within 1 year 1 ~ 2 years Over 2 years Total
Bank deposits $ 585 $ - $ - $ 585
Restricted assets – current - - - -
Short-term loans - - 70,742 70,742
Interests of financial instruments with floating interest rate are repriced within 1 year; interests of financial instruments with fixed interest rate are fixed until maturity. Other financial instruments excluded from the above table are financial instruments with no interests, as they do not have interest rate risk, they are excluded from the above table.
( b ) Credit risk
Transactions are conducted only with approved counterparties with good credit conditions. According to MAM’s policy, MAM assesses the credit standing of the counterparty before entering into transactions and assesses collectability of receivables and notes receivable on a periodic basis, and thereafter a payment due date is assigned for each counterparty according to assessments on their relative credit standings. Therefore, there is no doubtful account.
( c ) Liquidity risk
MAM achieves the objectives of effective use of capital and stabilization of capital by adjusting capital through the use of cash and cash equivalents, bank loans and short-term bills payable, etc. The operating capital of the Company is sufficient in meeting capital on demand; therefore, no significant liquidity risk is expected to occur.
( 5 ) Risk management and hedging strategy
A. The Company
Non-derivative financial assets and liabilities held by the Company mainly includes cash and cash equivalents, bonds and bills sold under repurchase agreements, and bond payable, etc. The Company takes advantage of such financial instruments to adjust for the demand for operating capitals. In addition, the Company also holds other financial assets and liabilities, such as receivables and payables incurred as a result of operating activities.
The primary risks of the Company's financial instruments are cash flow risk associated with interest rate variations, credit risks and liquidity risks. The risk management policies approved by the Board of Directors are as follows:
i. Cash flow risks associated with interest rate variations
The Company's major exposure to cash flow risk associated with interest rate variations comes primarily from corporate bonds payable with floating interest. The Company adopts a combination of fixed interest and floating interest rate methods in issuance of loans to manage such interest rate risks. In addition, the Company also engages in interest rate swaps to enhance the effectiveness of interest rate management.
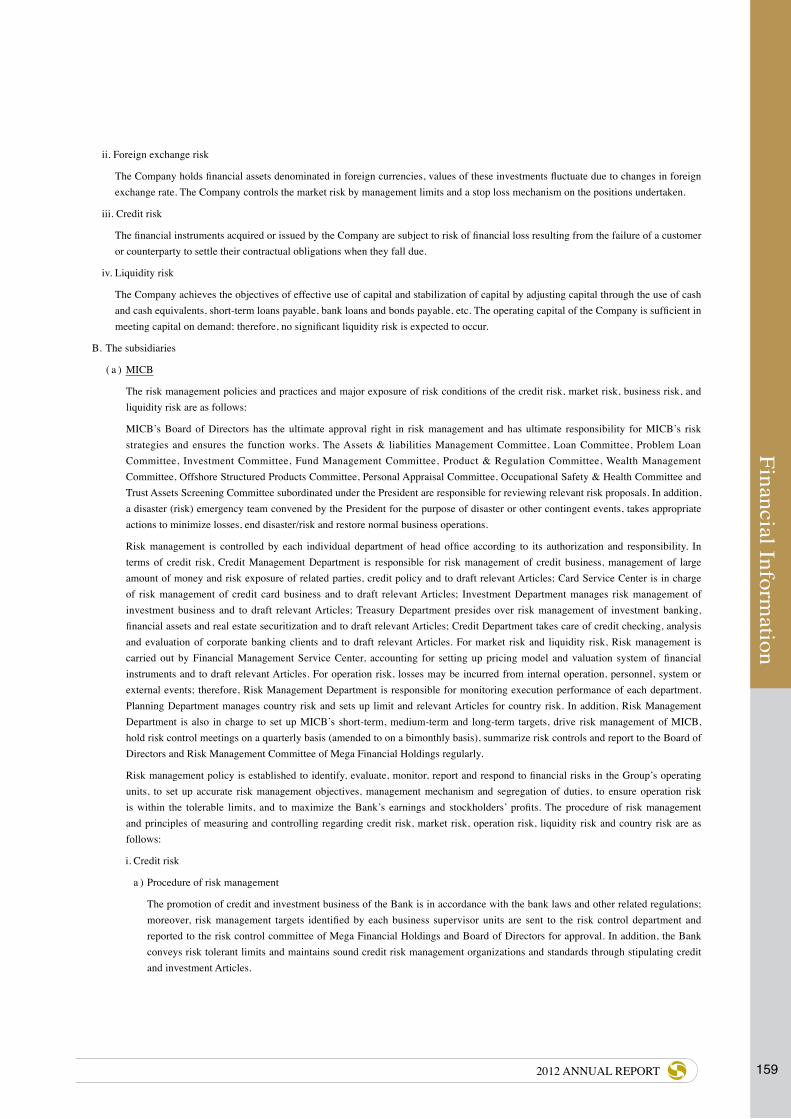
Financial Information
1592012 ANNUAL REPORT
ii. Foreign exchange risk
The Company holds financial assets denominated in foreign currencies, values of these investments fluctuate due to changes in foreign exchange rate. The Company controls the market risk by management limits and a stop loss mechanism on the positions undertaken.
iii. Credit risk
The financial instruments acquired or issued by the Company are subject to risk of financial loss resulting from the failure of a customer or counterparty to settle their contractual obligations when they fall due.
iv. Liquidity risk
The Company achieves the objectives of effective use of capital and stabilization of capital by adjusting capital through the use of cash and cash equivalents, short-term loans payable, bank loans and bonds payable, etc. The operating capital of the Company is sufficient in meeting capital on demand; therefore, no significant liquidity risk is expected to occur.
B. The subsidiaries
( a ) MICB
The risk management policies and practices and major exposure of risk conditions of the credit risk, market risk, business risk, and liquidity risk are as follows:
MICB’s Board of Directors has the ultimate approval right in risk management and has ultimate responsibility for MICB’s risk strategies and ensures the function works. The Assets & liabilities Management Committee, Loan Committee, Problem Loan Committee, Investment Committee, Fund Management Committee, Product & Regulation Committee, Wealth Management Committee, Offshore Structured Products Committee, Personal Appraisal Committee, Occupational Safety & Health Committee and Trust Assets Screening Committee subordinated under the President are responsible for reviewing relevant risk proposals. In addition, a disaster (risk) emergency team convened by the President for the purpose of disaster or other contingent events, takes appropriate actions to minimize losses, end disaster/risk and restore normal business operations.
Risk management is controlled by each individual department of head office according to its authorization and responsibility. In terms of credit risk, Credit Management Department is responsible for risk management of credit business, management of large amount of money and risk exposure of related parties, credit policy and to draft relevant Articles; Card Service Center is in charge of risk management of credit card business and to draft relevant Articles; Investment Department manages risk management of investment business and to draft relevant Articles; Treasury Department presides over risk management of investment banking, financial assets and real estate securitization and to draft relevant Articles; Credit Department takes care of credit checking, analysis and evaluation of corporate banking clients and to draft relevant Articles. For market risk and liquidity risk, Risk management is carried out by Financial Management Service Center, accounting for setting up pricing model and valuation system of financial instruments and to draft relevant Articles. For operation risk, losses may be incurred from internal operation, personnel, system or external events; therefore, Risk Management Department is responsible for monitoring execution performance of each department. Planning Department manages country risk and sets up limit and relevant Articles for country risk. In addition, Risk Management Department is also in charge to set up MICB’s short-term, medium-term and long-term targets, drive risk management of MICB, hold risk control meetings on a quarterly basis (amended to on a bimonthly basis), summarize risk controls and report to the Board of Directors and Risk Management Committee of Mega Financial Holdings regularly.
Risk management policy is established to identify, evaluate, monitor, report and respond to financial risks in the Group’s operating units, to set up accurate risk management objectives, management mechanism and segregation of duties, to ensure operation risk is within the tolerable limits, and to maximize the Bank’s earnings and stockholders’ profits. The procedure of risk management and principles of measuring and controlling regarding credit risk, market risk, operation risk, liquidity risk and country risk are as follows:
i. Credit risk
a ) Procedure of risk management
The promotion of credit and investment business of the Bank is in accordance with the bank laws and other related regulations; moreover, risk management targets identified by each business supervisor units are sent to the risk control department and reported to the risk control committee of Mega Financial Holdings and Board of Directors for approval. In addition, the Bank conveys risk tolerant limits and maintains sound credit risk management organizations and standards through stipulating credit and investment Articles.

160
Financial Information
Financial Information
OUR VISION—being your best financial service partner
As a result of the implementation of Basel II, MICB is developing various credit risk component models and valuation systems, adopting Internal Ratings Based Approach which links to probability of default, and using quantifiable analysis tools to predict customers’ probability of default, loss given default and so on. This also enhances the current credit rating system and then strengthens monitoring of credit risk.
MICB should ensure that credit checking and examination have been done before engaging loan and investment business and also designates credit amount, provides responsibilities according to levels to shorten operating procedures, and require periodic monitoring while engaging the business. MICB also should set up a reporting system and have timely reports if any unusual event or significant accident occurs.
Establishment of a unit mainly responsible for the overdue loan management in order to solve credit management problems and to seek the recovery of obligations. In order to execute this strategy, MICB sets regulations for procedures to evaluate asset rewards for dealing with recovery of non-performing loans, outsourcing of loans receivable as a base for managing doubtful credits and overdue loans.
b ) Principles of measuring and controlling
MICB’s goals of credit risk management are set from downward sloping to upward sloping annually and then presented to the Board of Directors for approval. In order to strengthen the risk management, the evaluation of conducting circumstances is in accordance with the economic and financial conditions. Moreover, in accordance with regulatory institutions, MICB is required to disclose the information of credit risk through its financial reports and website.
In order to control the group and industry risk and avoid excess concentration risk, MICB will separately set the credit limit of the individual clients, group and industry based on the industry condition, perspective and credit risk, and report to the management unit regarding the condition of complying with the bank laws, regulations stipulated by the authorities and internal credit rules to set the credit limits and balances monthly.
In order to strengthen the understanding of the client’s credit, reviews should be conducted periodically. For those that have high risk or abnormalities, the frequency of their reviews will be increased. Analysis and reviews will be made annually and the reports will be sent to the management.
Analysis and investigation should be conducted at least once a year, especially operation, capital inflow/outflow and business plan execution and problem solving. Analysis and investigation will be made annually and the reports will be sent to the management.
Abnormal notification system: When operating units determine that a client’s operations are abnormal, facing financial difficulties, or experience some unexpected events, the business supervisor will report this to the management, and information will be sent to the Mega Financial Holdings by the risk management department, in order for them to understand the circumstances so that they are able to take proper actions.
Appraisal of assets: Accrue possible losses or impairment of assets, investments, other assets, or contingent assets based on the experience of bad debts, reserves, other historical losses, the current overdue loan rate, recovery conditions, supervisory regulations, generally accepted accounting principles and so on.
ii. Market risk
a ) Procedure of risk management
MICB’s market risk management objectives are set up by Treasury Department and Financial Service Center. The Risk Management Department then summarizes and reports to the Risk Management Committee of Mega Financial Holdings and Board of Directors for approval.
The Financial Service Center not only prepares daily market risk portions and profit or loss statements, but also summarizes investment performance of marketable securities and reports to Board of Directors regularly. Risk Management Department summarizes and analyzes financial information prepared by the Treasury Department on a daily basis and pays attention to market changes when it is closer to stop loss limits. Monthly summary are prepared to analyze positions, profit or loss, sensitivity risk indicators analysis and stress test of financial products held by MICB for management reviews.
b ) Principles in measuring and controlling
MICB’s market risk reports including positions and profit or loss evaluation of exchange rate, interest rate and equity securities products. All transactions should follow amount limits and stop loss policy and submit for supervisors to be approved in accordance with MICB’s Articles. As long as transactions meet stop loss limits, the transactions should be revoked immediately,

Financial Information
1612012 ANNUAL REPORT
if not, the transaction unit should explain reasons and follow-up plans for management approval and report to the Board of Directors on a quarterly basis.
Non-hedging positions of derivative financial products are evaluated on daily market price while hedging positions are evaluated twice a month.
The SUMMIT information system set up by the Bank for market risk has currently completed the implementation of FX transactions, call loans system, interest rate option (swap option), bond and derivative financial instruments. Implementation for equity securities is supposed to be completed in the fourth quarter of 2012. Upon completion, the system provides on-spot credit limit control, profit or loss evaluation, sensitivity risk indicators analysis, stress test and risk value calculation and so on.
iii. Operation risk
a ) Procedure of risk management
Prior the release of new products, new business and establishment of new foreign operations, risk identification and evaluation, law compliance analysis and information operation system planning should be performed.
MICB institutes business management Articles and operating guidance which are embedded in computer system for personnel on-spot search, as business support.
Self-assessment is conducted to understand business controls and modify weaknesses.
In accordance with eight industries and seven loss events of Basel II, report and gather operation risk loss events.
MICB sets up self-assessment mechanism of operation risk at MICB level, in order to strengthen identification and evaluation of operation risk and improve current control mechanism.
In order to monitor the potential operating risks and take relevant control managing action, MICB needs to implement key indicators for operating risks step by step to further mitigate the occurrence of operating risks that might happen.
b ) Principles in measuring and controlling
MICB sets up self-assessment mechanism to measure the exposure of operation risk and reinforce controls on items that are likely to happen and with high effects.
MICB reports operation risk loss events, compliance with laws and regulations, auditing and self-assessment to the Board of Directors regularly.
Operation risk loss events report, compliance with laws and regulations and auditing system cover all departments of MICB. Self-assessments are conducted by Occupational Safety & Health Committee, Data Processing & Information Department, domestic and foreign branches and subsidiaries.
Each department discovers weaknesses via the aforesaid management mechanism, each weakness will be discussed and improved and followed-up by its management.
iv. Liquidity risk
a ) Procedure of risk management
There is an upper limit to control the amount of cash flow shortage for daily NTD and foreign currency. Also, the Financial Service Center is in charge of preparing weekly reports which are submitted to the fund management committee on semi-monthly basis in order to the control the liquidity risk. The risk management department reports to the Board of Directors periodically.
b ) Principles of measuring and controlling
MICB sets up limits of liquidity gap by periods and periodically prepares liquidity gap tables for monitoring liquidity risk and considers seasonal and short-term factors in order to effectively control capital flows.
In terms of fund management, in addition to provide sufficient legal reserves, the Bank invests in government bonds, negotiable certificates of time deposit of Central Bank, treasury bills, financial bonds, government bonds with repurchase agreement, corporate bonds, commercial papers, bankers’ acceptance and beneficiary certificates. The MICB diversifies its investments to reduce its operation risk.
v. Country risk
a ) Procedure of risk management

162
Financial Information
Financial Information
OUR VISION—being your best financial service partner
Planning Department reports to the Board of Directors for establishment of guidelines governing country risk, and prepares monthly “Table of risk limits to individual countries and each level” to inspect risk limits to be submitted to management. The Planning Department also reports the usage and exposure of country risk limits on a quarterly basis and then Risk Management Department reports to the Board of Directors.
b ) Principles of measuring and controlling
For the political stability, economic development, credit condition and ability to repay debts of individual countries, MICB takes the latest Country Ceilings for Foreign Currency published by Moody’s Investors Services, actual usage of allocated country risk limits and other information as references for setting up country risk limits of individual countries and each level and summarizing creditor’s rights of individual countries on a monthly basis, in order to avoid risk concentration on a specific country. Also, the price (spread) of five-year CDS is monitored daily as the management on motion of national risk limit.
( b ) MS
i. Market risk
MS and its subsidiaries’ investments in fixed income and equity securities are measured at the fair value of the quoted market price. Market price risks arise from variation in market prices that correspond to changes in market risk factors, such as stock prices, interest rates, exchange rates, etc. The management functions in place dealing with market risk not only include establishing limits on positions, notional principal, stop – loss, risk tolerance, but also include adopting quantification model and other sensitivity indices to assess market risk. The validity of such models has been verified on a periodic basis and the risk limits has been monitored and analyzed on a daily basis.
ii. Credit risk
MS and its indirect subsidiaries’ potential credit risk mainly arises from financial instruments including cash and cash equivalents, financial assets at fair value through profit or loss, accounts receivable, and receivables from margin trading of securities. MS’s cash is placed with different financial institutions in order to minimize exposure to risk of cash deficit in each financial institution (to diversify and avoid concentration risks). In addition, the financial institutions selected by MS to place cash with are all publicly listed companies in excellent business positions. Regarding the counterparties in which corporate bonds and short-term bills, also categorized as cash equivalents, are invested, their excellent credit standings have been previously assured in order to minimize the credit risk.
MS and its indirect subsidiaries assess the credit standing of the counterparty before entering into transactions and such assessment is to be held on a periodic basis thereafter for minimizing credit risk. A trading limit is assigned for each counterparty according to internal assessments on their relative credit standings prior to the trading. Generally speaking, with the effort MS puts into continuously monitoring credit risk control measures and assessing the credit standings, there should be no contingency regarding concentration of credit risk.
iii. Liquidity risk
The operating capital of MS and its indirect subsidiaries is sufficient to meet cash flows for all contractual obligations; therefore, there is no liquidity risk regarding inability to raise capital to meet existing contractual obligations. In order to control liquidity risk effectively, MS and its indirect subsidiaries perform capital maturity gap on a daily basis to avoid the occurrence of emergency situations.
All investments in equity securities, such as outstanding or unsettled futures contracts and options, equity certificates, etc. held by MS and its indirect subsidiaries are subject to prompt delivery of cash at reasonable prices in the market; therefore, the liquidity risk is assessed to be minimum.
Cash flows associated with investments in fixed income securities, such as convertible corporate bond swaps and interest rate swaps, etc., are interest receipts or payments calculated by the product of notional principal and the difference in the interest rates. Since amounts of such interest receipts or payments are not material and there are no cash inflows or outflows of notional principal, the liquidity risk undertaken is also minimized.
iv. Cash flow risk associated with interest rate variations
MS and its indirect subsidiaries’ short-term and long-term loans are fixed interest obligations; therefore, changes in market interest will neither affect the effective interest rate on such loans nor will it result in fluctuations in the expected future cash flows.
Most of MS and its indirect subsidiaries’ bond investments have fixed interest rates; therefore, changes in market interest will not result in fluctuations in the expected future cash flows. The effects on cash flows for other non-fixed interest investments are considered relatively immaterial.

Financial Information
1632012 ANNUAL REPORT
v. Risk management organization structure and policy
In order to effectively manage MS’ risk as a whole, MS established specialized risk management committee primarily responsible for the allocation of MS’ assets, standard setting for risk management targets, re-adjusting and early warning procedures, monitoring the implementation of risk management system on a continuing basis, examining the proposals from various departments regarding MS’ management standards as well as the management of other operating risks.
MS and its indirect subsidiaries’ risk management organization structure include the Board of Directors and risk management section. The Board of Directors is the highest instruction unit of MS and its indirect subsidiaries’ risk management organization structure and is responsible for authorizing MS and its indirect subsidiaries’ level of acceptance for risks as well as ensuring the management team’s awareness of risks and its mutual integration to operating decisions resolved. The risk management section, authorized by the risk management committee, is responsible for the comprehensive programming, implementing and tracking of various risk management system.
MS and its indirect subsidiaries’ risk management policy is established in order to manage the risk of the Group as a whole effectively and to pursue the optimum balance of risk compensation for ensuring that MS and its indirect subsidiaries’ administrator is seeking for business development with the comprehension of MS and its indirect subsidiaries’ risk as a priority.
vi. Concentration of credit risk information
The concentration of credit risk exist when the counterparties in the trading of financial instruments are concentrated in a small number of counterparties; or when the counterparties in the trading of financial instruments are not concentrated in a small number of counterparties, but a majority of counterparties do engage in similar business activities and possess similar economic characteristics which will result in economic factors or other circumstances having similar influence on the counterparties’ ability to meet obligations. The counterparties in the trading of financial instruments are not concentrated.
( c ) MBF
Other than complying with the laws and regulations, the purpose of risk management for MBF is to ensure operating risks are under control and maintaining proper capital adequacy ratio, pursuant to sustainable development. In order to achieve this goal, MBF’s risk management mechanism is set up via a system and culture followed by the Board of Directors, management and all staff, to safeguard MBF’s assets and ensure asset and financial quality. The effective mechanism is also to identify, measure, monitor, report and respond to the levels of risk, setting up a controlling and organized manner of risk management and allocation of responsibility.
MBF’s Board of Directors has the ultimate approval right in risk management. Major management risk items that include the company-wide risk management policy, risk tolerance limit, and authority must be approved by the Board of Directors. Under the Board of Directors, there is a risk management committee, which is responsible to supervise market risk, credit risk and operating risk. Besides, Audit Committee supervises and controls the implementation status of operating risk management policy. In order to effectively manage overall risks and integrate associated information of risk, define risk evaluation techniques and sum up risk positions, risk management segment is responsible for implementing the risk management strategy of MBF.
MBF’s risk management procedures are divided into establishment of risk policy and process of implementation status, setting up proper internal control system and management procedures against potential risks, building up limits of authority toward the entry of electronic files and evaluate potential negative impacts arising from associated risks.
Financial instruments held by MBF have high level of risk-factor (interest rate, foreign exchange rate and price changes). MBF reduces or avoids liquidity risk or risk of changes in fair value by using individual or combination hedging tools. MBF also reviews and adjusts limits of trading risks according to the changes of economic and financial situations and operating perspectives, to ensure data measured from associated risks and procedures conform to established policies, internal control and operating process.
( d ) CKI
In order to effectively recognize, measure and monitor the risks CKI is exposed to and ensure that the risks are within a coverable range, to balance risks and rewards reasonably, to maximize the value of stockholders’ equity and to maintain the adequacy of self-owned capital and repayment ability to secure the company’s operation, CKI established a risk management committee under the Board of Directors and a risk control department independent from business units in accordance with Jin-Guan-Pao-Tsai No. 098002512072 as well as risk control policy and procedures. Insurance risks and financial risks will be explained below.
CKI’s contracts are assessed to be transferred insurance contracts, and management procedures and methods for related risks are as follows:
i. Insurance risk, measurement and corresponding risk management
Insurance risks are the risks to overpay expected claims due to insufficient estimate of the frequency, degree of impact and
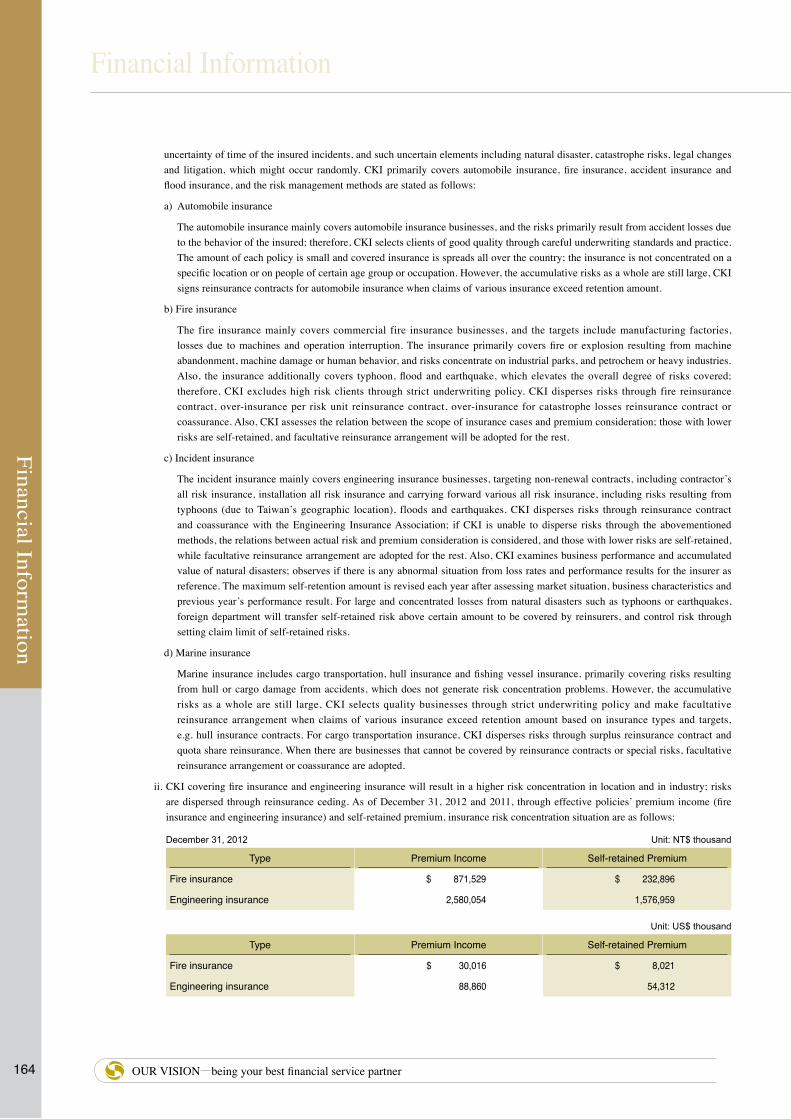
164
Financial Information
Financial Information
OUR VISION—being your best financial service partner
uncertainty of time of the insured incidents, and such uncertain elements including natural disaster, catastrophe risks, legal changes and litigation, which might occur randomly. CKI primarily covers automobile insurance, fire insurance, accident insurance and flood insurance, and the risk management methods are stated as follows:
a) Automobile insurance
The automobile insurance mainly covers automobile insurance businesses, and the risks primarily result from accident losses due to the behavior of the insured; therefore, CKI selects clients of good quality through careful underwriting standards and practice. The amount of each policy is small and covered insurance is spreads all over the country; the insurance is not concentrated on a specific location or on people of certain age group or occupation. However, the accumulative risks as a whole are still large, CKI signs reinsurance contracts for automobile insurance when claims of various insurance exceed retention amount.
b) Fire insurance
The fire insurance mainly covers commercial fire insurance businesses, and the targets include manufacturing factories, losses due to machines and operation interruption. The insurance primarily covers fire or explosion resulting from machine abandonment, machine damage or human behavior, and risks concentrate on industrial parks, and petrochem or heavy industries. Also, the insurance additionally covers typhoon, flood and earthquake, which elevates the overall degree of risks covered; therefore, CKI excludes high risk clients through strict underwriting policy. CKI disperses risks through fire reinsurance contract, over-insurance per risk unit reinsurance contract, over-insurance for catastrophe losses reinsurance contract or coassurance. Also, CKI assesses the relation between the scope of insurance cases and premium consideration; those with lower risks are self-retained, and facultative reinsurance arrangement will be adopted for the rest.
c) Incident insurance
The incident insurance mainly covers engineering insurance businesses, targeting non-renewal contracts, including contractor’s all risk insurance, installation all risk insurance and carrying forward various all risk insurance, including risks resulting from typhoons (due to Taiwan’s geographic location), floods and earthquakes. CKI disperses risks through reinsurance contract and coassurance with the Engineering Insurance Association; if CKI is unable to disperse risks through the abovementioned methods, the relations between actual risk and premium consideration is considered, and those with lower risks are self-retained, while facultative reinsurance arrangement are adopted for the rest. Also, CKI examines business performance and accumulated value of natural disasters; observes if there is any abnormal situation from loss rates and performance results for the insurer as reference. The maximum self-retention amount is revised each year after assessing market situation, business characteristics and previous year’s performance result. For large and concentrated losses from natural disasters such as typhoons or earthquakes, foreign department will transfer self-retained risk above certain amount to be covered by reinsurers, and control risk through setting claim limit of self-retained risks.
d) Marine insurance
Marine insurance includes cargo transportation, hull insurance and fishing vessel insurance, primarily covering risks resulting from hull or cargo damage from accidents, which does not generate risk concentration problems. However, the accumulative risks as a whole are still large, CKI selects quality businesses through strict underwriting policy and make facultative reinsurance arrangement when claims of various insurance exceed retention amount based on insurance types and targets, e.g. hull insurance contracts. For cargo transportation insurance, CKI disperses risks through surplus reinsurance contract and quota share reinsurance. When there are businesses that cannot be covered by reinsurance contracts or special risks, facultative reinsurance arrangement or coassurance are adopted.
ii. CKI covering fire insurance and engineering insurance will result in a higher risk concentration in location and in industry; risks are dispersed through reinsurance ceding. As of December 31, 2012 and 2011, through effective policies’ premium income (fire insurance and engineering insurance) and self-retained premium, insurance risk concentration situation are as follows:
December 31, 2012 Unit: NT$ thousand
Type Premium Income Self-retained Premium
Fire insurance $ 871,529 $ 232,896
Engineering insurance 2,580,054 1,576,959
Unit: US$ thousand
Type Premium Income Self-retained Premium
Fire insurance $ 30,016 $ 8,021
Engineering insurance 88,860 54,312

Financial Information
1652012 ANNUAL REPORT
December 31, 2011 Unit: NT$ thousand
Type Premium Income Self-retained Premium
Fire insurance $ 820,730 $ 171,408
Engineering insurance 2,548,612 1,644,373
iii. CKI assesses claim reserves through loss development model and estimated loss rate for various insurance types. Due to some uncertainties including changes in external environment (e.g. changes in regulations or legal ruling), trends or payment methods, which changes loss development model and estimated loss rate that could affect the estimation of claim reserves. CKI performs sensitivity test on estimated loss rate as of December 31, 2012 and 2011. The results are as follows:
December 31, 2012 Unit: NT$ thousand
Type
Final loss rate increases 5% Final loss rate decreases 5%
Total increase of claim reserves heldbefore reinsurance
Total increase ofclaim reserves heldafter reinsurance
Total increase ofclaim reserves heldbefore reinsurance
Total increase ofclaim reserves heldafter reinsurance
Fire Insurance 54,701 17,185 54,701 17,185
Marine Insurance 38,394 10,538 38,394 10,538
Automobile Insurance 112,389 89,276 112,389 89,276
Accident Insurance 99,794 33,932 99,794 33,932
Injury Insurance 16,844 13,532 16,844 13,532
Offshore Branches 6,947 6,939 6,947 6,939
Unit: US$ thousand
Type
Final loss rate increases 5% Final loss rate decreases 5%
Total increase of claim reserves heldbefore reinsurance
Total increase ofclaim reserves heldafter reinsurance
Total increase ofclaim reserves heldbefore reinsurance
Total increase ofclaim reserves heldafter reinsurance
Fire Insurance 1,884 592 1,884 592
Marine Insurance 1,322 363 1,322 363
Automobile Insurance 3,871 3,075 3,871 3,075
Accident Insurance 3,437 1,169 3,437 1,169
Injury Insurance 580 466 580 466
Offshore Branches 239 239 239 239
The sensitivity test adopts self-retained maturity premium as basis and calculates the effects of 5% increase or decrease of final loss rate to CKI’s income and losses.
December 31, 2011 Unit: NT$ thousand
Type
Final loss rate increases 5% Final loss rate decreases 5%
Total increase of claim reserves heldbefore reinsurance
Total increase ofclaim reserves heldafter reinsurance
Total increase ofclaim reserves heldbefore reinsurance
Total increase ofclaim reserves heldafter reinsurance
Fire Insurance 46,778 11,883 46,778 11,883
Marine Insurance 38,229 10,171 38,229 10,171
Automobile Insurance 102,811 81,949 102,811 81,949
Accident Insurance 91,973 32,904 91,973 32,904
Injury Insurance 11,352 9,625 11,352 9,625
Offshore Branches 5,025 5,017 5,025 5,017
The sensitivity test adopts self-retained maturity premium as basis and calculates the effects of 5% increase or decrease of final loss rate to CKI’s income and losses.

166
Financial Information
Financial Information
OUR VISION—being your best financial service partner
iv.As of December 31, 2012 and 2011, CKI’s claim development trend is as follows:
Unit: NT$ thousand
December 31, 2012
Year ofAccident
Day of evaluation Estimated accumulative
claim amounts
Accumulative claim
amounts
Accumulative present unpaid
amountAdjustments
(Note)
Amounts recognized in the balance
sheet2008.12.31 2009.12.31 2010.12.31 2011.12.31 2012.12.31
2008 and before 14,847,471 14,879,430 14,736,603 14,776,279 14,704,261 14,704,261 13,302,771 1,401,490
2009 2,116,129 2,185,536 2,168,941 2,168,161 2,168,161 1,878,474 289,687
2010 3,609,724 3,515,512 3,347,358 3,347,358 3,265,875 81,483
2011 1,824,491 2,069,938 2,069,938 1,794,192 275,746
2012 2,281,266 2,281,266 2,033,322 247,944
Total 24,570,984 22,274,634 2,296,350 958,874 3,255,224
Unit: US$ thousand
December 31, 2012
Year ofAccident
Day of evaluation Estimated accumulative
claim amounts
Accumulative claim
amounts
Accumulative present unpaid
amountAdjustments
(Note)
Amounts recognized in the balance
sheet2008.12.31 2009.12.31 2010.12.31 2011.12.31 2012.12.31
2008 and before 511,365 512,465 507,546 508,913 506,432 506,432 458,163 48,270
2009 72,882 75,272 74,701 74,674 74,674 64,697 9,977
2010 124,323 121,078 115,287 115,287 112,481 2,806
2011 62,838 71,291 71,291 61,794 9,497
2012 78,570 78,570 70,030 8,539
Total 846,254 767,165 79,089 33,025 112,114
Unit: NT$ thousand
December 31, 2011
Year ofAccident
Day of evaluation Estimated accumulative
claim amounts
Accumulative claim
amounts
Accumulative present unpaid
amountAdjustments
(Note)
Amounts recognized in the balance
sheet2007.12.31 2008.12.31 2009.12.31 2010.12.31 2011.12.31
2007 and before 11,915,751 12,235,404 12,282,665 12,128,180 12,060,708 12,060,708 11,769,086 291,622
2008 2,612,067 2,596,765 2,608,422 2,715,571 2,715,571 2,397,129 318,442
2009 2,116,129 2,185,536 2,168,941 2,168,941 1,997,613 171,328
2010 3,609,724 3,515,512 3,515,512 2,528,552 986,960
2011 1,824,491 1,824,491 1,025,418 799,073
Total 22,285,223 19,717,798 2,567,425 707,308 3,274,733
Note: Claim reserves for compulsory private automobile liability insurance, compulsory commercial automobile liability insurance, compulsory motorcycle liability insurance, credit insurance, nuclear energy insurance, government sponsored earthquake insurance and health insurance are provided in accordance with related regulations; therefore, the loss development triangle of direct businesses does not include the abovementioned insurance types. Claim reserves on account are estimated based on current available data; however, the final result might differ from initial estimation value due to subsequent developments.

Financial Information
1672012 ANNUAL REPORT
v. Financial risks, control and hedging strategies
For various financial assets held by CKI, the management considers economic environment, competition and market value changes as well as safety, profitability, and liquidity to optimize asset allocation positions and maintain appropriate liquidity position, to effectively control and measure market risk, credit risk and liquidity risk. CKI adopts different control strategies for different financial risks as follows:
a) Interest risk
CKI invests in fixed interest rate financial instruments, and no material interest risk is estimated. Changes in market interest rate will result in changes in the fair value of bond investment. CKI hedges fair value risk from interest rate fluctuation with part interest swap derivative financial instruments. CKI also observes interest rate trend and set stop-loss point to lower interest rate risk.
b) Foreign exchange risk
CKI’s primary working capital utilizing foreign currency positions include internationally dominant currencies such as foreign currency time deposit and foreign funds. CKI closely follows the economic situation and market changes, monitors exchange rate movement, and hedges with basket of currencies to lower the potential cash flow fair value risk.
c) Price risk
CKI set up purchase principles based on investment assets’ risk characteristics and set individual stop-loss point for risk assets to lower potential price risk resulting from price changes. The equity CKI invests in has been affected by market price changes; however, a stop-loss point has been set and no material market risk is estimated.
d) Credit risk
CKI establishes credit assessment standards and only counterparties that meet certain level of standards are qualified; debt security measures are adapted appropriately to lower credit risk. In accordance with Article 146 of Insurance Act, CKI carefully selects counterparties rated at no lower than a specified rating of credit quality before starting to make investments. Also, the investment limits are strictly restricted by law; therefore, no material credit risk is estimated and the largest credit risk amount is the book value.
e) Liquidity risk
CKI considers the amount and timing of capital demand, assesses the allocation, marketability and financial condition of the investment assets and monitors potential cash flow demand continually. The financial assets invested by CKI are mostly in an active market, where the assets could be sold quickly with the prices approximate to fair value. The working capital is sufficient to meet contract obligations and no material liquidity risk is estimated.
( e ) MITC
Derivative financial instruments held by MITC mainly include cash and cash equivalents, available-for-sale financial assets and bonds investments with no active market. MITC utilizes the advantages of such financial instruments to adjust for the flow of operating capitals. In addition, CKI also holds other financial assets and liabilities, such as receivables incurred as a result of operating activities.
The primary risks of MITC’s financial instruments are market risk, credit risk, liquidity risks and cash flow risk associated with interest rate variations.
i. Market risk
Market risks arise from variation in market interest rates. Variations in market interest rates fluctuate the fair value of bond investments. Limits on positions and stop–loss of the financial instruments held by MITC are properly controlled.
ii. Credit risk
MITC has no significant credit risk concentration.
iii. Liquidity risk
The operating capital of MITC is sufficient to meet cash flows for all contractual obligations; therefore, there is no liquidity risk regarding inability to raise capital to meet existing contractual obligations.
iv. Cash flow risk associated with interest rate variations
MITC has no short-term and long-term loans; therefore, there is no cash flow risk associated with interest rate variations.

168
Financial Information
Financial Information
OUR VISION—being your best financial service partner
( 6 ) Capital adequacy ratio
A. Capital adequacy ratio of the Company and its subsidiaries
Mega Financial Holding Co., Ltd. And Its Subsidiaries
Capital Adequacy Ratio
December 31, 2012
Ownership percentage held by the Company
Eligible capital Minimum capital
NT$ US$ NT$ US$
The Company 100% $ 216,178,338 $ 7,445,440 $ 242,267,534 $ 8,343,983
MICB 100% 206,137,155 7,099,610 140,071,287 4,824,222
MS 100% 10,894,139 375,207 3,096,672 106,653
MBF 100% 28,584,534 984,485 16,956,243 583,993
CKI 100% 5,204,402 179,246 2,095,062 72,156
MITC 100% 806,130 27,764 426,646 14,694
MAM 100% 2,879,702 99,180 5,634,870 194,072
Mega Life Insurance Agency 100% 202,164 6,963 159,344 5,488
Mega Venture Capital 100% 718,117 24,733 359,689 12,388
Deduction item ( 251,547,789 ) ( 8,663,606 ) ( 235,347,057 ) ( 8,105,633 )
Subtotal ( A ) $ 220,056,892 $ 7,579,022 ( B ) $ 175,720,290 $ 6,052,016
Capital adequacy ratio of the Consolidated Company ( C )=( A )÷( B ) ( C ) 125.23%
Mega Financial Holding Co., Ltd. And Its Subsidiaries
Capital Adequacy Ratio
December 31, 2011
Ownership percentage held by the Company
Eligible capital Minimum capital
NT$ US$ NT$ US$
The Company 100% $ 206,477,447 $ 6,820,740 $ 225,093,042 $ 7,435,683
MICB 100% 187,980,784 6,209,724 130,113,192 4,298,136
MS 100% 10,095,773 333,502 2,748,602 90,797
MBF 100% 28,220,229 932,222 15,586,780 514,891
CKI 100% 5,308,881 175,373 1,895,048 62,601
MITC 100% 816,571 26,974 429,584 14,191
MAM 100% 2,648,528 87,491 5,094,445 168,289
Mega Life Insurance Agency 100% 121,989 4,030 96,086 3,174
Mega Venture Capital 100% 699,498 23,107 356,944 11,791
Deduction item ( 237,413,126 ) ( 7,842,663 ) ( 218,167,682 ) ( 7,206,912 )
Subtotal ( A ) $ 204,956,574 $ 6,770,500 ( B ) $ 163,246,041 $ 5,392,641
Capital adequacy ratio of the Consolidated Company ( C )=( A )÷( B ) ( C ) 125.55%

Financial Information
1692012 ANNUAL REPORT
B. As of December 31, 2011, the financial holding’s net eligible capital
Mega Financial Holding Co., Ltd. And Its Subsidiaries
Financial Holding’s Net Eligible Capital
December 31, 2012
NT$ US$
Common stocks $ 114,498,240 $ 3,943,456
Unaccumulated preferred stocks which meet tier 1 capital requirement and unaccumulated subordinated debts with no maturity date - -
Other preferred stocks and subordinated debts 2,400,000 82,659
Capital collected in advance - -
Additional paid-in capital 43,425,270 1,495,618
Legal reserve 20,066,890 691,128
Special reserve 833,091 28,693
Accumulated earnings 31,312,668 1,078,446
Equity adjustment 3,648,744 125,667
Less: goodwill - -
deferred assets 6,565 226
treasury stocks - -
Total net eligible capital $ 216,178,338 $ 7,445,441
Mega Financial Holding Co., Ltd. And Its Subsidiaries
Financial Holding’s Net Eligible Capital
December 31, 2011
NT$
Common stocks $ 112,806,148
Unaccumulated preferred stocks which meet tier 1 capital requirement and unaccumulated subordinated debts with no maturity date -
Other preferred stocks and subordinated debts 3,600,000
Capital collected in advance -
Additional paid-in capital 43,426,403
Legal reserve 18,298,900
Special reserve 833,091
Accumulated earnings 22,828,132
Equity adjustments number 4,688,712
Less : goodwill -
deferred assets 3,939
treasury stocks -
Total net eligible capital $ 206,477,447
( 7 ) Disclosures of total amounts or ratios with respect to credit extensions, endorsements, or other transactions undertaken by a financial holding company and its subsidiaries for the same individual, the same related individual, or the same affiliated enterprises in accordance with Article 46 of the "Financial Holding Company Act" as of December 31, 2012:
( Please refer to P.128~ P.145 of the consolidated financial statements )

170
Financial Information
Financial Information
OUR VISION—being your best financial service partner
( 8 ) Significant impact arising from changes in government laws and regulations:
None.
( 9 ) Information for discontinued operations:
None.
( 10 ) Major operating assets or liabilities transferred from (or to) other financial institutions:
None.
( 11 ) Information on the apportionment of the revenues, costs, expenses, gains and losses arising from the transactions between the Company and its subsidiaries, joint promotion of businesses, and sharing of information, operating facilities or premises.
A. Transactions between the Company and its subsidiaries
Please refer to Note 5.
B. Joint promotion of businesses
In order to create synergies within the group and provide customers financial services in all aspects, the subsidiaries has continuously established other financial consulting service centers (including banking services, securities trading services, and insurance services) in its subsidiaries and simultaneously promoted service business in banking, securities and insurance areas.
C. Sharing of information
Under the Financial Holding Company Act, Computer-Process Personal Data Protection Law and the related regulations stipulated by the Ministry of Finance, when customers’ information of a financial holding company’s subsidiary is disclosed to the other subsidiaries under the group or exchanged between the subsidiaries for the purpose of cross-selling of products, the subsidiaries receiving, utilizing, managing or maintaining the information are bound to use the information for the specified purposes only. In addition, the Company is required to publish its “Measures for Protection of Customers’ Information” at its website. Customers also reserve the right to have their information withdrawn from the information sharing mechanism.
D. Sharing of operating facilities or premises
To provide one-stop-shopping services, MICB set up a securities desk and an insurance desk within its financial consulting center on April 2, 2003, which is engaged in the cross-selling of MS and CKI’s products, respectively. In addition, the Company had obtained the authorization to set up industry specialized desk in its business premises, and the set up had been gradually taking place in the Company’s subsidiaries.
E. Apportionment of revenues, costs, expenses, gains and losses
( a ) For the year ended December 31, 2012:
The promotion bonus paid to other subsidiaries by MITC, MBF and MICB amounted to NT$26,340 thousand (US$1,252 thousand), NT$560 thousand (US$19 thousand) and NT$570 thousand (US$20 thousand), respectively. As a result of cross-selling by other subsidiaries, the insurance premium income increased by NT$493,750 thousand (US$17,005 thousand) for CKI; NT$13,340 thousand (US$459 thousand) for MICB; NT$116,550 thousand (US$4,014 thousand) for MITC; and NT$3,010 (US$104 thousand) thousand for MBF.
( b ) For the year ended December 31, 2011:
The promotion bonus paid to other subsidiaries by MITC, MBF and MICB amounted to NT$25,970 thousand, NT$710 thousand and NT$570 thousand, respectively. As a result of cross-selling by other subsidiaries, the insurance premium income increased by NT$340,848 thousand for CKI; NT$12,320 thousand for MICB; NT$120,070 thousand for MITC; and NT$8,880 thousand for MBF.
( 12 ) Information for private placement securities:
None.

Financial Information
1712012 ANNUAL REPORT
( 13 ) Financial information by business segments
Financial information by business segmentsFor the year ended December 31, 2012
( Expressed in Thousands of NT Dollars )Operation ( Note )
ItemsBank
divisionInsurance division
Bills division
Securities division
Total other divisions Consolidation
Interest income, net $28,132,140 $ 81,758 $ 2,022,228 $ 724,749 ( $ 408,872 ) $ 30,552,003
Revenues other than interest, net 14,537,967 1,006,082 2,041,211 1,560,041 1,563,036 20,708,337
Net revenue 42,670,107 1,087,840 4,063,439 2,284,790 1,154,164 51,260,340
Bad debt expense ( 4,367,039 ) - ( 126,379 ) - ( 39,929 ) ( 4,533,347 )
Provisions for the reserve for insurance - 13,025 - - - 13,025
Operational expenses ( 16,402,796 ) ( 898,703 ) ( 758,748) ( 2,169,772 ) ( 674,322 ) ( 20,904,341 )Income before Income Tax from Continuing
Operations
21,900,272 202,162
3,178,312 115,018
439,913
25,835,677Income tax expense ( 3,219,904 ) ( 60,083 ) ( 331,209 ) ( 53,336 ) ( 627,531 ) ( 4,292,063 )Consolidated Net Income (Loss) from Continuing
Operations $ 18,680,368 $ 142,079 $ 2,847,103 $ 61,682 ( $ 187,618 ) $ 21,543,614
Note: Amounts eliminated in the consolidated financial statements among the Company and its subsidiaries.
Financial information by business segmentsFor the year ended December 31, 2012
( Expressed in Thousands of US Dollars )Operation ( Note )
ItemsBank
divisionInsurance division
Bills division
Securities division
Total other divisions Consolidation
Interest income, net $ 968,904 $ 2,816 $ 69,648 $ 24,961 ( $ 14,082 ) $ 1,052,247
Revenues other than interest, net 500,705 34,651 70,302 53,730 53,832 713,220
Net revenue 1,469,609 37,467 139,950 78,691 39,750 1,765,467
Bad debt expense ( 150,406 ) - ( 4,353 ) - ( 1,375 ) ( 156,134 )
Provisions for the reserve for insurance - 449 - - - 449
Operational expenses ( 564,932 ) ( 30,953 ) ( 26,132 ) ( 74,730 ) ( 23,224 ) ( 719,971 )Income before Income Tax from Continuing
Operations 754,271 6,963 109,465 3,961 15,151 889,811Income tax expense ( 110,897 ) ( 2,069 ) ( 11,407 ) ( 1,837 ) ( 21,613 ) ( 147,824 )Consolidated Net Incomee (Loss) from Continuing
Operations $ 643,374 $ 4,894 $ 98,058 $ 2,124 ($ 6,463 ) $ 741,987
Note: Amounts eliminated in the consolidated financial statements among the Company and its subsidiaries.
Financial information by business segmentsFor the year ended December 31, 2011
( Expressed in Thousands of NT Dollars )Operation ( Note )
ItemsBank
divisionInsurance division
Bills division
Securities division
Total other divisions Consolidation
Interest income, net $ 25,225,248 $ 74,011 $ 2,429,455 $ 949,779 ( $ 399,389 ) $ 28,279,104
Revenues other than interest, net 12,367,925 933,274 1,508,943 1,230,649 1,416,280 17,457,071
Net revenue 37,593,173 1,007,285 3,938,398 2,180,428 1,016,891 45,736,175
Bad debt expense ( 3,593,448 ) - ( 89,757 ) - ( 31,130 ) ( 3,714,335 )
Provisions for the reserve for insurance - 67,136 - - - 67,136
Operational expenses ( 16,351,770 ) ( 855,791 ) ( 741,242) ( 2,343,891 ) ( 680,778 ) ( 20,973,472 )Income before Income Tax from Continuing
Operations
17,647,955 218,630
3,107,399 ( 163,463 )
304,983
21,115,504Income tax expense ( 2,575,859 ) ( 45,351 ) ( 455,801 ) ( 226,617 ) ( 126,194 ) ( 3,429,822 )Consolidated Net Income (Loss) from Continuing
Operations $ 15,072,096 $ 173,279 $ 2,651,598 ($ 390,080 ) $ 178,789 $ 17,685,682
Note: Amounts eliminated in the consolidated financial statements among the Company and its subsidiaries.

172
Financial Information
Financial Information
OUR VISION—being your best financial service partner
( 14 ) Financial statements of the Company and condensed financial statements of its subsidiaries:
MEGA FINANCIAL HOLDING CO., LTD.BALANCE SHEETS
December 31, 2012 and 2011( Expressed in Thousands of Dollars )
ASSETS
December 31, 2012
December 31, 2011
LIABILITIES AND
STOCKHOLDERS' EQUITY
December 31, 2012
December 31, 2011
NT$ US$ NT$ NT$ US$ NT$Assets Liabilities
Cash and cash equivalents $ 77,293 $ 2,662 $ 4,276,849 Commercial paper payable $ 881,079 $ 30,346 -
Receivables, net 857,471 29,533 715,141 Financial liabilities at fair value through profit or loss 1,200 41 -
Available-for-sale financial assets, net 5,143,167 177,137 5,279,193 Payables $ 12,213,876 $ 420,661 $ 10,778,190
Equity investments Bonds payable 16,049,668 552,770 16,301,059accounted for by theequity method, net 235,347,057 8,105,633 218,167,682 Accrued pension liability 48,728 1,678 41,906
Financial assets carried at Other liabilities 2,257 78 1,608cost 758,193 26,113 762,046
Total Liabilities 29,196,808 1,005,574 27,122,763Property and equipment, net 783,919 26,999 784,065
Stockholders’ EquityOther assets, net 10,952 377 15,514
Common stock 114,498,240 3,943,456 112,806,148Deferred tax assets, net 3,659 126 3,659
Capital surplus 43,425,270 1,495,618 43,426,403
Retained earningsLegal reserve 20,066,890 691,128 18,298,900
Special reserve 833,091 28,693 833,091
Unappropriatedretained earnings 31,312,668 1,078,446 22,828,132
Equity adjustments
Land revaluation increment 3,324,517 114,500 2,206,808
Cumulative translationadjustments 563,235 19,398 1,505,518
Unrealized gains on financial instruments 1,051,731 36,223 1,033,669
Net loss of unrecognized pension cost ( 1,290,739) ( 44,456) ( 57,283)
Total Stockholders' Equity 213,784,903 7,363,006 202,881,386
TOTAL LIABILITIES ANDSTOCKHOLDERS'
TOTAL ASSETS $ 242,981,711 $ 8,368,580 $ 230,004,149 EQUITY $ 242,981,711 $ 8,368,580 $ 230,004,149

Financial Information
1732012 ANNUAL REPORT
MEGA FINANCIAL HOLDING CO., LTD.STATEMENTS OF INCOME
For the years ended December 31, 2012 and 2011( Expressed in Thousands of Dollars, Except Earnings Per Share Amounts )
For the year ended For the year ended December 31, 2012 December 31, 2011
NT$ US$ NT$
Revenues
Interest income $ 27,319 $ 941 $ 37,256
Gain from financial assets and liabilities at fair value through profit or loss
-
-
241,800
Investment income from equity investments accounted for by the equity method
22,661,062
780,474
18,111,631
Other revenue except for interest income 33,055 1,138 11,079
Total revenue 22,721,436 782,553 18,401,766
Expenses and losses
Interest expense ( 361,053 ) ( 12,436 ) ( 364,912 )
Loss from financial assets and liaabilities at fair value through profit and loss ( 1,200 ) ( 41 ) -
Loss from financial assets carried at cost ( 1.039 ) ( 36 ) -
Personnel expenses ( 247,850 ) ( 8,536 ) ( 223,532 )
Depreciation and amortization ( 21,806 ) ( 751 ) ( 31.677 )
Other business and administrative expenses ( 79,421 ) ( 2,735) ( 97,340 )
Total expenses and losses ( 712,369 ) ( 24,535 ) ( 717,461 )
Income before Income Tax from Continuing Operations
22,009,067
758,018
17,684,305
Income tax expense ( 475,926 ) ( 16,391 ) ( 4,413 )
Net Income $ 21,533,141 $ 741,627 $ 17,679,892
Basic Earnings Per Share ( in dollars ) Before Taxes After Taxes Before Taxes After Taxes
Net Income from Continuing Operations $1.92 $1.88 $1.54 $1.54
Diluted Earnings Per Share ( in dollars ) Before Taxes After Taxes Before Taxes After Taxes
Net Income from Continuing Operations $1.92 $1.88 $1.54 $1.54

174
Financial Information
Financial Information
OUR VISION—being your best financial service partner
MEG
A FI
NAN
CIA
L H
OLD
ING
CO
., LT
D.
STAT
EMEN
TS O
F C
HAN
GES
IN S
TOC
KHO
LDER
S’ E
QU
ITY
FOR
TH
E YE
ARS
END
ED D
ECEM
BER
31,
201
2 AN
D 2
011
(Exp
ress
ed in
Tho
usan
ds o
f NT
Dol
lars
)
Ret
aine
d Ea
rnin
gs
Unr
ealiz
edR
eval
uatio
nIn
crem
ents
Cum
ulat
ive
Tran
slat
ion
Adju
stm
ents
Unr
ealiz
edG
ains
or
Loss
es o
nFi
nanc
ial
Ins
trum
ents
Net
Los
s on
Unr
ecog
nize
dPe
nsio
n C
ost
To
tal
C
omm
onSt
ock
C
apita
lSu
rplu
s
Lega
lR
eser
ve
Spec
ial
Res
erve
R
etai
ned
Earn
ings
For t
he ye
ar en
ded D
ecem
ber 3
1, 20
11
Balan
ce, J
anua
ry 1,
2011
$ 11
0,594
,262
$ 4
3,426
,403
$ 1
6,787
,828
$
3
54,96
7$
18,82
4,681
$ 2
,319,9
45$
8
29,39
7$
7,7
33,63
7$
-$ 2
00,87
1,120
Earn
ings d
istrib
ution
for 2
010
Lega
l rese
rve
-
-1,5
11,07
2
-(
1,
511,0
72)
-
-
-
-
-
Cash
divid
ends
-
-
-
-
(
9,95
3,483
) -
-
-
-
(
9,95
3,483
)
Stoc
k divi
dend
s dist
ributa
ble2,2
11,88
6
-
-
-(
2,
211,8
86)
-
-
-
-
-
Adjus
tmen
ts in
other
stoc
khold
ers’
equit
y ar
ising
from
long
-term
equit
y
Chan
ges i
n unr
ealiz
ed pr
ofit o
r loss
on
avail
able-
for-sa
le fin
ancia
l ass
ets
-
-
-
-
-
-
-(
4,
831,8
35)
-(
4
,831,8
35)
Chan
ges i
n cum
ulativ
e tra
nslat
ion
adjus
tmen
ts
-
-
-
-
-
-67
6,121
-
-
676,1
21
Defau
lt los
s res
erve
tran
sferre
d as s
pecia
l re
serve
as re
gulat
ed
-
-
-19
5,344
-
-
-
-
-
195,3
44
Trad
ing lo
ss re
serve
tran
sferre
d as s
pecia
l re
serve
as re
gulat
ed
-
-
-28
2,780
-
-
-
-
-
282,7
80
Chan
ges i
n unr
ealiz
ed re
-eva
luatio
n
-
-
-
-
-(
113,1
37)
-
-
-(
113,1
37)
Net lo
ss on
unre
cogn
ized p
ensio
n los
t
-
-
-
-
-
-
-
-(
57,2
83)
(
5
7,283
)
Chan
ges i
n unr
ealiz
ed pr
ofit o
r loss
on
avail
able-
for-sa
le fin
ancia
l ass
ets
-
-
-
-
-
-
-
(
1,86
8,133
) -
(
1,86
8,133
)
Cons
olida
ted ne
t inco
me fo
r the
year
en
ded D
ecem
ber 3
1, 20
11
-
-
-
-17
,679,8
92
-
-
-
-17
,679,8
92
Balan
ce, D
ecem
ber 3
1, 20
11$
112,8
06,14
8$
43,4
26,40
3$
18,2
98,90
0$
8
33,09
1$
22,82
8,132
$2,20
6,808
$1,50
5,518
$ 1
,033,6
69($
57,2
83)
$ 20
2,881
,386
(Con
tinue
d)

Financial Information
1752012 ANNUAL REPORT
MEG
A FI
NAN
CIA
L H
OLD
ING
CO
., LT
D.
STAT
EMEN
TS O
F C
HAN
GES
IN S
TOC
KHO
LDER
S’ E
QU
ITY
(Con
tinue
d)FO
R T
HE
YEAR
S EN
DED
DEC
EMBE
R 3
1, 2
012
AND
201
1
(Exp
ress
ed in
Tho
usan
ds o
f NT
Dol
lars
)
Ret
aine
d Ea
rnin
gs
Unr
ealiz
edR
eval
uatio
nIn
crem
ents
Cum
ulat
ive
Tran
slat
ion
Adju
stm
ents
Unr
ealiz
edG
ains
or
Loss
es o
nFi
nanc
ial
Ins
trum
ents
Net
Los
s on
Unr
ecog
nize
dPe
nsio
n C
ost
To
tal
C
omm
onSt
ock
C
apita
lSu
rplu
s
Lega
lR
eser
ve
Spec
ial
Res
erve
R
etai
ned
Earn
ings
Balan
ce, J
anua
ry 1,
2012
Earn
ings d
istrib
ution
for 2
011
$112
,806,1
48$4
3,426
,403
$18,2
98,90
0$8
33,09
1$2
2,828
,132
$2,20
6,808
$1,50
5,518
$1,03
3,669
(
$57
,283)
$202
,881,3
86
Lega
l rese
rve
-
-1,7
67,99
0
-(
1,76
7,990
) -
-
-
-
-
Cash
divid
ends
-
-
-
-
( 9
,588,5
23)
-
-
-
-(
9,5
88,52
3)
Stoc
k divi
dend
s dist
ributa
ble1,6
92,09
2
-
-
-(
1,69
2,092
) -
-
-
-
-
Adjus
tmen
ts in
other
stoc
khold
ers’
equit
y ar
ising
from
long
-term
equit
y
Adjus
tmen
ts in
other
stoc
khold
ers’
equit
y
-(
1,13
3)
-
-
-
-
-
-
-(
1,13
3)
Chan
ges i
n unr
ealiz
ed pr
ofit o
r loss
on
avail
able-
for-sa
le fin
ancia
l ass
ets
-
-
-
-
-
-
-15
4,087
-
15
4,087
Chan
ges i
n cum
ulativ
e tra
nslat
ion
adjus
tmen
ts
- -
- -
- -
(
942
,283)
-
-(
9
42,28
3)
Adjus
tmen
ts in
unre
alize
d re-
evalu
ation
-
- -
- -
1,117
,709
-
- -
(
1,117
,709)
Net lo
ss on
unre
cogn
ized p
ensio
n cos
t
- -
- -
- -
- -
( 1
,233,4
56)
(
1,233
,456)
Chan
ges i
n unr
ealiz
ed pr
ofit o
r loss
on
avail
able-
for-sa
le fin
ancia
l ass
ets
- -
- -
- -
-(
1
36,02
5)
-(
1
36,02
5)
Cons
olida
ted ne
t inco
me fo
r the
year
en
ded D
ecem
ber 3
1, 20
12
-
-
-
-21
,533,1
41
-
-
-
-21
,533,1
41
Balan
ce, D
ecem
ber 3
1, 20
12$1
14,49
8,240
$ 43,4
25,27
0$ 2
0,066
,890
$
833,0
91$ 3
1,312
,668
$ 3,
324,5
17$
56
3,235
$ 1,
051,7
31($
1,29
0,739
)$2
13,78
4,903
(Con
tinue
d)

176
Financial Information
Financial Information
OUR VISION—being your best financial service partner
MEG
A FI
NAN
CIA
L H
OLD
ING
CO
., LT
D.
STAT
EMEN
TS O
F C
HAN
GES
IN S
TOC
KHO
LDER
S’ E
QU
ITY
(Con
tinue
d)FO
R T
HE
YEAR
S EN
DED
DEC
EMBE
R 3
1, 2
012
AND
201
1
(Exp
ress
ed in
Tho
usan
ds o
f US
Dol
lars
)
Reta
ined
Earn
ings
Unre
alize
dRe
valua
tion
Incr
emen
ts
Cum
ulativ
e Tr
ansla
tion
Adjus
tmen
ts
Unre
alize
dGa
ins o
r Lo
sses
on
Fina
ncial
Ins
trum
ents
Net L
oss o
nUn
reco
gnize
dPe
nsion
Cos
t
Tota
l
Com
mon
Stoc
k
Capit
alSu
rplus
Le
gal
Rese
rve
Spec
ialRe
serv
e
Reta
ined
Earn
ings
For t
he ye
ar en
ded D
ecem
ber 3
1, 20
12
Balan
ce, J
anua
ry 1,
2012
Earn
ings d
istrib
ution
for 2
011
$ 3
,885,1
78
$ 1
,495,6
57
$
630
,236
$
28
,693
$
786
,228
$
76
,005
$
51
,852
$
35
,601
($
1,973
)$
6,98
7,477
Lega
l rese
rve
-
-60
,892
-
(
6
0,892
)
-
-
-
-
-
Cash
divid
ends
-
-
-
-
(
33
0,239
)
-
-
-
-(
330,2
39)
Stoc
k divi
dend
s dist
ributa
ble58
,278
-
-
-
(
5
8,278
)
-
-
-
-
-
Adjus
tmen
ts in
other
stoc
khold
ers’
equit
y ar
ising
from
long
-term
equit
y
Adjus
tmen
ts in
other
stoc
khold
ers’
equit
y
-(
39)
-
-
-
-
-
-
-
(
39
)
Chan
ges i
n unr
ealiz
ed pr
ofit o
r loss
on
avail
able-
for-sa
le fin
ancia
l ass
ets
-
-
-
-
-
-
-5,3
07
-
5,307
Chan
ges i
n cum
ulativ
e tra
nslat
ion
adjus
tmen
ts
-
-
-
-
-
-(
32,4
54)
-
-
(
3
2,454
)
Adjus
tmen
ts in
unre
alize
d re-
evalu
ation
-
-
-
-
-38
,495
-
-
-38
,495
Net lo
ss on
unre
cogn
ized p
ensio
n cos
t
-
-
-
-
-
-
-
-(
42,4
83)
(
4
2,483
)
Chan
ges i
n unr
ealiz
ed pr
ofit o
r loss
on
avail
able-
for-sa
le fin
ancia
l ass
ets
-
-
-
-
-
-
-(
4,6
85)
-
(
4,685
)
Cons
olida
ted ne
t inco
me fo
r the
year
ende
d De
cemb
er 31
, 201
2
-
-
-
-74
1,62
7
--
-
-
74
1,62
7
Balan
ce, D
ecem
ber 3
1, 20
12$
3,94
3,456
$ 1
,495,6
18$
6
91,12
8$
28,69
3$
1,07
8,446
$
114
,500
$
19
,398
$
36
,223
(
$4
4,456
)$
7,36
3,006

Financial Information
1772012 ANNUAL REPORT
MEGA FINANCIAL HOLDING CO., LTD. AND ITS SUBSIDIARIESCONSOLIDATED STATEMENTS OF CASH FLOWS
FOR THE YEARS ENDED DECEMBER 31, 2012 AND 2011(EXPRESSED IN THOUSANDS OF DOLLARS)
For the Years Ended December 31,
2012 2011
NT$ US$ NT$
Cash Flows from Operating Activities
Net income $ 21,533,141 $ 741,627 $ 17,679,892
Adjustments to reconcile net income to net cash provided by operating activities:
Depreciation and amortization 21,806 751 31,677
Loss on financial assets measured at cost 1,039 36 -
Investment income from equity investments accounted for by the equity method ( 22,661,062) ( 780,474) ( 18,111,631)
Cash dividends distributed by equity investments accounted for by the equity method
11,770,105
405,376
10,157,330
Swap bond discounted amortization 48,609 1,674 22,859
Changes in assets and liabilities:
(Increase) decrease in receivables ( 142,330) ( 4,902) 1,467,798
Increase in other assets ( 409) ( 14) ( 2,645)
Net change in deferred income tax assets/liabilities - - 77,931
Increase in financial liabilities at fair value through profit or loss 1,200 41 -
Increase (decrease) in payables 1,435,686 49,447 ( 304,871)
Increase in accrued pension liability 4,328 149 2,895
Net cash provided by operating activities 12,012,113 413,711 11,021,235
Cash Flows from Investing Activities
Acquisition of property and equipment ( 16,688) ( 575) ( 1,747)
Increase in equity investments accounted for by the equity method ( 7,191,000) ( 247,666) -
Returned capital due to the liquidation on financial assets carried at cost 2,814 97 -
Acquisition of other assets - - ( 2,844)
Net cash used in investing activities ( 7,204,874) ( 248,144) ( 4,591)
Cash Flows from Financing Activities
Increase in commercial paper payable 881,079 30,345 -
(Decrease) increase in bonds payable ( 300,000) ( 10,332) 528,200
Increase (decrease) in other liability 649 22 ( 3,580)
Payments of cash dividends ( 9,588,523) ( 330,240) ( 9,953,483)
Net cash used in financing activities ( 9,006,795) ( 310,205) ( 9,428,863)
Net (decrease) increase in cash and cash equivalents ( 4,199,556) ( 144,638) 1,587,781
Cash and cash equivalents, beginning the year 4,276,849 147,300 2,689,068
Cash and cash equivalents, end the year $ 77,293 2,662 $ 4,276,849
Supplemental cash flow information:
Interest paid $ 362,600 $ 12,488 $ 437,758
Income tax paid $ 1,983,656 $ 68,319 $ 2,820,166
Non-cash Investing And Financing Activities
Payables - corporate bonds within 1 year of maturity $ 4,100,000 $ 141,209 $ -

178
Financial Information
Financial Information
OUR VISION—being your best financial service partner
MEGA
INTE
RNAT
IONA
L COM
MERC
IAL B
ANK
CO., L
TD.
COND
ENSE
D BA
LANC
E SH
EETS
Dece
mber
31, 2
012 a
nd 20
11(E
xpre
ssed
in T
hous
ands
of D
ollar
s)
Dece
mber
31, 2
012
Dece
mber
31, 2
011
LIABI
LITIE
S AN
DST
OCKH
OLDE
RS’ E
QUIT
Y
De
cemb
er 31
, 201
2De
cemb
er 31
, 201
1AS
SETS
NT$
US$
NT$
NT$
US$
NT$
Asse
tsLia
bilitie
s
Cash
and c
ash e
quiva
lents
$ 30
4,353
,338
$ 10
,482,2
92$
312,0
94,48
3Du
e to t
he C
entra
l Ban
k and
Due f
rom
the C
entra
l Ban
k and
call
finan
cial in
stitut
ions
$ 33
4,740
,953
$ 11
,528,8
77$
362,5
73,92
3
loan
s to b
anks
14
9,085
,287
5,1
34,67
5
181,2
70,58
6Fu
nds b
orro
wed f
rom
the
Finan
cial li
abilit
ies at
fair v
alue t
hrou
gh
Cen
tral B
ank a
nd ot
her b
anks
60
,548,9
01
2,085
,376
71
,873,4
00
profi
t or lo
ss
40,77
1,174
1,4
04,20
8
41,76
6,764
Finan
cial li
abilit
ies at
fair
Bills
and b
onds
purch
ased
unde
r res
ale va
lue th
roug
h pro
fit or
loss
14
,132,9
90
486,7
57
20,36
1,058
agre
emen
ts
4,428
,875
15
2,536
34
9,562
Bills
and b
onds
sold
unde
r
Rece
ivable
s, ne
t
102,1
11,55
8
3,516
,844
81
,343,0
07 re
purch
ase a
gree
ments
17
,364,4
64
598,0
53
7,339
,481
Bills
disc
ounte
d and
loan
s, ne
t
1,484
,215,3
95
51,11
8,147
1,4
43,25
5,804
Paya
bles
40
,868,9
47
1,407
,575
37
,873,2
88
Avail
able-
for-sa
le fin
ancia
l ass
ets, n
et
13
1,104
,245
4,5
15,38
6
71,16
7,598
Depo
sits a
nd re
mitta
nces
1,7
06,41
9,598
58
,771,1
24
1,577
,120,1
39
Held-
to-ma
turity
finan
cial a
ssets
, net
15
8,447
,725
5,4
57,12
8
130,1
83,21
0Fin
ancia
l bon
ds pa
yable
43
,900,0
00
1,511
,968
42
,600,0
00
Equit
y inv
estm
ents
acco
unted
for b
y Ac
crued
pens
ion lia
bilitie
s
2,729
,560
94
,009
1,5
43,32
7
the eq
uity m
ethod
, net
9,2
32,27
4
317,9
71
9,214
,207
Othe
r fina
ncial
liabil
ities
9,7
88,36
5
337,1
24
12,61
3,856
Othe
r fina
ncial
asse
ts, ne
t
17,09
5,712
58
8,797
17
,915,8
15Ot
her li
abilit
ies
14,67
7,973
50
5,528
12
,325,8
63
Prop
erty
and e
quipm
ent, n
et
14,67
6,321
50
5,470
13
,322,2
26To
tal Li
abilit
ies
2,245
,171,7
51
77,32
6,391
2,1
46,22
4,335
Othe
r ass
ets, n
et
9,762
,235
33
6,222
7,3
41,57
1St
ockh
older
s' eq
uity
Capit
al sto
ck
71,00
0,000
2,4
45,32
5
68,00
0,000
Capit
al su
rplus
37
,261,0
28
1,283
,314
33
,070,0
28
Retai
ned e
arnin
gs
69,23
7,662
2,3
84,62
8
59,22
0,190
Equit
y adju
stmen
ts
2,613
,698
90
,018
2,7
10,28
0
Total
Stoc
khold
ers'
Equit
y
180,1
12,38
8
6,203
,285
16
3,000
,498
TOTA
L ASS
ETS
$ 2,4
25,28
4,139
$ 83
,529,6
76$
2,309
,224,8
33TO
TAL L
IABI
LITIE
S AN
D ST
OCKH
OLDE
RS' E
QUIT
Y$
2,425
,284,1
39$
83,52
9,676
$ 2,3
09,22
4,833

Financial Information
1792012 ANNUAL REPORT
MEGA SECURITIES CO., LTD.CONDENSED BALANCE SHEETS
December 31, 2012 and 2011(Expressed in Thousands of Dollars)
December 31, 2012December 31, 2011 LIABILITIES AND
STOCKHOLDERS’ EQUITY
December 31, 2012 December 31, 2011
ASSETS NT$ US$ NT$ NT$ US$ NT$
Assets Liabilities
Current assets $ 28,523,892 $ 982,397 $ 27,433,601 Current liabilities $ 20,541,316 $ 707,467 $ 17,436,617
Funds and investments 1,368,566 47,135 1,465,513 Long-term liabilities - - 2,500,000
Property and equipment, net 2,659,080 91,582 2,680,523 Other liabilities 72,265 2,489 75,871
Intangible assets 31,016 1,068 39,804 Total liabilities 20,613,581 709,956 20,012,488
Other assets 1,730,923 59,615 1,916,971 Stockholders' equity
Debit items for securities Capital stock 11,600,000 399,517 11,600,000consignment trading, net 34,291 1,181 151,941 Capital surplus 906,255 31,213 906,255
Retained earnings 1,381,065 47,566 1,303,875
Equity adjustments ( 153,133) ( 5,274) ( 134,265)
Total Stockholders' Equity 13,734,187 473,022 13,675,865
TOTAL ASSETS $ 34,347,768 $ 1,182,978 $ 33,688,353TOTAL LIABILITIES AND STOCKHOLDERS' EQUITY $ 34,347,768 $ 1,182,978 $ 33,688,353
MEGA BILLS FINANCE CO., LTD.CONDENSED BALANCE SHEETS
December 31, 2012 and 2011(Expressed in Thousands of Dollars)
December 31, 2012December 31, 2011 LIABILITIES AND
STOCKHOLDERS’ EQUITY
December 31, 2012December 31, 2011
ASSETS NT$ US$ NT$ NT$ US$ NT$Assets LiabilitiesCash and cash equivalents $ 367,174 $ 12,646 $ 601,915 Due to the Central Bank and Financial assets at fair value financial institutions $ 20,861,000 $ 718,478 $ 3,416,000
through profit or loss 129,072,587 4,445,414 135,756,870 Financial liabilities at fair value Receivables, net 1,261,152 43,436 1,833,166 through profit or loss 3,154 109 -
Available-for-sale financial Bills and bonds sold under assets, net 81,883,882 2,820,178 83,240,989 repurchase agreements 159,376,775 5,489,126 184,993,275
Held-to-maturity financial Payables 1,000,645 34,463 1,257,098assets, net 500,000 17,221 250,000 Accrued pension liabilities 281,049 9,680 235,663
Property and equipment, net 2,918,234 100,507 2,928,881 Reserve for guarantees 2,999,660 103,312 2,911,927Other financial assets, net 1,299,398 44,753 822,684 Other liabilities 76,217 2,624 73,473Intangible assets 4,750 164 1,096 Total Liabilities 184,598,500 6,357,792 192,887,436Other assets 110,397 3,801 47,010
Stockholders' equityCapital stock 13,114,411 451,676 13,114,411Capital surplus 312,823 10,774 312,823Retained earnings 16,900,777 582,083 15,897,794Equity adjustments 2,491,063 85,795 3,270,147Total Stockholders' Equity 32,819,074 1,130,328 32,595,175
TOTAL ASSETS $ 217,417,574 $ 7,488,120 $ 225,482,611TOTAL LIABILITIES AND STOCKHOLDERS' EQUITY $ 217,417,574 $ 7,488,120 $ 225,482,611

180
Financial Information
Financial Information
OUR VISION—being your best financial service partner
CHUNG KUO INSURANCE CO., LTD.CONDENSED BALANCE SHEETS
December 31, 2012 and 2011(Expressed in Thousands of Dollars)
ASSETS
December 31, 2012
December 31, 2011 LIABILITIES AND
STOCKHOLDERS’ EQUITY
December 31, 2012
December 31, 2011
NT$ US$ NT$ NT$ $ NT$
Assets Liabilities
Current assets $ 5,718,289 $ 196,945 $ 6,596,264 Payables $ 1,426,042 $ 49,115 $ 1,272,801
Receivables, net 1,793,116 61,757 1,775,968 Financial liabilities at fair value
Funds and investments 3,116,910 107,350 1,689,082 through profit or loss 5,124 176 6,736
Reinsurance reserve assets 2,748,168 94,650 2,996,956 Operation and liabilities reserve 8,270,154 284,834 8,532,270
Property and equipment 856,137 29,486 870,987 Other liabilities 333,907 11,500 302,359
Intangible assets 24,649 849 22,620 Total liabilities 10,035,227 345,625 10,114,166
Other assets 673,146 23,184 866,868 Stockholders' equity
Capital stock 3,000,000 103,324 3,000,000
Capital surplus 1,057,329 36,416 1,058,461
Retained earnings 990,108 34,100 784,232
Equity adjustments ( 152,249) ( 5,244) ( 138,114)
Total Stockholders' Equity 4,895,188 168,596 4,704,579
TOTAL ASSETS $ 14,930,415 $ 514,221 $ 14,818,745TOTAL LIABILITIES AND STOCKHOLDERS' EQUITY $ 14,930,415 $ 514,221 $ 14,818,745
MEGA INTERNATIONAL INVESTMENT TRUST CO., LTD.CONDENSED BALANCE SHEETS
December 31, 2012 and 2011(Expressed in Thousands of Dollars)
ASSETS
December 31, 2012
December 31, 2011 LIABILITIES AND
STOCKHOLDERS’ EQUITY
December 31, 2012
December 31, 2011
NT$ US$ NT$ NT$ US$ NT$
Assets Liabilities
Current assets $ 346,114 $ 11,921 $ 336,525 Current liabilities $ 35,957 $ 1,238 $ 32,683
Property and equipment, net 3,076 106 5,257 Other liabilities 11,204 386 9,913
Intangible assets 1,012 35 83 Total liabilities 47,161 1,624 42,596
Other assets 503,089 17,326 517,302
Stockholders' equity
Capital stock 527,000 18,151 527,000
Capital surplus 336 12 336
Retained earnings 275,728 9,495 287,181
Equity adjustments 3,066 106 2,054
Total Stockholders' Equity 806,130 27,764 816,571
TOTAL ASSETS $ 853,291 $ 29,388 $ 859,167TOTAL LIABILITIES AND STOCKHOLDERS' EQUITY $ 853,291 $ 29,388 $ 859,167

Financial Information
1812012 ANNUAL REPORT
MEGA LIFE INSURANCE AGENCY CO., LTD.CONDENSED BALANCE SHEETS
December 31, 2012 and 2011(Expressed in Thousands of Dollars)
ASSETS
December 31, 2012
December 31, 2011 LIABILITIES AND
STOCKHOLDERS’ EQUITY
December 31, 2012
December 31, 2011
NT$ US$ NT$ NT$ US$ NT$
Assets Liabilities
Current assets $ 314,159 $ 10,820 $ 187,024 Current liabilities $ 116,523 $ 4,013 $ 70,183
Property and equipment, net 607 21 711 Total liabilities 116,523 4,013 70,183
Other assets 3,921 135 4,437 Stockholders' equity
Capital stock 20,000 689 20,000
Retained earnings 182,164 6,274 101,989
Total Stockholders' Equity 202,164 6,963 121,989
TOTAL ASSETS $ 318,687 $ 10,976 $ 192,172TOTAL LIABILITIES AND STOCKHOLDERS' EQUITY $ 318,687 $ 10,976 $ 192,172
MEGA ASSET MANAGEMENT CO., LTD.CONDENSED BALANCE SHEETS
December 31, 2012 and 2011(Expressed in Thousands of Dollars)
ASSETS
December 31, 2012
December 31, 2011 LIABILITIES AND
STOCKHOLDERS’ EQUITY
December 31, 2012
December 31, 2011
NT$ US$ NT$ NT$ US$ NT$
Assets Liabilities
Current assets $ 10,544,462 $ 363,164 $ 9,286,849 Current liabilities $ 6,136,449 $ 211,348 $ 7,336,152
Fund and investments - - 144,238 Long-term liabilities 2,054,000 70,742 24,400
Property and equipment, net 516 18 995 Other liabilities 199,597 6,874 179,825
Intangible assets 1,556 54 1,583 Total liabilities 8,390,046 288,964 7,540,377
Other assets 723,214 24,908 755,239
Stockholders' equity
Capital stock 2,000,000 68,882 2,000,000
Retained earnings 879,702 30,298 648,527
Total Stockholders' Equity 2,879,702 99,180 2,648,527
TOTAL ASSETS $ 11,269,748 $ 388,144 $ 10,188,904TOTAL LIABILITIES AND STOCKHOLDERS' EQUITY $ 11,269,748 $ 388,144 $ 10,188,904

182
Financial Information
Financial Information
OUR VISION—being your best financial service partner
MEGA VENTURE CAPITAL CO., LTD.CONDENSED BALANCE SHEETS
December 31, 2012 and 2011(Expressed in Thousands of Dollars)
ASSETS
December 31, 2012
December 31, 2011 LIABILITIES AND
STOCKHOLDERS’ EQUITY
December 31, 2012
December 31, 2011
NT$ US$ NT$ NT$ US$ NT$Assets LiabilitiesCurrent assets $ 117,878 $ 4,060 $ 101,513 Current liabilities $ 1,272 $ 44 $ 14,390Funds and investments 601,511 20,717 612,375 Total liabilities 1,272 44 14,390
Stockholders' equityCapital stock 1,000,000 34,441 1,000,000Retained earnings ( 66,118) ( 2,277) ( 78,530)Equity adjustments ( 215,765) ( 7,431) ( 221,972)Total Stockholders' Equity 718,117 24,733 699,498
TOTAL ASSETS $ 719,389 $ 24,777 $ 713,888TOTAL LIABILITIES AND STOCKHOLDERS' EQUITY $ 719,389 $ 24,777 $ 713,888
MEGA INTERNATIONAL COMMERCIAL BANK CO., LTD.CONDENSED INCOME STATEMENTS
For the years ended December 31, 2012 and 2011(Expressed in Thousands of Dollars, Except Earnings Per Share Amounts)
For the year endedDecember 31, 2012
For the year endedDecember 31, 2011
NT$ US$ NT$
Interest income, net $ 27,535,926 $ 948,370 $ 24,662,404Revenues other than interest income, net 15,597,402 537,193 12,348,846Net revenue 43,133,328 1,485,563 37,011,250Bad debts expense on loans ( 4,354,634) ( 149,978) ( 3,397,965)Operating Expenses ( 16,205,296) ( 558,130) ( 16,143,464)Income before Income Tax $ 22,573,398 $ 777,455 $ 17,469,821Net Income $ 19,333,472 $ 665,868 $ 15,007,858Earnings Per Share (Pre-tax) $ 3.27 $ 0.11 $ 2.57Earnings Per Share (After-tax) $ 2.80 $ 0.10 $ 2.21
MEGA SECURITIES CO., LTD.CONDENSED INCOME STATEMENTS
For the years ended December 31, 2012 and 2011(Expressed in Thousands of Dollars, Except Earnings Per Share Amounts)
For the year endedDecember 31, 2012
For the year endedDecember 31, 2011
NT$ US$ NT$
Revenues $ 2,785,830 $ 95,947 $ 4,129,130Expenses ( 2,659,115) ( 91,583) ( 4,279,723)Income before Income Tax $ 126,715 $ 4,364 ($ 150,593)Net Income $ 77,190 $ 2,659 ($ 370,929)Earnings Per Share (Pre-tax) $ 0.11 $ 0.004 ($ 0.13)Earnings Per Share (After-tax) $ 0.07 $ 0.002 ($ 0.32)

Financial Information
1832012 ANNUAL REPORT
MEGA BILLS FINANCE CO., LTD.CONDENSED INCOME STATEMENTS
For the years ended December 31, 2012 and 2011(Expressed in Thousands of Dollars, Except Earnings Per Share Amounts)
For the year endedDecember 31, 2012
For the year endedDecember 31, 2011
NT$ US$ NT$
Interest income, net $ 1,989,274 $ 68,513 $ 2,407,627Revenues other than interest, net 2,282,614 78,616 1,599,847Net revenue 4,271,888 147,129 4,007,474Provision for various reserve ( 126,379) ( 4,353) ( 89,757)Operating Expenses ( 796,950) ( 27,448) ( 779,614)Income before Income Tax $ 3,348,559 $ 115,328 $ 3,138,103Net Income $ 2,880,966 $ 99,224 $ 2,682,302Earnings Per Share (Pre-tax) $ 2.55 $ 0.09 $ 2.39Earnings Per Share (After-tax) $ 2.20 $ 0.08 $ 2.05
CHUNG KUO INSURANCE CO., LTD.CONDENSED INCOME STATEMENTS
For the years ended December 31, 2012 and 2011(Expressed in Thousands of Dollars, Except Earnings Per Share Amounts)
For the year endedDecember 31, 2012
For the year endedDecember 31, 2011
NT$ US$ NT$
Operating Revenues $ 4,116,127 $ 141,764 $ 3,637,062Operating Costs ( 2,938,982) ( 101,222) ( 2,478,238)Gross operating profit 1,177,145 40,542 1,158,824Operating Expenses ( 900,640) ( 31,019) ( 857,776)Non-Operating Revenues and Gains 8,333 287 5,987Non-Operating Expenses and Losses ( 18,879) ( 650) ( 24,073)Income before Income Tax $ 265,959 $ 9,160 $ 282,962Net income $ 205,876 $ 7,091 $ 237,612Earnings Per Share (Pre-tax) $ 0.89 $ 0.03 $ 0.94Earnings Per Share (After-tax) $ 0.69 $ 0.02 $ 0.79
MEGA INTERNATIONAL INVESTMENT TRUST CO., LTD.CONDENSED INCOME STATEMENTS
For the years ended December 31, 2012 and 2011(Expressed in Thousands of Dollars, Except Earnings Per Share Amounts)
For the year endedDecember 31, 2012
For the year endedDecember 31, 2011
NT$ US$ NT$
Operating Revenues $ 327,748 $ 11,288 $ 347,019Operating Expenses ( 213,817) ( 7,364) ( 217,034)Net operating income 113,931 3,924 129,985Non-Operating Revenues and Gains 14,904 513 17,181Non-Operating Expenses and Losses ( 11,566) ( 398) ( 2,139)Income before Income Tax $ 117,269 $ 4,039 $ 145,027Net Income $ 97,181 $ 3,347 $ 120,706Earnings Per Share (Pre-tax) $ 2.23 $ 0.08 $ 2.75Earnings Per Share (After-tax) $ 1.84 $ 0.06 $ 2.29

184
Financial Information
Financial Information
OUR VISION—being your best financial service partner
MEGA ASSET MANAGEMENT CO., LTD.CONDENSED INCOME STATEMENTS
For the years ended December 31, 2012 and 2011(Expressed in Thousands of Dollars, Except Earnings Per Share Amounts)
For the year endedDecember 31, 2012
For the year endedDecember 31, 2011
NT$ US$ NT$
Operating Revenues $ 905,262 $ 31,178 $ 681,630Operating Expenses ( 177,456) ( 6,112) ( 176,202)Net operating income 727,806 25,066 505,428Non-Operating Revenues and Gains 117,310 4,040 106,326Non-Operating Expenses and Losses ( 92,546) ( 3,187) ( 82,753)Income before Income Tax $ 752,570 $ 25,919 $ 529,001Net Income $ 621,075 $ 21,391 $ 433,223Earnings Per Share (Pre-tax) $ 3.76 $ 0.13 $ 2.65Earnings Per Share (After-tax) $ 3.11 $ 0.11 $ 2.17
MEGA LIFE INSURANCE AGENCY CO., LTD.CONDENSED INCOME STATEMENTS
For the years ended December 31, 2012 and 2011(Expressed in Thousands of Dollars, Except Earnings Per Share Amounts)
For the year endedDecember 31, 2012
For the year endedDecember 31, 2011
NT$ US$ NT$
Operating Revenues $ 1,213,988 $ 41,811 $ 605,975Operating Cost - - -Net Operating Income 1,213,988 41,811 605,975Operating Expenses ( 1,025,968) ( 35,336) ( 514,099)Non-Operating Revenues and Gains 2,129 73 12,036Non-Operating Expenses and Losses ( 75) ( 3) ( 44)Income before Income Tax $ 190,074 $ 6,545 $ 103,868Net Income $ 157,761 $ 5,433 $ 86,206Earnings Per Share (Pre-tax) $ 95.04 $ 3.27 $ 51.93Earnings Per Share (After-tax) $ 78.88 $ 2.72 $ 43.10
MEGA VENTURE CAPITAL CO., LTD.CONDENSED INCOME STATEMENT
For the years ended December 31, 2012 and 2011(Expressed in Thousands of Dollars, Except Earnings Per Share Amounts)
For the year endedDecember 31, 2012
For the year endedDecember 31, 2011
NT$ US$ NT$
Operating Revenues $ 168,623 $ 5,807 $ 235,265Operating Costs ( 136,330) ( 4,695) ( 302,628)Gross operating profit (loss) 32,293 1,112 ( 67,363)Operating Expenses ( 20,469) ( 705) ( 20,764)Non-Operating Revenues and Gains 597 21 219Income (loss) before Income Tax $ 12,421 $ 428 ($ 87,908)Net Income (Loss) $ 12,412 $ 427 ($ 89,356)Earnings (Loss) Per Share (Pre-tax) $ 0.12 $ 0.004 ($ 0.88)Earnings (Loss) Per Share (After-tax) $ 0.12 $ 0.004 ($ 0.89)

Financial Information
1852012 ANNUAL REPORT
( 15 ) Profitability, asset quality, management information, and liquidity and market risk sensitivity of the Company and subsidiaries:
A. Profitability
( a ) The Company : UNIT : %
ItemsMEGA FINANCIAL HOLDING CO., LTD.
For the year endedDecember 31, 2012
For the year endedDecember 31, 2011
Return on assetsPre-tax 9.31 7.73
After tax 9.11 7.72
Return on equityPre-tax 10.56 8.76
After tax 10.34 8.76
Net profit margin 94.77 97.36
UNIT : %
ItemsMEGA FINANCIAL HOLDING CO., LTD AND ITS SUBSIDIARIES
For the year endedDecember 31, 2012
For the year endedDecember 31, 2011
Return on assetsPre-tax 0.97 0.82
After tax 0.81 0.69
Return on equityPre-tax 12.38 10.44
After tax 10.33 8.75
Net profit margin 42.03 38.67
( b ) Subsidiaries:UNIT : %
ItemsMICB
For the year endedDecember 31, 2012
For the year endedDecember 31, 2011
Return on assetsPre-tax 0.95 0.78
After tax 0.82 0.67
Return on equityPre-tax 13.16 10.89
After tax 11.27 9.36
Net profit margin 44.82 40.55
UNIT : %
ItemsMS
For the year endedDecember 31, 2012
For the year endedDecember 31, 2011
Return on assetsPre-tax 0.37 ( 0.38 )
After tax 0.23 ( 0.93 )
Return on equityPre-tax 0.92 ( 1.06 )
After tax 0.56 ( 2.61 )
Net profit margin 2.91 ( 9.34 )

186
Financial Information
Financial Information
OUR VISION—being your best financial service partner
UNIT : %
ItemsMBF
For the year endedDecember 31, 2012
For the year endedDecember 31, 2011
Return on assetsPre-tax 1.51 1.44
After tax 1.30 1.23
Return on equityPre-tax 10.24 9.64
After tax 8.81 8.24
Net profit margin 67.44 66.93
UNIT : %
ItemsCKI
For the year endedDecember 31, 2012
For the year endedDecember 31, 2011
Return on assetsPre-tax 1.79 1.87
After tax 1.38 1.57
Return on equityPre-tax 5.54 6.06
After tax 4.29 5.09
Net profit margin 5.00 6.53
Note : ( 1 ) Return on assets = Income ( loss ) before income tax ÷ Average total assets
( 2 ) Return on equity = Income ( loss ) before income tax ÷ Average stockholders’ equity
( 3 ) Net profit margin = Net income ( loss ) after income tax ÷ Operating revenues
( 4 ) Net income ( loss ) pre-tax / after-tax refers to the income ( loss ) for the years ended December 31, 2012 and 2011.
B. Asset quality
( a ) MICB
i. Non-performing loans and overdue accountsUnit : In thousands of NT dollars, %
December 31, 2012
Amount of non-performing loans
( Note 1 )Gross loans
Non-performing loan ratio ( Note 2 )
Allowance for doubtful accounts
Coverage ratio ( Note 3 )
Corporate Banking
Secured loans $ 457,445 $ 569,646,321 0.08% $ 7,120,302 1556.54%
Unsecured loans 1,531,665 637,469,434 0.24% 6,828,648 445.83%
Consumer banking
Residential mortgage loans ( Note 4 ) 429,993 210,027,595 0.20% 1,549,096 360.26%
Cash card services - - - - -
Small amount of credit loans ( Note 5 ) 11,310 11,063,644 0.10% 78,069 690.27%
Others( Note 6 )
Secured loans 26,322 71,544,131 0.04% 478,214 1816.78%
Unsecured loans 23,805 524,467 4.54% 5,868 24.65%
Gross loan business 2,480,540 1,500,275,592 0.17% 16,060,197 647.45%
Amount of overdue accounts
Balance of accounts receivable
Overdue account ratio
Allowance for doubtful accounts Coverage ratio
Credit card services $ 10,263 $ 4,109,795 0.25% $ 87,254 850.18%
Without recourse factoring ( Note 7 ) - 67,166,000 - 651,042 -

Financial Information
1872012 ANNUAL REPORT
Unit : In thousands of NT Dollars, %
December 31, 2011
Amount of non-performing loans
( Note 1 )Gross loans
Non-performing loan ratio ( Note 2 )
Allowance for doubtful accounts
Coverage ratio ( Note 3 )
Corporate Banking
Secured loans $ 352,515 $ 549,792,258 0.06% $ 7,323,945 2077.63%
Unsecured loans 2,522,702 627,542,415 0.40% 6,163,658 244.33%
Consumer banking
Residential mortgage loans ( Note 4 ) 605,977 202,221,261 0.30% 1,438,462 237.38%
Cash card services - - - - -
Small amount of credit loans ( Note 5 ) 15,635 11,311,448 0.14% 72,034 460.72%
Others( Note 6 )
Secured loans 26,647 67,027,301 0.04% 385,842 1447.98%
Unsecured loans 40,009 754,375 5.30% 9,313 23.28%
Gross loan business 3,563,485 1,458,649,058 0.24% 15,393,254 431.97%
Amount of overdue accounts
Balance of accounts receivable
Overdue account ratio
Allowance for doubtful accounts Coverage ratio
Credit card services $ 9,118 $ 4,295,018 0.21% $ 82,912 909.32%
Without recourse factoring ( Note 7 ) 236,386 59,331,468 0.40% 302,943 128.16%
Note 1: The amount recognized as non-performing loans is in accordance with the “Regulation Governing the Procedures for Banking Institutions to Evaluate Assets and Deal with Non-performing/Non-accrual Loans”. The amount included in overdue accounts for credit cards is in accordance with the Banking Bureau (4) Letter No.0944000378 dated July 6, 2005.
Note 2: Non-performing loan ratio=non-performing loans/gross loans. Overdue account ratio for credit cards=overdue accounts/balance of accounts receivable.
Note 3: Coverage ratio for loans=allowance for doubtful accounts of loans/non-performing loans. Coverage ratio for accounts receivable of credit cards=allowance for doubtful accounts for accounts receivable of credit cards/overdue accounts.
Note 4: For residential mortgage loans, the borrower provides his/her (or spouses) house as collateral in full and mortgages it to the financial institution for the purpose of obtaining funds to purchase or add improvements to a house.
Note 5: Small amount of credit loans apply to the norms of the Banking Bureau (4) Letter No. 09440010950 dated December 19, 2005, excluding credit card and cash card services.
Note 6: Other consumer banking is specified as secured or unsecured consumer loans other than residential mortgage loan, cash card services and small amount of credit loans, and excluding credit card services.
Note 7: Pursuant to the Banking Bureau (5) Letter No. 094000494 dated July 19, 2005, the amount of without recourse factoring will be recognized as overdue accounts within three months after the factor or insurance company resolves not to compensate the loss.
ii. Total amount of non-performing loans or overdue receivables exempted from reporting to the competent authoritty
Unit : In thousands of NT Dollars, %
December 31, 2012 December 31, 2011
Total amount of non-performing loans
exempted from reporting to the competent
authority
Total amount of overdue receivables exempted from reporting to the competent authority
Total amount of non-performing loans
exempted from reporting to the competent
authority
Total amount of overdue receivables exempted from reporting to the competent authority
Performing amounts exempted from reporting to the competent authority as debt negotiation ( Note 1 ) $ 101 $ - $ 158 $ -
Performing amounts in accordancewith debt liquidation program and restructuring program ( Note 2 ) 584 4,763 242 5,393
Total $ 685 $ 4,763 $ 400 $ 5,393
Note 1: The Bank disclosed the total amount of non- performing loans and overdue receivables exempted from reporting to the competent authority as debt negotiation in accordance with the Explanatory Letter Jin-Guan-Yin (1) No. 09510001270 of the FSC dated April 25, 2006.
Note 2: The Bank disclosed the total amount of non- performing loans and overdue receivables exempted from reporting to the competent authority as debt liquidation program and restructuring program in accordance with the Explanatory Letter Jin-Guan-Yin (1) No. 09700318940 of the FSC dated September 15, 2008.
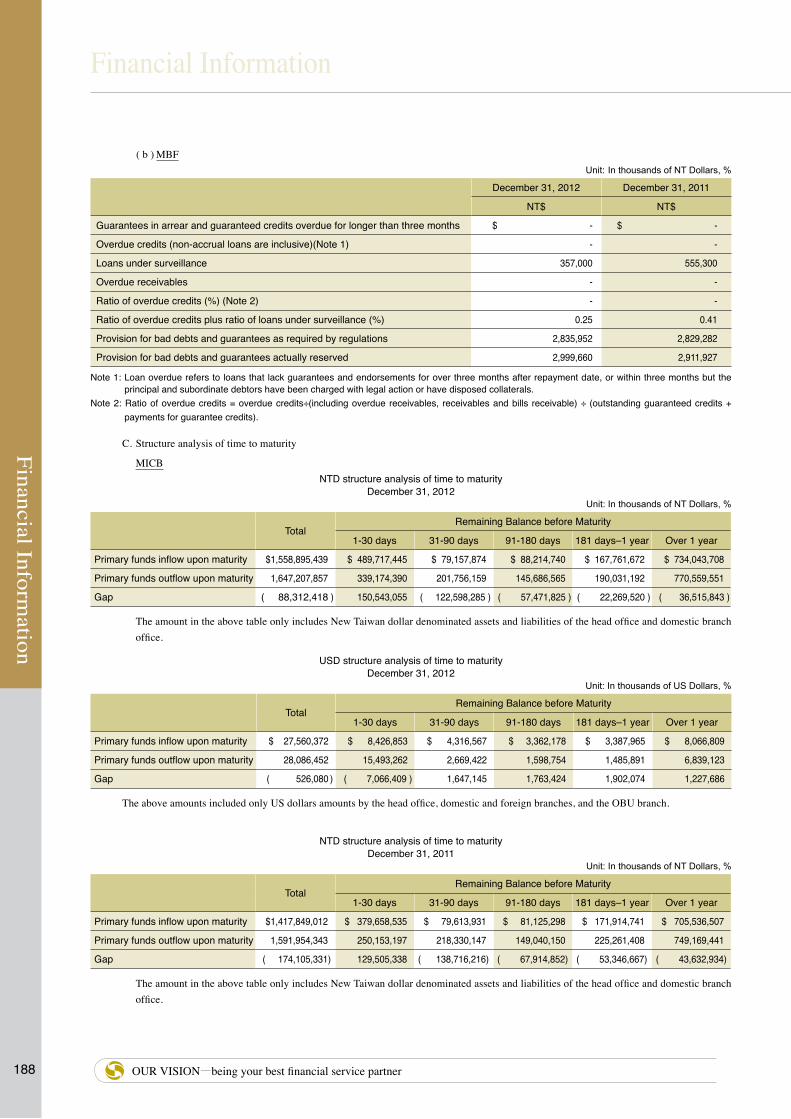
188
Financial Information
Financial Information
OUR VISION—being your best financial service partner
( b ) MBFUnit: In thousands of NT Dollars, %
December 31, 2012 December 31, 2011
NT$ NT$
Guarantees in arrear and guaranteed credits overdue for longer than three months $ - $ -
Overdue credits (non-accrual loans are inclusive)(Note 1) - -
Loans under surveillance 357,000 555,300
Overdue receivables - -
Ratio of overdue credits (%) (Note 2) - -
Ratio of overdue credits plus ratio of loans under surveillance (%) 0.25 0.41
Provision for bad debts and guarantees as required by regulations 2,835,952 2,829,282
Provision for bad debts and guarantees actually reserved 2,999,660 2,911,927
Note 1: Loan overdue refers to loans that lack guarantees and endorsements for over three months after repayment date, or within three months but the principal and subordinate debtors have been charged with legal action or have disposed collaterals.
Note 2: Ratio of overdue credits = overdue credits÷(including overdue receivables, receivables and bills receivable) ÷ (outstanding guaranteed credits + payments for guarantee credits).
C. Structure analysis of time to maturity
MICBNTD structure analysis of time to maturity
December 31, 2012Unit: In thousands of NT Dollars, %
TotalRemaining Balance before Maturity
1-30 days 31-90 days 91-180 days 181 days–1 year Over 1 year
Primary funds inflow upon maturity $1,558,895,439 $ 489,717,445 $ 79,157,874 $ 88,214,740 $ 167,761,672 $ 734,043,708
Primary funds outflow upon maturity 1,647,207,857 339,174,390 201,756,159 145,686,565 190,031,192 770,559,551
Gap ( 88,312,418 ) 150,543,055 ( 122,598,285 ) ( 57,471,825 ) ( 22,269,520 ) ( 36,515,843 )
The amount in the above table only includes New Taiwan dollar denominated assets and liabilities of the head office and domestic branch office.
USD structure analysis of time to maturityDecember 31, 2012
Unit: In thousands of US Dollars, %
TotalRemaining Balance before Maturity
1-30 days 31-90 days 91-180 days 181 days–1 year Over 1 year
Primary funds inflow upon maturity $ 27,560,372 $ 8,426,853 $ 4,316,567 $ 3,362,178 $ 3,387,965 $ 8,066,809
Primary funds outflow upon maturity 28,086,452 15,493,262 2,669,422 1,598,754 1,485,891 6,839,123
Gap ( 526,080 ) ( 7,066,409 ) 1,647,145 1,763,424 1,902,074 1,227,686
The above amounts included only US dollars amounts by the head office, domestic and foreign branches, and the OBU branch.
NTD structure analysis of time to maturityDecember 31, 2011
Unit: In thousands of NT Dollars, %
TotalRemaining Balance before Maturity
1-30 days 31-90 days 91-180 days 181 days–1 year Over 1 year
Primary funds inflow upon maturity $1,417,849,012 $ 379,658,535 $ 79,613,931 $ 81,125,298 $ 171,914,741 $ 705,536,507
Primary funds outflow upon maturity 1,591,954,343 250,153,197 218,330,147 149,040,150 225,261,408 749,169,441
Gap ( 174,105,331) 129,505,338 ( 138,716,216) ( 67,914,852) ( 53,346,667) ( 43,632,934)
The amount in the above table only includes New Taiwan dollar denominated assets and liabilities of the head office and domestic branch office.

Financial Information
1892012 ANNUAL REPORT
USD structure analysis of time to maturityDecember 31, 2011
Unit: In thousands of US Dollars, %
TotalRemaining Balance before Maturity
1-30 days 31-90 days 91-180 days 181 days–1 year Over 1 year
Primary funds inflow upon maturity $ 25,814,045 $ 7,495,395 $ 5,824,314 $ 2,612,029 $ 2,465,522 $ 7,416,785
Primary funds outflow upon maturity 26,460,786 15,662,775 2,759,123 1,499,514 2,315,933 4,223,441
Gap ( 646,741) ( 8,167,380) 3,065,191 1,112,515 149,589 3,193,344
The above amounts included only US dollars amounts by the head office, domestic and foreign branches, and the OBU branch.
D. Interest rate sensitivity analysis on assets and liabilities
( a ) MICB
Interest rate sensitivity analysis on assets and liabilities ( NT Dollars )December 31, 2012
Unit: In thousands of NT Dollars, %
1-90 days 91-180 days 181 days to 1 year Over 1 year Total
Interest rate sensitive assets $ 473,863,401 $ 680,228,420 $ 6,569,522 $ 21,077,653 $ 1,181,738,996
Interest rate sensitive liabilities 477,265,508 516,371,224 36,925,477 44,285,855 1,074,848,064
Interest rate sensitive gap ( 3,402,107) 163,857,196 ( 30,355,955) ( 23,208,202) 106,890,932
Net worth 180,112,388
Ratio of interest rate sensitive assets to interest rate sensitive liabilities 109.94%
Ratio of interest rate sensitivity gap to net worth 59.35%
Notes: 1. The above amounts included only New Taiwan dollar amounts by the onshore branches of the Company (i.e. excluding foreign currency). 2. Interest rate sensitive assets and liabilities refer to the interest-earning assets and interest-bearing liabilities of which the income or costs are
affected by the fluctuations in interest rates. 3. Interest rate sensitivity gap = Interest rate sensitive assets – Interest rate sensitive liabilities 4. Ratio of interest rate sensitive assets to interest rate sensitive liabilities = Interest rate sensitive assets ÷ Interest rate sensitive liabilities (referring to the current interest rate sensitive assets and liabilities denominated in New Taiwan dollars)
Interest rate sensitivity analysis on assets and liabilities ( US Dollars )December 31, 2012
Unit: In thousands of US Dollars, %
1-90 days 91-180 days 181 days to 1 year Over 1 year Total
Interest rate sensitive assets $ 29,084,516 $ 740,916 $ 339,508 $ 514,052 $ 30,678,992
Interest rate sensitive liabilities 28,010,741 1,105,073 789,745 300 29,905,859
Interest rate sensitive gap 1,073,775 ( 364,157) ( 450,237) 513,752 773,133
Net worth 6,203,285
Ratio of interest rate sensitive assets to interest rate sensitive liabilities 102.59%
Ratio of interest rate sensitivity gap to net worth 12.46%
Notes: 1. The above amounts included only US dollars denominated assets and liabilities of head office, domestic and foreign branches, and the OBU branch. Contingent assets and liabilities are excluded.
2. Interest rate sensitive assets and liabilities refer to the interest-earning assets and interest-bearing liabilities of which the income or costs are affected by the fluctuations in interest rates.
3. Interest rate sensitivity gap = Interest rate sensitive assets – Interest rate sensitive liabilities 4. Ratio of interest rate sensitive assets to interest rate sensitive liabilities = Interest rate sensitive assets ÷ Interest rate sensitive liabilities
(referring to the current interest rate sensitive assets and liabilities denominated in US dollars).

190
Financial Information
Financial Information
OUR VISION—being your best financial service partner
Interest rate sensitivity analysis on assets and liabilities ( NT Dollars )December 31, 2011
Unit: In thousands of US Dollars, %
1-90 days 91-180 days 181 days to 1 year Over 1 year Total
Interest rate sensitive assets $ 406,472,133 $ 621,620,710 $ 38,138,635 $ 20,769,878 $ 1,087,001,356
Interest rate sensitive liabilities 438,526,810 496,763,418 31,566,003 42,630,684 1,009,486,915
Interest rate sensitive gap ( 32,054,677) 124,857,292 6,572,632 ( 21,860,806) 77,514,441
Net worth 203,178,726
Ratio of interest rate sensitive assets to interest rate sensitive liabilities 107.68%
Ratio of interest rate sensitivity gap to net worth 38.15%
Notes: 1. The above amounts included only New Taiwan dollar amounts by the onshore branches of the Company (i.e. excluding foreign currency). 2. Interest rate sensitive assets and liabilities refer to the interest-earning assets and interest-bearing liabilities of which the income or costs are
affected by the fluctuations in interest rates. 3. Interest rate sensitivity gap = Interest rate sensitive assets – Interest rate sensitive liabilities 4. Ratio of interest rate sensitive assets to interest rate sensitive liabilities = Interest rate sensitive assets ÷ Interest rate sensitive liabilities (referring to the current interest rate sensitive assets and liabilities denominated in New Taiwan dollars)
Interest rate sensitivity analysis on assets and liabilities ( US Dollars )December 31, 2011
Unit: In thousands of US Dollars, %
1-90 days 91-180 days 181 days to 1 year Over 1 year Total
Interest rate sensitive assets $ 26,323,580 $ 535,866 $ 246,992 $ 1,067,177 $ 28,173,615
Interest rate sensitive liabilities 26,794,611 788,917 683,744 2,583 28,269,855
Interest rate sensitive gap ( 471,031) ( 253,051) ( 436,752) 1,064,594 ( 96,240)
Net worth 6,711,771
Ratio of interest rate sensitive assets to interest rate sensitive liabilities 99.66%
Ratio of interest rate sensitivity gap to net worth -1.43%
Notes: 1. The above amounts included only US dollars denominated assets and liabilities of head office, domestic and foreign branches, and the OBU branch. Contingent assets and liabilities are excluded.
2. Interest rate sensitive assets and liabilities refer to the interest-earning assets and interest-bearing liabilities of which the income or costs are affected by the fluctuations in interest rates.
3. Interest rate sensitivity gap = Interest rate sensitive assets – Interest rate sensitive liabilities 4. Ratio of interest rate sensitive assets to interest rate sensitive liabilities = Interest rate sensitive assets ÷ Interest rate sensitive liabilities
(referring to the current interest rate sensitive assets and liabilities denominated in US dollars).
( b ) MBF
Interest rate sensitivity analysis on assets and liabilities ( US Dollars )December 31, 2012
Unit: In thousands of US Dollars, %
1-90 days 91-180 days 181 days to 1 year Over 1 year Total
Interest rate sensitive assets 118,128,935 17,537,408 8,180,348 65,697,315 209,544,006
Interest rate sensitive liabilities 177,966,379 2,236,308 35,088 - 180,237,775
Interest rate sensitive gap (59,837,444) 15,301,100 8,145,260 65,697,315 29,306,231
Net worth 32,819,074
Ratio of interest rate sensitive assets to interest rate sensitive liabilities 116.26%
Ratio of interest rate sensitivity gap to net worth 89.30%

Financial Information
1912012 ANNUAL REPORT
Interest rate sensitivity analysis on assets and liabilities ( NT Dollars )December 31, 2011
Unit: In thousands of NT Dollars, %
1-90 days 91-180 days 181 days to 1 year Over 1 year Total
Interest rate sensitive assets $ 120,238,992 $ 18,060,358 $ 18,588,988 $ 60,653,896 $ 217,542,234
Interest rate sensitive liabilities 185,374,995 2,229,037 805,243 - 188,409,275
Interest rate sensitive gap ( 65,136,003 ) 15,831,321 17,783,745 60,653,896 29,132,959
Net worth 32,595,175
Ratio of interest rate sensitive assets to interest rate sensitive liabilities 115.46%
Ratio of interest rate sensitivity gap to net worth 89.38%
Notes: 1. Interest rate sensitive assets and liabilities refer to the interest-earning assets and interest-bearing liabilities of which the income or costs are affected by the fluctuations in interest rates.
2. Interest rate sensitivity gap = Interest rate sensitive assets – Interest rate sensitive liabilities. 3. Ratio of interest rate sensitive assets to interest rate sensitive liabilities = Interest rate sensitive assets ÷ Interest rate sensitive liabilities (referring
to the current interest rate sensitive assets and liabilities denominated in New Taiwan dollars).
E. Average amount and average interest rates of interest-earning assets and interest-bearing liabilities
( a ) MICB
For the years ended December 31,
2012 2011
Average amount ( NT$ )
Averageamount( US$ )
Average interest rate
( % )
Average amount ( NT$ )
Average interest rate
( % )Assets
Due from banks ( including call loans to banks ) $ 383,372,516 $ 13,203,806 0.98 $ 274,423,280 0.73Due from the Central Bank 54,116,692 1,863,843 0.49 53,612,317 0.45Financial assets held for trading purposes 100,621 3,466 1.11 35,585 1.03Financial assets at fair value through profit or loss 31,376,528 1,080,645 2.50 27,769,907 2.37Bonds and bills purchased under resale agreements 1,341,313 46,196 0.75 369,984 0.94Available-for-sale financial assets 84,538,160 2,911,595 2.28 68,090,385 2.60Receivables – credit card transaction with
circulating interests 1,646,816 56,718 16.54 1,808,085 16.06
Receivables on factoring 37,754,178 1,300,299 1.13 48,100,287 1.02Bills discounts and loans 1,497,498,032 51,575,617 2.08 1,398,949,694 2.01Held-to-maturity financial assets 143,735,688 4,950,428 1.13 183,470,933 1.00Other debt investments 4,000,000 137,765 - 4,000,000 -Bills purchased 53,506 1,843 1.79 48,376 2.41
LiabilitiesDue to the Central Bank 254,644,782 8,770,270 0.26 200,585,204 0.27Due to other banks 78,156,876 2,691,816 1.00 76,376,845 1.36Demand deposits 492,508,128 16,962,567 0.09 469,574,746 0.09Demand saving deposits 320,708,794 11,045,593 0.40 309,043,947 0.38Time deposits 585,474,566 20,164,442 0.89 540,794,318 0.76Time saving deposits 207,619,479 7,150,662 1.56 195,382,337 1.47Negotiable certificate of deposits 1,204,609 41,488 0.46 1,349,904 0.27Financial liabilities at fair value through profit or loss 9,593,496 330,411 2.76 14,657,079 2.40Bonds and bills sold under repurchase agreements 6,928,795 238,636 0.75 9,525,113 0.46Funds borrowed from the Central Bank and
other banks 75,001,084 2,583,127 0.46 52,680,699 0.56
Financial bonds payable 43,390,656 1,494,426 1.77 35,587,123 1.80
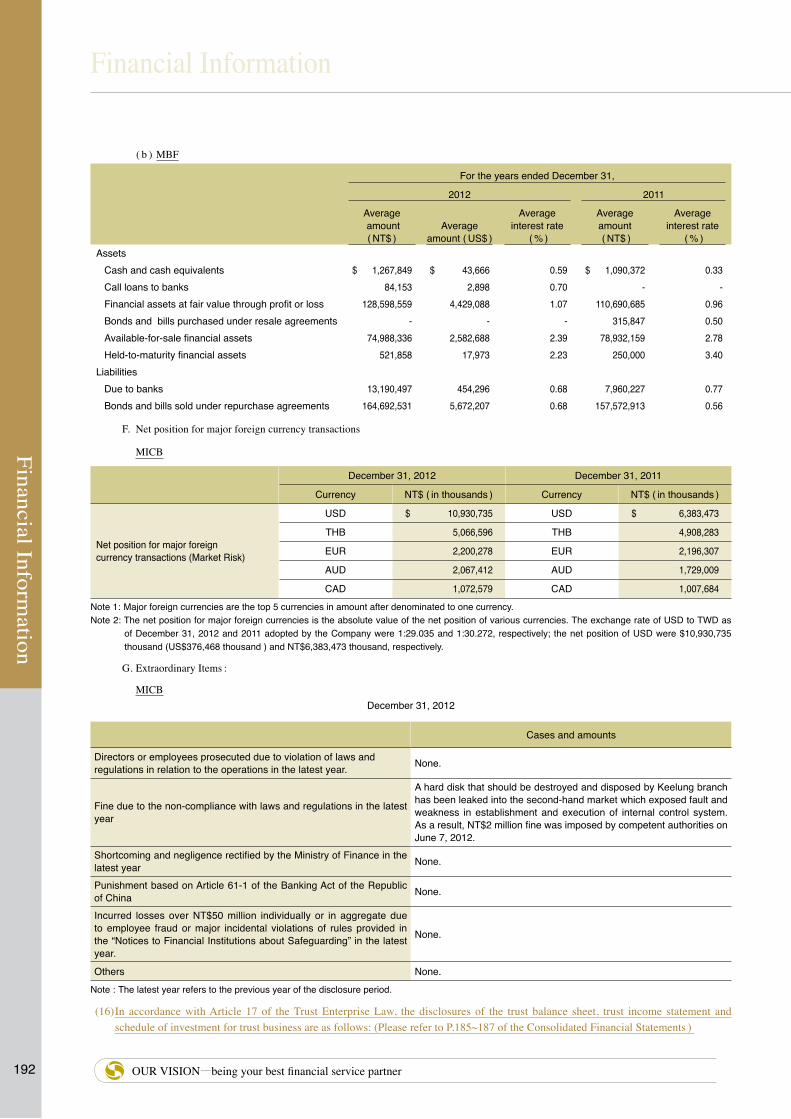
192
Financial Information
Financial Information
OUR VISION—being your best financial service partner
( b ) MBF
For the years ended December 31,
2012 2011
Average amount ( NT$ )
Averageamount ( US$ )
Average interest rate
( % )
Average amount ( NT$ )
Average interest rate
( % )Assets
Cash and cash equivalents $ 1,267,849 $ 43,666 0.59 $ 1,090,372 0.33Call loans to banks 84,153 2,898 0.70 - -Financial assets at fair value through profit or loss 128,598,559 4,429,088 1.07 110,690,685 0.96Bonds and bills purchased under resale agreements - - - 315,847 0.50Available-for-sale financial assets 74,988,336 2,582,688 2.39 78,932,159 2.78Held-to-maturity financial assets 521,858 17,973 2.23 250,000 3.40
LiabilitiesDue to banks 13,190,497 454,296 0.68 7,960,227 0.77Bonds and bills sold under repurchase agreements 164,692,531 5,672,207 0.68 157,572,913 0.56
F. Net position for major foreign currency transactions
MICB
December 31, 2012 December 31, 2011
Currency NT$ ( in thousands ) Currency NT$ ( in thousands )
Net position for major foreign currency transactions (Market Risk)
USD $ 10,930,735 USD $ 6,383,473
THB 5,066,596 THB 4,908,283
EUR 2,200,278 EUR 2,196,307
AUD 2,067,412 AUD 1,729,009
CAD 1,072,579 CAD 1,007,684Note 1: Major foreign currencies are the top 5 currencies in amount after denominated to one currency.Note 2: The net position for major foreign currencies is the absolute value of the net position of various currencies. The exchange rate of USD to TWD as
of December 31, 2012 and 2011 adopted by the Company were 1:29.035 and 1:30.272, respectively; the net position of USD were $10,930,735 thousand (US$376,468 thousand ) and NT$6,383,473 thousand, respectively.
G. Extraordinary Items :
MICBDecember 31, 2012
Cases and amounts
Directors or employees prosecuted due to violation of laws and regulations in relation to the operations in the latest year. None.
Fine due to the non-compliance with laws and regulations in the latest year
A hard disk that should be destroyed and disposed by Keelung branch has been leaked into the second-hand market which exposed fault and weakness in establishment and execution of internal control system. As a result, NT$2 million fine was imposed by competent authorities on June 7, 2012.
Shortcoming and negligence rectified by the Ministry of Finance in the latest year None.
Punishment based on Article 61-1 of the Banking Act of the Republic of China None.
Incurred losses over NT$50 million individually or in aggregate due to employee fraud or major incidental violations of rules provided in the “Notices to Financial Institutions about Safeguarding” in the latest year.
None.
Others None.Note : The latest year refers to the previous year of the disclosure period.
(16) In accordance with Article 17 of the Trust Enterprise Law, the disclosures of the trust balance sheet, trust income statement and schedule of investment for trust business are as follows: (Please refer to P.185~187 of the Consolidated Financial Statements )

Financial Information
1932012 ANNUAL REPORT
11. Additional DisclosuresThe transactions between and among subsidiaries has been eliminated during the consolidation. The disclosed information below is for reference purposes. (Please refer to P.188~211 of the Consolidated Financial Statements).
12. Disclosure of financial information by segments(1) General Information
The Group’s operation segment reports are consistent with the internal reports provided to chief operating decision-maker (“CODM”). The CODM allocates resources to operating segments and evaluates their performance. The Group’s CODM refers to the Board of Directors.
Inter-segmental transactions are arm’s-length transactions, and gain and loss arising from such transactions are eliminated by the parent company upon the presentation of consolidated financial statements. Profit and loss directly attributable to various segments have been considered when segment performance is being evaluated.
The operating segments of the Group comprise banking, securities, bills finance, insurance and other businesses. The operating results are reviewed by the Group’s Board of Directors (CODM) regularly and are referenced when allocating resources and evaluating operating performance.
The Group is based in the global market, comprising four major business segments; there were no changes in the reporting segments for the period.
The operating results have different income items due to different nature of the operating segments, and the Group’s Board of Directors evaluates segment performance based on the net profit before tax of various segments. Therefore, performance of all reporting segments is presented by the net amount of operating net profit less various operating expenses. Income from external clients provided for the Board of Directors to review is measured on the same basis with the statement of income.
Adjustments of internal pricing and transfer pricing are reflected in segment performance evaluation. Income from external clients has been allocated based on the regulated allocation standard between segments.
The internal management’s operating reports are prepared based on net operating profit, including net interest income, net service fee income, recovered bad debts (provision), loan loss impairment, net gain (loss) on financial instruments and other operating gain (loss). Measurement basis does not include non-recurring items, e.g. litigation expenses:
(2) Financial Information by Industry(Unit: In thousands of NT Dollars)
For the year ended December 31, 2012
Items Bank
Department Securities
DepartmentBills
DepartmentInsurance
DepartmentOther
DepartmentAdjustmentand write-off Total
Revenues from non-affiliated parties $ 56,862,318 $ 2,471,245 $ 5,489,600 $ 1,153,573 $ 24,130,289 ($ 23,842,877 $ 66,264,148
General expense ( 20,953,145 ) ( 2,194,001 ) ( 923,329 ) ( 887,614 ) ( 773,382 ) 306,809 ( 25,424,662 )
Interest expense ( 13,240,061 ) ( 146,717 ) ( 1,217,712 ) - ( 448,135 ) 48,816 ( 15,003,809 )
Income before income taxes $ 22,669,112 $ 130,527 $ 3,348,559 $ 265,959 $ 22,908,772 ($ 23,487,252 ) $ 25,835,677
Asset attributable to specific departments $2,439,725,515 $ 36,192,004 $217,417,574 $ 14,905,764 $ 20,972,525 ($ 5,932,583 ) $2,723,280,799
Equity investments accounted for by theequity method 2,604,845 73,223 - 24,651 235,347,057 ( 235,381,880 ) 2,667,896
Total assets $2,442,330,360 $ 36,265,227 $217,417,574 $ 14,930,415 $256,319,582 ($241,314,463 ) $2,725,948,695
(Unit: In thousands of US Dollars)
For the year ended December 31, 2012
Items Bank
Department Securities
DepartmentBills
DepartmentInsurance
DepartmentOther
DepartmentAdjustmentand write-off Total
Revenues from non-affiliated parties $ 1,958,406 $ 85,113 $ 189,068 $ 39,730 $ 831,076 ($ 821,177 ) $ 2,282,216
General expense ( 721,651 ) ( 75,564 ) ( 31,801 ) ( 30,570 ) ( 26,636 ) 10,567 ( 875,656 )
Interest expense ( 456,003 ) ( 5,053 ) ( 41,939 ) - ( 15,435 ) 1,681 ( 516,749 )
Income before income taxes $ 780,752 $ 4,496 $ 115,328 $ 9,160 $ 789,005 ($ 808,929 ) $ 889,811
Asset attributable to specific departments $ 84,027,054 $ 1,246,496 $ 7,488,120 $ 513,372 $ 722,319 ($ 204,325 ) $ 93,793,036
Equity investments accounted for by theequity method 89,714 2,522 - 849 8,105,633 ( 8,106,832 ) 91,886
Total assets $ 84,116,768 $ 1,249,018 $ 7,488,120 $ 514,221 $ 8,827,952 ($ 8,311,157 ) $ 93,884,922

194
Financial Information
Financial Information
OUR VISION—being your best financial service partner
(Unit: In thousands of NT Dollars)
For the year ended December 31, 2011
Items Bank
Department Securities
DepartmentBills
DepartmentInsurance
DepartmentOther
DepartmentAdjustmentand write-off Total
Revenues from non-affiliated parties $ 49,376,617 $ 2,405,477 $ 4,944,419 $ 1,088,577 $ 19,499,825 ($ 18,368,551 ) $ 58,946,364
General expense ( 20,132,726 ) ( 2,367,688 ) ( 869,371 ) ( 805,614 ) ( 777,939 ) 317,692 ( 24,635,646 )
Interest expense ( 11,660,080 ) ( 182,101 ) ( 936,945 ) - ( 441,735 ) 25,647 ( 13,195,214 )
Income before income taxes $ 17,583,811 ($ 144,312 ) $ 3,138,103 $ 282,963 $ 18,280,151 ($ 18,025,212 ) $ 21,115,504
Asset attributable to specific departments $2,322,568,142 $ 35,715,113 $225,482,611 $ 14,790,566 $ 24,087,965 ($ 6,790,856 ) $2,615,853,541
Equity investments accounted for by theequity method 2,548,824 84,241 - 28,179 217,578,824 ( 217,691,674 ) 2,548,394
Total assets $2,325,116,966 $ 35,799,354 $225,482,611 $ 14,818,745 $241,666,789 ($224,482,530 ) $2,618,401,935
(3) Financial information by geographic areaUnit: In thousands of NT dollars
For the year ended December 31, 2012
Domestic( including OBU ) North America
Other Overseas Operating
Departments
Adjustment and
elimination TotalRevenue from customers outside the Company
and its subsidiaries $ 56,524,113 $ 2,668,509 $ 7,053,526 $ - $ 66,246,148
Revenue from customers within the Company and its subsidiaries 23,093,448 90,409 659,020 ( 23,842,877 ) -
Total revenue $ 79,617,561 $ 2,758,918 $ 7,712,546 ($ 23,842,877 ) $ 66,246,148
Profit or loss $ 21,642,795 $ 1,261,430 $ 2,931,452 $ - $ 25,835,677
Asset attributable to specific departments $ 2,149,211,969 $ 315,197,262 $ 261,539,464 $ - $ 2,725,948,695
Unit: In thousands of US dollars
For the year ended December 31, 2012
Domestic( including OBU ) North America
Other Overseas Operating
Departments
Adjustment and
elimination TotalRevenue from customers outside the Company
and its subsidiaries $ 1,946,758 $ 91,907 $ 242,932 $ - $ 2,281,596
Revenue from customers within the Company and its subsidiaries 795,366 3,114 22,697 ( 821,177 ) -
Total revenue $ 2,742,124 $ 95,020 $ 265,629 ( $ 821,177 ) $ 2,281,596
Profit or loss $ 745,404 $ 43,445 $ 100,963 $ - $ 889,812
Asset attributable to specific departments $ 74,021,421 $ 10,855,769 $ 9,007,731 $ - $ 93,884,921
Unit: In thousands of NT dollars
For the year ended December 31, 2011
Domestic( including OBU ) North America
Other Overseas Operating
Departments
Adjustment and
elimination TotalRevenue from customers outside the Company
and its subsidiaries $ 50,322,534 $ 2,183,417 $ 6,440,413 $ - $ 58,946,364
Revenue from customers within the Company and its subsidiaries 39,001,690 173,595 814,001 ( 39,989,286 ) -
Total revenue $ 89,324,224 $ 2,357,012 $ 7,254,414 ($ 39,989,286 ) $ 58,946,364
Profit or loss $ 16,833,904 $ 2,046,767 $ 2,234,833 $ - $ 21,115,504
Asset attributable to specific departments $ 2,023,588,961 $ 314,703,919 $ 280,109,055 $ - $ 2,618,401,935

Financial Information
1952012 ANNUAL REPORT
(4) Export sales by geographic area :The Company and its subsidiaries have no export sales.
(5) Information on major customers: The Company and its subsidiaries have no customers accounting for more than 10% of the Group’s operating revenues for the years ended December 31, 2012 and 2011.
(6) MS and MF engaged in futures business and shall meet the requirements of relevant futures transactions regulations. Financial ratio and enforcement of MS and MF are as follows: (Please refer to P.217~218 of the Consolidated Financial Statements)
(7) The Prospective Risk For Futures Trading
Brokerage department of MF, which is under the consignment of futures’ traders, conducts brokerage services pursuant to the laws and regulations. Uncovered positions are daily adjusted by mark-to-market price of Taiwan Futures Exchange. If margin call is lower than certain level, additional margin calls are requested to maintain limits of guarantee deposits. The Company controls credit risk by constantly monitoring the balance of performance bonds based on market price of positions held by each client, regulations of Taiwan Stock Exchange and the Company to minimize the risk.
Futures’ trading and futures option trading are with high financial leverage risk. When MS and MF purchase options, the maximum loss arising from fluctuation on futures index is limited to the paid premium; hence, market price risk is insignificant. When MS and MF sell options, market price risk is the fluctuation of TAIEX Index Option contracts. Futures department of MS and MF have established relevant risk control mechanism and set up stop-loss limits, in order to monitor changes on positions held and their prices. When there is significant fluctuation on futures price, MS and MF will conversely purchase options or TAIEX Index Futures to manage the market price risk, and loss incurred would be controlled.
13. RELEVANT INFORMATION ON ADOPTION OF IFRSs( Please refer to P.220~236 of the Consolidated Financial Statments )

Review of Financial Conditions, Operating Results, and Risk Management
196
Review
of Financial Conditions, O
perating Results, and R
isk Managem
ent
OUR VISION—being your best financial service partner
Review of Financial Conditions,
Operating Results,
and Risk Management

Review
of Financial Conditions, O
perating Results, and R
isk Managem
ent
1972012 ANNUAL REPORT
7.1 Analysis of Financial StatusUnconsolidated
Unit: NT$1,000
Year Item 2012 2011
Difference
Amount %Cash and Cash Equivalents 77,293 4,276,849 ( 4,199,556 ) ( 98.19 )Available-for-Sale Financial Assets 5,143,167 5,279,193 ( 136,026 ) ( 2.58 )Receivables 857,471 715,141 142,330 19.90Equity Investments Accounted for by the Equity Method 235,347,057 218,167,682 17,179,375 7.87Property and Equipment 783,919 784,065 ( 146 ) ( 0.02 )Other Financial Assets 758,193 762,046 ( 3,853 ) ( 0.51 )Other Assets 14,611 19,173 ( 4,562 ) ( 23.79 )Total Assets 242,981,711 230,004,149 12,977,562 5.64Financial Liabilities at Fair Value through Profit or Loss 1,200 0 1,200 -Payables 13,094,955 10,778,190 2,316,765 21.49Bonds Payable 16,049,668 16,301,059 ( 251,391 ) ( 1.54 )Other Liabilities 50,985 43,514 7,471 17.17Total Liabilities 29,196,808 27,122,763 2,074,045 7.65Capital Stock 114,498,240 112,806,148 1,692,092 1.50Capital Surplus 43,425,270 43,426,403 ( 1,133 ) 0Retained Earnings 52,212,649 41,960,123 10,252,526 24.43Equity Adjustments 3,648,744 4,688,712 ( 1,039,968 ) ( 22.18 )Total Stockholders’ Equity 213,784,903 202,881,386 10,903,517 5.37
Analysis of changes in financial ratios:1. Cash and cash equivalents decreased mainly due to capital injection for the bank subsidiary. 2. Other assets reduced mainly as a result of decline in computer software and temporary payments.3. The increase in payables was primarily due to increase in commercial papers payables, dividends payable,
taxes payable and account payable to subsidiaries. 4. Retained earning rose as the subsidiaries’ profits grew in 2012.5. Equity adjustments declined primarily owing to increase of net loss on unrecognized pension cost, reduction
in cumulative translation adjustments, offset by the increase of the unrealized revaluation increment.
7.2 Analysis of Operational Results
Unconsolidated
Unit: NT$1,000
Year Item 2012 2011
Difference
Amount %
Investment Income from Equity Investments Accounted for by the Equity Method 22,661,062 18,111,631 4,549,431 25.12
Other Income 60,374 290,135 ( 229,761 ) ( 79.19 )Operating Expenses ( 349,077 ) ( 352,549 ) 3,472 ( 0.98 )Other Expenses and Losses ( 363,292 ) ( 364,912 ) 1,620 ( 0.44 )Income Before Income Tax from Continuing Operations 22,009,067 17,684,305 4,324,762 24.46Income After Income Tax from Continuing Operations 21,533,141 17,679,892 3,853,249 21.79Net Income 21,533,141 17,679,892 3,853,249 21.79
Review of Financial Conditions, Operating Results, and Risk Management

Review of Financial Conditions, Operating Results, and Risk Management
198
Review
of Financial Conditions, O
perating Results, and R
isk Managem
ent
OUR VISION—being your best financial service partner
Analysis of changes in financial ratios:1. Investment Income from equity investments accounted for by the equity method increased due to increase of
subsidiaries’ profits.2. Decrease in other income was mainly due to reduction in gain from financial liabilities at fair value through
profit or loss.
7.3 Analysis of Cash Flow 7.3.1 Cash Flow Analysis for 2012
Unconsolidated
YearItem 2012 2011 Variance (%)
Cash Flow Ratio (%) 478.13% 1,007.27% ( 52.53% )
Cash Flow Adequacy Ratio (%) 112.29% 100.60% 11.62%
Cash Reinvestment Ratio (%) 231.38% 100.65% 129.89%
Analysis of financial ratio change:1. Decrease in the cash flow ratio was primarily due to increase in payables.2. Cash reinvestment ratio’s growth is mainly attributed to payment of cash dividends and increase in net cash
inflow from operating activities.
7.3.2 Cash Flow Analysis for 2013 Unit: NT$1,000
Cash andCash Equivalents(12 / 31 / 2012)
(1)
Estimated Net Cash Flow
from Operating Activities
(2)
Estimated Cash Outflow
(3)
Cash Surplus (12 / 31 / 2013)
(1)+(2)-(3)
Leverage of Cash Surplus (Deficit)
Investment Plans Financing Plans
174,400 6,207,647 6,243,141 138,906 None None
Analysis of cash flow:1. Operating Activities: mainly net cash inflow from investment income2. Investing Activities: mainly procurement of property and equipment and intangible assets 3. Financing Activities: primarily for payout of cash dividends
7.4 Investment Policies in 2012・Expanding the Group’s operations network through merger and acquisition and enlarging the economic scale
- Banking sector: We target at state-owned and private banks specializing in consumer banking which is complementary to our business.
- Securities sector: We aim at increasing our market share of securities brokerage over 5% and entering Top 5 securities brokers in Taiwan.
- Life insurance sector: We aim at existing life insurance companies to expand the Group’s business scope.・Continually studying domestic and global financial environment, development of merger and acquisition,
and directions for the Group’s future development. The study findings are used as reference for investment policies.
・ Keeping an eye on the easing of restriction on access to China’s financial market, and evaluating the feasibility as well as opportunity of entering China’s financial market.
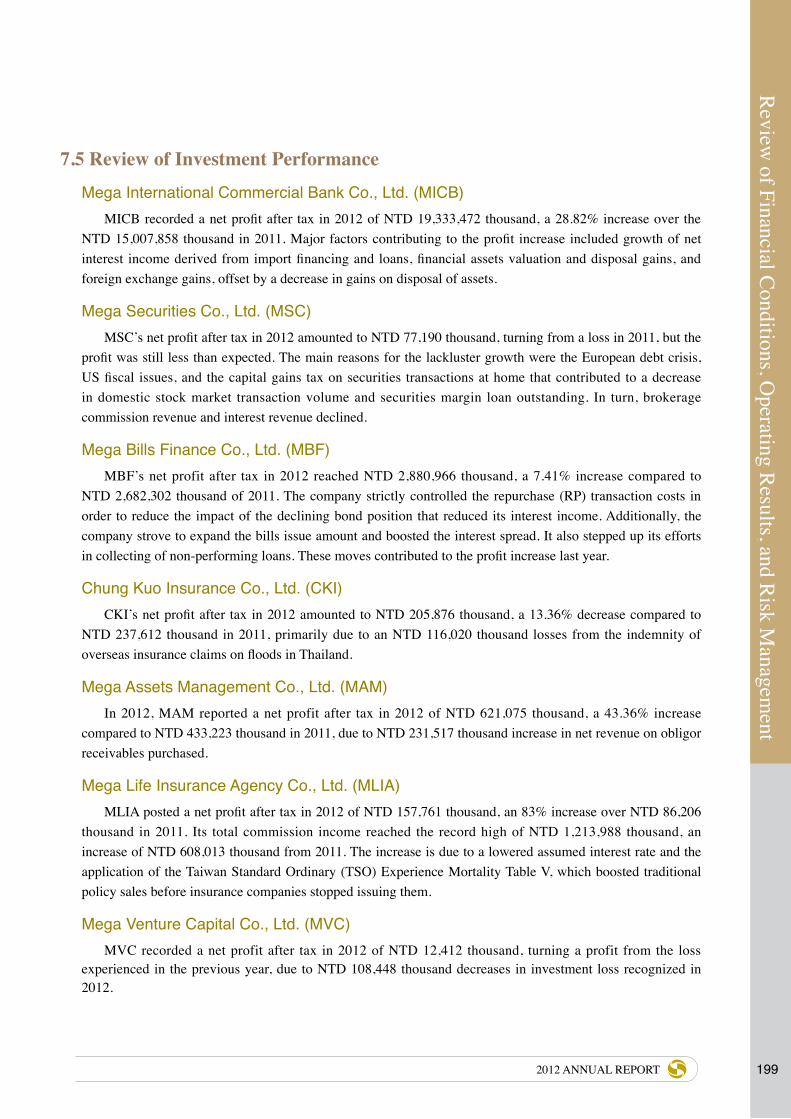
Review
of Financial Conditions, O
perating Results, and R
isk Managem
ent
1992012 ANNUAL REPORT
7.5 Review of Investment PerformanceMega International Commercial Bank Co., Ltd. (MICB)
MICB recorded a net profit after tax in 2012 of NTD 19,333,472 thousand, a 28.82% increase over the NTD 15,007,858 thousand in 2011. Major factors contributing to the profit increase included growth of net interest income derived from import financing and loans, financial assets valuation and disposal gains, and foreign exchange gains, offset by a decrease in gains on disposal of assets.
Mega Securities Co., Ltd. (MSC)MSC’s net profit after tax in 2012 amounted to NTD 77,190 thousand, turning from a loss in 2011, but the
profit was still less than expected. The main reasons for the lackluster growth were the European debt crisis, US fiscal issues, and the capital gains tax on securities transactions at home that contributed to a decrease in domestic stock market transaction volume and securities margin loan outstanding. In turn, brokerage commission revenue and interest revenue declined.
Mega Bills Finance Co., Ltd. (MBF)MBF’s net profit after tax in 2012 reached NTD 2,880,966 thousand, a 7.41% increase compared to
NTD 2,682,302 thousand of 2011. The company strictly controlled the repurchase (RP) transaction costs in order to reduce the impact of the declining bond position that reduced its interest income. Additionally, the company strove to expand the bills issue amount and boosted the interest spread. It also stepped up its efforts in collecting of non-performing loans. These moves contributed to the profit increase last year.
Chung Kuo Insurance Co., Ltd. (CKI)CKI’s net profit after tax in 2012 amounted to NTD 205,876 thousand, a 13.36% decrease compared to
NTD 237,612 thousand in 2011, primarily due to an NTD 116,020 thousand losses from the indemnity of overseas insurance claims on floods in Thailand.
Mega Assets Management Co., Ltd. (MAM)In 2012, MAM reported a net profit after tax in 2012 of NTD 621,075 thousand, a 43.36% increase
compared to NTD 433,223 thousand in 2011, due to NTD 231,517 thousand increase in net revenue on obligor receivables purchased.
Mega Life Insurance Agency Co., Ltd. (MLIA)MLIA posted a net profit after tax in 2012 of NTD 157,761 thousand, an 83% increase over NTD 86,206
thousand in 2011. Its total commission income reached the record high of NTD 1,213,988 thousand, an increase of NTD 608,013 thousand from 2011. The increase is due to a lowered assumed interest rate and the application of the Taiwan Standard Ordinary (TSO) Experience Mortality Table V, which boosted traditional policy sales before insurance companies stopped issuing them.
Mega Venture Capital Co., Ltd. (MVC)MVC recorded a net profit after tax in 2012 of NTD 12,412 thousand, turning a profit from the loss
experienced in the previous year, due to NTD 108,448 thousand decreases in investment loss recognized in 2012.

Review of Financial Conditions, Operating Results, and Risk Management
200
Review
of Financial Conditions, O
perating Results, and R
isk Managem
ent
OUR VISION—being your best financial service partner
Mega International Investment Trust Co., Ltd. (MIIT)MIIT posted a net profit after tax in 2012 of NTD 97,181 thousand, a 19.49% decreases from the NTD
120,706 thousand in 2011. The decrease was mainly resulting from the reduction in fund management fee revenue of NTD 18,934 thousand and indemnity provisions for NTD 8,000 thousand on private fund dispute.
Taipei Financial Center Corporation (TFCC)TFCC posted a net profit in 2012 for NTD 724,812 thousand, a decrease of NTD 985,668 thousand, or
57.63% compared to 2011 mainly due to the recognition of a tax benefit from loss carry back for NTD 1,397,162 thousand in 2011. Excluding income tax factors, department sales increased by NTD 1,298,865 thousand and, as a result, gross profit increased by NTD 325,355 thousand and net profit before tax increased by NTD 411,494 thousand. In 2012, the shopping center’s budgeted revenue realization ratio was 98.66%. In 2012, the lease ratio, the rent collection ratio, and average monthly rent of the office building all increased from 2011 levels. Currently, various government directed entities own 44.35% of the shares outstanding, while the Ting Hsin International Group owns 37.18%, making it the largest non-government shareholder.
Taiwan Depository & Clearing Corporation (TDC)TDC recorded a net profit after tax in 2012 of NTD 1,206,469, a decrease of NTD 368,318 thousand, or
23.39%, compared to 2011. As the European debt crises in the first half of 2012 and the securities transaction capital gains tax issue trimmed domestic stock market transaction volumes drastically, TDC’s securities service revenue decreased by NTD 475,771 thousand from 2011 levels.
Taiwan Business Bank (TBB)TBB posted a net profit after tax in 2012 of NTD 3,403,839 thousand, an increase of NTD 425,941
thousand, or 14.3%, compared to 2011. The profits growth was primarily due to the increase in net interest income of NTD 135,253 thousand along with the decrease in bad debt expense of NTD 402,704 thousand. However, the bank's NPL ratio rose from 0.65% at the end of 2011 to 0.92% at the end of 2012, while coverage ratio has declined from 137.99% at the end of 2011 to 93.53% at the end of 2012.
7.6 Investment Plans for 2013・Continuing to evaluate and explore opportunities for merging with financial institutions that are
complementary to our operations and can enhance synergy within the Group.
・Developing cross-strait financial businesses with characteristics, encouraged by the government.
・Evaluating the feasibility of entering China’s financial market.
7.7 Analysis of Risk Management7.7.1 Risk Management Structure
As the highest authority and the policy-making body for the Group’s risk management, the Board of Directors of the Company takes ultimate responsibility for the Group’s risk management system and its effective operation. The Risk Management Committee, which reports to the Board and meets once every two months, takes charge of formulating the Group’s risk management policy, and supervising the operation of the risk management mechanisms of its subsidiaries. The Risk Management Department is responsible for collecting, measuring, analyzing, monitoring, controlling, and reporting all risk information within the Group. Finally, the Auditing Office of the Board takes charge of evaluating the effectiveness of internal control systems and the efficiency of the Group’s operations.

Review
of Financial Conditions, O
perating Results, and R
isk Managem
ent
2012012 ANNUAL REPORT
The Company’s bank, bills finance, securities, insurance and asset management subsidiaries have set up Risk Management Committees responsible for overseeing risk management objectives and execution. All subsidiaries have had risk management departments in place to perform their risk management tasks. In addition, the internal audit departments verify the effectiveness of the risk management mechanism on a periodic basis.
7.7.2 Risk Management PolicyThe purposes of our risk management policy are to build mechanisms for identifying, evaluating, responding
to, supervising, and controlling risks arising from various businesses and to carry out consistent approaches to evaluate and manage all risks to ensure that the management team of the Company is well-informed regarding the Group’s overall risk profile. Additionally, the policy aims to ensure the capital adequacy of our subsidiaries to pursue rationalized risk and reward.
7.7.3 Risk Management TasksThe Company has set out mid- and long-term risk management goals for the Group, and has established a
risk management strategy in line with Basel II as required by the competent authority. The major tasks of risk management are to set and monitor the annual risk management targets and early warning indicators for the Group; to enhance horizontal interaction among subsidiaries for the risk management practices; to encourage the implementation of advanced risk management tools and approaches; to supervise the subsidiaries building their risk management systems; to establish and amend the policy, regulations and limits of risk management for the Group; to review risk management rules and regulations; and to monitor capital adequacy, total business exposure and risk concentrations of the subsidiaries. The Company’s risk management tasks are described as follows.
1. Credit risk: supervising all subsidiaries developing credit risk management systems and enhancing intra-group reporting and management system for the substantial credit risk events. Mega International Commercial Bank (MICB) is currently developing and maintaining the Internal Rating Model for Corporate Banking, the Mortgage Credit Score System, the Behavior Score System, and the Enforced Model Control Mechanism and has also completed the Client Credit Risk Clustering Enquiry System and Credit Risk Meta Reporting System. Main tasks performed by other subsidiaries are managing risk concentration and limits, setting early warning criteria, building monitoring mechanisms, strengthening computerized risk report processes, screening credit risks with models, and establishing counterparty management mechanism.
2. Market risk: carrying out research and development for the advanced market risk management tools, and improving data collection, analyses, and report of all risk positions within the Group. In addition to the Summit, a financial transaction information system currently being developed by MICB, the Company’s subsidiaries also manage market risks primarily by strengthening market risk management standards, analyzing and assessing domestic and global economic situations, monitoring risk limits of various financial products, and creating and submitting reports on control and management on a daily basis.
3. Operational risk: continue supervising the subsidiaries developing operational risk management mechanisms. MICB has completed a loss event reporting system to manage operational risks. Through the real-time reporting system, the Bank is able to develop measures for improvement, and build up self-evaluation mechanism to identify and analyze the operational risk exposure and also to improve the control and management mechanism. Besides, a key risk indicators (KRI) system is newly established to monitor the potential operational risks. The Company has also required other subsidiaries to conduct self-evaluation and to record loss events so that the operational risk management of the Group may be systematic and consistent.
4. Liquidity risk: monitoring liquidity risk position according to the risk management goals and risk limits; carrying out stress testing on a periodic basis; producing cash flow gap reports for reviews by the top management; and setting up mechanism for capital contingency management.

Review of Financial Conditions, Operating Results, and Risk Management
202
Review
of Financial Conditions, O
perating Results, and R
isk Managem
ent
OUR VISION—being your best financial service partner
5. Other risk management tasks:・Building an inter-subsidiary risk management information system, such as the credit rating enquiry system
that provides the internal credit rating results for related subsidiaries. Other information platforms of the Group are Default Securities Settlement and Financial Highlights and the Listed Company Watch List System.
・Continue collecting and analyzing risk management information, such as improving credit risk management report and its automation; collecting and reporting loss information of operational risk of all subsidiaries on a monthly basis; and producing consolidated asset evaluation and capital adequacy reports of the Group on a quarterly basis.
・Following up and reporting of the Group’s risk management cases and major risk events.・Enhancing communication and cooperation among the Company and its subsidiaries in operational risk
management.・Developing a response plan to ensure Basel II compliance in capital requirements to reduce future
operation impact.
7.7.4 Quantification of Risk Exposure
Mega International Commercial Bank
(1) Credit riskThe Capital Charge for Credit Risk under Standard Approach
December 31, 2012; Unit: NT$ thousand
Exposure type Exposures after credit mitigation Capital charge
Sovereigns 438,862,628 1,807
Non-central government public sector entities 7,157 114
Banks (including multilateral development banks) 274,144,046 9,096,662
Enterprises (including securities firms and insurance companies) 1,407,192,909 94,645,733
Regulatory retail portfolios 191,693,408 12,658,077
Residential property 172,009,503 7,351,984
Equity investment 21,662,596 6,480,636
Other assets 30,438,567 1,295,804
Total 2,536,010,814 131,530,817
(2) Market risk The Capital Charge for Market Risk
December 31, 2012; Unit: NT$ thousand
Risk type Capital charge
Interest rate risk 2,305,290
Equity risk 427,474
Foreign exchange risk 328,747
Product risk 0
Total 3,061,511

Review
of Financial Conditions, O
perating Results, and R
isk Managem
ent
2032012 ANNUAL REPORT
(3) Operational riskThe Capital Charge for Operational Risk
December 31, 2012; Unit: NT$ thousand
Year Gross profits Capital charge
2012 42,277,743
2011 35,134,576
2010 32,166,882
Total 109,579,201 5,478,960
(4) Securitization riskThe Capital Charge for Securitization Framework
December 31, 2012; Unit: NT$ thousand
Riskexposurecategory
Bank Book type Category
Asset category
Traditional Synthetic Total
Exposure
Capitalcharge
(2)
Exposure
Capital charge
(4)
Exposure
(5)=(1)+(3)
Capital charge
(6)=(2)+(4)
Capital charge before
securitizationRetained orpurchased
For liquidityfacility
For creditenhancement
Sub-total(1)
Retained orpurchased (3)
Non-originatingbank
Banking book
Trading bookMortgageloan 160,180 160,180 160,180 160,180 160,180
Credit right - - - - -
Sub-total 160,180 160,180 160,180 160,180 160,180
Originating bank
Banking book
Trading bookCredit right 3,927,332 3,927,332 314,187 3,927,332 314,187 35,394
Sub-total 3,927,332 3,927,332 314,187 3,927,332 314,187 35,394
Total 4,087,512 4,087,512 474,366 4,087,512 474,366 35,394
(5) Liquidity riskA. An Analysis of the Maturity Structure-NT Dollar
December 31, 2012; Unit: NT$ thousand
Item TotalAmount Outstanding by Remaining Time to Maturity
0~10 days 11~30 days 31~90 days 91~80 days 181days~1 year Over 1 Year
Major Inflows of Matured Funds 1,558,895,439 380,395,648 ( 109,321,797 ) 79,157,874 88,214,740 167,761,672 734,043,708
Major Outflows of Matured Funds 1,647,207,857 119,997,218 219,177,172 201,756,159 145,686,565 190,031,192 770,559,551
Period Gap ( 88,312,418 ) 260,398,430 ( 109,855,375 ) ( 122,598,285 ) ( 57,471,825 ) ( 22,269,520 ) ( 36,515,843 )
Note: The above table does not include currency other than NTD.

Review of Financial Conditions, Operating Results, and Risk Management
204
Review
of Financial Conditions, O
perating Results, and R
isk Managem
ent
OUR VISION—being your best financial service partner
B. An Analysis of the Maturity Structure-US Dollar December 31, 2012; Unit: US$ thousand
Item TotalAmount Outstanding by Remaining Time to Maturity
0~10 days 11~30 days 31~90 days 91 ~180 days 181days~1 yearMajor Inflows of Matured
Funds $ 42,626,855 $ 17,424,705 $ 5,980,970 $ 3,982,211 $ 4,010,726 $ 11,228,243
Major Outflows of Matured Funds 46,890,216 27,428,648 4,293,823 3,506,433 2,038,759 9,622,553
Period Gap ( 4,263,361 ) ( 10,003,943 ) 1,687,147 475,778 1,971,967 1,605,690
Note: The above table reports the U.S. dollars position held by the head office of the bank and its domestic braches including offshore banking unit.
Mega Bills Finance Co., Ltd.
(1) Credit riskThe Capital Charge for Credit Risk under Standard Approach
December 31, 2012; Unit: NT$ thousand
Exposure type Capital charge Risk assets
Sovereigns 0 0
Non-central government public sector entities 25,233 315,409
Banks (including multilateral development banks) 144,221 1,802,757
Corporations (including securities firms and insurance companies) 10,784,302 134,803,780
Regulatory retail portfolios 60,326 754,076
Equity investment 64,704 808,800
Credits extended to Mega FHC or its subsidiaries 0 0
Other assets 242,745 3,034,311
Total 11,321,531 141,519,133
(2) Market riskThe Capital Charge for Market Risk under Standard Approach
December 31, 2012; Unit: NT$ thousand
Exposure type Capital charge Risk assets (Note)
Interest rate risk 4,430,059 55,375,740
Equity risk 550,456 6,880,700
Foreign exchange risk 727 9,085
Product risk 0 0
Option adopted sensitive analysis method 0 0
Total 4,981,242 62,265,525
Note: Capital charge times 12.5

Review
of Financial Conditions, O
perating Results, and R
isk Managem
ent
2052012 ANNUAL REPORT
(3) Operational riskThe Capital Charge for Operational Risk under Basic Approach
December 31, 2012; Unit: NT$ thousand
Year Gross Profits Capital charge Risk assets
2011 3,581,235 - -
2010 4,317,737 - -
2009 5,170,429 - -
Total 13,069,401 653,470 8,168,375
(4) Securitization riskThe Capital Charge for Securitization Framework
March 31, 2013; Unit: NT$ thousand
Risk
exposure category
Bank category Book type
Asset category
Traditional Synthetic Total
Exposure
Capitalcharge
(2)
Exposure
Capitalcharge
(4)Exposure
(5)=(1)+(3)
Capitalcharge
(6)=(2)+(4)
Capitalchargebefore
securitization
Retained or purchased
(1)
Retained or purchased
(3)
Non-originating bank
Banking book
Trading bookCredit right 415,866 28,071 415,866 28,071
Sub-total 415,866 28,071 415,866 28,071
Originating bank
Banking book
Trading book
Sub-total
Total 415,866 28,071 415,866 28,071
(5) Liquidity risk December 31, 2012; Unit: NT$ thousand
TotalAmount Outstanding by Remaining Time to Maturity
0~30 days 31~90 days 91~180 days 181 days~1 year Over 1 year
Major inflows of matured funds 209,544 59,806 58,323 17,538 8,180 65,697
Major outflows of matured funds 213,057 159,792 18,175 2,236 35 32,819
Period gap ( 3,513) ( 99,986) 40,148 15,302 8,145 32,878
Cumulative gap ( 99,986) ( 59,838) ( 44,536) ( 36,391) ( 3,513)

Review of Financial Conditions, Operating Results, and Risk Management
206
Review
of Financial Conditions, O
perating Results, and R
isk Managem
ent
OUR VISION—being your best financial service partner
Mega Securities Co., Ltd.
(1) Counterparty risk December 31, 2012; Unit: NT$ thousand
Country Exposure Deposits Securities Derivatives Long term investment Total As a percentage of
shareholder’s equity
Taiwan 468,750 16,235,957 65,028 932,845 17,702,580 128.65%
Virgin Islands 0 0 0 2,025,369 2,025,369 14.72%
Cayman Islands 0 236,709 0 0 236,709 1.72%
Hong Kong 0 133,251 0 0 133,251 0.97%
USA 6,309 25,877 0 0 32,186 0.23%
South Africa 0 0 1,073 0 1,073 0.01%
Super-national 0 188,991 0 0 188,991 1.37%
Total 475,059 16,820,785 66,101 2,958,214 20,320,160 147.67%
(2) Liquidity riskDecember 31, 2012; Unit: NT$ million
TotalAmount Outstanding by Remaining Time to Maturity
0~10 days 11~30 days 31~90 days 91~180 days 181days~1 year 0ver 1 year
Major inflows of matured funds 28,470 8,503 10,080 2,024 2,549 5,057 257
Major outflows of matured funds 20,256 8,167 5,373 4,161 823 1,619 113
Period gap 8,214 336 4,707 ( 2,137) 1,726 3,438 144
Cumulative gap 336 5,043 2,906 4,632 8,070 8,214
Chung Kuo Insurance Co., Ltd. December 31, 2012; Unit: NT$ thousand
Exposure Risk capital As a percentage of the risk capital before adjustment
1. Asset risk—related party risk 66,649,803 1.87%
2. Asset risk—non-related party risk 383,849,772 10.76%
Asset risk—non-equity risk 205,019,497 5.75%
Asset risk—non-related party equity risk 178,830,275 5.01%
3. Credit risk 186,863,133 5.24%
4. Insurance underwriting risk—reserve risk 1,301,962,510 36.51%
5. Insurance underwriting risk—premium risk 1,544,350,526 43.31%
6. Asset liability allocation risk 14,983,292 0.42%
7. Other risk 67,433,093 1.89%
Total amount of risk capital before adjustment 3,566,092,129 100.00%
Total amount of risk capital 1,047,531,060
Total amount of equity capital 5,204,402,293
Capital adequacy ratio 496.83%

Special D
isclosure
2072012 ANNUAL REPORT
Special Disclosure
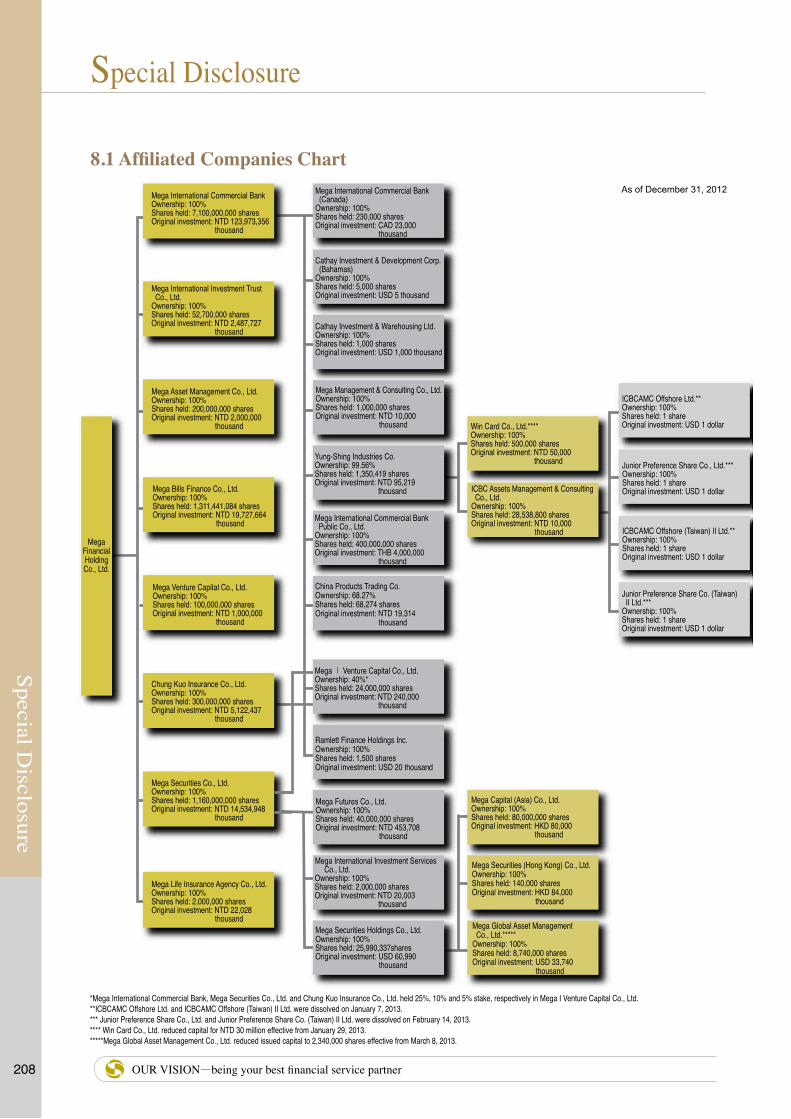
208
Special Disclosure
OUR VISION—being your best financial service partner
8.1 Affiliated Companies Chart
Special Disclosure
Mega International Commercial BankOwnership: 100%Shares held: 7,100,000,000 sharesOriginal investment: NTD 123,973,356 thousand
Mega International Investment Trust Co., Ltd.Ownership: 100%Shares held: 52,700,000 sharesOriginal investment: NTD 2,487,727 thousand
Mega Asset Management Co., Ltd.Ownership: 100%Shares held: 200,000,000 sharesOriginal investment: NTD 2,000,000 thousand
Mega Bills Finance Co., Ltd.Ownership: 100%Shares held: 1,311,441,084 sharesOriginal investment: NTD 19,727,664 thousand
MegaFinancial HoldingCo., Ltd.
Mega Venture Capital Co., Ltd.Ownership: 100%Shares held: 100,000,000 sharesOriginal investment: NTD 1,000,000 thousand
ICBCAMC Offshore Ltd.**Ownership: 100%Shares held: 1 shareOriginal investment: USD 1 dollar
Junior Preference Share Co., Ltd.***Ownership: 100%Shares held: 1 shareOriginal investment: USD 1 dollar
ICBCAMC Offshore (Taiwan) II Ltd.**Ownership: 100%Shares held: 1 shareOriginal investment: USD 1 dollar
Junior Preference Share Co. (Taiwan) II Ltd.***Ownership: 100% Shares held: 1 shareOriginal investment: USD 1 dollar
Win Card Co., Ltd.****Ownership: 100%Shares held: 500,000 sharesOriginal investment: NTD 50,000 thousand
ICBC Assets Management & Consulting Co., Ltd.Ownership: 100%Shares held: 28,538,800 sharesOriginal investment: NTD 10,000 thousand
Mega International Commercial Bank (Canada)Ownership: 100%Shares held: 230,000 sharesOriginal investment: CAD 23,000 thousand
Cathay Investment & Development Corp. (Bahamas)Ownership: 100%Shares held: 5,000 sharesOriginal investment: USD 5 thousand
Cathay Investment & Warehousing Ltd.Ownership: 100%Shares held: 1,000 sharesOriginal investment: USD 1,000 thousand
Mega Management & Consulting Co., Ltd.Ownership: 100%Shares held: 1,000,000 sharesOriginal investment: NTD 10,000 thousand
Yung-Shing Industries Co.Ownership: 99.56%Shares held: 1,350,419 sharesOriginal investment: NTD 95,219 thousand
Mega International Commercial Bank Public Co., Ltd. Ownership: 100%Shares held: 400,000,000 sharesOriginal investment: THB 4,000,000 thousand
China Products Trading Co.Ownership: 68.27%Shares held: 68,274 sharesOriginal investment: NTD 19,314 thousand
Mega Ι Venture Capital Co., Ltd.Ownership: 40%*Shares held: 24,000,000 sharesOriginal investment: NTD 240,000 thousand
Ramlett Finance Holdings Inc.Ownership: 100%Shares held: 1,500 sharesOriginal investment: USD 20 thousand
Mega Futures Co., Ltd.Ownership: 100%Shares held: 40,000,000 sharesOriginal investment: NTD 453,708 thousand
Mega International Investment Services Co., Ltd.
Ownership: 100%Shares held: 2,000,000 sharesOriginal investment: NTD 20,003 thousand
Chung Kuo Insurance Co., Ltd.Ownership: 100%Shares held: 300,000,000 sharesOriginal investment: NTD 5,122,437 thousand
Mega Securities Co., Ltd.Ownership: 100%Shares held: 1,160,000,000 sharesOriginal investment: NTD 14,534,948 thousand
Mega Life Insurance Agency Co., Ltd.Ownership: 100%Shares held: 2,000,000 sharesOriginal investment: NTD 22,028 thousand
Mega Capital (Asia) Co., Ltd.Ownership: 100%Shares held: 80,000,000 sharesOriginal investment: HKD 80,000 thousand
Mega Securities (Hong Kong) Co., Ltd.Ownership: 100%Shares held: 140,000 sharesOriginal investment: HKD 84,000 thousand
Mega Global Asset Management Co., Ltd.*****Ownership: 100%Shares held: 8,740,000 sharesOriginal investment: USD 33,740 thousand
Mega Securities Holdings Co., Ltd.Ownership: 100%Shares held: 25,990,337sharesOriginal investment: USD 60,990 thousand
As of December 31, 2012
*Mega International Commercial Bank, Mega Securities Co., Ltd. and Chung Kuo Insurance Co., Ltd. held 25%, 10% and 5% stake, respectively in Mega I Venture Capital Co., Ltd.**ICBCAMC Offshore Ltd. and ICBCAMC Offshore (Taiwan) II Ltd. were dissolved on January 7, 2013.*** Junior Preference Share Co., Ltd. and Junior Preference Share Co. (Taiwan) II Ltd. were dissolved on February 14, 2013.**** Win Card Co., Ltd. reduced capital for NTD 30 million effective from January 29, 2013.*****Mega Global Asset Management Co., Ltd. reduced issued capital to 2,340,000 shares effective from March 8, 2013.

Special D
isclosure
2092012 ANNUAL REPORT
8.2 Summary of Affiliated CompaniesDecember 31, 2012
Expressed in thousands of dollarss
Company Date of Incorporation Address Paid-in Capital Main Business
Mega International Commercial Bank Co., Ltd. 12.17.1971 No. 100 Jilin Road, Taipei, Taiwan NTD 71,000,000
Commercial banking, consumer banking, wealth management, investment banking and financial consulting etc.
Mega Securities Co., Ltd. 10.19.1989 3F, No. 95, Sec. 2, Jhongsiao E. Road, Taipei, Taiwan NTD 11,600,000 Brokerage, dealing and underwriting
of securities
Mega Bills Finance Co., Ltd. 05.20.1976 2~5F, No. 91, Hengyang Road, Taipei, Taiwan NTD 13,114,411
Brokerage, dealing, underwriting, and guaranteeing of short-term debt instruments
Chung Kuo Insurance Co., Ltd. 11.01.1931 58 Sec. 1, Wuchang Street, Taipei, Taiwan NTD 3,000,000 Non-life insurance
Mega Asset Management Co., Ltd. 12.05.2003 6F, No. 91, Hengyang Road, Taipei, Taiwan NTD 2,000,000 NPL asset management
Mega Life Insurance Agency Co., Ltd 11.05.1996 5F, No. 100, Jilin Road, Taipei, Taiwan NTD 20,000 Life insurance agency
Mega Venture Capital Co., Ltd. 12.13.2005 7F, No. 91, Hengyang Road, Taipei, Taiwan NTD 1,000,000 Venture capital investment
Mega International Investment Trust Co., Ltd. 08.09.1983 7~8F, No. 91, Hengyang Road, Taipei,
Taiwan NTD 527,000 Asset management
Mega Management & Consulting Co., Ltd. 01.16.2002 7F, No. 91, Hengyang Road, Taipei,
Taiwan NTD 10,000Venture capital management consulting, investment consulting and business administration consulting
Mega I Venture Capital Co., Ltd. 11.05.2003 7F, No. 91, Hengyang Road, Taipei, Taiwan NTD 600,000 Venture capital investment
Mega Futures Co., Ltd. 07.29.1999 4F, No. 563, Sec. 4, Jhongsiao E. Road, Taipei, Taiwan NTD 400,000 Futures brokerage
Futures advisory services
Mega International Investment Services Co., Ltd. 11.20.1997 10F, No. 95, Sec. 2, Jhongsiao E.
Road, Taipei, Taiwan NTD 20,000 Securities investment advisory
Mega Securities Holdings Co., Ltd. 05.05.1997Suites 1109-1111, 11/F, Tower 6, The Gateway, 9 Canton Road, Tsimshatsui, Kowloon, Hong Kong
USD 25,990 Investment holding business
Mega Global Asset Management Co., Ltd. 07.16.1998
Suites 1111, 11/F, Tower 6, The Gateway, 9 Canton Road, Tsimshatsui, Kowloon, Hong Kong
USD 8,740 Securities proprietary trading
Mega Capital (Asia) Co., Ltd. 05.23.1997Suites 1109, 11/F, Tower 6, The Gateway, 9 Canton Road, Tsimshatsui, Kowloon, Hong Kong
HKD 80,000 Financial advisory services
Mega Securities (Hong Kong) Co., Ltd. 08.20.1992
Suites 1110-1111, 11/F, Tower 6, The Gateway, 9 Canton Road, Tsimshatsui, Kowloon, Hong Kong
HKD 84,000 Securities brokeragefutures brokerage
China Products Trading Co. 12.29.1956 7F, No. 100 Jilin Road, Taipei, Taiwan NTD 5,000Investment in property, warehousing and other businesses (stop running business since 1966)
Yung-Shing Industries Co. 12.09.1950 7F, No. 100 Jilin Road, Taipei, Taiwan NTD 135,644International trading andagency service for electronic data processing, printing and packaging
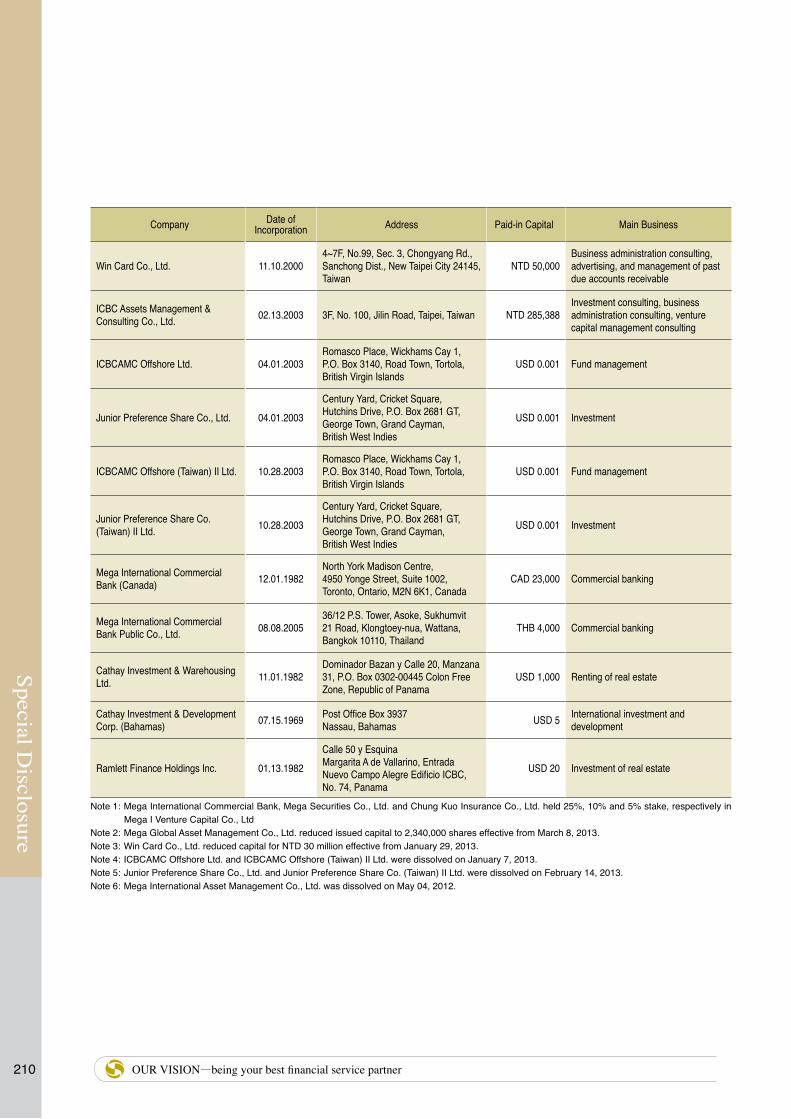
210
Special Disclosure
OUR VISION—being your best financial service partner
Company Date of Incorporation Address Paid-in Capital Main Business
Win Card Co., Ltd. 11.10.20004~7F, No.99, Sec. 3, Chongyang Rd., Sanchong Dist., New Taipei City 24145, Taiwan
NTD 50,000Business administration consulting, advertising, and management of past due accounts receivable
ICBC Assets Management & Consulting Co., Ltd. 02.13.2003 3F, No. 100, Jilin Road, Taipei, Taiwan NTD 285,388
Investment consulting, business administration consulting, venture capital management consulting
ICBCAMC Offshore Ltd. 04.01.2003Romasco Place, Wickhams Cay 1, P.O. Box 3140, Road Town, Tortola, British Virgin Islands
USD 0.001 Fund management
Junior Preference Share Co., Ltd. 04.01.2003Century Yard, Cricket Square, Hutchins Drive, P.O. Box 2681 GT, George Town, Grand Cayman, British West Indies
USD 0.001 Investment
ICBCAMC Offshore (Taiwan) II Ltd. 10.28.2003Romasco Place, Wickhams Cay 1, P.O. Box 3140, Road Town, Tortola, British Virgin Islands
USD 0.001 Fund management
Junior Preference Share Co. (Taiwan) II Ltd. 10.28.2003
Century Yard, Cricket Square, Hutchins Drive, P.O. Box 2681 GT, George Town, Grand Cayman, British West Indies
USD 0.001 Investment
Mega International Commercial Bank (Canada) 12.01.1982
North York Madison Centre, 4950 Yonge Street, Suite 1002, Toronto, Ontario, M2N 6K1, Canada
CAD 23,000 Commercial banking
Mega International Commercial Bank Public Co., Ltd. 08.08.2005
36/12 P.S. Tower, Asoke, Sukhumvit 21 Road, Klongtoey-nua, Wattana, Bangkok 10110, Thailand
THB 4,000 Commercial banking
Cathay Investment & Warehousing Ltd. 11.01.1982
Dominador Bazan y Calle 20, Manzana 31, P.O. Box 0302-00445 Colon Free Zone, Republic of Panama
USD 1,000 Renting of real estate
Cathay Investment & Development Corp. (Bahamas) 07.15.1969 Post Office Box 3937
Nassau, Bahamas USD 5 International investment and development
Ramlett Finance Holdings Inc. 01.13.1982Calle 50 y EsquinaMargarita A de Vallarino, Entrada Nuevo Campo Alegre Edificio ICBC, No. 74, Panama
USD 20 Investment of real estate
Note 1: Mega International Commercial Bank, Mega Securities Co., Ltd. and Chung Kuo Insurance Co., Ltd. held 25%, 10% and 5% stake, respectively in Mega I Venture Capital Co., Ltd
Note 2: Mega Global Asset Management Co., Ltd. reduced issued capital to 2,340,000 shares effective from March 8, 2013.Note 3: Win Card Co., Ltd. reduced capital for NTD 30 million effective from January 29, 2013.Note 4: ICBCAMC Offshore Ltd. and ICBCAMC Offshore (Taiwan) II Ltd. were dissolved on January 7, 2013.Note 5: Junior Preference Share Co., Ltd. and Junior Preference Share Co. (Taiwan) II Ltd. were dissolved on February 14, 2013.Note 6: Mega International Asset Management Co., Ltd. was dissolved on May 04, 2012.

Special D
isclosure
2112012 ANNUAL REPORT
8.3 Operational Highlights of Affiliated CompaniesAs of December 31, 2012
Unit: NT$ thousand, except EPS in NT$
Company Paid-in Capital Total Assets Total Liabilities Stockholders'
EquityOperating Revenues
(Net Revenue*)
Operating Income
(Income before Income Tax*)
Net Income (After Tax)
Earnings per share (After Tax)
Mega International Commercial Bank 71,000,000 2,425,284,139 2,245,171,757 180,112,388 43,133,328* 22,573,398* 19,333,472 2.80
Mega Securities Co., Ltd. 11,600,000 34,347,768 20,613,581 13,734,187 2,656,991 52,862 77,190 0.07
Mega Bills Finance Co., Ltd. 13,114,411 217,417,574 184,598,500 32,819,074 4,271,888* 3,348,559* 2,880,966 2.20
Chung Kuo Insurance Co., Ltd. 3,000,000 14,930,415 10,035,227 4,895,188 4,116,127 276,505 205,876 0.69
Mega Asset Management Co., Ltd. 2,000,000 11,269,748 8,390,046 2,879,702 905,262 727,806 621,075 3.11
Mega Life Insurance Agency Co., Ltd. 20,000 318,687 116,523 202,164 1,213,988 188,020 157,761 78.88
Mega Venture Capital Co., Ltd. 1,000,000 719,389 1,272 718,117 168,623 11,824 12,412 0.12
Mega International Investment Trust Co., Ltd. 527,000 853,291 47,161 806,130 327,748 113,931 97,181 1.84
Mega Management & Consulting Co., Ltd. 10,000 77,098 10,964 66,133 54,005 26,839 23,259 23.26
Mega I Venture Capital Co., Ltd. 600,000 495,446 2,426 493,020 178,196 17,198 17,433 0.29
Mega Futures Co., Ltd. 400,000 2,417,058 1,919,476 497,582 214,011 ( 2,169 ) 17,042 0.43
Mega International Investment Services Co., Ltd. 20,000 32,424 8,552 23,872 32,905 393 517 0.26
Mega Securities Holdings Co., Ltd. 753,152 409,797 19 409,778 374 ( 215,690 ) ( 216,022 ) ( 8.31 )
Mega Capital (Asia) Co., Ltd. 299,648 61,200 3,217 57,983 573 ( 175,886 ) ( 175,886 ) ( 2.20 )
Mega International Asset Management Co., Ltd. - - - - 27 ( 66 ) ( 66 ) -
Mega Securities (Hong Kong) Co., Ltd. 314,630 1,252,320 1,153,218 99,102 22,958 ( 35,254 ) ( 35,254 ) ( 251.82 )
Mega Global Asset Management Co., Ltd. 254,690 63,587 257 63,330 1,027 ( 1,363 ) ( 1,363 ) ( 0.16 )
China Products Trading Co. 5,000 53,427 24,984 28,443 1,866 979 812 8.12
Yung-Shing Industries Co. 135,644 1,365,003 458,888 906,115 147,235 ( 873 ) 4,097 3.02
Win Card Co., Ltd. 50,000 86,186 15,912 70,274 156,730 9,438 8,484 16.97
ICBC Assets Management & Consulting Co., Ltd. 285,388 324,075 47,055 277,020 5,111 ( 4,460 ) ( 28,679 ) ( 1.00 )
ICBCAMC Offshore Ltd. 0 0 0 0 1,949 1,878 1,878 1,878,019.79
Junior Preference Share Co., Ltd. 0 0 0 0 176 ( 15,633 ) ( 15,633 ) (15,632,882.65 )
ICBCAMC Offshore (Taiwan) II Ltd. 0 0 0 0 1,989 1,917 1,917 1,917,363.06
Junior Preference Share Co. (Taiwan) II Ltd. 0 0 0 0 36 15,338 15,338 15,338,209.69

212
Special Disclosure
Special Disclosure
OUR VISION—being your best financial service partner
Company Paid-in Capital Total Assets Total Liabilities Stockholders'
EquityOperating Revenues
(Net Revenue*)
Operating Income
(Income before Income Tax*)
Net Income (After Tax)
Earnings per share (After Tax)
Mega International Commercial Bank (Canada) 671,161 6,411,277 5,343,496 1,067,781 221,438 71,491 53,651 233.19
Mega International Commercial Bank Public Co., Ltd. 3,788,000 16,802,713 11,768,048 5,034,665 733,177 331,146 255,812 0.64
Cathay Investment & Warehousing Ltd. 29,035 95,823 8,528 87,295 3,968 ( 2,798 ) ( 2,798 ) ( 2,798.03 )
Cathay Investment & Development Corp. (Bahamas) 145 50,091 0 50,091 2,054 1,903 1,903 380.59
Ramlett Finance Holdings Inc. 581 49,867 50,429 ( 562 ) 7,672 1,725 1,725 1,150.24
Note: 1. Par value of common stock of Mega Securities Holdings Co., Ltd., Mega Global Asset Management Co., Ltd., is US$1 per share. Par value of common stock of Mega Securities (Hong Kong) Co., Ltd. is HK$600 per share. Par value of common share of Yung-Shing Industries Co. is NT$100 per share.
2. ICBCAMC Offshore Limited, Junior Preference Share Company Limited, ICBCAMC Offshore (Taiwan) II Limited, Junior Preference Share Company (Taiwan) II Limited were liquidated on August 31, 2012 at the prevailing US dollar exchange rate of 29.6778. Foreign exchange rates applied by the other affiliated companies are as follows:
Balance Sheet Items Income Statement Items Company Name
USD 1=NTD29.035 USD1=NTD 29.5076 Cathay Investment & Warehousing Limited, Cathay Investment & Development Corp. (Bahamas), and Ramlett Finance Holdings Inc.
CAD 1=NTD29.1809 CAD 1=NTD 29.5172 Mega International Commercial Bank (Canada)
THB 1=NTD 0.9470 THB 1=NTD 0.9499 Mega International Commercial Bank Public Co., Ltd.
HKD 1=NTD 3.7456 HKD 1=NTD 3.8043 Mega Securities Holdings Co., Ltd., Mega Global Asset Management Co., Ltd., Mega Capital (Asia) Co., Ltd. and Mega Securities (Hong Kong) Co., Ltd.

Mega Financial Holding Co., Ltd.
Chairman

14-16F, No. 123, Jhongsiao E. Road, Sec. 2,Taipei 100, Taiwan, R.O.C.Tel: +886-2-2357-8888 Fax:+886-2-3393-8755
Mega Holdings


