Download - MEMPHIS CITY SCHOOLS
This will be the BackCover.pdf file that you will put in the Graphics folder. You don’t need to refer to this in the spreadsheet.
Back Cover
MEMPHIS CITY SCHOOLSA COMPONENT UNIT OF THE
CITY OF MEMPHIS, TENNESSEE
COMPREHENSIVEANNUAL FINANCIAL
REPORTFor the Fiscal Year Ended June 30, 2011

Memphis City Schools Memphis, Tennessee
Comprehensive Annual Financial Report
For the Fiscal Year Ended June 30, 2011
Prepared by: Memphis City Schools
Department of Finance

Table of Contents
INTRODUCTORY SECTIONGovernment Finance Officers Association Award . . . . . . . . . . . . . . . . . . . . . . . . . . . . . . . . . . . . . . . . . . . .2Association School Business Officials Award . . . . . . . . . . . . . . . . . . . . . . . . . . . . . . . . . . . . . . . . . . . . . . .3Letter of Transmittal . . . . . . . . . . . . . . . . . . . . . . . . . . . . . . . . . . . . . . . . . . . . . . . . . . . . . . . . . . . . . . . . . . .5Organizational Chart . . . . . . . . . . . . . . . . . . . . . . . . . . . . . . . . . . . . . . . . . . . . . . . . . . . . . . . . . . . . . . . . .17District Officials . . . . . . . . . . . . . . . . . . . . . . . . . . . . . . . . . . . . . . . . . . . . . . . . . . . . . . . . . . . . . . . . . . . . .18
FINANCIAL SECTIONIndependent Auditor’s Report . . . . . . . . . . . . . . . . . . . . . . . . . . . . . . . . . . . . . . . . . . . . . . . . . . . . . . . . . .21Management’s Discussion and Analysis . . . . . . . . . . . . . . . . . . . . . . . . . . . . . . . . . . . . . . . . . . . . . . . . . .23
BASIC FINANCIAL STATEMENTS
Government-wide Financial Statements:Statement of Net Assets . . . . . . . . . . . . . . . . . . . . . . . . . . . . . . . . . . . . . . . . . . . . . . . . . . . . . . . . . . . . . .41Statement of Activities . . . . . . . . . . . . . . . . . . . . . . . . . . . . . . . . . . . . . . . . . . . . . . . . . . . . . . . . . . . . . . . .42
Fund Financial Statements:Balance Sheet – Governmental Funds . . . . . . . . . . . . . . . . . . . . . . . . . . . . . . . . . . . . . . . . . . . . . . . . . . .44Reconciliation of the Governmental Funds Balance Sheet to the Statement of Net Assets . . . . . . . . . . .45Statement of Revenues, Expenditures, and Changes in Fund Balances –
Governmental Funds . . . . . . . . . . . . . . . . . . . . . . . . . . . . . . . . . . . . . . . . . . . . . . . . . . . . . . . . . . . . .46Reconciliation of the Governmental Funds Statement of Revenues, Expenditures, and Changes In
Fund Balances to the Statement of Activities . . . . . . . . . . . . . . . . . . . . . . . . . . . . . . . . . . . . . . . . . . .47Statement of Revenues, Expenditures, and Changes in Fund Balance – Budget and Actual –
General Fund . . . . . . . . . . . . . . . . . . . . . . . . . . . . . . . . . . . . . . . . . . . . . . . . . . . . . . . . . . . . . . . . . . .48Statement of Revenues, Expenditures, and Changes in Fund Balance – Budget and Actual –
Special Revenue Categorically Aided Fund . . . . . . . . . . . . . . . . . . . . . . . . . . . . . . . . . . . . . . . . . . . .49Statement of Net Assets – Proprietary Fund . . . . . . . . . . . . . . . . . . . . . . . . . . . . . . . . . . . . . . . . . . . . . . .50Statement of Revenues, Expenses, and Changes in Net Assets – Proprietary Fund . . . . . . . . . . . . . . . .51Statement of Cash Flows – Proprietary Fund . . . . . . . . . . . . . . . . . . . . . . . . . . . . . . . . . . . . . . . . . . . . . .52Statement of Fiduciary Net Assets . . . . . . . . . . . . . . . . . . . . . . . . . . . . . . . . . . . . . . . . . . . . . . . . . . . . . . .53Statement of Changes in Fiduciary Net Assets – Fiduciary Funds . . . . . . . . . . . . . . . . . . . . . . . . . . . . . .54
Notes to the Basic Financial Statements . . . . . . . . . . . . . . . . . . . . . . . . . . . . . . . . . . . . . . . . . . . . . . . . . . .55
REQUIRED SUPPLEMENTARY INFORMATIONSchedules of Funding Progress and Schedule of Employer Contributions . . . . . . . . . . . . . . . . . . . . . . . .83
COMBINING AND INDIVIDUAL FUND STATEMENTS AND SCHEDULESCombining Statement of Net Assets – Internal Service Funds . . . . . . . . . . . . . . . . . . . . . . . . . . . . . . . . .87Combining Statement of Revenues, Expenses and Changes in Net Assets –
Internal Service Funds . . . . . . . . . . . . . . . . . . . . . . . . . . . . . . . . . . . . . . . . . . . . . . . . . . . . . . . . . . . .88Combining Statement of Cash Flows – Internal Service Funds . . . . . . . . . . . . . . . . . . . . . . . . . . . . . . . .90Statement of Changes in Assets and Liabilities – Agency Fund . . . . . . . . . . . . . . . . . . . . . . . . . . . . . . . .95Schedule of Revenues, Expenditures and Changes in Fund Balance – Budget and Actual –
Food Service Fund . . . . . . . . . . . . . . . . . . . . . . . . . . . . . . . . . . . . . . . . . . . . . . . . . . . . . . . . . . . . . . .97
Capital Assets InformationSchedule of Revenues, Expenditures, and Changes in Fund Balance – Budget and Actual –
Capital Projects Fund . . . . . . . . . . . . . . . . . . . . . . . . . . . . . . . . . . . . . . . . . . . . . . . . . . . . . . . . . . . . .98Schedule of General Capital Assets by Function and Activity . . . . . . . . . . . . . . . . . . . . . . . . . . . . . . . . . .99Schedule of Changes in General Capital Assets by Function and Activity . . . . . . . . . . . . . . . . . . . . . . .100
Debt InformationSchedule of General Long-Term Obligations . . . . . . . . . . . . . . . . . . . . . . . . . . . . . . . . . . . . . . . . . . . . . .102Schedule of General Long-Term Obligations Principal and Interest Requirements . . . . . . . . . . . . . . . . .104
i
Table of Contents (continued)
STATISTICAL SECTION (Unaudited)Overview. . . . . . . . . . . . . . . . . . . . . . . . . . . . . . . . . . . . . . . . . . . . . . . . . . . . . . . . . . . . . . . . . . . . . . . . . . . . . . . . 107
Financial TrendsNet Assets by Component . . . . . . . . . . . . . . . . . . . . . . . . . . . . . . . . . . . . . . . . . . . . . . . . . . . . . . . . . . . 110Statement of Activities . . . . . . . . . . . . . . . . . . . . . . . . . . . . . . . . . . . . . . . . . . . . . . . . . . . . . . . . . . . . . . 112General Revenues and Total Changes in Net Assets . . . . . . . . . . . . . . . . . . . . . . . . . . . . . . . . . . . . . . . 114Fund Balances, Governmental Funds . . . . . . . . . . . . . . . . . . . . . . . . . . . . . . . . . . . . . . . . . . . . . . . . . . 116Ten-Year Summary of Governmental Funds Revenues and Expenditures . . . . . . . . . . . . . . . . . . . . . . 118Ten-Year Comparison of General Fund Balance to Expenditures and Other Uses . . . . . . . . . . . . . . . . 120
Revenue CapacityAssessed Value and Estimated Actual Value of Taxable Property . . . . . . . . . . . . . . . . . . . . . . . . . . . . . 122Property Tax Rates and Levies . . . . . . . . . . . . . . . . . . . . . . . . . . . . . . . . . . . . . . . . . . . . . . . . . . . . . . . . 124Principal Property Tax Payers – Current Year and Nine Years Ago . . . . . . . . . . . . . . . . . . . . . . . . . . . . 126
Debt CapacityOutstanding Debt by Type . . . . . . . . . . . . . . . . . . . . . . . . . . . . . . . . . . . . . . . . . . . . . . . . . . . . . . . . . . . 131Ten-Year Comparison of Bonded Debt to Assessed Value, Estimated
Actual Value and Population . . . . . . . . . . . . . . . . . . . . . . . . . . . . . . . . . . . . . . . . . . . . . . . . . . . . . . 132Percentage of Debt Service to Non-Capital Expenditures – Last Ten Fiscal Years . . . . . . . . . . . . . . . . 133
Demographic and Economic InformationDemographic and Economic Statistics . . . . . . . . . . . . . . . . . . . . . . . . . . . . . . . . . . . . . . . . . . . . . . . . . . 137Principal Employers, Current Year and Nine Years Ago . . . . . . . . . . . . . . . . . . . . . . . . . . . . . . . . . . . . . 138
Operating InformationOperating Statistics . . . . . . . . . . . . . . . . . . . . . . . . . . . . . . . . . . . . . . . . . . . . . . . . . . . . . . . . . . . . . . . . . 142Weighted Full-time Equivalent Average Daily Attendance . . . . . . . . . . . . . . . . . . . . . . . . . . . . . . . . . . . 145Staff by Type . . . . . . . . . . . . . . . . . . . . . . . . . . . . . . . . . . . . . . . . . . . . . . . . . . . . . . . . . . . . . . . . . . . . . . 146Summary of Buildings and Sites . . . . . . . . . . . . . . . . . . . . . . . . . . . . . . . . . . . . . . . . . . . . . . . . . . . . . . . 148Schedule of Major Insurance Coverage . . . . . . . . . . . . . . . . . . . . . . . . . . . . . . . . . . . . . . . . . . . . . . . . . 188Schedule of Surety Bonds . . . . . . . . . . . . . . . . . . . . . . . . . . . . . . . . . . . . . . . . . . . . . . . . . . . . . . . . . . . 190Graduation Information . . . . . . . . . . . . . . . . . . . . . . . . . . . . . . . . . . . . . . . . . . . . . . . . . . . . . . . . . . . . . . 191School Lunch Program . . . . . . . . . . . . . . . . . . . . . . . . . . . . . . . . . . . . . . . . . . . . . . . . . . . . . . . . . . . . . . 192Pupil Transportation . . . . . . . . . . . . . . . . . . . . . . . . . . . . . . . . . . . . . . . . . . . . . . . . . . . . . . . . . . . . . . . . 194
STATUTORY REPORTING SECTIONIndependent Auditors Report on Internal Control over Financial Reporting
and on Compliance and Other Matters . . . . . . . . . . . . . . . . . . . . . . . . . . . . . . . . . . . . . . . . . . . . . . 199Independent Auditor's Report on Compliance with Requirements
applicable to each Major Program and on Internal Control over Compliance in Accordance with OMB Circular A-133 . . . . . . . . . . . . . . . . . . . . . . . . . . . . . . . . . . . 202
Schedule of Expenditures of Federal, State and Other Awards . . . . . . . . . . . . . . . . . . . . . . . . . . . . . . . 204Schedule of Findings and Questioned Costs . . . . . . . . . . . . . . . . . . . . . . . . . . . . . . . . . . . . . . . . . . . . . 219Summary of Prior Year Findings . . . . . . . . . . . . . . . . . . . . . . . . . . . . . . . . . . . . . . . . . . . . . . . . . . . . . . . 220
ii

1
INTRODUCTORY SECTION
Introductory Section
2
Government Finance Officers Association Award
3
Association School Business Officials Award

4
5
Letter of Transmittal
Breakthrough Leadership. Breakthrough Results.
December 22, 2011 Citizens and Board of Commissioners Memphis City Schools Memphis, TN We are hereby submitting the Comprehensive Annual Financial Report (CAFR) of the Memphis City Schools (the School District) for the fiscal year (FY) ended June 30, 2011. State and federal statutes require that the School District issue annual financial reports and that these reports be audited by an independent firm of certified public accountants. Pursuant to that requirement, we hereby issue the CAFR and all appropriate disclosures for FY ended June 30, 2011 in an effort to provide information on the financial condition of the School District for all interested parties. The School District’s financial statements have been audited by Watkins Uiberall, PLLC, a firm of licensed certified public accountants. The goal of the independent audit is to provide reasonable assurance that the financial statements of the School District for the FY ended June 30, 2011, are free of material misstatement. The independent audit consisted of reviewing, on a test basis, evidence supporting the amounts and disclosures in the financial statements; assessing the accounting principles used and significant estimates made by management; and evaluating the overall financial statement presentation. The independent auditor concluded, based upon the audit, that there was a reasonable basis for rendering an unqualified opinion, suggesting that the School District’s financial statements for the FY ended June 30, 2011, are fairly presented in conformity with Generally Accepted Accounting Principles (GAAP). Responsibility for both the accuracy of the data and the completeness and fairness of the presentation, including all disclosures, rests with the Department of Finance of Memphis City Schools. In addition, the School District is required to undergo an annual single audit in conformity with the provisions of the U.S. Office of Management and Budget’s (OMB) Circular A-133, “Audits of States, Local Governments, and Non-profit Organizations.” The standards governing single audit engagements require the independent auditor to report on both the fair presentation of the financial statements and on the School District’s internal controls and compliance with legal requirements, especially concerning the administration of federal awards. Information related to this single audit, including a schedule of federal financial assistance and the independent auditors reports on the internal control structure and on compliance with applicable laws and regulations, is included in this report. The Comprehensive Annual Financial Report includes all funds and consists of three sections. The Introductory Section includes this transmittal letter and information regarding the School District’s structure and officials. The Financial Section provides the School District’s financial statements, along with notes and supplementary information. The Statistical Section contains detailed information as a context for understanding what the information in the financial statements, note disclosures, and required supplementary information says about the School District’s overall financial health. GAAP requires that management provide a narrative introduction, overview and analysis to accompany the basic financial statements in the form of Management’s Discussion and Analysis (MD&A). This letter of transmittal is designed to complement the MD&A and should be read in
6
Breakthrough Leadership. Breakthrough Results.
conjunction with it. The MD&A can be found immediately following the report of the independent auditors. PROFILE OF MEMPHIS CITY SCHOOLS The Board of Education of the Memphis City Schools is a component unit of the City of Memphis, which is defined as the oversight entity by GASB Codification Section 2100. Reporting for the School District follows the criteria established by the Governmental Accounting Standards Board (GASB). During FY 2011 the District was governed by a nine-member Board of Commission that was elected by the citizens of Memphis. The Board members elect a member to serve as President and a member to serve as Vice President of the Board for one year terms. Pending the merger between Memphis City Schools and Shelby County Schools as discussed in the MD&A Memphis City Schools is now governed by the 23 member Shelby County Board of Education. Memphis City Schools is Tennessee’s largest school district and the 23rd largest public school system in the nation. The enrollment for the 2010-2011 school year was 106,656 students in K-12 and charter schools. The student demographics is 85 percent African American, 7 percent white and 8 percent other races and nationalities. The district is comprised of a total of 209 schools which includes charter schools, career and technology centers, special education centers and alternative schools; forty-four (44) schools are Optional Schools or offer Optional Programs that provide parents choices in selecting a public education that best fits their child’s talents and abilities. In addition Memphis City Schools has 205 pre-kindergarten classes, 53 of which are within community partner locations. The majority of MCS schools are accredited by the Southern Association of Colleges and Schools. The district employs more than 7,000 teachers. The vision of Memphis City Schools is that the district will be an internationally competitive urban school system that produces well-rounded, high-achieving students. Our strategic goals are centered on student achievement, accountability, parent and community involvement, healthy youth development and diversity. Our core beliefs and commitments are the following:
We BELIEVE in and commit to ALL children achieving at high global academic standards.
We BELIEVE that school culture and staff have a profound impact on student achievement and commit to hiring and supporting quality teachers, principals, and staff.
We BELIEVE in and commit to being a high-performing organization that establishes a culture of continuous improvement, transparency, and accountability at all levels.
We BELIEVE that strong public support is essential for All students to excel and commit to developing productive and mutually beneficial family, district, and community partnerships.
7
Breakthrough Leadership. Breakthrough Results.
We BELIEVE that good health is critical to high performance and commit to improving the physical, mental, and emotional well-being of All students and staff.
We BELIEVE that school safety is essential for a productive teaching and learning environment and commit to providing safe schools.
We BELIEVE in and commit to respecting and embracing cultural, social, intellectual, and economic diversity and empowering All students and staff to reach their full potential
LOCAL ECONOMIC OUTLOOK Profile of the City of Memphis Memphis is located on the east bank of the Mississippi River in the southwest corner of Tennessee. Memphis is the State’s largest city and the county seat of Shelby County. The corporate limits contain 343 square miles, representing 45 percent of the total land area of Shelby County. Memphis ranks as the 18th largest city in the nation. The 2010 population was 646,889 according to the 2010 Census. The City of Memphis was incorporated as a city in 1826. Memphis operated under a commission form of government from 1909 until January 1, 1968. At that time, a Mayor-Council form of government was established. The City Council is composed of thirteen representative citizens who are elected for four-year terms. Six council members are elected at large in multi-member districts, with territorial boundaries determined by dividing the City in half with each multi-member districts, with each multi-member districts consisting of three (3) council member numbered positions. The remaining seven (7) council members are elected by single member districts, numbered 1-7. The Council elects its own chairperson, exercises legislative powers, approves budgets and establishes the tax rate. The Mayor is elected to a four-year term. The Mayor carries out the policies of the City and appoints City board members, officers and division directors, with Council approval. The Mayor may veto action of the City Council, but a simple majority vote of the City Council can override any veto. Memphis is home to world famous Beale Street and Graceland. The FedEx World Hub and major hubs for UPS and DHL are located in Memphis. Memphis is known worldwide as: Memphis America’s Aerotropolis. The Grizzlies National Basketball Association and Redbirds AAA baseball teams call Memphis home. Based on the most recent (September, 2011) report prepared by the Eighth Federal Reserve District on economic conditions in the Memphis area at the close of July, 2011, the annual growth of employment, building permits and housing prices was 0.6 percent, (37.4) percent, and (6.4) percent in the Memphis Metropolitan Statistical Area (MSA) and 0.9 percent, (4.9) percent, and (4.5) percent in the nation, respectively. At the same time, the annual growth of personal income was 3.0 percent in Tennessee and 3.1 percent in the nation. Also, in the past three months, local employment decreased at an average rate of 0.1 percent per month, while nationwide employment increased by an average rate of 0.1 percent per month. Finally, the unemployment rate in Memphis (10.3 percent) was higher than the nation’s (9.1 percent). Based on the above, the nation has outperformed Memphis.
8
Breakthrough Leadership. Breakthrough Results.
1Current Economic Conditions in the Eighth Federal Reserve District Memphis Zone 2Memphis Business Journal May 2011
Memphis’ recession related decline in employment, which was centered near January 2009, was similar to the nation’s decline. The recovery in Memphis has been similar to that of the nation, with the exception of a large decline in employment in the third quarter of 2010. In the second quarter of 2011, Memphis’s employment contracted at an average rate of 0.1 percent per month, while the nation’s employment expanded at an average rate of 0.1 percent per month. Employment growth by sector during the past 12 months distinguishes general trends from sector-specific trends in Memphis’s economic performance. Employment rose by 0.6 percent in this MSA with respect to one year ago, while the increase was 0.9 percent for the United States. The three largest sectors in Memphis are Trade, Transportation and Utilities; Government; and Education and Health, accounting for 27 percent, 14 percent and 14 percent of Memphis area employment, respectively. Growth in these three sectors was 0.6 percent, -3.5 percent and 0.2 percent, respectively. Sectoral and aggregate employment changes in Memphis were mixed with 4 of 10 sectors increasing employment and 5 of 10 sectors decreasing employment. The Natural Resources, Mining, and Construction sector, which accounts for 4 percent of total employment, had the best performance (10.6 percent), while the Government sector, which accounts for 14 percent of total employment, had the worst performance (-3.5 percent). Employment expansion has been positive in the Memphis Zone. In Memphis, employment growth was substantial for goods-producing activities and mild for service-providing activities. For several quarters before the national recession, which started in 2007, personal income growth in Tennessee was roughly the same as the nation. Between the first quarter of 2010 and the first quarter of 2011, personal income grew 3.0 percent in Tennessee, compared with 3.1 percent in the nation. Relative to the same period last year, housing activity in the Memphis Zone has generally been weaker. In the year-to-date number of total building permits, Memphis experienced a decline of 37.4 percent. The contractions in Memphis have been greater than the 4.9 percent registered for the United States.¹ On the manufacturing side, projections state that U.S. revenues will increase 7.5 percent and capital investments will increase nearly 18 percent. Much of the manufacturing has emerged from the economic downturn and is experiencing significant growth. Capacity utilization is back to typical levels and manufacturers are significantly investing in their business. Manufacturing industry health is critical to the Memphis area because it represents 43,400 employees, or 7.5 percent of the workforce, according to February 2011 data from the Tennessee Department of Labor and Workforce Development. Memphis manufacturing activity has been booming recently, most notably thanks to the pending construction of major new facilities by Mitsubishi Electric Power Products Inc, Electrolux and the purchase of an existing facility for City Brewing Co.2
9
Breakthrough Leadership. Breakthrough Results.
EDUCATIONAL PROGRAMS 2010-11 was a remarkable year in numerous ways. For instance, the historic vote by the citizens of Memphis to surrender the Memphis City Schools Charter captured our attention for months and the aftermath continues. Still, Booker T. Washington High remained focused, got its work done, and became the heartthrob of MCS when its work captured the attention and presence of President Barack Obama - a historic moment of a different kind of magnitude. Our graduation rate for the 2010-11 academic year was 72.6%, one of the best of all urban districts in the United States. Moreover, Memphis City Schools high school graduates amassed an impressive record figure of $178,000,000 in college scholarship offers. Key among our 2010-11 highlights, the data of the Memphis Police Department informs that all our schools are safe. Our Memphis City Schools Prep Schools graduated 582 students who divergence had them destined for a different reality. White Station Middle had students and their school nationally acclaimed for their prowess in science. MCS got straight “A” grades in writing for grades 5, 8, and 11, a continuation of excellence in this content area. A total of 172 teachers were selected by their peers to be Prestige Award winners, and a delegation of Student Envoys represented MCS at an invitation-only youth summit in Washington, D.C. More than 10,000 citizens participated in ThinkShow! and ArtsFest; they slogged through rain and mud with every arts organization in Memphis to break new ground. Memphis City Schools was named one of the Best Communities for Music Education in America by The National Association of Music Merchants (NAMM). More than 1,000 MCS students earned college credit through our Dual Enrollment program - the largest of its kind in the country. Many of our schools had data that revealed significant growth in student performance at multiple grade levels and subjects. One disappointment of the 2010-11 academic year has to be the fact that we did not make AYP however, neither did Shelby County Schools or the State of Tennessee. Despite our AYP targets, the MCS TVAAS data tells a different story. We had dramatic improvements in mathematics in grades 3-8 and reading in grades 6 and 8. Significant improvements were seen in 6th and 7th grade science. Improvements in Algebra I have stimulated requests to share our approach and 11th grade writing scores continue to impress. There is a momentum in MCS that requires each of us to do our level best to sustain it. This retrospective is a testimony to what we can do when we do not submit to the distractions of poverty, politics, and assaults on urban education. We can continue to achieve the results we have accomplished and more! Below are some of the emerging results of critical reforms aligned to our strategic goals:
Goal 1: Student Achievement — It would be difficult to find a more reported or commented-on topic in K-12 education today than the reauthorization of the No Child Left Behind (NCLB) Act. From the proposed waiver authored by Tennessee Governor Bill Haslam and state education Commissioner Kevin Huffman to the weekly pronouncements of U.S. Secretary of Education, Arne Duncan, the future of NCLB seems uncertain at best. Our District’s status—School Improvement 1—reflects a measurement on an outdated system that very likely will not be the same going forward. While the politicians sort out NCLB and which states will get what waivers, we share the promise of important progress made on 11 of the 16 academic indicators from TCAP and EOC testing.
10
Breakthrough Leadership. Breakthrough Results.
For the 2010-11 school year, District efforts in mathematics paid the most substantial dividends, with English I and writing in grade 5 and grade 8 showing impressive lifts, as well. Modest declines in English II, and U.S. History are already being addressed in the new school year. As has been the case for the past three years and beyond, cohort graduation and dropout numbers are still in process and will be shared via the State Report Card later in the fall. The 12th grade graduation rate percentage increased again this year to an impressive 89%. The three-year trend shows that we are doing a better job overall at record-keeping and keeping our students in school through graduation. Our individually tailored EdPlan will help undergird this aim.
The essential first step for the District on the Cradle to Career Roadmap is Pre-K programming. With Board support and community commitment, the number of classrooms offered and students served has increased more than 75% in the past three years. Identified as a major fault line of the District, the percentage of students overage for grade has declined by approximately 25% in three years.
Enrollment in Advanced Placement (AP) courses has increased by almost one-third, with Hispanic student participation in AP up more than 60%. Dual enrollment has shown important increases, as well. Hispanic student participation in dual enrollment showed gains from 1.5% to 5.5% over three years; African-American student participation increased by 150 students in 2010-11 to 5.2% of11thand12th graders. In three years, MCS Prep Academies have added 906 graduates to the Memphis economy, dropping out. Based on U.S. Census data and conservative projections of lifetime earning potential, the impact of these students graduating versus dropping out is approximately $262 million.
The major challenge among Goal 1 indicators is improving the college- and career-ready rate of 4% for MCS graduating seniors; the corollary is improving the District’s ACT Composite average of 16.2. Summary statistics belie the fact that the District opportunity gap for having taken the ACT has closed significantly from 5,020 12th grade students taking the ACT in 2008-09 to 6,774 taking the ACT in 2010-11, an increase of 35% in the past three years. With more students than ever before taking the test, including students who had never previously seen themselves as college material, research tells us to expect a proportional dip in scores. All junior students are now required to take a Kaplan ACT prep course prior to the state-wide spring ACT testing date in order to ensure that students taking the exam have cogent strategies for test-taking. Results from the first-ever implementation of the Kaplan course and the resulting ACT outcomes are encouraging and expected out this fall.
In addition, participation by MCS seventh-graders in the Duke University Talent Identification Program (TIP) continues to increase and ACT performance exceeds that of national rates; 67% of MCS students in TIP earned state recognition (versus 36% nationally) and 13% of MCS students in TIP earned the highest level—Grand Recognition (versus 3% nationally). Goal 2: Accountability — No other urban district in the nation can boast the financial results of Memphis City Schools in the past three years. The work of the Finance Department is to be commended. The Budget Services Division earned the Meritorious Budget Award for the 2010-11 Annual Budget from the Association of School Business Officials (ASBO) and the Distinguished Budget Presentation Award from the Government Finance Officers Association (GFOA) of the United States and Canada on its first submission. Fiscal Services received its second Certificate of Achievement for Excellence in Financial Reporting for its 2010 Comprehensive Annual Financial Report from Government Finance Officers
11
Breakthrough Leadership. Breakthrough Results.
Association and the Certificate of Excellence in Financial Reporting from Association of School Business Officials International. The community can sleep easier knowing that our financial house is in order. Moreover, the MCS Office of Federal Programs and Grants earned an Exceptional Audit Rating by the Tennessee Department of Education for the seventh year in a row.
In addition, our Capital Planning department has reduced the number of untitled properties by 50% in three years and our Procurement Services department has improved the District’s purchasing efficiency with strategically-sourced items. Since the District established a partnership with Durham School Services to provide transportation for our students, on-time arrivals at school have improved from 40% in 2009-10 (with a prior company) to 86% in 2010-11. In addition, the Central Nutrition Center—an example of District mismanagement and waste in 2007—is now a national award-winning division with the Golden Carrot Award (from the Physicians Committee for Responsible Medicine) and a Council of Great City School’s Managing for Results recognition to its credit. Facilities and Real Estate Management also had another banner year. The newly-constructed Kate Bond Middle School project was completed on-time and under-budget with more than 1,000 students projected to enroll this fall. With new renovation and construction projects completed, we have reduced the number of portable classrooms by 26%, from 296 to 218. Goal 3: Parent and Community Engagement — The two performance indicators for this goal are among the most-changed areas in the District for 2011-12. The first—ThinkShow!—has moved from a twice-yearly event that has drawn national attention to become a spring-only event slated to serve as the District’s first major effort at integrating the Common Core State Standards into curricular activities. The second—the work of the Parent and Community Engagement (PACE) office—is undergoing a radical reform of leadership and scope of work. Parent participation at the Superintendent’s Demand Parent Regional Summits increased nearly 60% in three years, but the quality of overall engagement and the range of parental participation still represents an area for significant improvement. Goal 4: Healthy Youth Development — Our partnership with Well Child, Inc. - in managing our region based health clinics and through their school-based Early Periodic Screening, Diagnosis, and Treatment (EPSDT) program - had the direct result of providing 42,386 health screenings during the 2010-11 school year, an increase of approximately 70% in three years. This increase is so vitally important to our core business because, as we established three years ago, undiagnosed and under-diagnosed health problems are a major fault line for our District. The District also won a $499,167 grant from the Health Resources and Services Administration to purchase optometry equipment for each of the four region-based health clinics and fit students with glasses, as well as purchase and equip two mobile health units—one for optometry and one for general medicine. On September 16, the District’s second synthetic turf field will be celebrated with a ribbon-cutting ceremony at Crump Stadium. This important innovation, like the field at Melrose Stadium, will extend the life of the field and prevent injuries for the hundreds of athletes who compete on the Crump Stadium field each year. Meanwhile, student leadership opportunities are increasing in exciting ways. Hundreds of non-traditional student leaders have been deployed as Student Envoys under the auspices
12
Breakthrough Leadership. Breakthrough Results.
of the TEI project. MCS Urban Debate League teams ranked third in the nation for the number of schools and students participating, establishing the District’s young program as one of the premier opportunities for debate students in America. Goal 5: Safety and Discipline — With results like an 87% decrease in the number of serious targeted incidents (144.4 per thousand at the end of the 2007-08 school year to 18.3 per thousand at the end of 2010-11), it did not take long for the nation to notice the work we have done to help keep students and staff safe in school. Recently, Memphis hosted a federal team site visit with officials from the Office of Juvenile Justice and Delinquency Prevention where MCS programs like the School House Adjustment Program Enterprise (S.H.A.P.E.) and the Gang Reduction Assistance for Saving Society’s Youth (G.R.A.S.S.Y.) program were featured and commended as integral components of the Memphis Youth Violence Prevention Plan. Earlier this summer, Chief Gerald Darling and his staff traveled to Phoenix to collect the Individual School Safety Award/Exemplary School Safety Program Award from the School Safety Advocacy Council. With strong partnerships including the MPD, Juvenile Court and Judge Curtis Person, and other community agencies across the city, referrals to Juvenile Court are down 26%, the number of students transported to Juvenile Court is down 46%, and fights are down 16% in three years. The District believes that training more than 50,000 of our middle and high school students in the practice of Kingian non-violence has further helped lead to these impressive results. These are extraordinary results, indeed; however, our work is never done in this area. Goal 6: Diversity — As seen in the substantial increase of Hispanic students taking AP courses, our commitment to creating a school community sensitive and responsive to diversity is bearing fruit in several areas. In three years, the number of teachers with dual certification has increased by 30%, and several schools are now offering languages previously unavailable in MCS: Russian, Mandarin Chinese, Japanese, and Arabic. The District’s first dual-language program at Treadwell Elementary continues to be a source of excellent instruction and a proof-point for other schools seeking to replicate the curriculum and approach. Our work to provide diversity training for all staff members over the past two years has been very positive: since beginning as a pilot project in late spring 2010, a total of 12,783 staff completed a nationally-recognized curriculum on diversity in 2010-11. This program is designed to provide staff with various problem solving techniques and academic strategies for engaging all students, regardless of race, background, or prior achievement levels. Our Teacher Effectiveness Initiative (TEI) hit several important milestones in the past year including several firsts: the first-ever district-wide teacher recognition event in the Prestige Awards, the deployment of the first TEI Ambassadors as teacher-leaders equipped to take the message of teacher effectiveness to all schools, and the first cohort of Student Envoys trained in the language and tenets of efficacy to spread a culture of achievement among their peers. Looking ahead to 2011-2012: Even as discussions about waivers for NCLB and the advent of Common Core State Standards are garnering headlines, the major focus for our new school year is the comprehensive implementation of a new educator evaluation system. Mandated under the state’s Race to the Top strategy, educator evaluation now requires annual performance
13
Breakthrough Leadership. Breakthrough Results.
reviews for all school-based personnel, a schedule we adopted for all administrative staff three years ago. Teacher evaluations will be based on the Teacher Effectiveness Measure (TEM), one of three state approved alternative methodologies for conducting evaluations. The TEM grew out of our work with the Gates Foundation-funded Measures of Effective Teaching (MET) project and has been piloted across the district over the past year. With full implementation this school year, the TEM requires four classroom observations for tenured teachers and six observations for non-tenured teachers. In years past, observation was the primary source of data for teacher evaluation. With TEM, teachers receive weighted scores for value-added growth, academic achievement, teacher content knowledge, stakeholder perception, as well as classroom observation. With more than 29,000 teacher observations and more than 600 principal and assistant principal observations to be conducted this year, our TEI team will be reviewing protocols and monitoring logistics throughout the year. We look forward to keeping you updated on the very latest about TEI as the school year progresses. The “I Teach. I Am.” campaign is underway. The communication strategy will become evident in every school building, on large billboards, on buses and at bus stops, in movie theaters throughout Memphis, and on the Internet. The highlighting of outstanding MCS teachers is intended to communicate the strength of the system to internal and external constituents. At the threshold of another major breakthrough in urban education, more than 7,000 high school juniors are working to fulfill their requirement to take and pass an online course before they graduate. With 86 courses to choose from, MCS students are among the only students in the nation with a requirement to take an online course to fulfill graduation requirements. Middle school students have 34 courses to choose from, including keyboarding. With the coming change in standardized testing to an online, adaptive (questions adjust to the level of the student) administration format, our students are at the vanguard of preparation for the new assessments. In addition, our application for an MCS Virtual School is under current review by the state of Tennessee.
FINANCIAL INFORMATION
MCS ended the fiscal year better than budgeted, primarily due to sustainable revenue in addition to carefully controlled expenditures in the General Operating Fund. The year began with uncertain economic conditions, so MCS budgeted prudently and instituted fiscal controls. Using the full accrual basis of accounting, MCS has total net assets of $957 million, a decrease of approximately $147.2 million from fiscal year 2009.
Internal Control To provide a reasonable basis for making these representations, management of the School District has established a comprehensive internal control framework that is designed both to protect the School District’s assets from loss, theft, or misuse and to compile sufficient reliable information for the preparation of the School District’s financial statements in conformity with U.S. generally accepted accounting principles (GAAP). As the cost of internal controls should not outweigh their benefits, the School District’s comprehensive framework of internal controls
14
Breakthrough Leadership. Breakthrough Results.
has been designed to provide reasonable rather than absolute assurance that the financial statements will be free from material misstatement. To the best of our knowledge and belief, the enclosed data is accurate in all material respects and is reported in a manner designed to present fairly the financial position and results of operations of the government-wide activities and governmental funds of the School District. All disclosures necessary to enable the reader to gain an understanding of the School District’s financial activities have been included. Cash Management and Investments The Board of Commissioners of the Memphis City Schools supports and authorizes a safe and sound investment program. Such a program is critical for securing a maximum yield to supplement other district revenues for the support of educational programs. The investment policy of Memphis City Schools defines the parameters within which funds can be invested. Investments must comply with the policy and must always be in compliance with state and federal laws. It is the practice of the District to pursue an active cash management program that stresses safety of principal and interest while generating favorable rates of return. The program is maintained in such a fashion so as to provide a sufficient level of liquidity to support anticipated expenditures without subjecting the District to material, unfavorable fluctuations of market and interest rate risk. Risk Management and Financing The Division of Risk Management has the overall responsibility for the health, comfort and learning environment of students and staff. (DRM) objectives include preserving the assets of the Memphis City Schools from the consequences of accidental or other losses that are financially catastrophic and could impair the Board’s ability to provide educational and community services. DRM ensures risks that are likely to have a significant impact on the achievement of key Board objectives are identified and effectively mitigated. Additional objectives include ensuring business continuity plans and school emergency plans are prioritized and maintained in MCS and that guidelines for insured and self-insured programs are established. A Schedule of Insurance and Insurance Services is provided in the Statistical Section of this report. Fund Accounting
MCS reports its financial activities through the use of fund accounting. This is a system wherein transactions are reported in self-balancing sets of accounts to reflect the results of activities. (See note 1 of the Notes to the Basic Financial Statements for a summary of significant accounting policies and a description of fund types and account groups). Budgetary Controls Annual budgets are prepared on a basis consistent with General Accepted Accounting Principles for the General Fund, Capital Projects, Special Revenue and Nutrition Services Fund. The adopted annual budget serves as the foundation for the School District’s financial planning and control. Enrollment projections which drive staffing and expenditure allocations for local schools are developed in December in order to begin the budgeting process. Budgets are developed in order to support district goals and strategic objectives. A proposed budget prepared by the schools and central office department heads approved by the budget depart-ment is presented to the Superintendent and the Internal Budget Committee for review. After review by the Superintendent and Internal Budget Committee, the proposed budget is then reviewed by the Board of Commissioners. The budget is then adopted by the full Board of
15
Breakthrough Leadership. Breakthrough Results.
Commissioners and approved by the City of Memphis. The approval of the annual budget by the Board provides authorization to the Superintendent and the administrative staff to expend any or all of the amounts appropriated to the limit of each separate fund for the specific budget year. Any increase to the total budget must be resubmitted to the Board of Commissioners and the City of Memphis for approval. In order to be fiscally accountable, the budget development process focuses on the re-engineering of processes and realignment of functional assignments for greater efficiency and improved performance. Functional cost centers are charged with implementing measures for continuous improvement and seeking new revenue generators. A prudent review of alternative funding sources is emphasized to maximize and consolidate all resources. Funding levels are reviewed to ensure compliance with federal and state maintenance of efforts. An activist approach is taken in the budget development process. Typically, a deep midyear review is performed on each function’s current year expenditures and operations to guide the development of the budget. Management then determines if funds should be realigned or redirected to another area. All line item costs are substantiated as adding value to the school district or meeting state and federal mandates. Each budget is scrutinized for potential cost savings. Additional dollars to support the Academic Agenda are approved in certain cost centers whenever offset by efficiency savings in another cost center. Management is responsible for maintaining budgetary controls to ensure that budgets are in compliance with the legal provisions of the State of Tennessee, and within the annual appropriations adopted by the Board of Commissioners. Detailed line item budgetary reports are provided to the appropriate managers, who have been delegated the responsibility for monitoring and controlling their respective budget allocations. The School District’s financial accounting system allows budget managers on-line access to their budget, expenditure, and encumbrance information. An encumbrance system is utilized to measure the uncommitted funds available. Budgets are revised throughout the year to appropriately address variances that occur in enrollment, revenue, expenditure and unforeseen events. LONG-TERM FINANCIAL PLANNING
The financial position of Memphis City Schools remains stable as a result of the District’s conservative budgeting methodology and its ability to maintain disciplined spending practices. To ensure the Districts spending remains sound, the District has implemented and continues to explore new opportunities for cost savings, cost avoidance and revenue generation. The District has not developed a long-term financial plan because it is, by law, scheduled to merge with Shelby County Schools effective with the FY 2013-14 school year. In conjuction with the merger, Memphis City Schools is working with Shelby County Schools, and the Transition Planning Commission to explore functional and financial consolidation opportunities that will lead to a long-term financial plan for the Unified School District. NEWLY ADOPTED FINANCIAL POLICY Fund Balance and Expenditure of Funds – The policy was adopted to specify the size and composition of the District’s financial reserve and identify certain requirements for replenishing any fund balance reserves utilized and to establish a spending prioritization of find balance in

16
Breakthrough Leadership. Breakthrough Results.
accordance with standards established by the Government Accounting Standards Board (GASB).
Acknowledgments: The preparation of this report was accomplished through the commitment, dedication, and tireless effort of the entire Department of Finance. We would also like to extend our thanks to other school district and nonschool district personnel who assisted in the preparation of this report. Respectfully submitted,
Kriner Cash, Ed.D. Pamela Anstey Nancy Richie Superintendent of Schools Chief Financial Officer Executive Director,
Fiscal Services
Krinereeerrerereeerreeeeerereeeeereeeeeereeeeeeereeeeeeeeeeee CC CCCCCCCCCCCCCCCCCCCCCCCCCCCCCCCCCCCCCCCCCCCCCCCCCCCCCCCCCCCCCCCCCCCCCCCCCCCCCCCCCCCCCCCCCCCCCCCCCCCCCCCCCCCCCCCCCCCCCCCCCCCCCCCCCCCCCCCCCash, EEEEEEEEEEEEEEEEEEEEEEEEEEEEEEEEEEEEEEEEEEEEEEEEEEEEEEEEEEEEEEEEEEEEEEEEEEEEEdd.dddddddddddddddddddddddddddddddddddddddddddddddddddddddddddddddddddddddddddddddddddddd D.DDDDDDDDDDDDDDDDDDDDDDDDDDDDDDDDDDDDDDDDDDDDDDDDDDDDDDDDDDDDDDDDDDDDDDDDDDDDDDDDDDDDDDDDDDDDDDDDDSuperintenennnnnnnnnnnnnnnnnnnnnnnnnnnnnnnnnnnnnnnnnnnnnnnnnnnnnnnnnnnnnnnnnnndedededddededdeddeddedddddedededdddddddddeddddedddddddddeddddddddddddedddedddedddddedeeeedeedddddedddddedddeeeeent of Scho
17
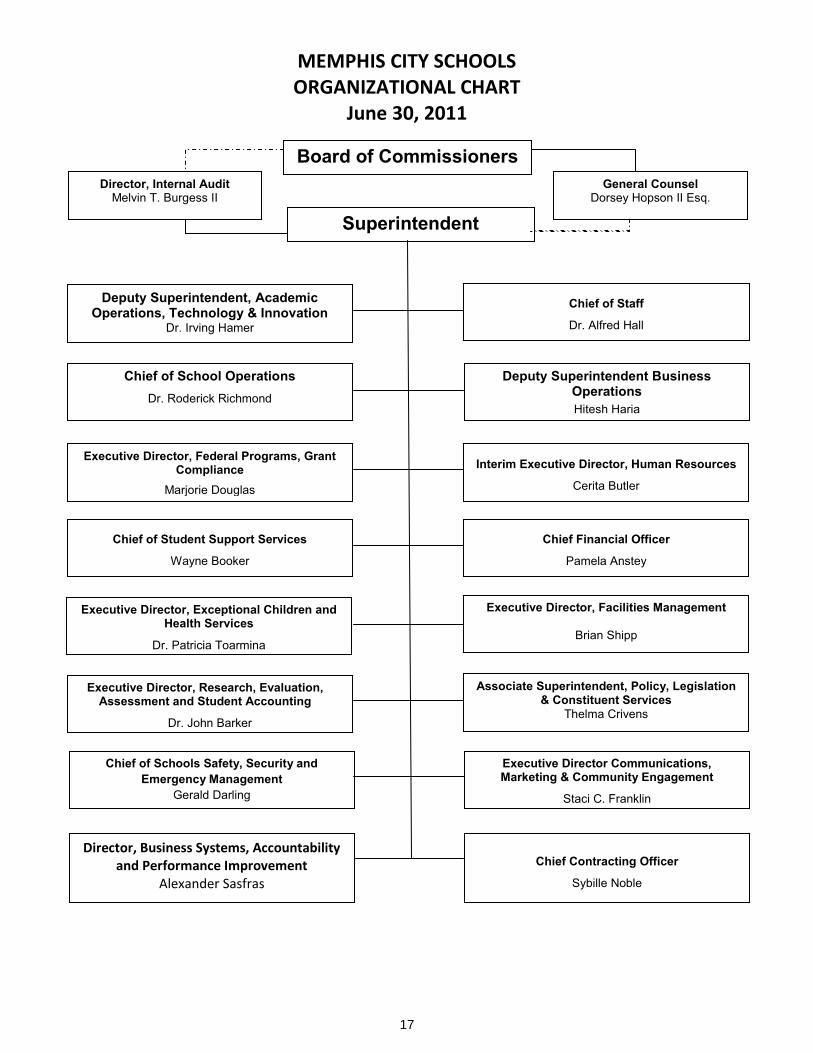
Organizational Chart MEMPHIS CITY SCHOOLS ORGANIZATIONAL CHART
June 30, 2011
General CounselDorsey Hopson II Esq.
Director, Internal AuditMelvin T. Burgess II
Board of Commissioners
Superintendent
General CounselDorsey Hopson II Esq.
Director, Internal AuditMelvin T. Burgess II
Deputy Superintendent Business OperationsHitesh Haria
Chief of School OperationsDr. Roderick Richmond
Deputy Superintendent, Academic Operations, Technology & Innovation
Dr. Irving Hamer
Director, Business Systems, Accountability and Performance Improvement
Alexander Sasfras
Chief of Schools Safety, Security and Emergency Management
Gerald Darling
Chief Contracting Officer
Sybille Noble
Executive Director, Research, Evaluation, Assessment and Student Accounting
Dr. John Barker
Executive Director Communications, Marketing & Community Engagement
Staci C. Franklin
Executive Director, Exceptional Children and Health Services
Dr. Patricia Toarmina
Associate Superintendent, Policy, Legislation & Constituent Services
Thelma Crivens
Chief of Student Support Services
Wayne Booker
Executive Director, Facilities Management
Brian Shipp
Executive Director, Federal Programs, Grant Compliance
Marjorie Douglas
Chief Financial Officer
Pamela Anstey
Interim Executive Director, Human Resources
Cerita Butler
Chief of Staff
Dr. Alfred Hall
18
District Officials
Memphis City Schools
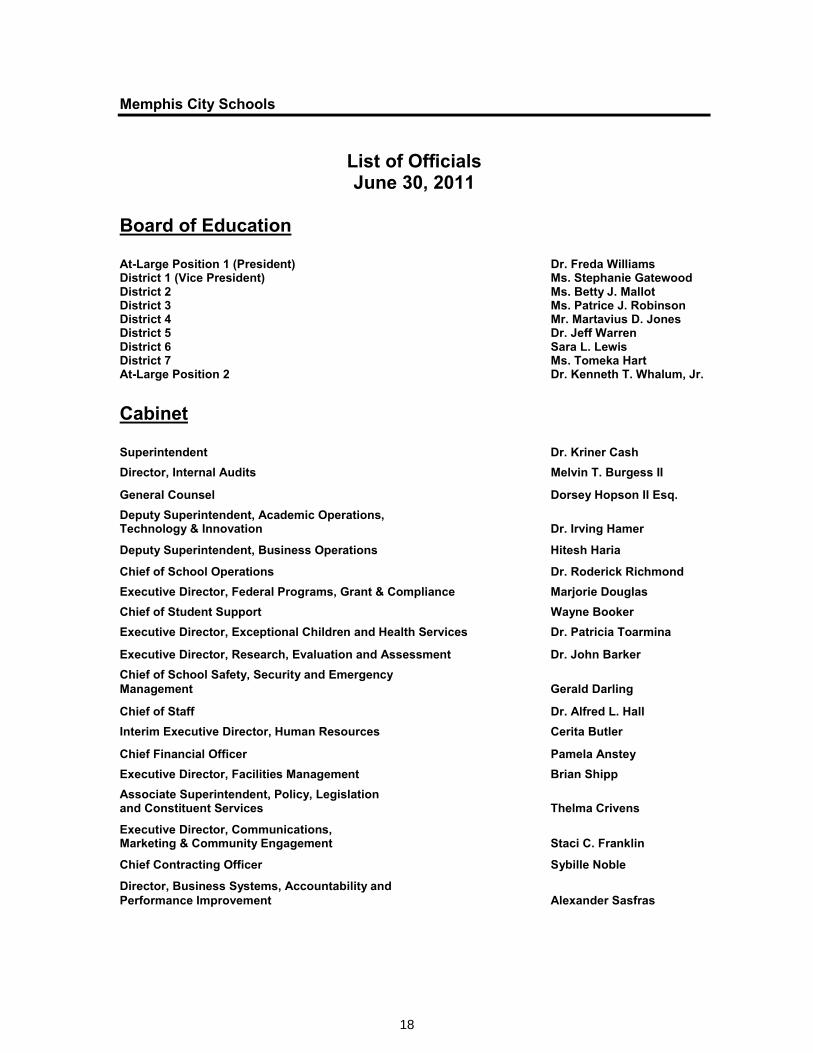
List of OfficialsJune 30, 2011
Board of Education
At-Large Position 1 (President) Dr. Freda WilliamsDistrict 1 (Vice President) Ms. Stephanie GatewoodDistrict 2 Ms. Betty J. MallotDistrict 3 Ms. Patrice J. RobinsonDistrict 4 Mr. Martavius D. JonesDistrict 5 Dr. Jeff WarrenDistrict 6 Sara L. LewisDistrict 7 Ms. Tomeka HartAt-Large Position 2 Dr. Kenneth T. Whalum, Jr.
Cabinet
Superintendent Dr. Kriner CashDirector, Internal Audits Melvin T. Burgess II
General Counsel Dorsey Hopson II Esq.Deputy Superintendent, Academic Operations,Technology & Innovation Dr. Irving Hamer
Deputy Superintendent, Business Operations Hitesh Haria
Chief of School Operations Dr. Roderick RichmondExecutive Director, Federal Programs, Grant & Compliance Marjorie DouglasChief of Student Support Wayne BookerExecutive Director, Exceptional Children and Health Services Dr. Patricia Toarmina
Executive Director, Research, Evaluation and Assessment Dr. John BarkerChief of School Safety, Security and EmergencyManagement Gerald Darling
Chief of Staff Dr. Alfred L. HallInterim Executive Director, Human Resources Cerita Butler
Chief Financial Officer Pamela AnsteyExecutive Director, Facilities Management Brian ShippAssociate Superintendent, Policy, Legislationand Constituent Services Thelma Crivens
Executive Director, Communications,Marketing & Community Engagement Staci C. Franklin
Chief Contracting Officer Sybille Noble
Director, Business Systems, Accountability and Performance Improvement Alexander Sasfras

19
FINANCIAL SECTION
Financial Section

20
21
Independent Auditor’s Report
INDEPENDENT AUDITOR’S REPORT
To the Chairman and Members of the Board of Education of the Memphis City Schools Memphis, Tennessee
We have audited the accompanying financial statements of the governmental activities, each major fund, the aggregate remaining fund information, and the budgetary comparison for the general fund and special revenue – categorically aided fund of the Board of Education of the Memphis City Schools (the Board) (a component unit of the City of Memphis, Tennessee) as of and for the year ended June 30, 2011, which collectively comprise the Board’s basic financial statements as listed in the table of contents. These financial statements are the responsibility of the Board’s management. Our responsibility is to express opinions on these financial statements based on our audit.
We conducted our audit in accordance with auditing standards generally accepted in the United States of America and the standards applicable to financial audits contained in Government Auditing Standards,issued by the Comptroller General of the United States. Those standards require that we plan and perform the audit to obtain reasonable assurance about whether the financial statements and schedules are free of material misstatement. An audit includes examining, on a test basis, evidence supporting the amounts and disclosures in the financial statements. An audit also includes assessing the accounting principles used and the significant estimates made by management, as well as evaluating the overall financial statement presentation. We believe that our audit provides a reasonable basis for our opinions.
In our opinion, the financial statements referred to above present fairly, in all material respects, the respective financial position of the governmental activities, each major fund, and remaining fund information of the Board of Education of the Memphis City Schools, as of June 30, 2011, and the respective changes in financial position and cash flows, where applicable, thereof and the budgetary comparisons for the general fund and special revenue – categorically aided fund for the year then ended in conformity with accounting principles generally accepted in the United States of America.
In accordance with Government Auditing Standards, we have also issued our report dated December 22, 2011, on our consideration of the Board’s internal control over financial reporting and on our tests of its compliance with certain provisions of laws, regulations, contracts and grant agreements and other matters. The purpose of that report is to describe the scope of our testing of internal control over financial reporting and compliance and the results of that testing, and not to provide an opinion on the internal control over financial reporting or on compliance. That report is an integral part of an audit performed in accordance with Government Auditing Standards and should be considered in assessing the results of our audit.
22
Accounting principles generally accepted in the United States of America require that the management’s discussion and analysis on pages 23 through 38 be presented to supplement the basic financial statements. Such information, although not a part of the basic financial statements, is required by the Governmental Accounting Standards Board, who considers it to be an essential part of financial reporting for placing the basic financial statements in an appropriate operational, economic, or historical context. We have applied certain limited procedures to the required supplementary information in accordance with auditing standards generally accepted in the United States of America, which consisted of inquiries of management about the methods of preparing the information and comparing the information for consistency with management’s responses to our inquiries, the basic financial statements, and other knowledge we obtained during our audit of the basic financial statements. We do not express an opinion or provide any assurance on the information because the limited procedures do not provide us with sufficient evidence to express an opinion or provide any assurance.
Our audit was conducted for the purpose of forming opinions on the financial statements that collectively comprise the Board’s basic financial statements as a whole. The introductory section, combining and individual fund statements and schedules, and statistical section, are presented for purposes of additional analysis and are not a required part of the financial statements. The accompanying schedule of expenditures of federal awards is presented for the purposes of additional analysis as required by the U.S. Office of Management and Budget Circular A-133, Audits of States, Local Governments, and Non-profit Organizations, and is also not a required part of the financial statements. The combining and individual fund statements and schedules and the schedule of expenditures of federal awards are the responsibility of management and were derived from and relate directly to the underlying accounting and other records used to prepare the financial statements. The information has been subjected to the auditing procedures applied in the audit of the financial statements and certain additional procedures, including comparing and reconciling such information directly to the underlying accounting and other records used to prepare the financial statements or to the financial statements themselves, and other additional procedures in accordance with auditing standards generally accepted in the United State of America. In our opinion, the information is fairly stated in all material respects in relation to the financial statements as a whole. The introductory and statistical sections have not been subjected to the auditing procedures applied in the audit of the basic financial statements and, accordingly, we do not express an opinion or provide any assurance on them.
Memphis, Tennessee December 22, 2011 ���
23
Management’s Discussion and Analysis Board of Education of the
Management Discussion and Analysis Memphis City Schools
As management of Memphis City Schools, we offer readers of the school district’s financial statements this narrative overview and analysis of the financial activities of Memphis City Schools for the fiscal year ended June 30, 2011. Comparative financial information is reported for the fiscal year ended June 30, 2010. The intent of this discussion and analysis is to look at the school district’s financial performance as a whole, or as an entire operating entity. Readers should also review the transmittal letter found at the front of this report in conjunction with basic financial statements and notes to enhance their understanding of the school district’s financial performance.
Financial Highlights
� Total assets of the school district exceeded its liabilities at June 30, 2011 by $899.5 million (net assets).
� Net assets decreased from fiscal year 2010 by $57.8 million or 6.04% primarily due to the OPEB annual required contribution (ARC).
� As a result of the ARC, the school district’s unrestricted liabilities exceeded its unrestricted assets by $197.5 million for the year.
� At June 30, 2011, the school district’s total general operating fund balance was $120.6 million or 13.91% of total general fund expenditures.
� Unassigned fund balance for the General Fund was $45.6 million or 5.26% of total General Fund expenditures, a increase of $31.1 million from the previous year. This amount is available to balance future budgets.
� Fund balance in the Capital Projects fund was $44.9 million, or 68.75% of expenditures, which was a decrease of $32.7 million for the year.
� Fund balance in the Categorically Aided fund was $10.6 million, or 5.51% of expenditures, which was a decrease of $1.5 million for the year.
� Fund balance for the Food Service fund was $21.5 million, or 39.58% of total expenditures for the year, which was an increase of $2.6 million for the year.
Overview of the Financial Statements
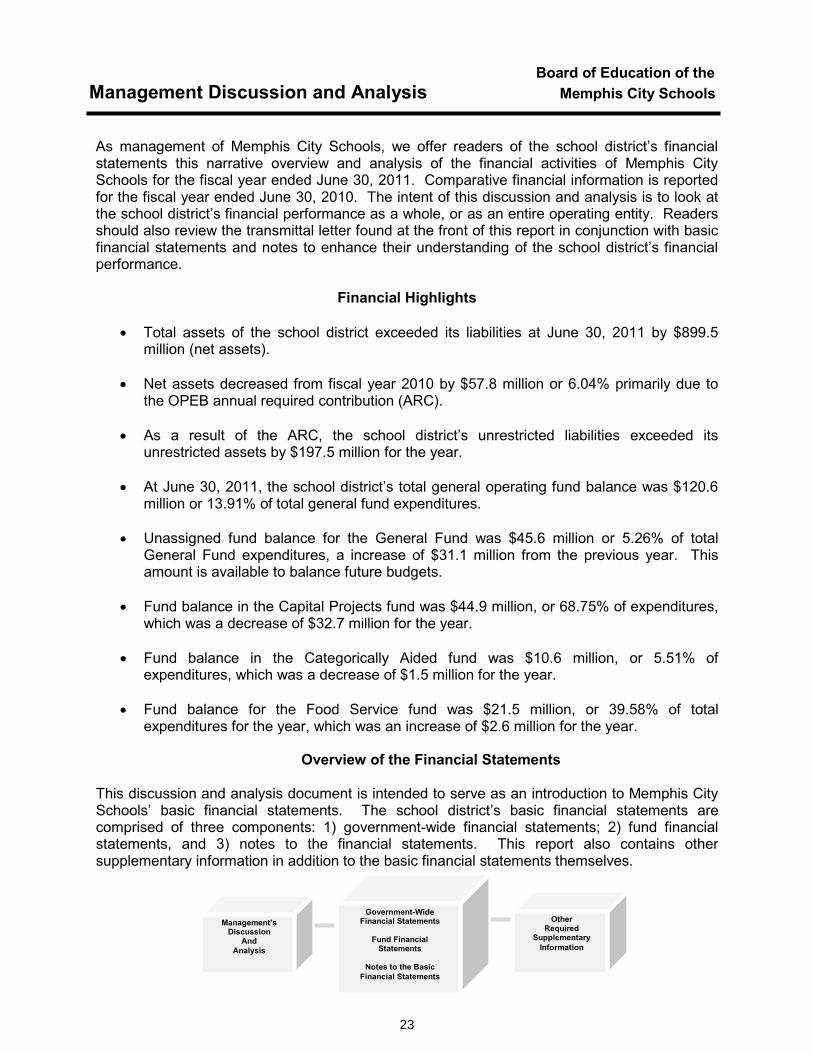
This discussion and analysis document is intended to serve as an introduction to Memphis City Schools’ basic financial statements. The school district’s basic financial statements arecomprised of three components: 1) government-wide financial statements; 2) fund financial statements, and 3) notes to the financial statements. This report also contains other supplementary information in addition to the basic financial statements themselves.
Management’sDiscussion
AndAnalysis
Government-WideFinancial Statements
Fund FinancialStatements
Notes to the BasicFinancial Statements
OtherRequired
SupplementaryInformation

24
Board of Education of the Management Discussion and Analysis Memphis City Schools
Government-wide Financial Statements. The government-wide financial statements are designed to provide readers with a broad overview of Memphis City Schools’ finances, in a manner similar to a private-sector business. The statements then proceed to provide an increasingly detailed look at specific financial activities.
The statement of net assets provides information on all of the assets and liabilities of the whole school district with the difference between the two reported as net assets, using the accrual basis of accounting used by most private sector companies. Over time, increases or decreases in net assets may serve as a useful indicator of how we did financially during the year.
The statement of activities presents information showing how the school district’s net assets changed during the most recent fiscal year. All changes in net assets are reported as soon as the underlying event giving rise to the change occurs, regardless of the timing of the related cash flows. Thus, revenues and expenses are reported in this statement for some items that will only result in cash flows in future fiscal periods (e.g., uncollected taxes and earned but unused vacation leave).
Fund Financial Statements. A fund is a grouping of related accounts. Funds are used to maintain control over resources that have been segregated for specific activities or objectives. Memphis City Schools, like other state and local governments, uses fund accounting to ensure and demonstrate compliance with finance-related legal requirements. The school district uses many funds to account for a multitude of financial transactions. All of the funds of Memphis City Schools can be divided into three categories: governmental funds, proprietary funds, and fiduciary funds. These fund financial statements focus on the school district’s most significant funds.
Governmental Funds. Most of the school district’s activities are reported in governmental fund financial statements. These statements focus on how monies flow into and out of those funds and the balances left at year-end that are available for spending in the future periods. These funds are reported using an accounting method called modified accrual accounting, which measures cash and all other financial assets that can readily be converted to cash. The governmental fund statements provide a detailed short-term view of the school district’s general government operations and the basic services it provides. Governmental fund information helps you determine whether there are more or less financial resources that can be spent in the near future to finance educational programs. Because the focus of governmental funds is narrower than that of the government-wide financial statements, it is useful to compare the information presented for governmental funds with similar information presented for governmental activities in the government-wide financial statements. By doing so, readers may better understand the long-term impact of the government’s near-term decisions. Both the governmental fundsbalance sheet and the governmental funds statement of revenues, expenditures, and changes in fund balances provide a reconciliation to facilitate this comparison between governmental funds and governmental activities.
Memphis City Schools maintains four governmental funds. Information is presented separately in the governmental fund balance sheet and the governmental fund statement of revenues, expenditures, and changes in fund balances for the General Fund, Capital Projects Fund, and Categorically Aided Fund. The Categorically Aided Fund is comprised of two categories –federal and non-federal. The school district has one non-major fund, which is Food Service.
25
Board of Education of the Management Discussion and Analysis Memphis City Schools
Memphis City Schools adopts an annual appropriated budget for all its funds. Budgetary comparison statements have been provided to demonstrate compliance with budget.
Proprietary Funds. Memphis City Schools maintains one type of proprietary fund, the Internal Service Fund. Internal Service Funds are an accounting device used to accumulate and allocate costs internally among the district’s functions for its central services, self-insurance health and unemployment benefits. Because these services predominately benefit governmental rather than business-type functions, they have been included within governmental activities in the government-wide financial statements.
Fiduciary Funds. Fiduciary funds (or Trust and Agency Funds) are used to account for resources held for the benefit of parties outside the government. Fiduciary funds are not reflected in the government-wide financial statements because the resources of those funds are not available to support the school district’s own programs. Memphis City Schools holds the Local Pensioner’s Retirement investment accounts and the individual schools’ Student Activity funds in a fiduciary capacity.
Notes to the Financial Statements. The notes provide additional information that is essential to a full understanding of the data provided in the government-wide and fund financial statements.
Supplemental Information. In addition to the basic financial statements and accompanying notes, this report also presents certain required supplementary information regarding funding progress for retirement and other post retirement benefits.
Government-wide Financial Analysis
As noted earlier, net assets may serve over time as a useful indicator of a government’s financial position. The school district’s assets, as a whole, exceeded liabilities at June 30, 2011and 2010 by $899,511,590 and $957,327,164 respectively.
26
Board of Education of the Management Discussion and Analysis Memphis City Schools
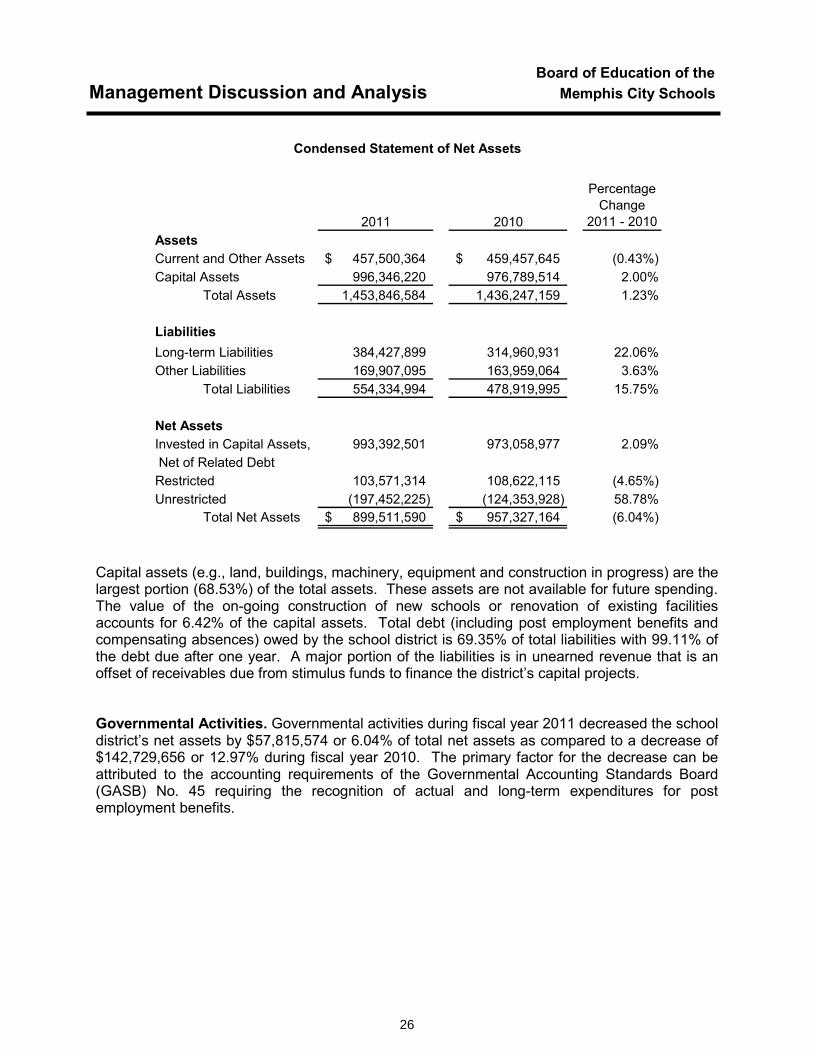
Condensed Statement of Net Assets
2011 2010
Percentage Change
2011 - 2010AssetsCurrent and Other Assets 457,500,364$ 459,457,645$ (0.43%)Capital Assets 996,346,220 976,789,514 2.00%
Total Assets 1,453,846,584 1,436,247,159 1.23%
LiabilitiesLong-term Liabilities 384,427,899 314,960,931 22.06%Other Liabilities 169,907,095 163,959,064 3.63%
Total Liabilities 554,334,994 478,919,995 15.75%
Net AssetsInvested in Capital Assets, 993,392,501 973,058,977 2.09% Net of Related DebtRestricted 103,571,314 108,622,115 (4.65%)Unrestricted (197,452,225) (124,353,928) 58.78%
Total Net Assets 899,511,590$ 957,327,164$ (6.04%)
Capital assets (e.g., land, buildings, machinery, equipment and construction in progress) are the largest portion (68.53%) of the total assets. These assets are not available for future spending. The value of the on-going construction of new schools or renovation of existing facilities accounts for 6.42% of the capital assets. Total debt (including post employment benefits and compensating absences) owed by the school district is 69.35% of total liabilities with 99.11% of the debt due after one year. A major portion of the liabilities is in unearned revenue that is an offset of receivables due from stimulus funds to finance the district’s capital projects.
Governmental Activities. Governmental activities during fiscal year 2011 decreased the school district’s net assets by $57,815,574 or 6.04% of total net assets as compared to a decrease of $142,729,656 or 12.97% during fiscal year 2010. The primary factor for the decrease can be attributed to the accounting requirements of the Governmental Accounting Standards Board (GASB) No. 45 requiring the recognition of actual and long-term expenditures for post employment benefits.
27
Board of Education of the Management Discussion and Analysis Memphis City Schools
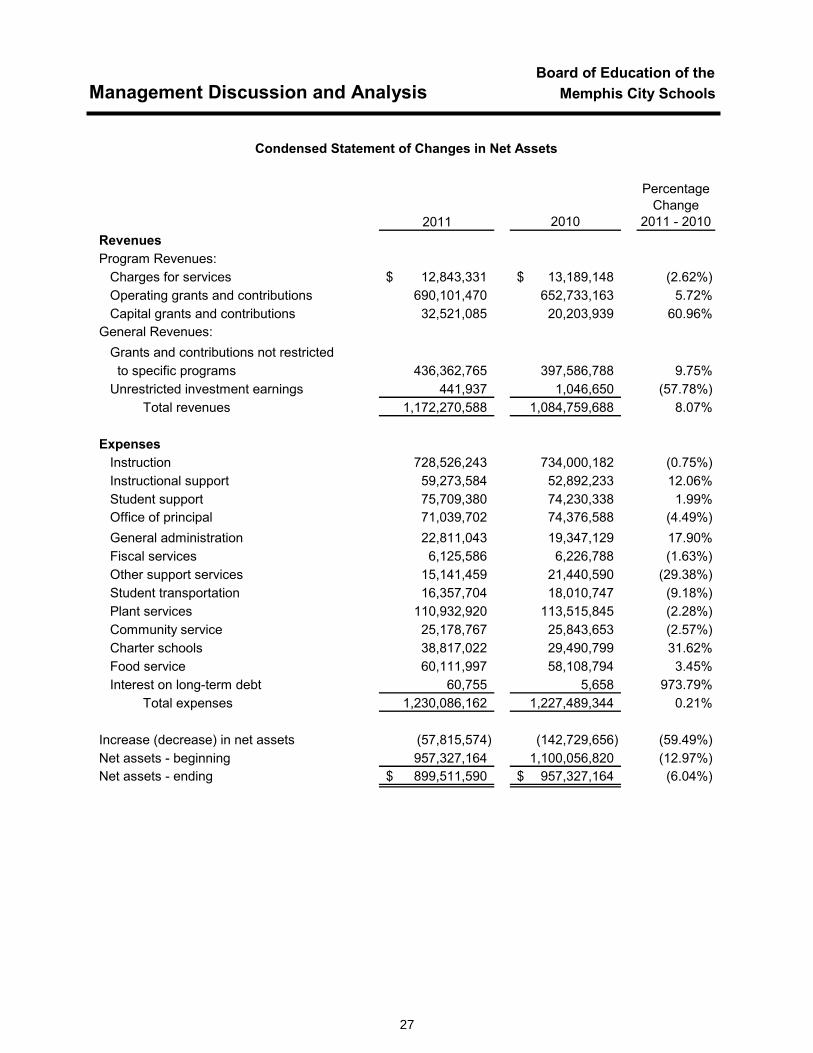
Condensed Statement of Changes in Net Assets
2011 2010
Percentage Change
2011 - 2010RevenuesProgram Revenues:
Charges for services 12,843,331$ 13,189,148$ (2.62%)Operating grants and contributions 690,101,470 652,733,163 5.72%Capital grants and contributions 32,521,085 20,203,939 60.96%
General Revenues:Grants and contributions not restricted to specific programs 436,362,765 397,586,788 9.75%Unrestricted investment earnings 441,937 1,046,650 (57.78%)
Total revenues 1,172,270,588 1,084,759,688 8.07%
ExpensesInstruction 728,526,243 734,000,182 (0.75%)Instructional support 59,273,584 52,892,233 12.06%Student support 75,709,380 74,230,338 1.99%Office of principal 71,039,702 74,376,588 (4.49%)General administration 22,811,043 19,347,129 17.90%Fiscal services 6,125,586 6,226,788 (1.63%)Other support services 15,141,459 21,440,590 (29.38%)Student transportation 16,357,704 18,010,747 (9.18%)Plant services 110,932,920 113,515,845 (2.28%)Community service 25,178,767 25,843,653 (2.57%)Charter schools 38,817,022 29,490,799 31.62%Food service 60,111,997 58,108,794 3.45%Interest on long-term debt 60,755 5,658 973.79%
Total expenses 1,230,086,162 1,227,489,344 0.21%
Increase (decrease) in net assets (57,815,574) (142,729,656) (59.49%)Net assets - beginning 957,327,164 1,100,056,820 (12.97%)Net assets - ending 899,511,590$ 957,327,164$ (6.04%)
28
Board of Education of the Management Discussion and Analysis Memphis City Schools
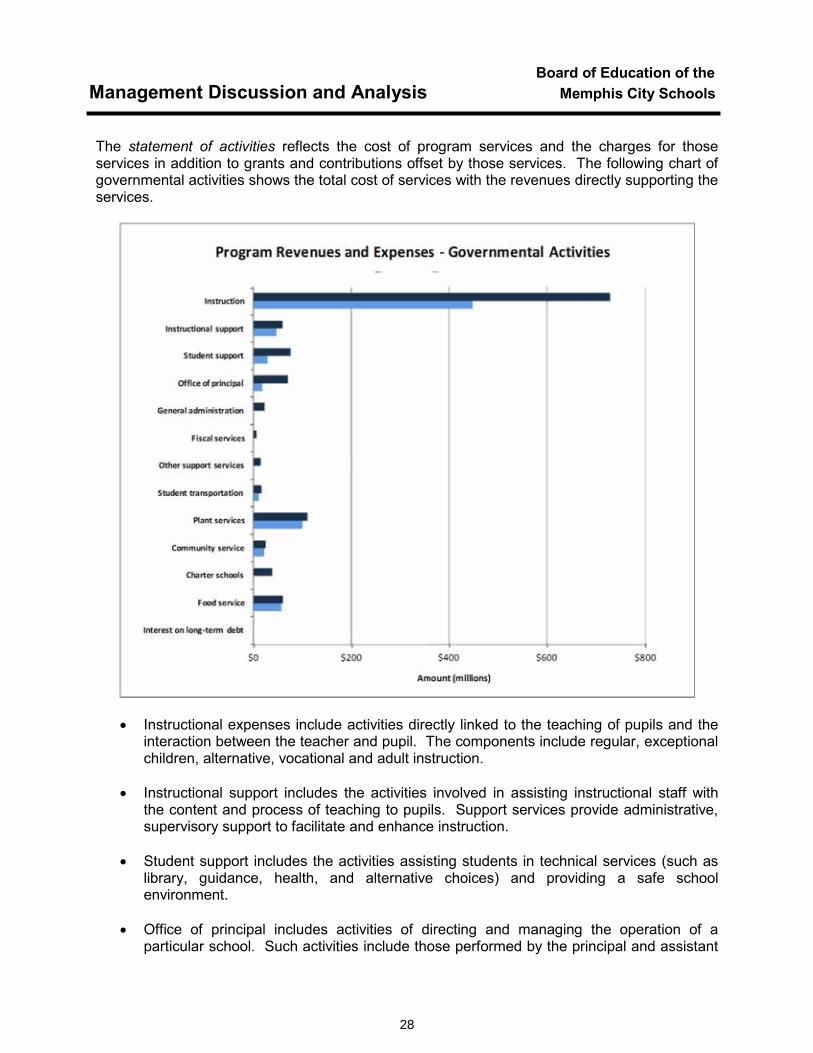
The statement of activities reflects the cost of program services and the charges for those services in addition to grants and contributions offset by those services. The following chart of governmental activities shows the total cost of services with the revenues directly supporting the services.
� Instructional expenses include activities directly linked to the teaching of pupils and the interaction between the teacher and pupil. The components include regular, exceptional children, alternative, vocational and adult instruction.
� Instructional support includes the activities involved in assisting instructional staff with the content and process of teaching to pupils. Support services provide administrative, supervisory support to facilitate and enhance instruction.
� Student support includes the activities assisting students in technical services (such as library, guidance, health, and alternative choices) and providing a safe school environment.
� Office of principal includes activities of directing and managing the operation of a particular school. Such activities include those performed by the principal and assistant
29
Board of Education of the Management Discussion and Analysis Memphis City Schools
principal while they supervise all operations of the school, evaluate staff, assign duties to staff, supervise and maintain the records of the school, and coordinate school instructional activities with those of the total school system. These activities also include the work of secretarial and clerical staff in support of the teaching and administrative duties.
� General administration includes the Board of Education and Office of the Superintendent. Activities are centered on establishing and administering policy for operating the LEA. Other general services include commission fees assessed by the County Trustee for tax collection; external audit and legal services; and administrative supervision of the district and communications.
� Fiscal services include activities involving all aspects of budgeting and financial reporting; financial and property accounting; payroll and tax reporting; managing of funds; purchasing, receipts and disbursements; and internal auditing.
� Other support services provide non-instructional services to students and staff by the Human Resources and Information Technology Divisions.
� Student transportation includes activities involved with the conveyance of students for regular, vocational and special educational instruction to and from school, as well as school activities, as provided by state and federal law.
� Plant services supports keeping of the school grounds, buildings, and equipment in an effective working condition and state of repair.
� Community services include community development programs for Memphis City Schools, which promote the district and its objectives. It also includes Early Childhood Development, Parental Involvement, Volunteer Services and Innovation and Planning.
� In accordance with TCA 49-13-106, charter schools are transferred state and local revenues based on an average daily membership of the expenditures of the district. Twenty-two charter schools were active in fiscal year 2011.
� Food service includes the preparation, delivery, and servicing of lunches, snacks and other incidental meals to students and school staff in connection with school activities.
� Interest on long-term debt provides for the payment of interest and other related charges of debt with the school district.
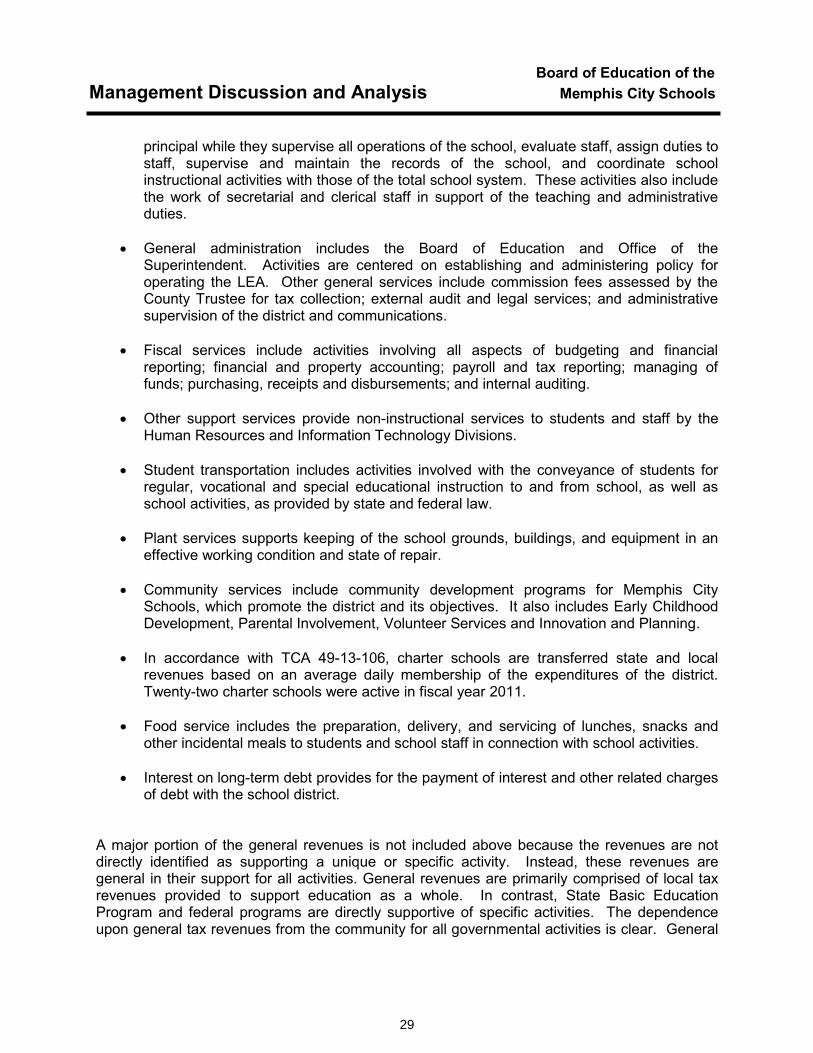
A major portion of the general revenues is not included above because the revenues are not directly identified as supporting a unique or specific activity. Instead, these revenues are general in their support for all activities. General revenues are primarily comprised of local tax revenues provided to support education as a whole. In contrast, State Basic Education Program and federal programs are directly supportive of specific activities. The dependence upon general tax revenues from the community for all governmental activities is clear. General
30
Board of Education of the Management Discussion and Analysis Memphis City Schools
tax revenues support 30.13% of the governmental activities. A breakdown of revenues by source is presented below.
Food service4.87%
Community service1.84%
Plant services8.52%
Student transportation1.00%
Other support services0.10%
Fiscal services0.01%
General administration0.03%
Office of principal1.55%
Student support2.52%
Instructional support4.02%
Instruction38.28%
Grants and contributions (non-restrictive)
37.22%
Unrestricted investment earnings0.04%
Revenues by Source - Governmental Activities
Financial Analysis of the Government’s Funds
As noted earlier, Memphis City Schools uses fund accounting to ensure and demonstrate compliance with finance-related legal requirements.
Governmental Funds. The focus of Memphis City Schools’ governmental funds is to provide information on near-term inflows, outflows, and balances of spendable resources. Such information is useful in assessing the school district’s financing requirements. In particular, unassigned fund balance may serve as a useful measure of a government’s net resources available for spending at the end of the fiscal year.
In compliance with GASB Standard No. 54, the district has changed the fund balance classifications. The purpose of this standard is to provide clearer fund balance classifications that can be more consistently applied and by clarifying the existing governmental fund type definitions. This standard establishes fund balance categories in a hierarchy based primarily on the extent to which a government is bound to observe constraints imposed upon the use of the resources reported in governmental funds. The classifications are restricted, committed,
31
Board of Education of the Management Discussion and Analysis Memphis City Schools
assigned, and unassigned that identify the order of constraints that control how specific amounts can be spent. Explanations of the classifications and the fund balance policy are presented in Notes to the Financial Statements Note 1 under “Equity Classifications” and Note 14.
As of the end of the current fiscal year, Memphis City Schools’ governmental funds reported a combined ending fund balance of $197,601,358. The components of the balances are:
June 30, 2011 June 30, 2010
PercentageChange
2011 - 2010General Fund 120,595,643$ 94,905,699$ 27.07%Categorically Aided Fund 10,610,888 12,148,613 (12.66%)Food Service Fund 21,451,083 18,803,355 14.08% Total, except Capital Projects Fund 152,657,614 125,857,667 21.29%Capital Projects 44,943,744 77,670,147 (42.14%) Total all government funds 197,601,358$ 203,527,814$ (2.91%)
There was a $26.8 million increase in fund balance excluding capital projects that included an increase of $25.7 million in the general fund, a decrease of $1.5 million in the Categorically Aided Fund, and a $2.6 million increase in the Food Service Fund. There was a $32.7 million decrease in the Capital Projects Fund. The changes are discussed in the following fund sections.
Major Funds
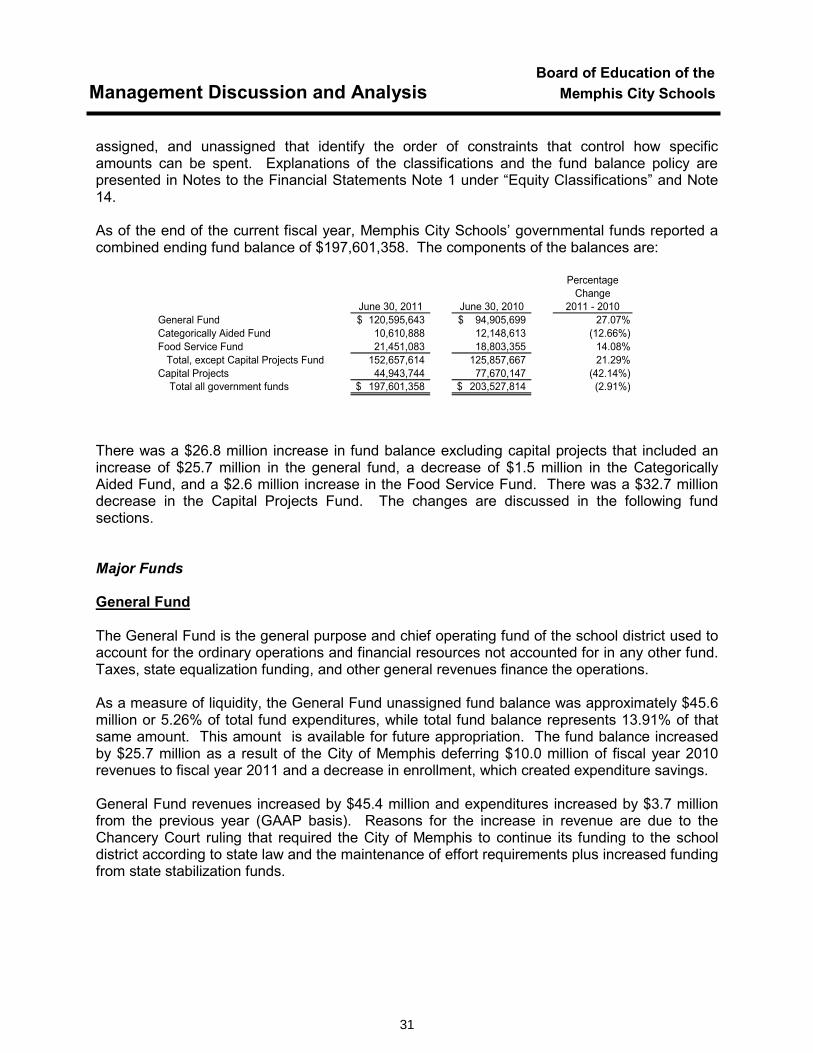
General Fund
The General Fund is the general purpose and chief operating fund of the school district used to account for the ordinary operations and financial resources not accounted for in any other fund.Taxes, state equalization funding, and other general revenues finance the operations.
As a measure of liquidity, the General Fund unassigned fund balance was approximately $45.6 million or 5.26% of total fund expenditures, while total fund balance represents 13.91% of that same amount. This amount is available for future appropriation. The fund balance increasedby $25.7 million as a result of the City of Memphis deferring $10.0 million of fiscal year 2010 revenues to fiscal year 2011 and a decrease in enrollment, which created expenditure savings.
General Fund revenues increased by $45.4 million and expenditures increased by $3.7 millionfrom the previous year (GAAP basis). Reasons for the increase in revenue are due to theChancery Court ruling that required the City of Memphis to continue its funding to the school district according to state law and the maintenance of effort requirements plus increased funding from state stabilization funds.
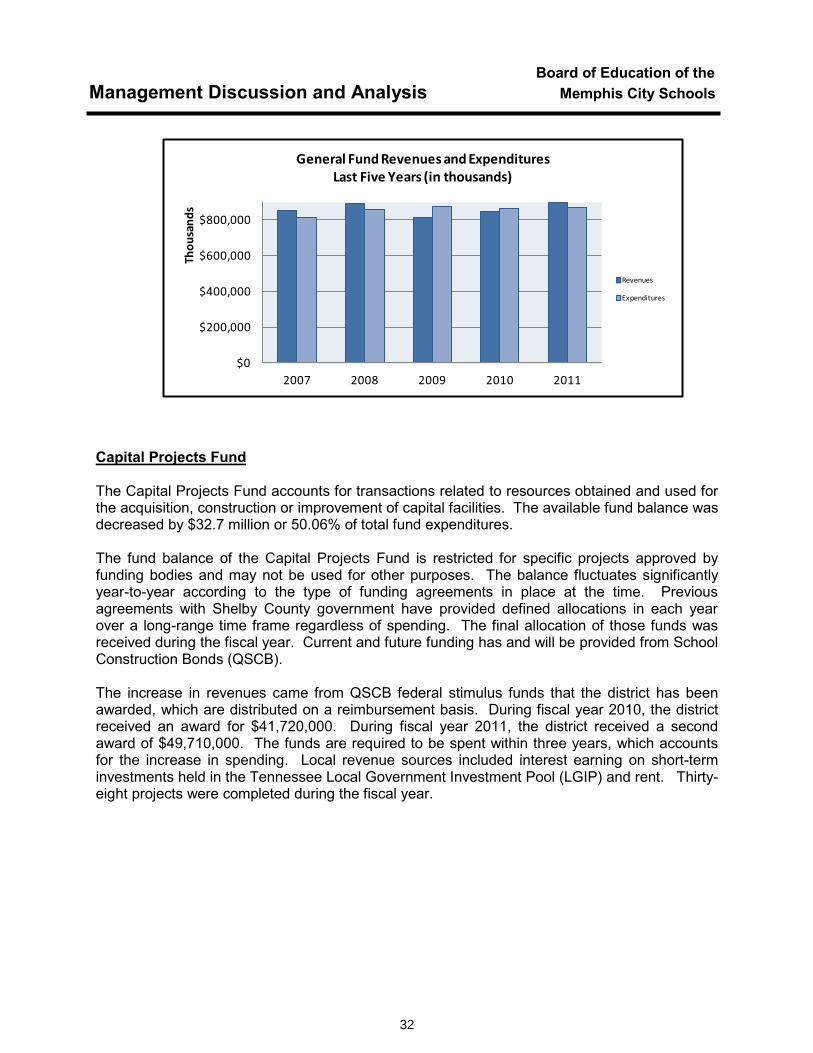
32
Board of Education of the Management Discussion and Analysis Memphis City Schools
$0
$200,000
$400,000
$600,000
$800,000
2007 2008 2009 2010 2011
Thou
sand
s
General Fund Revenues and ExpendituresLast Five Years (in thousands)
Revenues
Expenditures
Capital Projects Fund
The Capital Projects Fund accounts for transactions related to resources obtained and used for the acquisition, construction or improvement of capital facilities. The available fund balance was decreased by $32.7 million or 50.06% of total fund expenditures.
The fund balance of the Capital Projects Fund is restricted for specific projects approved by funding bodies and may not be used for other purposes. The balance fluctuates significantly year-to-year according to the type of funding agreements in place at the time. Previous agreements with Shelby County government have provided defined allocations in each year over a long-range time frame regardless of spending. The final allocation of those funds was received during the fiscal year. Current and future funding has and will be provided from School Construction Bonds (QSCB).
The increase in revenues came from QSCB federal stimulus funds that the district has been awarded, which are distributed on a reimbursement basis. During fiscal year 2010, the district received an award for $41,720,000. During fiscal year 2011, the district received a second award of $49,710,000. The funds are required to be spent within three years, which accounts for the increase in spending. Local revenue sources included interest earning on short-term investments held in the Tennessee Local Government Investment Pool (LGIP) and rent. Thirty-eight projects were completed during the fiscal year.
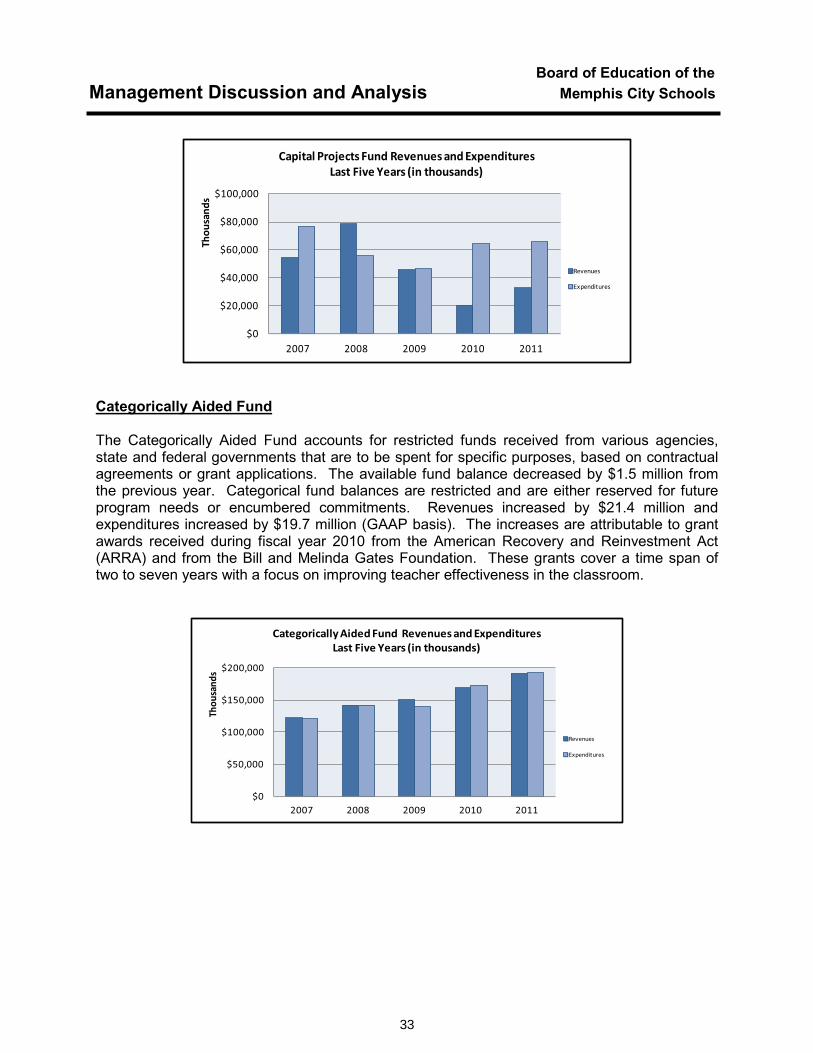
33
Board of Education of the Management Discussion and Analysis Memphis City Schools
$0
$20,000
$40,000
$60,000
$80,000
$100,000
2007 2008 2009 2010 2011
Thou
sand
s
Capital Projects Fund Revenues and ExpendituresLast Five Years (in thousands)
Revenues
Expenditures
Categorically Aided Fund
The Categorically Aided Fund accounts for restricted funds received from various agencies,state and federal governments that are to be spent for specific purposes, based on contractual agreements or grant applications. The available fund balance decreased by $1.5 million from the previous year. Categorical fund balances are restricted and are either reserved for future program needs or encumbered commitments. Revenues increased by $21.4 million and expenditures increased by $19.7 million (GAAP basis). The increases are attributable to grant awards received during fiscal year 2010 from the American Recovery and Reinvestment Act (ARRA) and from the Bill and Melinda Gates Foundation. These grants cover a time span of two to seven years with a focus on improving teacher effectiveness in the classroom.
$0
$50,000
$100,000
$150,000
$200,000
2007 2008 2009 2010 2011
Thou
sand
s
Categorically Aided Fund Revenues and ExpendituresLast Five Years (in thousands)
Revenues
Expenditures
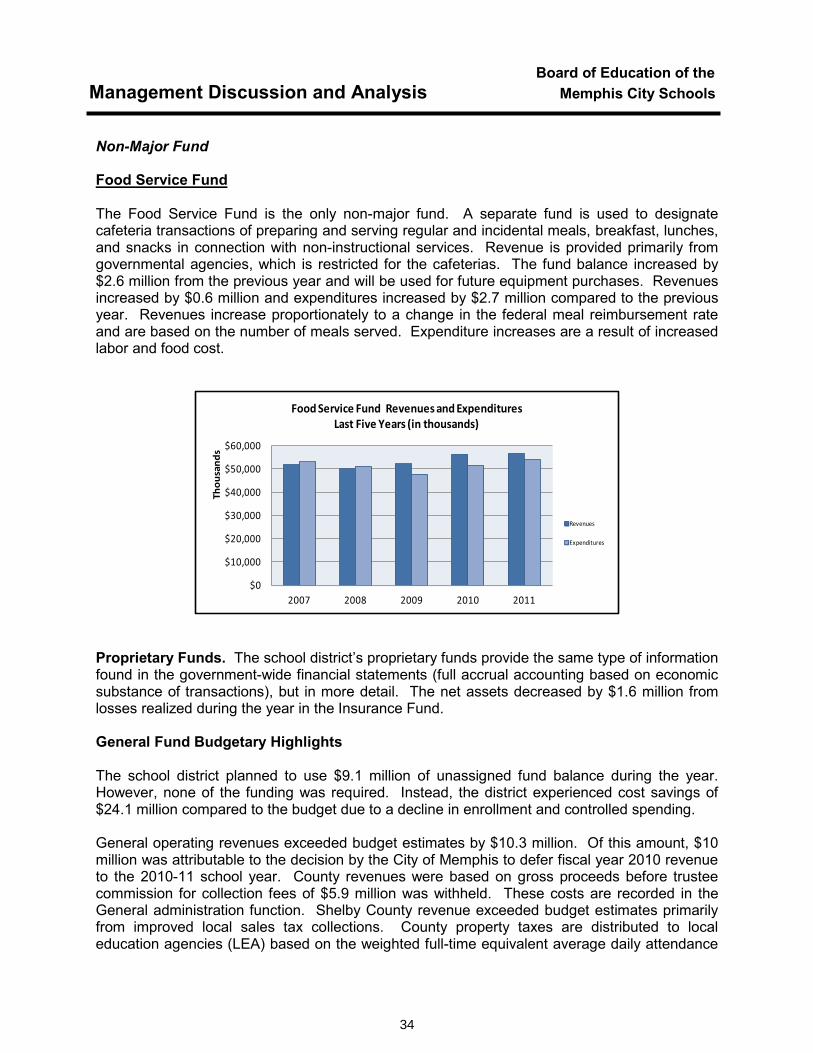
34
Board of Education of the Management Discussion and Analysis Memphis City Schools
Non-Major Fund
Food Service Fund
The Food Service Fund is the only non-major fund. A separate fund is used to designate cafeteria transactions of preparing and serving regular and incidental meals, breakfast, lunches, and snacks in connection with non-instructional services. Revenue is provided primarily from governmental agencies, which is restricted for the cafeterias. The fund balance increased by $2.6 million from the previous year and will be used for future equipment purchases. Revenues increased by $0.6 million and expenditures increased by $2.7 million compared to the previous year. Revenues increase proportionately to a change in the federal meal reimbursement rate and are based on the number of meals served. Expenditure increases are a result of increased labor and food cost.
$0
$10,000
$20,000
$30,000
$40,000
$50,000
$60,000
2007 2008 2009 2010 2011
Tho
usa
nd
s
Food Service Fund Revenues and ExpendituresLast Five Years (in thousands)
Revenues
Expenditures
Proprietary Funds. The school district’s proprietary funds provide the same type of information found in the government-wide financial statements (full accrual accounting based on economic substance of transactions), but in more detail. The net assets decreased by $1.6 million from losses realized during the year in the Insurance Fund.
General Fund Budgetary Highlights
The school district planned to use $9.1 million of unassigned fund balance during the year. However, none of the funding was required. Instead, the district experienced cost savings of $24.1 million compared to the budget due to a decline in enrollment and controlled spending.
General operating revenues exceeded budget estimates by $10.3 million. Of this amount, $10 million was attributable to the decision by the City of Memphis to defer fiscal year 2010 revenueto the 2010-11 school year. County revenues were based on gross proceeds before trustee commission for collection fees of $5.9 million was withheld. These costs are recorded in the General administration function. Shelby County revenue exceeded budget estimates primarily from improved local sales tax collections. County property taxes are distributed to local education agencies (LEA) based on the weighted full-time equivalent average daily attendance
35
Board of Education of the Management Discussion and Analysis Memphis City Schools
(WFTEADA) figures that are calculated between Memphis City Schools and Shelby County Schools. The estimated percentage used for budgeting was 68.70%. The actual rate was 69.06%, an increase from 68.67% for fiscal year 2010. The percentage increase was an anomaly since actual student membership decreased. Factors contributing to the percentage increase were improved attendance plus additional adult education students that factor into the equation.
Actual day student enrollment of 106,656, based on the 40-day end-of-month membership count, was down 1,261 students from projected enrollment figures of 107,917. Actual membership dropped 385 students from the previous year.
The variance between budget and actual revenues received from the State occurred because the State planned to pay a non-recurring bonus to teachers dependant upon state sales tax collections. Since sales tax collections did not meet expectations, the bonus was not approved in October 2010 as planned. The bonus would have been a pass through to certified teachers.
General Fund expenditures were $24.1 million less than budget. Key factors contributing to the expenditure variance include:
� Salary and benefit savings of $9.3 million were realized from lapse-time created by firm cost containment of district-wide vacant positions; a drop in student membership; and the $4 million discontinued non-recurring certified teacher bonus from the State.
� Charter schools student enrollment was less than they projected and caused the $6.5 million variance.
� A savings of $650,000 in district property insurance in Plant Services was realized as a result of competitive pricing.
� Utility savings of $1.5 million were realized due to rate changes and installation of energy efficient HVAC systems.
� Transportation savings of $1 million were a result of strict monitoring of routes and zones.
� The set aside of $2 million for other potential uses in the Instructional function was not spent since the district did not receive additional revenues from unidentified sources.
� A spending freeze was enacted that generated a cost savings of $2.3 million in equipment and professional service categories spread throughout the functions.
Benefit costs in the General Fund were 33% of salaries – a three percent (3%) increase from the previous year as a result of an increase in the state retirement rate (district matching). Insurance costs account for approximately 49% of total benefits, down 2.3% from the previous year. Salary and benefit costs were approximately 83% of total expenditures, relatively unchanged from a year ago.
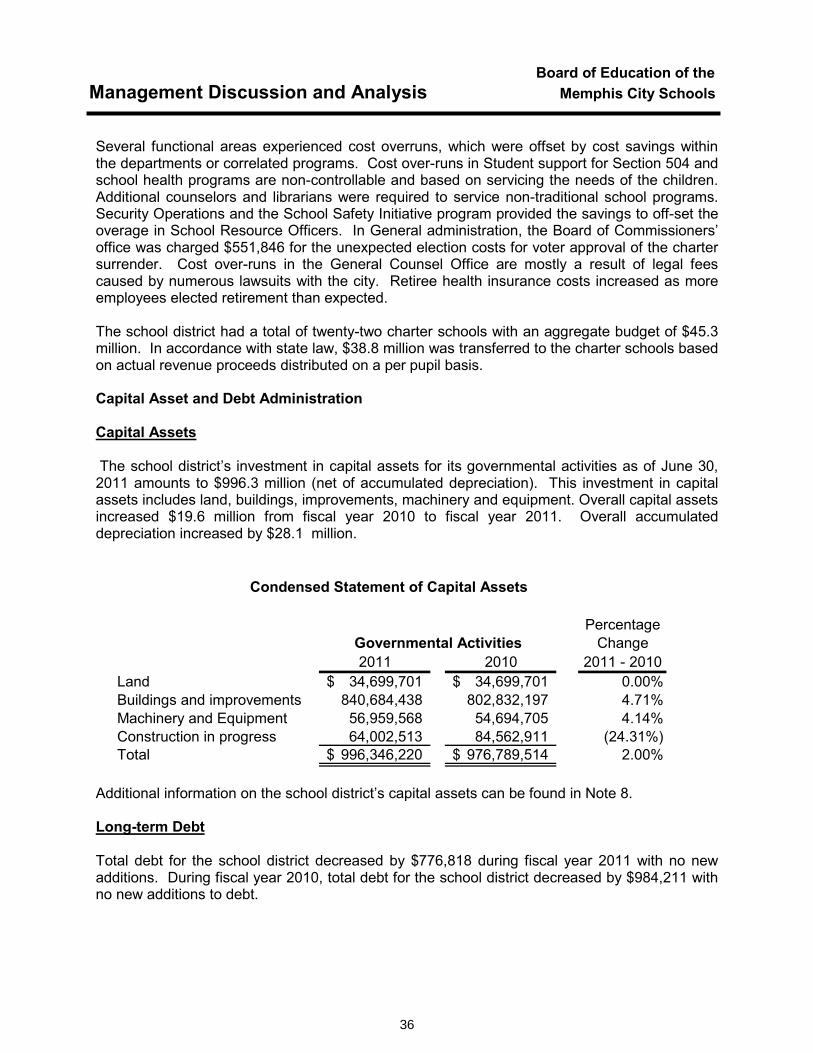
36
Board of Education of the Management Discussion and Analysis Memphis City Schools
Several functional areas experienced cost overruns, which were offset by cost savings within the departments or correlated programs. Cost over-runs in Student support for Section 504 and school health programs are non-controllable and based on servicing the needs of the children. Additional counselors and librarians were required to service non-traditional school programs. Security Operations and the School Safety Initiative program provided the savings to off-set the overage in School Resource Officers. In General administration, the Board of Commissioners’ office was charged $551,846 for the unexpected election costs for voter approval of the charter surrender. Cost over-runs in the General Counsel Office are mostly a result of legal fees caused by numerous lawsuits with the city. Retiree health insurance costs increased as more employees elected retirement than expected.
The school district had a total of twenty-two charter schools with an aggregate budget of $45.3million. In accordance with state law, $38.8 million was transferred to the charter schools based on actual revenue proceeds distributed on a per pupil basis.
Capital Asset and Debt Administration
Capital Assets
The school district’s investment in capital assets for its governmental activities as of June 30, 2011 amounts to $996.3 million (net of accumulated depreciation). This investment in capital assets includes land, buildings, improvements, machinery and equipment. Overall capital assets increased $19.6 million from fiscal year 2010 to fiscal year 2011. Overall accumulated depreciation increased by $28.1 million.
Condensed Statement of Capital Assets
PercentageGovernmental Activities Change2011 2010 2011 - 2010
Land 34,699,701$ 34,699,701$ 0.00%Buildings and improvements 840,684,438 802,832,197 4.71%Machinery and Equipment 56,959,568 54,694,705 4.14%Construction in progress 64,002,513 84,562,911 (24.31%)Total 996,346,220$ 976,789,514$ 2.00%
Additional information on the school district’s capital assets can be found in Note 8.
Long-term Debt
Total debt for the school district decreased by $776,818 during fiscal year 2011 with no new additions. During fiscal year 2010, total debt for the school district decreased by $984,211 with no new additions to debt.
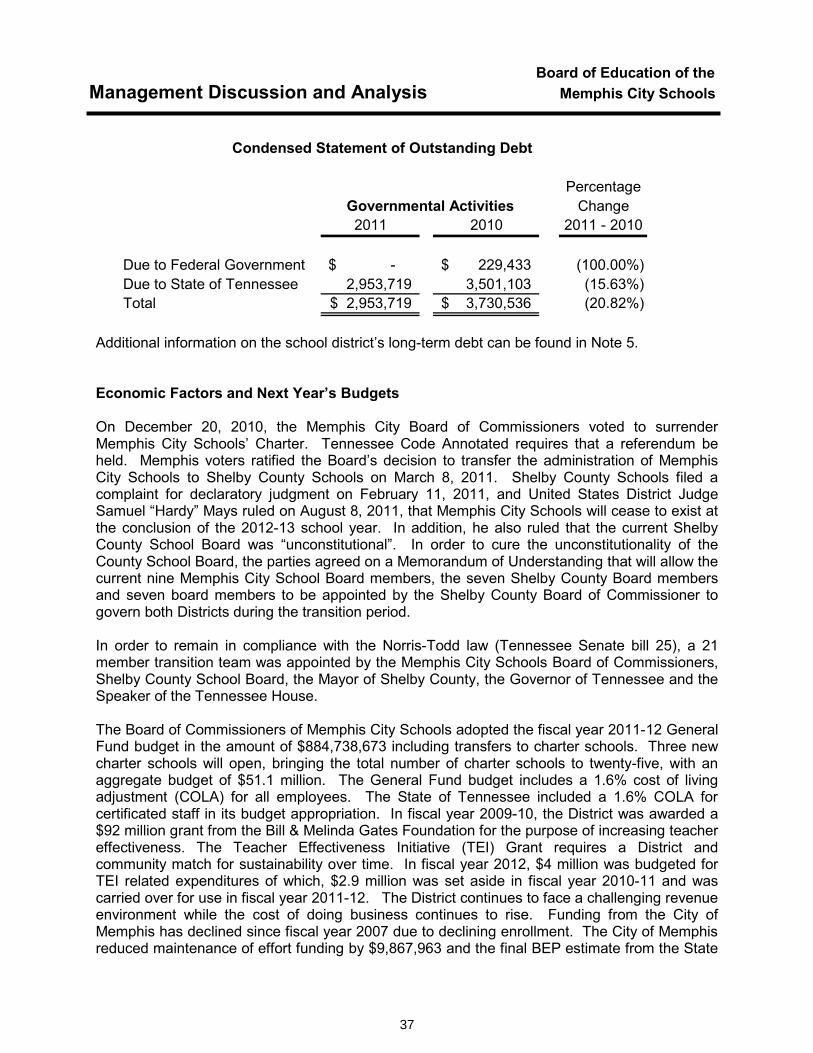
37
Board of Education of the Management Discussion and Analysis Memphis City Schools
Condensed Statement of Outstanding Debt
PercentageChange
2011 2010 2011 - 2010
Due to Federal Government -$ 229,433$ (100.00%)Due to State of Tennessee 2,953,719 3,501,103 (15.63%)Total 2,953,719$ 3,730,536$ (20.82%)
Governmental Activities
Additional information on the school district’s long-term debt can be found in Note 5.
Economic Factors and Next Year’s Budgets
On December 20, 2010, the Memphis City Board of Commissioners voted to surrender Memphis City Schools’ Charter. Tennessee Code Annotated requires that a referendum be held. Memphis voters ratified the Board’s decision to transfer the administration of Memphis City Schools to Shelby County Schools on March 8, 2011. Shelby County Schools filed a complaint for declaratory judgment on February 11, 2011, and United States District Judge Samuel “Hardy” Mays ruled on August 8, 2011, that Memphis City Schools will cease to exist at the conclusion of the 2012-13 school year. In addition, he also ruled that the current Shelby County School Board was “unconstitutional”. In order to cure the unconstitutionality of the County School Board, the parties agreed on a Memorandum of Understanding that will allow the current nine Memphis City School Board members, the seven Shelby County Board members and seven board members to be appointed by the Shelby County Board of Commissioner to govern both Districts during the transition period.
In order to remain in compliance with the Norris-Todd law (Tennessee Senate bill 25), a 21 member transition team was appointed by the Memphis City Schools Board of Commissioners, Shelby County School Board, the Mayor of Shelby County, the Governor of Tennessee and the Speaker of the Tennessee House.
The Board of Commissioners of Memphis City Schools adopted the fiscal year 2011-12 General Fund budget in the amount of $884,738,673 including transfers to charter schools. Three new charter schools will open, bringing the total number of charter schools to twenty-five, with an aggregate budget of $51.1 million. The General Fund budget includes a 1.6% cost of living adjustment (COLA) for all employees. The State of Tennessee included a 1.6% COLA for certificated staff in its budget appropriation. In fiscal year 2009-10, the District was awarded a $92 million grant from the Bill & Melinda Gates Foundation for the purpose of increasing teacher effectiveness. The Teacher Effectiveness Initiative (TEI) Grant requires a District and community match for sustainability over time. In fiscal year 2012, $4 million was budgeted for TEI related expenditures of which, $2.9 million was set aside in fiscal year 2010-11 and was carried over for use in fiscal year 2011-12. The District continues to face a challenging revenue environment while the cost of doing business continues to rise. Funding from the City of Memphis has declined since fiscal year 2007 due to declining enrollment. The City of Memphis reduced maintenance of effort funding by $9,867,963 and the final BEP estimate from the State
38
Board of Education of the Management Discussion and Analysis Memphis City Schools
was approximately $5.5 million lower than projected; as a result, the District continues to use fund balance. The Board of Commissioners approved the planned use of $18.3 million in unassigned fund balance to balance the operating budget, which includes the $2.9 million carry over for TEI.
Student enrollment is the primary driver of instruction and school expenditure budgets. The expenditure budget is basically a level service budget with reductions of approximately $54 million from the initial proposed budget. The reductions include changes to service delivery such as changes to the Board approved staffing formula for secondary grades. The District also adjusted staffing levels in schools for J.R.O.T.C., Driver Education, Optional Schools, World Languages, Specials Skills and Career and Technical Education. The District elected to adopt math textbooks for all grades, but will purchase textbooks for grades K-8. The District increased the single employee health contribution from 20% to 30% to align with the employee contribution for family coverage and eliminated the District’s contribution for Dental and Vision plans. The District plans to implement a Medicare Supplement for Medicare eligible retirees in fiscal year 2011-12. In addition, the District implemented a reduction in force and eliminated a net of 276.14 positions.
Shelby County funding of public education is based on an appropriated budget of $361,288,000 that caps the amount both school Districts can receive by adjusting proceeds from wheel taxes. Education’s share of property tax levy is expected to remain at $1.91 per $100 of assessed property value. Based on the funding cap, total educational funding is expected to remain flat for several years. The District’s share of the appropriation will be impacted by the weighted full-time equivalent average daily attendance (WFTEADA) figures that are calculated between Memphis City Schools and Shelby County Schools. Memphis City Schools’ 40 day end-of-month enrollment is expected to decrease slightly from 106,656 to 106,417 day students.
The Memphis City Council voted to approve Memphis City Schools’ budget provided that the revenues budgeted from all City of Memphis sources shall not exceed $68,407,842 in the aggregate. The District has negotiated a payment plan with the City of Memphis whereby the City will remit approximately $8.8 million due from prior years in the coming year.
Requests for Information
This financial report is designed to provide a general overview of the school district’s finances for all those with an interest in the government’s finances. Questions concerning any of the information provided in this report or request for additional financial information may be addressed to the Division of Fiscal Services, Room 226, Memphis City Schools, 2597 Avery Avenue, Memphis, Tennessee 38112.

39
BASIC FINANCIAL STATEMENTSGovernment-wide Financial Statements:
Basic Financial Statements

40
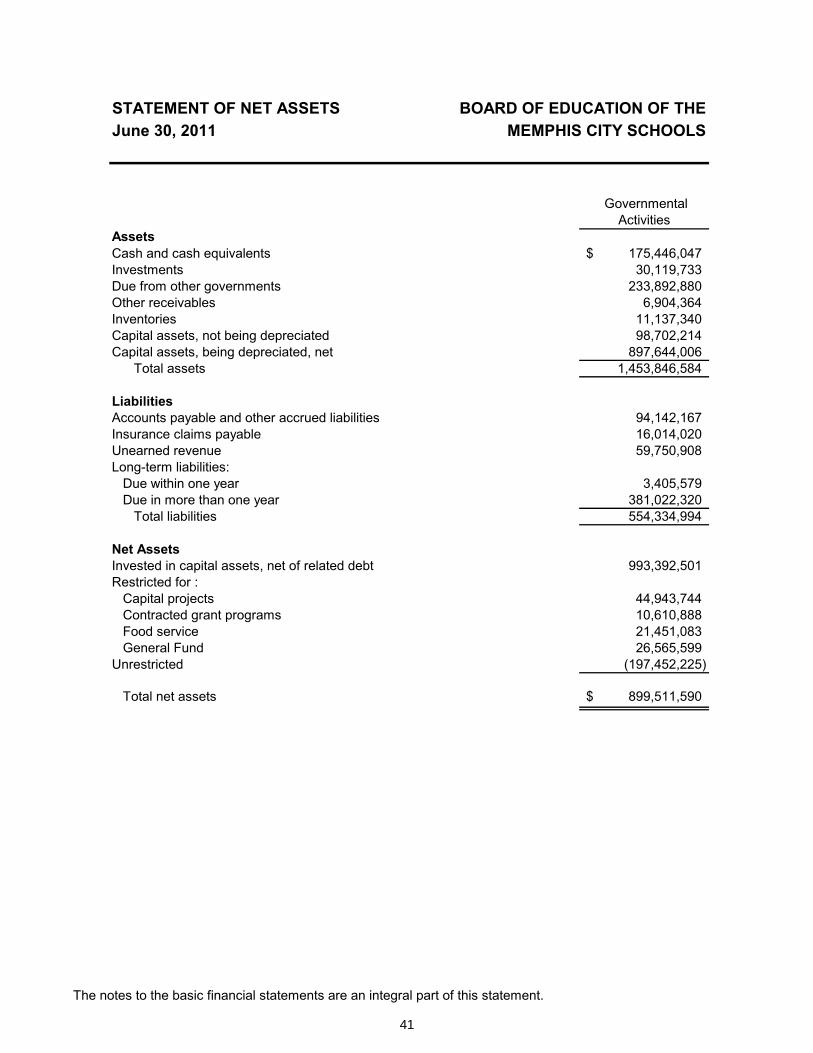
41
Statement of Net Assets
The notes to the basic financial statements are an integral part of this statement.
STATEMENT OF NET ASSETS BOARD OF EDUCATION OF THEJune 30, 2011 MEMPHIS CITY SCHOOLS
Governmental Activities
AssetsCash and cash equivalents 175,446,047$Investments 30,119,733Due from other governments 233,892,880Other receivables 6,904,364Inventories 11,137,340Capital assets, not being depreciated 98,702,214Capital assets, being depreciated, net 897,644,006
Total assets 1,453,846,584
LiabilitiesAccounts payable and other accrued liabilities 94,142,167Insurance claims payable 16,014,020Unearned revenue 59,750,908Long-term liabilities:
Due within one year 3,405,579Due in more than one year 381,022,320
Total liabilities 554,334,994
Net AssetsInvested in capital assets, net of related debt 993,392,501Restricted for :
Capital projects 44,943,744Contracted grant programs 10,610,888Food service 21,451,083General Fund 26,565,599
Unrestricted (197,452,225)
Total net assets 899,511,590$
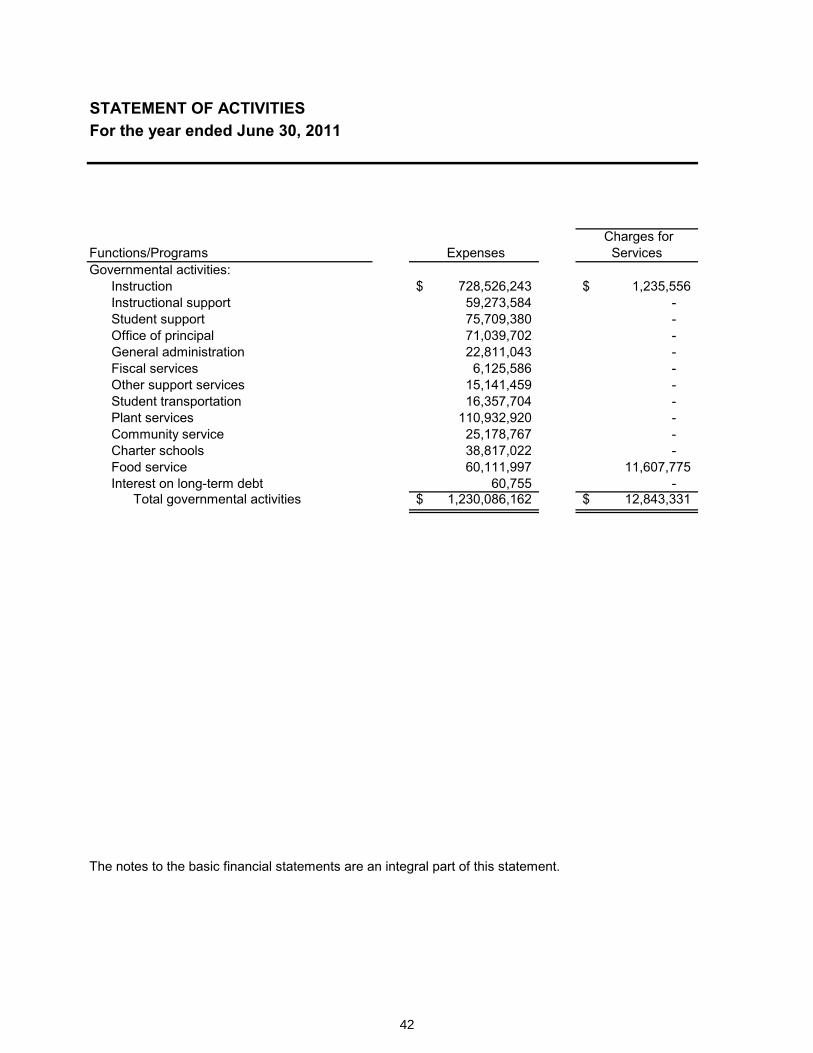
42
Statement of Activities
STATEMENT OF ACTIVITIESFor the year ended June 30, 2011
Functions/Programs Expenses Charges for
Services Governmental activities:
Instruction 728,526,243$ 1,235,556$Instructional support 59,273,584 -Student support 75,709,380 -Office of principal 71,039,702 -General administration 22,811,043 -Fiscal services 6,125,586 -Other support services 15,141,459 -Student transportation 16,357,704 -Plant services 110,932,920 -Community service 25,178,767 -Charter schools 38,817,022 -Food service 60,111,997 11,607,775Interest on long-term debt 60,755 -
Total governmental activities 1,230,086,162$ 12,843,331$
The notes to the basic financial statements are an integral part of this statement.
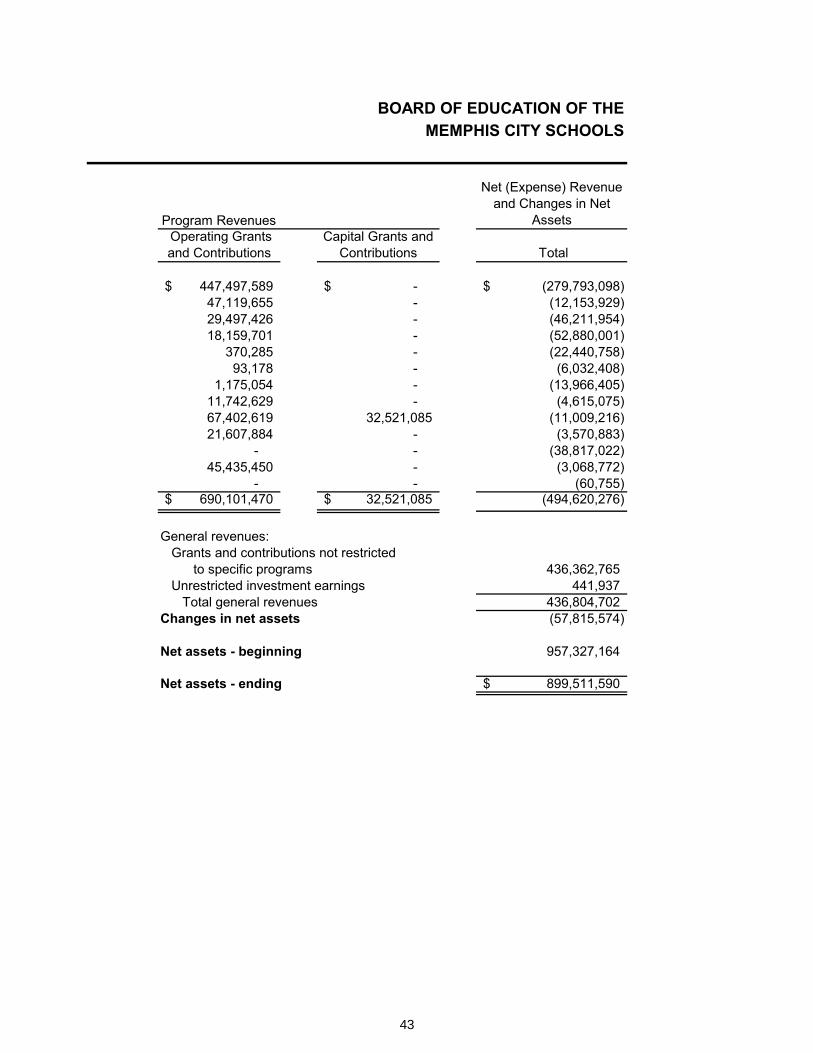
43
BOARD OF EDUCATION OF THEMEMPHIS CITY SCHOOLS
Program Revenues
Net (Expense) Revenue and Changes in Net
Assets Operating Grants and Contributions
Capital Grants and Contributions Total
447,497,589$ -$ (279,793,098)$47,119,655 - (12,153,929)29,497,426 - (46,211,954)18,159,701 - (52,880,001)
370,285 - (22,440,758)93,178 - (6,032,408)
1,175,054 - (13,966,405)11,742,629 - (4,615,075)67,402,619 32,521,085 (11,009,216)21,607,884 - (3,570,883)
- - (38,817,022)45,435,450 - (3,068,772)
- - (60,755)690,101,470$ 32,521,085$ (494,620,276)
General revenues:Grants and contributions not restricted
to specific programs 436,362,765Unrestricted investment earnings 441,937
Total general revenues 436,804,702Changes in net assets (57,815,574)
Net assets - beginning 957,327,164
Net assets - ending 899,511,590$
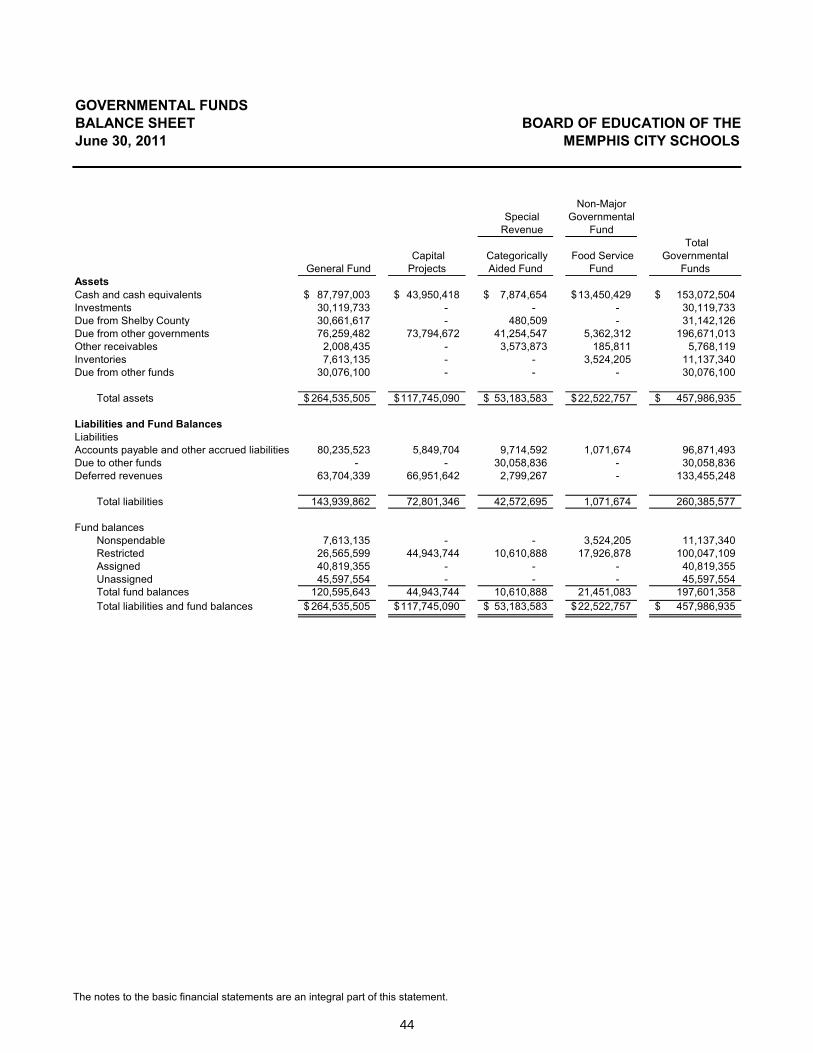
44
Fund Financial Statements:Balance Sheet – Governmental Funds
The notes to the basic financial statements are an integral part of this statement.
GOVERNMENTAL FUNDSBALANCE SHEET BOARD OF EDUCATION OF THEJune 30, 2011 MEMPHIS CITY SCHOOLS
SpecialRevenue
Non-MajorGovernmental
Fund
General Fund Capital Projects
Categorically Aided Fund
Food Service Fund
Total Governmental
Funds AssetsCash and cash equivalents 87,797,003$ 43,950,418$ 7,874,654$ 13,450,429$ 153,072,504$Investments 30,119,733 - - - 30,119,733Due from Shelby County 30,661,617 - 480,509 - 31,142,126Due from other governments 76,259,482 73,794,672 41,254,547 5,362,312 196,671,013Other receivables 2,008,435 - 3,573,873 185,811 5,768,119Inventories 7,613,135 - - 3,524,205 11,137,340Due from other funds 30,076,100 - - - 30,076,100
Total assets 264,535,505$ 117,745,090$ 53,183,583$ 22,522,757$ 457,986,935$
Liabilities and Fund BalancesLiabilitiesAccounts payable and other accrued liabilities 80,235,523 5,849,704 9,714,592 1,071,674 96,871,493Due to other funds - - 30,058,836 - 30,058,836Deferred revenues 63,704,339 66,951,642 2,799,267 - 133,455,248
Total liabilities 143,939,862 72,801,346 42,572,695 1,071,674 260,385,577
Fund balancesNonspendable 7,613,135 - - 3,524,205 11,137,340Restricted 26,565,599 44,943,744 10,610,888 17,926,878 100,047,109Assigned 40,819,355 - - - 40,819,355Unassigned 45,597,554 - - - 45,597,554Total fund balances 120,595,643 44,943,744 10,610,888 21,451,083 197,601,358Total liabilities and fund balances 264,535,505$ 117,745,090$ 53,183,583$ 22,522,757$ 457,986,935$
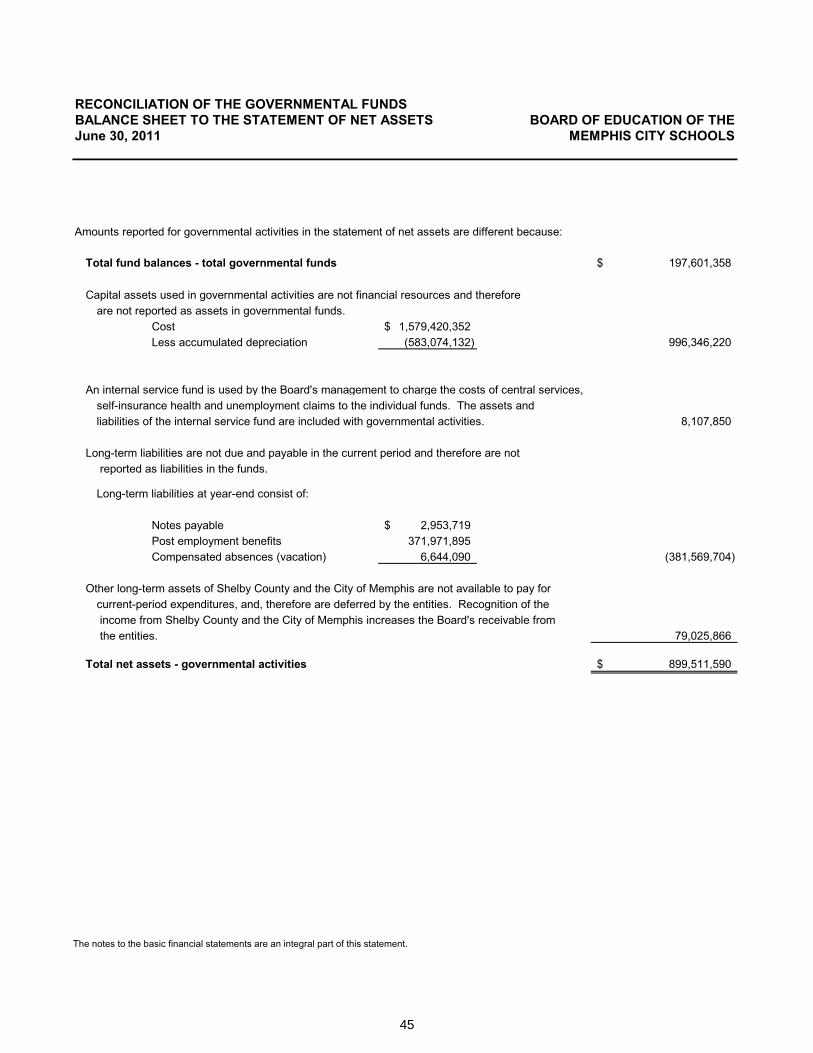
45
Reconciliation of the Governmental Funds Balance Sheet to the Statement of Net Assets
The notes to the basic financial statements are an integral part of this statement.
RECONCILIATION OF THE GOVERNMENTAL FUNDSBALANCE SHEET TO THE STATEMENT OF NET ASSETS BOARD OF EDUCATION OF THEJune 30, 2011 MEMPHIS CITY SCHOOLS
Amounts reported for governmental activities in the statement of net assets are different because:
Total fund balances - total governmental funds 197,601,358$
Capital assets used in governmental activities are not financial resources and therefore are not reported as assets in governmental funds.
Cost 1,579,420,352$Less accumulated depreciation (583,074,132) 996,346,220
An internal service fund is used by the Board's management to charge the costs of central services, self-insurance health and unemployment claims to the individual funds. The assets and liabilities of the internal service fund are included with governmental activities. 8,107,850
Long-term liabilities are not due and payable in the current period and therefore are not reported as liabilities in the funds.
Long-term liabilities at year-end consist of:
Notes payable 2,953,719$Post employment benefits 371,971,895Compensated absences (vacation) 6,644,090 (381,569,704)
Other long-term assets of Shelby County and the City of Memphis are not available to pay for current-period expenditures, and, therefore are deferred by the entities. Recognition of the income from Shelby County and the City of Memphis increases the Board's receivable from the entities. 79,025,866
Total net assets - governmental activities 899,511,590$
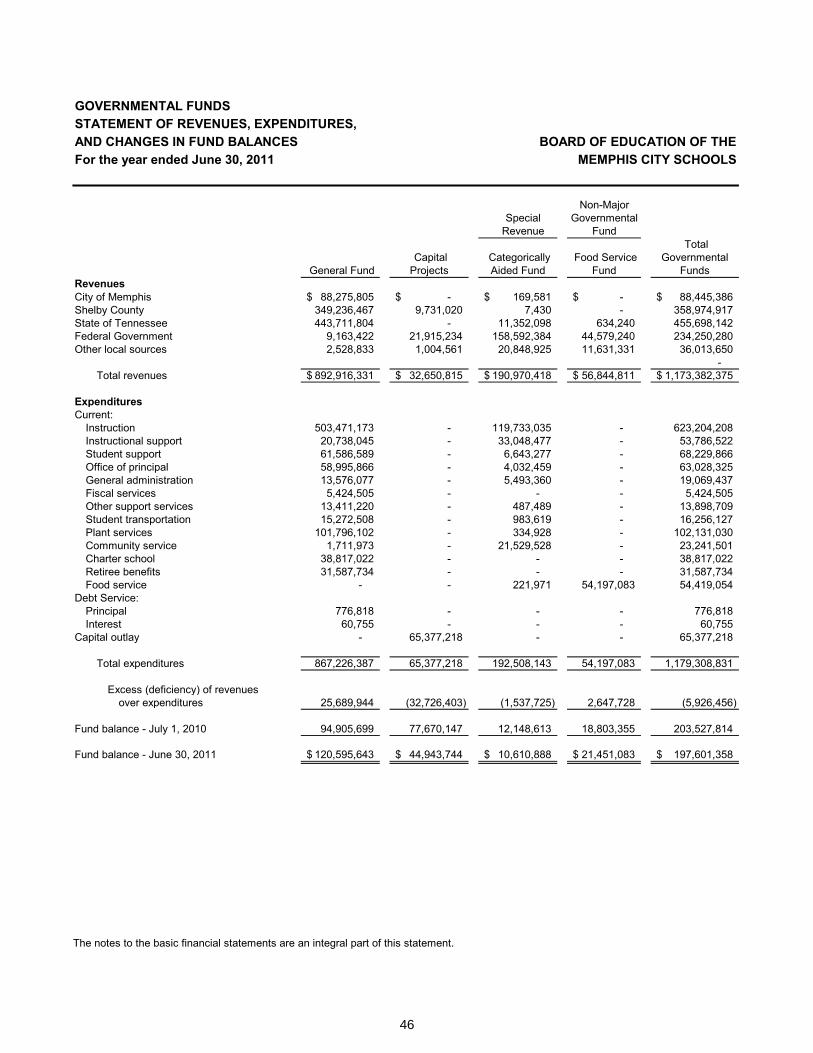
46
Statement of Revenues, Expenditures, and Changes in Fund Balances – Governmental Funds
The notes to the basic financial statements are an integral part of this statement.
GOVERNMENTAL FUNDSSTATEMENT OF REVENUES, EXPENDITURES,AND CHANGES IN FUND BALANCES BOARD OF EDUCATION OF THEFor the year ended June 30, 2011 MEMPHIS CITY SCHOOLS
SpecialRevenue
Non-MajorGovernmental
Fund
General Fund Capital Projects
Categorically Aided Fund
Food Service Fund
Total Governmental
Funds RevenuesCity of Memphis 88,275,805$ -$ 169,581$ -$ 88,445,386$Shelby County 349,236,467 9,731,020 7,430 - 358,974,917 State of Tennessee 443,711,804 - 11,352,098 634,240 455,698,142 Federal Government 9,163,422 21,915,234 158,592,384 44,579,240 234,250,280 Other local sources 2,528,833 1,004,561 20,848,925 11,631,331 36,013,650
- Total revenues 892,916,331$ 32,650,815$ 190,970,418$ 56,844,811$ 1,173,382,375$
ExpendituresCurrent:
Instruction 503,471,173 - 119,733,035 - 623,204,208 Instructional support 20,738,045 - 33,048,477 - 53,786,522 Student support 61,586,589 - 6,643,277 - 68,229,866 Office of principal 58,995,866 - 4,032,459 - 63,028,325 General administration 13,576,077 - 5,493,360 - 19,069,437 Fiscal services 5,424,505 - - - 5,424,505 Other support services 13,411,220 - 487,489 - 13,898,709 Student transportation 15,272,508 - 983,619 - 16,256,127 Plant services 101,796,102 - 334,928 - 102,131,030 Community service 1,711,973 - 21,529,528 - 23,241,501 Charter school 38,817,022 - - - 38,817,022 Retiree benefits 31,587,734 - - - 31,587,734 Food service - - 221,971 54,197,083 54,419,054
Debt Service:Principal 776,818 - - - 776,818 Interest 60,755 - - - 60,755
Capital outlay - 65,377,218 - - 65,377,218
Total expenditures 867,226,387 65,377,218 192,508,143 54,197,083 1,179,308,831
Excess (deficiency) of revenuesover expenditures 25,689,944 (32,726,403) (1,537,725) 2,647,728 (5,926,456)
Fund balance - July 1, 2010 94,905,699 77,670,147 12,148,613 18,803,355 203,527,814
Fund balance - June 30, 2011 120,595,643$ 44,943,744$ 10,610,888$ 21,451,083$ 197,601,358$
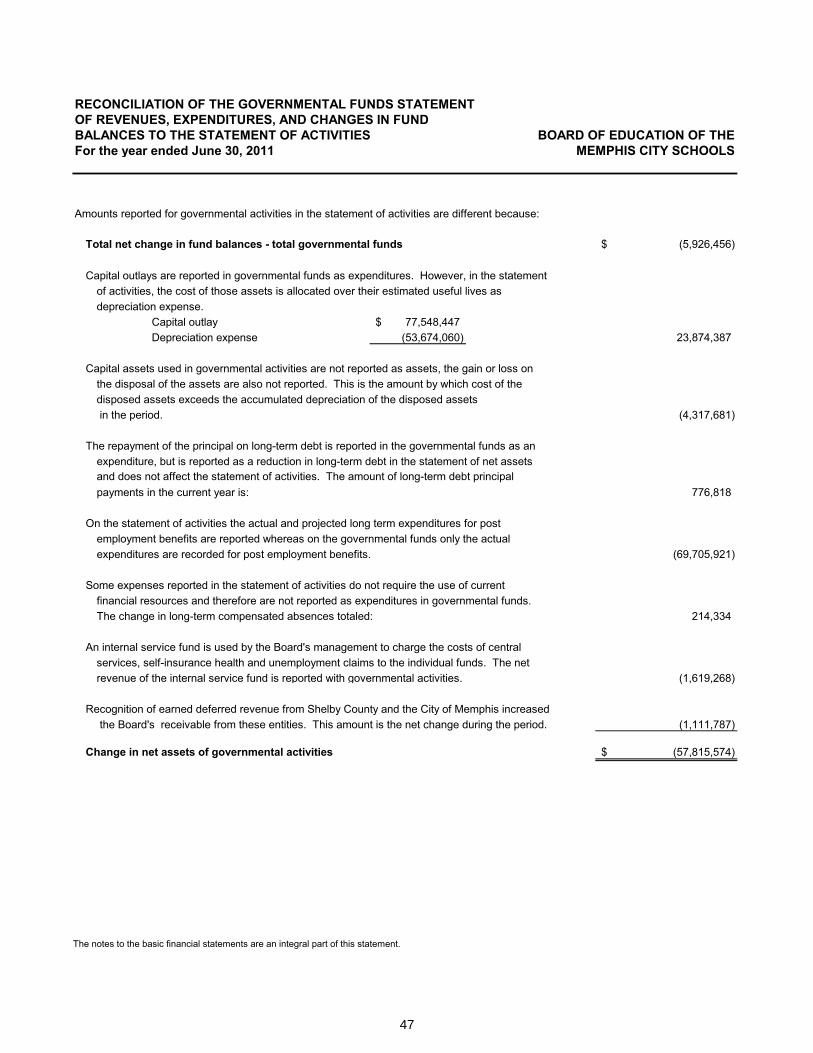
47
Reconciliation of the Governmental Funds Statement of Revenues, Expenditures, and Changes In Fund Balances to the Statement of Activities
The notes to the basic financial statements are an integral part of this statement.
RECONCILIATION OF THE GOVERNMENTAL FUNDS STATEMENTOF REVENUES, EXPENDITURES, AND CHANGES IN FUNDBALANCES TO THE STATEMENT OF ACTIVITIES BOARD OF EDUCATION OF THEFor the year ended June 30, 2011 MEMPHIS CITY SCHOOLS
Amounts reported for governmental activities in the statement of activities are different because:
Total net change in fund balances - total governmental funds (5,926,456)$
Capital outlays are reported in governmental funds as expenditures. However, in the statement of activities, the cost of those assets is allocated over their estimated useful lives as depreciation expense.
Capital outlay 77,548,447$ Depreciation expense (53,674,060) 23,874,387
Capital assets used in governmental activities are not reported as assets, the gain or loss on the disposal of the assets are also not reported. This is the amount by which cost of the disposed assets exceeds the accumulated depreciation of the disposed assets in the period. (4,317,681)
The repayment of the principal on long-term debt is reported in the governmental funds as an expenditure, but is reported as a reduction in long-term debt in the statement of net assets and does not affect the statement of activities. The amount of long-term debt principal payments in the current year is: 776,818
On the statement of activities the actual and projected long term expenditures for postemployment benefits are reported whereas on the governmental funds only the actualexpenditures are recorded for post employment benefits. (69,705,921)
Some expenses reported in the statement of activities do not require the use of currentfinancial resources and therefore are not reported as expenditures in governmental funds.The change in long-term compensated absences totaled: 214,334
An internal service fund is used by the Board's management to charge the costs of centralservices, self-insurance health and unemployment claims to the individual funds. The net revenue of the internal service fund is reported with governmental activities. (1,619,268)
Recognition of earned deferred revenue from Shelby County and the City of Memphis increased the Board's receivable from these entities. This amount is the net change during the period. (1,111,787)
Change in net assets of governmental activities (57,815,574)$
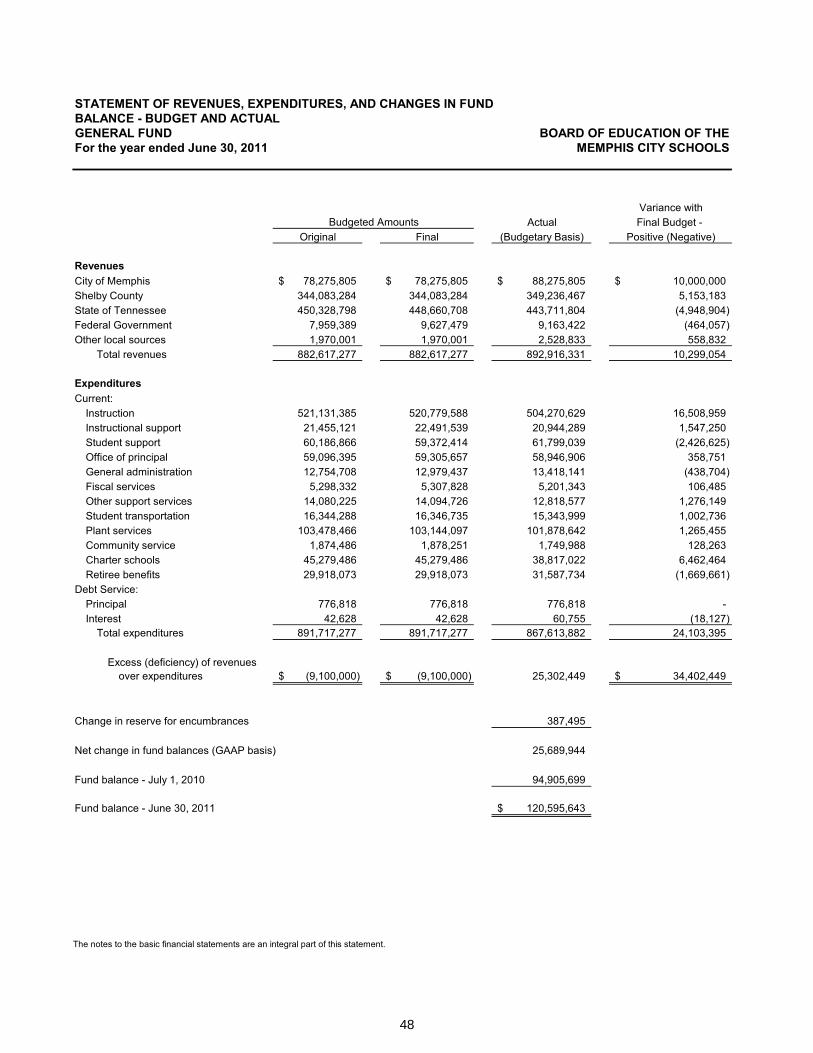
48
Statement of Revenues, Expenditures, and Changes in Fund Balance – Budget and Actual – General Fund
The notes to the basic financial statements are an integral part of this statement.
STATEMENT OF REVENUES, EXPENDITURES, AND CHANGES IN FUND BALANCE - BUDGET AND ACTUALGENERAL FUND BOARD OF EDUCATION OF THEFor the year ended June 30, 2011 MEMPHIS CITY SCHOOLS
Variance withActual Final Budget -
Original Final (Budgetary Basis) Positive (Negative)
RevenuesCity of Memphis 78,275,805$ 78,275,805$ 88,275,805$ 10,000,000$Shelby County 344,083,284 344,083,284 349,236,467 5,153,183State of Tennessee 450,328,798 448,660,708 443,711,804 (4,948,904)Federal Government 7,959,389 9,627,479 9,163,422 (464,057)Other local sources 1,970,001 1,970,001 2,528,833 558,832
Total revenues 882,617,277 882,617,277 892,916,331 10,299,054
ExpendituresCurrent:
Instruction 521,131,385 520,779,588 504,270,629 16,508,959Instructional support 21,455,121 22,491,539 20,944,289 1,547,250Student support 60,186,866 59,372,414 61,799,039 (2,426,625)Office of principal 59,096,395 59,305,657 58,946,906 358,751General administration 12,754,708 12,979,437 13,418,141 (438,704)Fiscal services 5,298,332 5,307,828 5,201,343 106,485Other support services 14,080,225 14,094,726 12,818,577 1,276,149Student transportation 16,344,288 16,346,735 15,343,999 1,002,736Plant services 103,478,466 103,144,097 101,878,642 1,265,455Community service 1,874,486 1,878,251 1,749,988 128,263Charter schools 45,279,486 45,279,486 38,817,022 6,462,464Retiree benefits 29,918,073 29,918,073 31,587,734 (1,669,661)
Debt Service:Principal 776,818 776,818 776,818 -Interest 42,628 42,628 60,755 (18,127)
Total expenditures 891,717,277 891,717,277 867,613,882 24,103,395
Excess (deficiency) of revenuesover expenditures (9,100,000)$ (9,100,000)$ 25,302,449 34,402,449$
Change in reserve for encumbrances 387,495
Net change in fund balances (GAAP basis) 25,689,944
Fund balance - July 1, 2010 94,905,699
Fund balance - June 30, 2011 120,595,643$
Budgeted Amounts
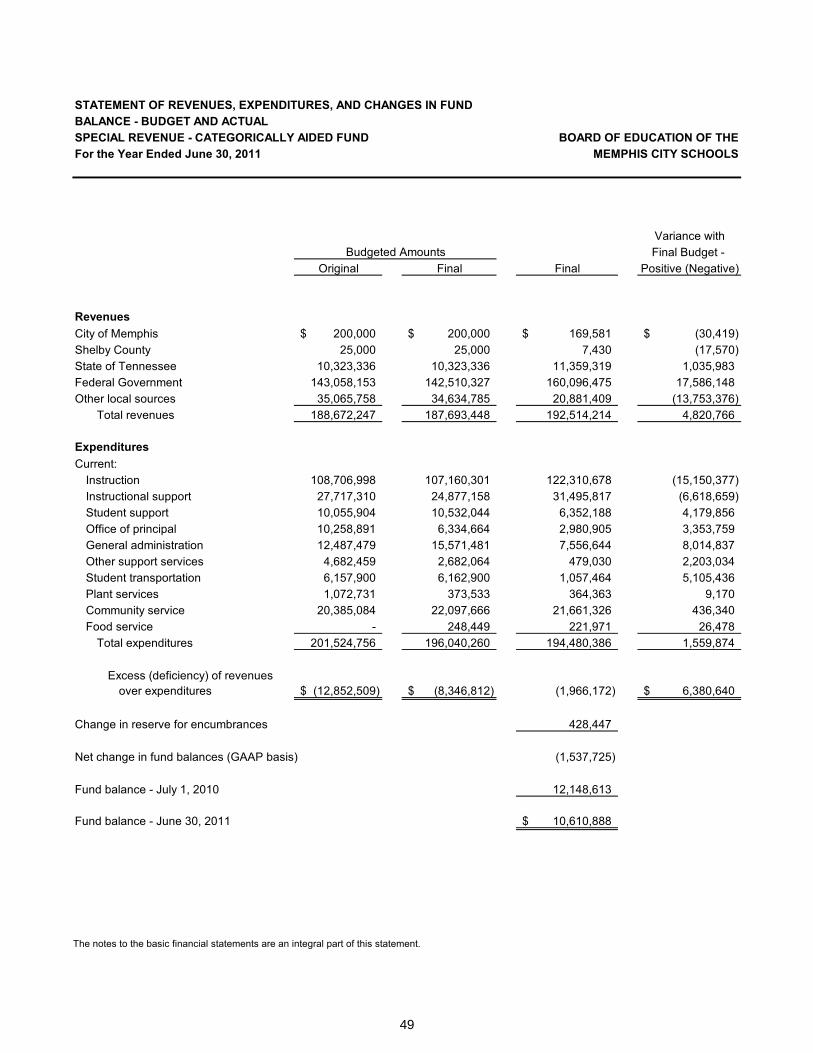
49
Statement of Revenues, Expenditures, and Changes in Fund Balance – Budget and Actual – Special Revenue Categorically Aided Fund
The notes to the basic financial statements are an integral part of this statement.
STATEMENT OF REVENUES, EXPENDITURES, AND CHANGES IN FUND BALANCE - BUDGET AND ACTUALSPECIAL REVENUE - CATEGORICALLY AIDED FUND BOARD OF EDUCATION OF THEFor the Year Ended June 30, 2011 MEMPHIS CITY SCHOOLS
Variance withFinal Budget -
Original Final Final Positive (Negative)
RevenuesCity of Memphis 200,000$ 200,000$ 169,581$ (30,419)$Shelby County 25,000 25,000 7,430 (17,570)State of Tennessee 10,323,336 10,323,336 11,359,319 1,035,983Federal Government 143,058,153 142,510,327 160,096,475 17,586,148Other local sources 35,065,758 34,634,785 20,881,409 (13,753,376)
Total revenues 188,672,247 187,693,448 192,514,214 4,820,766
ExpendituresCurrent:
Instruction 108,706,998 107,160,301 122,310,678 (15,150,377)Instructional support 27,717,310 24,877,158 31,495,817 (6,618,659)Student support 10,055,904 10,532,044 6,352,188 4,179,856Office of principal 10,258,891 6,334,664 2,980,905 3,353,759General administration 12,487,479 15,571,481 7,556,644 8,014,837Other support services 4,682,459 2,682,064 479,030 2,203,034Student transportation 6,157,900 6,162,900 1,057,464 5,105,436Plant services 1,072,731 373,533 364,363 9,170Community service 20,385,084 22,097,666 21,661,326 436,340Food service - 248,449 221,971 26,478
Total expenditures 201,524,756 196,040,260 194,480,386 1,559,874
Excess (deficiency) of revenuesover expenditures (12,852,509)$ (8,346,812)$ (1,966,172) 6,380,640$
Change in reserve for encumbrances 428,447
Net change in fund balances (GAAP basis) (1,537,725)
Fund balance - July 1, 2010 12,148,613
Fund balance - June 30, 2011 10,610,888$
Budgeted Amounts
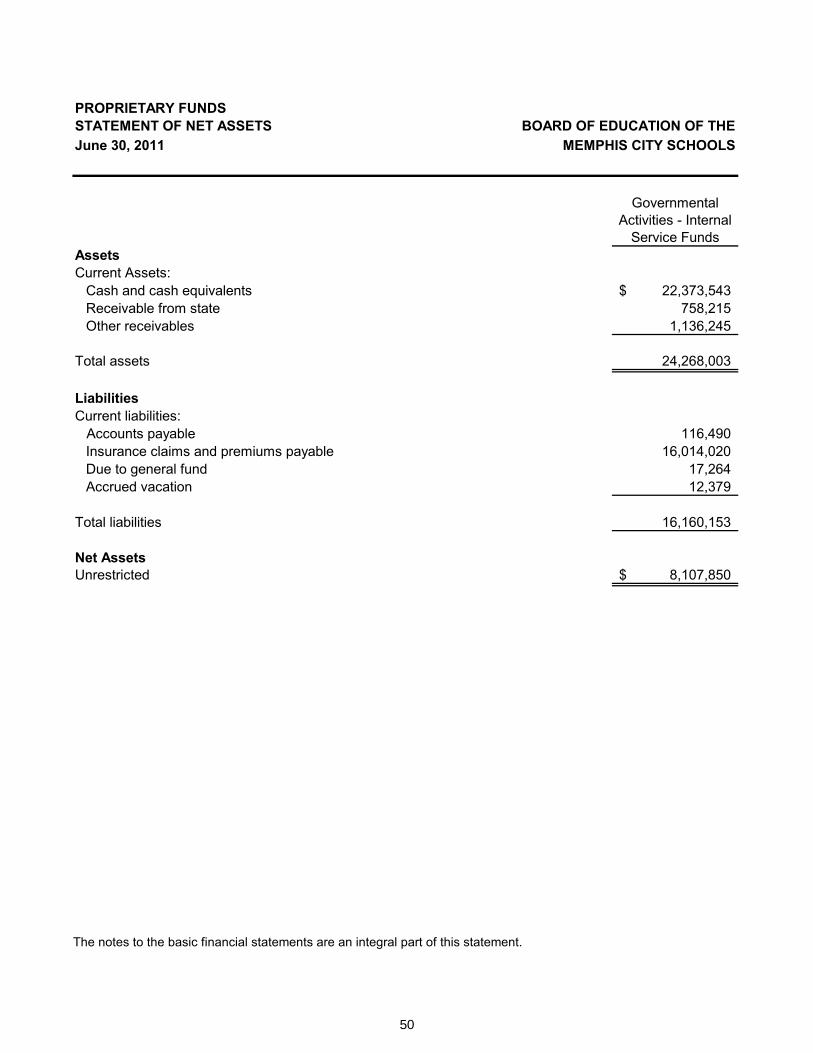
50
Statement of Net Assets – Proprietary Fund
The notes to the basic financial statements are an integral part of this statement.
PROPRIETARY FUNDSSTATEMENT OF NET ASSETS BOARD OF EDUCATION OF THEJune 30, 2011 MEMPHIS CITY SCHOOLS
Governmental Activities - Internal
Service FundsAssetsCurrent Assets:
Cash and cash equivalents 22,373,543$Receivable from state 758,215Other receivables 1,136,245
Total assets 24,268,003
LiabilitiesCurrent liabilities: Accounts payable 116,490
Insurance claims and premiums payable 16,014,020Due to general fund 17,264Accrued vacation 12,379
Total liabilities 16,160,153
Net AssetsUnrestricted 8,107,850$
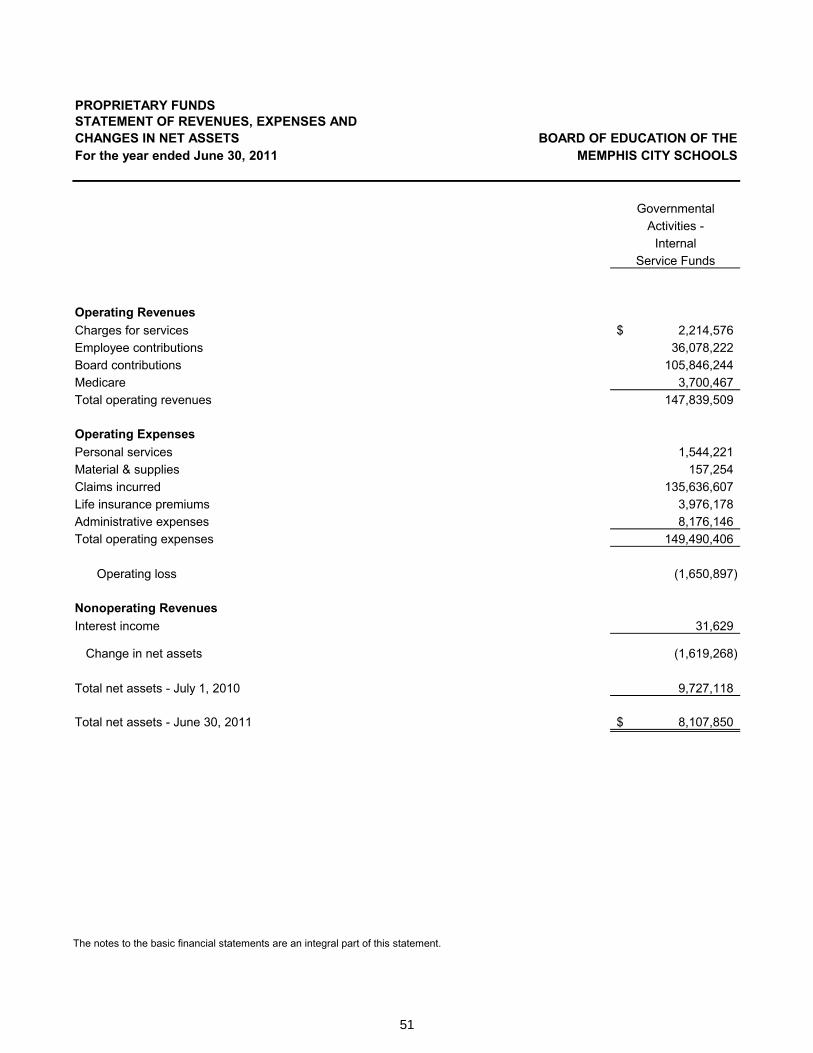
51
Statement of Revenues, Expenses, and Changes in Net Assets – Proprietary Fund
The notes to the basic financial statements are an integral part of this statement.
PROPRIETARY FUNDSSTATEMENT OF REVENUES, EXPENSES ANDCHANGES IN NET ASSETS BOARD OF EDUCATION OF THEFor the year ended June 30, 2011 MEMPHIS CITY SCHOOLS
GovernmentalActivities -
InternalService Funds
Operating RevenuesCharges for services 2,214,576$Employee contributions 36,078,222Board contributions 105,846,244Medicare 3,700,467Total operating revenues 147,839,509
Operating ExpensesPersonal services 1,544,221Material & supplies 157,254Claims incurred 135,636,607Life insurance premiums 3,976,178Administrative expenses 8,176,146Total operating expenses 149,490,406
Operating loss (1,650,897)
Nonoperating RevenuesInterest income 31,629
Change in net assets (1,619,268)
Total net assets - July 1, 2010 9,727,118
Total net assets - June 30, 2011 8,107,850$
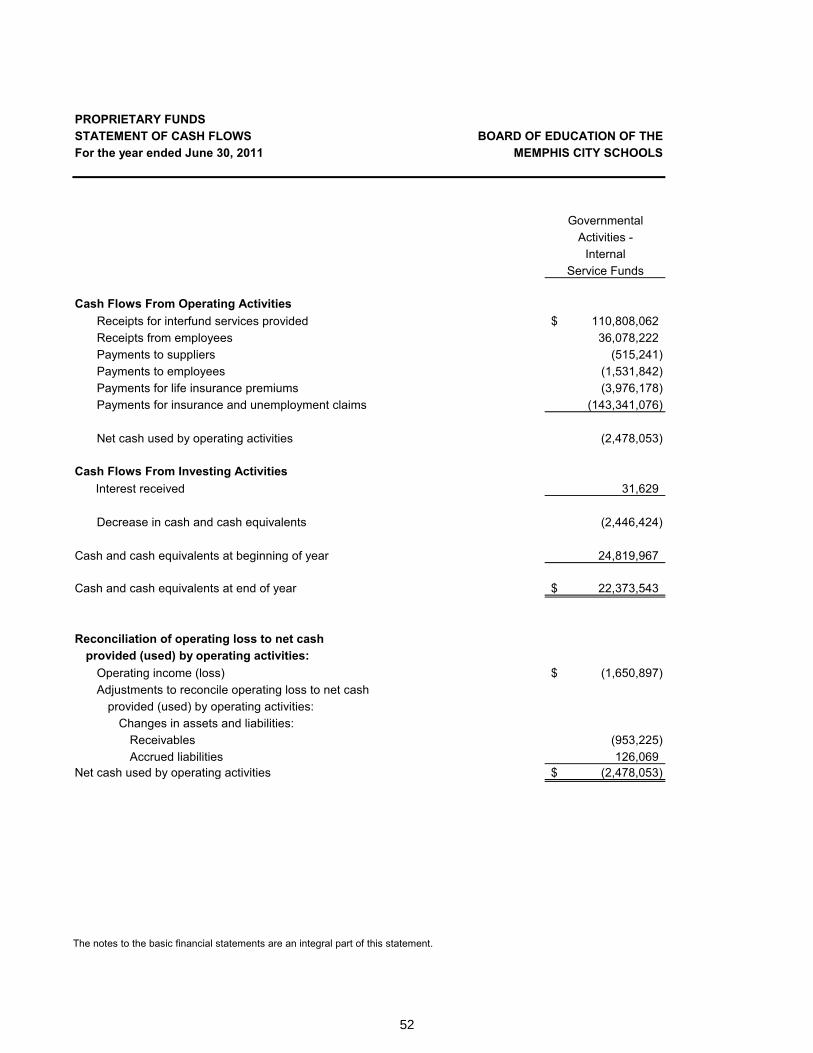
52
Statement of Cash Flows – Proprietary Fund
The notes to the basic financial statements are an integral part of this statement.
PROPRIETARY FUNDSSTATEMENT OF CASH FLOWS BOARD OF EDUCATION OF THEFor the year ended June 30, 2011 MEMPHIS CITY SCHOOLS
GovernmentalActivities -
InternalService Funds
Cash Flows From Operating ActivitiesReceipts for interfund services provided 110,808,062$Receipts from employees 36,078,222Payments to suppliers (515,241)Payments to employees (1,531,842)Payments for life insurance premiums (3,976,178)Payments for insurance and unemployment claims (143,341,076)
Net cash used by operating activities (2,478,053)
Cash Flows From Investing Activities Interest received 31,629
Decrease in cash and cash equivalents (2,446,424)
Cash and cash equivalents at beginning of year 24,819,967
Cash and cash equivalents at end of year 22,373,543$
Reconciliation of operating loss to net cashprovided (used) by operating activities:
Operating income (loss) (1,650,897)$Adjustments to reconcile operating loss to net cash
provided (used) by operating activities:Changes in assets and liabilities:
Receivables (953,225)Accrued liabilities 126,069
Net cash used by operating activities (2,478,053)$
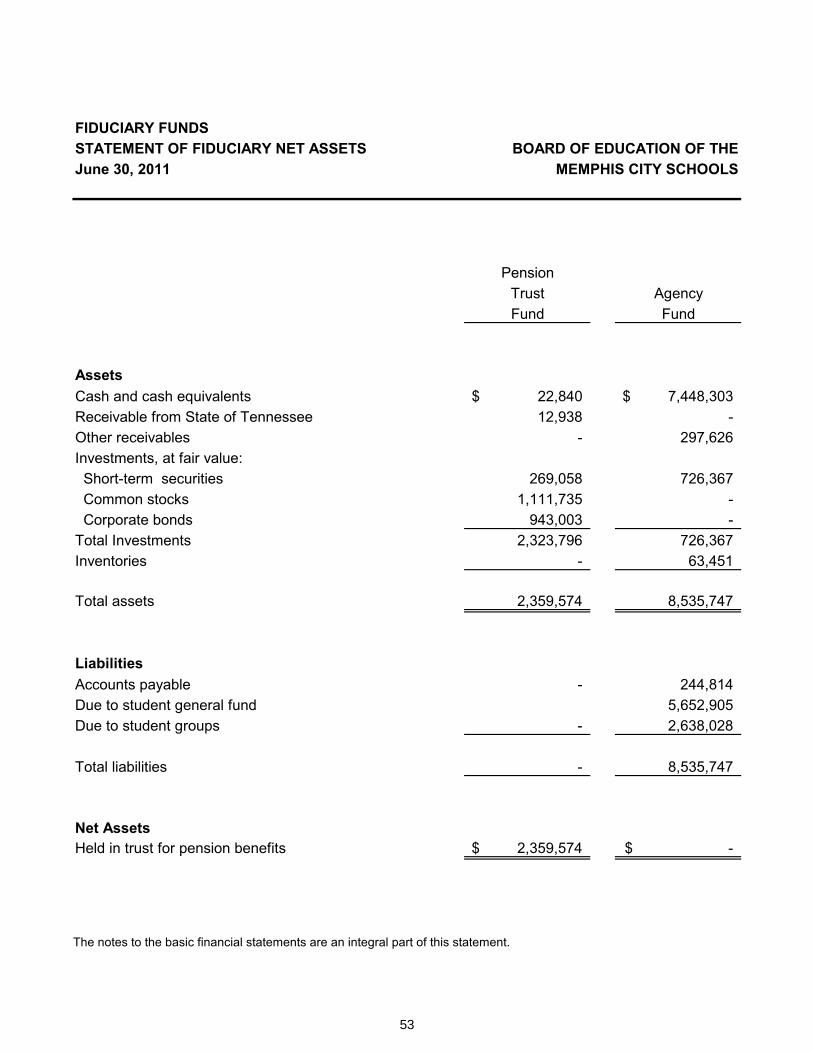
53
Statement of Fiduciary Net Assets
The notes to the basic financial statements are an integral part of this statement.
FIDUCIARY FUNDSSTATEMENT OF FIDUCIARY NET ASSETS BOARD OF EDUCATION OF THEJune 30, 2011 MEMPHIS CITY SCHOOLS
PensionTrust AgencyFund Fund
AssetsCash and cash equivalents 22,840$ 7,448,303$Receivable from State of Tennessee 12,938 -Other receivables - 297,626Investments, at fair value: Short-term securities 269,058 726,367 Common stocks 1,111,735 - Corporate bonds 943,003 -Total Investments 2,323,796 726,367Inventories - 63,451
Total assets 2,359,574 8,535,747
LiabilitiesAccounts payable - 244,814Due to student general fund 5,652,905Due to student groups - 2,638,028
Total liabilities - 8,535,747
Net AssetsHeld in trust for pension benefits 2,359,574$ -$
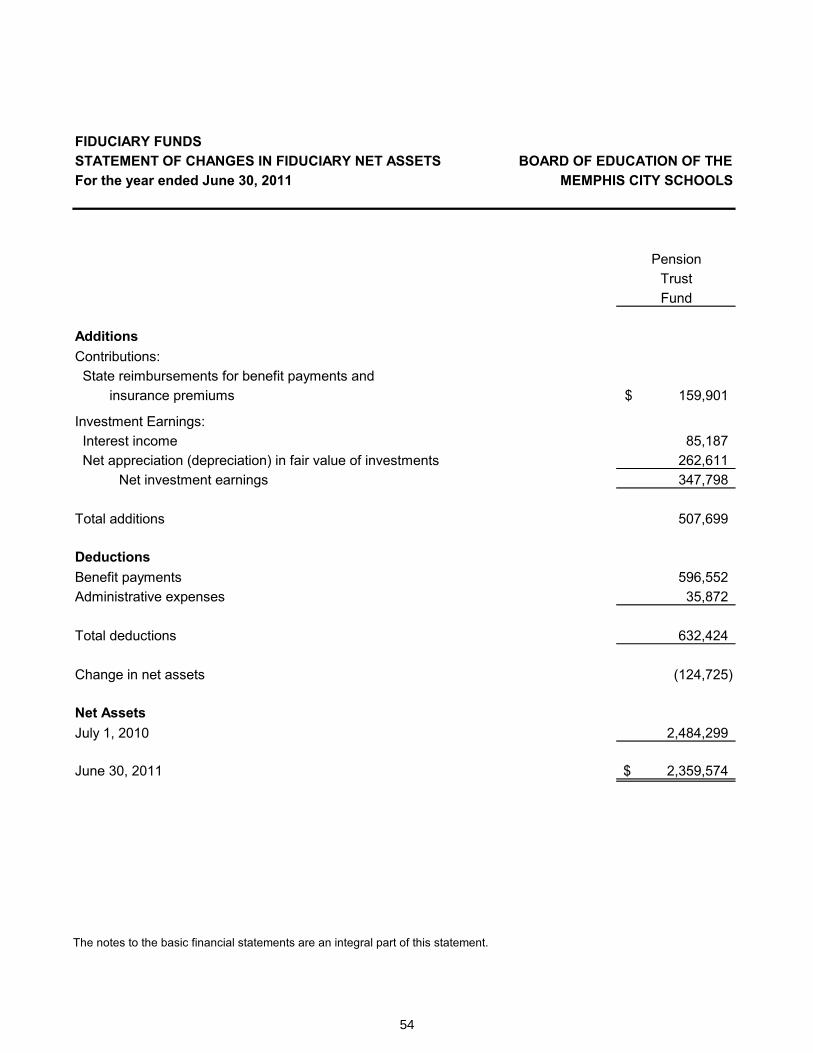
54
Statement of Changes in Fiduciary Net Assets – Fiduciary Funds
The notes to the basic financial statements are an integral part of this statement.
FIDUCIARY FUNDSSTATEMENT OF CHANGES IN FIDUCIARY NET ASSETS BOARD OF EDUCATION OF THEFor the year ended June 30, 2011 MEMPHIS CITY SCHOOLS
PensionTrustFund
AdditionsContributions: State reimbursements for benefit payments and insurance premiums 159,901$
Investment Earnings: Interest income 85,187 Net appreciation (depreciation) in fair value of investments 262,611
Net investment earnings 347,798
Total additions 507,699
DeductionsBenefit payments 596,552Administrative expenses 35,872
Total deductions 632,424
Change in net assets (124,725)
Net AssetsJuly 1, 2010 2,484,299
June 30, 2011 2,359,574$
55
Notes to the Basic Financial StatementsNOTES TO THE BASIC FINANCIAL STATEMENTS BOARD OF EDUCATION OF THEJune 30, 2011 MEMPHIS CITY SCHOOLS
NOTE 1 – SUMMARY OF SIGNIFICANT ACCOUNTING POLICIES
Determination of the Reporting Entity
The Board of Education of the Memphis City Schools (the Board), is a component unit of the City of Memphis, which is defined as the oversight entity by GASB Codification Section 2100, Defining the Reporting Entity. In determining the reporting entity, the Board was determined to be a component unit based upon its financial accountability as a result of fiscal dependency on the City of Memphis.
As such, the financial statements of the Board are included in the financial statements of the City of Memphis, Tennessee. Financial activities of the Board are recorded in the individual funds described below, each of which is deemed to be a separate accounting entity. The financial affairs and operations of each fund are accounted for in separate self-balancing entity accounts, which represent the funds’ assets, liabilities, equity, revenue and expenditures.
Government-Wide Financial Statements
The statement of net assets and statement of activities display information about the reporting entity as a whole. They include all funds of the reporting entity except for fiduciary funds. Activities are generally financed through a share of tax revenue collected by the City of Memphis and Shelby County, grants, and other non-exchange revenues. For the most part, the effect of internal activity has been removed from these statements.
The statement of activities demonstrates the degree to which the direct expenses of a given function are offset by program revenues. Direct expenses are those that are clearly identifiable with a specific function or segment. Certain indirect costs are included in the program expense reported for individual functions and activities due to the allocation of overhead for certain grants. Program revenues include grants and contributions that are restricted to meeting the operational or capital requirements of a particular function. General revenues include internally dedicated resources, non-specific grants and contributions, and investment earnings.
Fund Financial Statements
Fund financial statements of the reporting entity are organized into funds, each of which is considered to be a separate accounting entity. Each fund is accounted for by providing a separate set of self-balancing accounts that constitute its assets, liabilities, fund equity, revenues, expenditures and/or expenses. Funds are organized into three major categories: governmental, proprietary, and fiduciary. An emphasis is placed on major funds within the governmental and proprietary categories. A fund is considered major if it is the primary operating fund of the Board or meets the following criteria:
a. Total assets, liabilities, revenues, or expenditures/expenses of that individual fund are at least 10 percent of the corresponding total for all funds of that category or type; and
b. Total assets, liabilities, revenues, or expenditures/expenses of that individual fund are at least 5 percent of the corresponding total for all funds.
56
NOTES TO THE BASIC FINANCIAL STATEMENTS BOARD OF EDUCATION OF THEJune 30, 2011 MEMPHIS CITY SCHOOLS
The funds of the financial reporting entity are described below:
Governmental Funds
General Fund
The General Fund is the general purpose and chief operating fund of the school district used to account for the ordinary operations and financial resources not accounted for in any other fund. Taxes, state equalization funding, and other general revenues finance the operations.
Special Revenue Funds
Transactions related to resources obtained and used under certain federal and state programs and from other sources, upon which legal restrictions are imposed, are accounted for in Special Revenue Funds. The Special Revenue Funds are:
Categorically Aided Fund: The Board receives funds from various agencies, state and federal governments that are to be spent for specified purposes based upon contractual agreements or grant applications. Thus, the funds are restricted and the Categorically Aided Fund is used to keep these funds segregated from other funds.
Food Service Fund: This fund is used to account for the operations of the cafeterias in preparing and serving regular and incidental meals, breakfast, lunches, and snacks in connection with non-instructional services. Revenue is provided primarily from governmental agencies, which is to be spent specifically for the cafeterias. Thus, the funds are restricted and the Food Service Fund is used to keep these funds segregated from other funds.
Capital Projects Fund
Transactions related to resources obtained and used for the acquisition, construction or improvement of capital facilities are accounted for in the Capital Projects Fund.
Proprietary Funds
Internal Service Funds
Internal service funds account for central services, health insurance, life insurance and unemployment services provided to other funds of the Board that are funded through charges for services, and employee and Board contributions.
Central Services—Central service operations include printing and supply chain management services to the district.
Insurance—Insurance Fund accounts for the school district’s self insurance for health and premiums for life insurance benefits for school district employees, their dependents, and retirees.
Unemployment Compensation—Unemployment Compensation accounts for the school district’s self insurance for unemployment benefits which may be due for employment benefits for school district employees.
57
NOTES TO THE BASIC FINANCIAL STATEMENTS BOARD OF EDUCATION OF THEJune 30, 2011 MEMPHIS CITY SCHOOLS
Fiduciary Funds (Not included in government-wide statements)
Trust and Agency Funds consist of the following:
Pension Trust Fund—Retirement Fund: Transactions related to resources held in a fiduciary capacity as agent for participants in the Retirement System of the Board of Education of the Memphis City Schools are accounted for in the Retirement Fund. See Note 6 for additional information regarding this retirement plan.
Agency Fund—Student Activity Fund: Transactions related to resources held in a fiduciary capacity as agent for the general school population, or in some cases, for a specific segment of the school population, are recorded in the Student Activity Fund. Agency funds are purely custodial and thus do not involve measurement of results of operations.
Major and Nonmajor Funds
The General Fund, Capital Projects Fund, and Categorically Aided Fund are classified as major funds. The Food Service Fund is classified as a non-major fund. See above for descriptions.
Measurement Focus
Measurement focus is a term used to describe which transactions are recorded within the various financial statements.
The government-wide financial statements are presented using the economic resources measurement focus as defined in item b. below.
In the fund financial statements, the “current financial resources” measurement focus or the “economic resources” measurement focus is used as appropriate:
a. All governmental funds utilize a “current financial resources” measurement focus. Only current financial assets and liabilities are generally included on their balance sheets. Their operating statements present sources and uses of available spendable financial resources at the end of the period.
b. The proprietary fund utilizes an “economic resources” measurement focus. The accounting objectives of this measurement focus are the determination of operating income, changes in net assets (or cost recovery), financial position, and cash flows. All assets and liabilities (whether current or noncurrent) associated with their activities are reported. Proprietary fund equity is classified as net assets.
c. Agency funds are not involved in the measurement of results of operations; therefore, measurement focus is not applicable to them.
Budgeting and Budgetary Control
Revenue and expenditures accounted for in the General, Special Revenue, and Capital Projects Funds are controlled by a formal integrated budgetary accounting system in accordance with various legal requirements that govern the Board's operations. The General Fund budget is subject to approval by
58
NOTES TO THE BASIC FINANCIAL STATEMENTS BOARD OF EDUCATION OF THEJune 30, 2011 MEMPHIS CITY SCHOOLS
the Memphis City Council and the Board cannot exceed the total budgeted expenditures. The Board can amend the General Fund budget if the total budget does not exceed the amount approved by the Council. However, a resolution approval by the Council is required if the amendment total is more than the original resolution approved. Annual amendments to the Special Revenue and Capital ProjectsFunds only require Board approval.
Basis of Accounting
The government-wide financial statements are presented using the accrual basis of accounting. Under the accrual basis of accounting, revenues are recognized when earned and expenses are recorded when the liability is incurred or economic asset used. Revenues, expenses, gains, losses, assets, and liabilities resulting from exchange and exchange-like transactions are recognized when the exchange takes place.
The fund financial statements, the General, Special Revenue, and Capital Projects Funds, are prepared on the modified accrual basis of accounting. Under this basis of accounting, revenues are recognized in the accounting period in which they become susceptible to accrual, which is defined as being both measurable and available to finance expenditures of the fiscal period. Expenditures are recognized on the modified accrual basis which is defined as when measurable and when the related liability is incurred. When both restricted and unrestricted resources are available for use, it is the Board’s policy to use restricted resources first, then unrestricted resources as they are needed. Revenue susceptible to accrual under the modified accrual basis is principally:
a. Property taxes collected by the City of Memphis and Shelby County but not yet remitted to theBoard.
b. Grants and subsidies from other governments, to the extent measurable and available.
c. Interest earned on investments as of year-end.
The proprietary fund utilizes the accrual basis of accounting. Under the accrual basis of accounting, revenue is recorded as earned and expenses are recorded when the liability is incurred or economic asset used. Operating revenues and expenses generally result from providing services in connection with a proprietary fund’s principal ongoing operations. All other revenue is considered nonoperating revenue.
For budgetary reporting purposes, the encumbrance method of accounting for expenditures is used for the General, Special Revenue, and Capital Projects Funds. Under this method, commitments represented by purchase orders, contracts and repair authorizations, except for those related to inventory purchases, are recorded as expenditures in addition to actual expenditures incurred.
Outstanding encumbrances are classified as “Fund Balance—Assigned or Restricted” in the various funds. These amounts have been excluded from expenditures in all accompanying financial statements except for the statement which shows comparisons between actual expenditures (including encumbrances) and related budgeted amounts.
59
NOTES TO THE BASIC FINANCIAL STATEMENTS BOARD OF EDUCATION OF THEJune 30, 2011 MEMPHIS CITY SCHOOLS
Receivables
Receivables consist primarily of grant funds receivable from the Federal Government and the State of Tennessee, property taxes receivable from the City of Memphis and Shelby County, and funds due from Shelby County and the City of Memphis for capital projects. Outstanding balances between funds are reported as “due to/from other funds.” Transfers between funds are used to ensure current operations and programs are not interrupted.
Inventories
General Fund inventories consist of textbooks, maintenance and school supplies. Food Service Fund inventories consist of food and cafeteria supplies. Inventories are considered expenditures when issued from the central warehouse to the schools (Consumption Method) except food items, which are expensed when used. Inventories are reported in the balance sheet at average cost and are offset by a Fund Balance reserve of a like amount. Inventories in the Agency Fund are stated at cost determined by the first-in, first-out method.
Realty and Personal Property Taxes
The Board recognizes as revenue its net share of realty and personal property taxes collected by Shelby County and the City of Memphis (see Basis of Accounting above). The Board does not have any taxing authority. Consequently, it relies on a share of realty and personal property taxes collected by both the City of Memphis and Shelby County. The City of Memphis provided the Board with $.187 of the total city property tax levy, which is $3.20 per $100 of assessed value. The Shelby County tax levy of $4.02 per $100 of assessed value included $1.91 for both the city and county schools. Distribution of Shelby County funds was based on the average daily attendance of each system, approximately 69.06% for the City of Memphis Schools and 30.94% for the Shelby County Schools.
Cash Equivalents
The Board considers all highly liquid investments with maturity of three months or less when purchased to be cash equivalents.
Investments
Investments are stated at market value.
In accordance with Tennessee Code Annotated 6-56-106, the Board’s investment policy authorizes investments in the local government investment pool; certificates of deposit of up to 365 days;obligations of the United States or agencies; repurchase agreements of up to 4 years; bankers’ acceptances; and commercial paper with a minimum rating of A-1 by Standard & Poor’s Corporation, P-1 by Moody’s Investors Service, Inc. and F-1 by Fitch Investors Service. This policy relates to investments in all funds, except the retirement fund.
60
NOTES TO THE BASIC FINANCIAL STATEMENTS BOARD OF EDUCATION OF THEJune 30, 2011 MEMPHIS CITY SCHOOLS
The Board’s investment policy states:
� that all excess funds should be held in interest-bearing accounts or investments to earn the maximum return possible on the funds available for investment while complying with state and federal statutes and district policy;
� that safety of funds should be the first consideration. The district should not enter into investment transactions which will expose itself to an undue risk; and
� that investment practices must always be in compliance with state and federal laws.
Therefore, the investment program shall have at least four basic ingredients: legality, safety, liquidity, and yield.
Capital Assets
Capital assets are reported in the government-wide financial statements.
Capital assets are valued at historical cost or estimated historical cost if actual is unavailable, except for donated capital assets, which are recorded at their estimated fair value at the date of donation. Estimated historical cost was used to value the majority of the assets acquired prior to June 30, 2001.
The District capitalizes the following:
� All assets considered “sensitive,” and
� Assets with an initial cost of $5,000 or more.
Depreciation of all exhaustible capital assets is recorded as an allocated expense in the Statement of Activities, with accumulated depreciation reflected in the Statement of Net Assets. Depreciation is provided over the assets’ estimated useful lives using the straight-line method of depreciation. The range of estimated useful lives by type of asset is as follows:
- Buildings and Improvements 10-50 years- Machinery and Equipment 5-20 years
Long-Term Obligations
All long-term obligations to be repaid from governmental resources are reported as liabilities in the government-wide financial statements. Long-term obligations consist primarily of notes payable, capital leases, and accrued compensated absences.
Long-term debt for governmental funds is not reported as a liability in the fund financial statements. Debt proceeds are reported as other financing sources and payments of principal and interest are reported as expenditures.
Compensated Absences
The liability for accrued vacation is recorded as a long-term obligation in the government-wide financial
61
NOTES TO THE BASIC FINANCIAL STATEMENTS BOARD OF EDUCATION OF THEJune 30, 2011 MEMPHIS CITY SCHOOLS
statements. The current portion of this obligation is estimated based on historical trends. In the fund financial statements, governmental funds report only the compensated absence liability payable from expendable available financial resources, and only the absences which have matured and are probable to be paid (i.e., unused reimbursable leave still outstanding following an employee’s resignation or retirement).
Equity Classifications
In the government-wide financial statements, equity is classified as net assets and displayed in three components:
a. Invested in capital assets, net of related debt – Consists of capital assets including restricted capital assets, net of accumulated depreciation and reduced by the outstanding balances of any borrowings that are attributable to the acquisition, construction, or improvement of those assets.
b. Restricted net assets – Consists of net assets with constraints placed on the use either by (1) external groups such as creditors, grantors, contributors, or laws or regulations of other governments; or (2) law through constitutional provisions or enabling legislation.
c. Unrestricted net assets – All other net assets that do not meet the definition of “restricted’ or “invested in capital assets, net of related debt.”
Governmental fund balances are reported, in accordance with Governmental Accounting Standards Board Statement No. 54, Fund Balance Reporting and Governmental Fund Type Definitions, as either Nonspendable, Restricted, Committed, Assigned and/or Unassigned.
� Nonspendable fund balance includes amounts that are not in a spendable form such as inventory, prepaid amounts and the long-term amounts of loans and notes receivable, or are legally or contractually required to be maintained intact.
� Restricted fund balance includes amounts that can be spent only for the specific purposes stipulated by external resource providers such as grantors or enabling legislations. Restrictions may be changed or lifted only with the consent of the resource providers.
� Committed fund balance includes amounts that can be used only for the specific purposes determined by a formal action of the Memphis City Schools Board of Commissioners, the District’s highest level of decision making authority. Commitments may be changed or lifted only by the Memphis City Schools Board of Commissioners taking the same formal action that imposed the constraint.
� Assigned fund balance includes amounts that the District intends to use for a specific purpose, but are not restricted or committed. The intent shall be expressed by resolution of the Memphis City Schools Board of Commissioners or official to which the Board has delegated the authority, such as the Superintendent or his designee (e.g. legal contingencies).
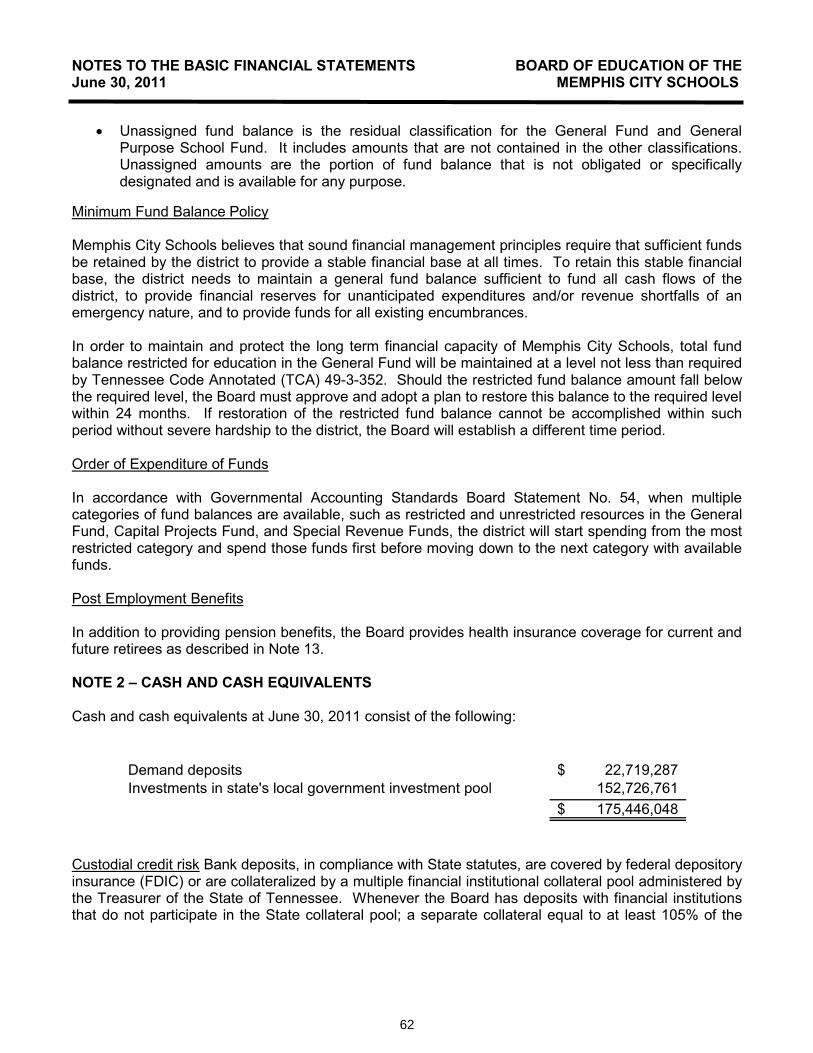
62
NOTES TO THE BASIC FINANCIAL STATEMENTS BOARD OF EDUCATION OF THEJune 30, 2011 MEMPHIS CITY SCHOOLS
� Unassigned fund balance is the residual classification for the General Fund and General Purpose School Fund. It includes amounts that are not contained in the other classifications. Unassigned amounts are the portion of fund balance that is not obligated or specifically designated and is available for any purpose.
Minimum Fund Balance Policy
Memphis City Schools believes that sound financial management principles require that sufficient funds be retained by the district to provide a stable financial base at all times. To retain this stable financial base, the district needs to maintain a general fund balance sufficient to fund all cash flows of the district, to provide financial reserves for unanticipated expenditures and/or revenue shortfalls of an emergency nature, and to provide funds for all existing encumbrances.
In order to maintain and protect the long term financial capacity of Memphis City Schools, total fund balance restricted for education in the General Fund will be maintained at a level not less than required by Tennessee Code Annotated (TCA) 49-3-352. Should the restricted fund balance amount fall below the required level, the Board must approve and adopt a plan to restore this balance to the required level within 24 months. If restoration of the restricted fund balance cannot be accomplished within such period without severe hardship to the district, the Board will establish a different time period.
Order of Expenditure of Funds
In accordance with Governmental Accounting Standards Board Statement No. 54, when multiple categories of fund balances are available, such as restricted and unrestricted resources in the General Fund, Capital Projects Fund, and Special Revenue Funds, the district will start spending from the most restricted category and spend those funds first before moving down to the next category with available funds.
Post Employment Benefits
In addition to providing pension benefits, the Board provides health insurance coverage for current and future retirees as described in Note 13.
NOTE 2 – CASH AND CASH EQUIVALENTS
Cash and cash equivalents at June 30, 2011 consist of the following:
Demand deposits 22,719,287$ Investments in state's local government investment pool 152,726,761
175,446,048$
Custodial credit risk Bank deposits, in compliance with State statutes, are covered by federal depository insurance (FDIC) or are collateralized by a multiple financial institutional collateral pool administered by the Treasurer of the State of Tennessee. Whenever the Board has deposits with financial institutions that do not participate in the State collateral pool; a separate collateral equal to at least 105% of the
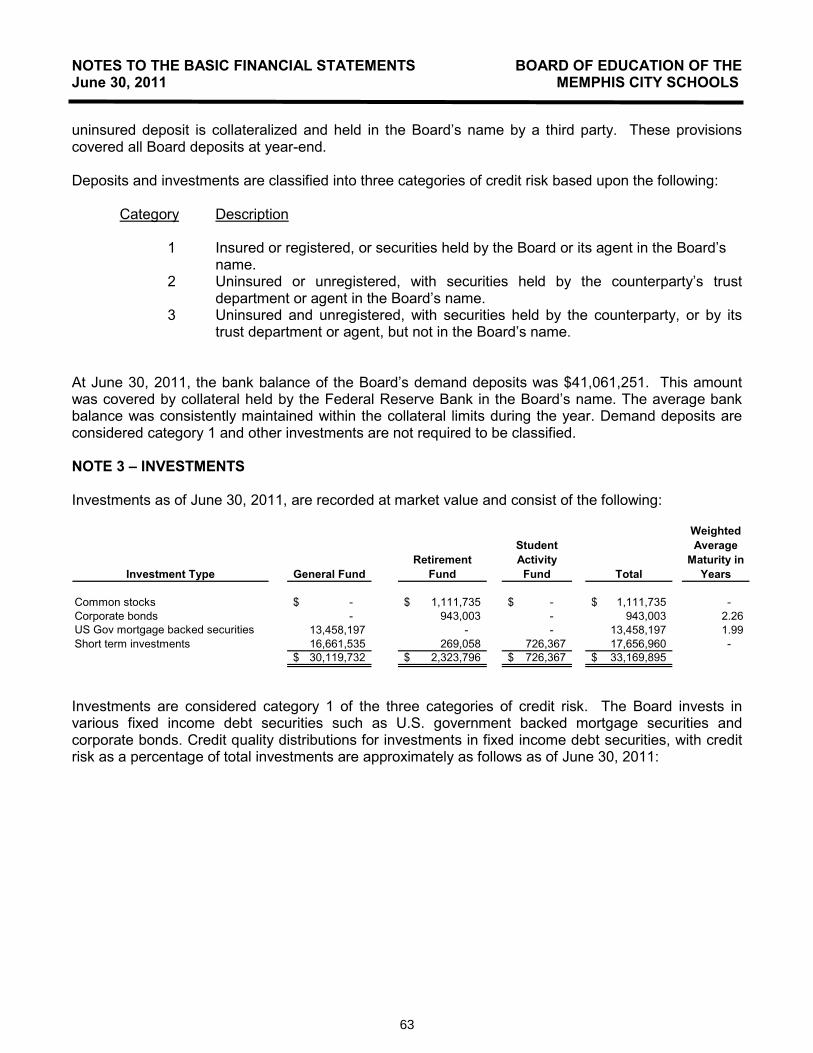
63
NOTES TO THE BASIC FINANCIAL STATEMENTS BOARD OF EDUCATION OF THEJune 30, 2011 MEMPHIS CITY SCHOOLS
uninsured deposit is collateralized and held in the Board’s name by a third party. These provisions covered all Board deposits at year-end.
Deposits and investments are classified into three categories of credit risk based upon the following:
Category Description
1 Insured or registered, or securities held by the Board or its agent in the Board’s name.
2 Uninsured or unregistered, with securities held by the counterparty’s trust department or agent in the Board’s name.
3 Uninsured and unregistered, with securities held by the counterparty, or by its trust department or agent, but not in the Board’s name.
At June 30, 2011, the bank balance of the Board’s demand deposits was $41,061,251. This amount was covered by collateral held by the Federal Reserve Bank in the Board’s name. The average bank balance was consistently maintained within the collateral limits during the year. Demand deposits are considered category 1 and other investments are not required to be classified.
NOTE 3 – INVESTMENTS
Investments as of June 30, 2011, are recorded at market value and consist of the following:
Investment Type General FundRetirement
Fund
Student Activity Fund Total
Weighted Average
Maturity in Years
Common stocks -$ 1,111,735$ -$ 1,111,735$ -Corporate bonds - 943,003 - 943,003 2.26US Gov mortgage backed securities 13,458,197 - - 13,458,197 1.99Short term investments 16,661,535 269,058 726,367 17,656,960 -
30,119,732$ 2,323,796$ 726,367$ 33,169,895$
Investments are considered category 1 of the three categories of credit risk. The Board invests in various fixed income debt securities such as U.S. government backed mortgage securities andcorporate bonds. Credit quality distributions for investments in fixed income debt securities, with credit risk as a percentage of total investments are approximately as follows as of June 30, 2011:
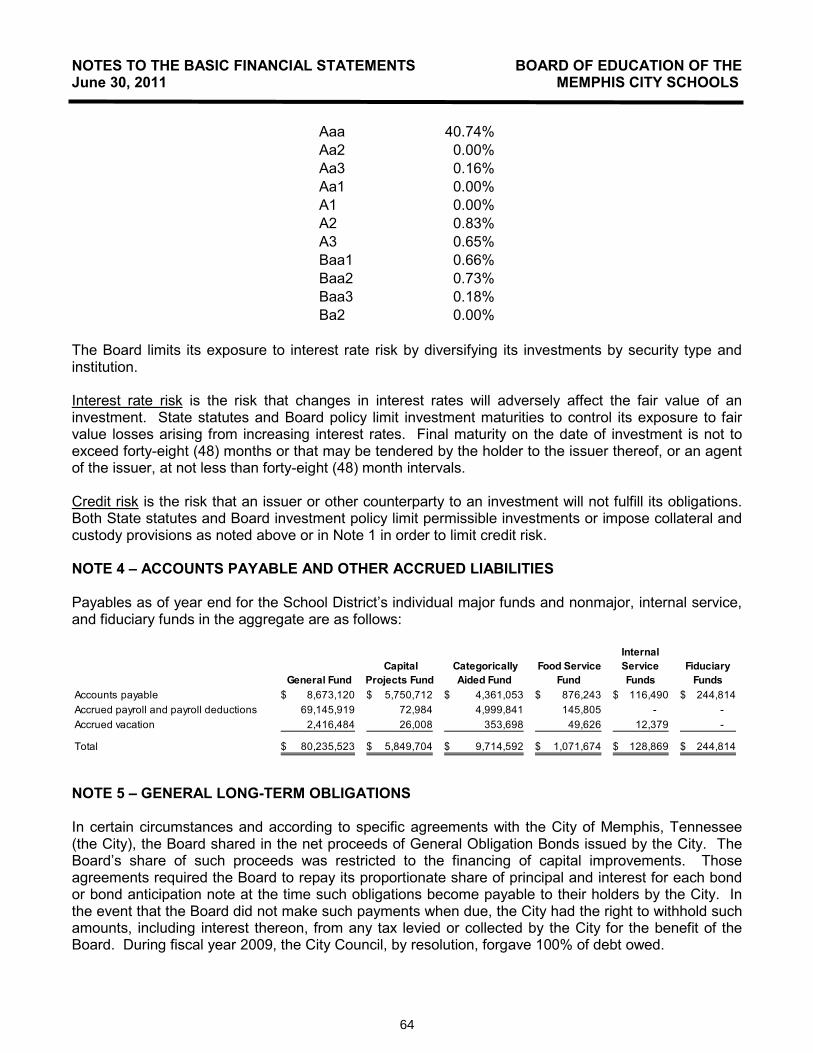
64
NOTES TO THE BASIC FINANCIAL STATEMENTS BOARD OF EDUCATION OF THEJune 30, 2011 MEMPHIS CITY SCHOOLS
Aaa 40.74%Aa2 0.00%Aa3 0.16%Aa1 0.00%A1 0.00%A2 0.83%A3 0.65%Baa1 0.66%Baa2 0.73%Baa3 0.18%Ba2 0.00%
The Board limits its exposure to interest rate risk by diversifying its investments by security type and institution.
Interest rate risk is the risk that changes in interest rates will adversely affect the fair value of an investment. State statutes and Board policy limit investment maturities to control its exposure to fair value losses arising from increasing interest rates. Final maturity on the date of investment is not to exceed forty-eight (48) months or that may be tendered by the holder to the issuer thereof, or an agent of the issuer, at not less than forty-eight (48) month intervals.
Credit risk is the risk that an issuer or other counterparty to an investment will not fulfill its obligations. Both State statutes and Board investment policy limit permissible investments or impose collateral and custody provisions as noted above or in Note 1 in order to limit credit risk.
NOTE 4 – ACCOUNTS PAYABLE AND OTHER ACCRUED LIABILITIES
Payables as of year end for the School District’s individual major funds and nonmajor, internal service, and fiduciary funds in the aggregate are as follows:
General Fund Capital
Projects Fund Categorically
Aided Fund Food Service
Fund
Internal Service Funds
Fiduciary Funds
Accounts payable 8,673,120$ 5,750,712$ 4,361,053$ 876,243$ 116,490$ 244,814$Accrued payroll and payroll deductions 69,145,919 72,984 4,999,841 145,805 - -Accrued vacation 2,416,484 26,008 353,698 49,626 12,379 -
Total 80,235,523$ 5,849,704$ 9,714,592$ 1,071,674$ 128,869$ 244,814$
NOTE 5 – GENERAL LONG-TERM OBLIGATIONS
In certain circumstances and according to specific agreements with the City of Memphis, Tennessee (the City), the Board shared in the net proceeds of General Obligation Bonds issued by the City. The Board’s share of such proceeds was restricted to the financing of capital improvements. Thoseagreements required the Board to repay its proportionate share of principal and interest for each bond or bond anticipation note at the time such obligations become payable to their holders by the City. In the event that the Board did not make such payments when due, the City had the right to withhold such amounts, including interest thereon, from any tax levied or collected by the City for the benefit of the Board. During fiscal year 2009, the City Council, by resolution, forgave 100% of debt owed.

65
NOTES TO THE BASIC FINANCIAL STATEMENTS BOARD OF EDUCATION OF THEJune 30, 2011 MEMPHIS CITY SCHOOLS
At June 30, 2011, the Board is indebted for outstanding general long-term obligations (excluding accrued vacation) with interest rates of 0%. Debt service requirements for principal and interest are paid from the General Fund and there are no designations of fund balance for debt service because each year’s debt service requirements are expected to be paid from that year’s revenue. Other long-term liabilities, compensated absences, and pension liabilities are also paid from the General Fund.
Future years’ debt service requirements for long-term obligations are as follows:
Years EndingJune 30 Principal Interest Total
2012 547,384$ -$ 547,384$2013 547,384 - 547,3842014 547,383 - 547,3832015 547,384 - 547,3842016 547,384 - 547,384
2017-2019 216,800 - 216,800
2,953,719$ -$ 2,953,719$
The following is a summary of changes in general long-term obligations for the year June 30, 2011:
Balance Payments and Balance Due WithinJuly 1, 2010 Additions Retirements June 30, 2011 One Year
Due To Federal Government 229,433$ -$ 229,433$ -$ -$ Due to State of Tennessee 3,501,103 - 547,385 2,953,719 547,384
3,730,536 - 776,818 2,953,719 547,384Post Employment Benefits 302,265,974 106,029,583 36,323,662 371,971,895 - Compensated Absences 8,964,421 2,643,861 2,105,997 9,502,285 2,858,195
314,960,931$ 108,673,444$ 39,206,477$ 384,427,899$ 3,405,579$
Board employees are granted vacation and sick leave in varying amounts in accordance with administrative policy and union contracts. A maximum of thirty-five vacation days may be accumulated for non-teacher employees. In the event of termination, an employee is reimbursed for accumulated vacation days. Employees are generally not reimbursed for accumulated unused sick leave upon retirement; however, such accumulated sick leave is credited to time in service in computing retirement benefits.
The Board accrues vacation benefits in the government fund types as they are earned, to the extent that such benefits would normally be expected to be taken during the next year.
66
NOTES TO THE BASIC FINANCIAL STATEMENTS BOARD OF EDUCATION OF THEJune 30, 2011 MEMPHIS CITY SCHOOLS
NOTE 6 – RETIREMENT PLANS
A. Local Plan
The Retirement Fund accounts for the activities of the Retirement System of the Board of Education of the Memphis City Schools (the Local Plan), a defined benefit plan. The accounting records are maintained and pension benefits are processed by employees of the Board. The Board paid net benefits of $436,651 ($596,552 net of $159,901 in reimbursements from the state) for employees covered by the Local Plan for the year ended June 30, 2011.
The Local Plan was closed to new members effective December 31, 1957 and all present participants are fully vested. Employees were required to contribute 5% of their individual compensation for the first thirty-five years of service. The Board’s annual contribution cannot be less than the aggregate employee contributions. The employer did not make a contribution for the year ended June 30, 2011.
As provided by State law, the State of Tennessee Consolidated Retirement System (TCRS) pays the Local Plan for distribution to its retired participants amounts necessary to equalize retiree benefits as if they had retired with TCRS benefits. Contributions to the Local Plan from the TCRS amounted to $159,901 during the year ended June 30, 2011. The on-behalf payments by the state of fringe benefits and salaries for the local retirees were recognized as revenues and expenses.
The Local Plan accumulated benefits and net assets as of December 31, 2010 (the date of latest actuarial valuation report using 1971 GAM) were as follows:
Actuarial present value of accumulated plan benefits $2,280,714
Net assets available for benefits (market value) $2,466,312
The yield assumption used in the actuarial valuation was 5%.
B. Tennessee Consolidated Retirement System (TCRS)
Plan Description
Employees of Memphis City Schools are members of the Political Subdivision Pension Plan (PSPP); anagent multiple-employer defined benefit pension plan administered by the Tennessee Consolidated Retirement System (TCRS). TCRS provides retirement benefits as well as death and disability benefitsto plan members and their beneficiaries. Benefits are determined by a formula using the member’s high five-year average salary and years of service. Members become eligible to retire at the age of 60 with five years of service or at any age with 30 years of service. A reduced retirement benefit is available to vested members at the age of 55. Disability benefits are available to active members with five years of service who became disabled and cannot engage in gainful employment. There is no service requirement for disability that is the result of an accident or injury occurring while the member was in the performance of duty. Members joining the system after July 1, 1979 become vested after five years of service and members joining prior to July 1, 1979 were vested after four years of service. Benefit provisions are established in state statute found in Title 8, Chapter 34-37 of the Tennessee Code Annotated (TCA). State statutes are amended by the Tennessee General Assembly. Political subdivisions such as Memphis City Schools participate in the TCRS as individual entities and are liable
67
NOTES TO THE BASIC FINANCIAL STATEMENTS BOARD OF EDUCATION OF THEJune 30, 2011 MEMPHIS CITY SCHOOLS
for all costs associated with the operation and administration of their plan. Benefit improvements are not applicable to a political subdivision unless approved by the chief governing body.
The TCRS issues a publicly available financial report that includes financial statements and required supplementary information for the PSPP. That report may be obtained by writing to Tennessee Treasury Department, Consolidated Retirement System, 10th Floor Andrew Jackson Building, Nashville, TN 37243-0230 or can be accessed at www.tn.gov/treasury/tcrs.
2. Funding Policy
Memphis City Schools requires employees to contribute 5.0 percent of earnable compensation.
Memphis City Schools is required to contribute at an actuarially determined rate; the rate for the fiscal year ending June 30, 2011 was 9.72% of annual covered payroll. The contribution requirement of plan members is set by state statute. The contribution requirement for Memphis City Schools is established and may be amended by the TCRS Board of Trustees.
3. Annual Pension Cost
For the year ending June 30, 2011, Memphis City Schools’ annual pension cost of $15,403,294 toTCRS was equal to Memphis City Schools’ required and actual contributions. The required contribution was determined as part of the July 1, 2009 actuarial valuation using the frozen entry age actuarial cost method. Significant actuarial assumptions used in the valuation include (a) rate of return on investment of present and future assets of 7.5 percent a year compounded annually, (b) projected 3.0 percent annual rate of inflation, (c) projected salary increases of 4.75 percent (graded) annual rate (no explicit assumption is made regarding the portion attributable to the effects of inflation on salaries), (d)projected 3.5 percent annual increase in the Social Security wage base, and (e) projected post retirement increases of 2.5 percent annually. The actuarial value of assets was determined using techniques that smooth the effect of short-term volatility in the market value of total investments over a ten-year period. Memphis City Schools’ unfunded actuarial accrued liability is being amortized as a level dollar amount on a closed basis. The remaining amortization period at July 1, 2009 was 6 years.An actuarial valuation was performed as of July 1, 2009, which established contribution rates effective July 1, 2010.
4. Trend Information
Fiscal Annual Percentage NetYear Pension of APC Pension
Ending Cost (APC) Contributed Obligation
6/30/11 $15,403,294 100.00% $ -6/30/10 $13,872,839 100.00% $ -6/30/09 $13,835,468 100.00% $ -
5. Funded Status and Funding Progress
As of July 1, 2009, the most recent actuarial valuation date, the plan was 86.06% funded. The actuarial accrued liability for benefits was $442.200 million, and the actuarial value of assets was $380.540
68
NOTES TO THE BASIC FINANCIAL STATEMENTS BOARD OF EDUCATION OF THEJune 30, 2011 MEMPHIS CITY SCHOOLS
million, resulting in an unfunded actuarial accrued liability (UAAL) of $61.660 million. The covered payroll (annual payroll of active employees covered by the plan) was $140.720 million, and the ratio of the UAAL to the covered payroll was 43.82%.
The schedules of funding progress, presented as required supplementary information (RSI) following the notes to the financial statements, present multiyear trend information about whether the actuarial values of plan assets are increasing or decreasing over time relative to the AALs for benefits.
The annual required contribution (ARC) was calculated using the frozen entry age actuarial cost method. Since the frozen entry age actuarial cost method only identifies and separately amortizes the unfunded actuarial liabilities upon reestablishment of the amortization period, information about funded status and funding progress has been prepared using the entry age actuarial cost method for that purpose, and this information is intended to serve as a surrogate for the funded status and funding progress of the plan.
C. School Systems
1. Plan Description
The Memphis City Schools contribute to the State Employees, Teachers, and Higher Education Employees Pension Plan (SETHEPP), a cost-sharing multiple employers defined benefit pension plan administered by the Tennessee Consolidated Retirement System (TCRS). TCRS provides retirement benefits as well as death and disability benefits to plan members and their beneficiaries. Benefits are determined by a formula using the member’s high five-year average salary and years of service. Members become eligible to retire at the age of 60 with five years of service or at any age with 30 years of service. A reduced retirement benefit is available to vested members who are at least 55 years of age or have 25 years of service. Disability benefits are available to active members with five years of service who become disabled and cannot engage in gainful employment. There is no service requirement for disability that is the result of an accident or injury occurring while the member was in the performance of duty. Members joining the plan on or after July 1, 1979 are vested after five years of service. Members joining prior to July 1, 1979 are vested after four years of service. Benefit provisions are established in state statute found in Title 8, Chapters 34-37 of the Tennessee Code Annotated (TCA). State statutes are amended by the Tennessee General Assembly. Cost of living adjustments (COLA) are provided to retirees each July based on the percentage change in the Consumer Price Index (CPI) during the previous calendar year. No COLA is granted if the CPI increases less than one-half percent. The annual COLA is capped at three percent.
The TCRS issues a publicly available financial report that includes financial statements and required supplementary information for the SETHEPP. That report may be obtained by writing to the Tennessee Treasury Department, Consolidated Retirement System, 10th Floor Andrew Jackson Building, Nashville, TN 37243-0230 or can be accessed at http://www.tn.gov/treasury/tcrs/Schools.
2. Funding Policy
Most teachers are required by state statute to contribute 5.0% of salary to the plan. The employer contribution rate for Memphis City Schools is established at an actuarially determined rate. The employer rate for the fiscal year ending June 30, 2011 was 9.05% of annual covered payroll. The employer contribution requirement for Memphis City Schools is established and may be amended by the TCRS Board of Trustees. The employer’s contributions to TCRS for the years ending June 30,
69
NOTES TO THE BASIC FINANCIAL STATEMENTS BOARD OF EDUCATION OF THEJune 30, 2011 MEMPHIS CITY SCHOOLS
2011, 2010, and 2009 were $43,195,161, $29,906,025, $29,695,233, respectively, and equal to the required contributions for each year.
D. Other Employee Benefits
The Board provides certain health care and life insurance benefits for retired employees and their dependents/beneficiaries. As of the year ending June 30, 2011, a retiring employee hired before January 1, 2007 may continue health insurance coverage provided the employee has been covered forfive consecutive years prior to retirement. A retiring employee hired after January 1, 2007 may continue health insurance coverage provided the employee has been covered for ten consecutive years prior to retirement. Retirement is defined as those who have reached age 60 and vested or 30 years of service, or age 55 with 25 years of service. The health care benefits were provided through a self-funded plan administered by an insurance company. The life insurance benefits were provided through an insurance company. Premiums for both are based on the benefits expected to be paid during the year. The cost of health care and life insurance benefits are classified as retiree benefits expenditure in the General Fund. For the years ended June 30, 2011 and 2010 costs were $31,587,734 and$30,297,529 for 5,658 and 5,660 retirees, respectively. See note 13 for information on other postemployment benefits (OPEB).
NOTE 7 – RELATED PARTY TRANSACTIONS
The Board received certain revenue from the City of Memphis during the year ended June 30, 2011.This revenue consisted of the Board’s share of property taxes collected by the City of Memphis (see Note 1). This revenue amounted to $20,993,916 for property taxes. In addition the Chancery Court ruled that the City owes the school district its full share of the previous rate or approximately $55.1million. That ruling was upheld when the Tennessee State Supreme Court declined to hear the City of Memphis’ appeal. The Board recorded this amount as deferred revenue at the fund level.
The City of Memphis filed suit against Memphis City Schools stating that previous City Council did not have the legal authority to award gratuitously to the Board $50 million in bond funds that were used to build new schools in newly annexed areas and for ADA renovation projects.
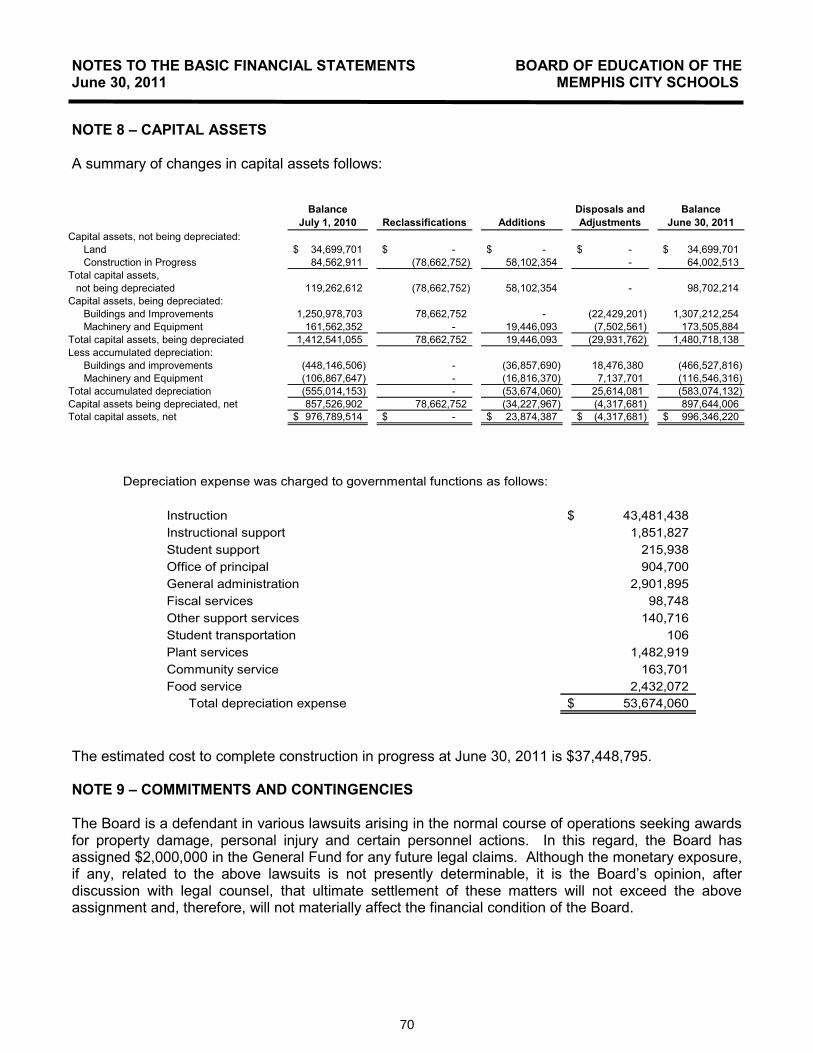
70
NOTES TO THE BASIC FINANCIAL STATEMENTS BOARD OF EDUCATION OF THEJune 30, 2011 MEMPHIS CITY SCHOOLS
NOTE 8 – CAPITAL ASSETS
A summary of changes in capital assets follows:
BalanceJuly 1, 2010 Reclassifications Additions
Disposals and Adjustments
BalanceJune 30, 2011
Capital assets, not being depreciated:Land 34,699,701$ -$ -$ -$ 34,699,701$ Construction in Progress 84,562,911 (78,662,752) 58,102,354 - 64,002,513
Total capital assets,not being depreciated 119,262,612 (78,662,752) 58,102,354 - 98,702,214
Capital assets, being depreciated:Buildings and Improvements 1,250,978,703 78,662,752 - (22,429,201) 1,307,212,254Machinery and Equipment 161,562,352 - 19,446,093 (7,502,561) 173,505,884
Total capital assets, being depreciated 1,412,541,055 78,662,752 19,446,093 (29,931,762) 1,480,718,138Less accumulated depreciation:
Buildings and improvements (448,146,506) - (36,857,690) 18,476,380 (466,527,816)Machinery and Equipment (106,867,647) - (16,816,370) 7,137,701 (116,546,316)
Total accumulated depreciation (555,014,153) - (53,674,060) 25,614,081 (583,074,132)Capital assets being depreciated, net 857,526,902 78,662,752 (34,227,967) (4,317,681) 897,644,006Total capital assets, net 976,789,514$ -$ 23,874,387$ (4,317,681)$ 996,346,220$
Depreciation expense was charged to governmental functions as follows:
Instruction 43,481,438$Instructional support 1,851,827Student support 215,938Office of principal 904,700General administration 2,901,895Fiscal services 98,748Other support services 140,716Student transportation 106Plant services 1,482,919Community service 163,701Food service 2,432,072
Total depreciation expense 53,674,060$
The estimated cost to complete construction in progress at June 30, 2011 is $37,448,795.
NOTE 9 – COMMITMENTS AND CONTINGENCIES
The Board is a defendant in various lawsuits arising in the normal course of operations seeking awards for property damage, personal injury and certain personnel actions. In this regard, the Board has assigned $2,000,000 in the General Fund for any future legal claims. Although the monetary exposure, if any, related to the above lawsuits is not presently determinable, it is the Board’s opinion, after discussion with legal counsel, that ultimate settlement of these matters will not exceed the above assignment and, therefore, will not materially affect the financial condition of the Board.
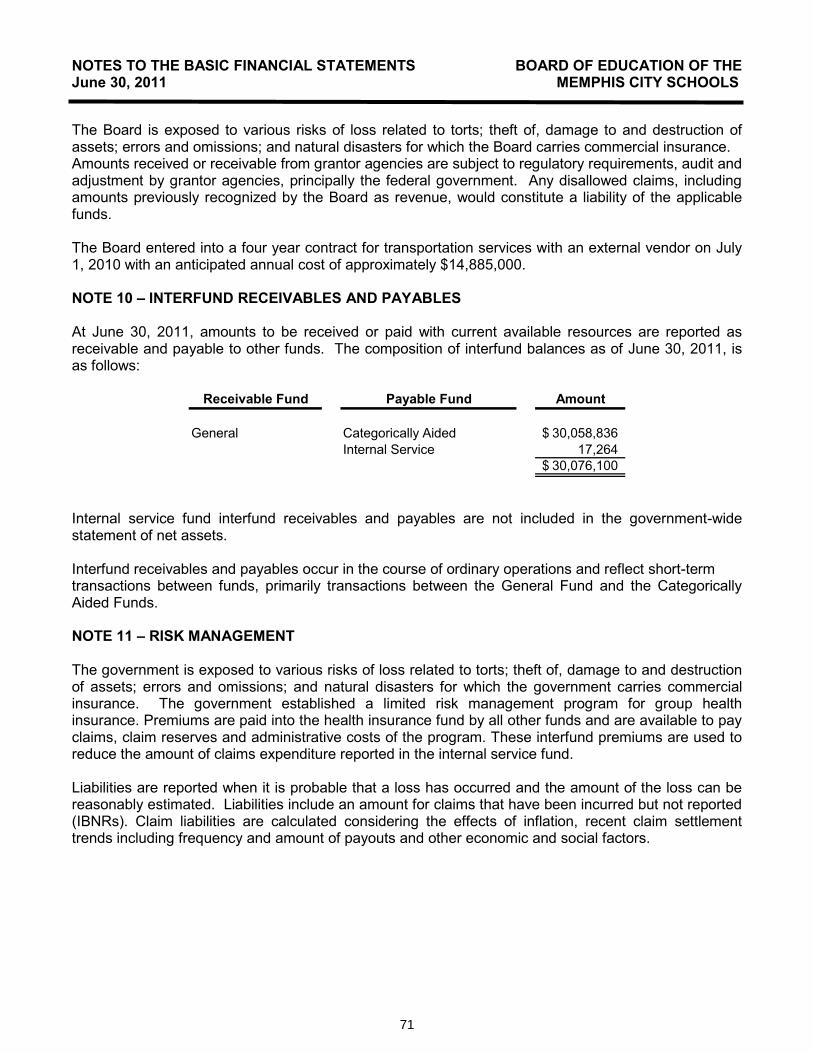
71
NOTES TO THE BASIC FINANCIAL STATEMENTS BOARD OF EDUCATION OF THEJune 30, 2011 MEMPHIS CITY SCHOOLS
The Board is exposed to various risks of loss related to torts; theft of, damage to and destruction of assets; errors and omissions; and natural disasters for which the Board carries commercial insurance.Amounts received or receivable from grantor agencies are subject to regulatory requirements, audit and adjustment by grantor agencies, principally the federal government. Any disallowed claims, including amounts previously recognized by the Board as revenue, would constitute a liability of the applicable funds.
The Board entered into a four year contract for transportation services with an external vendor on July 1, 2010 with an anticipated annual cost of approximately $14,885,000.
NOTE 10 – INTERFUND RECEIVABLES AND PAYABLES
At June 30, 2011, amounts to be received or paid with current available resources are reported as receivable and payable to other funds. The composition of interfund balances as of June 30, 2011, is as follows:
Receivable Fund Payable Fund Amount
General Categorically Aided 30,058,836$Internal Service 17,264
30,076,100$
Internal service fund interfund receivables and payables are not included in the government-wide statement of net assets.
Interfund receivables and payables occur in the course of ordinary operations and reflect short-termtransactions between funds, primarily transactions between the General Fund and the Categorically Aided Funds.
NOTE 11 – RISK MANAGEMENT
The government is exposed to various risks of loss related to torts; theft of, damage to and destruction of assets; errors and omissions; and natural disasters for which the government carries commercial insurance. The government established a limited risk management program for group health insurance. Premiums are paid into the health insurance fund by all other funds and are available to pay claims, claim reserves and administrative costs of the program. These interfund premiums are used to reduce the amount of claims expenditure reported in the internal service fund.
Liabilities are reported when it is probable that a loss has occurred and the amount of the loss can be reasonably estimated. Liabilities include an amount for claims that have been incurred but not reported (IBNRs). Claim liabilities are calculated considering the effects of inflation, recent claim settlement trends including frequency and amount of payouts and other economic and social factors.
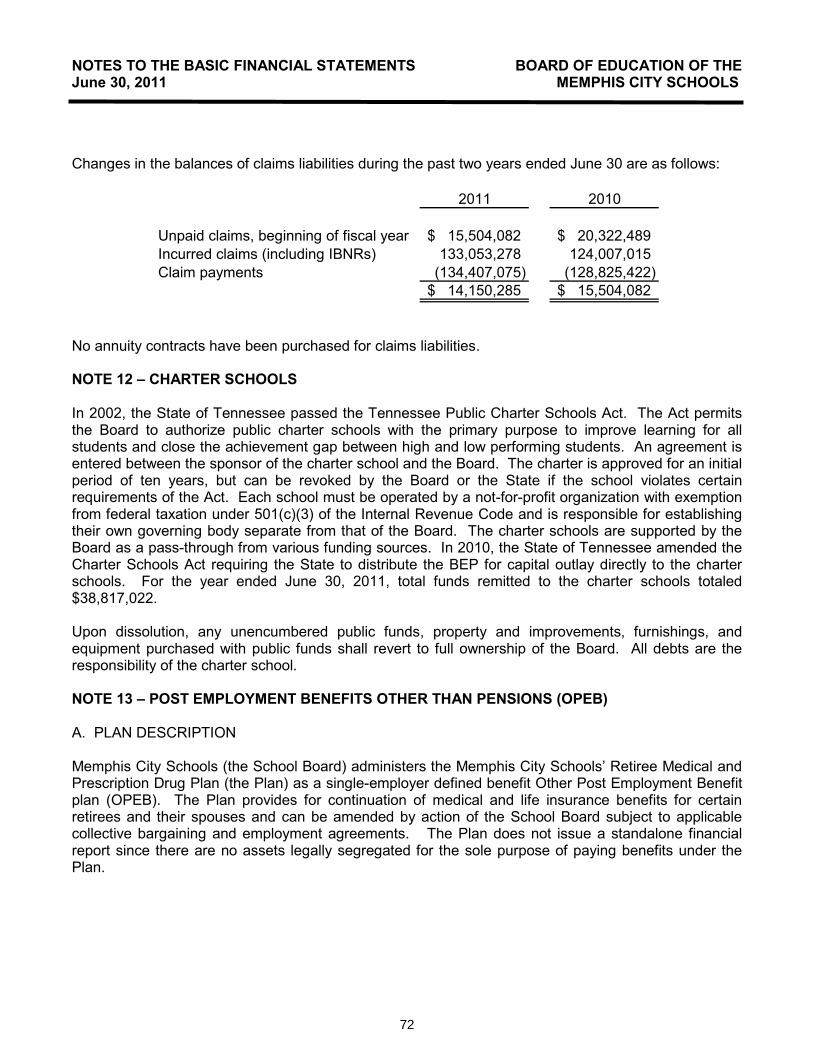
72
NOTES TO THE BASIC FINANCIAL STATEMENTS BOARD OF EDUCATION OF THEJune 30, 2011 MEMPHIS CITY SCHOOLS
Changes in the balances of claims liabilities during the past two years ended June 30 are as follows:
2011 2010
Unpaid claims, beginning of fiscal year 15,504,082$ 20,322,489$Incurred claims (including IBNRs) 133,053,278 124,007,015Claim payments (134,407,075) (128,825,422)
14,150,285$ 15,504,082$
No annuity contracts have been purchased for claims liabilities.
NOTE 12 – CHARTER SCHOOLS
In 2002, the State of Tennessee passed the Tennessee Public Charter Schools Act. The Act permits the Board to authorize public charter schools with the primary purpose to improve learning for all students and close the achievement gap between high and low performing students. An agreement is entered between the sponsor of the charter school and the Board. The charter is approved for an initial period of ten years, but can be revoked by the Board or the State if the school violates certain requirements of the Act. Each school must be operated by a not-for-profit organization with exemption from federal taxation under 501(c)(3) of the Internal Revenue Code and is responsible for establishing their own governing body separate from that of the Board. The charter schools are supported by the Board as a pass-through from various funding sources. In 2010, the State of Tennessee amended the Charter Schools Act requiring the State to distribute the BEP for capital outlay directly to the charter schools. For the year ended June 30, 2011, total funds remitted to the charter schools totaled$38,817,022.
Upon dissolution, any unencumbered public funds, property and improvements, furnishings, and equipment purchased with public funds shall revert to full ownership of the Board. All debts are the responsibility of the charter school.
NOTE 13 – POST EMPLOYMENT BENEFITS OTHER THAN PENSIONS (OPEB)
A. PLAN DESCRIPTION
Memphis City Schools (the School Board) administers the Memphis City Schools’ Retiree Medical and Prescription Drug Plan (the Plan) as a single-employer defined benefit Other Post Employment Benefit plan (OPEB). The Plan provides for continuation of medical and life insurance benefits for certain retirees and their spouses and can be amended by action of the School Board subject to applicable collective bargaining and employment agreements. The Plan does not issue a standalone financial report since there are no assets legally segregated for the sole purpose of paying benefits under the Plan.
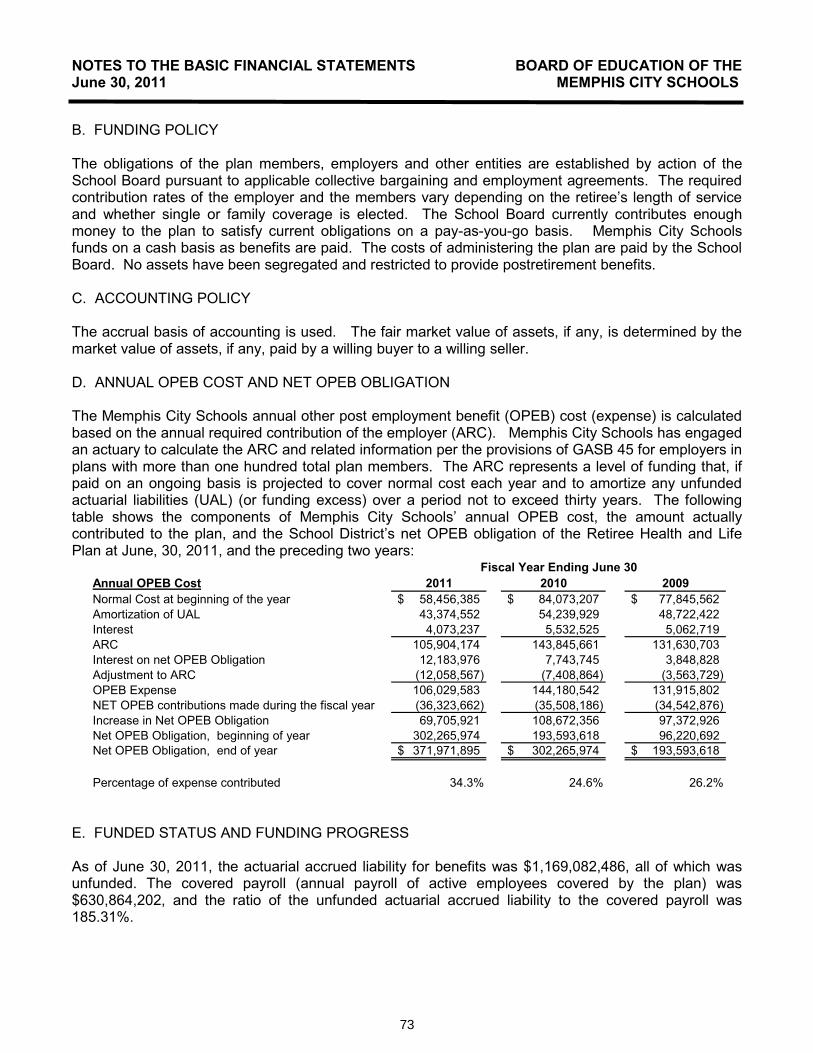
73
NOTES TO THE BASIC FINANCIAL STATEMENTS BOARD OF EDUCATION OF THEJune 30, 2011 MEMPHIS CITY SCHOOLS
B. FUNDING POLICY
The obligations of the plan members, employers and other entities are established by action of the School Board pursuant to applicable collective bargaining and employment agreements. The required contribution rates of the employer and the members vary depending on the retiree’s length of service and whether single or family coverage is elected. The School Board currently contributes enough money to the plan to satisfy current obligations on a pay-as-you-go basis. Memphis City Schools funds on a cash basis as benefits are paid. The costs of administering the plan are paid by the School Board. No assets have been segregated and restricted to provide postretirement benefits.
C. ACCOUNTING POLICY
The accrual basis of accounting is used. The fair market value of assets, if any, is determined by the market value of assets, if any, paid by a willing buyer to a willing seller.
D. ANNUAL OPEB COST AND NET OPEB OBLIGATION
The Memphis City Schools annual other post employment benefit (OPEB) cost (expense) is calculated based on the annual required contribution of the employer (ARC). Memphis City Schools has engaged an actuary to calculate the ARC and related information per the provisions of GASB 45 for employers in plans with more than one hundred total plan members. The ARC represents a level of funding that, if paid on an ongoing basis is projected to cover normal cost each year and to amortize any unfunded actuarial liabilities (UAL) (or funding excess) over a period not to exceed thirty years. The following table shows the components of Memphis City Schools’ annual OPEB cost, the amount actually contributed to the plan, and the School District’s net OPEB obligation of the Retiree Health and Life Plan at June, 30, 2011, and the preceding two years:
Annual OPEB Cost 2011 2010 2009Normal Cost at beginning of the year 58,456,385$ 84,073,207$ 77,845,562$ Amortization of UAL 43,374,552 54,239,929 48,722,422Interest 4,073,237 5,532,525 5,062,719ARC 105,904,174 143,845,661 131,630,703Interest on net OPEB Obligation 12,183,976 7,743,745 3,848,828Adjustment to ARC (12,058,567) (7,408,864) (3,563,729)OPEB Expense 106,029,583 144,180,542 131,915,802NET OPEB contributions made during the fiscal year (36,323,662) (35,508,186) (34,542,876)Increase in Net OPEB Obligation 69,705,921 108,672,356 97,372,926Net OPEB Obligation, beginning of year 302,265,974 193,593,618 96,220,692Net OPEB Obligation, end of year 371,971,895$ 302,265,974$ 193,593,618$
Percentage of expense contributed 34.3% 24.6% 26.2%
Fiscal Year Ending June 30
E. FUNDED STATUS AND FUNDING PROGRESS
As of June 30, 2011, the actuarial accrued liability for benefits was $1,169,082,486, all of which was unfunded. The covered payroll (annual payroll of active employees covered by the plan) was$630,864,202, and the ratio of the unfunded actuarial accrued liability to the covered payroll was 185.31%.
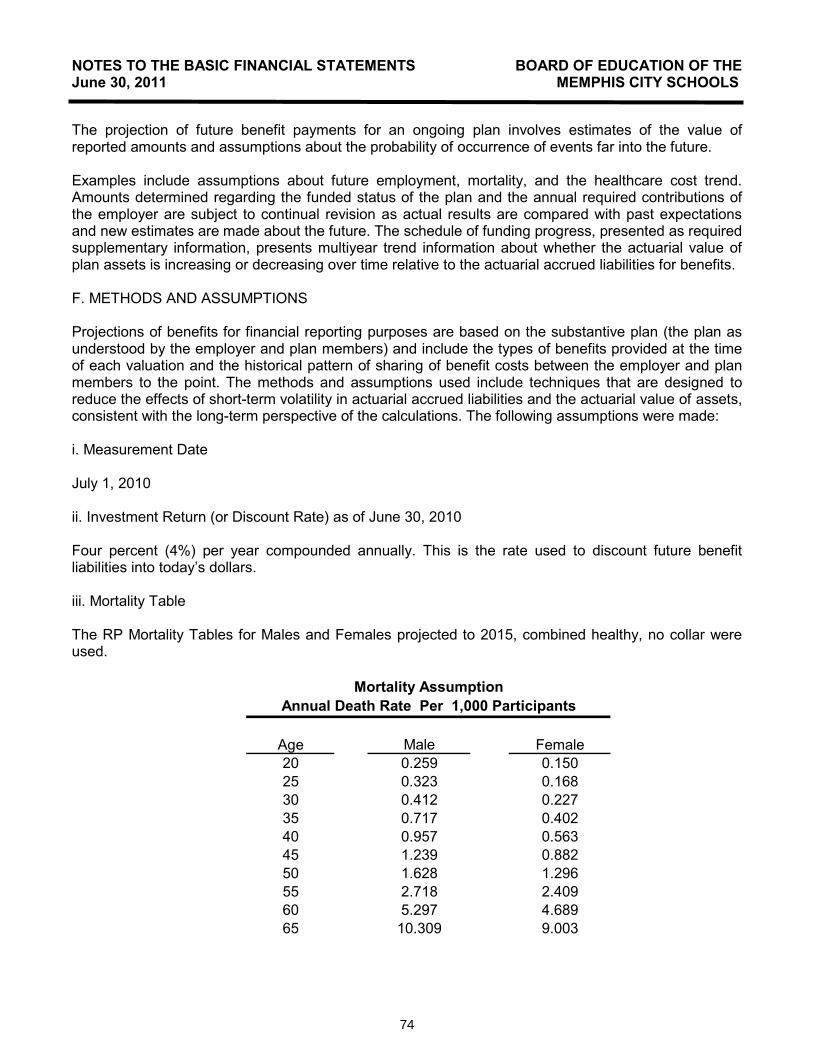
74
NOTES TO THE BASIC FINANCIAL STATEMENTS BOARD OF EDUCATION OF THEJune 30, 2011 MEMPHIS CITY SCHOOLS
The projection of future benefit payments for an ongoing plan involves estimates of the value of reported amounts and assumptions about the probability of occurrence of events far into the future.
Examples include assumptions about future employment, mortality, and the healthcare cost trend. Amounts determined regarding the funded status of the plan and the annual required contributions of the employer are subject to continual revision as actual results are compared with past expectations and new estimates are made about the future. The schedule of funding progress, presented as required supplementary information, presents multiyear trend information about whether the actuarial value of plan assets is increasing or decreasing over time relative to the actuarial accrued liabilities for benefits.
F. METHODS AND ASSUMPTIONS
Projections of benefits for financial reporting purposes are based on the substantive plan (the plan as understood by the employer and plan members) and include the types of benefits provided at the time of each valuation and the historical pattern of sharing of benefit costs between the employer and plan members to the point. The methods and assumptions used include techniques that are designed to reduce the effects of short-term volatility in actuarial accrued liabilities and the actuarial value of assets,consistent with the long-term perspective of the calculations. The following assumptions were made:
i. Measurement Date
July 1, 2010
ii. Investment Return (or Discount Rate) as of June 30, 2010
Four percent (4%) per year compounded annually. This is the rate used to discount future benefitliabilities into today’s dollars.
iii. Mortality Table
The RP Mortality Tables for Males and Females projected to 2015, combined healthy, no collar were used.
Mortality AssumptionAnnual Death Rate Per 1,000 Participants
Age Male Female20 0.259 0.15025 0.323 0.16830 0.412 0.22735 0.717 0.40240 0.957 0.56345 1.239 0.88250 1.628 1.29655 2.718 2.40960 5.297 4.68965 10.309 9.003
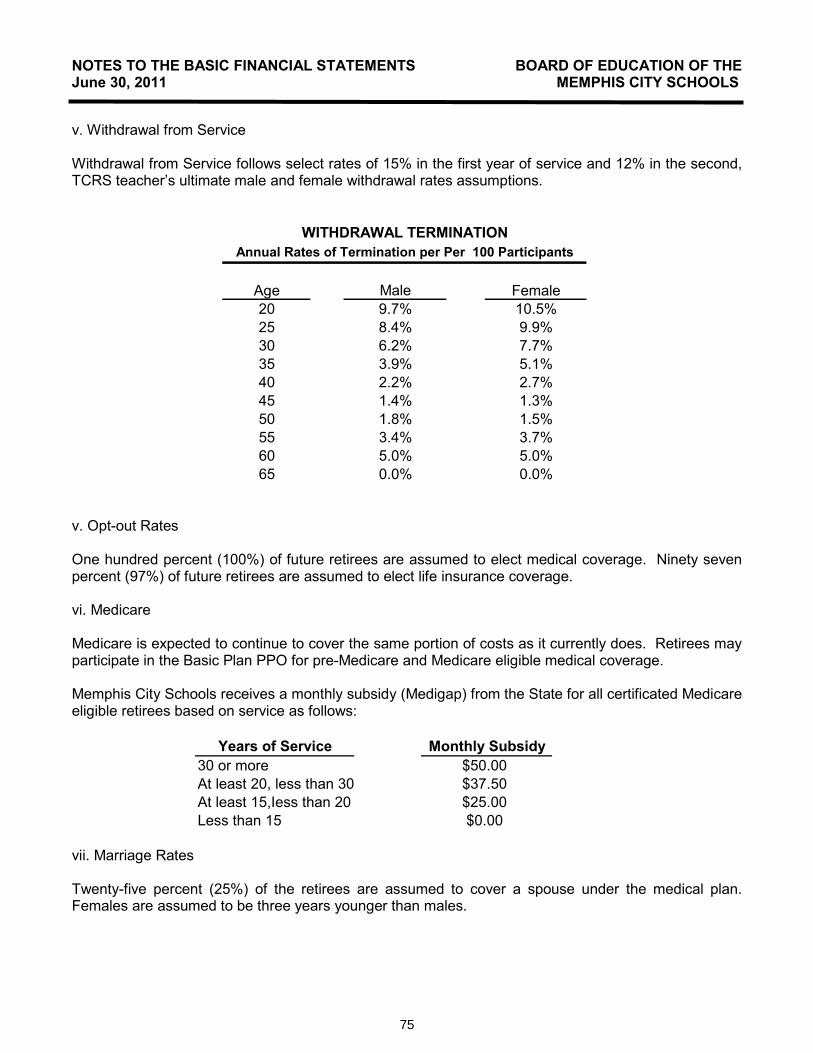
75
NOTES TO THE BASIC FINANCIAL STATEMENTS BOARD OF EDUCATION OF THEJune 30, 2011 MEMPHIS CITY SCHOOLS
v. Withdrawal from Service
Withdrawal from Service follows select rates of 15% in the first year of service and 12% in the second, TCRS teacher’s ultimate male and female withdrawal rates assumptions.
WITHDRAWAL TERMINATIONAnnual Rates of Termination per Per 100 Participants
Age Male Female20 9.7% 10.5%25 8.4% 9.9%30 6.2% 7.7%35 3.9% 5.1%40 2.2% 2.7%45 1.4% 1.3%50 1.8% 1.5%55 3.4% 3.7%60 5.0% 5.0%65 0.0% 0.0%
v. Opt-out Rates
One hundred percent (100%) of future retirees are assumed to elect medical coverage. Ninety seven percent (97%) of future retirees are assumed to elect life insurance coverage.
vi. Medicare
Medicare is expected to continue to cover the same portion of costs as it currently does. Retirees may participate in the Basic Plan PPO for pre-Medicare and Medicare eligible medical coverage.
Memphis City Schools receives a monthly subsidy (Medigap) from the State for all certificated Medicare eligible retirees based on service as follows:
Years of Service Monthly Subsidy30 or more $50.00At least 20, less than 30 $37.50At least 15,Iess than 20 $25.00Less than 15 $0.00
vii. Marriage Rates
Twenty-five percent (25%) of the retirees are assumed to cover a spouse under the medical plan.Females are assumed to be three years younger than males.
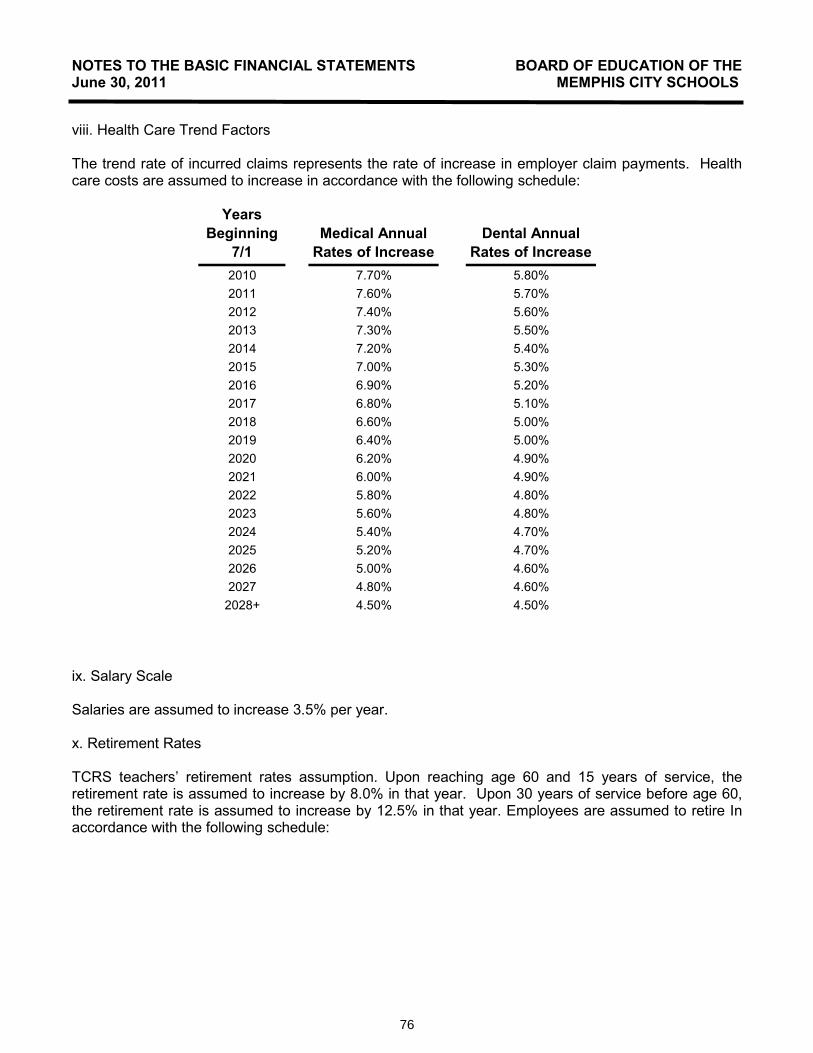
76
NOTES TO THE BASIC FINANCIAL STATEMENTS BOARD OF EDUCATION OF THEJune 30, 2011 MEMPHIS CITY SCHOOLS
viii. Health Care Trend Factors
The trend rate of incurred claims represents the rate of increase in employer claim payments. Health care costs are assumed to increase in accordance with the following schedule:
Years Beginning
7/1Medical Annual
Rates of IncreaseDental Annual
Rates of Increase2010 7.70% 5.80%2011 7.60% 5.70%2012 7.40% 5.60%2013 7.30% 5.50%2014 7.20% 5.40%2015 7.00% 5.30%2016 6.90% 5.20%2017 6.80% 5.10%2018 6.60% 5.00%2019 6.40% 5.00%2020 6.20% 4.90%2021 6.00% 4.90%2022 5.80% 4.80%2023 5.60% 4.80%2024 5.40% 4.70%2025 5.20% 4.70%2026 5.00% 4.60%2027 4.80% 4.60%
2028+ 4.50% 4.50%
ix. Salary Scale
Salaries are assumed to increase 3.5% per year.
x. Retirement Rates
TCRS teachers’ retirement rates assumption. Upon reaching age 60 and 15 years of service, the retirement rate is assumed to increase by 8.0% in that year. Upon 30 years of service before age 60, the retirement rate is assumed to increase by 12.5% in that year. Employees are assumed to retire In accordance with the following schedule:
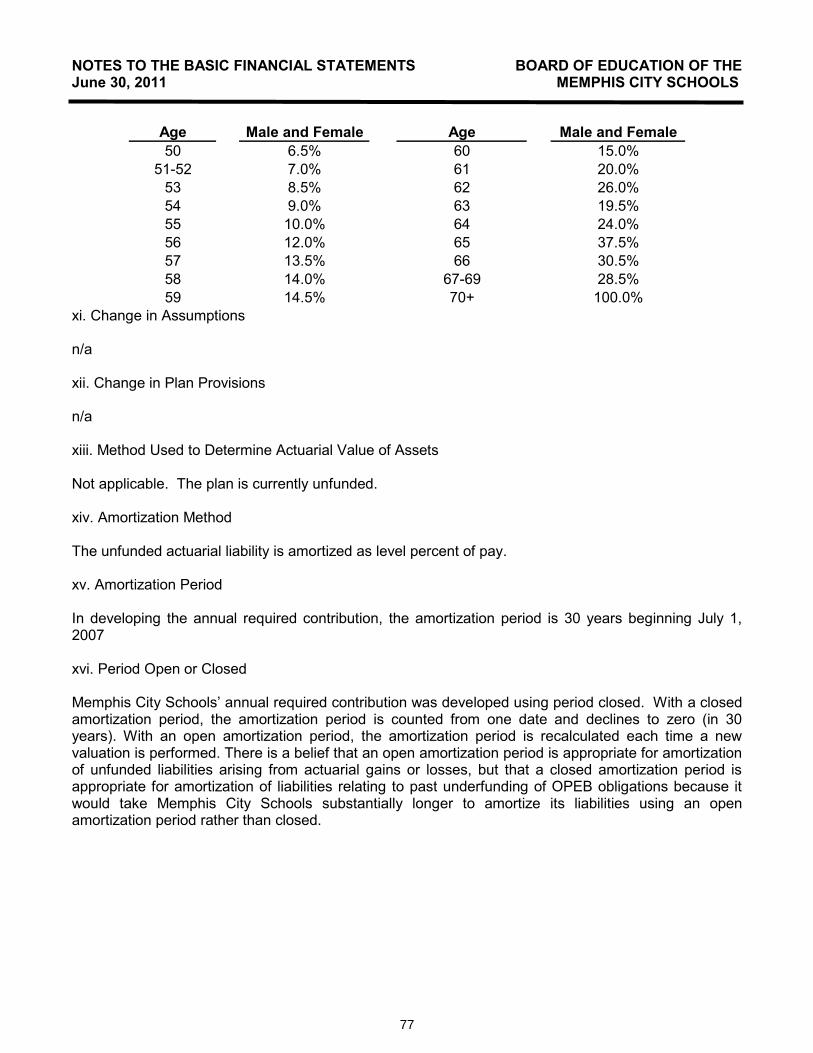
77
NOTES TO THE BASIC FINANCIAL STATEMENTS BOARD OF EDUCATION OF THEJune 30, 2011 MEMPHIS CITY SCHOOLS
Age Male and Female Age Male and Female50 6.5% 60 15.0%
51-52 7.0% 61 20.0%53 8.5% 62 26.0%54 9.0% 63 19.5%55 10.0% 64 24.0%56 12.0% 65 37.5%57 13.5% 66 30.5%58 14.0% 67-69 28.5%59 14.5% 70+ 100.0%
xi. Change in Assumptions
n/a
xii. Change in Plan Provisions
n/a
xiii. Method Used to Determine Actuarial Value of Assets
Not applicable. The plan is currently unfunded.
xiv. Amortization Method
The unfunded actuarial liability is amortized as level percent of pay.
xv. Amortization Period
In developing the annual required contribution, the amortization period is 30 years beginning July 1, 2007
xvi. Period Open or Closed
Memphis City Schools’ annual required contribution was developed using period closed. With a closed amortization period, the amortization period is counted from one date and declines to zero (in 30 years). With an open amortization period, the amortization period is recalculated each time a new valuation is performed. There is a belief that an open amortization period is appropriate for amortization of unfunded liabilities arising from actuarial gains or losses, but that a closed amortization period isappropriate for amortization of liabilities relating to past underfunding of OPEB obligations because it would take Memphis City Schools substantially longer to amortize its liabilities using an open amortization period rather than closed.
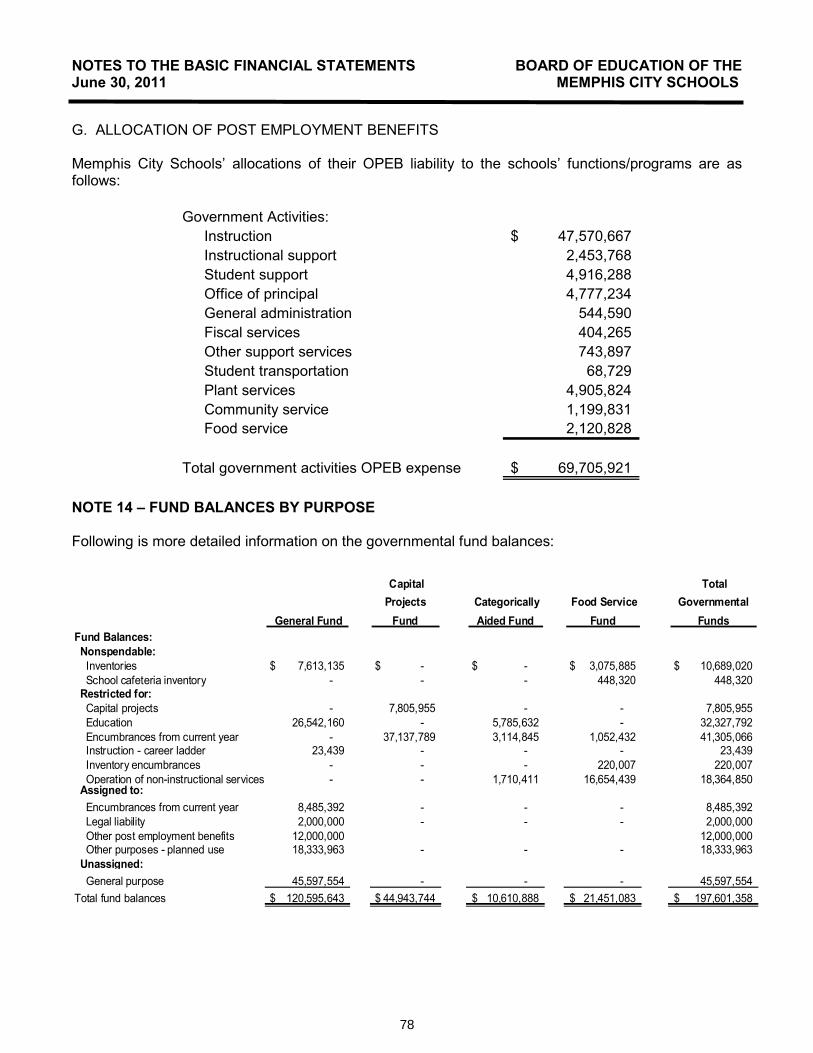
78
NOTES TO THE BASIC FINANCIAL STATEMENTS BOARD OF EDUCATION OF THEJune 30, 2011 MEMPHIS CITY SCHOOLS
G. ALLOCATION OF POST EMPLOYMENT BENEFITS
Memphis City Schools’ allocations of their OPEB liability to the schools’ functions/programs are as follows:
Government Activities:Instruction 47,570,667$ Instructional support 2,453,768Student support 4,916,288Office of principal 4,777,234General administration 544,590Fiscal services 404,265Other support services 743,897Student transportation 68,729Plant services 4,905,824Community service 1,199,831Food service 2,120,828
Total government activities OPEB expense 69,705,921$
NOTE 14 – FUND BALANCES BY PURPOSE
Following is more detailed information on the governmental fund balances:
General Fund
Capital Projects
Fund Categorically Aided Fund
Food Service Fund
TotalGovernmental
Funds Fund Balances: Nonspendable: Inventories 7,613,135$ -$ -$ 3,075,885$ 10,689,020$ School cafeteria inventory - - - 448,320 448,320 Restricted for: Capital projects - 7,805,955 - - 7,805,955 Education 26,542,160 - 5,785,632 - 32,327,792 Encumbrances from current year - 37,137,789 3,114,845 1,052,432 41,305,066 Instruction - career ladder 23,439 - - - 23,439 Inventory encumbrances - - - 220,007 220,007 Operation of non-instructional services - - 1,710,411 16,654,439 18,364,850 Assigned to: Encumbrances from current year 8,485,392 - - - 8,485,392 Legal liability 2,000,000 - - - 2,000,000 Other post employment benefits 12,000,000 12,000,000 Other purposes - planned use 18,333,963 - - - 18,333,963 Unassigned: General purpose 45,597,554 - - - 45,597,554 Total fund balances 120,595,643$ 44,943,744$ 10,610,888$ 21,451,083$ 197,601,358$
79
NOTES TO THE BASIC FINANCIAL STATEMENTS BOARD OF EDUCATION OF THEJune 30, 2011 MEMPHIS CITY SCHOOLS
NOTE 15 – SUBSEQUENT EVENT
United States District Judge Samuel “Hardy” Mays ruled on August 8, 2011, that Memphis City Schools will cease to exist at the conclusion of the 2012-13 school year. In addition, he also ruled that the current Shelby County School Board was “unconstitutional”. In order to cure the unconstitutionality of the County School Board, the parties agreed on a Memorandum of Understanding that will allow the current nine Memphis City School Board members, the seven Shelby County Board members and seven board members to be appointed by the Shelby County Board of Commissioner to govern both Districts during the transition period.
In order to remain in compliance with the Norris-Todd law (Tennessee Senate bill 25), a 21 member planning commission was appointed by the Memphis City Schools Board of Commissioners, Shelby County School Board, the Mayor of Shelby County, the Governor of Tennessee and the Speaker of the Tennessee House. The purpose of the Planning Commission is to develop a plan to present to the Shelby County Board of Education for merging the two school districts.

80
This page left intentionally blank

81
REQUIRED SUPPLEMENTARY INFORMATION
Required Supplementary Information

82
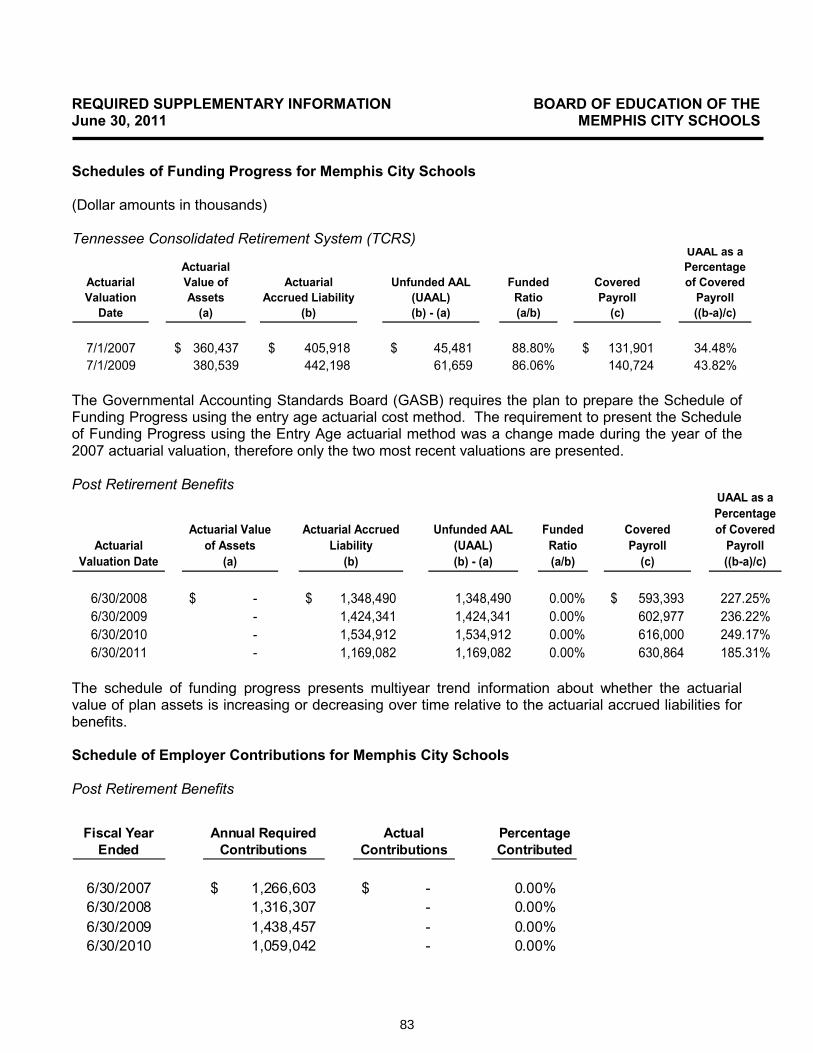
83
Schedules of Funding Progress and Schedule of Employer Contributions
REQUIRED SUPPLEMENTARY INFORMATION BOARD OF EDUCATION OF THEJune 30, 2011 MEMPHIS CITY SCHOOLS
Schedules of Funding Progress for Memphis City Schools
(Dollar amounts in thousands)
Tennessee Consolidated Retirement System (TCRS)
Actuarial Valuation
Date
Actuarial Value of Assets
(a)
Actuarial Accrued Liability
(b)
Unfunded AAL (UAAL)(b) - (a)
Funded Ratio(a/b)
Covered Payroll
(c)
UAAL as a Percentage of Covered
Payroll((b-a)/c)
7/1/2007 360,437$ 405,918$ 45,481$ 88.80% 131,901$ 34.48%7/1/2009 380,539 442,198 61,659 86.06% 140,724 43.82%
The Governmental Accounting Standards Board (GASB) requires the plan to prepare the Schedule of Funding Progress using the entry age actuarial cost method. The requirement to present the Schedule of Funding Progress using the Entry Age actuarial method was a change made during the year of the 2007 actuarial valuation, therefore only the two most recent valuations are presented.
Post Retirement Benefits
Actuarial Valuation Date
Actuarial Value of Assets
(a)
Actuarial Accrued Liability
(b)
Unfunded AAL (UAAL)(b) - (a)
Funded Ratio(a/b)
Covered Payroll
(c)
UAAL as a Percentage of Covered
Payroll((b-a)/c)
6/30/2008 -$ 1,348,490$ 1,348,490 0.00% 593,393$ 227.25%6/30/2009 - 1,424,341 1,424,341 0.00% 602,977 236.22%6/30/2010 - 1,534,912 1,534,912 0.00% 616,000 249.17%6/30/2011 - 1,169,082 1,169,082 0.00% 630,864 185.31%
The schedule of funding progress presents multiyear trend information about whether the actuarial value of plan assets is increasing or decreasing over time relative to the actuarial accrued liabilities for benefits.
Schedule of Employer Contributions for Memphis City Schools
Post Retirement Benefits
Fiscal Year Ended
Annual Required Contributions
Actual Contributions
Percentage Contributed
6/30/2007 1,266,603$ -$ 0.00%6/30/2008 1,316,307 - 0.00%6/30/2009 1,438,457 - 0.00%6/30/2010 1,059,042 - 0.00%

84
This page left intentionally blank
85
COMBINING AND INDIVIDUAL FUND STATEMENTS AND SCHEDULES
COMBINING INFORMATIONINTERNAL SERVICE FUNDS

86
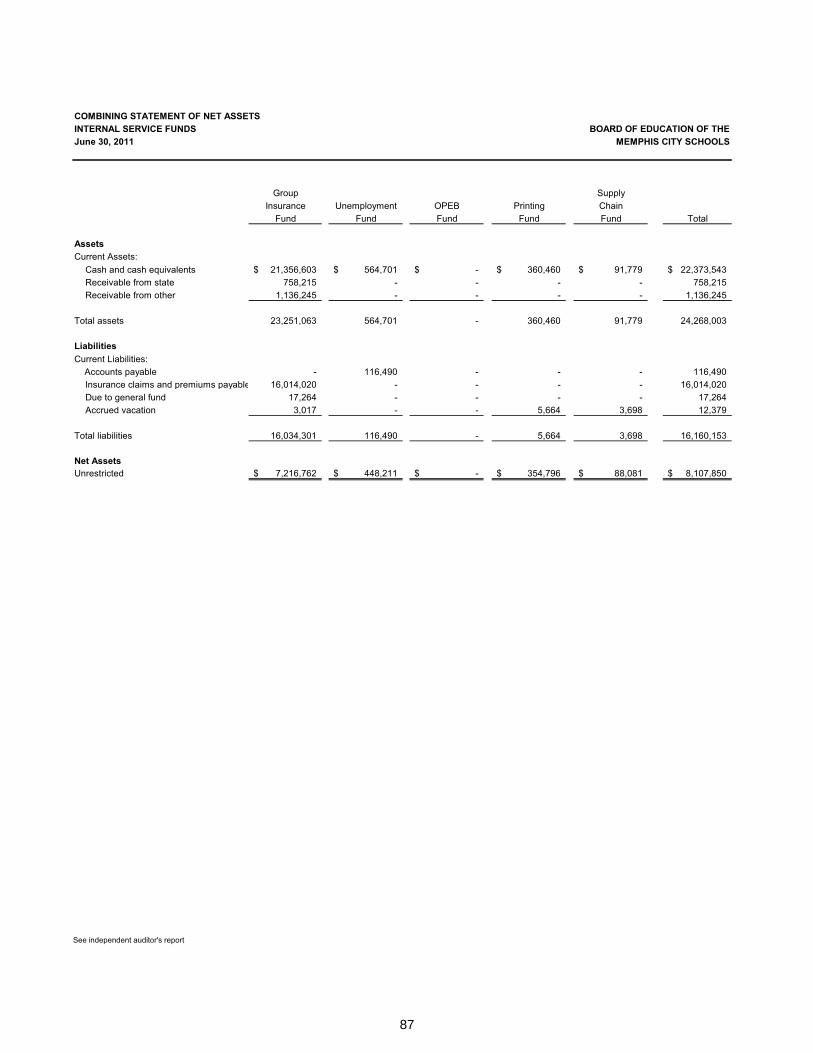
87
Combining Statement of Net Assets – Internal Service Funds
See independent auditor's report
COMBINING STATEMENT OF NET ASSETSINTERNAL SERVICE FUNDS BOARD OF EDUCATION OF THEJune 30, 2011 MEMPHIS CITY SCHOOLS
Group SupplyInsurance Unemployment OPEB Printing Chain
Fund Fund Fund Fund Fund Total
AssetsCurrent Assets:
Cash and cash equivalents 21,356,603$ 564,701$ -$ 360,460$ 91,779$ 22,373,543$Receivable from state 758,215 - - - - 758,215Receivable from other 1,136,245 - - - - 1,136,245
Total assets 23,251,063 564,701 - 360,460 91,779 24,268,003
LiabilitiesCurrent Liabilities: Accounts payable - 116,490 - - - 116,490
Insurance claims and premiums payable 16,014,020 - - - - 16,014,020Due to general fund 17,264 - - - - 17,264Accrued vacation 3,017 - - 5,664 3,698 12,379
Total liabilities 16,034,301 116,490 - 5,664 3,698 16,160,153
Net AssetsUnrestricted 7,216,762$ 448,211$ -$ 354,796$ 88,081$ 8,107,850$
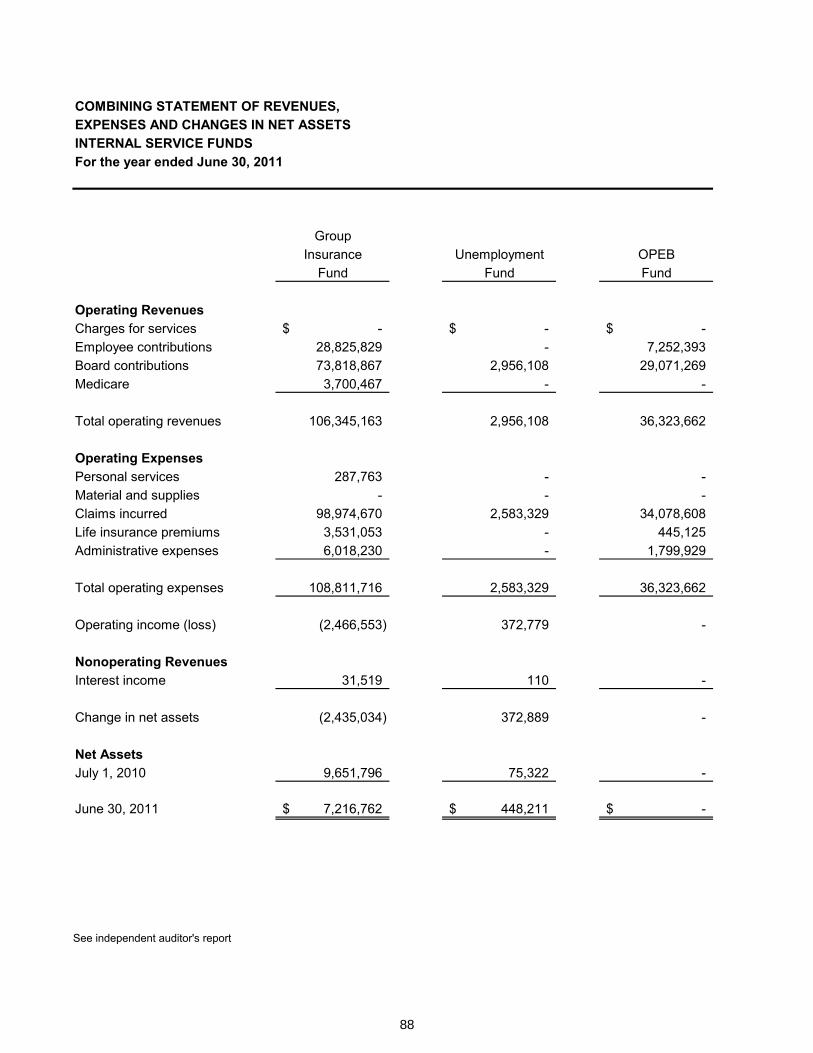
88
Combining Statement of Revenues, Expenses and Changes in Net Assets – Internal Service Funds
See independent auditor's report
COMBINING STATEMENT OF REVENUES, EXPENSES AND CHANGES IN NET ASSETSINTERNAL SERVICE FUNDSFor the year ended June 30, 2011
GroupInsurance Unemployment OPEB
Fund Fund Fund
Operating RevenuesCharges for services -$ -$ -$Employee contributions 28,825,829 - 7,252,393Board contributions 73,818,867 2,956,108 29,071,269Medicare 3,700,467 - -
Total operating revenues 106,345,163 2,956,108 36,323,662
Operating ExpensesPersonal services 287,763 - -Material and supplies - - -Claims incurred 98,974,670 2,583,329 34,078,608Life insurance premiums 3,531,053 - 445,125Administrative expenses 6,018,230 - 1,799,929
Total operating expenses 108,811,716 2,583,329 36,323,662
Operating income (loss) (2,466,553) 372,779 -
Nonoperating RevenuesInterest income 31,519 110 -
Change in net assets (2,435,034) 372,889 -
Net AssetsJuly 1, 2010 9,651,796 75,322 -
June 30, 2011 7,216,762$ 448,211$ -$
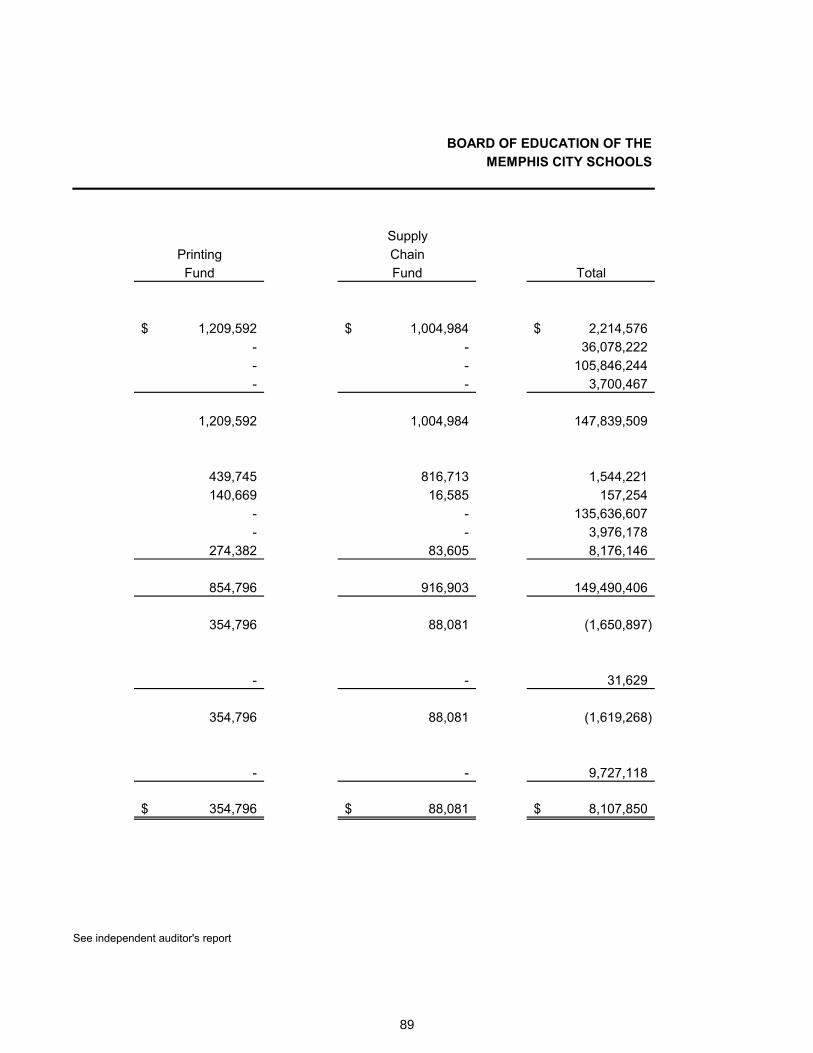
89
See independent auditor's report
BOARD OF EDUCATION OF THE MEMPHIS CITY SCHOOLS
SupplyPrinting ChainFund Fund Total
1,209,592$ 1,004,984$ 2,214,576$- - 36,078,222- - 105,846,244- - 3,700,467
1,209,592 1,004,984 147,839,509
439,745 816,713 1,544,221140,669 16,585 157,254
- - 135,636,607- - 3,976,178
274,382 83,605 8,176,146
854,796 916,903 149,490,406
354,796 88,081 (1,650,897)
- - 31,629
354,796 88,081 (1,619,268)
- - 9,727,118
354,796$ 88,081$ 8,107,850$
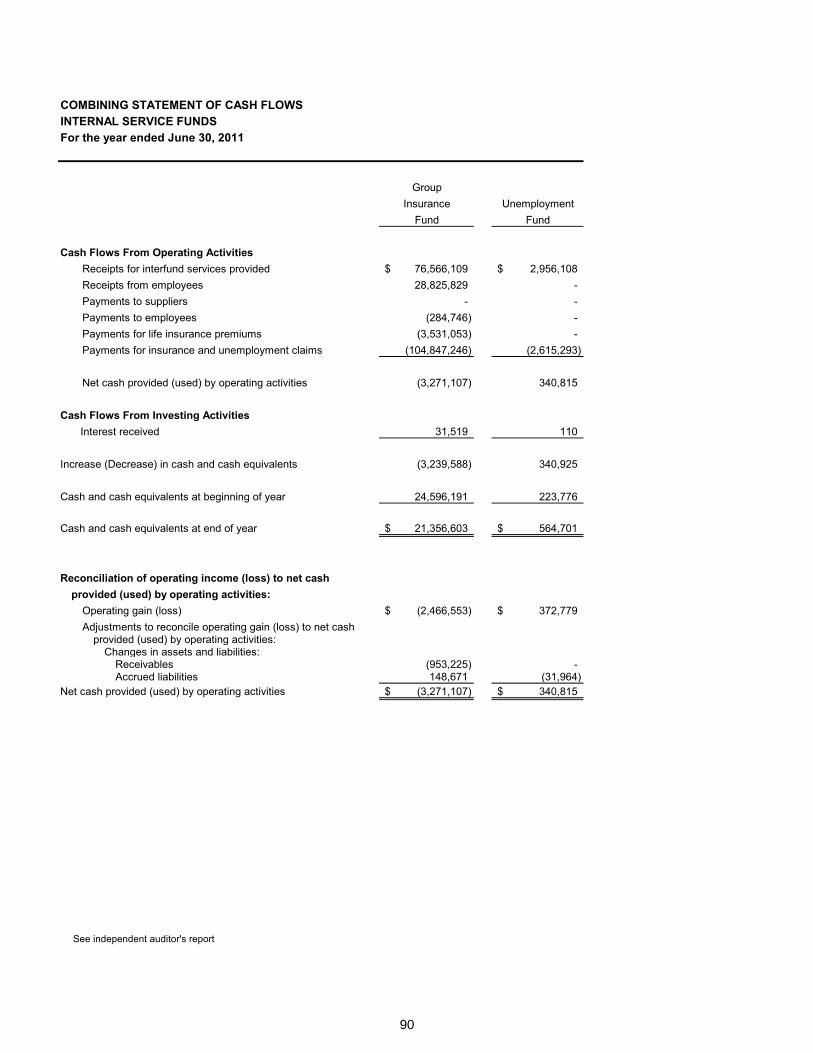
90
Combining Statement of Cash Flows – Internal Service Funds
See independent auditor's report
COMBINING STATEMENT OF CASH FLOWSINTERNAL SERVICE FUNDSFor the year ended June 30, 2011
GroupInsurance Unemployment
Fund Fund
Cash Flows From Operating ActivitiesReceipts for interfund services provided 76,566,109$ 2,956,108$ Receipts from employees 28,825,829 - Payments to suppliers - - Payments to employees (284,746) - Payments for life insurance premiums (3,531,053) - Payments for insurance and unemployment claims (104,847,246) (2,615,293)
Net cash provided (used) by operating activities (3,271,107) 340,815
Cash Flows From Investing Activities Interest received 31,519 110
Increase (Decrease) in cash and cash equivalents (3,239,588) 340,925
Cash and cash equivalents at beginning of year 24,596,191 223,776
Cash and cash equivalents at end of year 21,356,603$ 564,701$
Reconciliation of operating income (loss) to net cashprovided (used) by operating activities:
Operating gain (loss) (2,466,553)$ 372,779$ Adjustments to reconcile operating gain (loss) to net cash
provided (used) by operating activities:Changes in assets and liabilities:
Receivables (953,225) - Accrued liabilities 148,671 (31,964)
Net cash provided (used) by operating activities (3,271,107)$ 340,815$
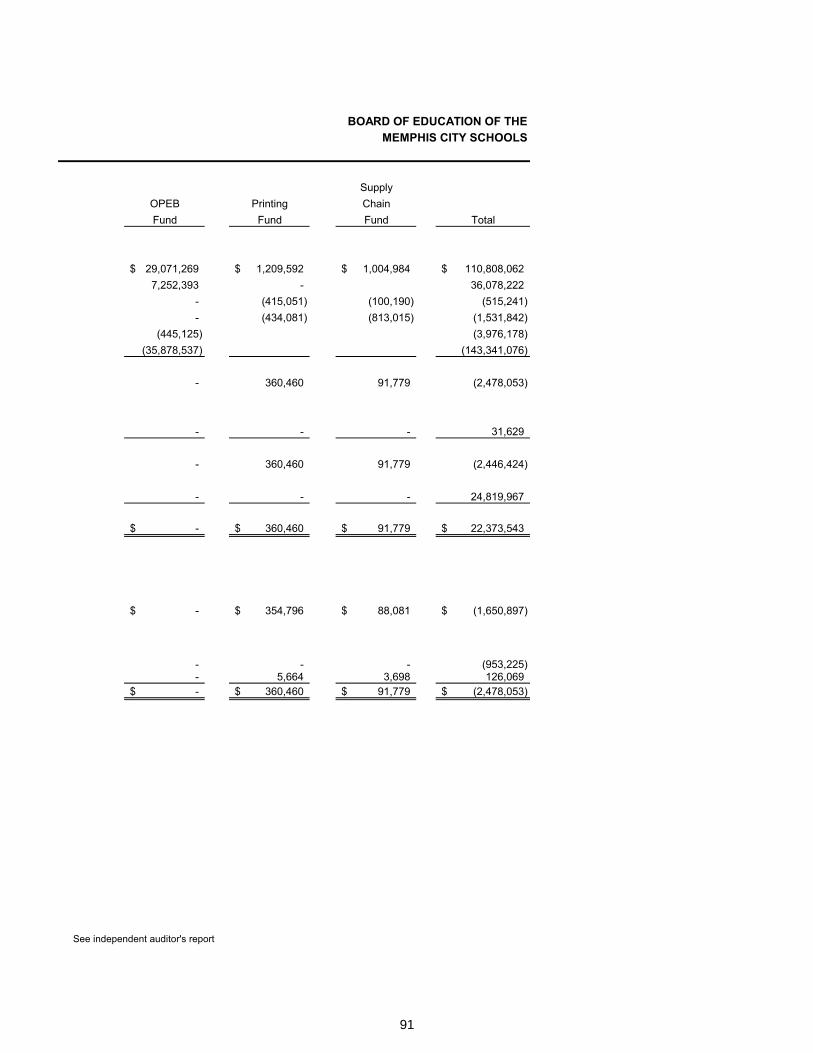
91
See independent auditor's report
BOARD OF EDUCATION OF THE MEMPHIS CITY SCHOOLS
SupplyOPEB Printing ChainFund Fund Fund Total
29,071,269$ 1,209,592$ 1,004,984$ 110,808,062$7,252,393 - 36,078,222
- (415,051) (100,190) (515,241) - (434,081) (813,015) (1,531,842)
(445,125) (3,976,178) (35,878,537) (143,341,076)
- 360,460 91,779 (2,478,053)
- - - 31,629
- 360,460 91,779 (2,446,424)
- - - 24,819,967
-$ 360,460$ 91,779$ 22,373,543$
-$ 354,796$ 88,081$ (1,650,897)$
- - - (953,225) - 5,664 3,698 126,069 -$ 360,460$ 91,779$ (2,478,053)$

92
This page left intentionally blank

93
Other Supplementary Statements and Schedules

94
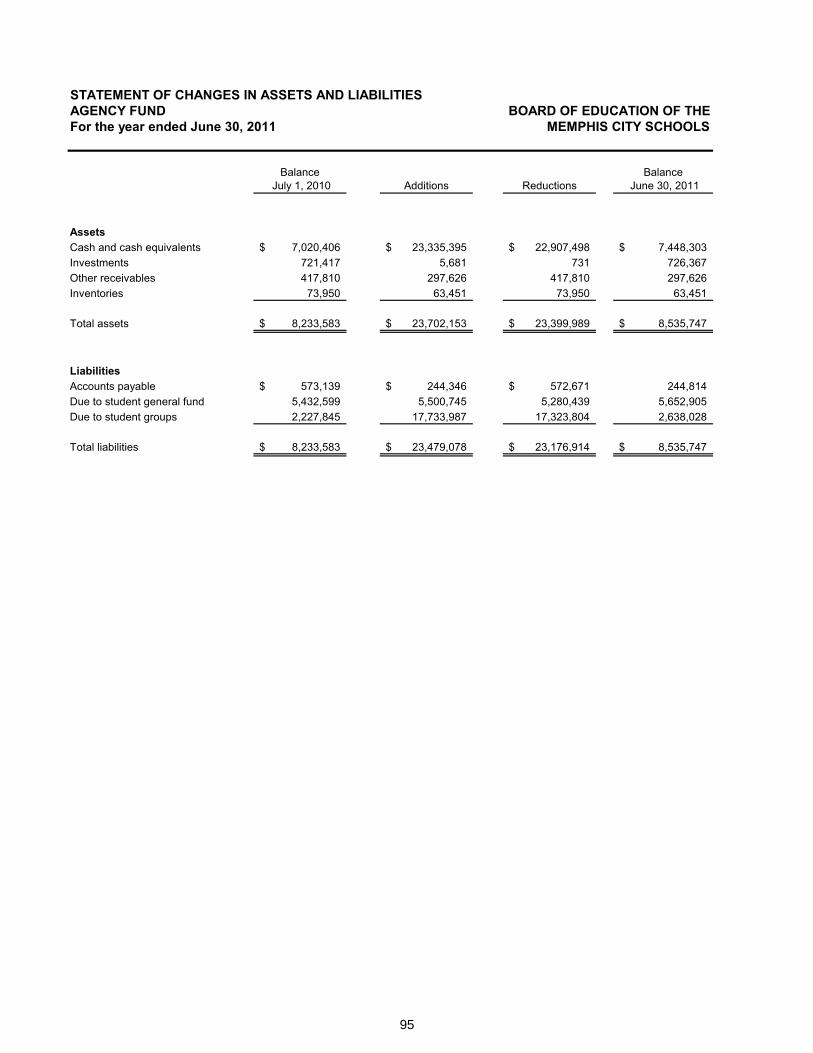
95
Statement of Changes in Assets and Liabilities – Agency Fund
STATEMENT OF CHANGES IN ASSETS AND LIABILITIESAGENCY FUND BOARD OF EDUCATION OF THEFor the year ended June 30, 2011 MEMPHIS CITY SCHOOLS
Balance July 1, 2010 Additions Reductions
Balance June 30, 2011
AssetsCash and cash equivalents 7,020,406$ 23,335,395$ 22,907,498$ 7,448,303$ Investments 721,417 5,681 731 726,367 Other receivables 417,810 297,626 417,810 297,626 Inventories 73,950 63,451 73,950 63,451
Total assets 8,233,583$ 23,702,153$ 23,399,989$ 8,535,747$
LiabilitiesAccounts payable 573,139$ 244,346$ 572,671$ 244,814 Due to student general fund 5,432,599 5,500,745 5,280,439 5,652,905 Due to student groups 2,227,845 17,733,987 17,323,804 2,638,028
Total liabilities 8,233,583$ 23,479,078$ 23,176,914$ 8,535,747$

96
This page left intentionally blank
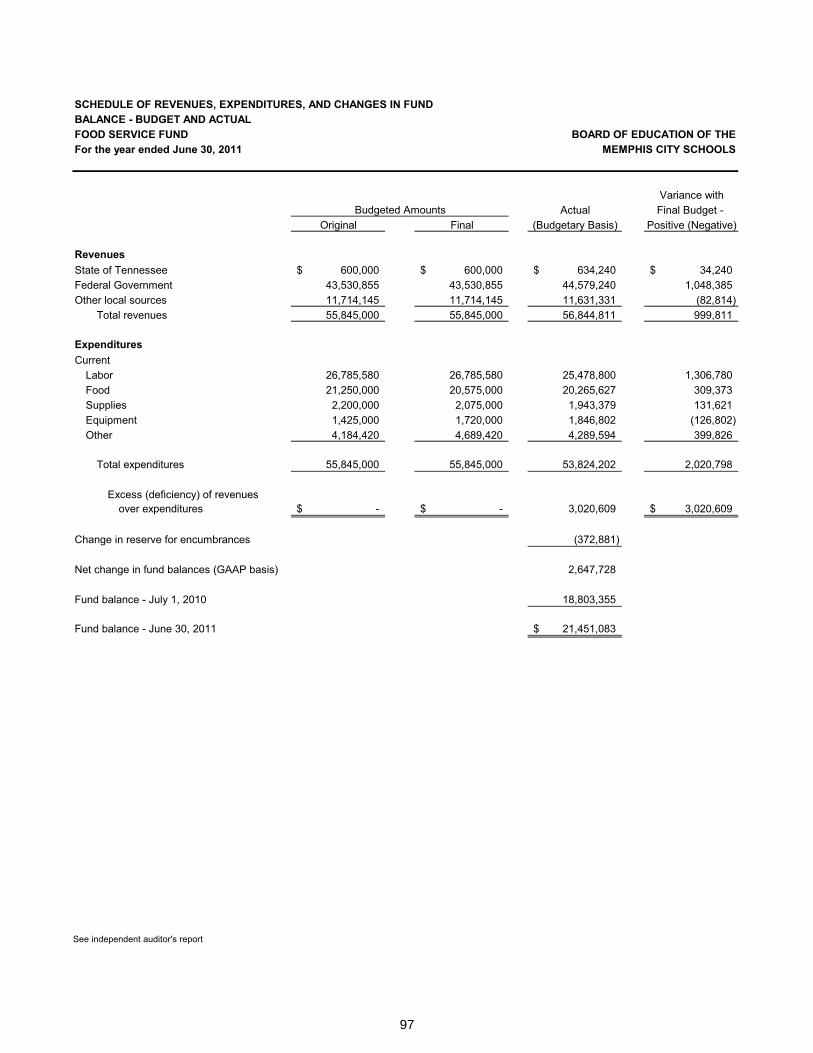
97
Schedule of Revenues, Expenditures and Changes in Fund Balance – Budget and Actual – Food Service Fund
See independent auditor's report
SCHEDULE OF REVENUES, EXPENDITURES, AND CHANGES IN FUND BALANCE - BUDGET AND ACTUALFOOD SERVICE FUND BOARD OF EDUCATION OF THEFor the year ended June 30, 2011 MEMPHIS CITY SCHOOLS
Variance withActual Final Budget -
Original Final (Budgetary Basis) Positive (Negative)
RevenuesState of Tennessee 600,000$ 600,000$ 634,240$ 34,240$ Federal Government 43,530,855 43,530,855 44,579,240 1,048,385 Other local sources 11,714,145 11,714,145 11,631,331 (82,814)
Total revenues 55,845,000 55,845,000 56,844,811 999,811
ExpendituresCurrent
Labor 26,785,580 26,785,580 25,478,800 1,306,780 Food 21,250,000 20,575,000 20,265,627 309,373 Supplies 2,200,000 2,075,000 1,943,379 131,621 Equipment 1,425,000 1,720,000 1,846,802 (126,802) Other 4,184,420 4,689,420 4,289,594 399,826
Total expenditures 55,845,000 55,845,000 53,824,202 2,020,798
Excess (deficiency) of revenuesover expenditures -$ -$ 3,020,609 3,020,609$
Change in reserve for encumbrances (372,881)
Net change in fund balances (GAAP basis) 2,647,728
Fund balance - July 1, 2010 18,803,355
Fund balance - June 30, 2011 21,451,083$
Budgeted Amounts
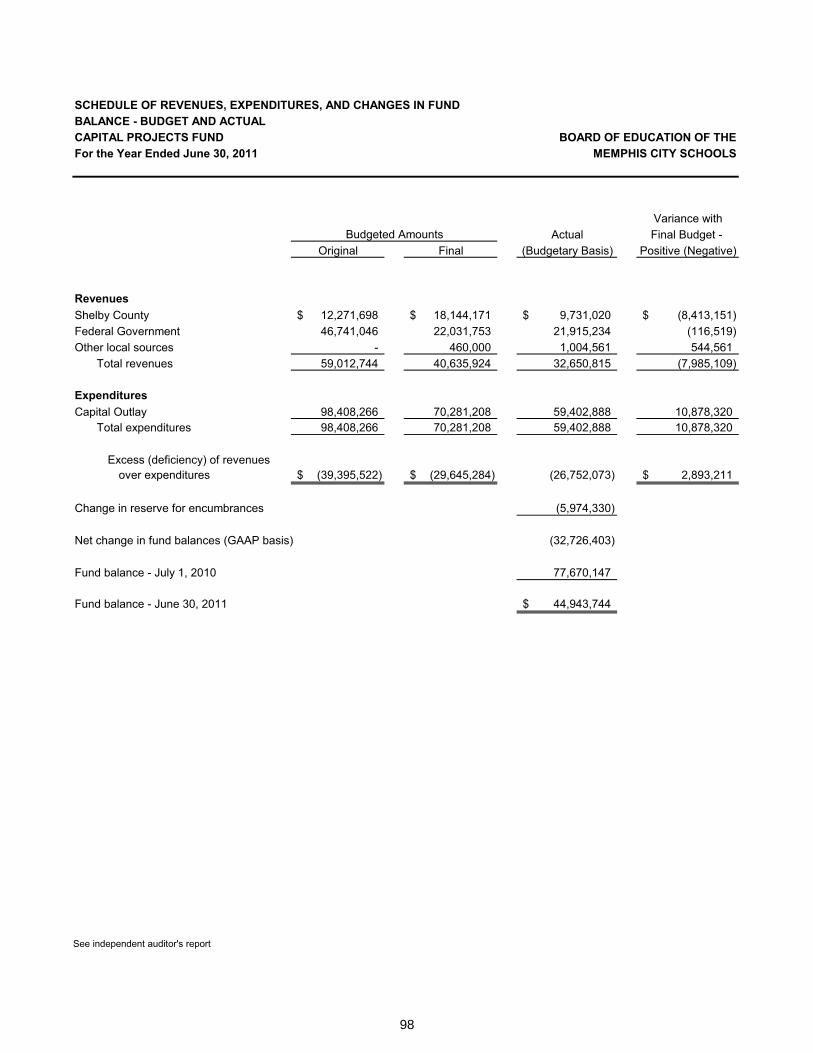
98
Capital Assets InformationSchedule of Revenues, Expenditures, and Changes in Fund Balance – Budget and Actual – Capital Projects Fund
See independent auditor's report
SCHEDULE OF REVENUES, EXPENDITURES, AND CHANGES IN FUND BALANCE - BUDGET AND ACTUALCAPITAL PROJECTS FUND BOARD OF EDUCATION OF THEFor the Year Ended June 30, 2011 MEMPHIS CITY SCHOOLS
Variance withActual Final Budget -
Original Final (Budgetary Basis) Positive (Negative)
RevenuesShelby County 12,271,698$ 18,144,171$ 9,731,020$ (8,413,151)$ Federal Government 46,741,046 22,031,753 21,915,234 (116,519)Other local sources - 460,000 1,004,561 544,561
Total revenues 59,012,744 40,635,924 32,650,815 (7,985,109)
ExpendituresCapital Outlay 98,408,266 70,281,208 59,402,888 10,878,320
Total expenditures 98,408,266 70,281,208 59,402,888 10,878,320
Excess (deficiency) of revenuesover expenditures (39,395,522)$ (29,645,284)$ (26,752,073) 2,893,211$
Change in reserve for encumbrances (5,974,330)
Net change in fund balances (GAAP basis) (32,726,403)
Fund balance - July 1, 2010 77,670,147
Fund balance - June 30, 2011 44,943,744$
Budgeted Amounts
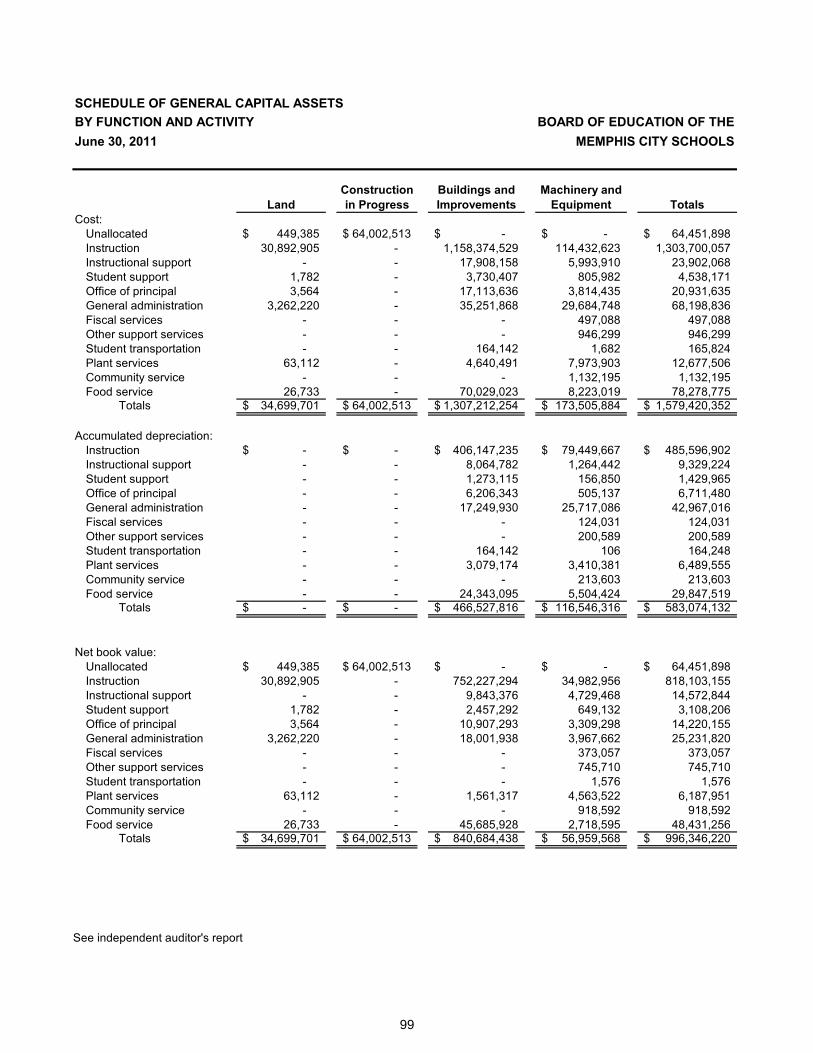
99
Schedule of General Capital Assets by Function and Activity
See independent auditor's report
SCHEDULE OF GENERAL CAPITAL ASSETSBY FUNCTION AND ACTIVITY BOARD OF EDUCATION OF THEJune 30, 2011 MEMPHIS CITY SCHOOLS
LandConstruction in Progress
Buildings and Improvements
Machinery and Equipment Totals
Cost:Unallocated 449,385$ 64,002,513$ -$ -$ 64,451,898$Instruction 30,892,905 - 1,158,374,529 114,432,623 1,303,700,057Instructional support - - 17,908,158 5,993,910 23,902,068Student support 1,782 - 3,730,407 805,982 4,538,171Office of principal 3,564 - 17,113,636 3,814,435 20,931,635General administration 3,262,220 - 35,251,868 29,684,748 68,198,836Fiscal services - - - 497,088 497,088Other support services - - - 946,299 946,299Student transportation - - 164,142 1,682 165,824Plant services 63,112 - 4,640,491 7,973,903 12,677,506Community service - - - 1,132,195 1,132,195Food service 26,733 - 70,029,023 8,223,019 78,278,775
Totals 34,699,701$ 64,002,513$ 1,307,212,254$ 173,505,884$ 1,579,420,352$
Accumulated depreciation:Instruction -$ -$ 406,147,235$ 79,449,667$ 485,596,902$Instructional support - - 8,064,782 1,264,442 9,329,224Student support - - 1,273,115 156,850 1,429,965Office of principal - - 6,206,343 505,137 6,711,480General administration - - 17,249,930 25,717,086 42,967,016Fiscal services - - - 124,031 124,031Other support services - - - 200,589 200,589Student transportation - - 164,142 106 164,248Plant services - - 3,079,174 3,410,381 6,489,555Community service - - - 213,603 213,603Food service - - 24,343,095 5,504,424 29,847,519
Totals -$ -$ 466,527,816$ 116,546,316$ 583,074,132$
Net book value:Unallocated 449,385$ 64,002,513$ -$ -$ 64,451,898$Instruction 30,892,905 - 752,227,294 34,982,956 818,103,155Instructional support - - 9,843,376 4,729,468 14,572,844Student support 1,782 - 2,457,292 649,132 3,108,206Office of principal 3,564 - 10,907,293 3,309,298 14,220,155General administration 3,262,220 - 18,001,938 3,967,662 25,231,820Fiscal services - - - 373,057 373,057Other support services - - - 745,710 745,710Student transportation - - - 1,576 1,576Plant services 63,112 - 1,561,317 4,563,522 6,187,951Community service - - - 918,592 918,592Food service 26,733 - 45,685,928 2,718,595 48,431,256
Totals 34,699,701$ 64,002,513$ 840,684,438$ 56,959,568$ 996,346,220$
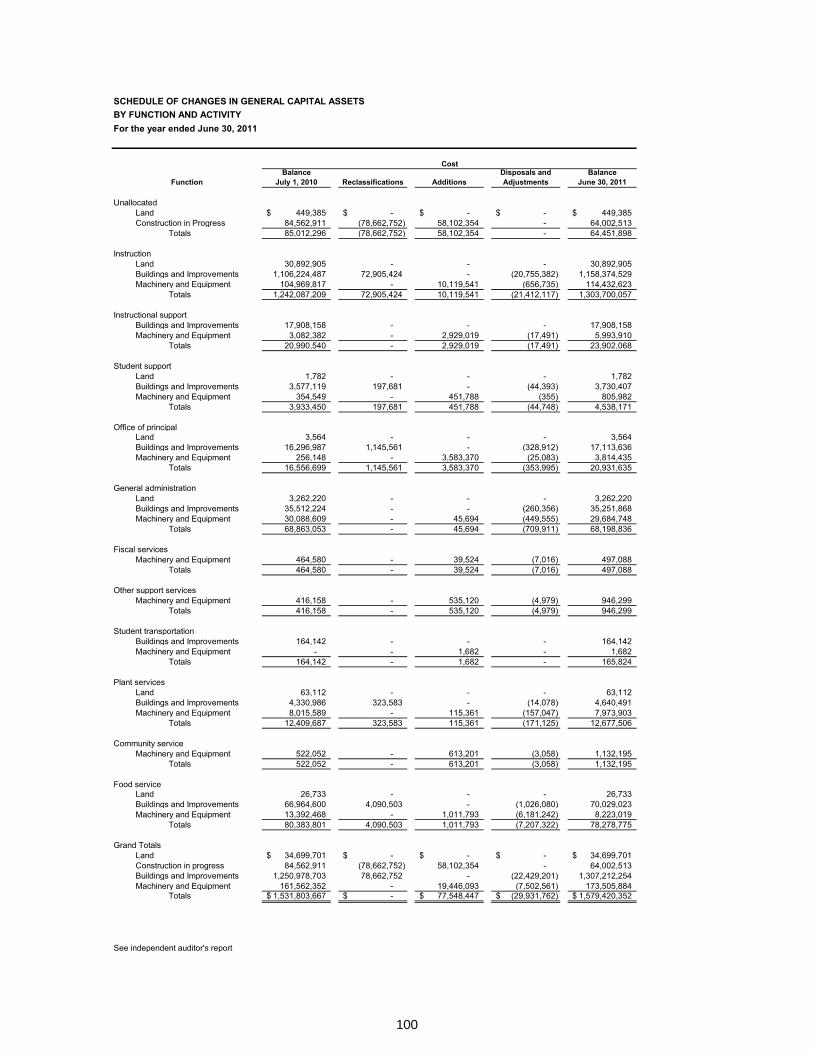
100
Schedule of Changes in General Capital Assets by Function and Activity
SCHEDULE OF CHANGES IN GENERAL CAPITAL ASSETSBY FUNCTION AND ACTIVITYFor the year ended June 30, 2011
Cost
FunctionBalance
July 1, 2010 Reclassifications AdditionsDisposals and Adjustments
BalanceJune 30, 2011
UnallocatedLand 449,385$ -$ -$ -$ 449,385$Construction in Progress 84,562,911 (78,662,752) 58,102,354 - 64,002,513
Totals 85,012,296 (78,662,752) 58,102,354 - 64,451,898
InstructionLand 30,892,905 - - - 30,892,905Buildings and Improvements 1,106,224,487 72,905,424 - (20,755,382) 1,158,374,529Machinery and Equipment 104,969,817 - 10,119,541 (656,735) 114,432,623
Totals 1,242,087,209 72,905,424 10,119,541 (21,412,117) 1,303,700,057
Instructional supportBuildings and Improvements 17,908,158 - - - 17,908,158Machinery and Equipment 3,082,382 - 2,929,019 (17,491) 5,993,910
Totals 20,990,540 - 2,929,019 (17,491) 23,902,068
Student supportLand 1,782 - - - 1,782Buildings and Improvements 3,577,119 197,681 - (44,393) 3,730,407Machinery and Equipment 354,549 - 451,788 (355) 805,982
Totals 3,933,450 197,681 451,788 (44,748) 4,538,171
Office of principalLand 3,564 - - - 3,564Buildings and Improvements 16,296,987 1,145,561 - (328,912) 17,113,636Machinery and Equipment 256,148 - 3,583,370 (25,083) 3,814,435
Totals 16,556,699 1,145,561 3,583,370 (353,995) 20,931,635
General administrationLand 3,262,220 - - - 3,262,220Buildings and Improvements 35,512,224 - - (260,356) 35,251,868Machinery and Equipment 30,088,609 - 45,694 (449,555) 29,684,748
Totals 68,863,053 - 45,694 (709,911) 68,198,836
Fiscal servicesMachinery and Equipment 464,580 - 39,524 (7,016) 497,088
Totals 464,580 - 39,524 (7,016) 497,088
Other support servicesMachinery and Equipment 416,158 - 535,120 (4,979) 946,299
Totals 416,158 - 535,120 (4,979) 946,299
Student transportationBuildings and Improvements 164,142 - - - 164,142Machinery and Equipment - - 1,682 - 1,682
Totals 164,142 - 1,682 - 165,824
Plant servicesLand 63,112 - - - 63,112Buildings and Improvements 4,330,986 323,583 - (14,078) 4,640,491Machinery and Equipment 8,015,589 - 115,361 (157,047) 7,973,903
Totals 12,409,687 323,583 115,361 (171,125) 12,677,506
Community serviceMachinery and Equipment 522,052 - 613,201 (3,058) 1,132,195
Totals 522,052 - 613,201 (3,058) 1,132,195
Food serviceLand 26,733 - - - 26,733Buildings and Improvements 66,964,600 4,090,503 - (1,026,080) 70,029,023Machinery and Equipment 13,392,468 - 1,011,793 (6,181,242) 8,223,019
Totals 80,383,801 4,090,503 1,011,793 (7,207,322) 78,278,775
Grand TotalsLand 34,699,701$ -$ -$ -$ 34,699,701$Construction in progress 84,562,911 (78,662,752) 58,102,354 - 64,002,513Buildings and Improvements 1,250,978,703 78,662,752 - (22,429,201) 1,307,212,254Machinery and Equipment 161,562,352 - 19,446,093 (7,502,561) 173,505,884
Totals 1,531,803,667$ -$ 77,548,447$ (29,931,762)$ 1,579,420,352$
See independent auditor's report
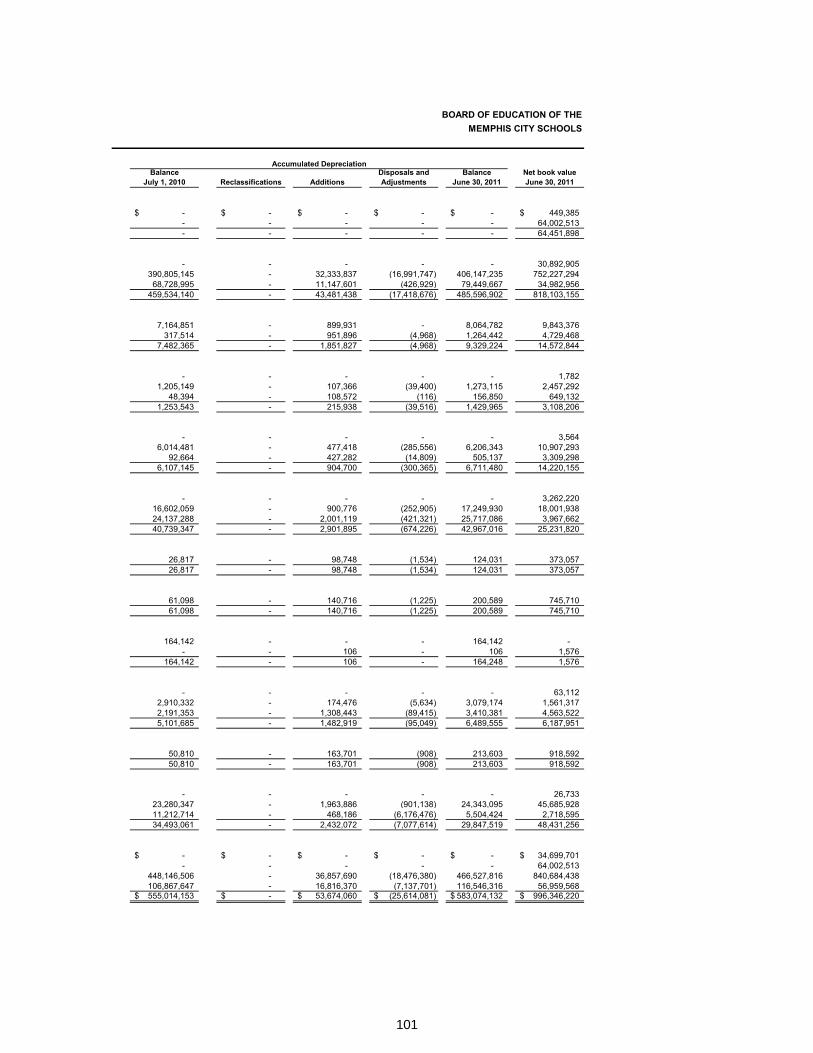
101
BOARD OF EDUCATION OF THEMEMPHIS CITY SCHOOLS
Accumulated DepreciationBalance
July 1, 2010 Reclassifications AdditionsDisposals and Adjustments
BalanceJune 30, 2011
Net book valueJune 30, 2011
-$ -$ -$ -$ -$ 449,385$- - - - - 64,002,513- - - - - 64,451,898
- - - - - 30,892,905390,805,145 - 32,333,837 (16,991,747) 406,147,235 752,227,294
68,728,995 - 11,147,601 (426,929) 79,449,667 34,982,956459,534,140 - 43,481,438 (17,418,676) 485,596,902 818,103,155
7,164,851 - 899,931 - 8,064,782 9,843,376317,514 - 951,896 (4,968) 1,264,442 4,729,468
7,482,365 - 1,851,827 (4,968) 9,329,224 14,572,844
- - - - - 1,7821,205,149 - 107,366 (39,400) 1,273,115 2,457,292
48,394 - 108,572 (116) 156,850 649,1321,253,543 - 215,938 (39,516) 1,429,965 3,108,206
- - - - - 3,5646,014,481 - 477,418 (285,556) 6,206,343 10,907,293
92,664 - 427,282 (14,809) 505,137 3,309,2986,107,145 - 904,700 (300,365) 6,711,480 14,220,155
- - - - - 3,262,22016,602,059 - 900,776 (252,905) 17,249,930 18,001,93824,137,288 - 2,001,119 (421,321) 25,717,086 3,967,66240,739,347 - 2,901,895 (674,226) 42,967,016 25,231,820
26,817 - 98,748 (1,534) 124,031 373,05726,817 - 98,748 (1,534) 124,031 373,057
61,098 - 140,716 (1,225) 200,589 745,71061,098 - 140,716 (1,225) 200,589 745,710
164,142 - - - 164,142 -- - 106 - 106 1,576
164,142 - 106 - 164,248 1,576
- - - - - 63,1122,910,332 - 174,476 (5,634) 3,079,174 1,561,3172,191,353 - 1,308,443 (89,415) 3,410,381 4,563,5225,101,685 - 1,482,919 (95,049) 6,489,555 6,187,951
50,810 - 163,701 (908) 213,603 918,59250,810 - 163,701 (908) 213,603 918,592
- - - - - 26,73323,280,347 - 1,963,886 (901,138) 24,343,095 45,685,92811,212,714 - 468,186 (6,176,476) 5,504,424 2,718,59534,493,061 - 2,432,072 (7,077,614) 29,847,519 48,431,256
-$ -$ -$ -$ -$ 34,699,701$- - - - - 64,002,513
448,146,506 - 36,857,690 (18,476,380) 466,527,816 840,684,438106,867,647 - 16,816,370 (7,137,701) 116,546,316 56,959,568555,014,153$ -$ 53,674,060$ (25,614,081)$ 583,074,132$ 996,346,220$
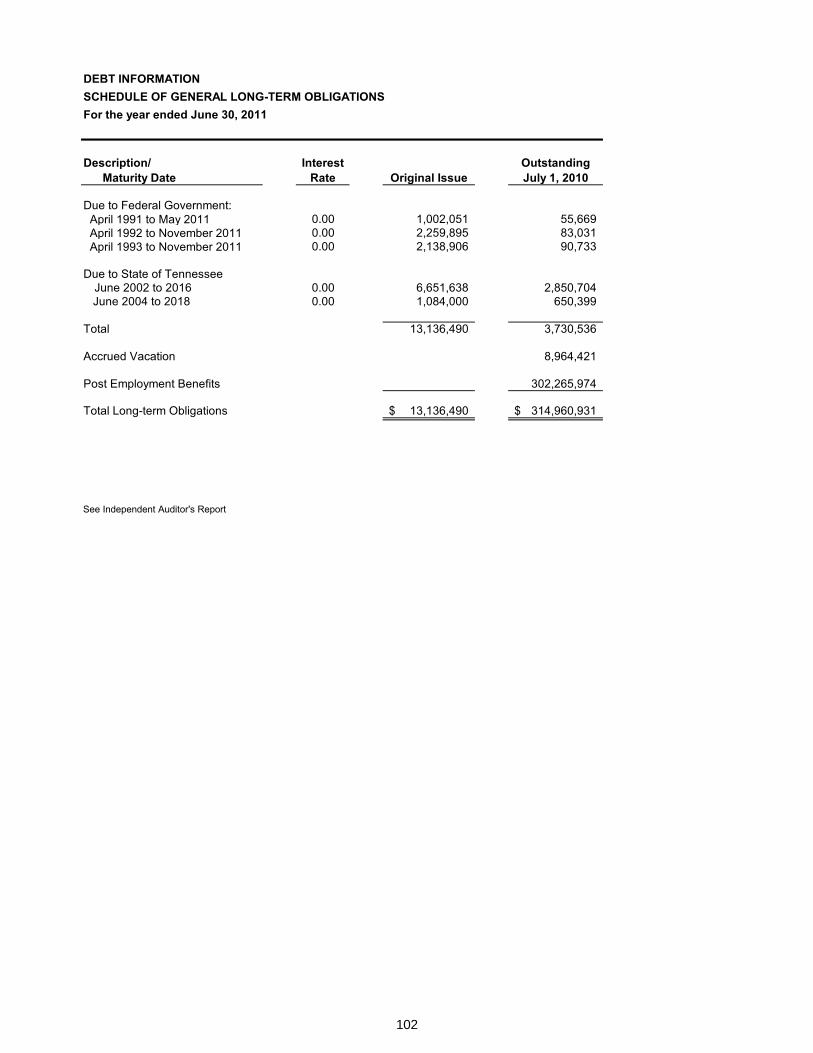
102
Debt InformationSchedule of General Long-Term ObligationsDEBT INFORMATION
SCHEDULE OF GENERAL LONG-TERM OBLIGATIONSFor the year ended June 30, 2011
Description/ Maturity Date
Interest Rate Original Issue
Outstanding July 1, 2010
Due to Federal Government: April 1991 to May 2011 0.00 1,002,051 55,669 April 1992 to November 2011 0.00 2,259,895 83,031 April 1993 to November 2011 0.00 2,138,906 90,733
Due to State of TennesseeJune 2002 to 2016 0.00 6,651,638 2,850,704
June 2004 to 2018 0.00 1,084,000 650,399
Total 13,136,490 3,730,536
Accrued Vacation 8,964,421
Post Employment Benefits 302,265,974
Total Long-term Obligations 13,136,490$ 314,960,931$
See Independent Auditor's Report
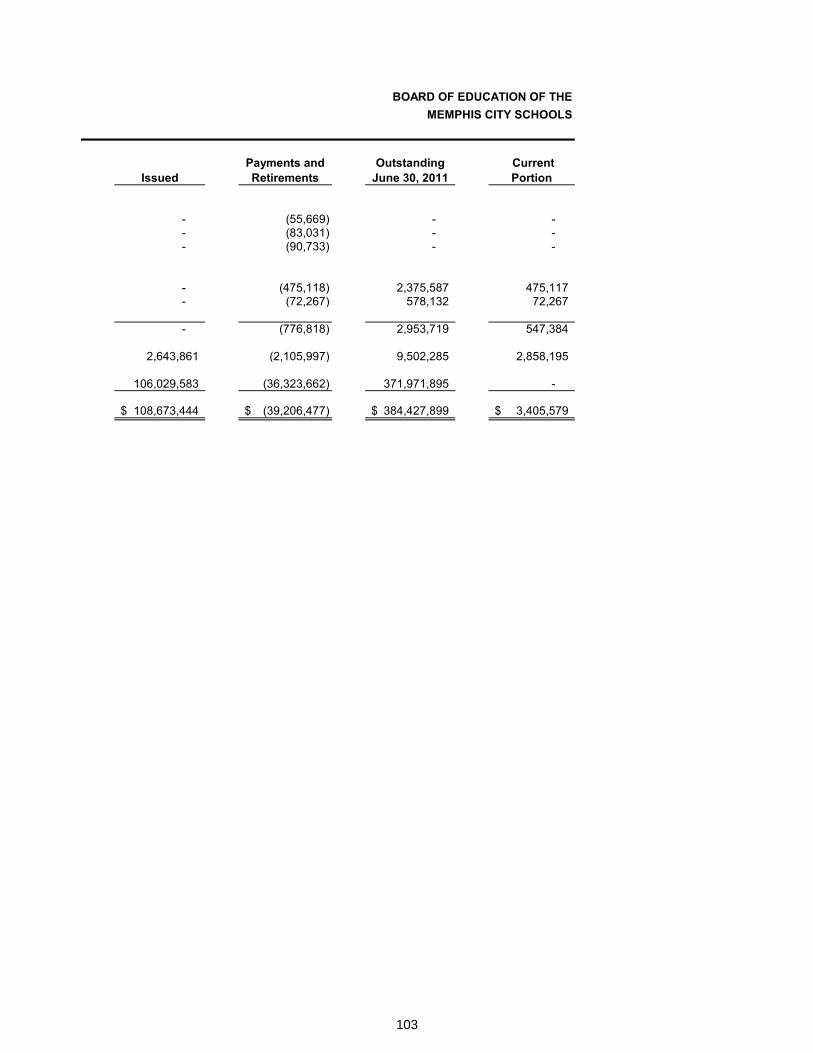
103
BOARD OF EDUCATION OF THE MEMPHIS CITY SCHOOLS
IssuedPayments and Retirements
Outstanding June 30, 2011
Current Portion
- (55,669) - -- (83,031) - -- (90,733) - -
- (475,118) 2,375,587 475,117- (72,267) 578,132 72,267
- (776,818) 2,953,719 547,384
2,643,861 (2,105,997) 9,502,285 2,858,195
106,029,583 (36,323,662) 371,971,895 -
108,673,444$ (39,206,477)$ 384,427,899$ 3,405,579$
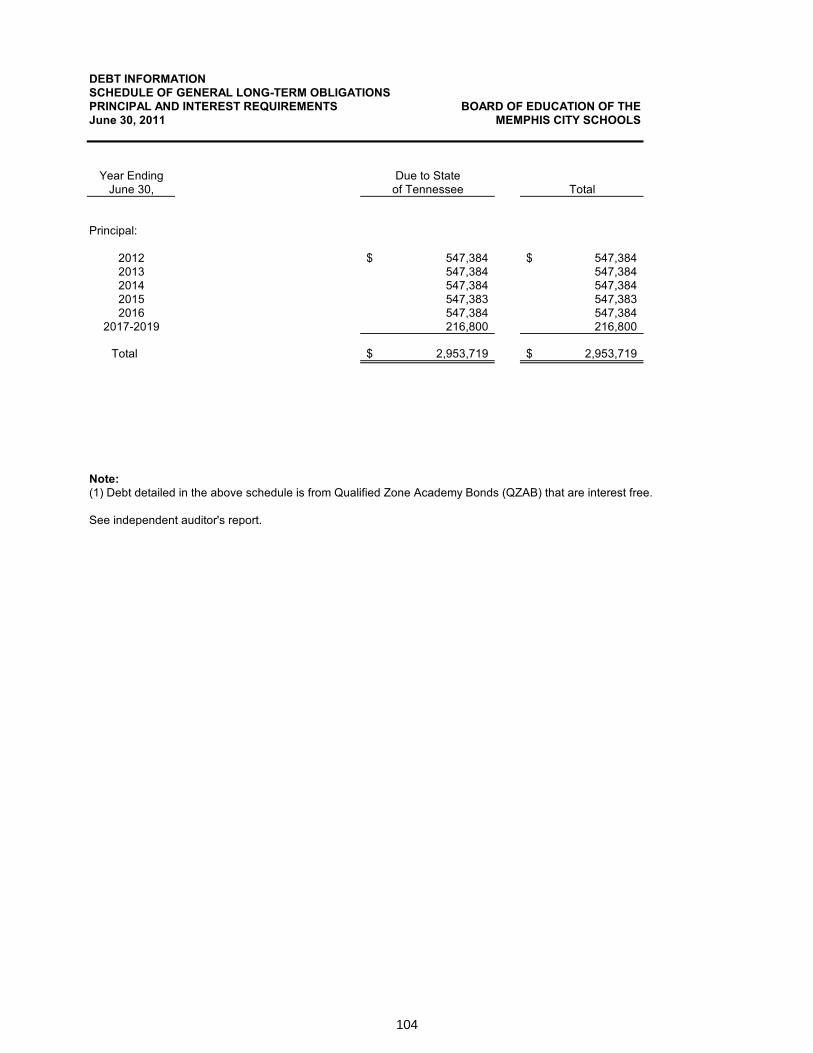
104
Schedule of General Long-Term Obligations Principal and Interest Requirements
DEBT INFORMATIONSCHEDULE OF GENERAL LONG-TERM OBLIGATIONSPRINCIPAL AND INTEREST REQUIREMENTS BOARD OF EDUCATION OF THE
MEMPHIS CITY SCHOOLS
Year Ending Due to StateJune 30, of Tennessee Total
Principal:
2012 547,384$ 547,384$2013 547,384 547,3842014 547,384 547,3842015 547,383 547,3832016 547,384 547,384
2017-2019 216,800 216,800
Total 2,953,719$ 2,953,719$
Note:(1) Debt detailed in the above schedule is from Qualified Zone Academy Bonds (QZAB) that are interest free.
See independent auditor's report.
June 30, 2011
105
STATISTICAL SECTION (Unaudited)
Statistical Section (unaudited)

106
107
Overview
STATISTICAL AND OTHERINFORMATION (UNAUDITED)OVERVIEW BOARD OF EDUCATION OF THE Year Ended June 30, 2011 MEMPHIS CITY SCHOOLS
This part of the Memphis City Schools Comprehensive Annual Financial Report presents detailed information as a context for understanding what the information in the financial statements, note disclosures, and required supplementary information says about the School District’s overall financial health.
Contents
Financial TrendsThese schedules contain trend information to help the reader understand how the School District’s financial performance and well-being have changed over time.
Revenue CapacityThese schedules contain information to help the reader assess the factors affecting the School District’s ability to generate revenues through property taxes levied by other governmental agencies.
Debt CapacityThese schedules present information to help the reader assess the affordability of the School District’s current levels of outstanding debt and the School District’s ability to issue additional debt in the future.
The School District does not have taxing authority and does not have a legal debt margin. Accordingly, schedules regarding legal debt margin and overlapping debt are not applicable. In addition, the School District does not have any pledged revenue.
Demographic and Economic InformationThese schedules offer demographic and economic indicators to help the reader understand the environment within which the School District’s financial activities take place and to help make comparisons over time and with other governments.
Operating InformationThese schedules contain information about the School District’s operations and resources to help the reader understand how the School District’s financial information relates to the services the School District provides and the activities it performs.
Sources
Unless otherwise noted, the information in these schedules is derived from the annual financial reports for the relevant year. The School District implemented GASB Statement 34 in 2002; schedules presenting government-wide information include information beginning in that year.

108
This page left intentionally blank
109
Financial Trends
Financial Trends
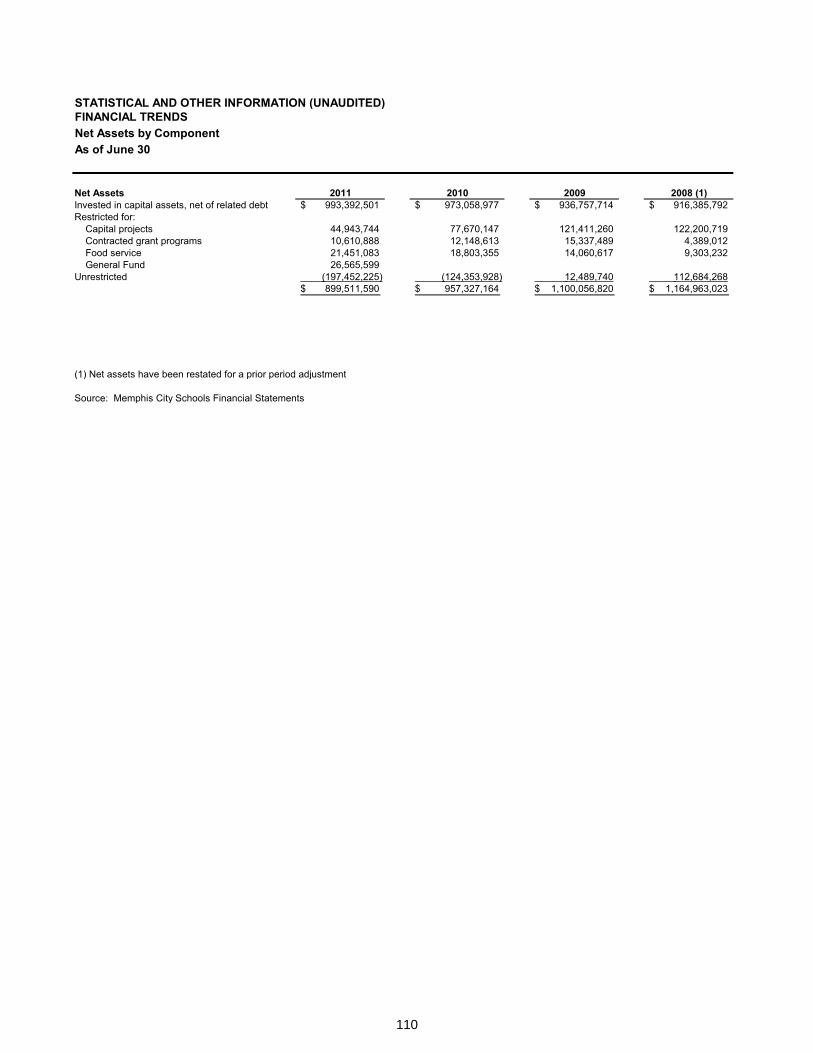
110
Net Assets by Component
STATISTICAL AND OTHER INFORMATION (UNAUDITED)FINANCIAL TRENDSNet Assets by ComponentAs of June 30
Net Assets 2011 2010 2009 2008 (1)Invested in capital assets, net of related debt 993,392,501$ 973,058,977$ 936,757,714$ 916,385,792$Restricted for:
Capital projects 44,943,744 77,670,147 121,411,260 122,200,719Contracted grant programs 10,610,888 12,148,613 15,337,489 4,389,012Food service 21,451,083 18,803,355 14,060,617 9,303,232General Fund 26,565,599
Unrestricted (197,452,225) (124,353,928) 12,489,740 112,684,268899,511,590$ 957,327,164$ 1,100,056,820$ 1,164,963,023$
(1) Net assets have been restated for a prior period adjustment
Source: Memphis City Schools Financial Statements
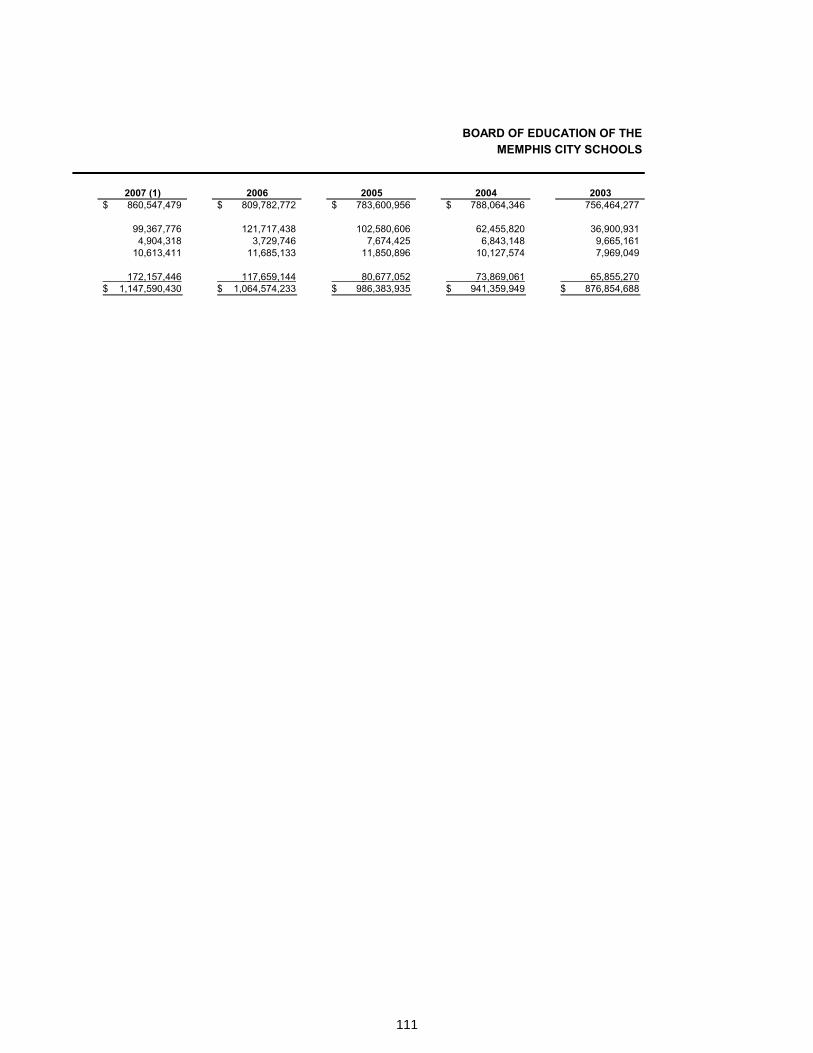
111
BOARD OF EDUCATION OF THE MEMPHIS CITY SCHOOLS
2007 (1) 2006 2005 2004 2003860,547,479$ 809,782,772$ 783,600,956$ 788,064,346$ 756,464,277
99,367,776 121,717,438 102,580,606 62,455,820 36,900,9314,904,318 3,729,746 7,674,425 6,843,148 9,665,161
10,613,411 11,685,133 11,850,896 10,127,574 7,969,049
172,157,446 117,659,144 80,677,052 73,869,061 65,855,2701,147,590,430$ 1,064,574,233$ 986,383,935$ 941,359,949$ 876,854,688$
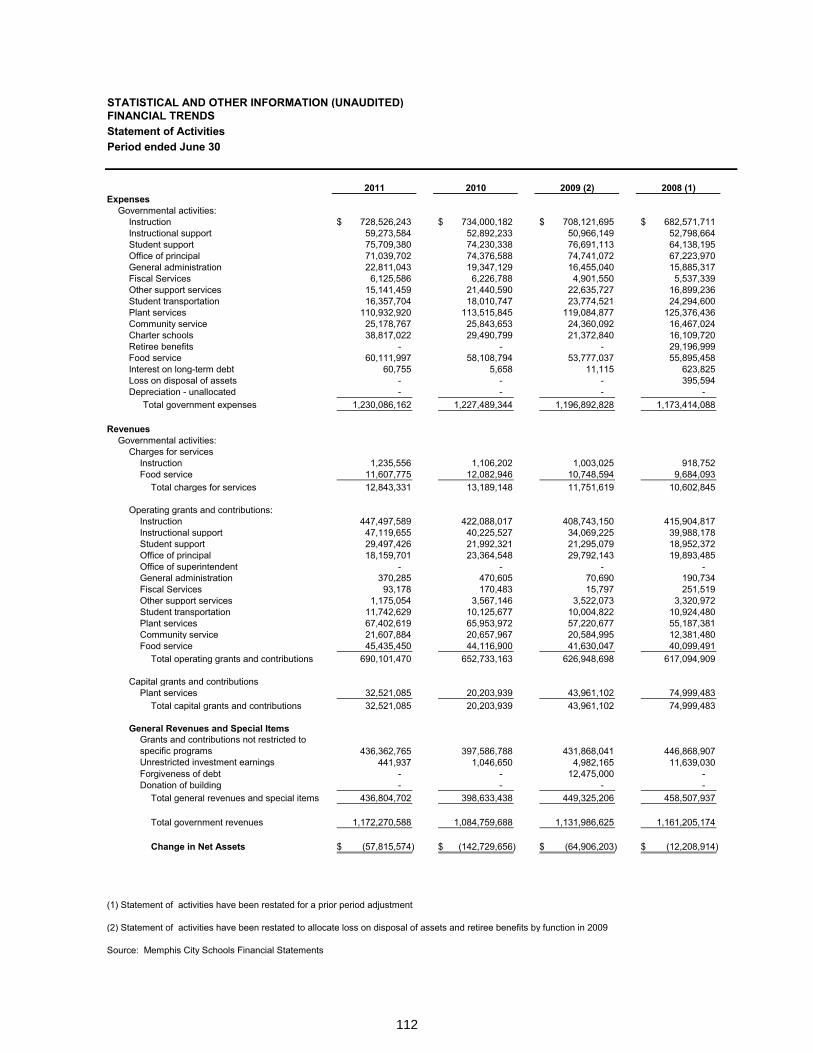
112
Statement of Activities
STATISTICAL AND OTHER INFORMATION (UNAUDITED)FINANCIAL TRENDSStatement of ActivitiesPeriod ended June 30
2011 2010 2009 (2) 2008 (1)Expenses
Governmental activities:Instruction 728,526,243$ 734,000,182$ 708,121,695$ 682,571,711$Instructional support 59,273,584 52,892,233 50,966,149 52,798,664Student support 75,709,380 74,230,338 76,691,113 64,138,195Office of principal 71,039,702 74,376,588 74,741,072 67,223,970General administration 22,811,043 19,347,129 16,455,040 15,885,317Fiscal Services 6,125,586 6,226,788 4,901,550 5,537,339Other support services 15,141,459 21,440,590 22,635,727 16,899,236Student transportation 16,357,704 18,010,747 23,774,521 24,294,600Plant services 110,932,920 113,515,845 119,084,877 125,376,436Community service 25,178,767 25,843,653 24,360,092 16,467,024Charter schools 38,817,022 29,490,799 21,372,840 16,109,720Retiree benefits - - - 29,196,999Food service 60,111,997 58,108,794 53,777,037 55,895,458Interest on long-term debt 60,755 5,658 11,115 623,825Loss on disposal of assets - - - 395,594Depreciation - unallocated - - - -
Total government expenses 1,230,086,162 1,227,489,344 1,196,892,828 1,173,414,088
RevenuesGovernmental activities:
Charges for servicesInstruction 1,235,556 1,106,202 1,003,025 918,752Food service 11,607,775 12,082,946 10,748,594 9,684,093
Total charges for services 12,843,331 13,189,148 11,751,619 10,602,845
Operating grants and contributions:Instruction 447,497,589 422,088,017 408,743,150 415,904,817Instructional support 47,119,655 40,225,527 34,069,225 39,988,178Student support 29,497,426 21,992,321 21,295,079 18,952,372Office of principal 18,159,701 23,364,548 29,792,143 19,893,485Office of superintendent - - - -General administration 370,285 470,605 70,690 190,734Fiscal Services 93,178 170,483 15,797 251,519Other support services 1,175,054 3,567,146 3,522,073 3,320,972Student transportation 11,742,629 10,125,677 10,004,822 10,924,480Plant services 67,402,619 65,953,972 57,220,677 55,187,381Community service 21,607,884 20,657,967 20,584,995 12,381,480Food service 45,435,450 44,116,900 41,630,047 40,099,491
Total operating grants and contributions 690,101,470 652,733,163 626,948,698 617,094,909
Capital grants and contributionsPlant services 32,521,085 20,203,939 43,961,102 74,999,483
Total capital grants and contributions 32,521,085 20,203,939 43,961,102 74,999,483
General Revenues and Special ItemsGrants and contributions not restricted to specific programs 436,362,765 397,586,788 431,868,041 446,868,907Unrestricted investment earnings 441,937 1,046,650 4,982,165 11,639,030Forgiveness of debt - - 12,475,000 -Donation of building - - - -
Total general revenues and special items 436,804,702 398,633,438 449,325,206 458,507,937
Total government revenues 1,172,270,588 1,084,759,688 1,131,986,625 1,161,205,174
Change in Net Assets (57,815,574)$ (142,729,656)$ (64,906,203)$ (12,208,914)$
(1) Statement of activities have been restated for a prior period adjustment
(2) Statement of activities have been restated to allocate loss on disposal of assets and retiree benefits by function in 2009
Source: Memphis City Schools Financial Statements
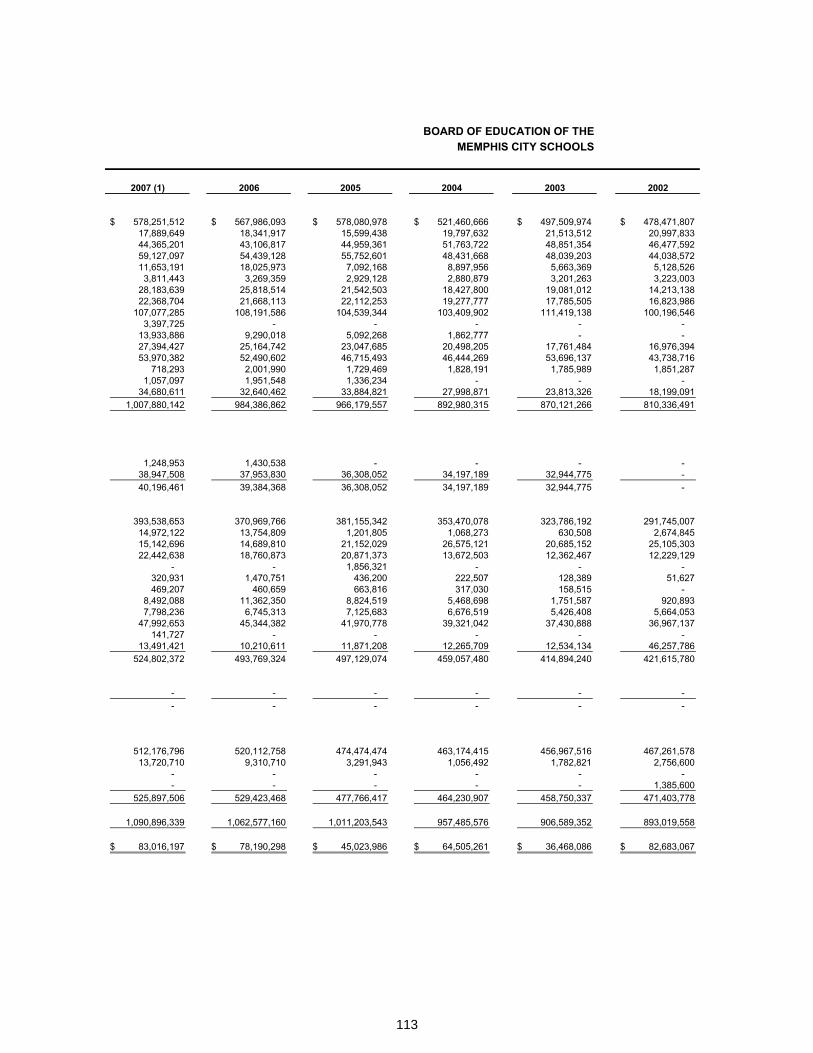
113
BOARD OF EDUCATION OF THE MEMPHIS CITY SCHOOLS
2007 (1) 2006 2005 2004 2003 2002
578,251,512$ 567,986,093$ 578,080,978$ 521,460,666$ 497,509,974$ 478,471,807$17,889,649 18,341,917 15,599,438 19,797,632 21,513,512 20,997,83344,365,201 43,106,817 44,959,361 51,763,722 48,851,354 46,477,59259,127,097 54,439,128 55,752,601 48,431,668 48,039,203 44,038,57211,653,191 18,025,973 7,092,168 8,897,956 5,663,369 5,128,5263,811,443 3,269,359 2,929,128 2,880,879 3,201,263 3,223,003
28,183,639 25,818,514 21,542,503 18,427,800 19,081,012 14,213,13822,368,704 21,668,113 22,112,253 19,277,777 17,785,505 16,823,986
107,077,285 108,191,586 104,539,344 103,409,902 111,419,138 100,196,5463,397,725 - - - - -
13,933,886 9,290,018 5,092,268 1,862,777 - -27,394,427 25,164,742 23,047,685 20,498,205 17,761,484 16,976,39453,970,382 52,490,602 46,715,493 46,444,269 53,696,137 43,738,716
718,293 2,001,990 1,729,469 1,828,191 1,785,989 1,851,2871,057,097 1,951,548 1,336,234 - - -
34,680,611 32,640,462 33,884,821 27,998,871 23,813,326 18,199,0911,007,880,142 984,386,862 966,179,557 892,980,315 870,121,266 810,336,491
1,248,953 1,430,538 - - - -38,947,508 37,953,830 36,308,052 34,197,189 32,944,775 -40,196,461 39,384,368 36,308,052 34,197,189 32,944,775 -
393,538,653 370,969,766 381,155,342 353,470,078 323,786,192 291,745,00714,972,122 13,754,809 1,201,805 1,068,273 630,508 2,674,84515,142,696 14,689,810 21,152,029 26,575,121 20,685,152 25,105,30322,442,638 18,760,873 20,871,373 13,672,503 12,362,467 12,229,129
- - 1,856,321 - - -320,931 1,470,751 436,200 222,507 128,389 51,627469,207 460,659 663,816 317,030 158,515 -
8,492,088 11,362,350 8,824,519 5,468,698 1,751,587 920,8937,798,236 6,745,313 7,125,683 6,676,519 5,426,408 5,664,053
47,992,653 45,344,382 41,970,778 39,321,042 37,430,888 36,967,137141,727 - - - - -
13,491,421 10,210,611 11,871,208 12,265,709 12,534,134 46,257,786524,802,372 493,769,324 497,129,074 459,057,480 414,894,240 421,615,780
- - - - - -- - - - - -
512,176,796 520,112,758 474,474,474 463,174,415 456,967,516 467,261,57813,720,710 9,310,710 3,291,943 1,056,492 1,782,821 2,756,600
- - - - - -- - - - - 1,385,600
525,897,506 529,423,468 477,766,417 464,230,907 458,750,337 471,403,778
1,090,896,339 1,062,577,160 1,011,203,543 957,485,576 906,589,352 893,019,558
83,016,197$ 78,190,298$ 45,023,986$ 64,505,261$ 36,468,086$ 82,683,067$
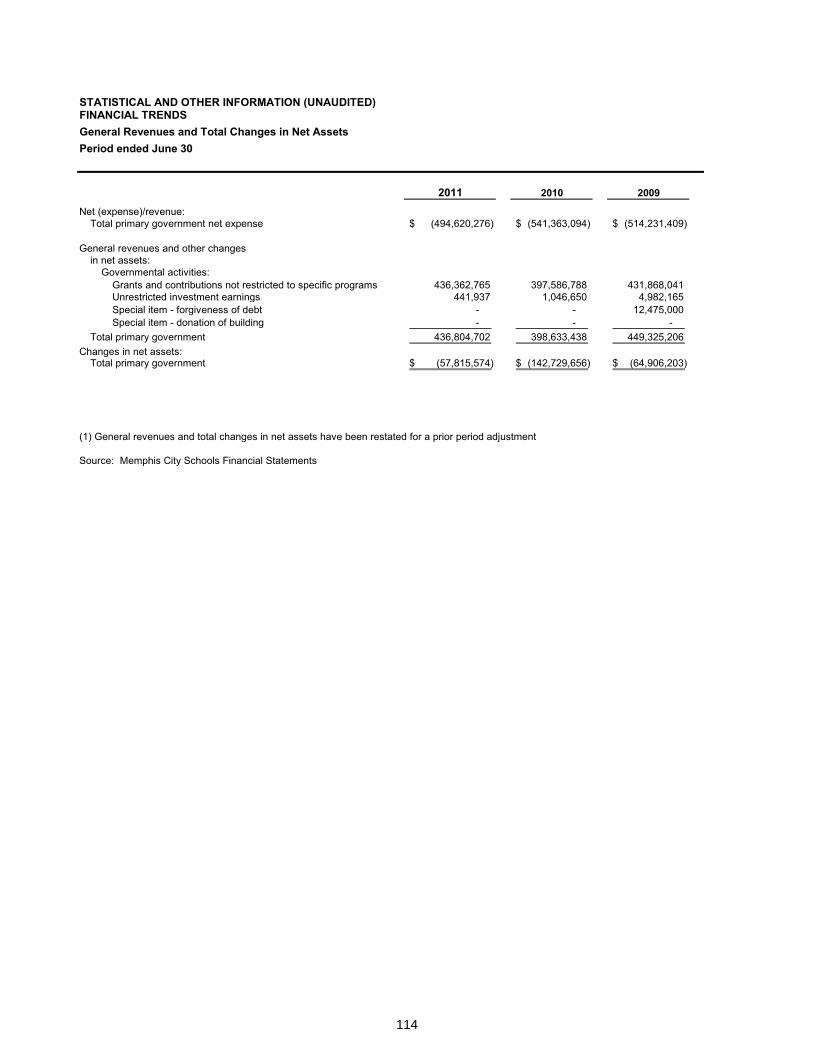
114
General Revenues and Total Changes in Net Assets
STATISTICAL AND OTHER INFORMATION (UNAUDITED)FINANCIAL TRENDSGeneral Revenues and Total Changes in Net AssetsPeriod ended June 30
2011 2010 2009
Net (expense)/revenue:Total primary government net expense (494,620,276)$ (541,363,094)$ (514,231,409)$
General revenues and other changesin net assets:
Governmental activities:Grants and contributions not restricted to specific programs 436,362,765 397,586,788 431,868,041Unrestricted investment earnings 441,937 1,046,650 4,982,165Special item - forgiveness of debt - - 12,475,000Special item - donation of building - - -
Total primary government 436,804,702 398,633,438 449,325,206Changes in net assets:
Total primary government (57,815,574)$ (142,729,656)$ (64,906,203)$
(1) General revenues and total changes in net assets have been restated for a prior period adjustment
Source: Memphis City Schools Financial Statements
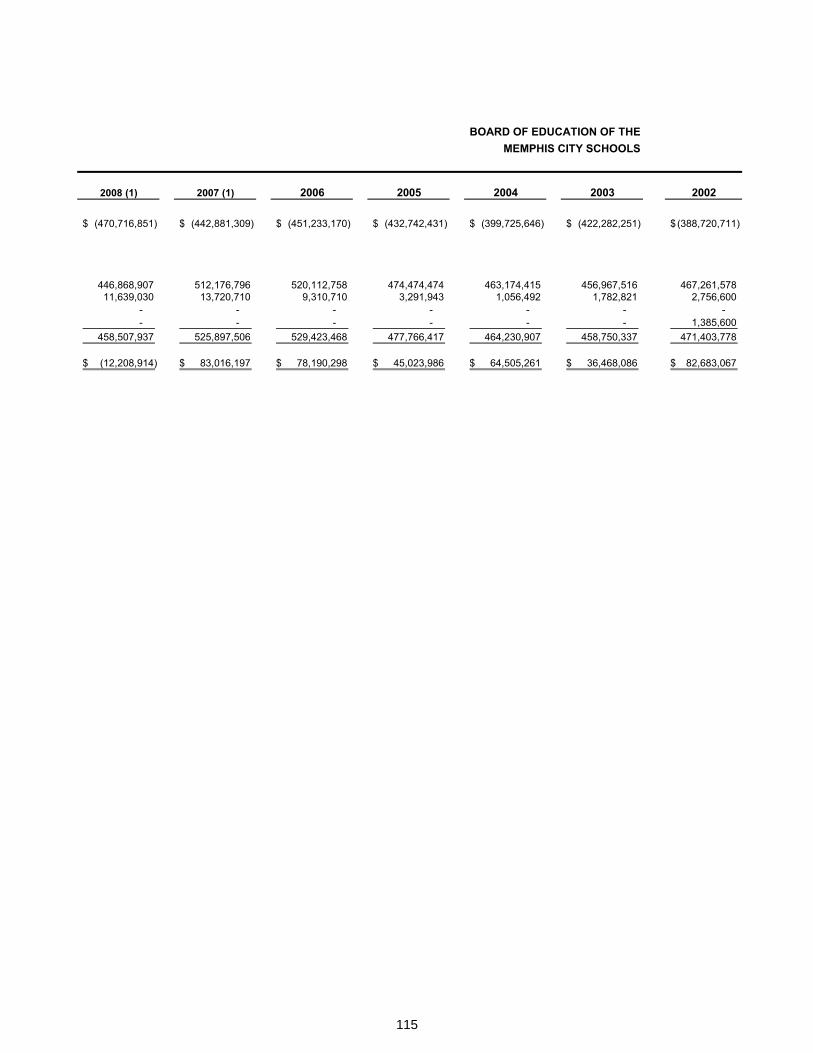
115
BOARD OF EDUCATION OF THE MEMPHIS CITY SCHOOLS
2008 (1) 2007 (1) 2006 2005 2004 2003 2002
(470,716,851)$ (442,881,309)$ (451,233,170)$ (432,742,431)$ (399,725,646)$ (422,282,251)$ (388,720,711)$
446,868,907 512,176,796 520,112,758 474,474,474 463,174,415 456,967,516 467,261,57811,639,030 13,720,710 9,310,710 3,291,943 1,056,492 1,782,821 2,756,600
- - - - - - -- - - - - - 1,385,600
458,507,937 525,897,506 529,423,468 477,766,417 464,230,907 458,750,337 471,403,778
(12,208,914)$ 83,016,197$ 78,190,298$ 45,023,986$ 64,505,261$ 36,468,086$ 82,683,067$
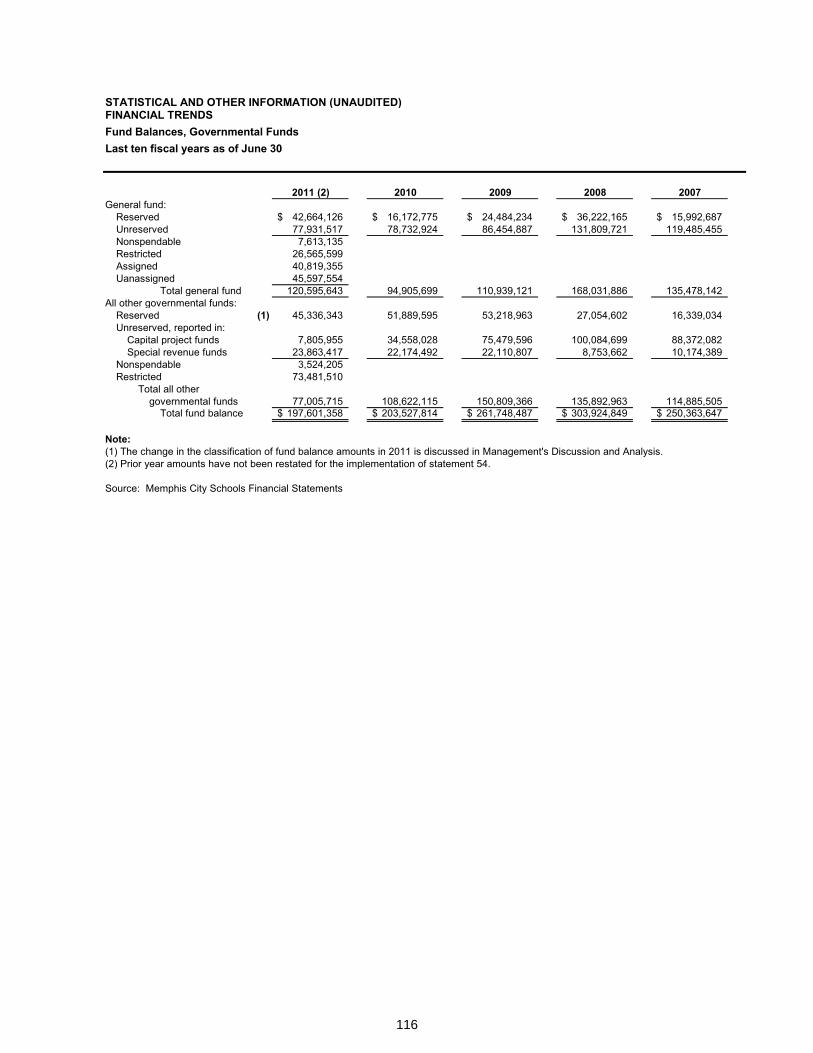
116
Fund Balances, Governmental Funds
STATISTICAL AND OTHER INFORMATION (UNAUDITED)FINANCIAL TRENDSFund Balances, Governmental FundsLast ten fiscal years as of June 30
2011 (2) 2010 2009 2008 2007General fund:
Reserved 42,664,126$ 16,172,775$ 24,484,234$ 36,222,165$ 15,992,687$ Unreserved 77,931,517 78,732,924 86,454,887 131,809,721 119,485,455Nonspendable 7,613,135Restricted 26,565,599Assigned 40,819,355Uanassigned 45,597,554
Total general fund 120,595,643 94,905,699 110,939,121 168,031,886 135,478,142All other governmental funds:
Reserved (1) 45,336,343 51,889,595 53,218,963 27,054,602 16,339,034Unreserved, reported in:
Capital project funds 7,805,955 34,558,028 75,479,596 100,084,699 88,372,082Special revenue funds 23,863,417 22,174,492 22,110,807 8,753,662 10,174,389
Nonspendable 3,524,205Restricted 73,481,510
Total all othergovernmental funds 77,005,715 108,622,115 150,809,366 135,892,963 114,885,505
Total fund balance 197,601,358$ 203,527,814$ 261,748,487$ 303,924,849$ 250,363,647$
Note:(1) The change in the classification of fund balance amounts in 2011 is discussed in Management's Discussion and Analysis.(2) Prior year amounts have not been restated for the implementation of statement 54.
Source: Memphis City Schools Financial Statements
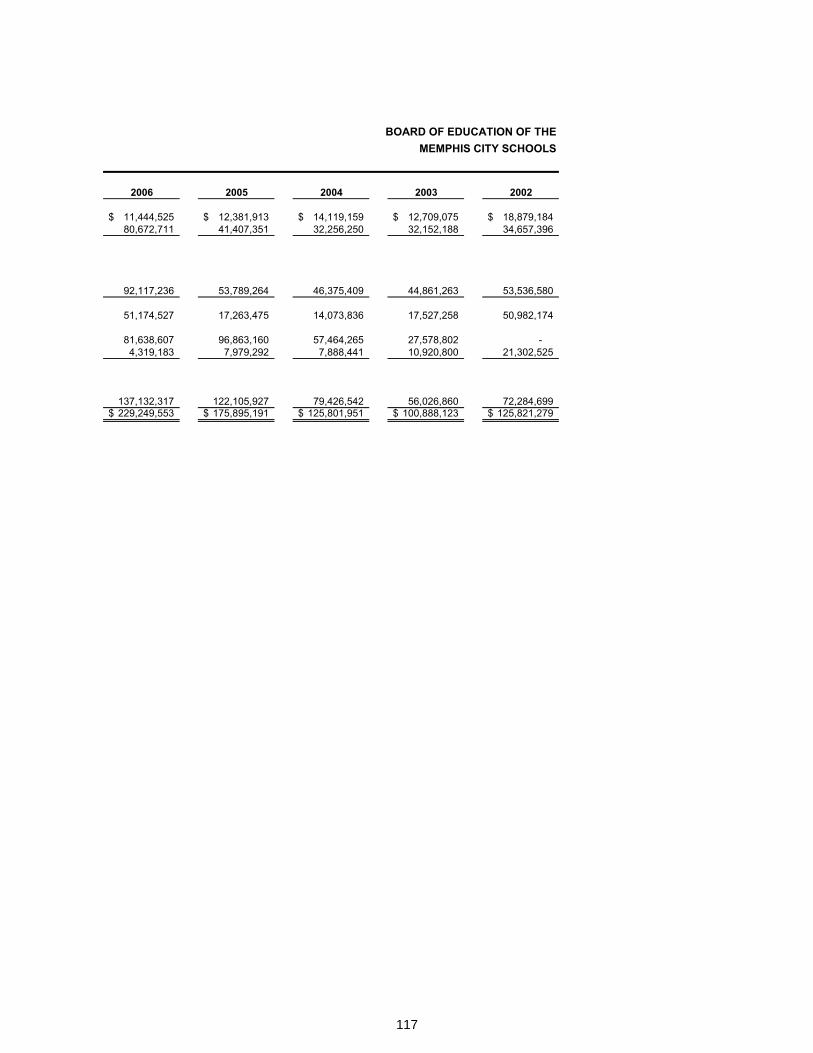
117
BOARD OF EDUCATION OF THE MEMPHIS CITY SCHOOLS
2006 2005 2004 2003 2002
11,444,525$ 12,381,913$ 14,119,159$ 12,709,075$ 18,879,184$ 80,672,711 41,407,351 32,256,250 32,152,188 34,657,396
92,117,236 53,789,264 46,375,409 44,861,263 53,536,580
51,174,527 17,263,475 14,073,836 17,527,258 50,982,174
81,638,607 96,863,160 57,464,265 27,578,802 -4,319,183 7,979,292 7,888,441 10,920,800 21,302,525
137,132,317 122,105,927 79,426,542 56,026,860 72,284,699229,249,553$ 175,895,191$ 125,801,951$ 100,888,123$ 125,821,279$
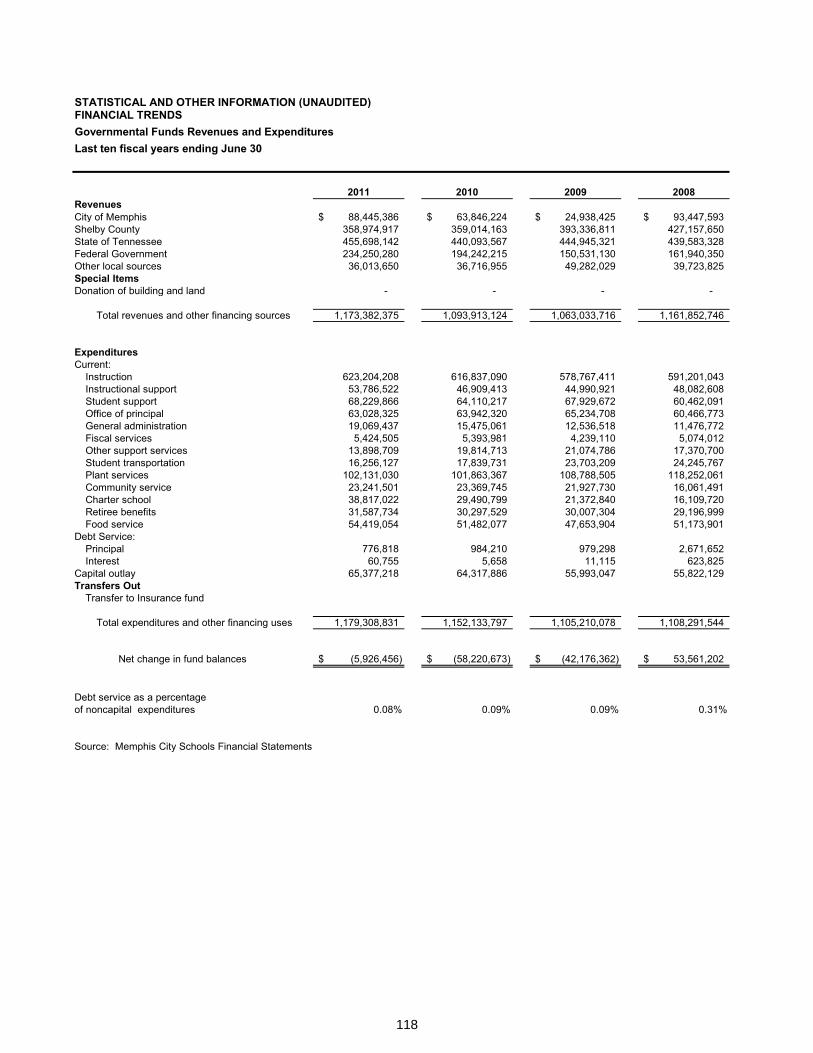
118
Ten-Year Summary of Governmental Funds Revenues and Expenditures
STATISTICAL AND OTHER INFORMATION (UNAUDITED)FINANCIAL TRENDSGovernmental Funds Revenues and ExpendituresLast ten fiscal years ending June 30
2011 2010 2009 2008RevenuesCity of Memphis 88,445,386$ 63,846,224$ 24,938,425$ 93,447,593$ Shelby County 358,974,917 359,014,163 393,336,811 427,157,650State of Tennessee 455,698,142 440,093,567 444,945,321 439,583,328Federal Government 234,250,280 194,242,215 150,531,130 161,940,350Other local sources 36,013,650 36,716,955 49,282,029 39,723,825Special ItemsDonation of building and land - - - -
Total revenues and other financing sources 1,173,382,375 1,093,913,124 1,063,033,716 1,161,852,746
ExpendituresCurrent:
Instruction 623,204,208 616,837,090 578,767,411 591,201,043Instructional support 53,786,522 46,909,413 44,990,921 48,082,608Student support 68,229,866 64,110,217 67,929,672 60,462,091Office of principal 63,028,325 63,942,320 65,234,708 60,466,773General administration 19,069,437 15,475,061 12,536,518 11,476,772Fiscal services 5,424,505 5,393,981 4,239,110 5,074,012Other support services 13,898,709 19,814,713 21,074,786 17,370,700Student transportation 16,256,127 17,839,731 23,703,209 24,245,767Plant services 102,131,030 101,863,367 108,788,505 118,252,061Community service 23,241,501 23,369,745 21,927,730 16,061,491Charter school 38,817,022 29,490,799 21,372,840 16,109,720Retiree benefits 31,587,734 30,297,529 30,007,304 29,196,999Food service 54,419,054 51,482,077 47,653,904 51,173,901
Debt Service:Principal 776,818 984,210 979,298 2,671,652Interest 60,755 5,658 11,115 623,825
Capital outlay 65,377,218 64,317,886 55,993,047 55,822,129Transfers Out
Transfer to Insurance fund
Total expenditures and other financing uses 1,179,308,831 1,152,133,797 1,105,210,078 1,108,291,544
Net change in fund balances (5,926,456)$ (58,220,673)$ (42,176,362)$ 53,561,202$
Debt service as a percentage of noncapital expenditures 0.08% 0.09% 0.09% 0.31%
Source: Memphis City Schools Financial Statements
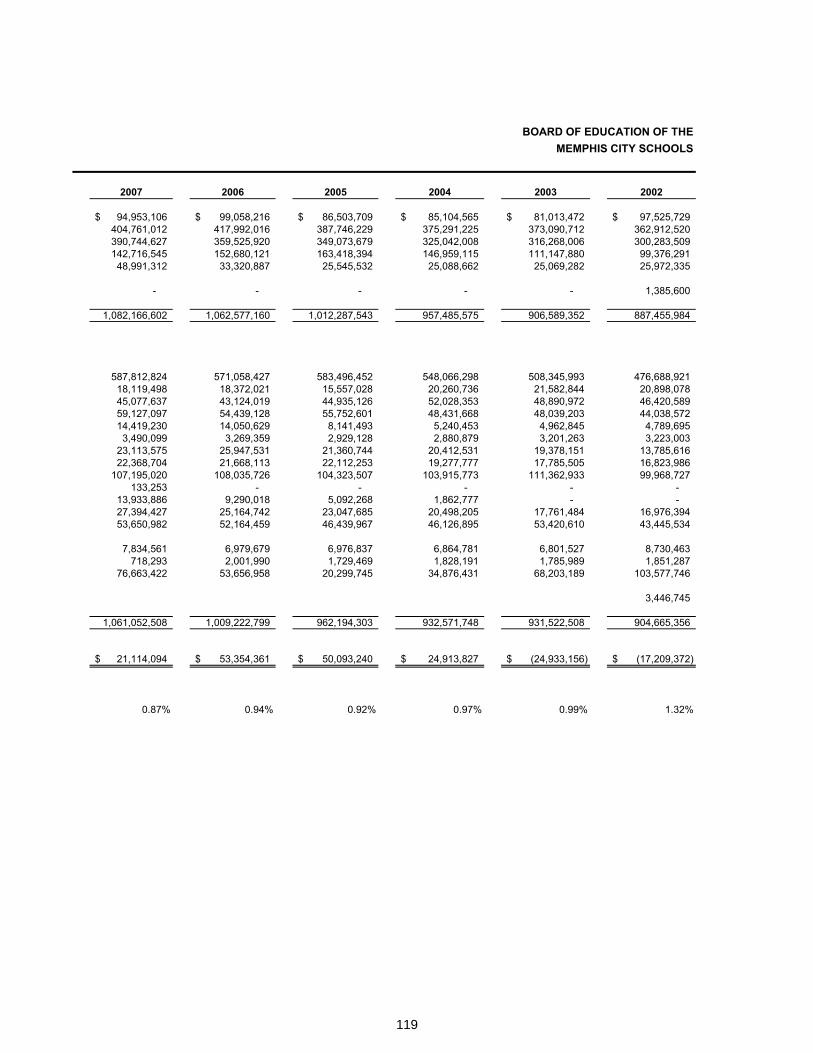
119
BOARD OF EDUCATION OF THE MEMPHIS CITY SCHOOLS
2007 2006 2005 2004 2003 2002
94,953,106$ 99,058,216$ 86,503,709$ 85,104,565$ 81,013,472$ 97,525,729$ 404,761,012 417,992,016 387,746,229 375,291,225 373,090,712 362,912,520390,744,627 359,525,920 349,073,679 325,042,008 316,268,006 300,283,509142,716,545 152,680,121 163,418,394 146,959,115 111,147,880 99,376,29148,991,312 33,320,887 25,545,532 25,088,662 25,069,282 25,972,335
- - - - - 1,385,600
1,082,166,602 1,062,577,160 1,012,287,543 957,485,575 906,589,352 887,455,984
587,812,824 571,058,427 583,496,452 548,066,298 508,345,993 476,688,92118,119,498 18,372,021 15,557,028 20,260,736 21,582,844 20,898,07845,077,637 43,124,019 44,935,126 52,028,353 48,890,972 46,420,58959,127,097 54,439,128 55,752,601 48,431,668 48,039,203 44,038,57214,419,230 14,050,629 8,141,493 5,240,453 4,962,845 4,789,6953,490,099 3,269,359 2,929,128 2,880,879 3,201,263 3,223,003
23,113,575 25,947,531 21,360,744 20,412,531 19,378,151 13,785,61622,368,704 21,668,113 22,112,253 19,277,777 17,785,505 16,823,986
107,195,020 108,035,726 104,323,507 103,915,773 111,362,933 99,968,727133,253 - - - - -
13,933,886 9,290,018 5,092,268 1,862,777 - -27,394,427 25,164,742 23,047,685 20,498,205 17,761,484 16,976,39453,650,982 52,164,459 46,439,967 46,126,895 53,420,610 43,445,534
7,834,561 6,979,679 6,976,837 6,864,781 6,801,527 8,730,463718,293 2,001,990 1,729,469 1,828,191 1,785,989 1,851,287
76,663,422 53,656,958 20,299,745 34,876,431 68,203,189 103,577,746
3,446,745
1,061,052,508 1,009,222,799 962,194,303 932,571,748 931,522,508 904,665,356
21,114,094$ 53,354,361$ 50,093,240$ 24,913,827$ (24,933,156)$ (17,209,372)$
0.87% 0.94% 0.92% 0.97% 0.99% 1.32%
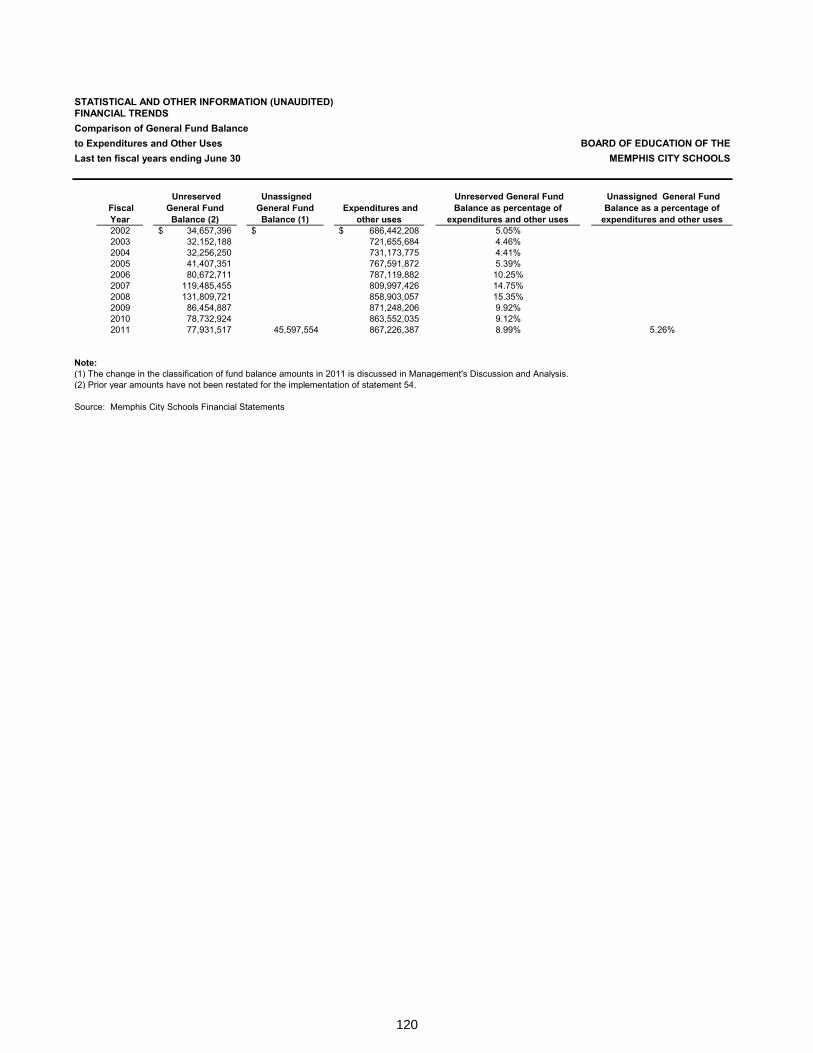
120
Ten-Year Comparison of General Fund Balance to Expenditures and Other Uses
STATISTICAL AND OTHER INFORMATION (UNAUDITED)FINANCIAL TRENDSComparison of General Fund Balanceto Expenditures and Other Uses BOARD OF EDUCATION OF THELast ten fiscal years ending June 30 MEMPHIS CITY SCHOOLS
Fiscal Year
Unreserved General Fund Balance (2)
Unassigned General Fund Balance (1)
Expenditures and other uses
Unreserved General Fund Balance as percentage of
expenditures and other uses
Unassigned General Fund Balance as a percentage of
expenditures and other uses 2002 34,657,396$ $ 686,442,208$ 5.05%2003 32,152,188 721,655,684 4.46%2004 32,256,250 731,173,775 4.41%2005 41,407,351 767,591,872 5.39%2006 80,672,711 787,119,882 10.25%2007 119,485,455 809,997,426 14.75%2008 131,809,721 858,903,057 15.35%2009 86,454,887 871,248,206 9.92%2010 78,732,924 863,552,035 9.12%2011 77,931,517 45,597,554 867,226,387 8.99% 5.26%
Note:(1) The change in the classification of fund balance amounts in 2011 is discussed in Management's Discussion and Analysis.(2) Prior year amounts have not been restated for the implementation of statement 54.
Source: Memphis City Schools Financial Statements
121
Revenue Capacity
Revenue Capacity
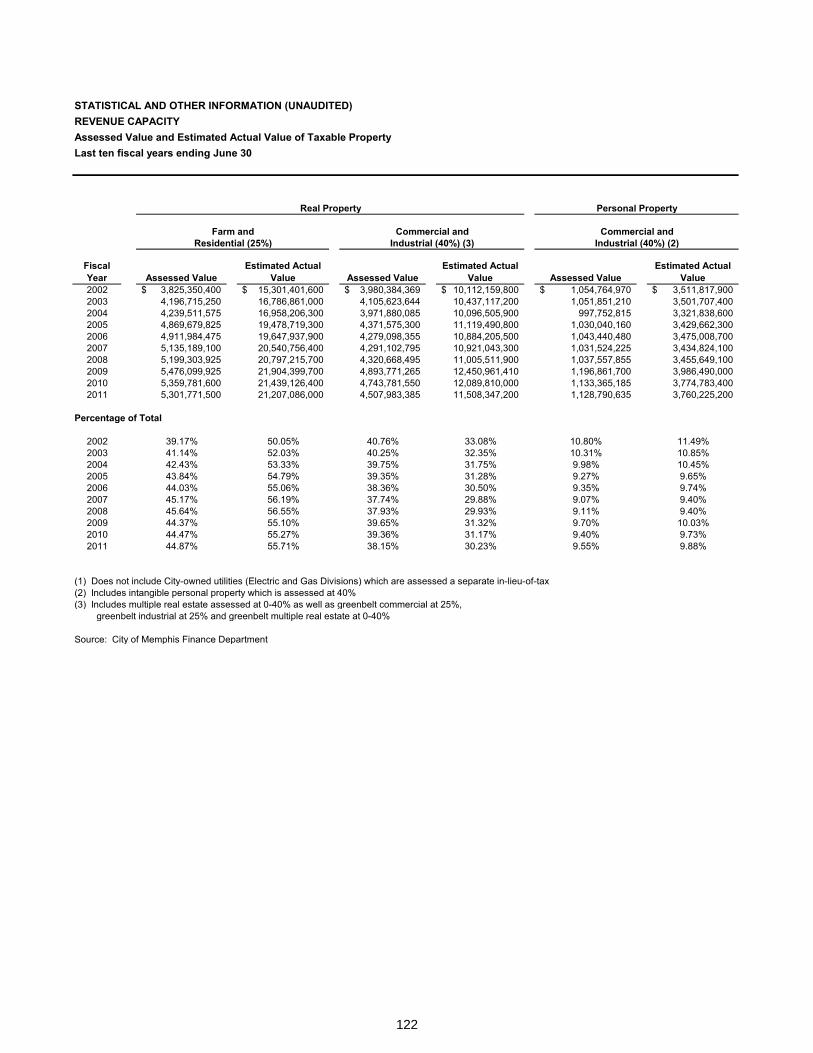
122
Assessed Value and Estimated Actual Value of Taxable Property
STATISTICAL AND OTHER INFORMATION (UNAUDITED)REVENUE CAPACITYAssessed Value and Estimated Actual Value of Taxable PropertyLast ten fiscal years ending June 30
Real Property Personal Property
Farm and Commercial and Commercial andResidential (25%) Industrial (40%) (3) Industrial (40%) (2)
Fiscal Year Assessed Value
Estimated Actual Value Assessed Value
Estimated Actual Value Assessed Value
Estimated Actual Value
2002 3,825,350,400$ 15,301,401,600$ 3,980,384,369$ 10,112,159,800$ 1,054,764,970$ 3,511,817,900$2003 4,196,715,250 16,786,861,000 4,105,623,644 10,437,117,200 1,051,851,210 3,501,707,4002004 4,239,511,575 16,958,206,300 3,971,880,085 10,096,505,900 997,752,815 3,321,838,6002005 4,869,679,825 19,478,719,300 4,371,575,300 11,119,490,800 1,030,040,160 3,429,662,3002006 4,911,984,475 19,647,937,900 4,279,098,355 10,884,205,500 1,043,440,480 3,475,008,7002007 5,135,189,100 20,540,756,400 4,291,102,795 10,921,043,300 1,031,524,225 3,434,824,1002008 5,199,303,925 20,797,215,700 4,320,668,495 11,005,511,900 1,037,557,855 3,455,649,1002009 5,476,099,925 21,904,399,700 4,893,771,265 12,450,961,410 1,196,861,700 3,986,490,0002010 5,359,781,600 21,439,126,400 4,743,781,550 12,089,810,000 1,133,365,185 3,774,783,4002011 5,301,771,500 21,207,086,000 4,507,983,385 11,508,347,200 1,128,790,635 3,760,225,200
Percentage of Total
2002 39.17% 50.05% 40.76% 33.08% 10.80% 11.49%2003 41.14% 52.03% 40.25% 32.35% 10.31% 10.85%2004 42.43% 53.33% 39.75% 31.75% 9.98% 10.45%2005 43.84% 54.79% 39.35% 31.28% 9.27% 9.65%2006 44.03% 55.06% 38.36% 30.50% 9.35% 9.74%2007 45.17% 56.19% 37.74% 29.88% 9.07% 9.40%2008 45.64% 56.55% 37.93% 29.93% 9.11% 9.40%2009 44.37% 55.10% 39.65% 31.32% 9.70% 10.03%2010 44.47% 55.27% 39.36% 31.17% 9.40% 9.73%2011 44.87% 55.71% 38.15% 30.23% 9.55% 9.88%
(1) Does not include City-owned utilities (Electric and Gas Divisions) which are assessed a separate in-lieu-of-tax(2) Includes intangible personal property which is assessed at 40%(3) Includes multiple real estate assessed at 0-40% as well as greenbelt commercial at 25%,
greenbelt industrial at 25% and greenbelt multiple real estate at 0-40%
Source: City of Memphis Finance Department
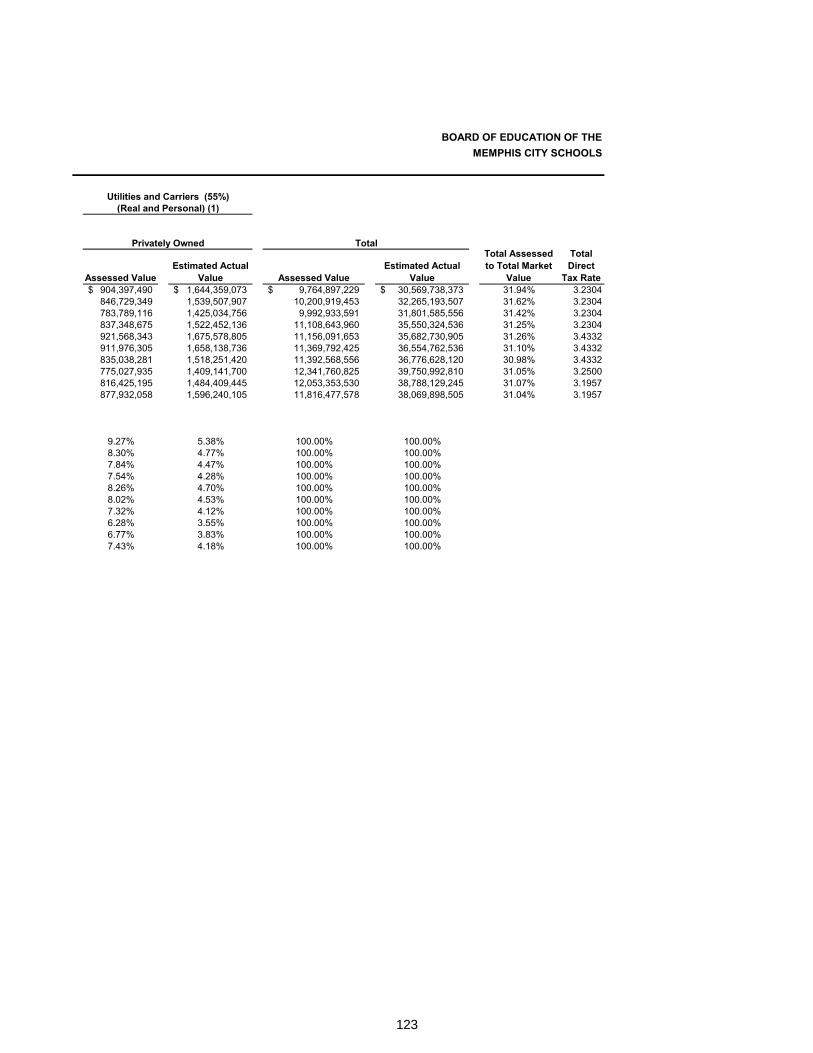
123
BOARD OF EDUCATION OF THE MEMPHIS CITY SCHOOLS
Utilities and Carriers (55%)(Real and Personal) (1)
Privately Owned Total
Assessed ValueEstimated Actual
Value Assessed ValueEstimated Actual
Value
Total Assessed to Total Market
Value
Total Direct
Tax Rate904,397,490$ 1,644,359,073$ 9,764,897,229$ 30,569,738,373$ 31.94% 3.2304846,729,349 1,539,507,907 10,200,919,453 32,265,193,507 31.62% 3.2304783,789,116 1,425,034,756 9,992,933,591 31,801,585,556 31.42% 3.2304837,348,675 1,522,452,136 11,108,643,960 35,550,324,536 31.25% 3.2304921,568,343 1,675,578,805 11,156,091,653 35,682,730,905 31.26% 3.4332911,976,305 1,658,138,736 11,369,792,425 36,554,762,536 31.10% 3.4332835,038,281 1,518,251,420 11,392,568,556 36,776,628,120 30.98% 3.4332775,027,935 1,409,141,700 12,341,760,825 39,750,992,810 31.05% 3.2500816,425,195 1,484,409,445 12,053,353,530 38,788,129,245 31.07% 3.1957877,932,058 1,596,240,105 11,816,477,578 38,069,898,505 31.04% 3.1957
9.27% 5.38% 100.00% 100.00%8.30% 4.77% 100.00% 100.00%7.84% 4.47% 100.00% 100.00%7.54% 4.28% 100.00% 100.00%8.26% 4.70% 100.00% 100.00%8.02% 4.53% 100.00% 100.00%7.32% 4.12% 100.00% 100.00%6.28% 3.55% 100.00% 100.00%6.77% 3.83% 100.00% 100.00%7.43% 4.18% 100.00% 100.00%
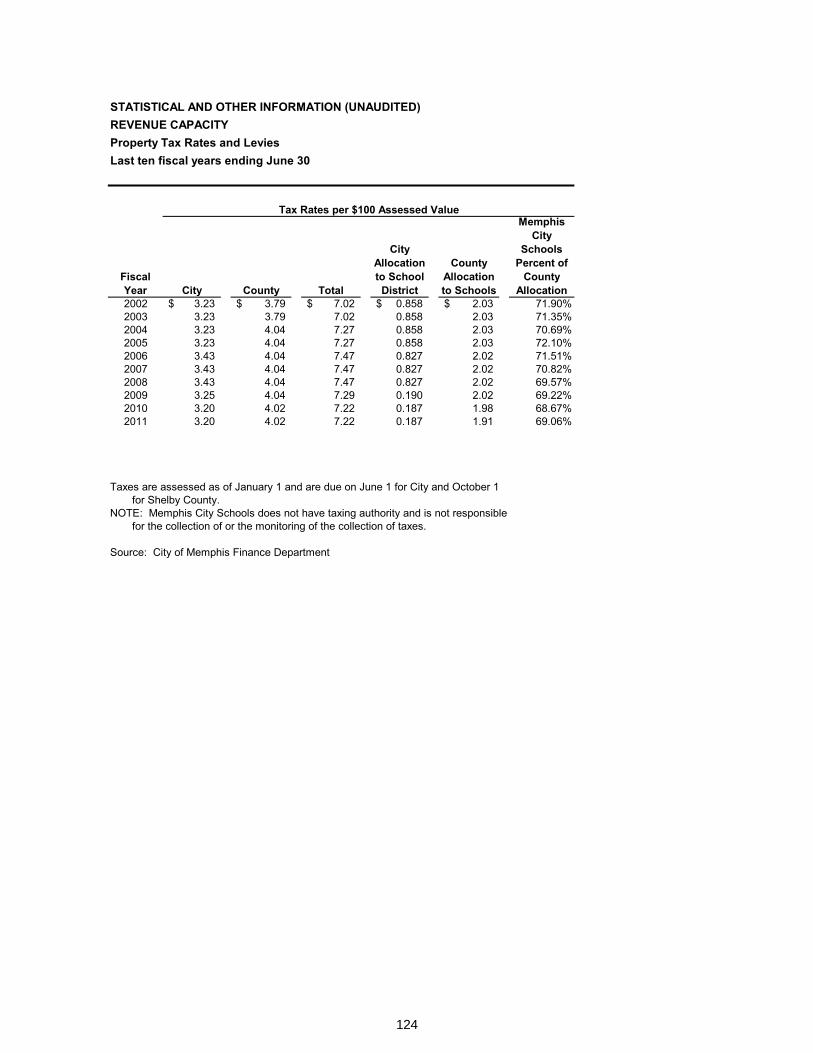
124
Property Tax Rates and Levies
STATISTICAL AND OTHER INFORMATION (UNAUDITED)REVENUE CAPACITYProperty Tax Rates and LeviesLast ten fiscal years ending June 30
Tax Rates per $100 Assessed Value
Fiscal Year City County Total
City Allocation to School
District
County Allocation to Schools
Memphis City
Schools Percent of
County Allocation
2002 3.23$ 3.79$ 7.02$ 0.858$ 2.03$ 71.90%2003 3.23 3.79 7.02 0.858 2.03 71.35%2004 3.23 4.04 7.27 0.858 2.03 70.69%2005 3.23 4.04 7.27 0.858 2.03 72.10%2006 3.43 4.04 7.47 0.827 2.02 71.51%2007 3.43 4.04 7.47 0.827 2.02 70.82%2008 3.43 4.04 7.47 0.827 2.02 69.57%2009 3.25 4.04 7.29 0.190 2.02 69.22%2010 3.20 4.02 7.22 0.187 1.98 68.67%2011 3.20 4.02 7.22 0.187 1.91 69.06%
Taxes are assessed as of January 1 and are due on June 1 for City and October 1for Shelby County.
NOTE: Memphis City Schools does not have taxing authority and is not responsiblefor the collection of or the monitoring of the collection of taxes.
Source: City of Memphis Finance Department
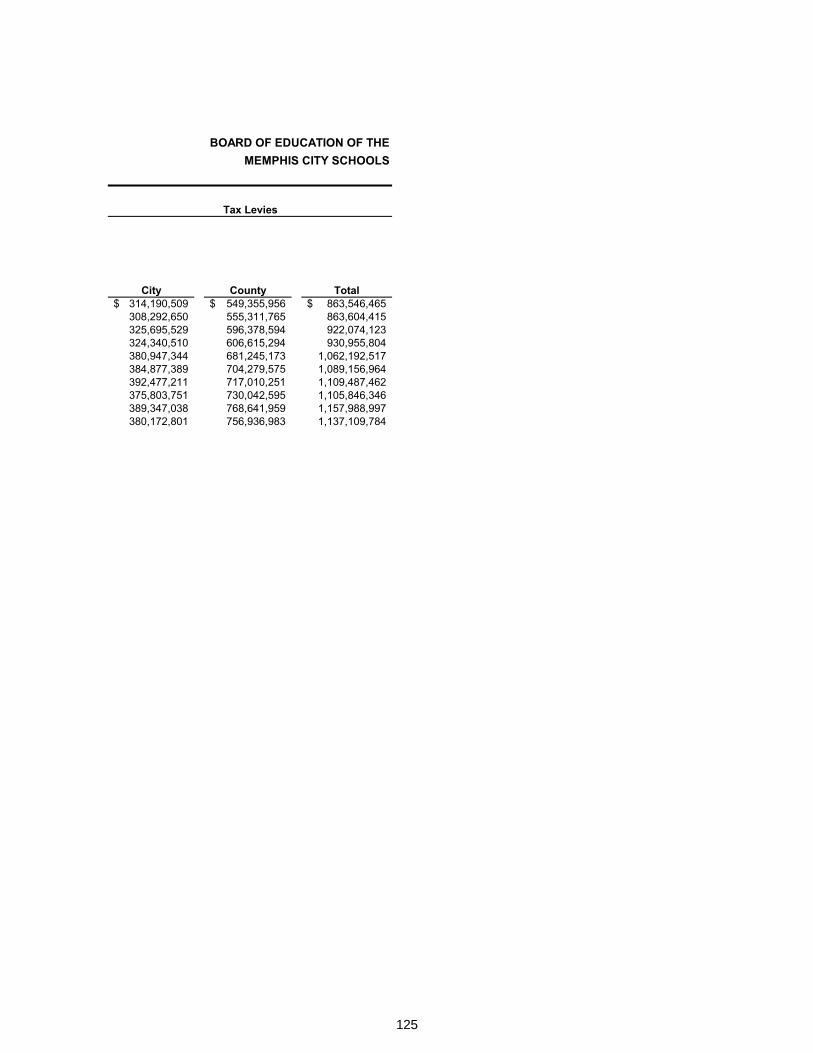
125
BOARD OF EDUCATION OF THE MEMPHIS CITY SCHOOLS
Tax Levies
City County Total314,190,509$ 549,355,956$ 863,546,465$308,292,650 555,311,765 863,604,415 325,695,529 596,378,594 922,074,123 324,340,510 606,615,294 930,955,804 380,947,344 681,245,173 1,062,192,517384,877,389 704,279,575 1,089,156,964392,477,211 717,010,251 1,109,487,462375,803,751 730,042,595 1,105,846,346389,347,038 768,641,959 1,157,988,997380,172,801 756,936,983 1,137,109,784
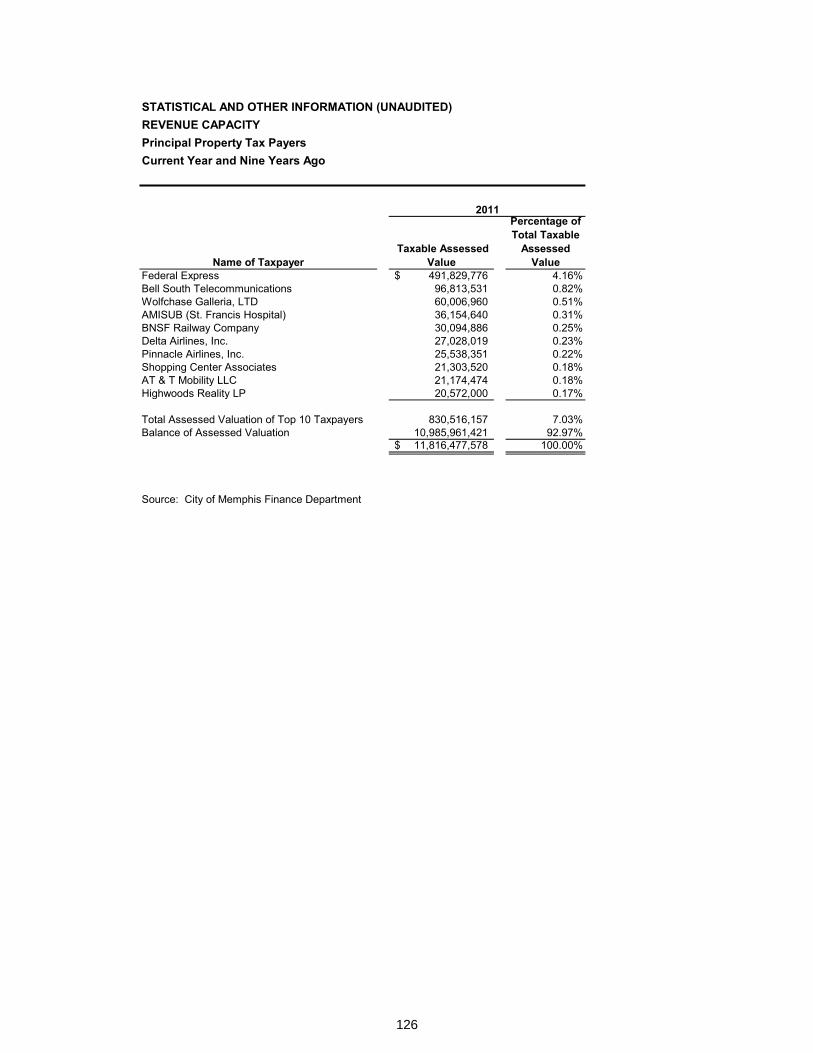
126
Principal Property Tax Payers – Current Year and Nine Years Ago
STATISTICAL AND OTHER INFORMATION (UNAUDITED)REVENUE CAPACITYPrincipal Property Tax PayersCurrent Year and Nine Years Ago
2011
Name of Taxpayer Taxable Assessed
Value
Percentage of Total Taxable
Assessed Value
Federal Express 491,829,776$ 4.16%Bell South Telecommunications 96,813,531 0.82%Wolfchase Galleria, LTD 60,006,960 0.51%AMISUB (St. Francis Hospital) 36,154,640 0.31%BNSF Railway Company 30,094,886 0.25%Delta Airlines, Inc. 27,028,019 0.23%Pinnacle Airlines, Inc. 25,538,351 0.22%Shopping Center Associates 21,303,520 0.18%AT & T Mobility LLC 21,174,474 0.18%Highwoods Reality LP 20,572,000 0.17%
Total Assessed Valuation of Top 10 Taxpayers 830,516,157 7.03%Balance of Assessed Valuation 10,985,961,421 92.97%
11,816,477,578$ 100.00%
Source: City of Memphis Finance Department
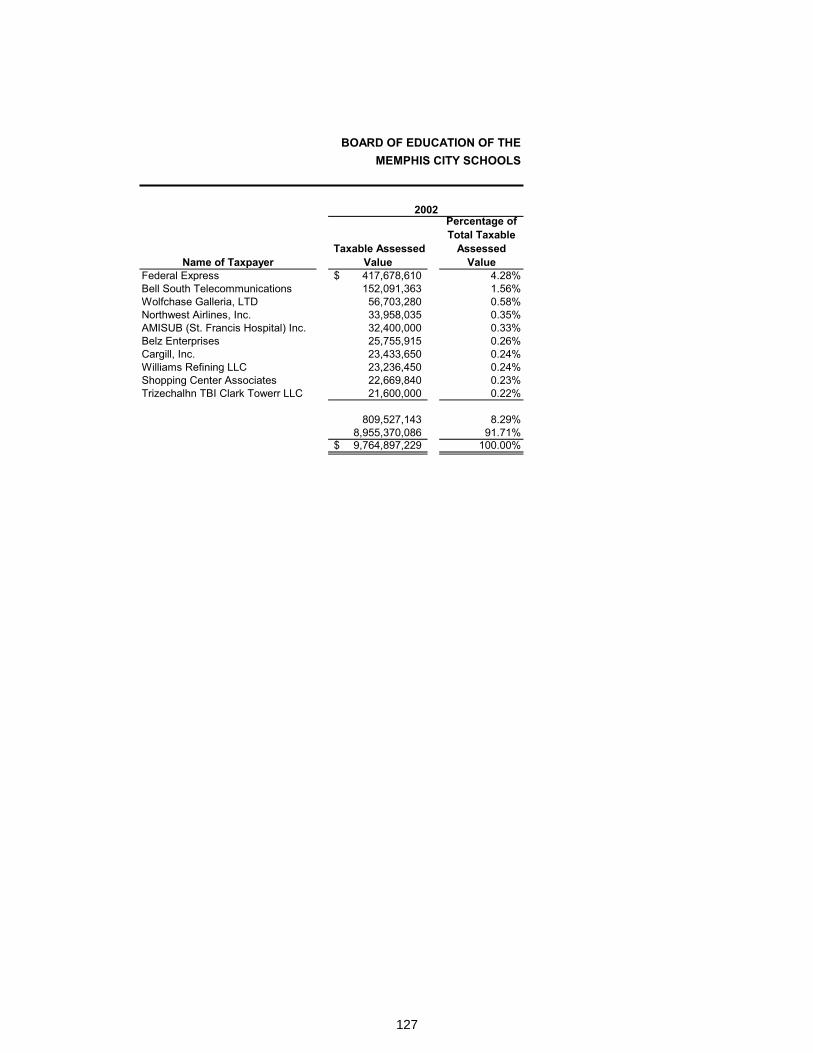
127
BOARD OF EDUCATION OF THE MEMPHIS CITY SCHOOLS
2002
Name of Taxpayer Taxable Assessed
Value
Percentage of Total Taxable
Assessed Value
Federal Express 417,678,610$ 4.28%Bell South Telecommunications 152,091,363 1.56%Wolfchase Galleria, LTD 56,703,280 0.58%Northwest Airlines, Inc. 33,958,035 0.35%AMISUB (St. Francis Hospital) Inc. 32,400,000 0.33%Belz Enterprises 25,755,915 0.26%Cargill, Inc. 23,433,650 0.24%Williams Refining LLC 23,236,450 0.24%Shopping Center Associates 22,669,840 0.23%Trizechalhn TBI Clark Towerr LLC 21,600,000 0.22%
809,527,143 8.29%8,955,370,086 91.71%9,764,897,229$ 100.00%

128
This page left intentionally blank

129
Debt Capacity
Debt Capacity

130
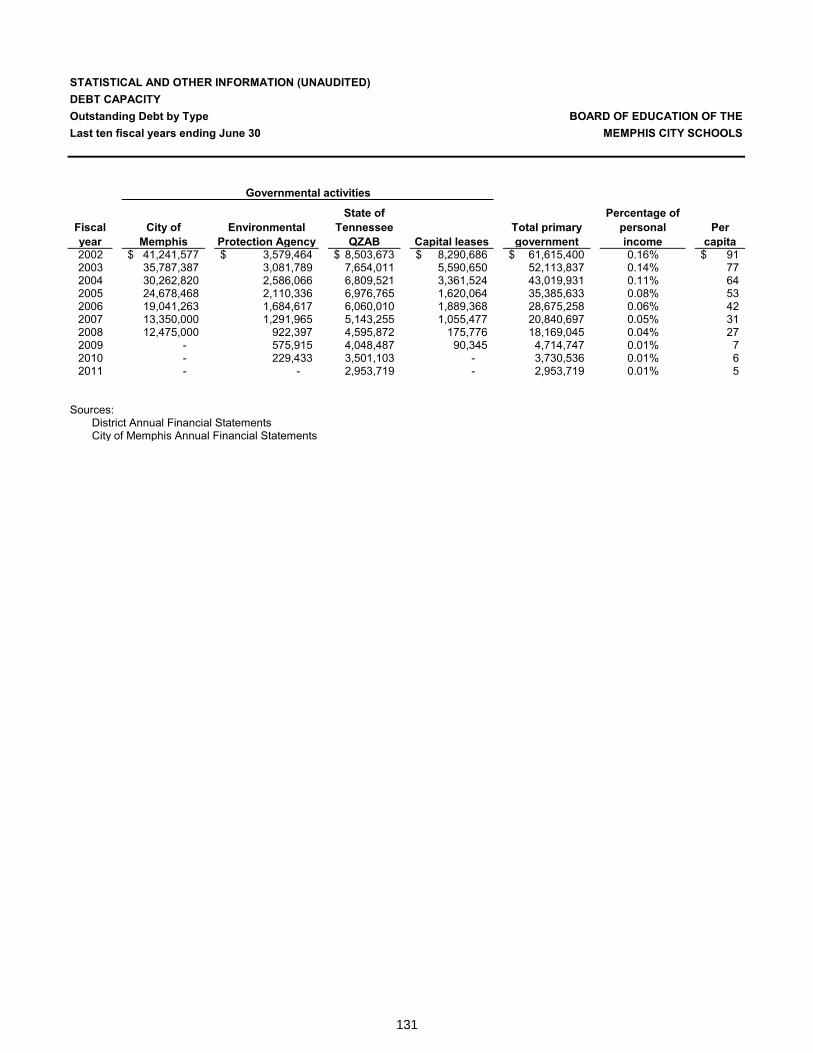
131
Outstanding Debt by Type
STATISTICAL AND OTHER INFORMATION (UNAUDITED)DEBT CAPACITYOutstanding Debt by Type BOARD OF EDUCATION OF THELast ten fiscal years ending June 30 MEMPHIS CITY SCHOOLS
Governmental activities
Fiscal year
City of Memphis
Environmental Protection Agency
State of Tennessee
QZAB Capital leasesTotal primary government
Percentage of personal income
Per capita
2002 41,241,577$ 3,579,464$ 8,503,673$ 8,290,686$ 61,615,400$ 0.16% 91$ 2003 35,787,387 3,081,789 7,654,011 5,590,650 52,113,837 0.14% 77 2004 30,262,820 2,586,066 6,809,521 3,361,524 43,019,931 0.11% 64 2005 24,678,468 2,110,336 6,976,765 1,620,064 35,385,633 0.08% 53 2006 19,041,263 1,684,617 6,060,010 1,889,368 28,675,258 0.06% 42 2007 13,350,000 1,291,965 5,143,255 1,055,477 20,840,697 0.05% 31 2008 12,475,000 922,397 4,595,872 175,776 18,169,045 0.04% 27 2009 - 575,915 4,048,487 90,345 4,714,747 0.01% 7 2010 - 229,433 3,501,103 - 3,730,536 0.01% 6 2011 - - 2,953,719 - 2,953,719 0.01% 5
Sources:District Annual Financial StatementsCity of Memphis Annual Financial Statements

132
Ten-Year Comparison of Bonded Debt to Assessed Value, Estimated Actual Value and PopulationSTATISTICAL AND OTHER INFORMATION (UNAUDITED)DEBT CAPACITYComparison of Bonded Debt to Assessed Value, Estimated Actual Value and Population BOARD OF EDUCATION OF THELast ten fiscal years ending June 30 MEMPHIS CITY SCHOOLS
Fiscal year Bonded debt Assessed Value
Percent of bonded debt to assessed
valueEstimated Actual
Value
Percent of bonded debt to estimated actual value Population
Per capita bonded
debt2002 49,745,250$ 9,764,897,229$ 0.51% 30,569,738,373$ 0.16% 674,478 $742003 43,441,398 10,200,919,453 0.43 32,265,193,507 0.13 673,120 652004 37,072,341 9,992,933,591 0.37 31,801,585,556 0.12 671,929 552005 31,655,233 11,108,643,960 0.28 35,550,324,536 0.09 672,277 472006 25,101,273 11,156,091,653 0.23 35,682,730,905 0.07 677,345 372007 18,493,255 11,369,792,425 0.16 36,554,762,536 0.05 674,028 272008 17,070,872 11,392,568,556 0.15 36,776,628,120 0.05 669,651 252009 4,048,487 12,341,760,825 0.03 39,750,992,810 0.01 676,640 62010 3,501,103 12,053,353,530 0.03 38,788,129,245 0.01 646,889 52011 2,953,719 11,816,477,578 0.02 38,069,898,505 0.01 646,889 5
Sources:District Annual Financial StatementsCity of Memphis Annual Financial Statements
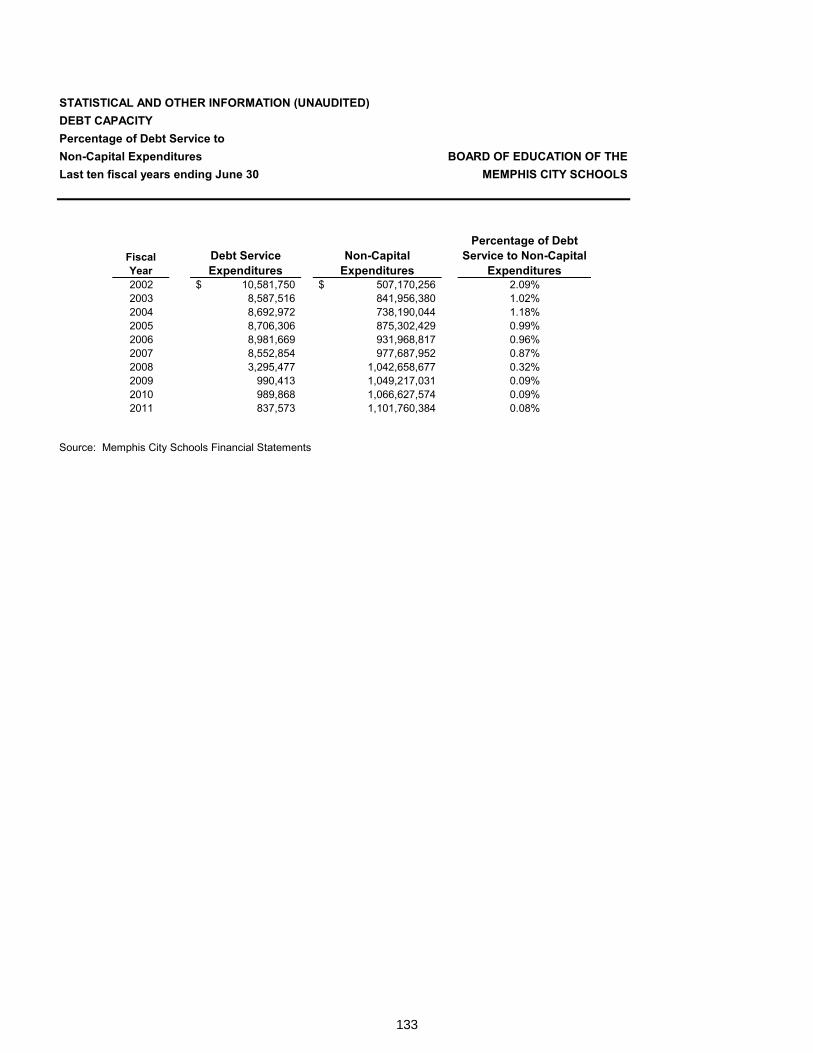
133
Percentage of Debt Service to Non-Capital Expenditures – Last Ten Fiscal Years
STATISTICAL AND OTHER INFORMATION (UNAUDITED)DEBT CAPACITYPercentage of Debt Service toNon-Capital Expenditures BOARD OF EDUCATION OF THELast ten fiscal years ending June 30 MEMPHIS CITY SCHOOLS
Fiscal Year
Debt Service Expenditures
Non-Capital Expenditures
Percentage of Debt Service to Non-Capital
Expenditures2002 10,581,750$ 507,170,256$ 2.09%2003 8,587,516 841,956,380 1.02%2004 8,692,972 738,190,044 1.18%2005 8,706,306 875,302,429 0.99%2006 8,981,669 931,968,817 0.96%2007 8,552,854 977,687,952 0.87%2008 3,295,477 1,042,658,677 0.32%2009 990,413 1,049,217,031 0.09%2010 989,868 1,066,627,574 0.09%2011 837,573 1,101,760,384 0.08%
Source: Memphis City Schools Financial Statements

134
This page left intentionally blank

135
Demographic and Economic Information
Demographic and Economic Information

136
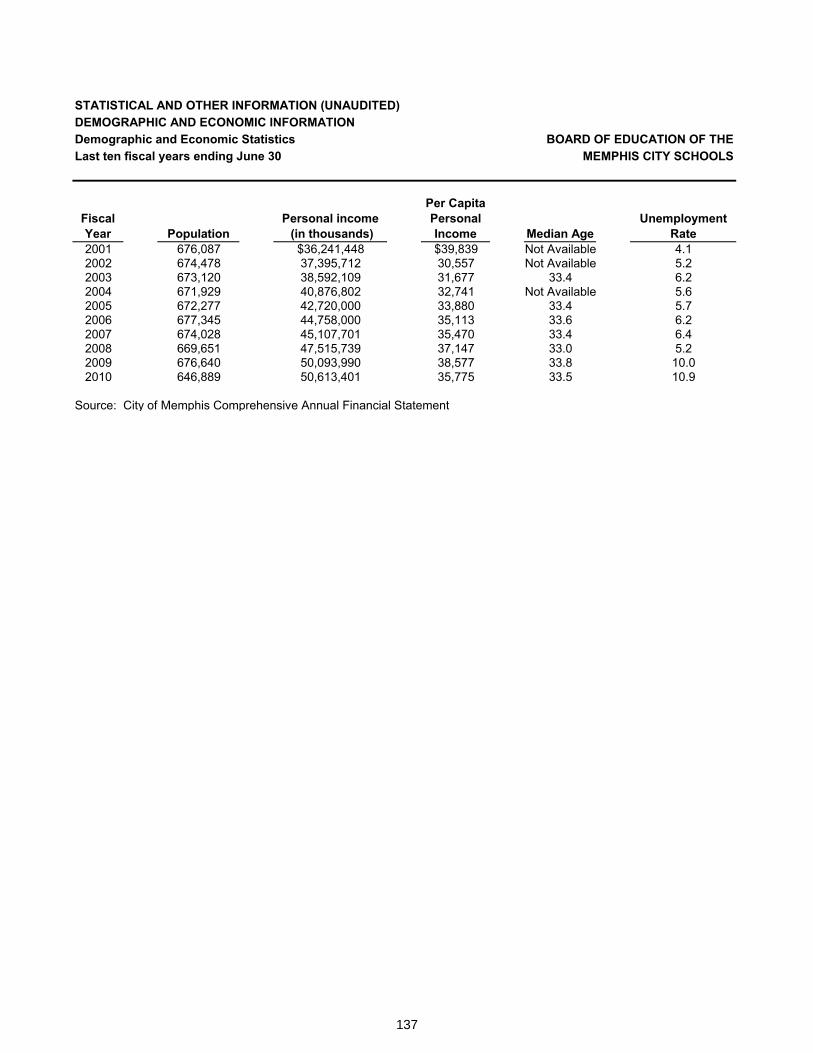
137
Demographic and Economic Statistics
STATISTICAL AND OTHER INFORMATION (UNAUDITED)DEMOGRAPHIC AND ECONOMIC INFORMATIONDemographic and Economic Statistics BOARD OF EDUCATION OF THELast ten fiscal years ending June 30 MEMPHIS CITY SCHOOLS
Fiscal Year Population
Personal income (in thousands)
Per Capita Personal Income Median Age
Unemployment Rate
2001 676,087 $36,241,448 $39,839 Not Available 4.12002 674,478 37,395,712 30,557 Not Available 5.22003 673,120 38,592,109 31,677 33.4 6.22004 671,929 40,876,802 32,741 Not Available 5.62005 672,277 42,720,000 33,880 33.4 5.72006 677,345 44,758,000 35,113 33.6 6.22007 674,028 45,107,701 35,470 33.4 6.42008 669,651 47,515,739 37,147 33.0 5.22009 676,640 50,093,990 38,577 33.8 10.02010 646,889 50,613,401 35,775 33.5 10.9
Source: City of Memphis Comprehensive Annual Financial Statement
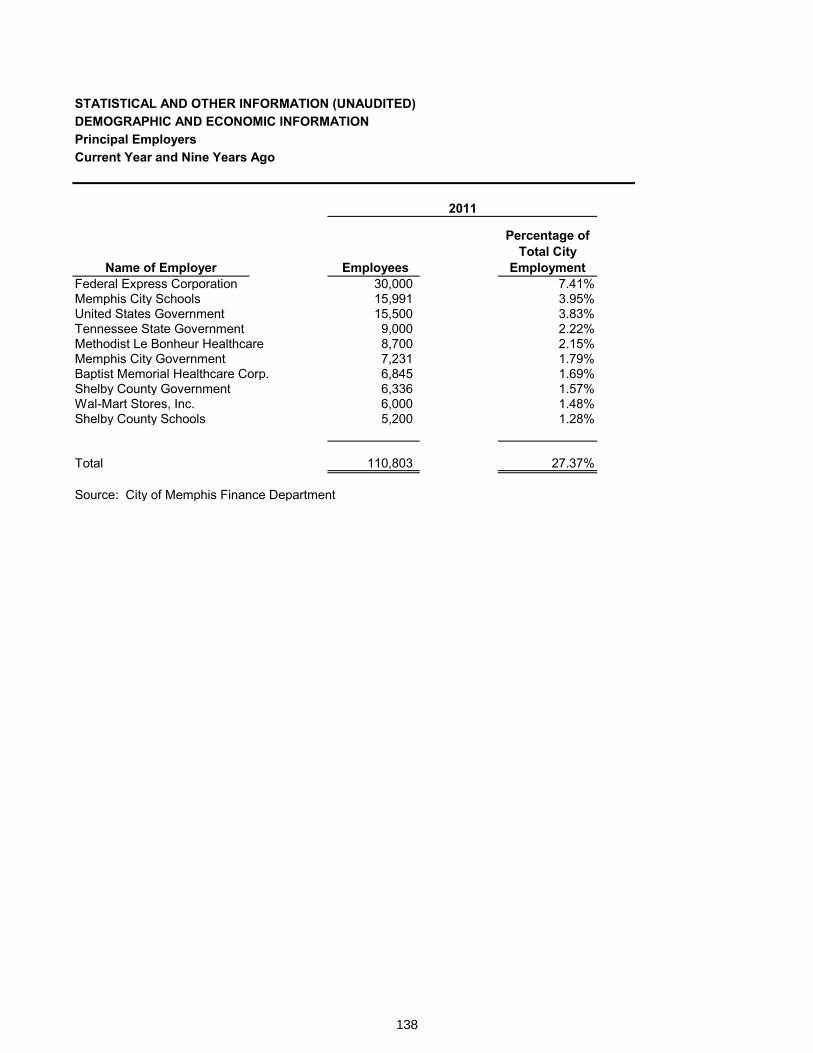
138
Principal Employers, Current Year and Nine Years Ago
STATISTICAL AND OTHER INFORMATION (UNAUDITED)DEMOGRAPHIC AND ECONOMIC INFORMATIONPrincipal EmployersCurrent Year and Nine Years Ago
2011
Name of Employer Employees
Percentage of Total City
EmploymentFederal Express Corporation 30,000 7.41%Memphis City Schools 15,991 3.95%United States Government 15,500 3.83%Tennessee State Government 9,000 2.22%Methodist Le Bonheur Healthcare 8,700 2.15%Memphis City Government 7,231 1.79%Baptist Memorial Healthcare Corp. 6,845 1.69%Shelby County Government 6,336 1.57%Wal-Mart Stores, Inc. 6,000 1.48%Shelby County Schools 5,200 1.28%
Total 110,803 27.37%
Source: City of Memphis Finance Department
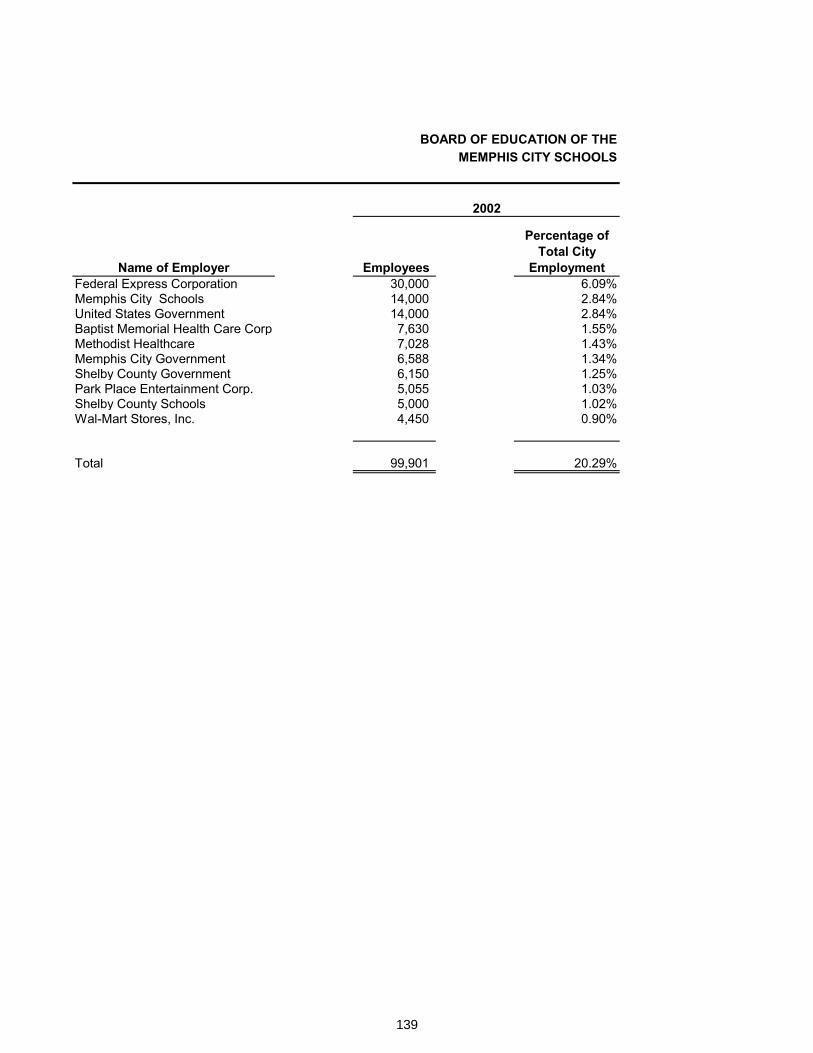
139
BOARD OF EDUCATION OF THE MEMPHIS CITY SCHOOLS
2002
Name of Employer Employees
Percentage of Total City
EmploymentFederal Express Corporation 30,000 6.09%Memphis City Schools 14,000 2.84%United States Government 14,000 2.84%Baptist Memorial Health Care Corp 7,630 1.55%Methodist Healthcare 7,028 1.43%Memphis City Government 6,588 1.34%Shelby County Government 6,150 1.25%Park Place Entertainment Corp. 5,055 1.03%Shelby County Schools 5,000 1.02%Wal-Mart Stores, Inc. 4,450 0.90%
Total 99,901 20.29%

140
This page left intentionally blank

141
Operating Information
Operating Information
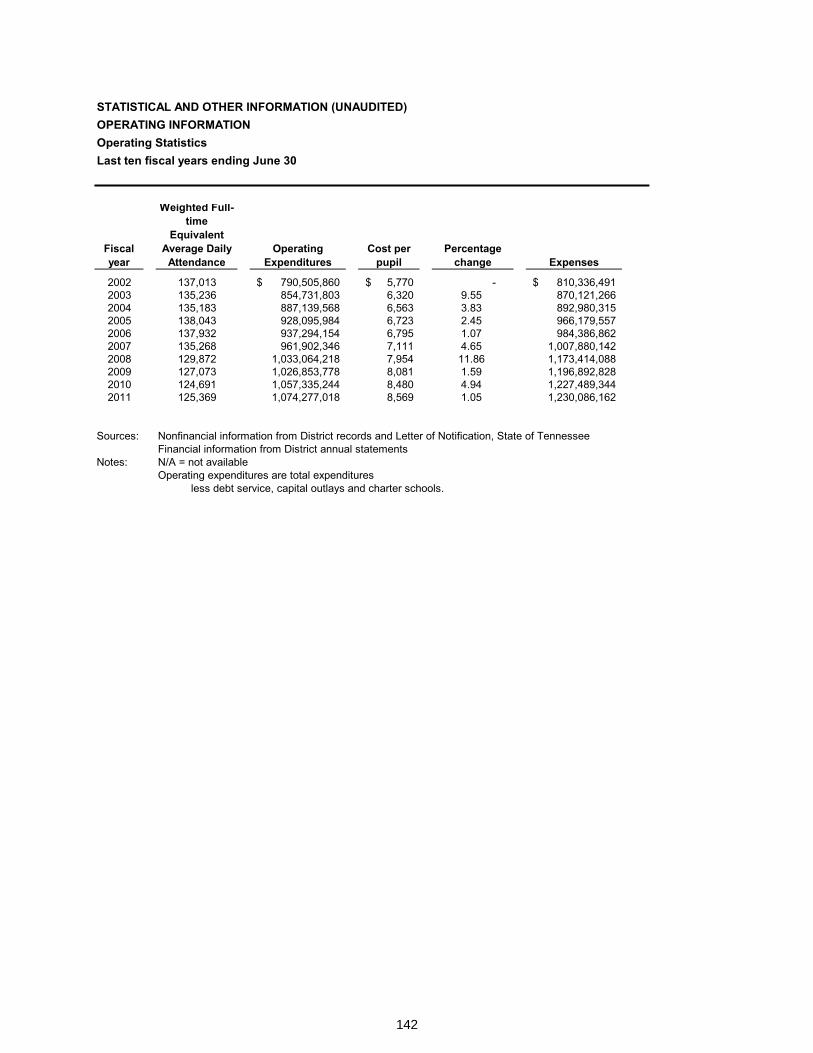
142
Operating Statistics
STATISTICAL AND OTHER INFORMATION (UNAUDITED)OPERATING INFORMATIONOperating StatisticsLast ten fiscal years ending June 30
Fiscal year
Weighted Full-time
Equivalent Average Daily
AttendanceOperating
ExpendituresCost per
pupilPercentage
change Expenses
2002 137,013 790,505,860$ 5,770$ - 810,336,491$2003 135,236 854,731,803 6,320 9.55 870,121,266 2004 135,183 887,139,568 6,563 3.83 892,980,315 2005 138,043 928,095,984 6,723 2.45 966,179,557 2006 137,932 937,294,154 6,795 1.07 984,386,862 2007 135,268 961,902,346 7,111 4.65 1,007,880,142 2008 129,872 1,033,064,218 7,954 11.86 1,173,414,088 2009 127,073 1,026,853,778 8,081 1.59 1,196,892,828 2010 124,691 1,057,335,244 8,480 4.94 1,227,489,344 2011 125,369 1,074,277,018 8,569 1.05 1,230,086,162
Sources: Nonfinancial information from District records and Letter of Notification, State of TennesseeFinancial information from District annual statements
Notes: N/A = not availableOperating expenditures are total expenditures
less debt service, capital outlays and charter schools.
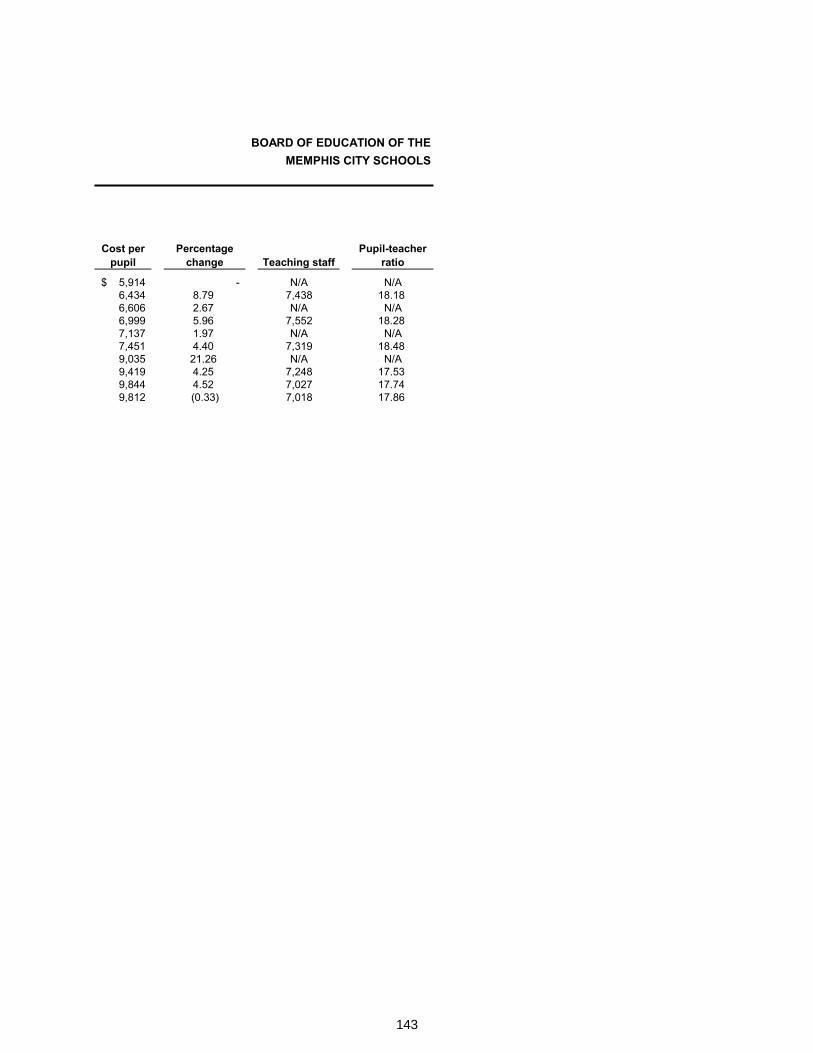
143
BOARD OF EDUCATION OF THE MEMPHIS CITY SCHOOLS
Cost per pupil
Percentage change Teaching staff
Pupil-teacher ratio
5,914$ - N/A N/A6,434 8.79 7,438 18.186,606 2.67 N/A N/A6,999 5.96 7,552 18.287,137 1.97 N/A N/A7,451 4.40 7,319 18.489,035 21.26 N/A N/A9,419 4.25 7,248 17.539,844 4.52 7,027 17.749,812 (0.33) 7,018 17.86

144
This page left intentionally blank
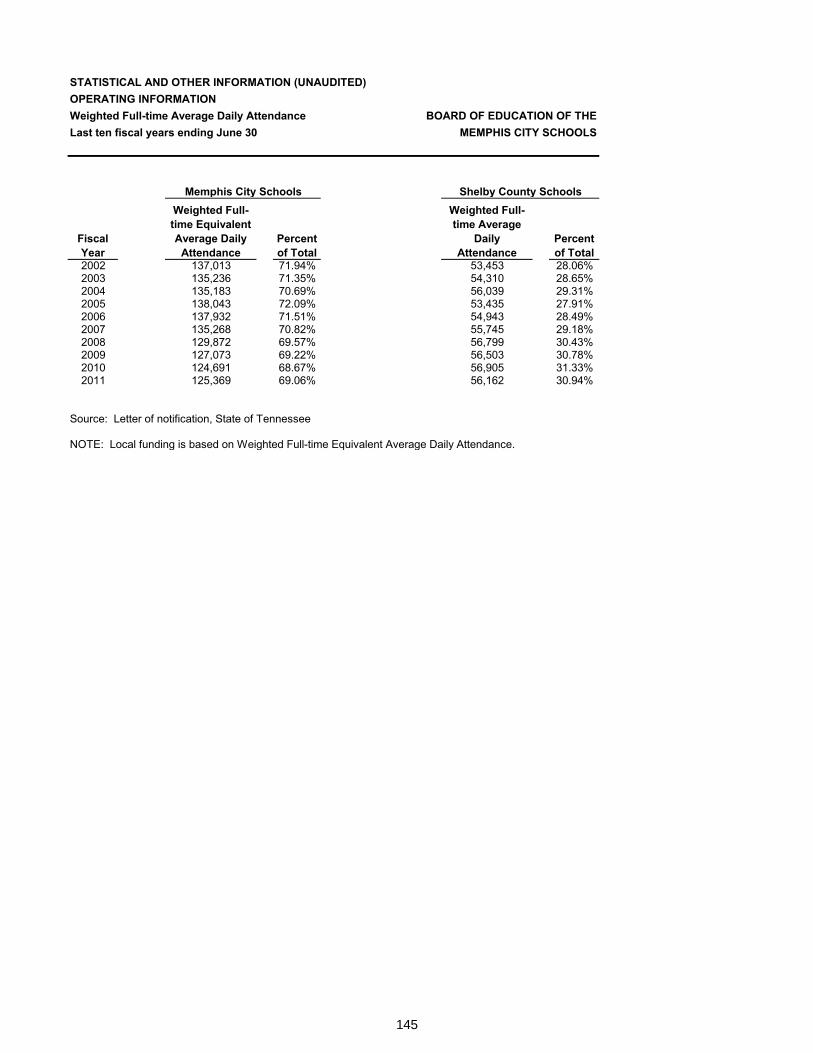
145
Weighted Full-time Equivalent Average Daily Attendance
STATISTICAL AND OTHER INFORMATION (UNAUDITED)OPERATING INFORMATIONWeighted Full-time Average Daily Attendance BOARD OF EDUCATION OF THELast ten fiscal years ending June 30 MEMPHIS CITY SCHOOLS
Memphis City Schools Shelby County Schools
Fiscal Year
Weighted Full-time Equivalent Average Daily
AttendancePercent of Total
Weighted Full-time Average
Daily Attendance
Percent of Total
2002 137,013 71.94% 53,453 28.06%2003 135,236 71.35% 54,310 28.65%2004 135,183 70.69% 56,039 29.31%2005 138,043 72.09% 53,435 27.91%2006 137,932 71.51% 54,943 28.49%2007 135,268 70.82% 55,745 29.18%2008 129,872 69.57% 56,799 30.43%2009 127,073 69.22% 56,503 30.78%2010 124,691 68.67% 56,905 31.33%2011 125,369 69.06% 56,162 30.94%
Source: Letter of notification, State of Tennessee
NOTE: Local funding is based on Weighted Full-time Equivalent Average Daily Attendance.
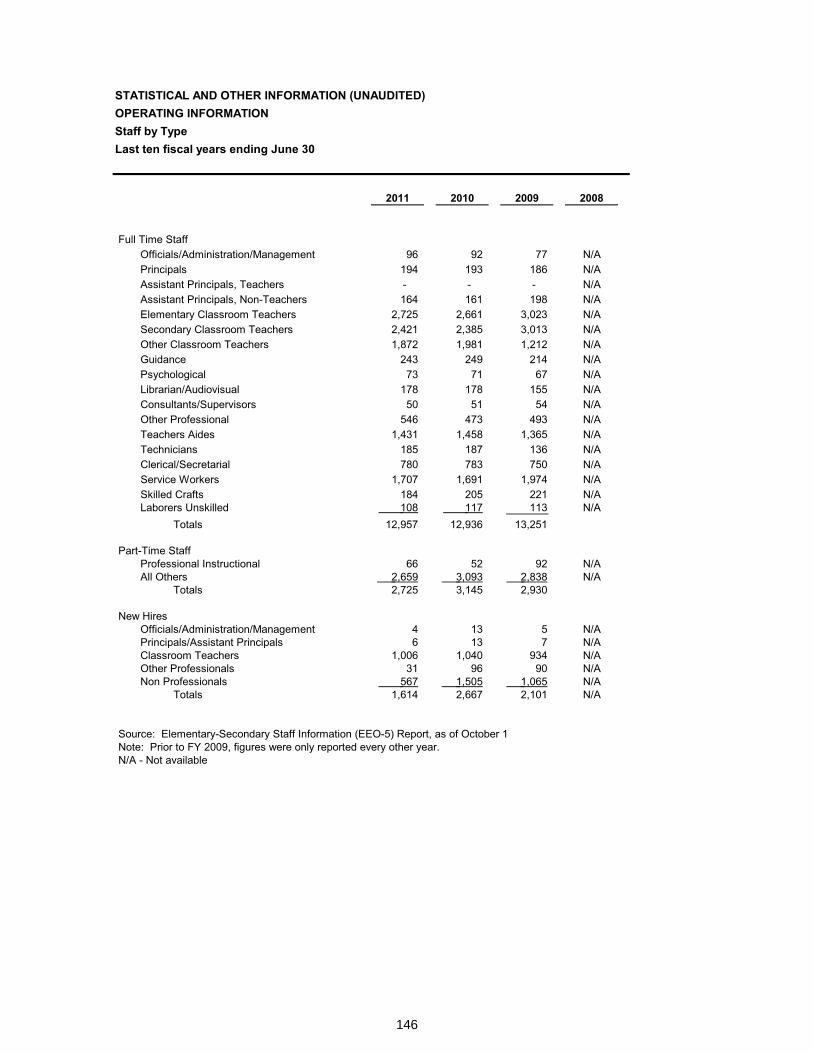
146
Staff by Type
STATISTICAL AND OTHER INFORMATION (UNAUDITED)OPERATING INFORMATIONStaff by TypeLast ten fiscal years ending June 30
2011 2010 2009 2008
Full Time StaffOfficials/Administration/Management 96 92 77 N/APrincipals 194 193 186 N/AAssistant Principals, Teachers - - - N/AAssistant Principals, Non-Teachers 164 161 198 N/AElementary Classroom Teachers 2,725 2,661 3,023 N/ASecondary Classroom Teachers 2,421 2,385 3,013 N/AOther Classroom Teachers 1,872 1,981 1,212 N/AGuidance 243 249 214 N/APsychological 73 71 67 N/ALibrarian/Audiovisual 178 178 155 N/AConsultants/Supervisors 50 51 54 N/AOther Professional 546 473 493 N/ATeachers Aides 1,431 1,458 1,365 N/ATechnicians 185 187 136 N/AClerical/Secretarial 780 783 750 N/AService Workers 1,707 1,691 1,974 N/ASkilled Crafts 184 205 221 N/ALaborers Unskilled 108 117 113 N/A
Totals 12,957 12,936 13,251
Part-Time StaffProfessional Instructional 66 52 92 N/AAll Others 2,659 3,093 2,838 N/A
Totals 2,725 3,145 2,930
New HiresOfficials/Administration/Management 4 13 5 N/APrincipals/Assistant Principals 6 13 7 N/AClassroom Teachers 1,006 1,040 934 N/AOther Professionals 31 96 90 N/ANon Professionals 567 1,505 1,065 N/A
Totals 1,614 2,667 2,101 N/A
Source: Elementary-Secondary Staff Information (EEO-5) Report, as of October 1Note: Prior to FY 2009, figures were only reported every other year.N/A - Not available
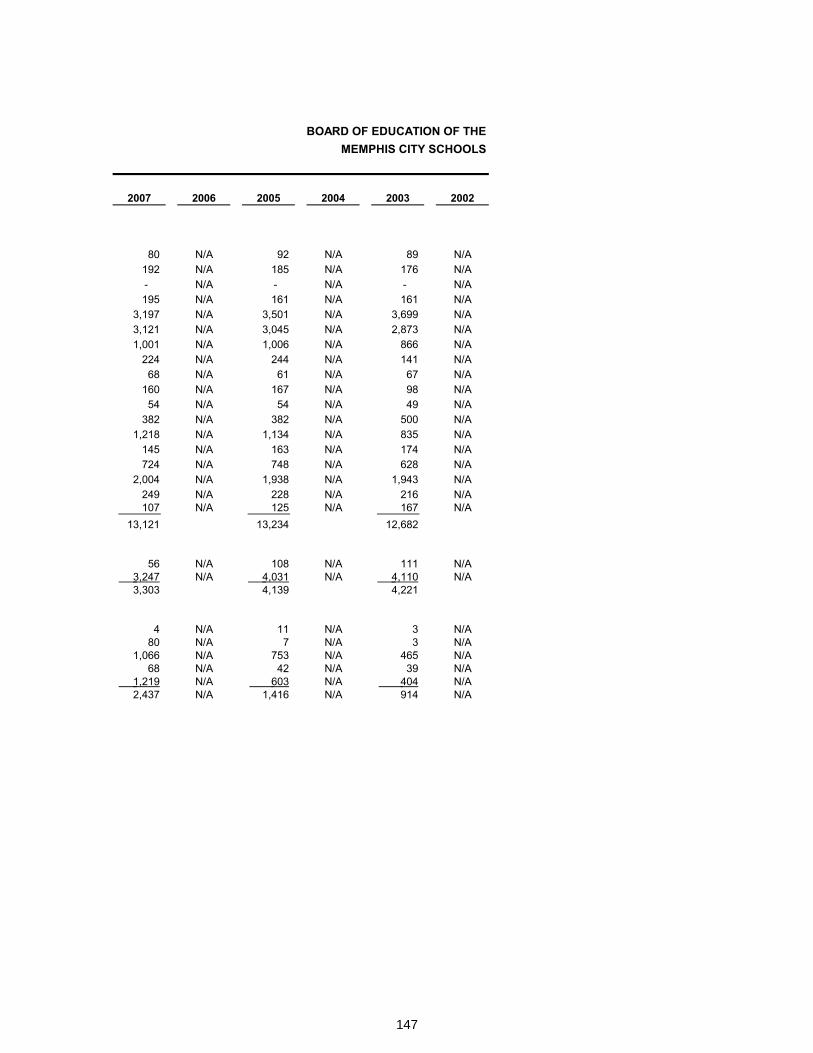
147
BOARD OF EDUCATION OF THE MEMPHIS CITY SCHOOLS
2007 2006 2005 2004 2003 2002
80 N/A 92 N/A 89 N/A192 N/A 185 N/A 176 N/A- N/A - N/A - N/A195 N/A 161 N/A 161 N/A
3,197 N/A 3,501 N/A 3,699 N/A3,121 N/A 3,045 N/A 2,873 N/A1,001 N/A 1,006 N/A 866 N/A
224 N/A 244 N/A 141 N/A68 N/A 61 N/A 67 N/A
160 N/A 167 N/A 98 N/A54 N/A 54 N/A 49 N/A
382 N/A 382 N/A 500 N/A1,218 N/A 1,134 N/A 835 N/A
145 N/A 163 N/A 174 N/A724 N/A 748 N/A 628 N/A
2,004 N/A 1,938 N/A 1,943 N/A249 N/A 228 N/A 216 N/A107 N/A 125 N/A 167 N/A
13,121 13,234 12,682
56 N/A 108 N/A 111 N/A3,247 N/A 4,031 N/A 4,110 N/A3,303 4,139 4,221
4 N/A 11 N/A 3 N/A80 N/A 7 N/A 3 N/A
1,066 N/A 753 N/A 465 N/A68 N/A 42 N/A 39 N/A
1,219 N/A 603 N/A 404 N/A2,437 N/A 1,416 N/A 914 N/A
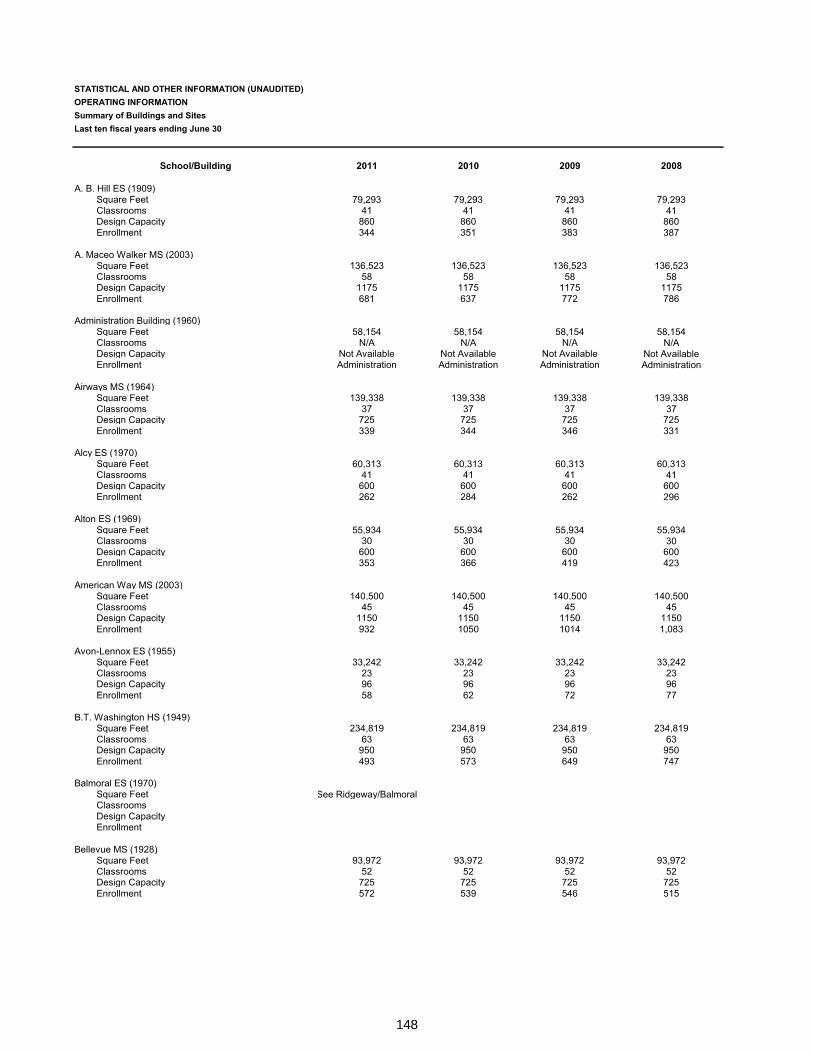
148
Summary of Buildings and Sites
STATISTICAL AND OTHER INFORMATION (UNAUDITED)OPERATING INFORMATIONSummary of Buildings and SitesLast ten fiscal years ending June 30
School/Building 2011 2010 2009 2008
A. B. Hill ES (1909)Square Feet 79,293 79,293 79,293 79,293Classrooms 41 41 41 41Design Capacity 860 860 860 860Enrollment 344 351 383 387
A. Maceo Walker MS (2003)Square Feet 136,523 136,523 136,523 136,523Classrooms 58 58 58 58Design Capacity 1175 1175 1175 1175Enrollment 681 637 772 786
Administration Building (1960)Square Feet 58,154 58,154 58,154 58,154Classrooms N/A N/A N/A N/ADesign Capacity Not Available Not Available Not Available Not AvailableEnrollment Administration Administration Administration Administration
Airways MS (1964)Square Feet 139,338 139,338 139,338 139,338Classrooms 37 37 37 37Design Capacity 725 725 725 725Enrollment 339 344 346 331
Alcy ES (1970)Square Feet 60,313 60,313 60,313 60,313Classrooms 41 41 41 41Design Capacity 600 600 600 600Enrollment 262 284 262 296
Alton ES (1969)Square Feet 55,934 55,934 55,934 55,934Classrooms 30 30 30 30Design Capacity 600 600 600 600Enrollment 353 366 419 423
American Way MS (2003)Square Feet 140,500 140,500 140,500 140,500Classrooms 45 45 45 45Design Capacity 1150 1150 1150 1150Enrollment 932 1050 1014 1,083
Avon-Lennox ES (1955)Square Feet 33,242 33,242 33,242 33,242Classrooms 23 23 23 23Design Capacity 96 96 96 96Enrollment 58 62 72 77
B.T. Washington HS (1949)Square Feet 234,819 234,819 234,819 234,819Classrooms 63 63 63 63Design Capacity 950 950 950 950Enrollment 493 573 649 747
Balmoral ES (1970)Square Feet See Ridgeway/BalmoralClassroomsDesign CapacityEnrollment
Bellevue MS (1928)Square Feet 93,972 93,972 93,972 93,972Classrooms 52 52 52 52Design Capacity 725 725 725 725Enrollment 572 539 546 515
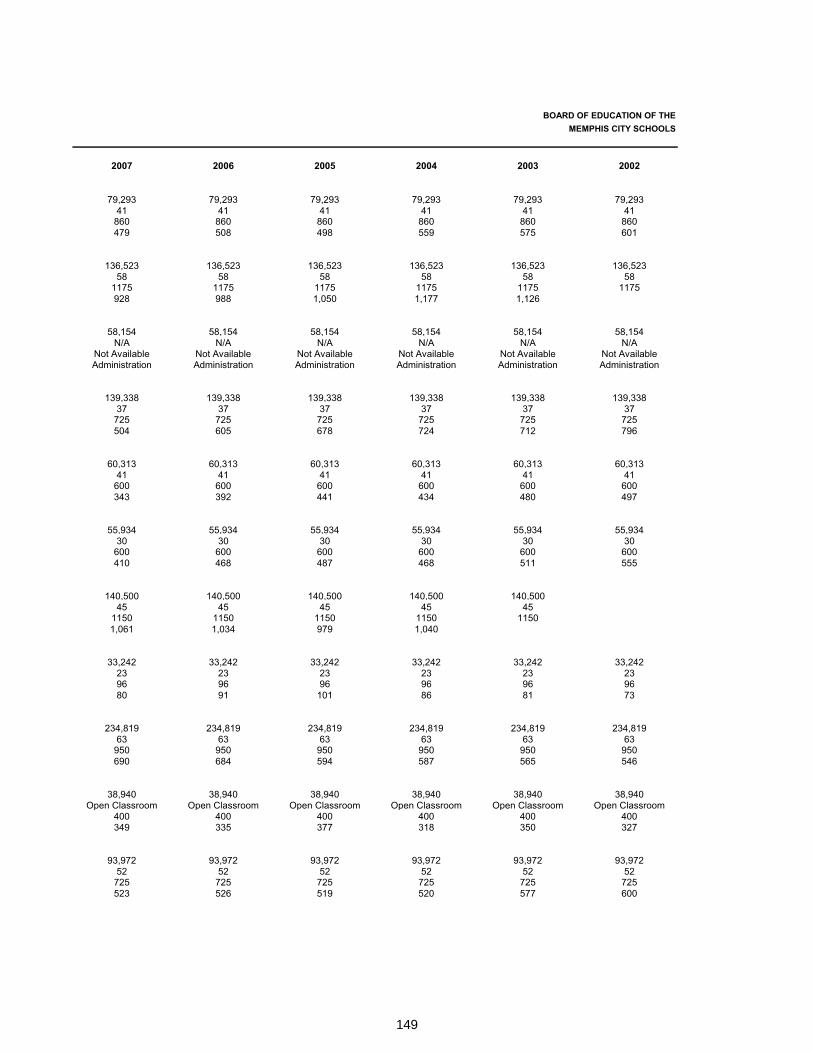
149
BOARD OF EDUCATION OF THE MEMPHIS CITY SCHOOLS
2007 2006 2005 2004 2003 2002
79,293 79,293 79,293 79,293 79,293 79,29341 41 41 41 41 41
860 860 860 860 860 860479 508 498 559 575 601
136,523 136,523 136,523 136,523 136,523 136,52358 58 58 58 58 58
1175 1175 1175 1175 1175 1175928 988 1,050 1,177 1,126
58,154 58,154 58,154 58,154 58,154 58,154N/A N/A N/A N/A N/A N/A
Not Available Not Available Not Available Not Available Not Available Not AvailableAdministration Administration Administration Administration Administration Administration
139,338 139,338 139,338 139,338 139,338 139,33837 37 37 37 37 37
725 725 725 725 725 725504 605 678 724 712 796
60,313 60,313 60,313 60,313 60,313 60,31341 41 41 41 41 41
600 600 600 600 600 600343 392 441 434 480 497
55,934 55,934 55,934 55,934 55,934 55,93430 30 30 30 30 30
600 600 600 600 600 600410 468 487 468 511 555
140,500 140,500 140,500 140,500 140,50045 45 45 45 45
1150 1150 1150 1150 11501,061 1,034 979 1,040
33,242 33,242 33,242 33,242 33,242 33,24223 23 23 23 23 2396 96 96 96 96 9680 91 101 86 81 73
234,819 234,819 234,819 234,819 234,819 234,81963 63 63 63 63 63
950 950 950 950 950 950690 684 594 587 565 546
38,940 38,940 38,940 38,940 38,940 38,940Open Classroom Open Classroom Open Classroom Open Classroom Open Classroom Open Classroom
400 400 400 400 400 400349 335 377 318 350 327
93,972 93,972 93,972 93,972 93,972 93,97252 52 52 52 52 52
725 725 725 725 725 725523 526 519 520 577 600
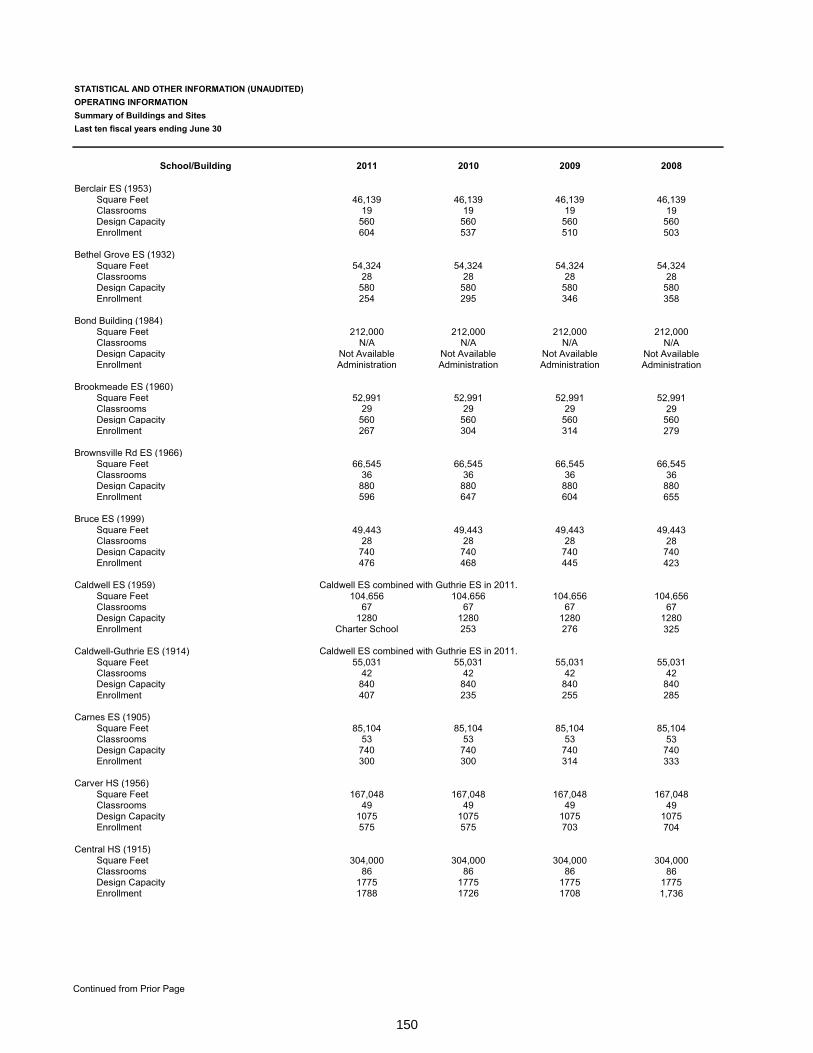
150
Continued from Prior Page
STATISTICAL AND OTHER INFORMATION (UNAUDITED)OPERATING INFORMATIONSummary of Buildings and SitesLast ten fiscal years ending June 30
School/Building 2011 2010 2009 2008
Berclair ES (1953)Square Feet 46,139 46,139 46,139 46,139Classrooms 19 19 19 19Design Capacity 560 560 560 560Enrollment 604 537 510 503
Bethel Grove ES (1932)Square Feet 54,324 54,324 54,324 54,324Classrooms 28 28 28 28Design Capacity 580 580 580 580Enrollment 254 295 346 358
Bond Building (1984)Square Feet 212,000 212,000 212,000 212,000Classrooms N/A N/A N/A N/ADesign Capacity Not Available Not Available Not Available Not AvailableEnrollment Administration Administration Administration Administration
Brookmeade ES (1960)Square Feet 52,991 52,991 52,991 52,991Classrooms 29 29 29 29Design Capacity 560 560 560 560Enrollment 267 304 314 279
Brownsville Rd ES (1966)Square Feet 66,545 66,545 66,545 66,545Classrooms 36 36 36 36Design Capacity 880 880 880 880Enrollment 596 647 604 655
Bruce ES (1999)Square Feet 49,443 49,443 49,443 49,443Classrooms 28 28 28 28Design Capacity 740 740 740 740Enrollment 476 468 445 423
Caldwell ES (1959) Caldwell ES combined with Guthrie ES in 2011. Square Feet 104,656 104,656 104,656 104,656Classrooms 67 67 67 67Design Capacity 1280 1280 1280 1280Enrollment Charter School 253 276 325
Caldwell-Guthrie ES (1914) Caldwell ES combined with Guthrie ES in 2011. Square Feet 55,031 55,031 55,031 55,031Classrooms 42 42 42 42Design Capacity 840 840 840 840Enrollment 407 235 255 285
Carnes ES (1905)Square Feet 85,104 85,104 85,104 85,104Classrooms 53 53 53 53Design Capacity 740 740 740 740Enrollment 300 300 314 333
Carver HS (1956)Square Feet 167,048 167,048 167,048 167,048Classrooms 49 49 49 49Design Capacity 1075 1075 1075 1075Enrollment 575 575 703 704
Central HS (1915)Square Feet 304,000 304,000 304,000 304,000Classrooms 86 86 86 86Design Capacity 1775 1775 1775 1775Enrollment 1788 1726 1708 1,736
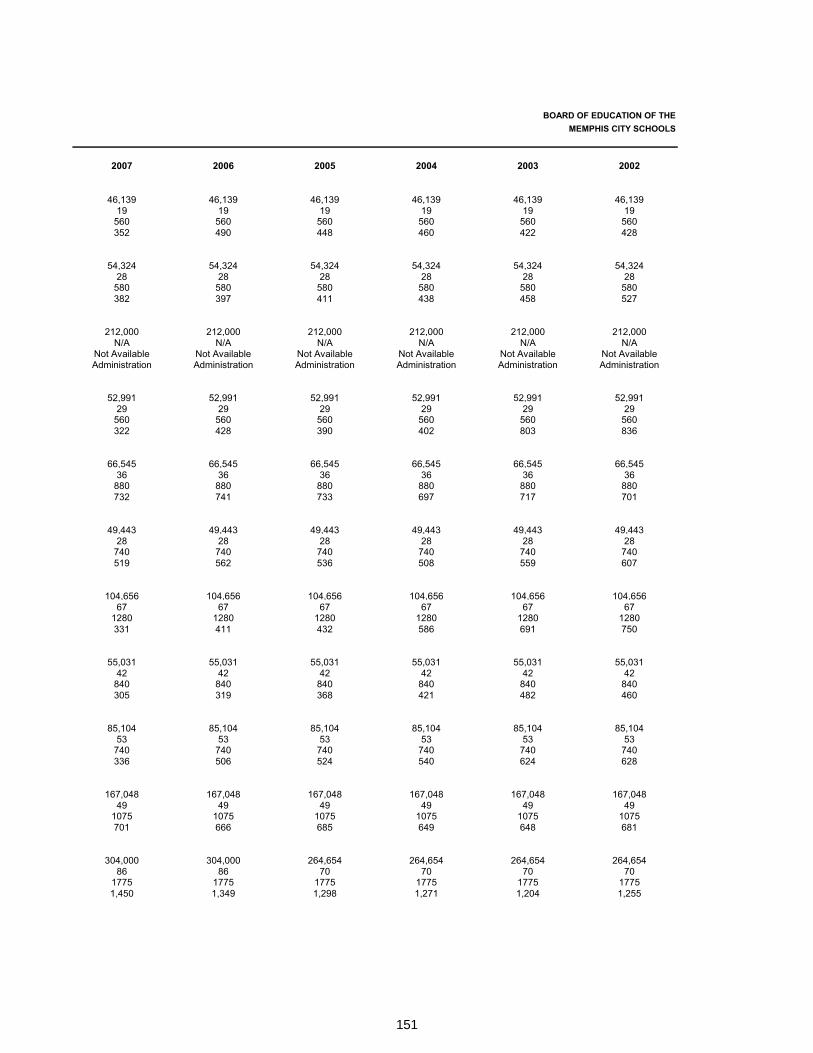
151
BOARD OF EDUCATION OF THE MEMPHIS CITY SCHOOLS
2007 2006 2005 2004 2003 2002
46,139 46,139 46,139 46,139 46,139 46,13919 19 19 19 19 19
560 560 560 560 560 560352 490 448 460 422 428
54,324 54,324 54,324 54,324 54,324 54,32428 28 28 28 28 28
580 580 580 580 580 580382 397 411 438 458 527
212,000 212,000 212,000 212,000 212,000 212,000N/A N/A N/A N/A N/A N/A
Not Available Not Available Not Available Not Available Not Available Not AvailableAdministration Administration Administration Administration Administration Administration
52,991 52,991 52,991 52,991 52,991 52,99129 29 29 29 29 29
560 560 560 560 560 560322 428 390 402 803 836
66,545 66,545 66,545 66,545 66,545 66,54536 36 36 36 36 36
880 880 880 880 880 880732 741 733 697 717 701
49,443 49,443 49,443 49,443 49,443 49,44328 28 28 28 28 28
740 740 740 740 740 740519 562 536 508 559 607
104,656 104,656 104,656 104,656 104,656 104,65667 67 67 67 67 67
1280 1280 1280 1280 1280 1280331 411 432 586 691 750
55,031 55,031 55,031 55,031 55,031 55,03142 42 42 42 42 42
840 840 840 840 840 840305 319 368 421 482 460
85,104 85,104 85,104 85,104 85,104 85,10453 53 53 53 53 53
740 740 740 740 740 740336 506 524 540 624 628
167,048 167,048 167,048 167,048 167,048 167,04849 49 49 49 49 49
1075 1075 1075 1075 1075 1075701 666 685 649 648 681
304,000 304,000 264,654 264,654 264,654 264,65486 86 70 70 70 70
1775 1775 1775 1775 1775 17751,450 1,349 1,298 1,271 1,204 1,255
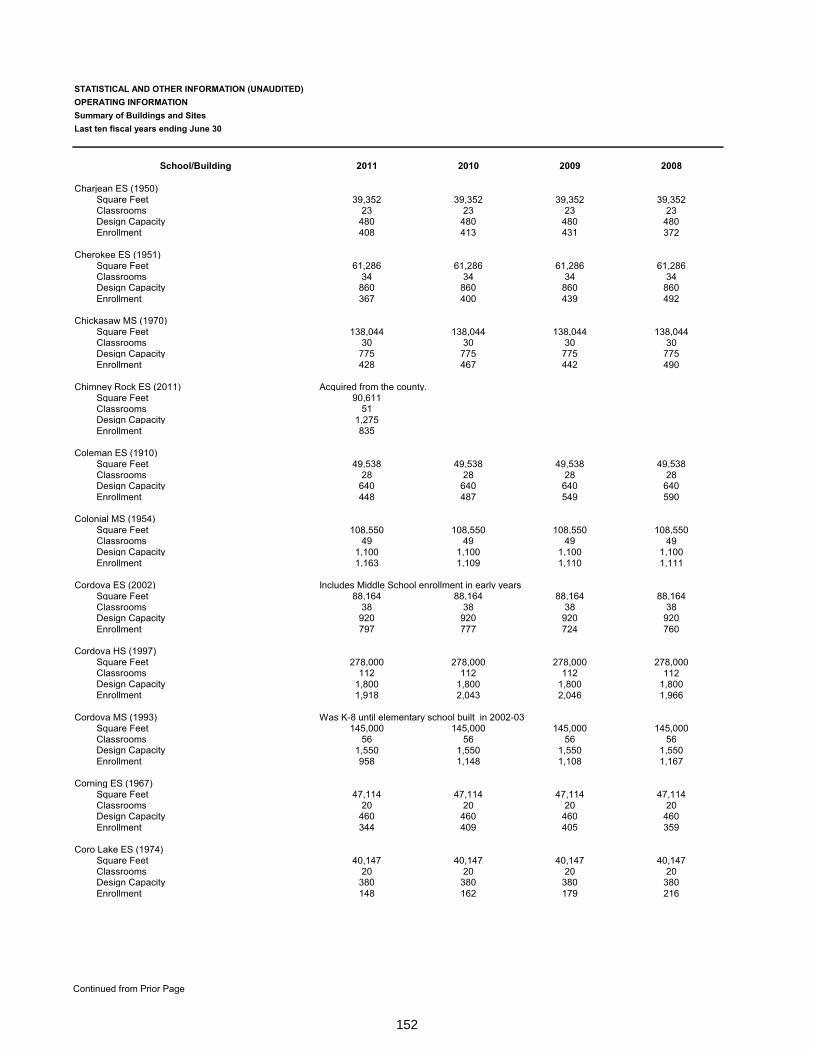
152
Continued from Prior Page
STATISTICAL AND OTHER INFORMATION (UNAUDITED)OPERATING INFORMATIONSummary of Buildings and SitesLast ten fiscal years ending June 30
School/Building 2011 2010 2009 2008
Charjean ES (1950)Square Feet 39,352 39,352 39,352 39,352Classrooms 23 23 23 23Design Capacity 480 480 480 480Enrollment 408 413 431 372
Cherokee ES (1951)Square Feet 61,286 61,286 61,286 61,286Classrooms 34 34 34 34Design Capacity 860 860 860 860Enrollment 367 400 439 492
Chickasaw MS (1970)Square Feet 138,044 138,044 138,044 138,044Classrooms 30 30 30 30Design Capacity 775 775 775 775Enrollment 428 467 442 490
Chimney Rock ES (2011) Acquired from the county.Square Feet 90,611Classrooms 51Design Capacity 1,275Enrollment 835
Coleman ES (1910)Square Feet 49,538 49,538 49,538 49,538Classrooms 28 28 28 28Design Capacity 640 640 640 640Enrollment 448 487 549 590
Colonial MS (1954)Square Feet 108,550 108,550 108,550 108,550Classrooms 49 49 49 49Design Capacity 1,100 1,100 1,100 1,100Enrollment 1,163 1,109 1,110 1,111
Cordova ES (2002) Includes Middle School enrollment in early yearsSquare Feet 88,164 88,164 88,164 88,164Classrooms 38 38 38 38Design Capacity 920 920 920 920Enrollment 797 777 724 760
Cordova HS (1997)Square Feet 278,000 278,000 278,000 278,000Classrooms 112 112 112 112Design Capacity 1,800 1,800 1,800 1,800Enrollment 1,918 2,043 2,046 1,966
Cordova MS (1993) Was K-8 until elementary school built in 2002-03Square Feet 145,000 145,000 145,000 145,000Classrooms 56 56 56 56Design Capacity 1,550 1,550 1,550 1,550Enrollment 958 1,148 1,108 1,167
Corning ES (1967)Square Feet 47,114 47,114 47,114 47,114Classrooms 20 20 20 20Design Capacity 460 460 460 460Enrollment 344 409 405 359
Coro Lake ES (1974)Square Feet 40,147 40,147 40,147 40,147Classrooms 20 20 20 20Design Capacity 380 380 380 380Enrollment 148 162 179 216
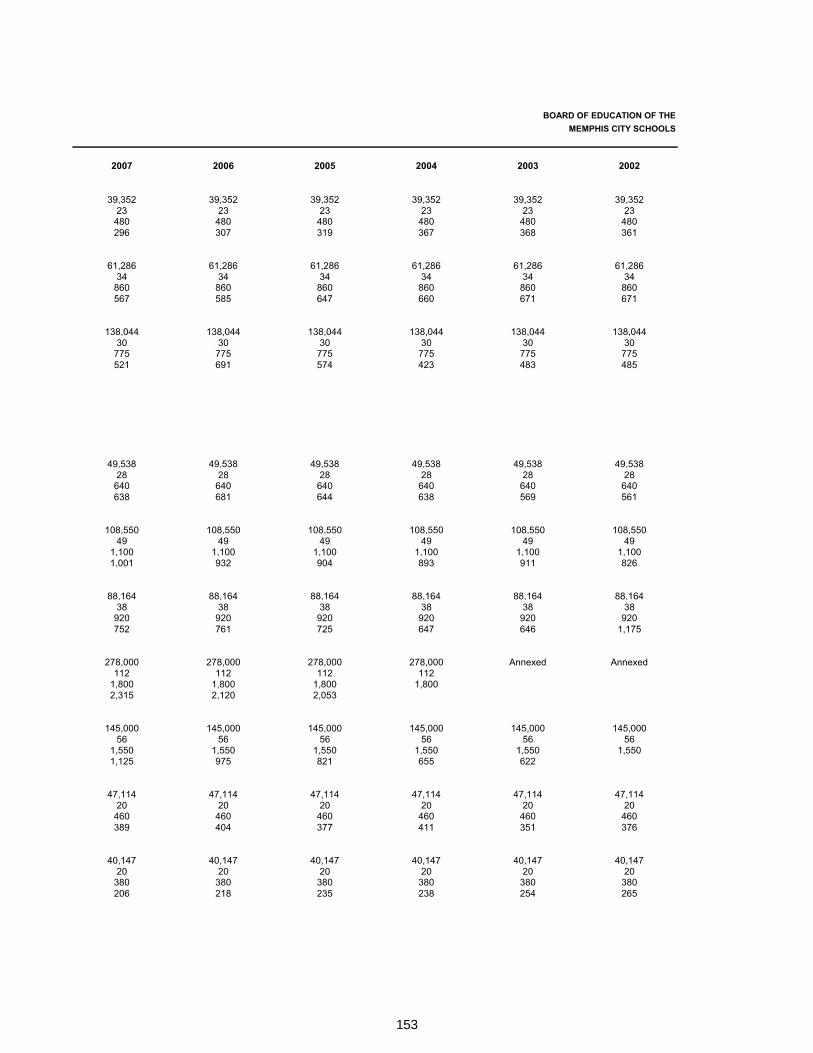
153
BOARD OF EDUCATION OF THE MEMPHIS CITY SCHOOLS
2007 2006 2005 2004 2003 2002
39,352 39,352 39,352 39,352 39,352 39,35223 23 23 23 23 23
480 480 480 480 480 480296 307 319 367 368 361
61,286 61,286 61,286 61,286 61,286 61,28634 34 34 34 34 34
860 860 860 860 860 860567 585 647 660 671 671
138,044 138,044 138,044 138,044 138,044 138,04430 30 30 30 30 30
775 775 775 775 775 775521 691 574 423 483 485
49,538 49,538 49,538 49,538 49,538 49,53828 28 28 28 28 28
640 640 640 640 640 640638 681 644 638 569 561
108,550 108,550 108,550 108,550 108,550 108,55049 49 49 49 49 49
1,100 1,100 1,100 1,100 1,100 1,1001,001 932 904 893 911 826
88,164 88,164 88,164 88,164 88,164 88,16438 38 38 38 38 38
920 920 920 920 920 920752 761 725 647 646 1,175
278,000 278,000 278,000 278,000 Annexed Annexed112 112 112 112
1,800 1,800 1,800 1,8002,315 2,120 2,053
145,000 145,000 145,000 145,000 145,000 145,00056 56 56 56 56 56
1,550 1,550 1,550 1,550 1,550 1,5501,125 975 821 655 622
47,114 47,114 47,114 47,114 47,114 47,11420 20 20 20 20 20
460 460 460 460 460 460389 404 377 411 351 376
40,147 40,147 40,147 40,147 40,147 40,14720 20 20 20 20 20
380 380 380 380 380 380206 218 235 238 254 265
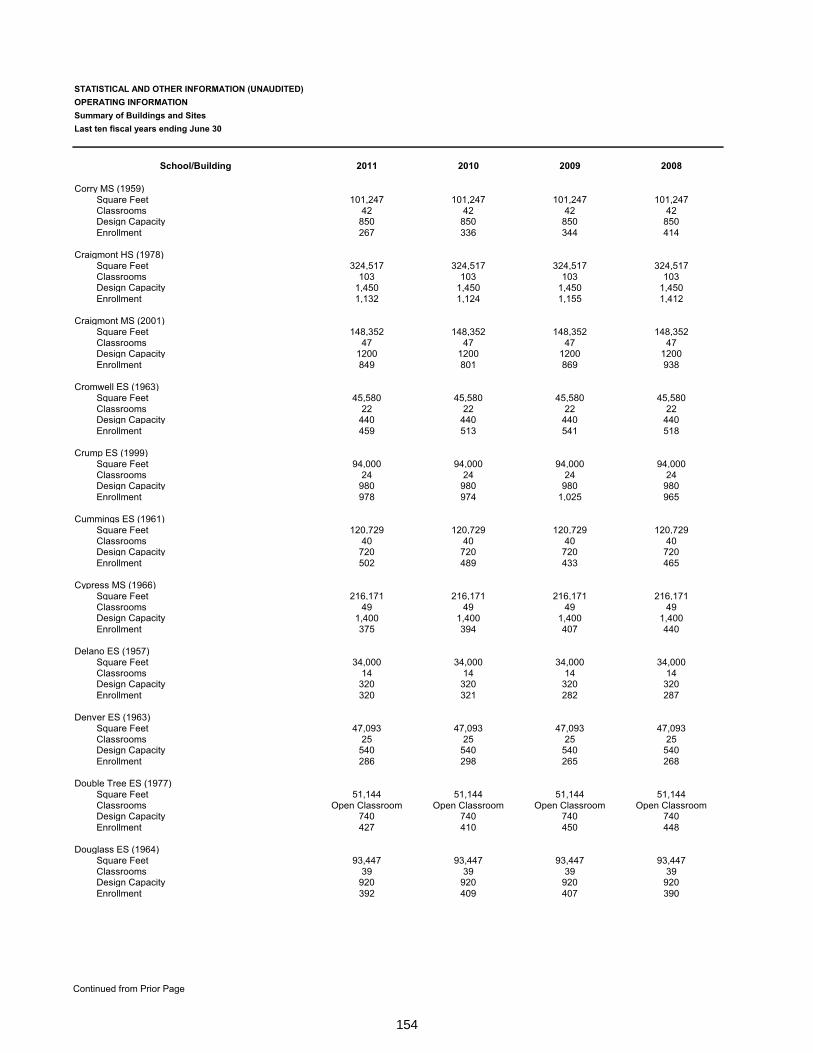
154
Continued from Prior Page
STATISTICAL AND OTHER INFORMATION (UNAUDITED)OPERATING INFORMATIONSummary of Buildings and SitesLast ten fiscal years ending June 30
School/Building 2011 2010 2009 2008
Corry MS (1959)Square Feet 101,247 101,247 101,247 101,247Classrooms 42 42 42 42Design Capacity 850 850 850 850Enrollment 267 336 344 414
Craigmont HS (1978)Square Feet 324,517 324,517 324,517 324,517Classrooms 103 103 103 103Design Capacity 1,450 1,450 1,450 1,450Enrollment 1,132 1,124 1,155 1,412
Craigmont MS (2001)Square Feet 148,352 148,352 148,352 148,352Classrooms 47 47 47 47Design Capacity 1200 1200 1200 1200Enrollment 849 801 869 938
Cromwell ES (1963)Square Feet 45,580 45,580 45,580 45,580Classrooms 22 22 22 22Design Capacity 440 440 440 440Enrollment 459 513 541 518
Crump ES (1999)Square Feet 94,000 94,000 94,000 94,000Classrooms 24 24 24 24Design Capacity 980 980 980 980Enrollment 978 974 1,025 965
Cummings ES (1961)Square Feet 120,729 120,729 120,729 120,729Classrooms 40 40 40 40Design Capacity 720 720 720 720Enrollment 502 489 433 465
Cypress MS (1966)Square Feet 216,171 216,171 216,171 216,171Classrooms 49 49 49 49Design Capacity 1,400 1,400 1,400 1,400Enrollment 375 394 407 440
Delano ES (1957)Square Feet 34,000 34,000 34,000 34,000Classrooms 14 14 14 14Design Capacity 320 320 320 320Enrollment 320 321 282 287
Denver ES (1963)Square Feet 47,093 47,093 47,093 47,093Classrooms 25 25 25 25Design Capacity 540 540 540 540Enrollment 286 298 265 268
Double Tree ES (1977)Square Feet 51,144 51,144 51,144 51,144Classrooms Open Classroom Open Classroom Open Classroom Open ClassroomDesign Capacity 740 740 740 740Enrollment 427 410 450 448
Douglass ES (1964)Square Feet 93,447 93,447 93,447 93,447Classrooms 39 39 39 39Design Capacity 920 920 920 920Enrollment 392 409 407 390
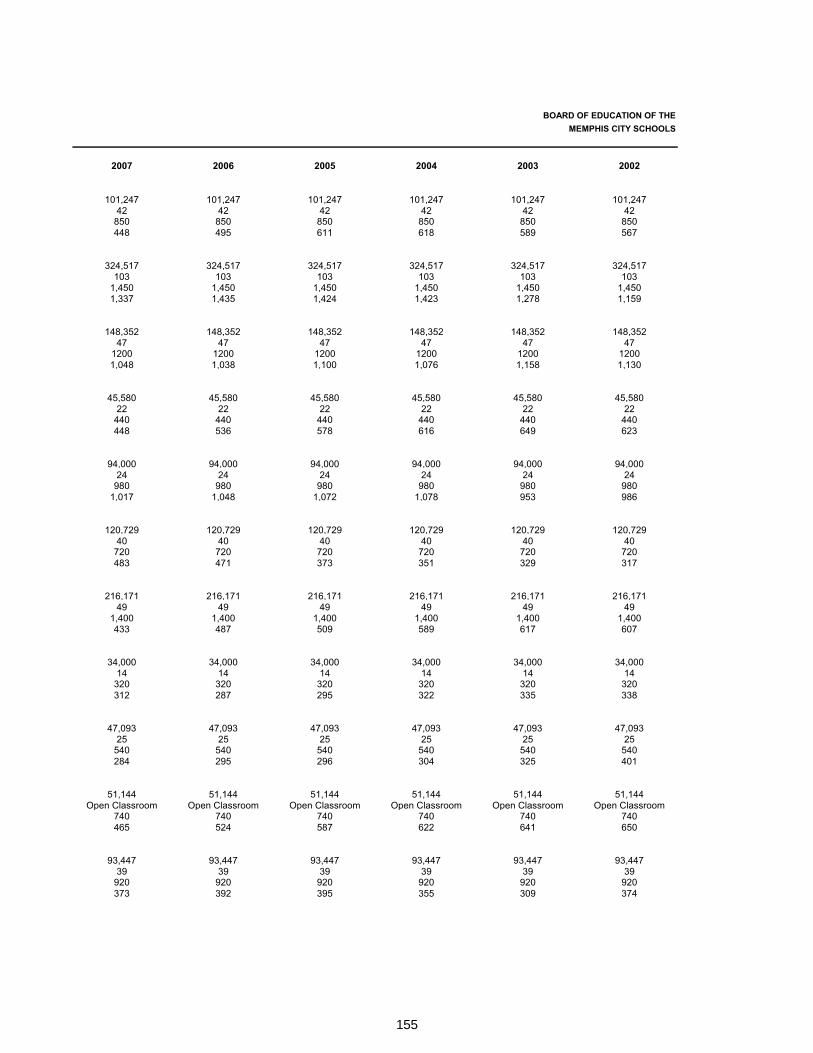
155
BOARD OF EDUCATION OF THE MEMPHIS CITY SCHOOLS
2007 2006 2005 2004 2003 2002
101,247 101,247 101,247 101,247 101,247 101,24742 42 42 42 42 42
850 850 850 850 850 850448 495 611 618 589 567
324,517 324,517 324,517 324,517 324,517 324,517103 103 103 103 103 103
1,450 1,450 1,450 1,450 1,450 1,4501,337 1,435 1,424 1,423 1,278 1,159
148,352 148,352 148,352 148,352 148,352 148,35247 47 47 47 47 47
1200 1200 1200 1200 1200 12001,048 1,038 1,100 1,076 1,158 1,130
45,580 45,580 45,580 45,580 45,580 45,58022 22 22 22 22 22
440 440 440 440 440 440448 536 578 616 649 623
94,000 94,000 94,000 94,000 94,000 94,00024 24 24 24 24 24
980 980 980 980 980 9801,017 1,048 1,072 1,078 953 986
120,729 120,729 120,729 120,729 120,729 120,72940 40 40 40 40 40
720 720 720 720 720 720483 471 373 351 329 317
216,171 216,171 216,171 216,171 216,171 216,17149 49 49 49 49 49
1,400 1,400 1,400 1,400 1,400 1,400433 487 509 589 617 607
34,000 34,000 34,000 34,000 34,000 34,00014 14 14 14 14 14
320 320 320 320 320 320312 287 295 322 335 338
47,093 47,093 47,093 47,093 47,093 47,09325 25 25 25 25 25
540 540 540 540 540 540284 295 296 304 325 401
51,144 51,144 51,144 51,144 51,144 51,144Open Classroom Open Classroom Open Classroom Open Classroom Open Classroom Open Classroom
740 740 740 740 740 740465 524 587 622 641 650
93,447 93,447 93,447 93,447 93,447 93,44739 39 39 39 39 39
920 920 920 920 920 920373 392 395 355 309 374
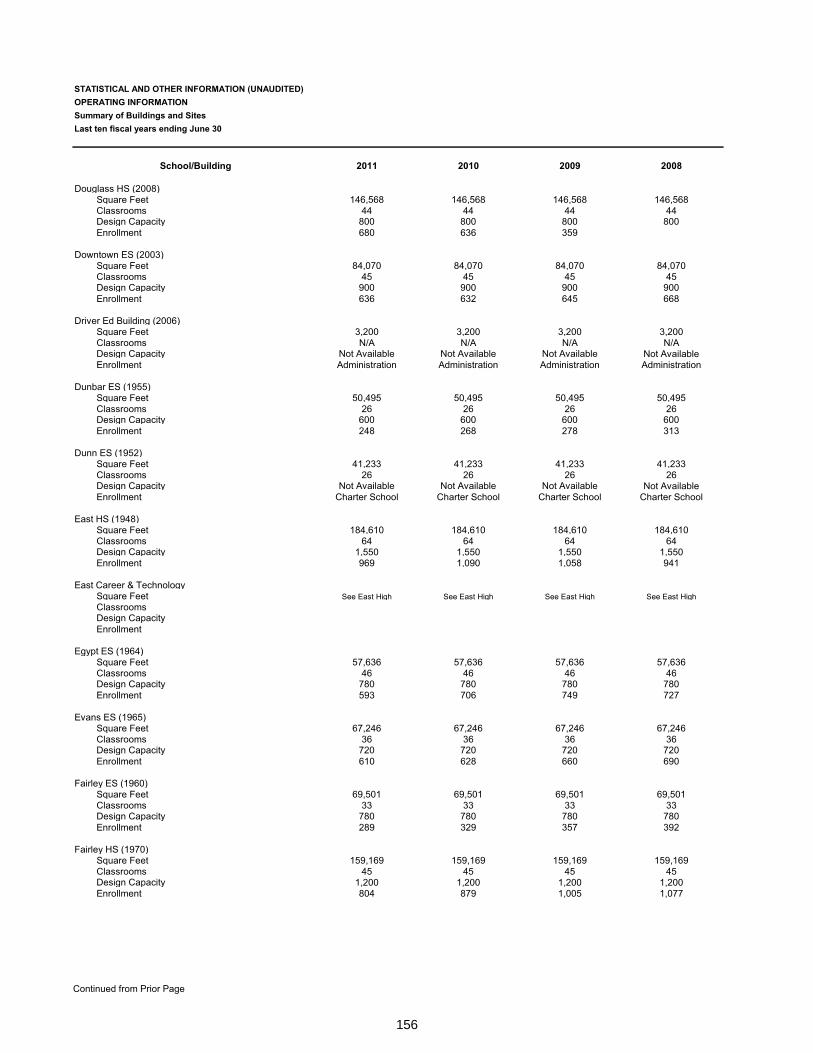
156
Continued from Prior Page
STATISTICAL AND OTHER INFORMATION (UNAUDITED)OPERATING INFORMATIONSummary of Buildings and SitesLast ten fiscal years ending June 30
School/Building 2011 2010 2009 2008
Douglass HS (2008)Square Feet 146,568 146,568 146,568 146,568Classrooms 44 44 44 44Design Capacity 800 800 800 800Enrollment 680 636 359
Downtown ES (2003)Square Feet 84,070 84,070 84,070 84,070Classrooms 45 45 45 45Design Capacity 900 900 900 900Enrollment 636 632 645 668
Driver Ed Building (2006)Square Feet 3,200 3,200 3,200 3,200Classrooms N/A N/A N/A N/ADesign Capacity Not Available Not Available Not Available Not AvailableEnrollment Administration Administration Administration Administration
Dunbar ES (1955)Square Feet 50,495 50,495 50,495 50,495Classrooms 26 26 26 26Design Capacity 600 600 600 600Enrollment 248 268 278 313
Dunn ES (1952)Square Feet 41,233 41,233 41,233 41,233Classrooms 26 26 26 26Design Capacity Not Available Not Available Not Available Not AvailableEnrollment Charter School Charter School Charter School Charter School
East HS (1948)Square Feet 184,610 184,610 184,610 184,610Classrooms 64 64 64 64Design Capacity 1,550 1,550 1,550 1,550Enrollment 969 1,090 1,058 941
East Career & TechnologySquare Feet See East High See East High See East High See East HighClassroomsDesign CapacityEnrollment
Egypt ES (1964)Square Feet 57,636 57,636 57,636 57,636Classrooms 46 46 46 46Design Capacity 780 780 780 780Enrollment 593 706 749 727
Evans ES (1965)Square Feet 67,246 67,246 67,246 67,246Classrooms 36 36 36 36Design Capacity 720 720 720 720Enrollment 610 628 660 690
Fairley ES (1960)Square Feet 69,501 69,501 69,501 69,501Classrooms 33 33 33 33Design Capacity 780 780 780 780Enrollment 289 329 357 392
Fairley HS (1970)Square Feet 159,169 159,169 159,169 159,169Classrooms 45 45 45 45Design Capacity 1,200 1,200 1,200 1,200Enrollment 804 879 1,005 1,077
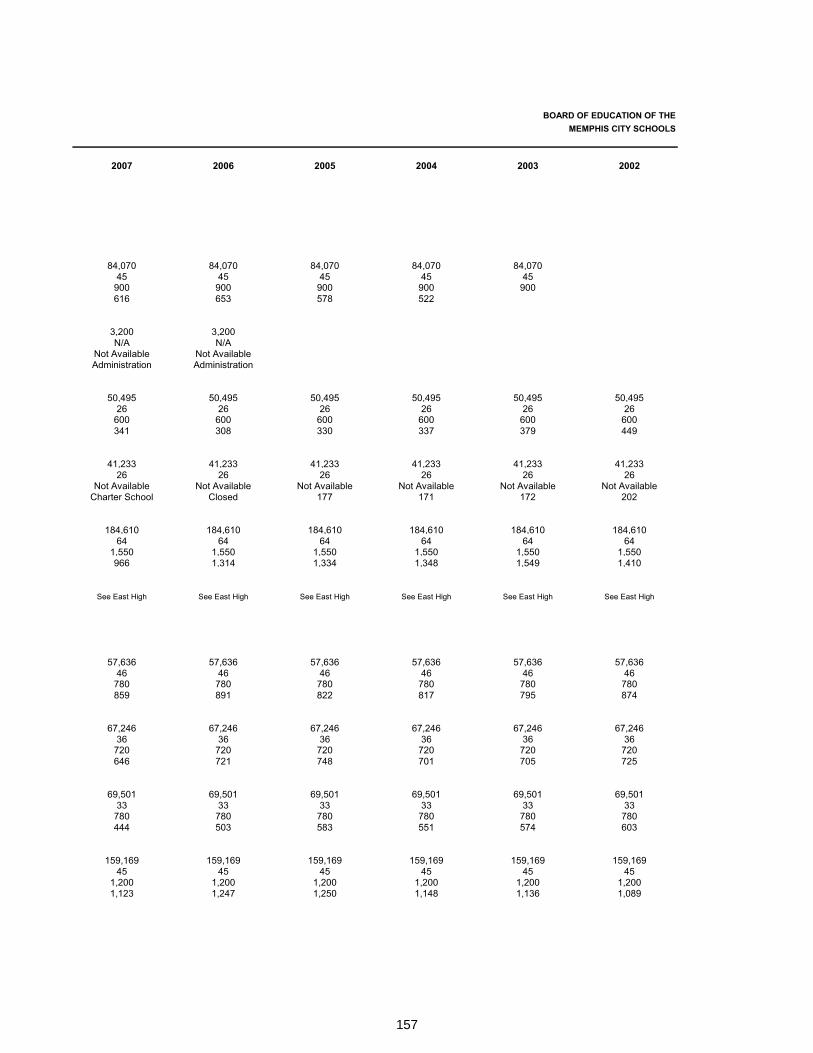
157
BOARD OF EDUCATION OF THE MEMPHIS CITY SCHOOLS
2007 2006 2005 2004 2003 2002
84,070 84,070 84,070 84,070 84,07045 45 45 45 45
900 900 900 900 900616 653 578 522
3,200 3,200N/A N/A
Not Available Not AvailableAdministration Administration
50,495 50,495 50,495 50,495 50,495 50,49526 26 26 26 26 26
600 600 600 600 600 600341 308 330 337 379 449
41,233 41,233 41,233 41,233 41,233 41,23326 26 26 26 26 26
Not Available Not Available Not Available Not Available Not Available Not AvailableCharter School Closed 177 171 172 202
184,610 184,610 184,610 184,610 184,610 184,61064 64 64 64 64 64
1,550 1,550 1,550 1,550 1,550 1,550966 1,314 1,334 1,348 1,549 1,410
See East High See East High See East High See East High See East High See East High
57,636 57,636 57,636 57,636 57,636 57,63646 46 46 46 46 46
780 780 780 780 780 780859 891 822 817 795 874
67,246 67,246 67,246 67,246 67,246 67,24636 36 36 36 36 36
720 720 720 720 720 720646 721 748 701 705 725
69,501 69,501 69,501 69,501 69,501 69,50133 33 33 33 33 33
780 780 780 780 780 780444 503 583 551 574 603
159,169 159,169 159,169 159,169 159,169 159,16945 45 45 45 45 45
1,200 1,200 1,200 1,200 1,200 1,2001,123 1,247 1,250 1,148 1,136 1,089
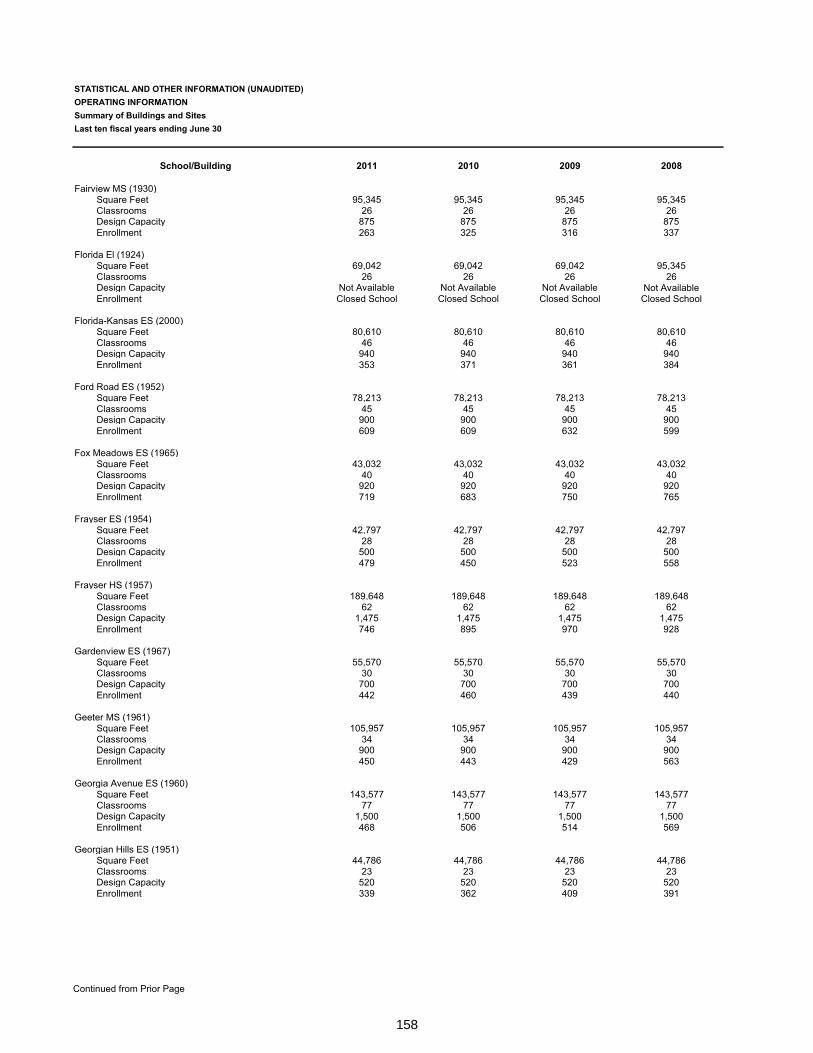
158
Continued from Prior Page
STATISTICAL AND OTHER INFORMATION (UNAUDITED)OPERATING INFORMATIONSummary of Buildings and SitesLast ten fiscal years ending June 30
School/Building 2011 2010 2009 2008
Fairview MS (1930)Square Feet 95,345 95,345 95,345 95,345Classrooms 26 26 26 26Design Capacity 875 875 875 875Enrollment 263 325 316 337
Florida El (1924)Square Feet 69,042 69,042 69,042 95,345Classrooms 26 26 26 26Design Capacity Not Available Not Available Not Available Not AvailableEnrollment Closed School Closed School Closed School Closed School
Florida-Kansas ES (2000)Square Feet 80,610 80,610 80,610 80,610Classrooms 46 46 46 46Design Capacity 940 940 940 940Enrollment 353 371 361 384
Ford Road ES (1952)Square Feet 78,213 78,213 78,213 78,213Classrooms 45 45 45 45Design Capacity 900 900 900 900Enrollment 609 609 632 599
Fox Meadows ES (1965)Square Feet 43,032 43,032 43,032 43,032Classrooms 40 40 40 40Design Capacity 920 920 920 920Enrollment 719 683 750 765
Frayser ES (1954)Square Feet 42,797 42,797 42,797 42,797Classrooms 28 28 28 28Design Capacity 500 500 500 500Enrollment 479 450 523 558
Frayser HS (1957)Square Feet 189,648 189,648 189,648 189,648Classrooms 62 62 62 62Design Capacity 1,475 1,475 1,475 1,475Enrollment 746 895 970 928
Gardenview ES (1967)Square Feet 55,570 55,570 55,570 55,570Classrooms 30 30 30 30Design Capacity 700 700 700 700Enrollment 442 460 439 440
Geeter MS (1961)Square Feet 105,957 105,957 105,957 105,957Classrooms 34 34 34 34Design Capacity 900 900 900 900Enrollment 450 443 429 563
Georgia Avenue ES (1960)Square Feet 143,577 143,577 143,577 143,577Classrooms 77 77 77 77Design Capacity 1,500 1,500 1,500 1,500Enrollment 468 506 514 569
Georgian Hills ES (1951)Square Feet 44,786 44,786 44,786 44,786Classrooms 23 23 23 23Design Capacity 520 520 520 520Enrollment 339 362 409 391
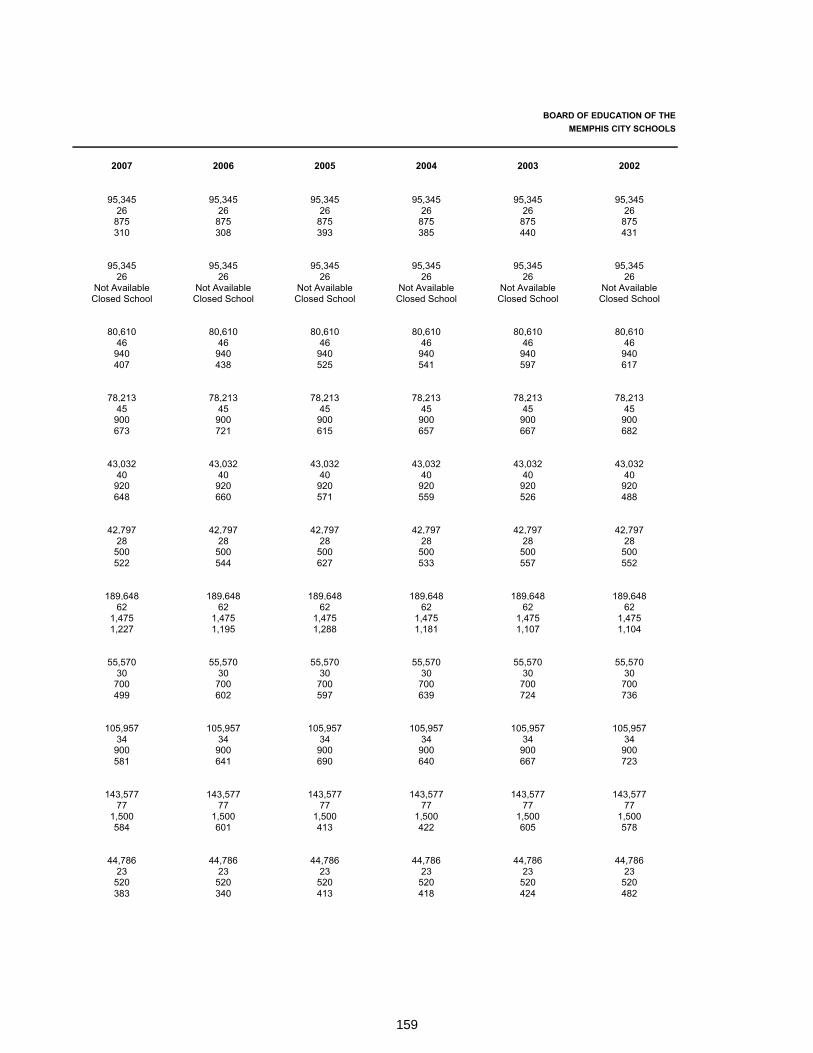
159
BOARD OF EDUCATION OF THE MEMPHIS CITY SCHOOLS
2007 2006 2005 2004 2003 2002
95,345 95,345 95,345 95,345 95,345 95,34526 26 26 26 26 26
875 875 875 875 875 875310 308 393 385 440 431
95,345 95,345 95,345 95,345 95,345 95,34526 26 26 26 26 26
Not Available Not Available Not Available Not Available Not Available Not AvailableClosed School Closed School Closed School Closed School Closed School Closed School
80,610 80,610 80,610 80,610 80,610 80,61046 46 46 46 46 46
940 940 940 940 940 940407 438 525 541 597 617
78,213 78,213 78,213 78,213 78,213 78,21345 45 45 45 45 45
900 900 900 900 900 900673 721 615 657 667 682
43,032 43,032 43,032 43,032 43,032 43,03240 40 40 40 40 40
920 920 920 920 920 920648 660 571 559 526 488
42,797 42,797 42,797 42,797 42,797 42,79728 28 28 28 28 28
500 500 500 500 500 500522 544 627 533 557 552
189,648 189,648 189,648 189,648 189,648 189,64862 62 62 62 62 62
1,475 1,475 1,475 1,475 1,475 1,4751,227 1,195 1,288 1,181 1,107 1,104
55,570 55,570 55,570 55,570 55,570 55,57030 30 30 30 30 30
700 700 700 700 700 700499 602 597 639 724 736
105,957 105,957 105,957 105,957 105,957 105,95734 34 34 34 34 34
900 900 900 900 900 900581 641 690 640 667 723
143,577 143,577 143,577 143,577 143,577 143,57777 77 77 77 77 77
1,500 1,500 1,500 1,500 1,500 1,500584 601 413 422 605 578
44,786 44,786 44,786 44,786 44,786 44,78623 23 23 23 23 23
520 520 520 520 520 520383 340 413 418 424 482
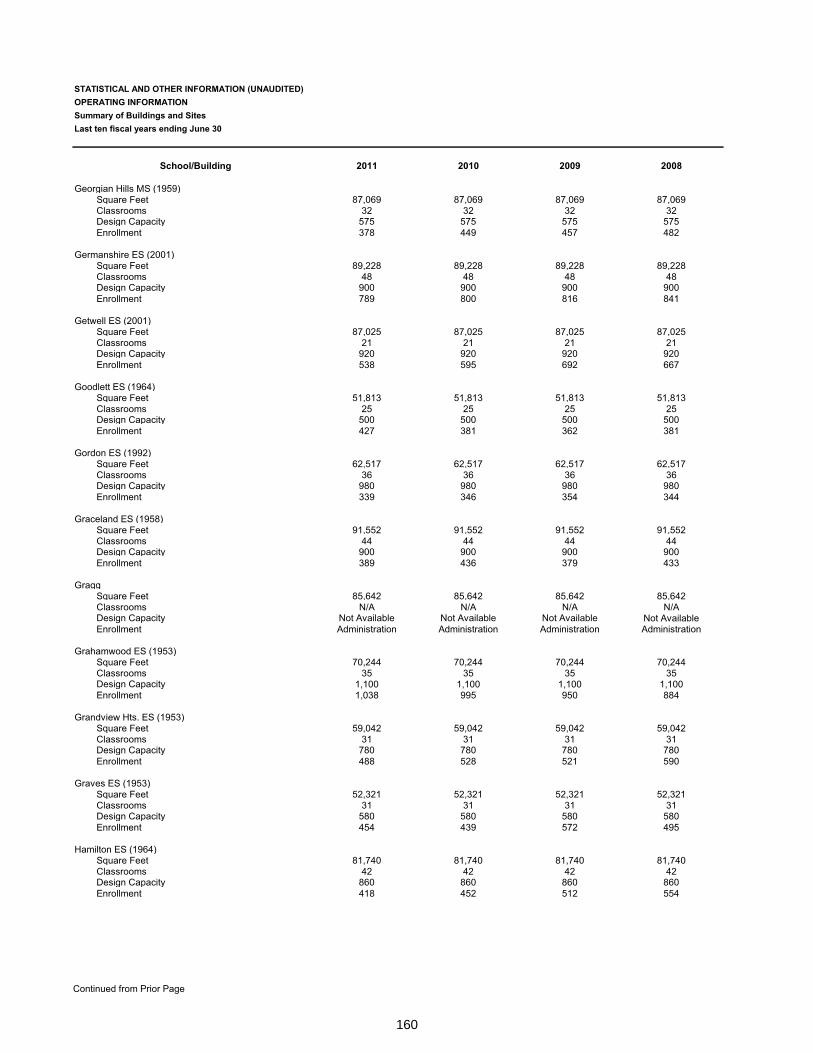
160
Continued from Prior Page
STATISTICAL AND OTHER INFORMATION (UNAUDITED)OPERATING INFORMATIONSummary of Buildings and SitesLast ten fiscal years ending June 30
School/Building 2011 2010 2009 2008
Georgian Hills MS (1959)Square Feet 87,069 87,069 87,069 87,069Classrooms 32 32 32 32Design Capacity 575 575 575 575Enrollment 378 449 457 482
Germanshire ES (2001)Square Feet 89,228 89,228 89,228 89,228Classrooms 48 48 48 48Design Capacity 900 900 900 900Enrollment 789 800 816 841
Getwell ES (2001)Square Feet 87,025 87,025 87,025 87,025Classrooms 21 21 21 21Design Capacity 920 920 920 920Enrollment 538 595 692 667
Goodlett ES (1964)Square Feet 51,813 51,813 51,813 51,813Classrooms 25 25 25 25Design Capacity 500 500 500 500Enrollment 427 381 362 381
Gordon ES (1992)Square Feet 62,517 62,517 62,517 62,517Classrooms 36 36 36 36Design Capacity 980 980 980 980Enrollment 339 346 354 344
Graceland ES (1958)Square Feet 91,552 91,552 91,552 91,552Classrooms 44 44 44 44Design Capacity 900 900 900 900Enrollment 389 436 379 433
GraggSquare Feet 85,642 85,642 85,642 85,642Classrooms N/A N/A N/A N/ADesign Capacity Not Available Not Available Not Available Not AvailableEnrollment Administration Administration Administration Administration
Grahamwood ES (1953)Square Feet 70,244 70,244 70,244 70,244Classrooms 35 35 35 35Design Capacity 1,100 1,100 1,100 1,100Enrollment 1,038 995 950 884
Grandview Hts. ES (1953)Square Feet 59,042 59,042 59,042 59,042Classrooms 31 31 31 31Design Capacity 780 780 780 780Enrollment 488 528 521 590
Graves ES (1953)Square Feet 52,321 52,321 52,321 52,321Classrooms 31 31 31 31Design Capacity 580 580 580 580Enrollment 454 439 572 495
Hamilton ES (1964)Square Feet 81,740 81,740 81,740 81,740Classrooms 42 42 42 42Design Capacity 860 860 860 860Enrollment 418 452 512 554
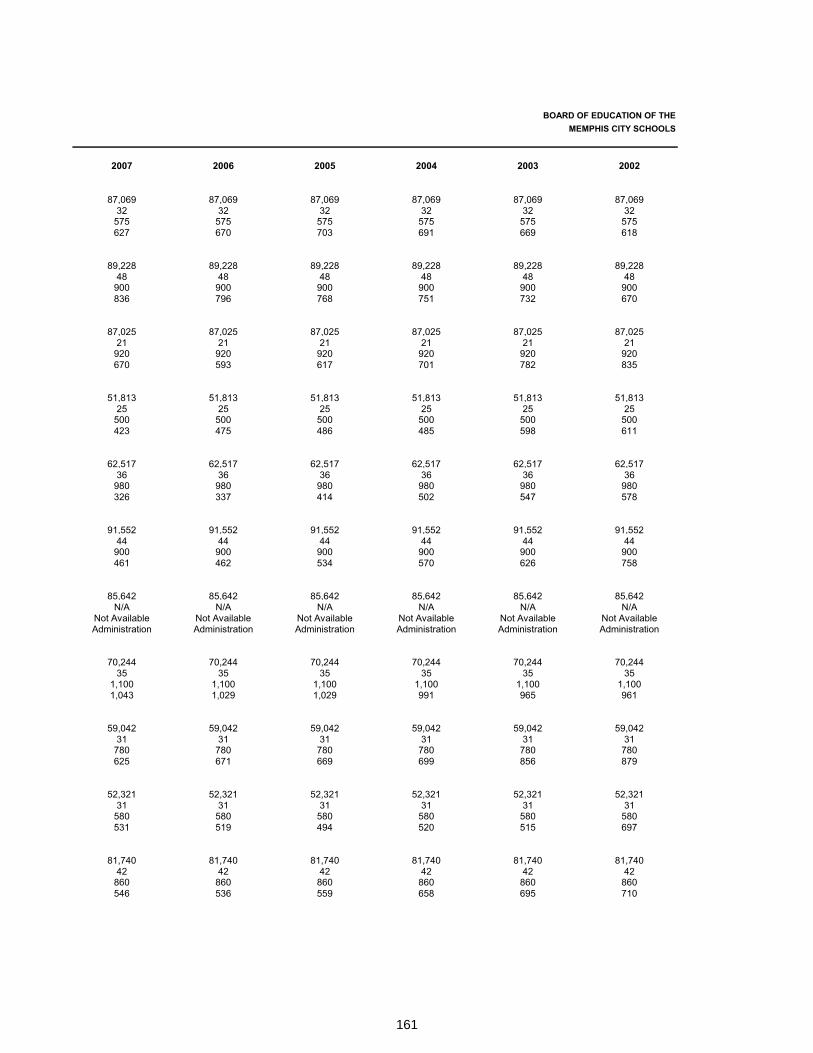
161
BOARD OF EDUCATION OF THE MEMPHIS CITY SCHOOLS
2007 2006 2005 2004 2003 2002
87,069 87,069 87,069 87,069 87,069 87,06932 32 32 32 32 32
575 575 575 575 575 575627 670 703 691 669 618
89,228 89,228 89,228 89,228 89,228 89,22848 48 48 48 48 48
900 900 900 900 900 900836 796 768 751 732 670
87,025 87,025 87,025 87,025 87,025 87,02521 21 21 21 21 21
920 920 920 920 920 920670 593 617 701 782 835
51,813 51,813 51,813 51,813 51,813 51,81325 25 25 25 25 25
500 500 500 500 500 500423 475 486 485 598 611
62,517 62,517 62,517 62,517 62,517 62,51736 36 36 36 36 36
980 980 980 980 980 980326 337 414 502 547 578
91,552 91,552 91,552 91,552 91,552 91,55244 44 44 44 44 44
900 900 900 900 900 900461 462 534 570 626 758
85,642 85,642 85,642 85,642 85,642 85,642N/A N/A N/A N/A N/A N/A
Not Available Not Available Not Available Not Available Not Available Not AvailableAdministration Administration Administration Administration Administration Administration
70,244 70,244 70,244 70,244 70,244 70,24435 35 35 35 35 35
1,100 1,100 1,100 1,100 1,100 1,1001,043 1,029 1,029 991 965 961
59,042 59,042 59,042 59,042 59,042 59,04231 31 31 31 31 31
780 780 780 780 780 780625 671 669 699 856 879
52,321 52,321 52,321 52,321 52,321 52,32131 31 31 31 31 31
580 580 580 580 580 580531 519 494 520 515 697
81,740 81,740 81,740 81,740 81,740 81,74042 42 42 42 42 42
860 860 860 860 860 860546 536 559 658 695 710
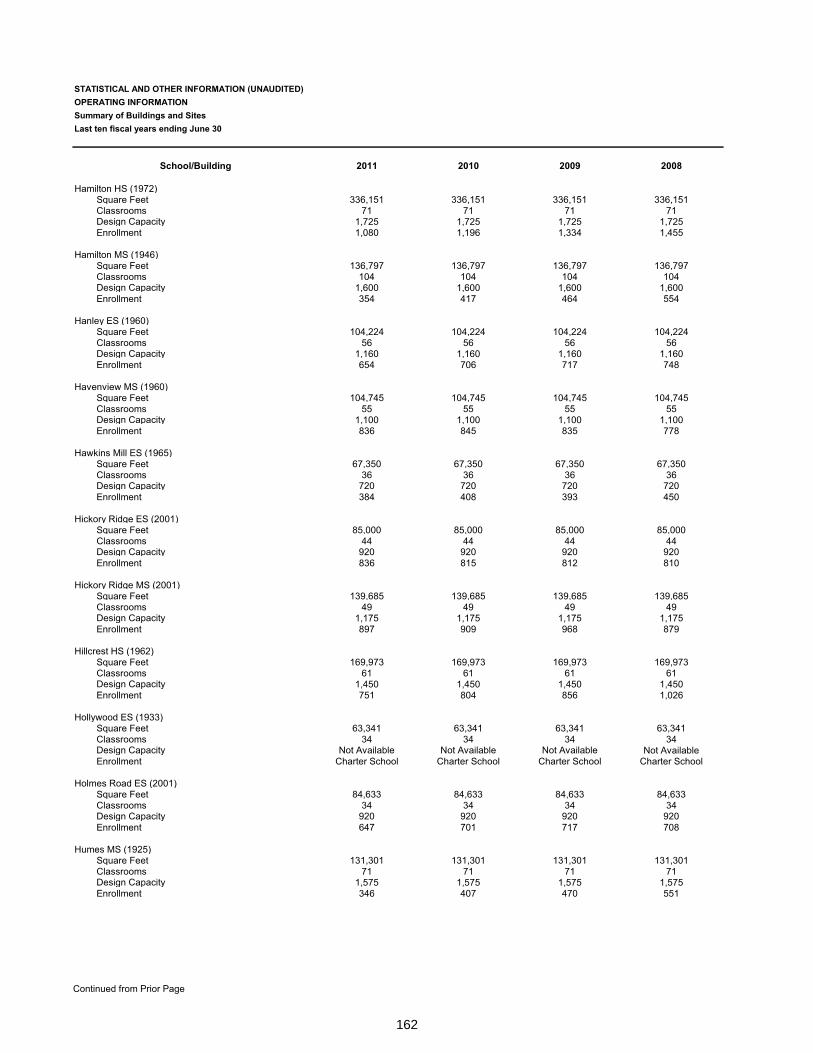
162
Continued from Prior Page
STATISTICAL AND OTHER INFORMATION (UNAUDITED)OPERATING INFORMATIONSummary of Buildings and SitesLast ten fiscal years ending June 30
School/Building 2011 2010 2009 2008
Hamilton HS (1972)Square Feet 336,151 336,151 336,151 336,151Classrooms 71 71 71 71Design Capacity 1,725 1,725 1,725 1,725Enrollment 1,080 1,196 1,334 1,455
Hamilton MS (1946)Square Feet 136,797 136,797 136,797 136,797Classrooms 104 104 104 104Design Capacity 1,600 1,600 1,600 1,600Enrollment 354 417 464 554
Hanley ES (1960)Square Feet 104,224 104,224 104,224 104,224Classrooms 56 56 56 56Design Capacity 1,160 1,160 1,160 1,160Enrollment 654 706 717 748
Havenview MS (1960)Square Feet 104,745 104,745 104,745 104,745Classrooms 55 55 55 55Design Capacity 1,100 1,100 1,100 1,100Enrollment 836 845 835 778
Hawkins Mill ES (1965)Square Feet 67,350 67,350 67,350 67,350Classrooms 36 36 36 36Design Capacity 720 720 720 720Enrollment 384 408 393 450
Hickory Ridge ES (2001)Square Feet 85,000 85,000 85,000 85,000Classrooms 44 44 44 44Design Capacity 920 920 920 920Enrollment 836 815 812 810
Hickory Ridge MS (2001)Square Feet 139,685 139,685 139,685 139,685Classrooms 49 49 49 49Design Capacity 1,175 1,175 1,175 1,175Enrollment 897 909 968 879
Hillcrest HS (1962)Square Feet 169,973 169,973 169,973 169,973Classrooms 61 61 61 61Design Capacity 1,450 1,450 1,450 1,450Enrollment 751 804 856 1,026
Hollywood ES (1933)Square Feet 63,341 63,341 63,341 63,341Classrooms 34 34 34 34Design Capacity Not Available Not Available Not Available Not AvailableEnrollment Charter School Charter School Charter School Charter School
Holmes Road ES (2001)Square Feet 84,633 84,633 84,633 84,633Classrooms 34 34 34 34Design Capacity 920 920 920 920Enrollment 647 701 717 708
Humes MS (1925)Square Feet 131,301 131,301 131,301 131,301Classrooms 71 71 71 71Design Capacity 1,575 1,575 1,575 1,575Enrollment 346 407 470 551

163
BOARD OF EDUCATION OF THE MEMPHIS CITY SCHOOLS
2007 2006 2005 2004 2003 2002
336,151 336,151 336,151 336,151 336,151 336,15171 71 71 71 71 71
1,725 1,725 1,725 1,725 1,725 1,7251,153 1,415 1,395 1,549 1,613 1,673
136,797 136,797 136,797 136,797 136,797 136,797104 104 104 104 104 104
1,600 1,600 1,600 1,600 1,600 1,600684 754 820 842 909 894
104,224 104,224 104,224 104,224 104,224 104,22456 56 56 56 56 56
1,160 1,160 1,160 1,160 1,160 1,160667 674 708 679 756 775
104,745 104,745 104,745 104,745 104,745 104,74555 55 55 55 55 55
1,100 1,100 1,100 1,100 1,100 1,100762 813 941 914 964 1,027
67,350 67,350 67,350 67,350 67,350 67,35036 36 36 36 36 36
720 720 720 720 720 720436 442 514 467 553 663
85,000 85,000 85,000 85,000 85,000 85,00044 44 44 44 44 44
920 920 920 920 920 920817 768 796 845 840 928
139,685 139,685 139,685 139,685 139,685 139,68549 49 49 49 49 49
1,175 1,175 1,175 1,175 1,175 1,175891 865 888 876 938 981
169,973 169,973 169,973 169,973 169,973 169,97361 61 61 61 61 61
1,450 1,450 1,450 1,450 1,450 1,4501,028 1,094 929 935 814 1,119
63,341 63,341 63,341 63,341 63,341 63,34134 34 34 34 34 34
Not Available Not Available Not Available Not Available Not Available Not Available324 352 363 438 485 528
84,633 84,633 84,633 84,633 84,633 84,63334 34 34 34 34 34
920 920 920 920 920 920700 717 647 623 707 620
131,301 131,301 131,301 131,301 131,301 131,30171 71 71 71 71 71
1,575 1,575 1,575 1,575 1,575 1,575582 684 753 880 921 927
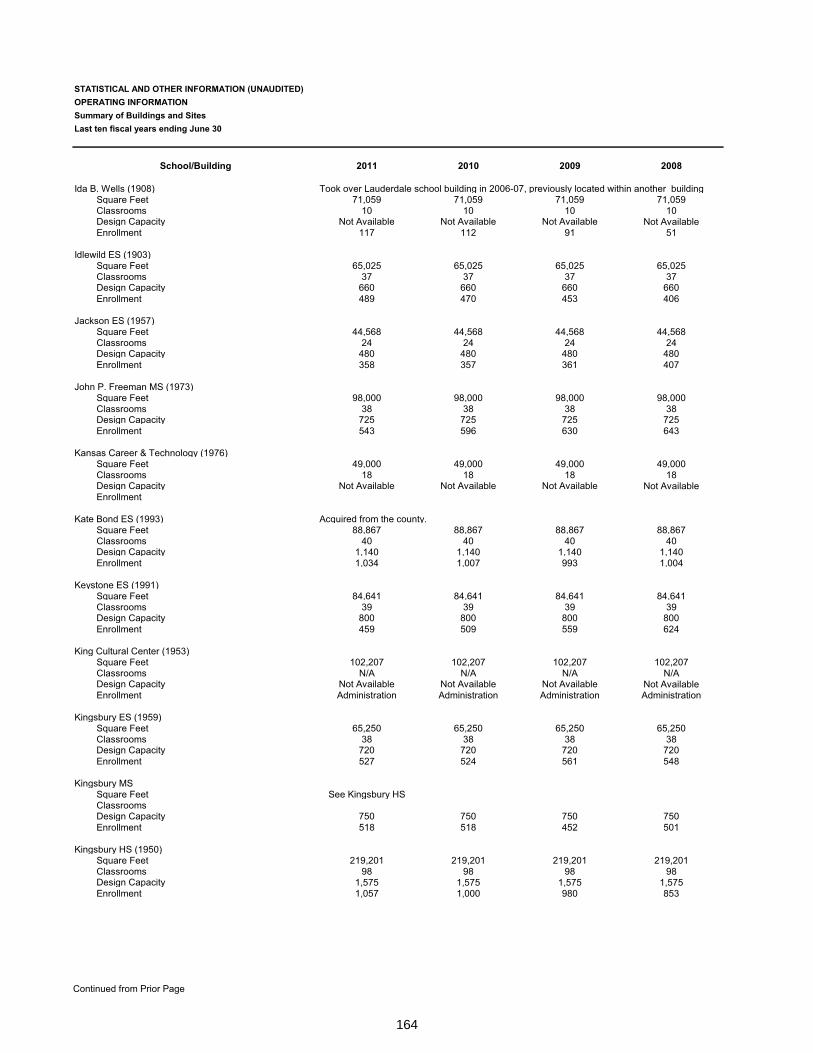
164
Continued from Prior Page
STATISTICAL AND OTHER INFORMATION (UNAUDITED)OPERATING INFORMATIONSummary of Buildings and SitesLast ten fiscal years ending June 30
School/Building 2011 2010 2009 2008
Ida B. Wells (1908) Took over Lauderdale school building in 2006-07, previously located within another buildingSquare Feet 71,059 71,059 71,059 71,059Classrooms 10 10 10 10Design Capacity Not Available Not Available Not Available Not AvailableEnrollment 117 112 91 51
Idlewild ES (1903)Square Feet 65,025 65,025 65,025 65,025Classrooms 37 37 37 37Design Capacity 660 660 660 660Enrollment 489 470 453 406
Jackson ES (1957)Square Feet 44,568 44,568 44,568 44,568Classrooms 24 24 24 24Design Capacity 480 480 480 480Enrollment 358 357 361 407
John P. Freeman MS (1973)Square Feet 98,000 98,000 98,000 98,000Classrooms 38 38 38 38Design Capacity 725 725 725 725Enrollment 543 596 630 643
Kansas Career & Technology (1976)Square Feet 49,000 49,000 49,000 49,000Classrooms 18 18 18 18Design Capacity Not Available Not Available Not Available Not AvailableEnrollment
Kate Bond ES (1993) Acquired from the county.Square Feet 88,867 88,867 88,867 88,867Classrooms 40 40 40 40Design Capacity 1,140 1,140 1,140 1,140Enrollment 1,034 1,007 993 1,004
Keystone ES (1991)Square Feet 84,641 84,641 84,641 84,641Classrooms 39 39 39 39Design Capacity 800 800 800 800Enrollment 459 509 559 624
King Cultural Center (1953)Square Feet 102,207 102,207 102,207 102,207Classrooms N/A N/A N/A N/ADesign Capacity Not Available Not Available Not Available Not AvailableEnrollment Administration Administration Administration Administration
Kingsbury ES (1959)Square Feet 65,250 65,250 65,250 65,250Classrooms 38 38 38 38Design Capacity 720 720 720 720Enrollment 527 524 561 548
Kingsbury MSSquare Feet See Kingsbury HSClassroomsDesign Capacity 750 750 750 750Enrollment 518 518 452 501
Kingsbury HS (1950)Square Feet 219,201 219,201 219,201 219,201Classrooms 98 98 98 98Design Capacity 1,575 1,575 1,575 1,575Enrollment 1,057 1,000 980 853
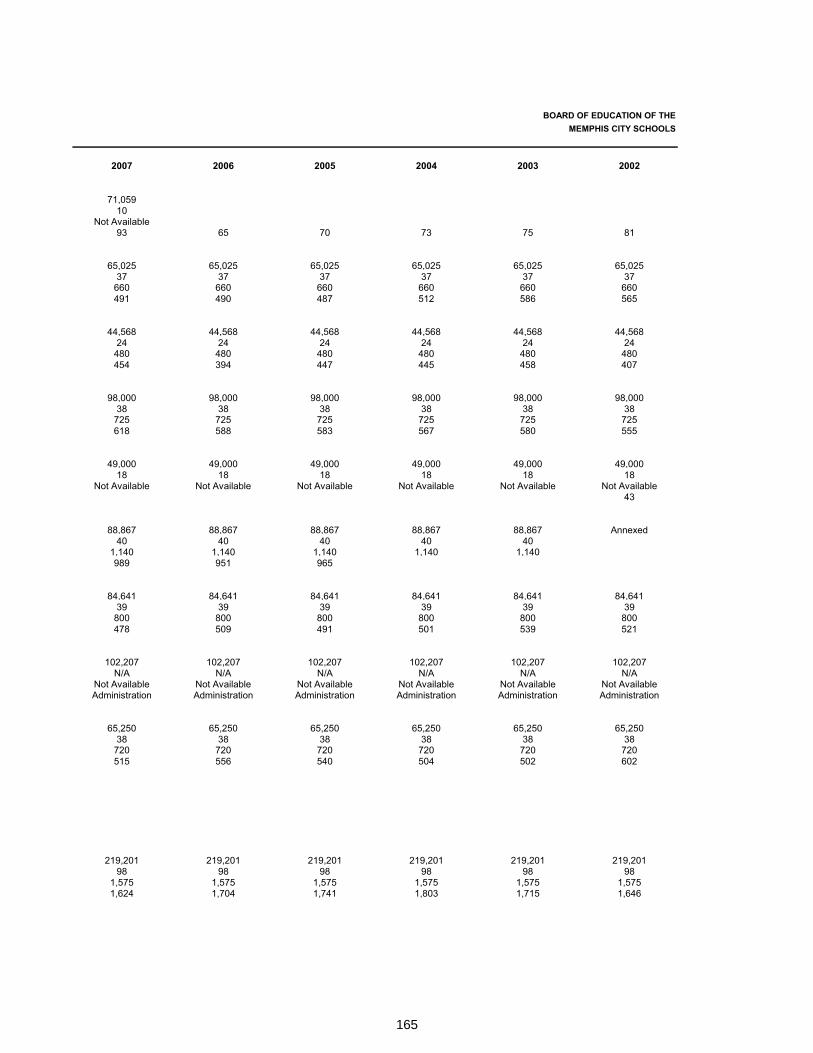
165
BOARD OF EDUCATION OF THE MEMPHIS CITY SCHOOLS
2007 2006 2005 2004 2003 2002
71,05910
Not Available93 65 70 73 75 81
65,025 65,025 65,025 65,025 65,025 65,02537 37 37 37 37 37
660 660 660 660 660 660491 490 487 512 586 565
44,568 44,568 44,568 44,568 44,568 44,56824 24 24 24 24 24
480 480 480 480 480 480454 394 447 445 458 407
98,000 98,000 98,000 98,000 98,000 98,00038 38 38 38 38 38
725 725 725 725 725 725618 588 583 567 580 555
49,000 49,000 49,000 49,000 49,000 49,00018 18 18 18 18 18
Not Available Not Available Not Available Not Available Not Available Not Available43
88,867 88,867 88,867 88,867 88,867 Annexed40 40 40 40 40
1,140 1,140 1,140 1,140 1,140989 951 965
84,641 84,641 84,641 84,641 84,641 84,64139 39 39 39 39 39
800 800 800 800 800 800478 509 491 501 539 521
102,207 102,207 102,207 102,207 102,207 102,207N/A N/A N/A N/A N/A N/A
Not Available Not Available Not Available Not Available Not Available Not AvailableAdministration Administration Administration Administration Administration Administration
65,250 65,250 65,250 65,250 65,250 65,25038 38 38 38 38 38
720 720 720 720 720 720515 556 540 504 502 602
219,201 219,201 219,201 219,201 219,201 219,20198 98 98 98 98 98
1,575 1,575 1,575 1,575 1,575 1,5751,624 1,704 1,741 1,803 1,715 1,646
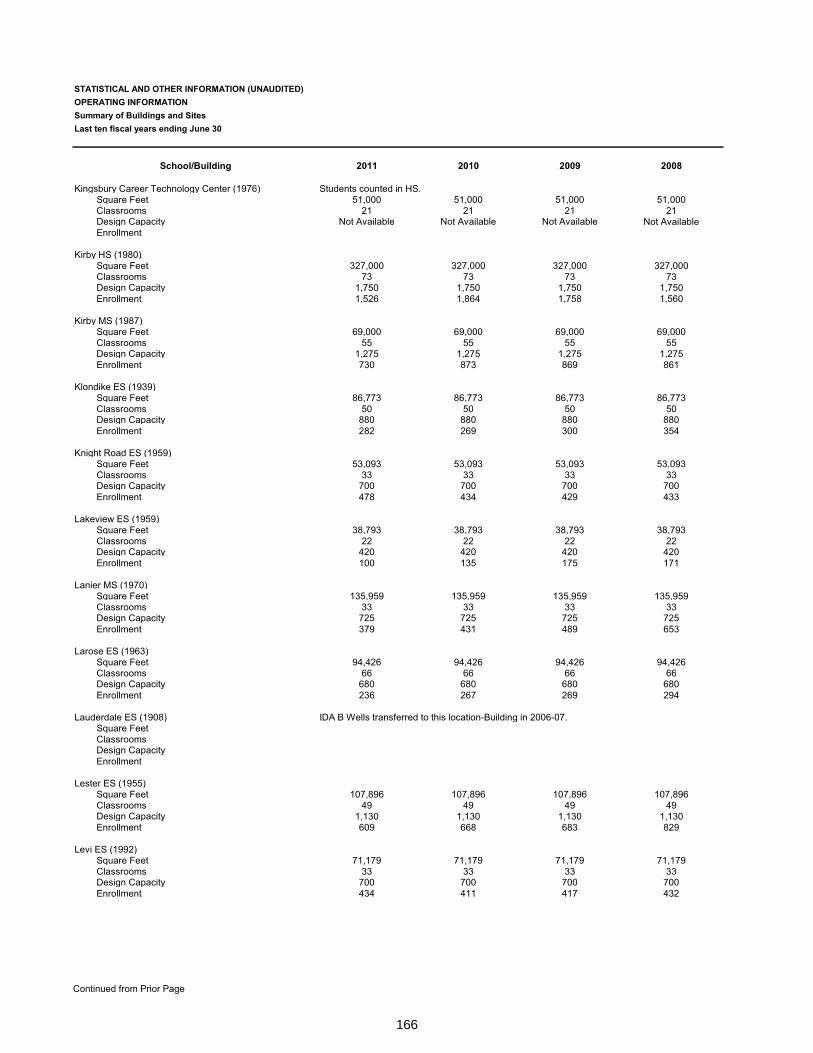
166
Continued from Prior Page
STATISTICAL AND OTHER INFORMATION (UNAUDITED)OPERATING INFORMATIONSummary of Buildings and SitesLast ten fiscal years ending June 30
School/Building 2011 2010 2009 2008
Kingsbury Career Technology Center (1976) Students counted in HS.Square Feet 51,000 51,000 51,000 51,000Classrooms 21 21 21 21Design Capacity Not Available Not Available Not Available Not AvailableEnrollment
Kirby HS (1980)Square Feet 327,000 327,000 327,000 327,000Classrooms 73 73 73 73Design Capacity 1,750 1,750 1,750 1,750Enrollment 1,526 1,864 1,758 1,560
Kirby MS (1987)Square Feet 69,000 69,000 69,000 69,000Classrooms 55 55 55 55Design Capacity 1,275 1,275 1,275 1,275Enrollment 730 873 869 861
Klondike ES (1939)Square Feet 86,773 86,773 86,773 86,773Classrooms 50 50 50 50Design Capacity 880 880 880 880Enrollment 282 269 300 354
Knight Road ES (1959)Square Feet 53,093 53,093 53,093 53,093Classrooms 33 33 33 33Design Capacity 700 700 700 700Enrollment 478 434 429 433
Lakeview ES (1959)Square Feet 38,793 38,793 38,793 38,793Classrooms 22 22 22 22Design Capacity 420 420 420 420Enrollment 100 135 175 171
Lanier MS (1970)Square Feet 135,959 135,959 135,959 135,959Classrooms 33 33 33 33Design Capacity 725 725 725 725Enrollment 379 431 489 653
Larose ES (1963)Square Feet 94,426 94,426 94,426 94,426Classrooms 66 66 66 66Design Capacity 680 680 680 680Enrollment 236 267 269 294
Lauderdale ES (1908) IDA B Wells transferred to this location-Building in 2006-07.Square FeetClassroomsDesign CapacityEnrollment
Lester ES (1955)Square Feet 107,896 107,896 107,896 107,896Classrooms 49 49 49 49Design Capacity 1,130 1,130 1,130 1,130Enrollment 609 668 683 829
Levi ES (1992)Square Feet 71,179 71,179 71,179 71,179Classrooms 33 33 33 33Design Capacity 700 700 700 700Enrollment 434 411 417 432

167
BOARD OF EDUCATION OF THE MEMPHIS CITY SCHOOLS
2007 2006 2005 2004 2003 2002
51,000 51,000 51,000 51,000 51,000 51,00021 21 21 21 21 21
Not Available Not Available Not Available Not Available Not Available Not Available
327,000 327,000 327,000 327,000 327,000 327,00073 73 73 73 73 73
1,750 1,750 1,750 1,750 1,750 1,7501,378 1,370 1,410 1,434 1,400 1,448
69,000 69,000 69,000 69,000 69,000 69,00055 55 55 55 55 55
1,275 1,275 1,275 1,275 1,275 1,275968 1,147 1,128 1,161 1,172 1,155
86,773 86,773 86,773 86,773 86,773 86,77350 50 50 50 50 50
880 880 880 880 880 880395 406 436 457 530 539
53,093 53,093 53,093 53,093 53,093 53,09333 33 33 33 33 33
700 700 700 700 700 700521 572 559 552 530 545
38,793 38,793 38,793 38,793 38,793 38,79322 22 22 22 22 22
420 420 420 420 420 420195 216 205 223 187 179
135,959 135,959 135,959 135,959 135,959 135,95933 33 33 33 33 33
725 725 725 725 725 725664 698 638 666 694 804
94,426 94,426 94,426 94,426 94,426 94,42666 66 66 66 66 66
680 680 680 680 680 680227 270 273 292 293 364
71,059 71,059 71,059 71,059 71,059 71,05933 33 33 33 33 33
Not Available Not Available Not Available Not Available Not Available Not Available206 176 218 229 273 257
107,896 107,896 107,896 107,896 107,896 107,89649 49 49 49 49 49
1,130 1,130 1,130 1,130 1,130 1,130571 481 540 564 588 644
71,179 71,179 71,179 71,179 71,179 71,17933 33 33 33 33 33
700 700 700 700 700 700448 493 368 340 389 440
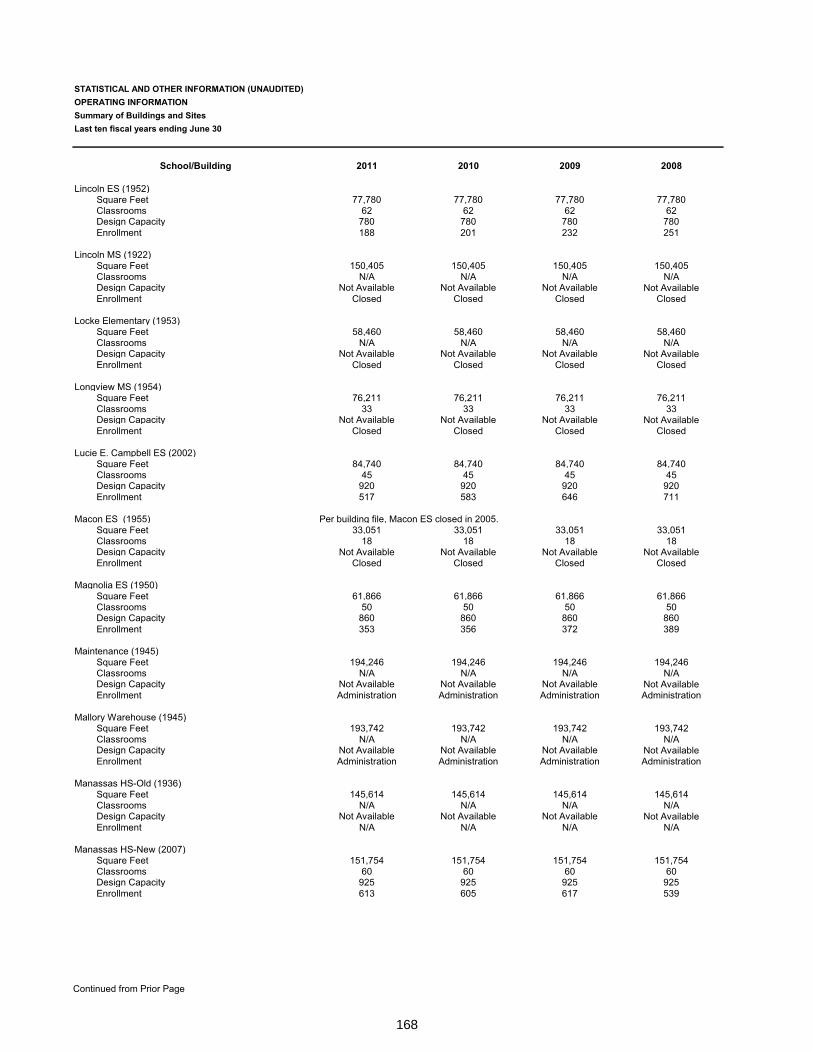
168
Continued from Prior Page
STATISTICAL AND OTHER INFORMATION (UNAUDITED)OPERATING INFORMATIONSummary of Buildings and SitesLast ten fiscal years ending June 30
School/Building 2011 2010 2009 2008
Lincoln ES (1952)Square Feet 77,780 77,780 77,780 77,780Classrooms 62 62 62 62Design Capacity 780 780 780 780Enrollment 188 201 232 251
Lincoln MS (1922)Square Feet 150,405 150,405 150,405 150,405Classrooms N/A N/A N/A N/ADesign Capacity Not Available Not Available Not Available Not AvailableEnrollment Closed Closed Closed Closed
Locke Elementary (1953)Square Feet 58,460 58,460 58,460 58,460Classrooms N/A N/A N/A N/ADesign Capacity Not Available Not Available Not Available Not AvailableEnrollment Closed Closed Closed Closed
Longview MS (1954)Square Feet 76,211 76,211 76,211 76,211Classrooms 33 33 33 33Design Capacity Not Available Not Available Not Available Not AvailableEnrollment Closed Closed Closed Closed
Lucie E. Campbell ES (2002)Square Feet 84,740 84,740 84,740 84,740Classrooms 45 45 45 45Design Capacity 920 920 920 920Enrollment 517 583 646 711
Macon ES (1955) Per building file, Macon ES closed in 2005.Square Feet 33,051 33,051 33,051 33,051Classrooms 18 18 18 18Design Capacity Not Available Not Available Not Available Not AvailableEnrollment Closed Closed Closed Closed
Magnolia ES (1950)Square Feet 61,866 61,866 61,866 61,866Classrooms 50 50 50 50Design Capacity 860 860 860 860Enrollment 353 356 372 389
Maintenance (1945)Square Feet 194,246 194,246 194,246 194,246Classrooms N/A N/A N/A N/ADesign Capacity Not Available Not Available Not Available Not AvailableEnrollment Administration Administration Administration Administration
Mallory Warehouse (1945)Square Feet 193,742 193,742 193,742 193,742Classrooms N/A N/A N/A N/ADesign Capacity Not Available Not Available Not Available Not AvailableEnrollment Administration Administration Administration Administration
Manassas HS-Old (1936)Square Feet 145,614 145,614 145,614 145,614Classrooms N/A N/A N/A N/ADesign Capacity Not Available Not Available Not Available Not AvailableEnrollment N/A N/A N/A N/A
Manassas HS-New (2007)Square Feet 151,754 151,754 151,754 151,754Classrooms 60 60 60 60Design Capacity 925 925 925 925Enrollment 613 605 617 539
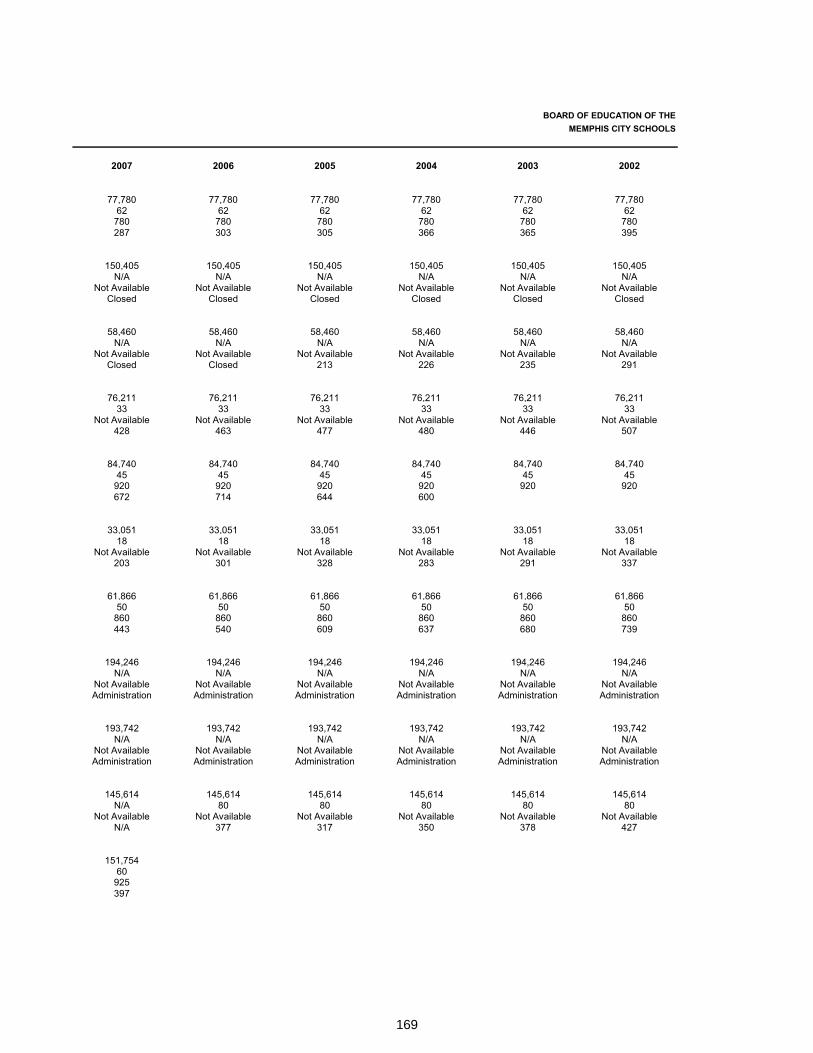
169
BOARD OF EDUCATION OF THE MEMPHIS CITY SCHOOLS
2007 2006 2005 2004 2003 2002
77,780 77,780 77,780 77,780 77,780 77,78062 62 62 62 62 62
780 780 780 780 780 780287 303 305 366 365 395
150,405 150,405 150,405 150,405 150,405 150,405N/A N/A N/A N/A N/A N/A
Not Available Not Available Not Available Not Available Not Available Not AvailableClosed Closed Closed Closed Closed Closed
58,460 58,460 58,460 58,460 58,460 58,460N/A N/A N/A N/A N/A N/A
Not Available Not Available Not Available Not Available Not Available Not AvailableClosed Closed 213 226 235 291
76,211 76,211 76,211 76,211 76,211 76,21133 33 33 33 33 33
Not Available Not Available Not Available Not Available Not Available Not Available428 463 477 480 446 507
84,740 84,740 84,740 84,740 84,740 84,74045 45 45 45 45 45
920 920 920 920 920 920672 714 644 600
33,051 33,051 33,051 33,051 33,051 33,05118 18 18 18 18 18
Not Available Not Available Not Available Not Available Not Available Not Available203 301 328 283 291 337
61,866 61,866 61,866 61,866 61,866 61,86650 50 50 50 50 50
860 860 860 860 860 860443 540 609 637 680 739
194,246 194,246 194,246 194,246 194,246 194,246N/A N/A N/A N/A N/A N/A
Not Available Not Available Not Available Not Available Not Available Not AvailableAdministration Administration Administration Administration Administration Administration
193,742 193,742 193,742 193,742 193,742 193,742N/A N/A N/A N/A N/A N/A
Not Available Not Available Not Available Not Available Not Available Not AvailableAdministration Administration Administration Administration Administration Administration
145,614 145,614 145,614 145,614 145,614 145,614N/A 80 80 80 80 80
Not Available Not Available Not Available Not Available Not Available Not AvailableN/A 377 317 350 378 427
151,75460
925397
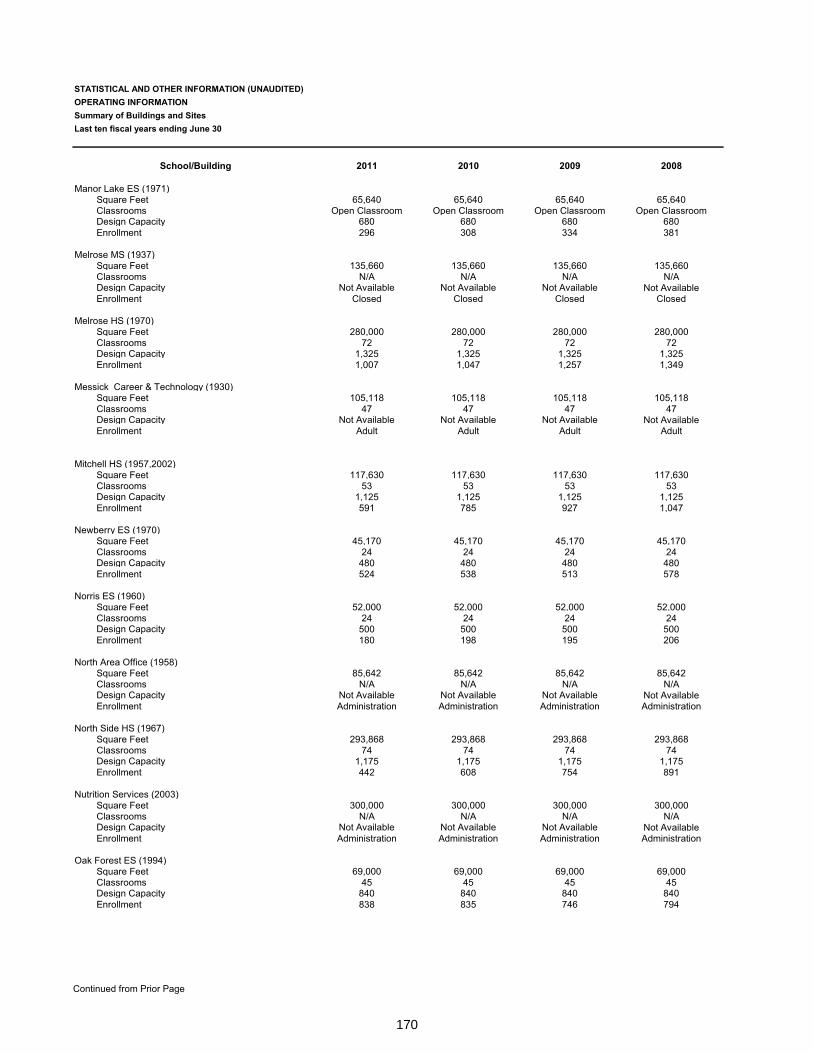
170
Continued from Prior Page
STATISTICAL AND OTHER INFORMATION (UNAUDITED)OPERATING INFORMATIONSummary of Buildings and SitesLast ten fiscal years ending June 30
School/Building 2011 2010 2009 2008
Manor Lake ES (1971)Square Feet 65,640 65,640 65,640 65,640Classrooms Open Classroom Open Classroom Open Classroom Open ClassroomDesign Capacity 680 680 680 680Enrollment 296 308 334 381
Melrose MS (1937)Square Feet 135,660 135,660 135,660 135,660Classrooms N/A N/A N/A N/ADesign Capacity Not Available Not Available Not Available Not AvailableEnrollment Closed Closed Closed Closed
Melrose HS (1970)Square Feet 280,000 280,000 280,000 280,000Classrooms 72 72 72 72Design Capacity 1,325 1,325 1,325 1,325Enrollment 1,007 1,047 1,257 1,349
Messick Career & Technology (1930)Square Feet 105,118 105,118 105,118 105,118Classrooms 47 47 47 47Design Capacity Not Available Not Available Not Available Not AvailableEnrollment Adult Adult Adult Adult
Mitchell HS (1957,2002)Square Feet 117,630 117,630 117,630 117,630Classrooms 53 53 53 53Design Capacity 1,125 1,125 1,125 1,125Enrollment 591 785 927 1,047
Newberry ES (1970)Square Feet 45,170 45,170 45,170 45,170Classrooms 24 24 24 24Design Capacity 480 480 480 480Enrollment 524 538 513 578
Norris ES (1960)Square Feet 52,000 52,000 52,000 52,000Classrooms 24 24 24 24Design Capacity 500 500 500 500Enrollment 180 198 195 206
North Area Office (1958)Square Feet 85,642 85,642 85,642 85,642Classrooms N/A N/A N/A N/ADesign Capacity Not Available Not Available Not Available Not AvailableEnrollment Administration Administration Administration Administration
North Side HS (1967)Square Feet 293,868 293,868 293,868 293,868Classrooms 74 74 74 74Design Capacity 1,175 1,175 1,175 1,175Enrollment 442 608 754 891
Nutrition Services (2003)Square Feet 300,000 300,000 300,000 300,000Classrooms N/A N/A N/A N/ADesign Capacity Not Available Not Available Not Available Not AvailableEnrollment Administration Administration Administration Administration
Oak Forest ES (1994)Square Feet 69,000 69,000 69,000 69,000Classrooms 45 45 45 45Design Capacity 840 840 840 840Enrollment 838 835 746 794
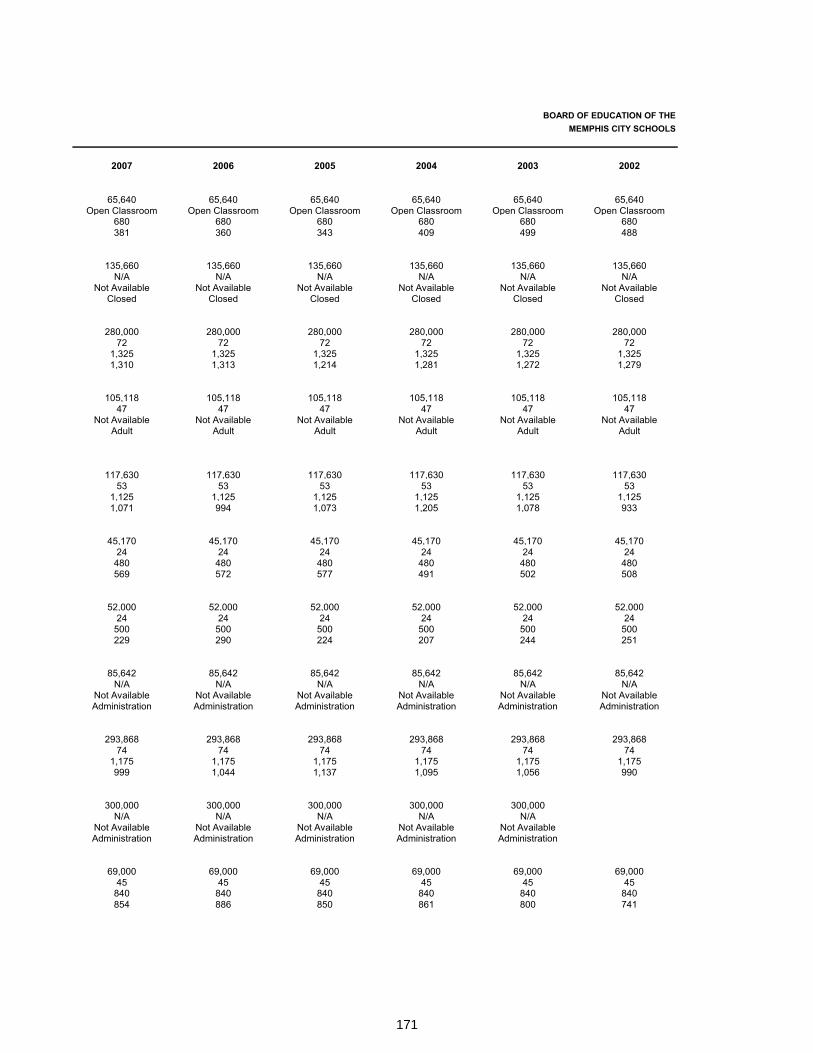
171
BOARD OF EDUCATION OF THE MEMPHIS CITY SCHOOLS
2007 2006 2005 2004 2003 2002
65,640 65,640 65,640 65,640 65,640 65,640Open Classroom Open Classroom Open Classroom Open Classroom Open Classroom Open Classroom
680 680 680 680 680 680381 360 343 409 499 488
135,660 135,660 135,660 135,660 135,660 135,660N/A N/A N/A N/A N/A N/A
Not Available Not Available Not Available Not Available Not Available Not AvailableClosed Closed Closed Closed Closed Closed
280,000 280,000 280,000 280,000 280,000 280,00072 72 72 72 72 72
1,325 1,325 1,325 1,325 1,325 1,3251,310 1,313 1,214 1,281 1,272 1,279
105,118 105,118 105,118 105,118 105,118 105,11847 47 47 47 47 47
Not Available Not Available Not Available Not Available Not Available Not AvailableAdult Adult Adult Adult Adult Adult
117,630 117,630 117,630 117,630 117,630 117,63053 53 53 53 53 53
1,125 1,125 1,125 1,125 1,125 1,1251,071 994 1,073 1,205 1,078 933
45,170 45,170 45,170 45,170 45,170 45,17024 24 24 24 24 24
480 480 480 480 480 480569 572 577 491 502 508
52,000 52,000 52,000 52,000 52,000 52,00024 24 24 24 24 24
500 500 500 500 500 500229 290 224 207 244 251
85,642 85,642 85,642 85,642 85,642 85,642N/A N/A N/A N/A N/A N/A
Not Available Not Available Not Available Not Available Not Available Not AvailableAdministration Administration Administration Administration Administration Administration
293,868 293,868 293,868 293,868 293,868 293,86874 74 74 74 74 74
1,175 1,175 1,175 1,175 1,175 1,175999 1,044 1,137 1,095 1,056 990
300,000 300,000 300,000 300,000 300,000N/A N/A N/A N/A N/A
Not Available Not Available Not Available Not Available Not AvailableAdministration Administration Administration Administration Administration
69,000 69,000 69,000 69,000 69,000 69,00045 45 45 45 45 45
840 840 840 840 840 840854 886 850 861 800 741
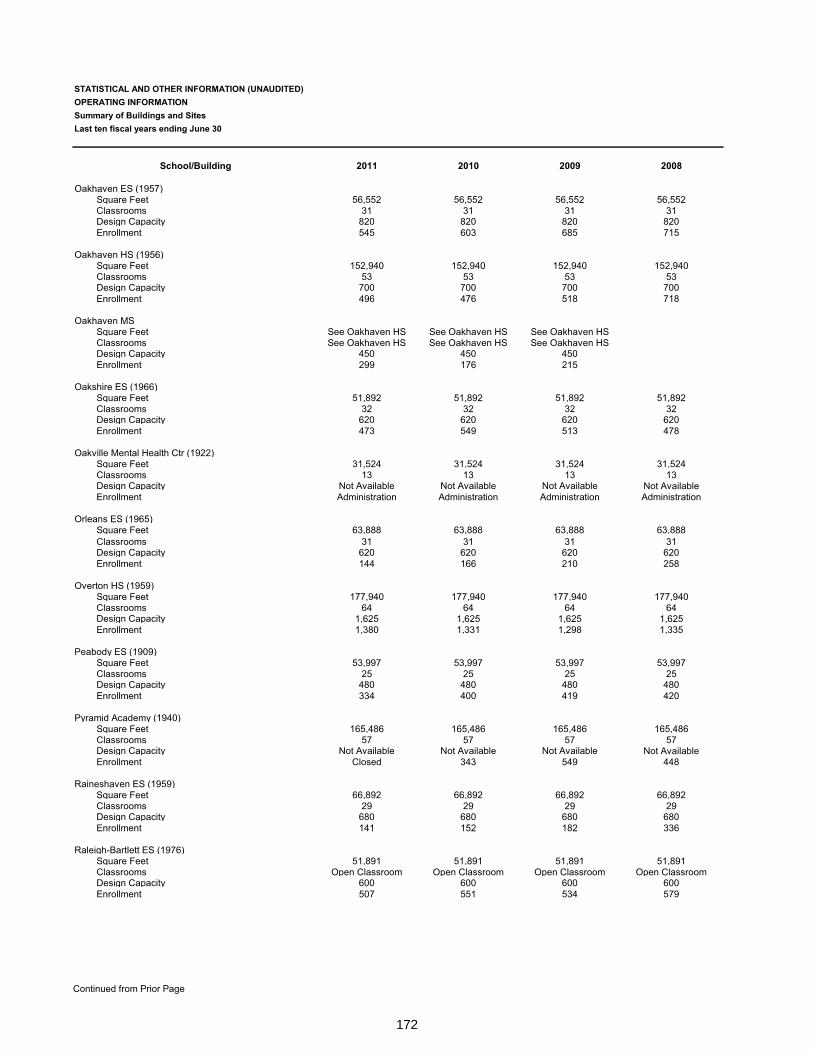
172
Continued from Prior Page
STATISTICAL AND OTHER INFORMATION (UNAUDITED)OPERATING INFORMATIONSummary of Buildings and SitesLast ten fiscal years ending June 30
School/Building 2011 2010 2009 2008
Oakhaven ES (1957)Square Feet 56,552 56,552 56,552 56,552Classrooms 31 31 31 31Design Capacity 820 820 820 820Enrollment 545 603 685 715
Oakhaven HS (1956)Square Feet 152,940 152,940 152,940 152,940Classrooms 53 53 53 53Design Capacity 700 700 700 700Enrollment 496 476 518 718
Oakhaven MSSquare Feet See Oakhaven HS See Oakhaven HS See Oakhaven HSClassrooms See Oakhaven HS See Oakhaven HS See Oakhaven HSDesign Capacity 450 450 450Enrollment 299 176 215
Oakshire ES (1966)Square Feet 51,892 51,892 51,892 51,892Classrooms 32 32 32 32Design Capacity 620 620 620 620Enrollment 473 549 513 478
Oakville Mental Health Ctr (1922)Square Feet 31,524 31,524 31,524 31,524Classrooms 13 13 13 13Design Capacity Not Available Not Available Not Available Not AvailableEnrollment Administration Administration Administration Administration
Orleans ES (1965)Square Feet 63,888 63,888 63,888 63,888Classrooms 31 31 31 31Design Capacity 620 620 620 620Enrollment 144 166 210 258
Overton HS (1959)Square Feet 177,940 177,940 177,940 177,940Classrooms 64 64 64 64Design Capacity 1,625 1,625 1,625 1,625Enrollment 1,380 1,331 1,298 1,335
Peabody ES (1909)Square Feet 53,997 53,997 53,997 53,997Classrooms 25 25 25 25Design Capacity 480 480 480 480Enrollment 334 400 419 420
Pyramid Academy (1940)Square Feet 165,486 165,486 165,486 165,486Classrooms 57 57 57 57Design Capacity Not Available Not Available Not Available Not AvailableEnrollment Closed 343 549 448
Raineshaven ES (1959)Square Feet 66,892 66,892 66,892 66,892Classrooms 29 29 29 29Design Capacity 680 680 680 680Enrollment 141 152 182 336
Raleigh-Bartlett ES (1976)Square Feet 51,891 51,891 51,891 51,891Classrooms Open Classroom Open Classroom Open Classroom Open ClassroomDesign Capacity 600 600 600 600Enrollment 507 551 534 579
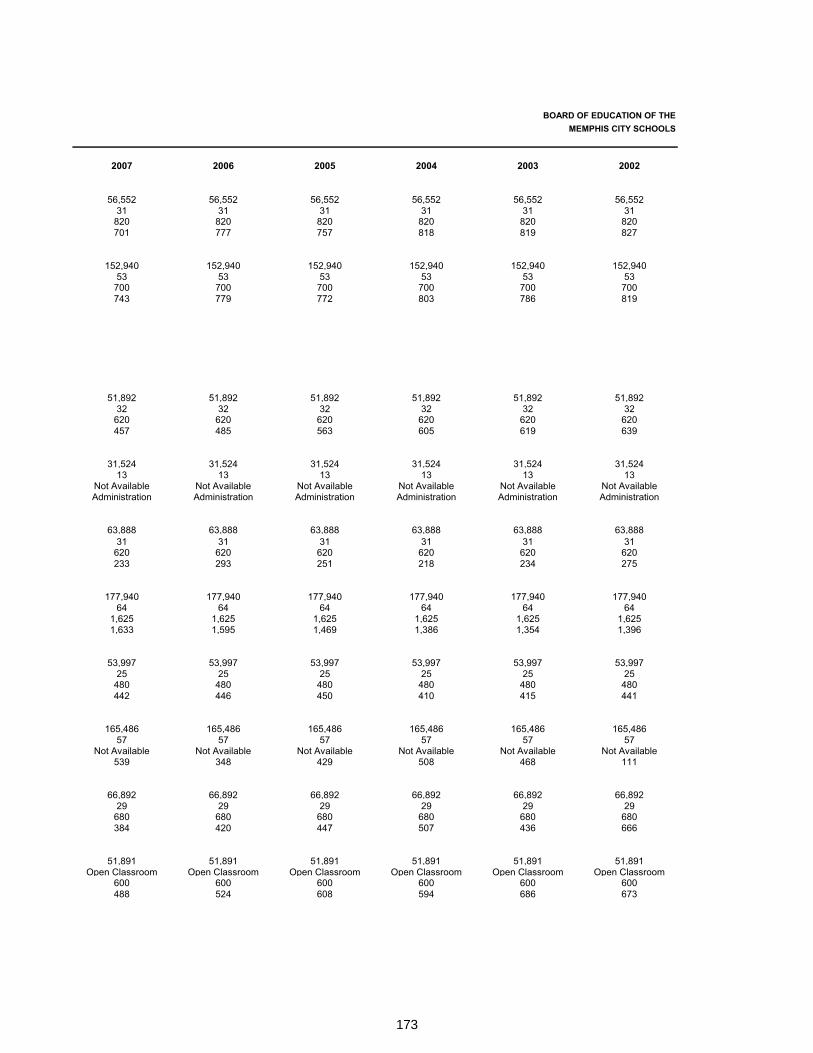
173
BOARD OF EDUCATION OF THE MEMPHIS CITY SCHOOLS
2007 2006 2005 2004 2003 2002
56,552 56,552 56,552 56,552 56,552 56,55231 31 31 31 31 31
820 820 820 820 820 820701 777 757 818 819 827
152,940 152,940 152,940 152,940 152,940 152,94053 53 53 53 53 53
700 700 700 700 700 700743 779 772 803 786 819
51,892 51,892 51,892 51,892 51,892 51,89232 32 32 32 32 32
620 620 620 620 620 620457 485 563 605 619 639
31,524 31,524 31,524 31,524 31,524 31,52413 13 13 13 13 13
Not Available Not Available Not Available Not Available Not Available Not AvailableAdministration Administration Administration Administration Administration Administration
63,888 63,888 63,888 63,888 63,888 63,88831 31 31 31 31 31
620 620 620 620 620 620233 293 251 218 234 275
177,940 177,940 177,940 177,940 177,940 177,94064 64 64 64 64 64
1,625 1,625 1,625 1,625 1,625 1,6251,633 1,595 1,469 1,386 1,354 1,396
53,997 53,997 53,997 53,997 53,997 53,99725 25 25 25 25 25
480 480 480 480 480 480442 446 450 410 415 441
165,486 165,486 165,486 165,486 165,486 165,48657 57 57 57 57 57
Not Available Not Available Not Available Not Available Not Available Not Available539 348 429 508 468 111
66,892 66,892 66,892 66,892 66,892 66,89229 29 29 29 29 29
680 680 680 680 680 680384 420 447 507 436 666
51,891 51,891 51,891 51,891 51,891 51,891Open Classroom Open Classroom Open Classroom Open Classroom Open Classroom Open Classroom
600 600 600 600 600 600488 524 608 594 686 673
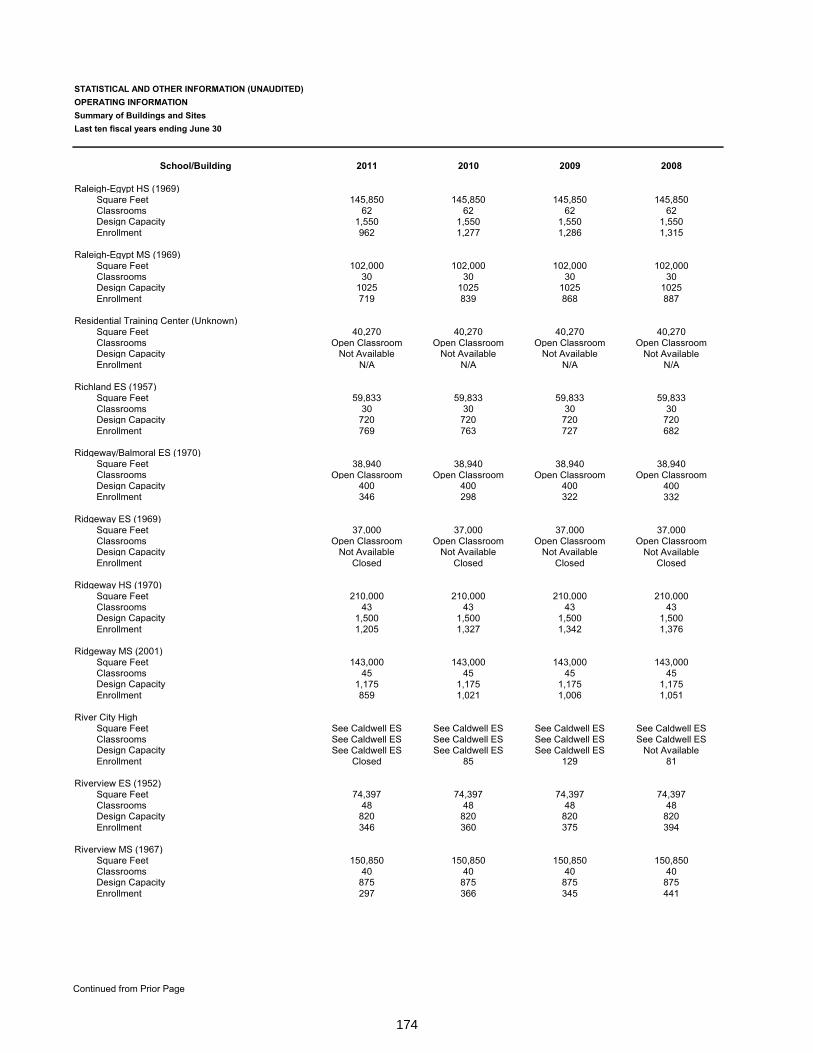
174
Continued from Prior Page
STATISTICAL AND OTHER INFORMATION (UNAUDITED)OPERATING INFORMATIONSummary of Buildings and SitesLast ten fiscal years ending June 30
School/Building 2011 2010 2009 2008
Raleigh-Egypt HS (1969)Square Feet 145,850 145,850 145,850 145,850Classrooms 62 62 62 62Design Capacity 1,550 1,550 1,550 1,550Enrollment 962 1,277 1,286 1,315
Raleigh-Egypt MS (1969)Square Feet 102,000 102,000 102,000 102,000Classrooms 30 30 30 30Design Capacity 1025 1025 1025 1025Enrollment 719 839 868 887
Residential Training Center (Unknown)Square Feet 40,270 40,270 40,270 40,270Classrooms Open Classroom Open Classroom Open Classroom Open ClassroomDesign Capacity Not Available Not Available Not Available Not AvailableEnrollment N/A N/A N/A N/A
Richland ES (1957)Square Feet 59,833 59,833 59,833 59,833Classrooms 30 30 30 30Design Capacity 720 720 720 720Enrollment 769 763 727 682
Ridgeway/Balmoral ES (1970)Square Feet 38,940 38,940 38,940 38,940Classrooms Open Classroom Open Classroom Open Classroom Open ClassroomDesign Capacity 400 400 400 400Enrollment 346 298 322 332
Ridgeway ES (1969)Square Feet 37,000 37,000 37,000 37,000Classrooms Open Classroom Open Classroom Open Classroom Open ClassroomDesign Capacity Not Available Not Available Not Available Not AvailableEnrollment Closed Closed Closed Closed
Ridgeway HS (1970)Square Feet 210,000 210,000 210,000 210,000Classrooms 43 43 43 43Design Capacity 1,500 1,500 1,500 1,500Enrollment 1,205 1,327 1,342 1,376
Ridgeway MS (2001)Square Feet 143,000 143,000 143,000 143,000Classrooms 45 45 45 45Design Capacity 1,175 1,175 1,175 1,175Enrollment 859 1,021 1,006 1,051
River City HighSquare Feet See Caldwell ES See Caldwell ES See Caldwell ES See Caldwell ESClassrooms See Caldwell ES See Caldwell ES See Caldwell ES See Caldwell ESDesign Capacity See Caldwell ES See Caldwell ES See Caldwell ES Not AvailableEnrollment Closed 85 129 81
Riverview ES (1952)Square Feet 74,397 74,397 74,397 74,397Classrooms 48 48 48 48Design Capacity 820 820 820 820Enrollment 346 360 375 394
Riverview MS (1967)Square Feet 150,850 150,850 150,850 150,850Classrooms 40 40 40 40Design Capacity 875 875 875 875Enrollment 297 366 345 441
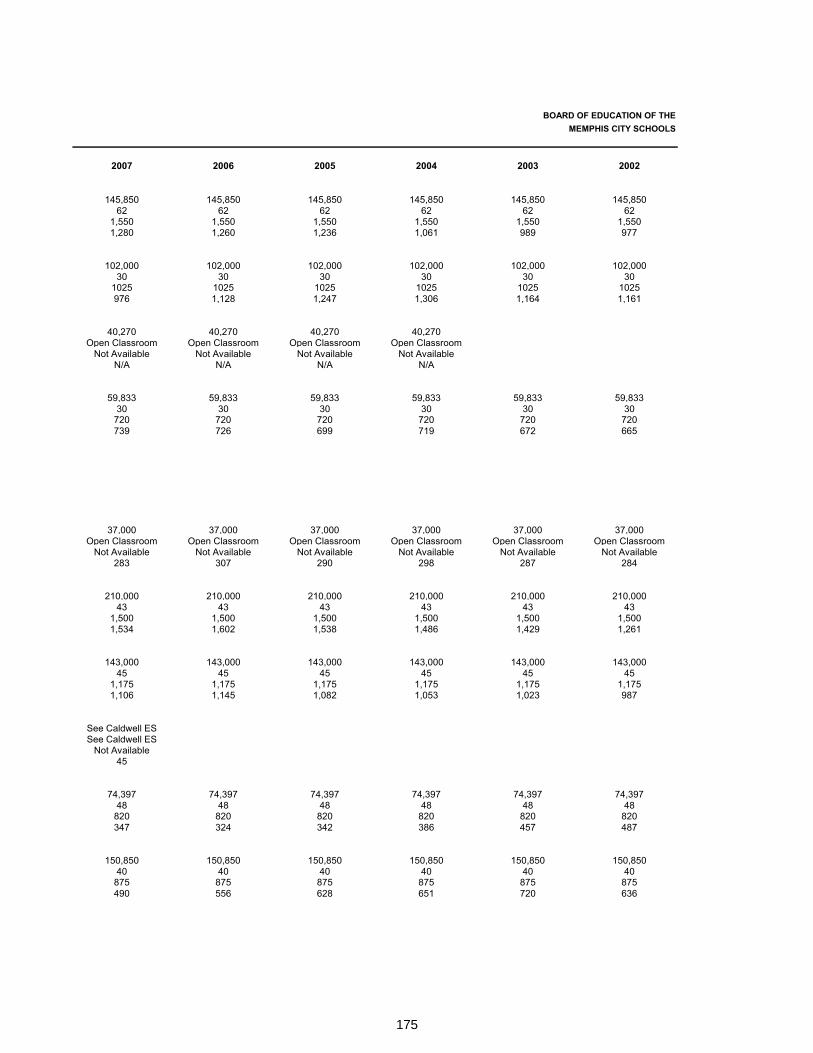
175
BOARD OF EDUCATION OF THE MEMPHIS CITY SCHOOLS
2007 2006 2005 2004 2003 2002
145,850 145,850 145,850 145,850 145,850 145,85062 62 62 62 62 62
1,550 1,550 1,550 1,550 1,550 1,5501,280 1,260 1,236 1,061 989 977
102,000 102,000 102,000 102,000 102,000 102,00030 30 30 30 30 30
1025 1025 1025 1025 1025 1025976 1,128 1,247 1,306 1,164 1,161
40,270 40,270 40,270 40,270Open Classroom Open Classroom Open Classroom Open Classroom
Not Available Not Available Not Available Not AvailableN/A N/A N/A N/A
59,833 59,833 59,833 59,833 59,833 59,83330 30 30 30 30 30
720 720 720 720 720 720739 726 699 719 672 665
37,000 37,000 37,000 37,000 37,000 37,000Open Classroom Open Classroom Open Classroom Open Classroom Open Classroom Open Classroom
Not Available Not Available Not Available Not Available Not Available Not Available283 307 290 298 287 284
210,000 210,000 210,000 210,000 210,000 210,00043 43 43 43 43 43
1,500 1,500 1,500 1,500 1,500 1,5001,534 1,602 1,538 1,486 1,429 1,261
143,000 143,000 143,000 143,000 143,000 143,00045 45 45 45 45 45
1,175 1,175 1,175 1,175 1,175 1,1751,106 1,145 1,082 1,053 1,023 987
See Caldwell ESSee Caldwell ES
Not Available45
74,397 74,397 74,397 74,397 74,397 74,39748 48 48 48 48 48
820 820 820 820 820 820347 324 342 386 457 487
150,850 150,850 150,850 150,850 150,850 150,85040 40 40 40 40 40
875 875 875 875 875 875490 556 628 651 720 636
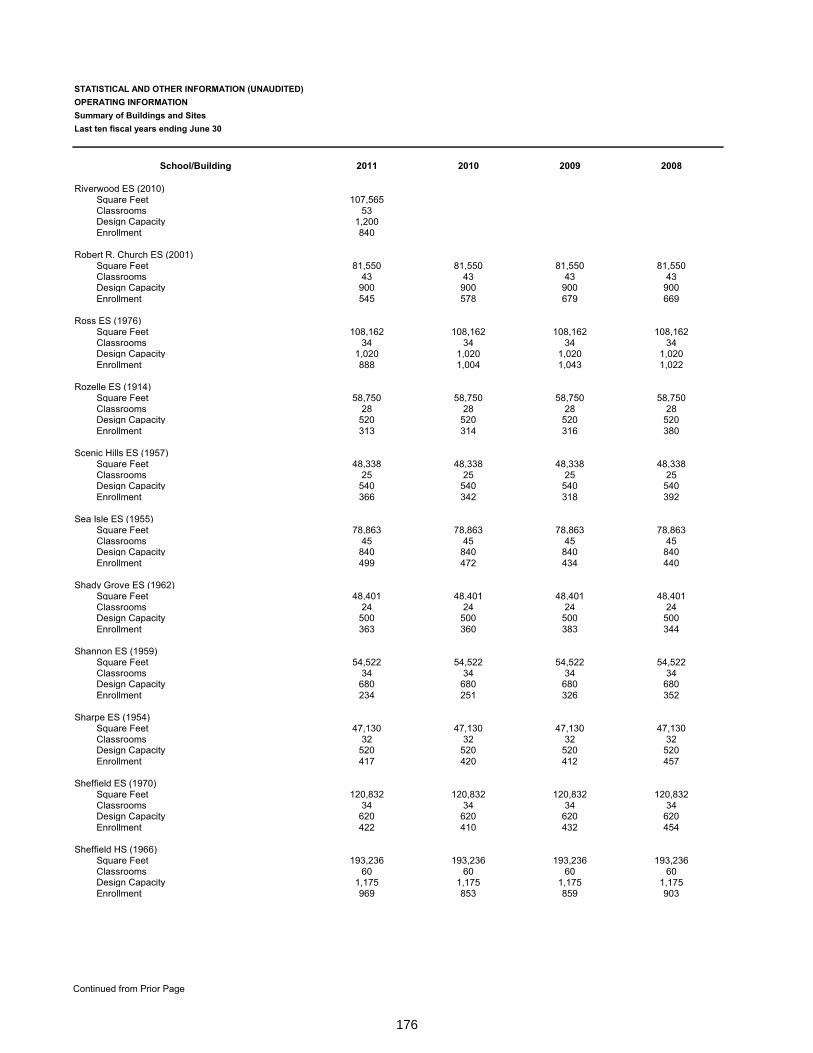
176
Continued from Prior Page
STATISTICAL AND OTHER INFORMATION (UNAUDITED)OPERATING INFORMATIONSummary of Buildings and SitesLast ten fiscal years ending June 30
School/Building 2011 2010 2009 2008
Riverwood ES (2010)Square Feet 107,565Classrooms 53Design Capacity 1,200Enrollment 840
Robert R. Church ES (2001)Square Feet 81,550 81,550 81,550 81,550Classrooms 43 43 43 43Design Capacity 900 900 900 900Enrollment 545 578 679 669
Ross ES (1976)Square Feet 108,162 108,162 108,162 108,162Classrooms 34 34 34 34Design Capacity 1,020 1,020 1,020 1,020Enrollment 888 1,004 1,043 1,022
Rozelle ES (1914)Square Feet 58,750 58,750 58,750 58,750Classrooms 28 28 28 28Design Capacity 520 520 520 520Enrollment 313 314 316 380
Scenic Hills ES (1957)Square Feet 48,338 48,338 48,338 48,338Classrooms 25 25 25 25Design Capacity 540 540 540 540Enrollment 366 342 318 392
Sea Isle ES (1955)Square Feet 78,863 78,863 78,863 78,863Classrooms 45 45 45 45Design Capacity 840 840 840 840Enrollment 499 472 434 440
Shady Grove ES (1962)Square Feet 48,401 48,401 48,401 48,401Classrooms 24 24 24 24Design Capacity 500 500 500 500Enrollment 363 360 383 344
Shannon ES (1959)Square Feet 54,522 54,522 54,522 54,522Classrooms 34 34 34 34Design Capacity 680 680 680 680Enrollment 234 251 326 352
Sharpe ES (1954)Square Feet 47,130 47,130 47,130 47,130Classrooms 32 32 32 32Design Capacity 520 520 520 520Enrollment 417 420 412 457
Sheffield ES (1970)Square Feet 120,832 120,832 120,832 120,832Classrooms 34 34 34 34Design Capacity 620 620 620 620Enrollment 422 410 432 454
Sheffield HS (1966)Square Feet 193,236 193,236 193,236 193,236Classrooms 60 60 60 60Design Capacity 1,175 1,175 1,175 1,175Enrollment 969 853 859 903
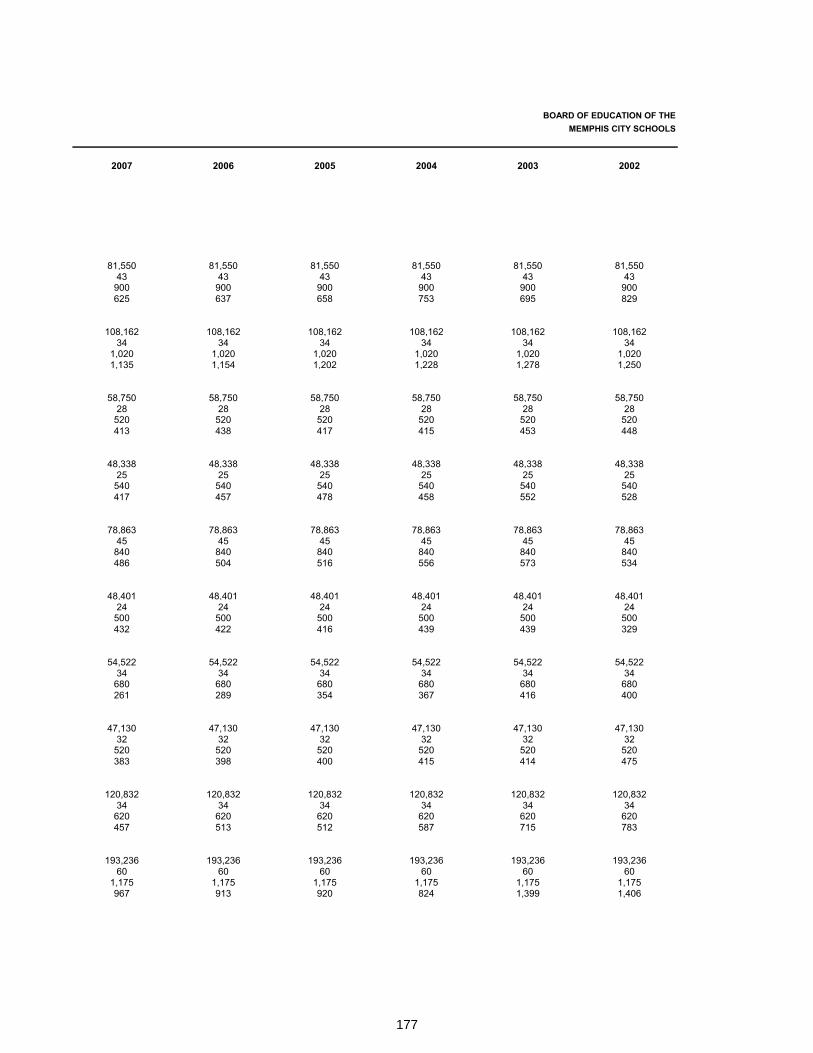
177
BOARD OF EDUCATION OF THE MEMPHIS CITY SCHOOLS
2007 2006 2005 2004 2003 2002
81,550 81,550 81,550 81,550 81,550 81,55043 43 43 43 43 43
900 900 900 900 900 900625 637 658 753 695 829
108,162 108,162 108,162 108,162 108,162 108,16234 34 34 34 34 34
1,020 1,020 1,020 1,020 1,020 1,0201,135 1,154 1,202 1,228 1,278 1,250
58,750 58,750 58,750 58,750 58,750 58,75028 28 28 28 28 28
520 520 520 520 520 520413 438 417 415 453 448
48,338 48,338 48,338 48,338 48,338 48,33825 25 25 25 25 25
540 540 540 540 540 540417 457 478 458 552 528
78,863 78,863 78,863 78,863 78,863 78,86345 45 45 45 45 45
840 840 840 840 840 840486 504 516 556 573 534
48,401 48,401 48,401 48,401 48,401 48,40124 24 24 24 24 24
500 500 500 500 500 500432 422 416 439 439 329
54,522 54,522 54,522 54,522 54,522 54,52234 34 34 34 34 34
680 680 680 680 680 680261 289 354 367 416 400
47,130 47,130 47,130 47,130 47,130 47,13032 32 32 32 32 32
520 520 520 520 520 520383 398 400 415 414 475
120,832 120,832 120,832 120,832 120,832 120,83234 34 34 34 34 34
620 620 620 620 620 620457 513 512 587 715 783
193,236 193,236 193,236 193,236 193,236 193,23660 60 60 60 60 60
1,175 1,175 1,175 1,175 1,175 1,175967 913 920 824 1,399 1,406
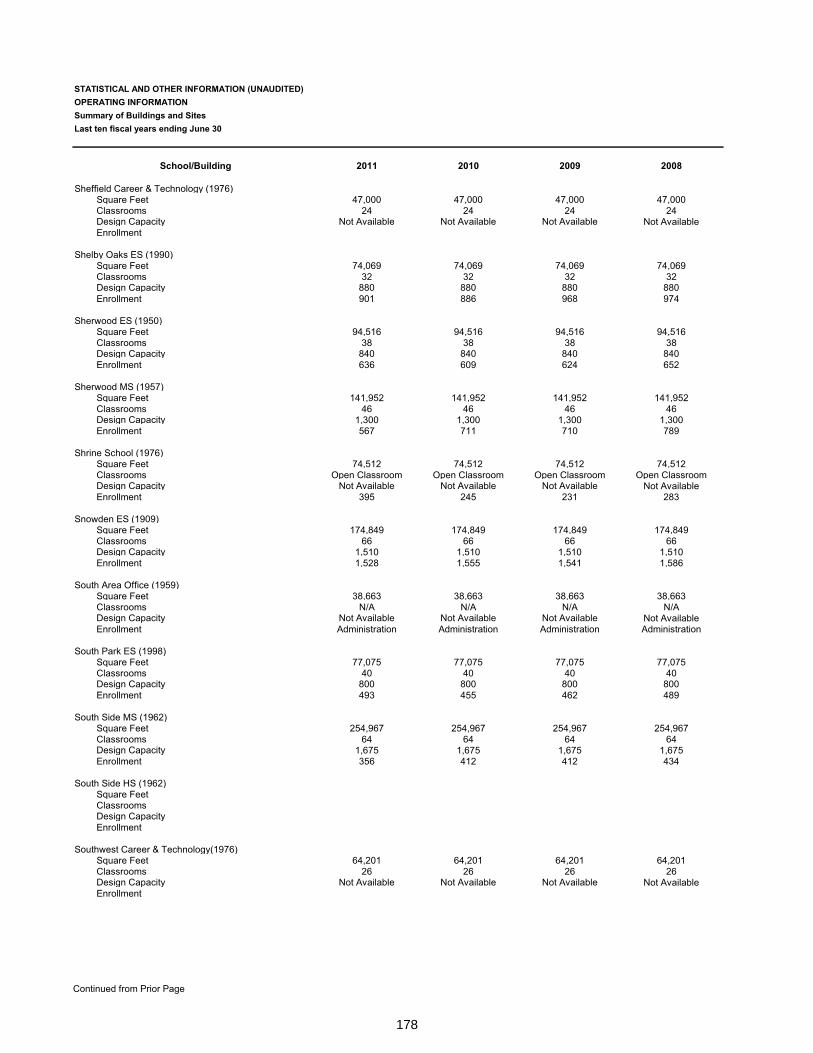
178
Continued from Prior Page
STATISTICAL AND OTHER INFORMATION (UNAUDITED)OPERATING INFORMATIONSummary of Buildings and SitesLast ten fiscal years ending June 30
School/Building 2011 2010 2009 2008
Sheffield Career & Technology (1976)Square Feet 47,000 47,000 47,000 47,000Classrooms 24 24 24 24Design Capacity Not Available Not Available Not Available Not AvailableEnrollment
Shelby Oaks ES (1990)Square Feet 74,069 74,069 74,069 74,069Classrooms 32 32 32 32Design Capacity 880 880 880 880Enrollment 901 886 968 974
Sherwood ES (1950)Square Feet 94,516 94,516 94,516 94,516Classrooms 38 38 38 38Design Capacity 840 840 840 840Enrollment 636 609 624 652
Sherwood MS (1957)Square Feet 141,952 141,952 141,952 141,952Classrooms 46 46 46 46Design Capacity 1,300 1,300 1,300 1,300Enrollment 567 711 710 789
Shrine School (1976)Square Feet 74,512 74,512 74,512 74,512Classrooms Open Classroom Open Classroom Open Classroom Open ClassroomDesign Capacity Not Available Not Available Not Available Not AvailableEnrollment 395 245 231 283
Snowden ES (1909)Square Feet 174,849 174,849 174,849 174,849Classrooms 66 66 66 66Design Capacity 1,510 1,510 1,510 1,510Enrollment 1,528 1,555 1,541 1,586
South Area Office (1959)Square Feet 38,663 38,663 38,663 38,663Classrooms N/A N/A N/A N/ADesign Capacity Not Available Not Available Not Available Not AvailableEnrollment Administration Administration Administration Administration
South Park ES (1998)Square Feet 77,075 77,075 77,075 77,075Classrooms 40 40 40 40Design Capacity 800 800 800 800Enrollment 493 455 462 489
South Side MS (1962)Square Feet 254,967 254,967 254,967 254,967Classrooms 64 64 64 64Design Capacity 1,675 1,675 1,675 1,675Enrollment 356 412 412 434
South Side HS (1962)Square FeetClassroomsDesign CapacityEnrollment
Southwest Career & Technology(1976)Square Feet 64,201 64,201 64,201 64,201Classrooms 26 26 26 26Design Capacity Not Available Not Available Not Available Not AvailableEnrollment
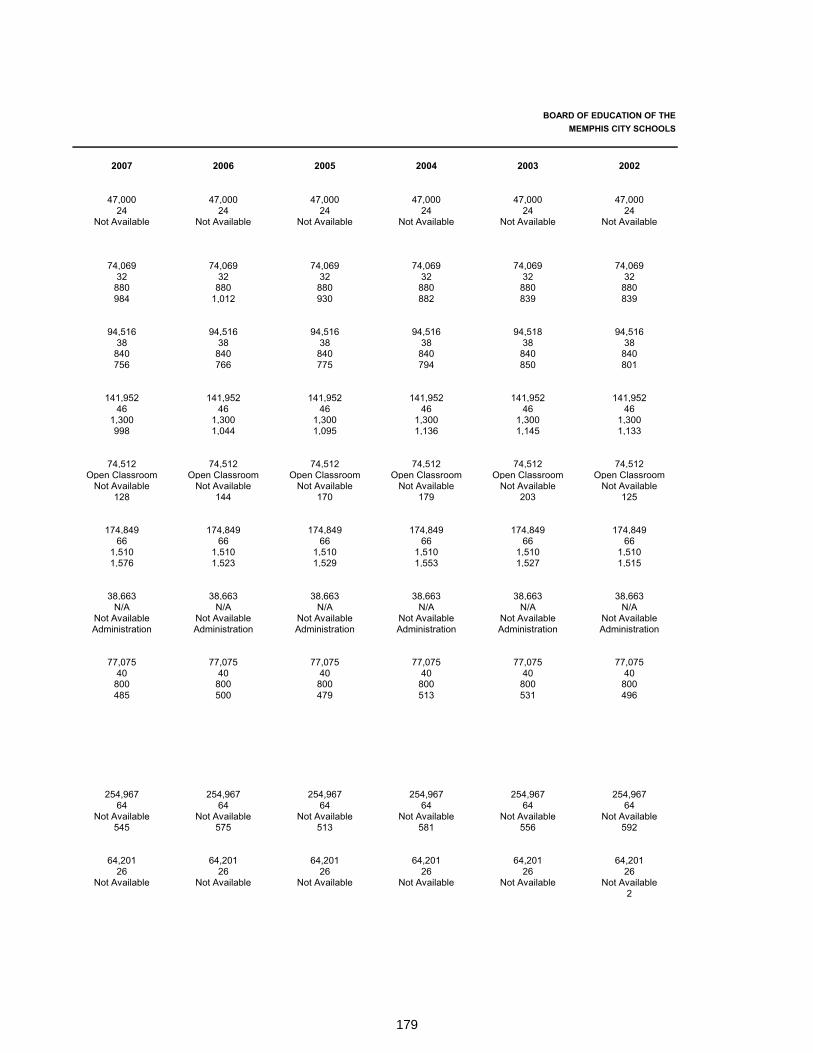
179
BOARD OF EDUCATION OF THE MEMPHIS CITY SCHOOLS
2007 2006 2005 2004 2003 2002
47,000 47,000 47,000 47,000 47,000 47,00024 24 24 24 24 24
Not Available Not Available Not Available Not Available Not Available Not Available
74,069 74,069 74,069 74,069 74,069 74,06932 32 32 32 32 32
880 880 880 880 880 880984 1,012 930 882 839 839
94,516 94,516 94,516 94,516 94,518 94,51638 38 38 38 38 38
840 840 840 840 840 840756 766 775 794 850 801
141,952 141,952 141,952 141,952 141,952 141,95246 46 46 46 46 46
1,300 1,300 1,300 1,300 1,300 1,300998 1,044 1,095 1,136 1,145 1,133
74,512 74,512 74,512 74,512 74,512 74,512Open Classroom Open Classroom Open Classroom Open Classroom Open Classroom Open Classroom
Not Available Not Available Not Available Not Available Not Available Not Available128 144 170 179 203 125
174,849 174,849 174,849 174,849 174,849 174,84966 66 66 66 66 66
1,510 1,510 1,510 1,510 1,510 1,5101,576 1,523 1,529 1,553 1,527 1,515
38,663 38,663 38,663 38,663 38,663 38,663N/A N/A N/A N/A N/A N/A
Not Available Not Available Not Available Not Available Not Available Not AvailableAdministration Administration Administration Administration Administration Administration
77,075 77,075 77,075 77,075 77,075 77,07540 40 40 40 40 40
800 800 800 800 800 800485 500 479 513 531 496
254,967 254,967 254,967 254,967 254,967 254,96764 64 64 64 64 64
Not Available Not Available Not Available Not Available Not Available Not Available545 575 513 581 556 592
64,201 64,201 64,201 64,201 64,201 64,20126 26 26 26 26 26
Not Available Not Available Not Available Not Available Not Available Not Available2
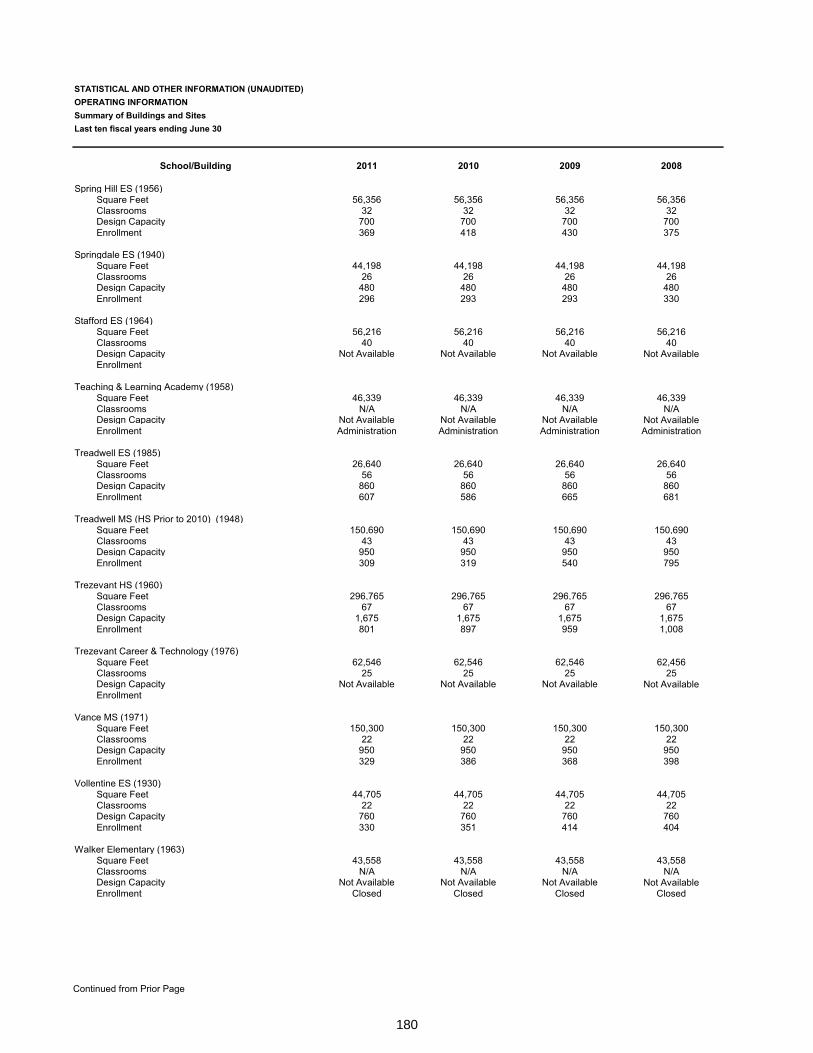
180
Continued from Prior Page
STATISTICAL AND OTHER INFORMATION (UNAUDITED)OPERATING INFORMATIONSummary of Buildings and SitesLast ten fiscal years ending June 30
School/Building 2011 2010 2009 2008
Spring Hill ES (1956)Square Feet 56,356 56,356 56,356 56,356Classrooms 32 32 32 32Design Capacity 700 700 700 700Enrollment 369 418 430 375
Springdale ES (1940)Square Feet 44,198 44,198 44,198 44,198Classrooms 26 26 26 26Design Capacity 480 480 480 480Enrollment 296 293 293 330
Stafford ES (1964)Square Feet 56,216 56,216 56,216 56,216Classrooms 40 40 40 40Design Capacity Not Available Not Available Not Available Not AvailableEnrollment
Teaching & Learning Academy (1958)Square Feet 46,339 46,339 46,339 46,339Classrooms N/A N/A N/A N/ADesign Capacity Not Available Not Available Not Available Not AvailableEnrollment Administration Administration Administration Administration
Treadwell ES (1985)Square Feet 26,640 26,640 26,640 26,640Classrooms 56 56 56 56Design Capacity 860 860 860 860Enrollment 607 586 665 681
Treadwell MS (HS Prior to 2010) (1948)Square Feet 150,690 150,690 150,690 150,690Classrooms 43 43 43 43Design Capacity 950 950 950 950Enrollment 309 319 540 795
Trezevant HS (1960)Square Feet 296,765 296,765 296,765 296,765Classrooms 67 67 67 67Design Capacity 1,675 1,675 1,675 1,675Enrollment 801 897 959 1,008
Trezevant Career & Technology (1976)Square Feet 62,546 62,546 62,546 62,456Classrooms 25 25 25 25Design Capacity Not Available Not Available Not Available Not AvailableEnrollment
Vance MS (1971)Square Feet 150,300 150,300 150,300 150,300Classrooms 22 22 22 22Design Capacity 950 950 950 950Enrollment 329 386 368 398
Vollentine ES (1930)Square Feet 44,705 44,705 44,705 44,705Classrooms 22 22 22 22Design Capacity 760 760 760 760Enrollment 330 351 414 404
Walker Elementary (1963)Square Feet 43,558 43,558 43,558 43,558Classrooms N/A N/A N/A N/ADesign Capacity Not Available Not Available Not Available Not AvailableEnrollment Closed Closed Closed Closed
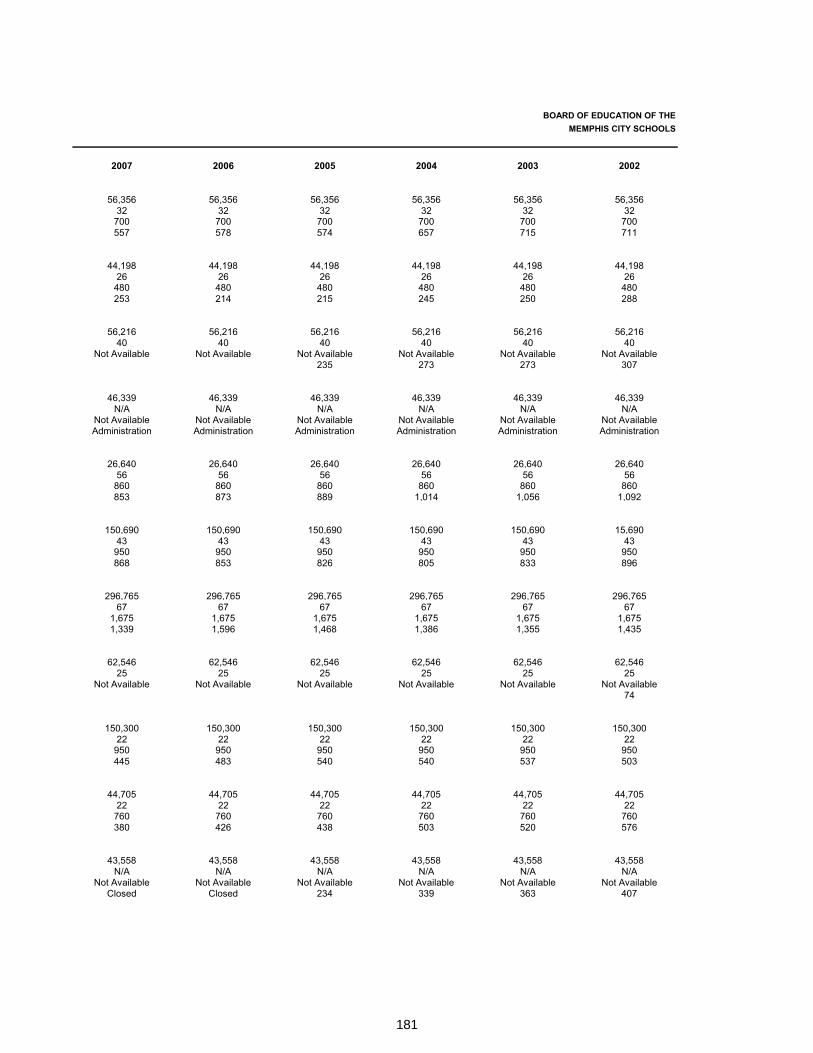
181
BOARD OF EDUCATION OF THE MEMPHIS CITY SCHOOLS
2007 2006 2005 2004 2003 2002
56,356 56,356 56,356 56,356 56,356 56,35632 32 32 32 32 32
700 700 700 700 700 700557 578 574 657 715 711
44,198 44,198 44,198 44,198 44,198 44,19826 26 26 26 26 26
480 480 480 480 480 480253 214 215 245 250 288
56,216 56,216 56,216 56,216 56,216 56,21640 40 40 40 40 40
Not Available Not Available Not Available Not Available Not Available Not Available235 273 273 307
46,339 46,339 46,339 46,339 46,339 46,339N/A N/A N/A N/A N/A N/A
Not Available Not Available Not Available Not Available Not Available Not AvailableAdministration Administration Administration Administration Administration Administration
26,640 26,640 26,640 26,640 26,640 26,64056 56 56 56 56 56
860 860 860 860 860 860853 873 889 1,014 1,056 1,092
150,690 150,690 150,690 150,690 150,690 15,69043 43 43 43 43 43
950 950 950 950 950 950868 853 826 805 833 896
296,765 296,765 296,765 296,765 296,765 296,76567 67 67 67 67 67
1,675 1,675 1,675 1,675 1,675 1,6751,339 1,596 1,468 1,386 1,355 1,435
62,546 62,546 62,546 62,546 62,546 62,54625 25 25 25 25 25
Not Available Not Available Not Available Not Available Not Available Not Available74
150,300 150,300 150,300 150,300 150,300 150,30022 22 22 22 22 22
950 950 950 950 950 950445 483 540 540 537 503
44,705 44,705 44,705 44,705 44,705 44,70522 22 22 22 22 22
760 760 760 760 760 760380 426 438 503 520 576
43,558 43,558 43,558 43,558 43,558 43,558N/A N/A N/A N/A N/A N/A
Not Available Not Available Not Available Not Available Not Available Not AvailableClosed Closed 234 339 363 407
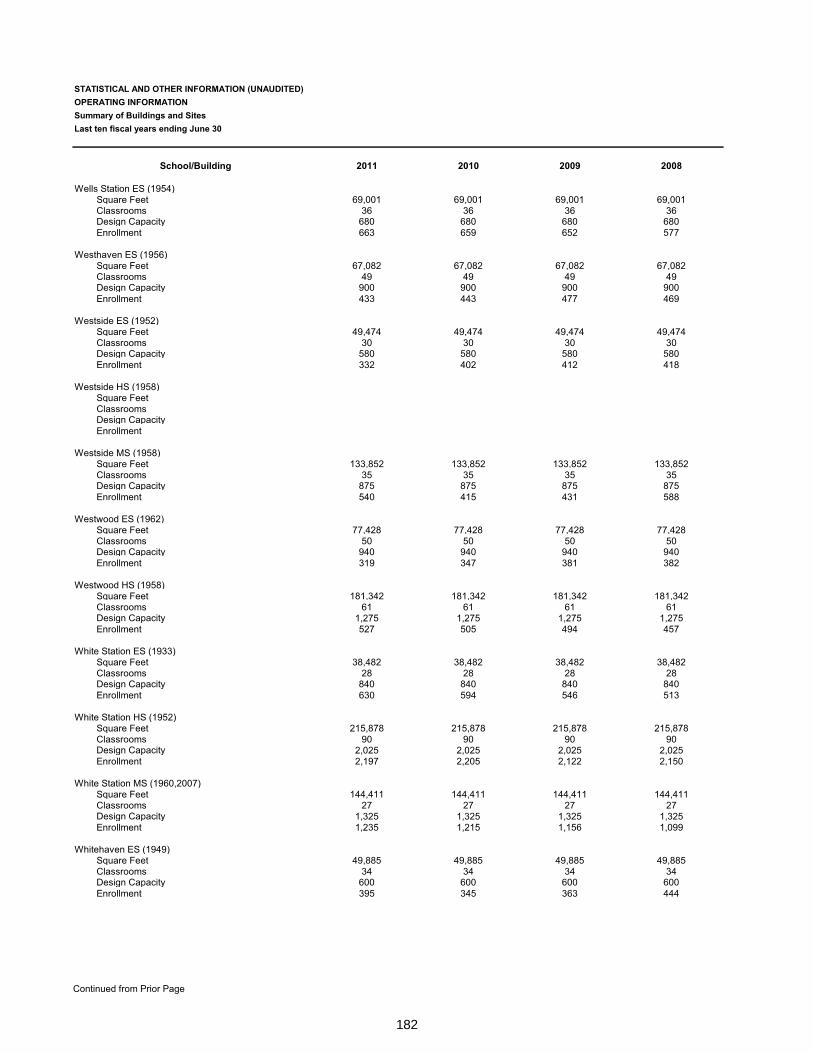
182
Continued from Prior Page
STATISTICAL AND OTHER INFORMATION (UNAUDITED)OPERATING INFORMATIONSummary of Buildings and SitesLast ten fiscal years ending June 30
School/Building 2011 2010 2009 2008
Wells Station ES (1954)Square Feet 69,001 69,001 69,001 69,001Classrooms 36 36 36 36Design Capacity 680 680 680 680Enrollment 663 659 652 577
Westhaven ES (1956)Square Feet 67,082 67,082 67,082 67,082Classrooms 49 49 49 49Design Capacity 900 900 900 900Enrollment 433 443 477 469
Westside ES (1952)Square Feet 49,474 49,474 49,474 49,474Classrooms 30 30 30 30Design Capacity 580 580 580 580Enrollment 332 402 412 418
Westside HS (1958)Square FeetClassroomsDesign CapacityEnrollment
Westside MS (1958)Square Feet 133,852 133,852 133,852 133,852Classrooms 35 35 35 35Design Capacity 875 875 875 875Enrollment 540 415 431 588
Westwood ES (1962)Square Feet 77,428 77,428 77,428 77,428Classrooms 50 50 50 50Design Capacity 940 940 940 940Enrollment 319 347 381 382
Westwood HS (1958)Square Feet 181,342 181,342 181,342 181,342Classrooms 61 61 61 61Design Capacity 1,275 1,275 1,275 1,275Enrollment 527 505 494 457
White Station ES (1933)Square Feet 38,482 38,482 38,482 38,482Classrooms 28 28 28 28Design Capacity 840 840 840 840Enrollment 630 594 546 513
White Station HS (1952)Square Feet 215,878 215,878 215,878 215,878Classrooms 90 90 90 90Design Capacity 2,025 2,025 2,025 2,025Enrollment 2,197 2,205 2,122 2,150
White Station MS (1960,2007)Square Feet 144,411 144,411 144,411 144,411Classrooms 27 27 27 27Design Capacity 1,325 1,325 1,325 1,325Enrollment 1,235 1,215 1,156 1,099
Whitehaven ES (1949)Square Feet 49,885 49,885 49,885 49,885Classrooms 34 34 34 34Design Capacity 600 600 600 600Enrollment 395 345 363 444
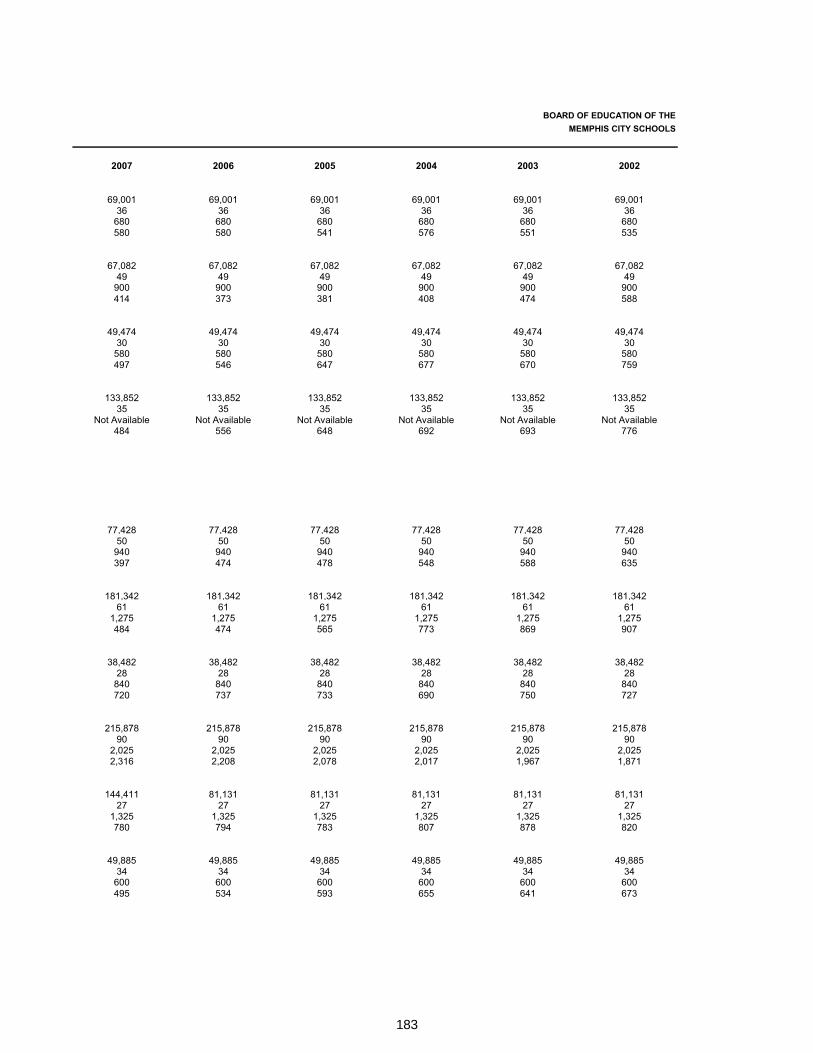
183
BOARD OF EDUCATION OF THE MEMPHIS CITY SCHOOLS
2007 2006 2005 2004 2003 2002
69,001 69,001 69,001 69,001 69,001 69,00136 36 36 36 36 36
680 680 680 680 680 680580 580 541 576 551 535
67,082 67,082 67,082 67,082 67,082 67,08249 49 49 49 49 49
900 900 900 900 900 900414 373 381 408 474 588
49,474 49,474 49,474 49,474 49,474 49,47430 30 30 30 30 30
580 580 580 580 580 580497 546 647 677 670 759
133,852 133,852 133,852 133,852 133,852 133,85235 35 35 35 35 35
Not Available Not Available Not Available Not Available Not Available Not Available484 556 648 692 693 776
77,428 77,428 77,428 77,428 77,428 77,42850 50 50 50 50 50
940 940 940 940 940 940397 474 478 548 588 635
181,342 181,342 181,342 181,342 181,342 181,34261 61 61 61 61 61
1,275 1,275 1,275 1,275 1,275 1,275484 474 565 773 869 907
38,482 38,482 38,482 38,482 38,482 38,48228 28 28 28 28 28
840 840 840 840 840 840720 737 733 690 750 727
215,878 215,878 215,878 215,878 215,878 215,87890 90 90 90 90 90
2,025 2,025 2,025 2,025 2,025 2,0252,316 2,208 2,078 2,017 1,967 1,871
144,411 81,131 81,131 81,131 81,131 81,13127 27 27 27 27 27
1,325 1,325 1,325 1,325 1,325 1,325780 794 783 807 878 820
49,885 49,885 49,885 49,885 49,885 49,88534 34 34 34 34 34
600 600 600 600 600 600495 534 593 655 641 673
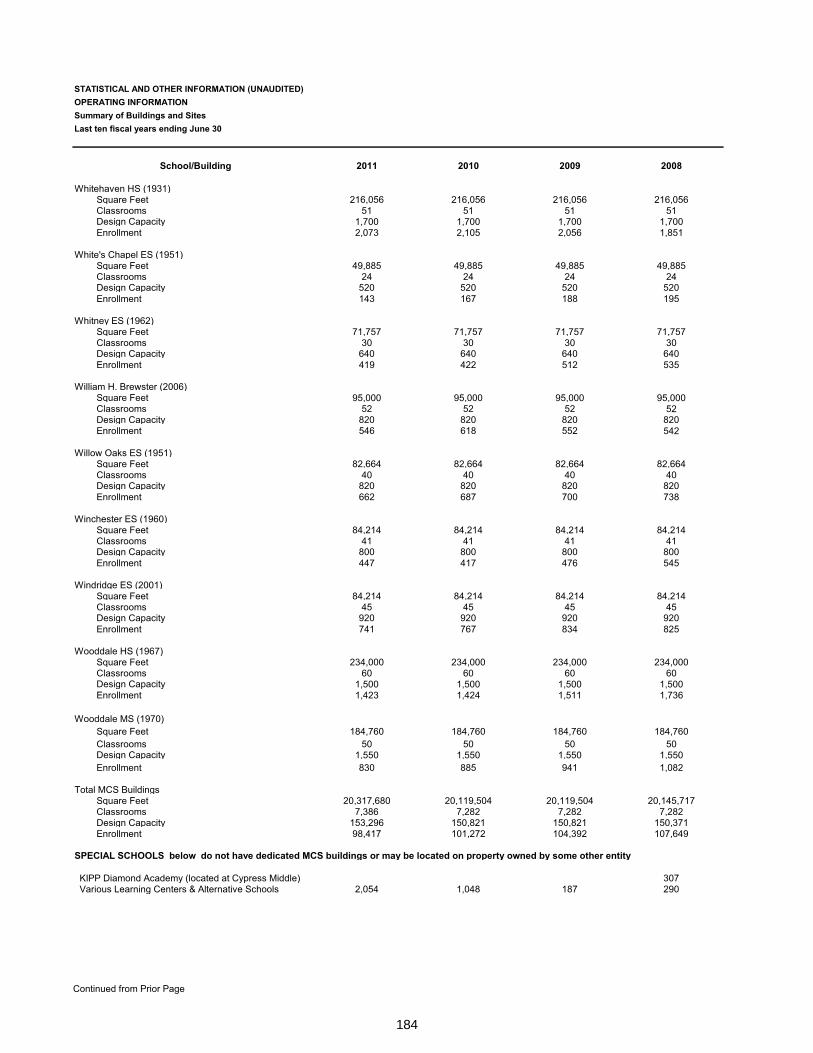
184
Continued from Prior Page
STATISTICAL AND OTHER INFORMATION (UNAUDITED)OPERATING INFORMATIONSummary of Buildings and SitesLast ten fiscal years ending June 30
School/Building 2011 2010 2009 2008
Whitehaven HS (1931)Square Feet 216,056 216,056 216,056 216,056Classrooms 51 51 51 51Design Capacity 1,700 1,700 1,700 1,700Enrollment 2,073 2,105 2,056 1,851
White's Chapel ES (1951)Square Feet 49,885 49,885 49,885 49,885Classrooms 24 24 24 24Design Capacity 520 520 520 520Enrollment 143 167 188 195
Whitney ES (1962)Square Feet 71,757 71,757 71,757 71,757Classrooms 30 30 30 30Design Capacity 640 640 640 640Enrollment 419 422 512 535
William H. Brewster (2006)Square Feet 95,000 95,000 95,000 95,000Classrooms 52 52 52 52Design Capacity 820 820 820 820Enrollment 546 618 552 542
Willow Oaks ES (1951)Square Feet 82,664 82,664 82,664 82,664Classrooms 40 40 40 40Design Capacity 820 820 820 820Enrollment 662 687 700 738
Winchester ES (1960)Square Feet 84,214 84,214 84,214 84,214Classrooms 41 41 41 41Design Capacity 800 800 800 800Enrollment 447 417 476 545
Windridge ES (2001)Square Feet 84,214 84,214 84,214 84,214Classrooms 45 45 45 45Design Capacity 920 920 920 920Enrollment 741 767 834 825
Wooddale HS (1967)Square Feet 234,000 234,000 234,000 234,000Classrooms 60 60 60 60Design Capacity 1,500 1,500 1,500 1,500Enrollment 1,423 1,424 1,511 1,736
Wooddale MS (1970)Square Feet 184,760 184,760 184,760 184,760Classrooms 50 50 50 50Design Capacity 1,550 1,550 1,550 1,550Enrollment 830 885 941 1,082
Total MCS BuildingsSquare Feet 20,317,680 20,119,504 20,119,504 20,145,717Classrooms 7,386 7,282 7,282 7,282Design Capacity 153,296 150,821 150,821 150,371Enrollment 98,417 101,272 104,392 107,649
SPECIAL SCHOOLS below do not have dedicated MCS buildings or may be located on property owned by some other entity
KIPP Diamond Academy (located at Cypress Middle) 307 Various Learning Centers & Alternative Schools 2,054 1,048 187 290
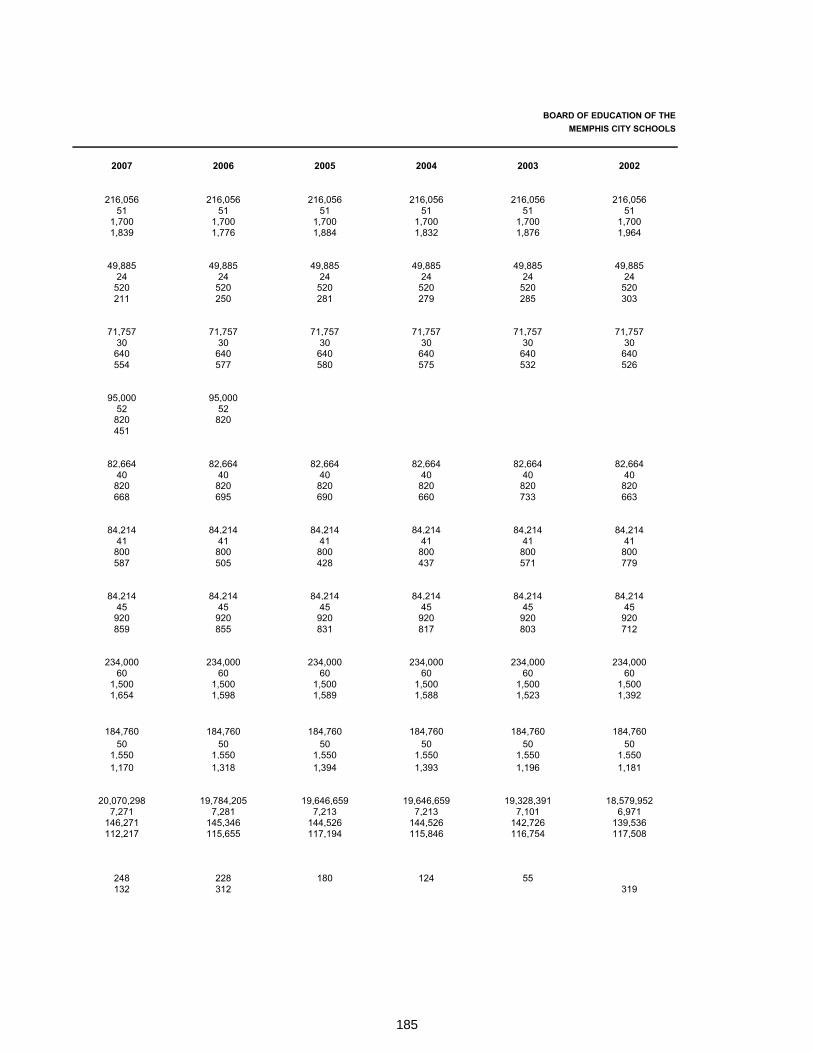
185
BOARD OF EDUCATION OF THE MEMPHIS CITY SCHOOLS
2007 2006 2005 2004 2003 2002
216,056 216,056 216,056 216,056 216,056 216,05651 51 51 51 51 51
1,700 1,700 1,700 1,700 1,700 1,7001,839 1,776 1,884 1,832 1,876 1,964
49,885 49,885 49,885 49,885 49,885 49,88524 24 24 24 24 24
520 520 520 520 520 520211 250 281 279 285 303
71,757 71,757 71,757 71,757 71,757 71,75730 30 30 30 30 30
640 640 640 640 640 640554 577 580 575 532 526
95,000 95,00052 52
820 820451
82,664 82,664 82,664 82,664 82,664 82,66440 40 40 40 40 40
820 820 820 820 820 820668 695 690 660 733 663
84,214 84,214 84,214 84,214 84,214 84,21441 41 41 41 41 41
800 800 800 800 800 800587 505 428 437 571 779
84,214 84,214 84,214 84,214 84,214 84,21445 45 45 45 45 45
920 920 920 920 920 920859 855 831 817 803 712
234,000 234,000 234,000 234,000 234,000 234,00060 60 60 60 60 60
1,500 1,500 1,500 1,500 1,500 1,5001,654 1,598 1,589 1,588 1,523 1,392
184,760 184,760 184,760 184,760 184,760 184,76050 50 50 50 50 50
1,550 1,550 1,550 1,550 1,550 1,5501,170 1,318 1,394 1,393 1,196 1,181
20,070,298 19,784,205 19,646,659 19,646,659 19,328,391 18,579,9527,271 7,281 7,213 7,213 7,101 6,971
146,271 145,346 144,526 144,526 142,726 139,536112,217 115,655 117,194 115,846 116,754 117,508
248 228 180 124 55132 312 319
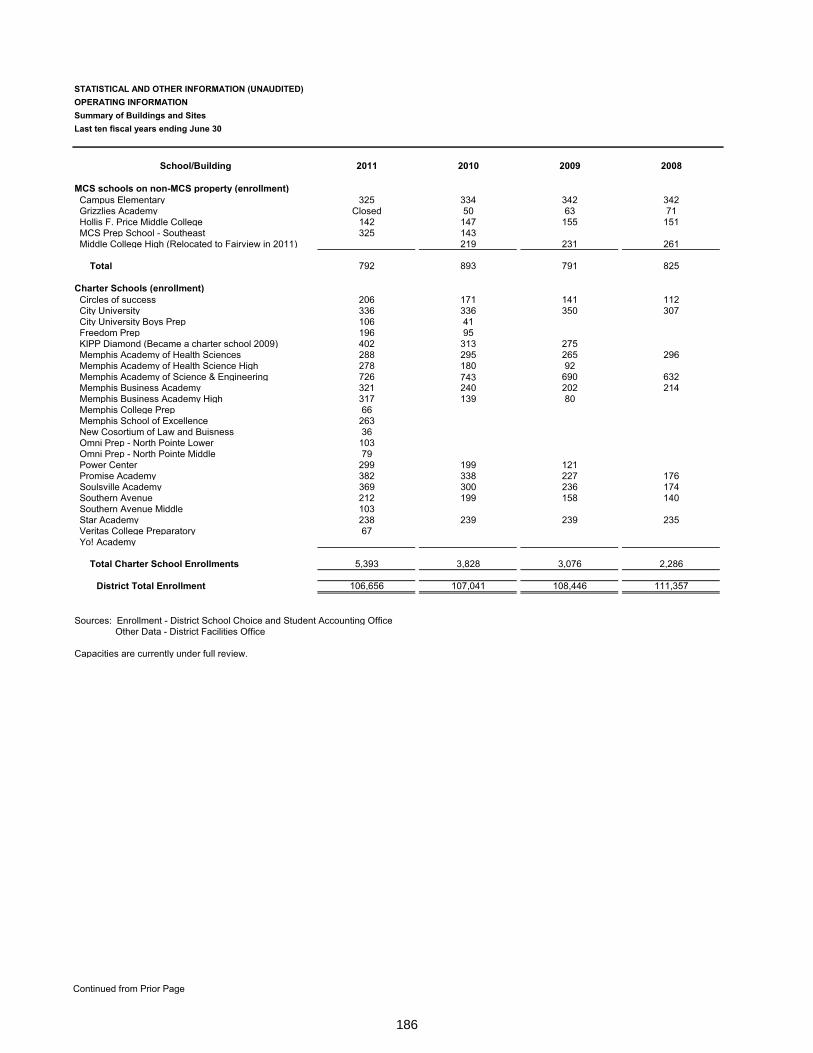
186
Continued from Prior Page
STATISTICAL AND OTHER INFORMATION (UNAUDITED)OPERATING INFORMATIONSummary of Buildings and SitesLast ten fiscal years ending June 30
School/Building 2011 2010 2009 2008
MCS schools on non-MCS property (enrollment) Campus Elementary 325 334 342 342 Grizzlies Academy Closed 50 63 71 Hollis F. Price Middle College 142 147 155 151 MCS Prep School - Southeast 325 143 Middle College High (Relocated to Fairview in 2011) 219 231 261
Total 792 893 791 825
Charter Schools (enrollment) Circles of success 206 171 141 112 City University 336 336 350 307 City University Boys Prep 106 41 Freedom Prep 196 95 KIPP Diamond (Became a charter school 2009) 402 313 275 Memphis Academy of Health Sciences 288 295 265 296 Memphis Academy of Health Science High 278 180 92 Memphis Academy of Science & Engineering 726 743 690 632 Memphis Business Academy 321 240 202 214 Memphis Business Academy High 317 139 80 Memphis College Prep 66 Memphis School of Excellence 263 New Cosortium of Law and Buisness 36 Omni Prep - North Pointe Lower 103 Omni Prep - North Pointe Middle 79 Power Center 299 199 121 Promise Academy 382 338 227 176 Soulsville Academy 369 300 236 174 Southern Avenue 212 199 158 140 Southern Avenue Middle 103 Star Academy 238 239 239 235 Veritas College Preparatory 67 Yo! Academy
Total Charter School Enrollments 5,393 3,828 3,076 2,286
District Total Enrollment 106,656 107,041 108,446 111,357
Sources: Enrollment - District School Choice and Student Accounting Office Other Data - District Facilities Office
Capacities are currently under full review.
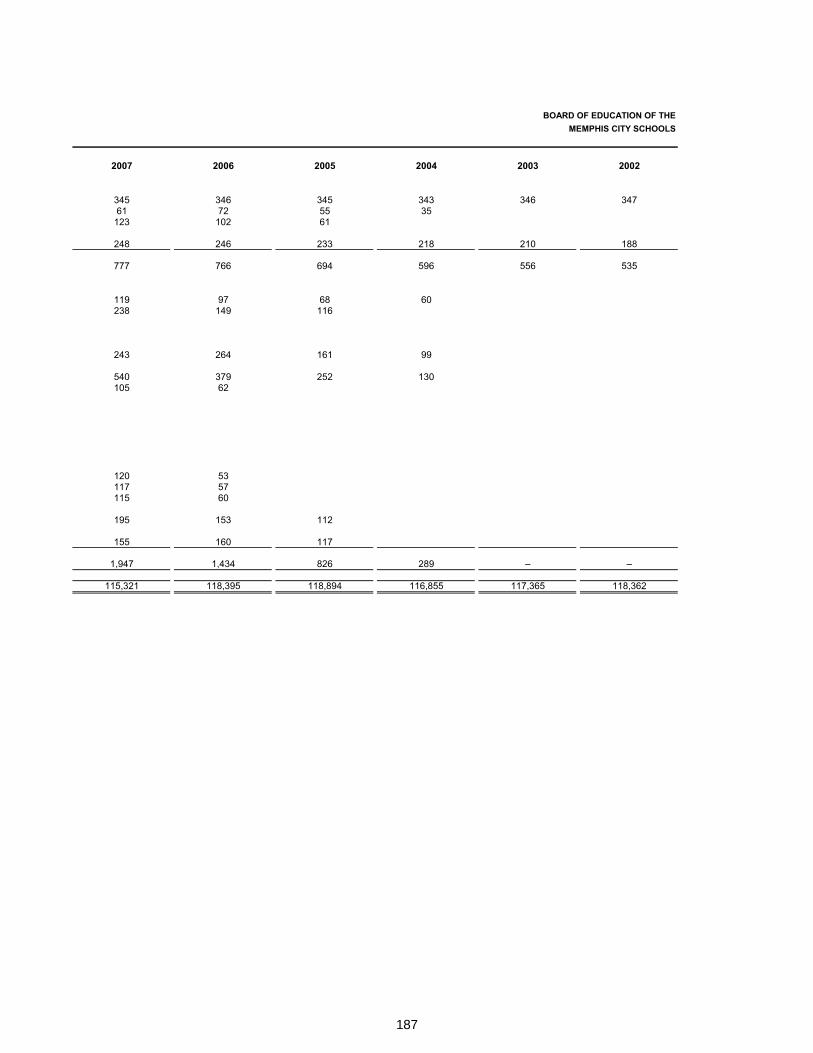
187
BOARD OF EDUCATION OF THE MEMPHIS CITY SCHOOLS
2007 2006 2005 2004 2003 2002
345 346 345 343 346 34761 72 55 35
123 102 61
248 246 233 218 210 188
777 766 694 596 556 535
119 97 68 60238 149 116
243 264 161 99
540 379 252 130105 62
120 53117 57115 60
195 153 112
155 160 117
1,947 1,434 826 289 – –
115,321 118,395 118,894 116,855 117,365 118,362
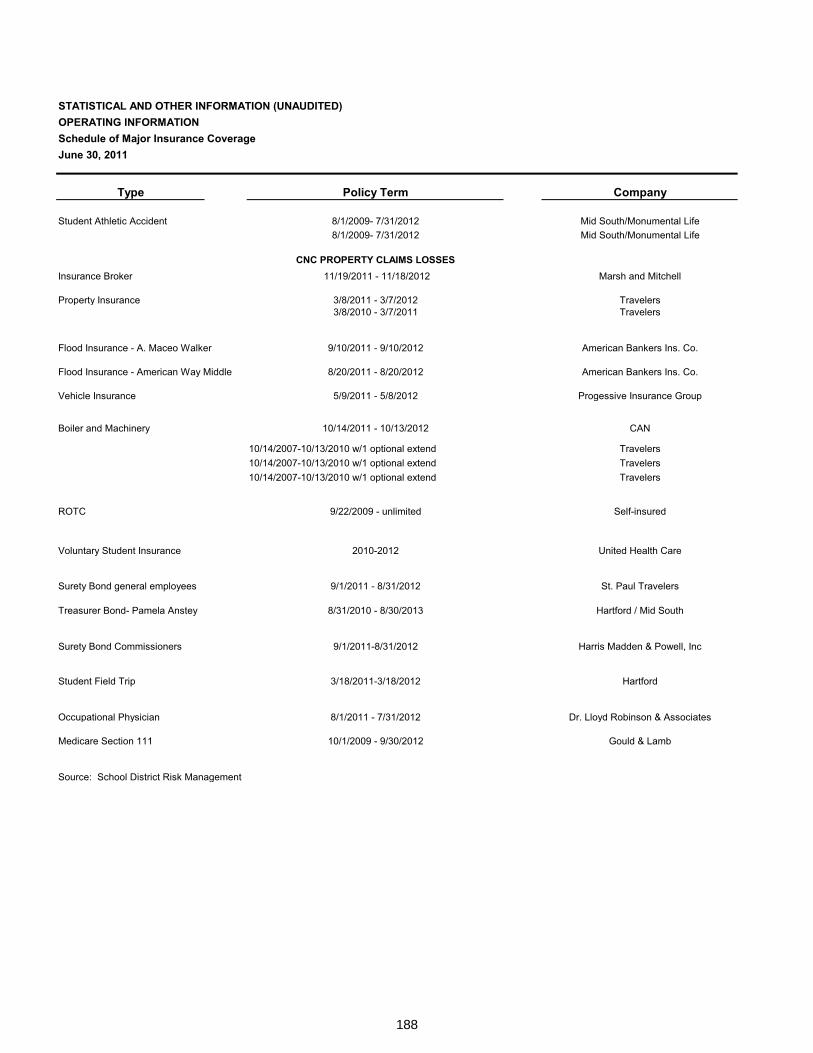
188
Schedule of Major Insurance Coverage
STATISTICAL AND OTHER INFORMATION (UNAUDITED)OPERATING INFORMATIONSchedule of Major Insurance CoverageJune 30, 2011
Type Policy Term Company
Student Athletic Accident 8/1/2009- 7/31/2012 Mid South/Monumental Life8/1/2009- 7/31/2012 Mid South/Monumental Life
CNC PROPERTY CLAIMS LOSSESInsurance Broker 11/19/2011 - 11/18/2012 Marsh and Mitchell
Property Insurance 3/8/2011 - 3/7/2012 Travelers3/8/2010 - 3/7/2011 Travelers
Flood Insurance - A. Maceo Walker 9/10/2011 - 9/10/2012 American Bankers Ins. Co.
Flood Insurance - American Way Middle 8/20/2011 - 8/20/2012 American Bankers Ins. Co.
Vehicle Insurance 5/9/2011 - 5/8/2012 Progessive Insurance Group
Boiler and Machinery 10/14/2011 - 10/13/2012 CAN
10/14/2007-10/13/2010 w/1 optional extend Travelers10/14/2007-10/13/2010 w/1 optional extend Travelers10/14/2007-10/13/2010 w/1 optional extend Travelers
ROTC 9/22/2009 - unlimited Self-insured
Voluntary Student Insurance 2010-2012 United Health Care
Surety Bond general employees 9/1/2011 - 8/31/2012 St. Paul Travelers
Treasurer Bond- Pamela Anstey 8/31/2010 - 8/30/2013 Hartford / Mid South
Surety Bond Commissioners 9/1/2011-8/31/2012 Harris Madden & Powell, Inc
Student Field Trip 3/18/2011-3/18/2012 Hartford
Occupational Physician 8/1/2011 - 7/31/2012 Dr. Lloyd Robinson & Associates
Medicare Section 111 10/1/2009 - 9/30/2012 Gould & Lamb
Source: School District Risk Management
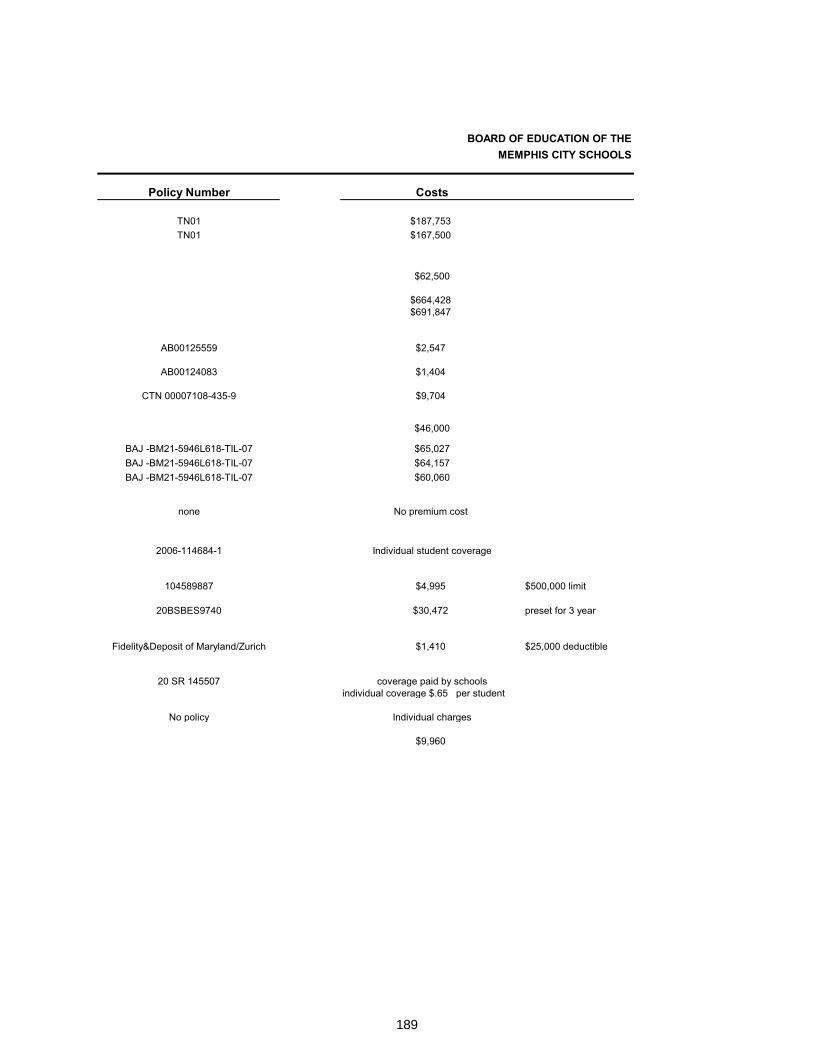
189
BOARD OF EDUCATION OF THE MEMPHIS CITY SCHOOLS
Policy Number Costs
TN01 $187,753TN01 $167,500
$62,500
$664,428$691,847
AB00125559 $2,547
AB00124083 $1,404
CTN 00007108-435-9 $9,704
$46,000
BAJ -BM21-5946L618-TIL-07 $65,027BAJ -BM21-5946L618-TIL-07 $64,157BAJ -BM21-5946L618-TIL-07 $60,060
none No premium cost
2006-114684-1 Individual student coverage
104589887 $4,995 $500,000 limit
20BSBES9740 $30,472 preset for 3 year
Fidelity&Deposit of Maryland/Zurich $1,410 $25,000 deductible
20 SR 145507 coverage paid by schoolsindividual coverage $.65 per student
No policy Individual charges
$9,960
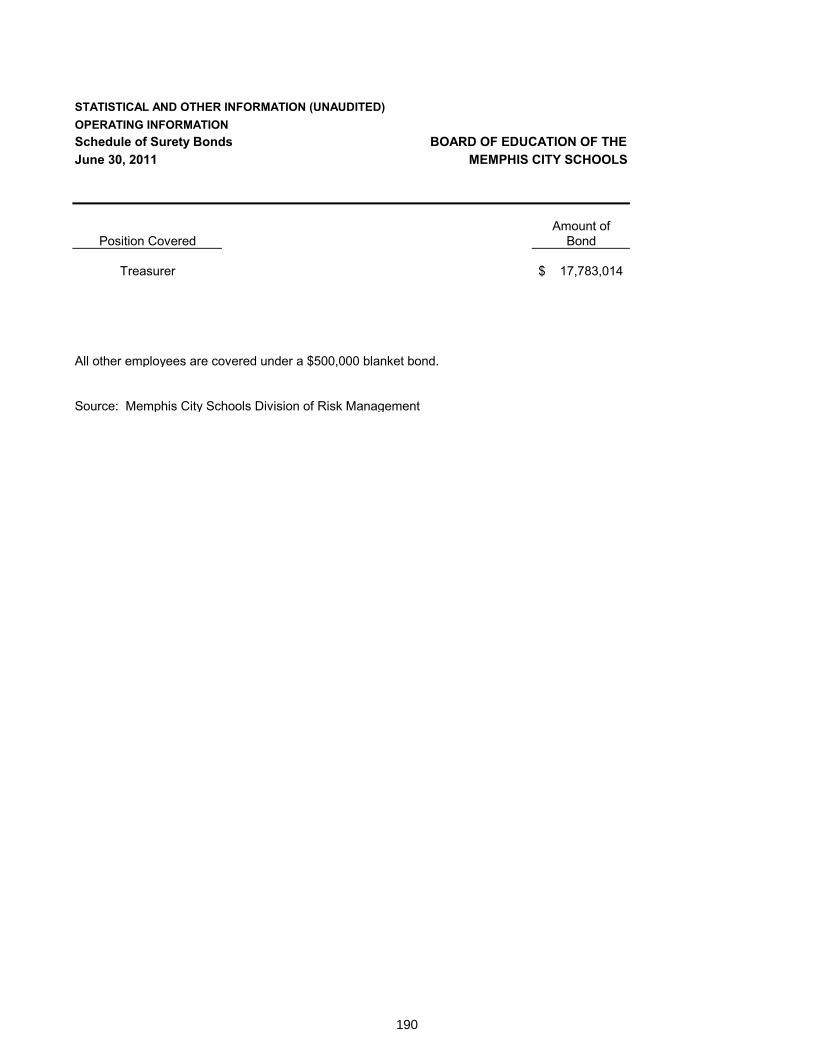
190
Schedule of Surety Bonds
STATISTICAL AND OTHER INFORMATION (UNAUDITED)OPERATING INFORMATIONSchedule of Surety Bonds BOARD OF EDUCATION OF THEJune 30, 2011 MEMPHIS CITY SCHOOLS
Amount ofPosition Covered Bond
Treasurer 17,783,014$
All other employees are covered under a $500,000 blanket bond.
Source: Memphis City Schools Division of Risk Management
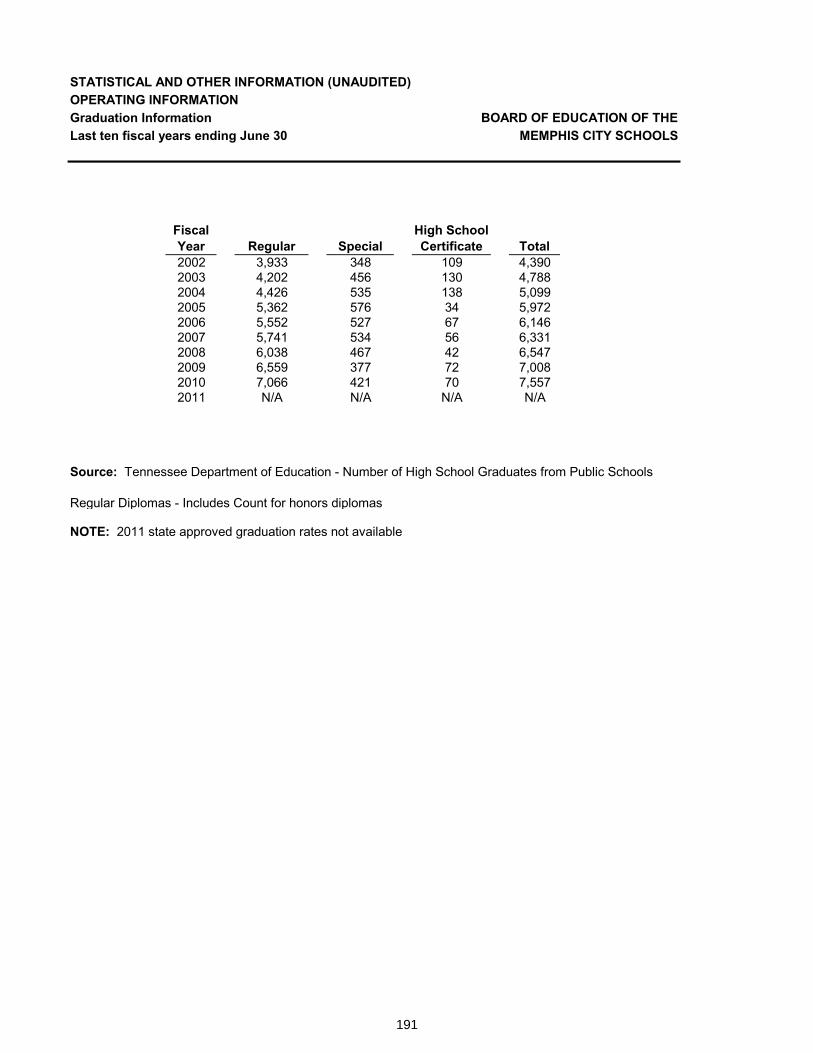
191
Graduation Information
STATISTICAL AND OTHER INFORMATION (UNAUDITED)OPERATING INFORMATIONGraduation Information BOARD OF EDUCATION OF THELast ten fiscal years ending June 30 MEMPHIS CITY SCHOOLS
Fiscal Year Regular Special
High School Certificate Total
2002 3,933 348 109 4,3902003 4,202 456 130 4,7882004 4,426 535 138 5,0992005 5,362 576 34 5,9722006 5,552 527 67 6,1462007 5,741 534 56 6,3312008 6,038 467 42 6,5472009 6,559 377 72 7,0082010 7,066 421 70 7,5572011 N/A N/A N/A N/A
Source: Tennessee Department of Education - Number of High School Graduates from Public Schools
Regular Diplomas - Includes Count for honors diplomas
NOTE: 2011 state approved graduation rates not available
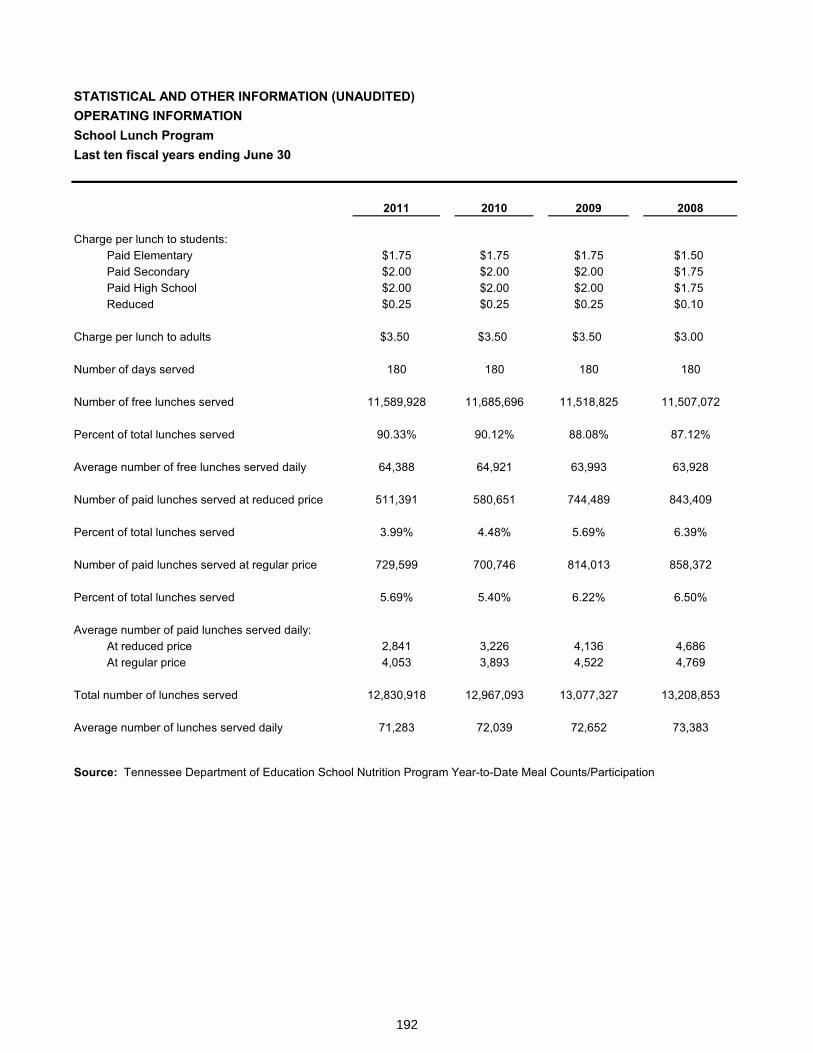
192
School Lunch Program
STATISTICAL AND OTHER INFORMATION (UNAUDITED)OPERATING INFORMATIONSchool Lunch ProgramLast ten fiscal years ending June 30
2011 2010 2009 2008
Charge per lunch to students:Paid Elementary $1.75 $1.75 $1.75 $1.50Paid Secondary $2.00 $2.00 $2.00 $1.75Paid High School $2.00 $2.00 $2.00 $1.75Reduced $0.25 $0.25 $0.25 $0.10
Charge per lunch to adults $3.50 $3.50 $3.50 $3.00
Number of days served 180 180 180 180
Number of free lunches served 11,589,928 11,685,696 11,518,825 11,507,072
Percent of total lunches served 90.33% 90.12% 88.08% 87.12%
Average number of free lunches served daily 64,388 64,921 63,993 63,928
Number of paid lunches served at reduced price 511,391 580,651 744,489 843,409
Percent of total lunches served 3.99% 4.48% 5.69% 6.39%
Number of paid lunches served at regular price 729,599 700,746 814,013 858,372
Percent of total lunches served 5.69% 5.40% 6.22% 6.50%
Average number of paid lunches served daily:At reduced price 2,841 3,226 4,136 4,686At regular price 4,053 3,893 4,522 4,769
Total number of lunches served 12,830,918 12,967,093 13,077,327 13,208,853
Average number of lunches served daily 71,283 72,039 72,652 73,383
Source: Tennessee Department of Education School Nutrition Program Year-to-Date Meal Counts/Participation
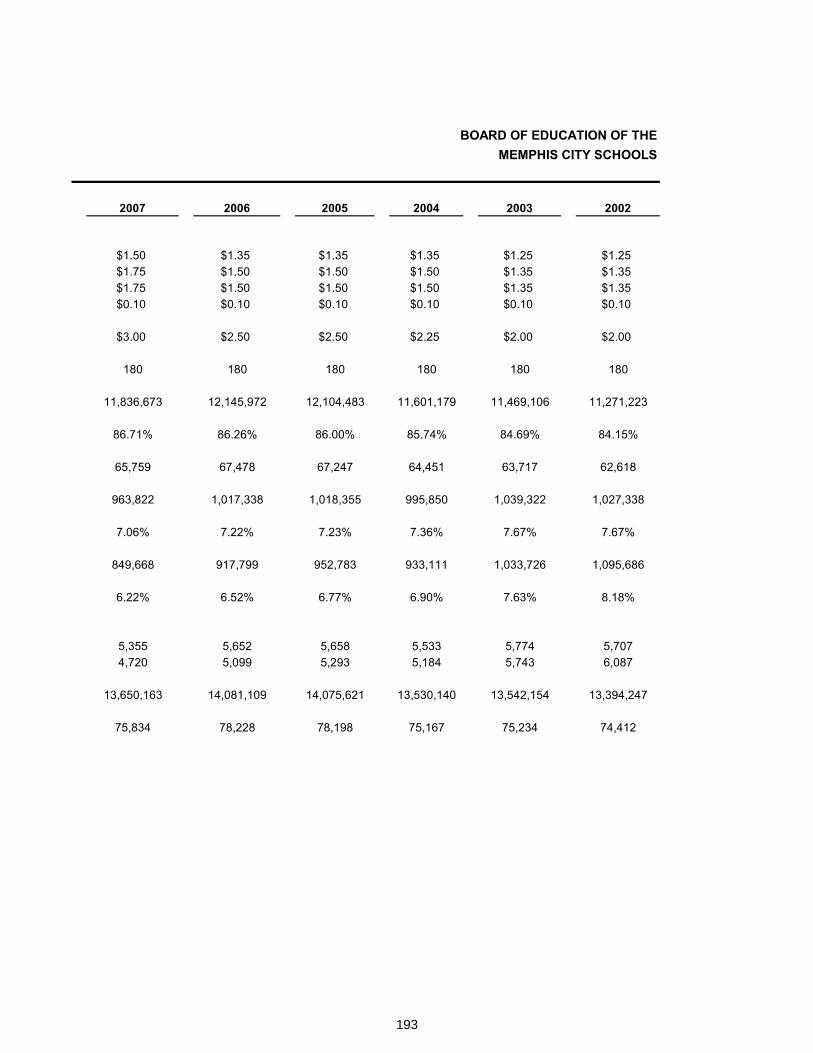
193
BOARD OF EDUCATION OF THE MEMPHIS CITY SCHOOLS
2007 2006 2005 2004 2003 2002
$1.50 $1.35 $1.35 $1.35 $1.25 $1.25$1.75 $1.50 $1.50 $1.50 $1.35 $1.35$1.75 $1.50 $1.50 $1.50 $1.35 $1.35$0.10 $0.10 $0.10 $0.10 $0.10 $0.10
$3.00 $2.50 $2.50 $2.25 $2.00 $2.00
180 180 180 180 180 180
11,836,673 12,145,972 12,104,483 11,601,179 11,469,106 11,271,223
86.71% 86.26% 86.00% 85.74% 84.69% 84.15%
65,759 67,478 67,247 64,451 63,717 62,618
963,822 1,017,338 1,018,355 995,850 1,039,322 1,027,338
7.06% 7.22% 7.23% 7.36% 7.67% 7.67%
849,668 917,799 952,783 933,111 1,033,726 1,095,686
6.22% 6.52% 6.77% 6.90% 7.63% 8.18%
5,355 5,652 5,658 5,533 5,774 5,7074,720 5,099 5,293 5,184 5,743 6,087
13,650,163 14,081,109 14,075,621 13,530,140 13,542,154 13,394,247
75,834 78,228 78,198 75,167 75,234 74,412
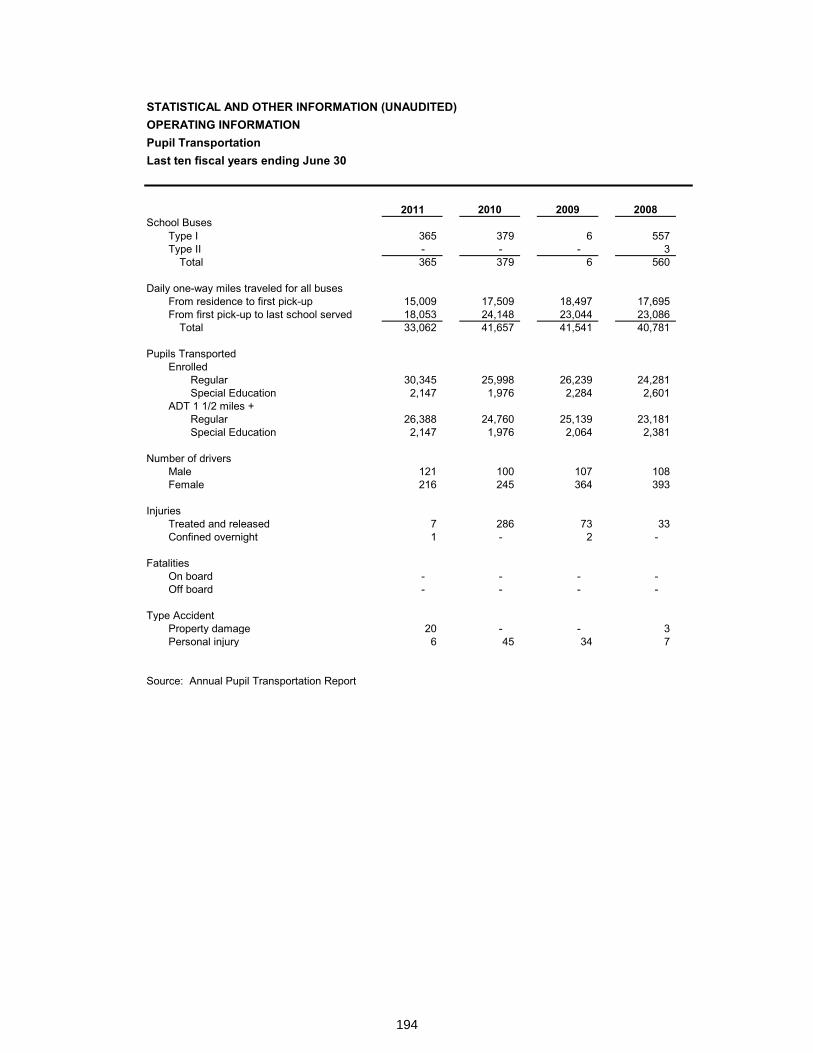
194
Pupil Transportation
STATISTICAL AND OTHER INFORMATION (UNAUDITED)OPERATING INFORMATIONPupil TransportationLast ten fiscal years ending June 30
2011 2010 2009 2008School Buses
Type I 365 379 6 557 Type II - - - 3
Total 365 379 6 560
Daily one-way miles traveled for all busesFrom residence to first pick-up 15,009 17,509 18,497 17,695 From first pick-up to last school served 18,053 24,148 23,044 23,086
Total 33,062 41,657 41,541 40,781
Pupils TransportedEnrolled
Regular 30,345 25,998 26,239 24,281 Special Education 2,147 1,976 2,284 2,601
ADT 1 1/2 miles +Regular 26,388 24,760 25,139 23,181 Special Education 2,147 1,976 2,064 2,381
Number of driversMale 121 100 107 108 Female 216 245 364 393
InjuriesTreated and released 7 286 73 33 Confined overnight 1 - 2 -
FatalitiesOn board - - - - Off board - - - -
Type AccidentProperty damage 20 - - 3 Personal injury 6 45 34 7
Source: Annual Pupil Transportation Report
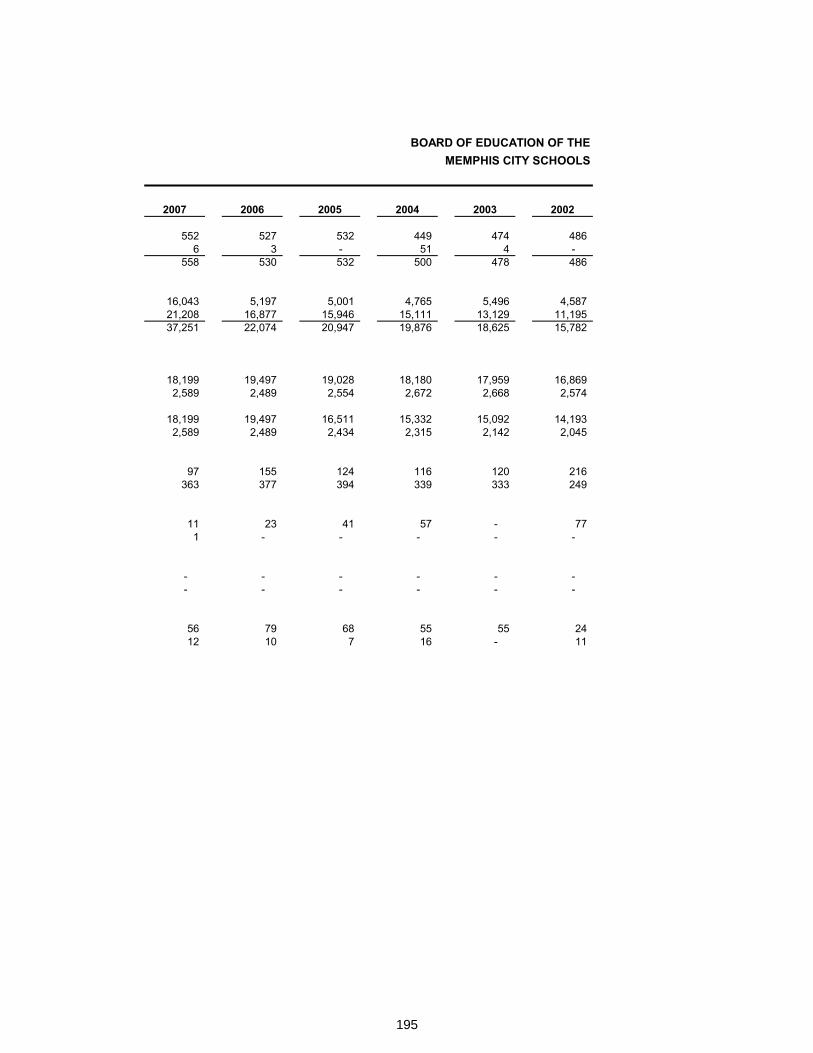
195
BOARD OF EDUCATION OF THE MEMPHIS CITY SCHOOLS
2007 2006 2005 2004 2003 2002
552 527 532 449 474 486 6 3 - 51 4 -
558 530 532 500 478 486
16,043 5,197 5,001 4,765 5,496 4,587 21,208 16,877 15,946 15,111 13,129 11,195 37,251 22,074 20,947 19,876 18,625 15,782
18,199 19,497 19,028 18,180 17,959 16,869 2,589 2,489 2,554 2,672 2,668 2,574
18,199 19,497 16,511 15,332 15,092 14,193 2,589 2,489 2,434 2,315 2,142 2,045
97 155 124 116 120 216 363 377 394 339 333 249
11 23 41 57 - 77 1 - - - - -
- - - - - - - - - - - -
56 79 68 55 55 24 12 10 7 16 - 11

196
This page left intentionally blank

197
STATUTORY REPORTING SECTION
Statutory Reporting Section

198
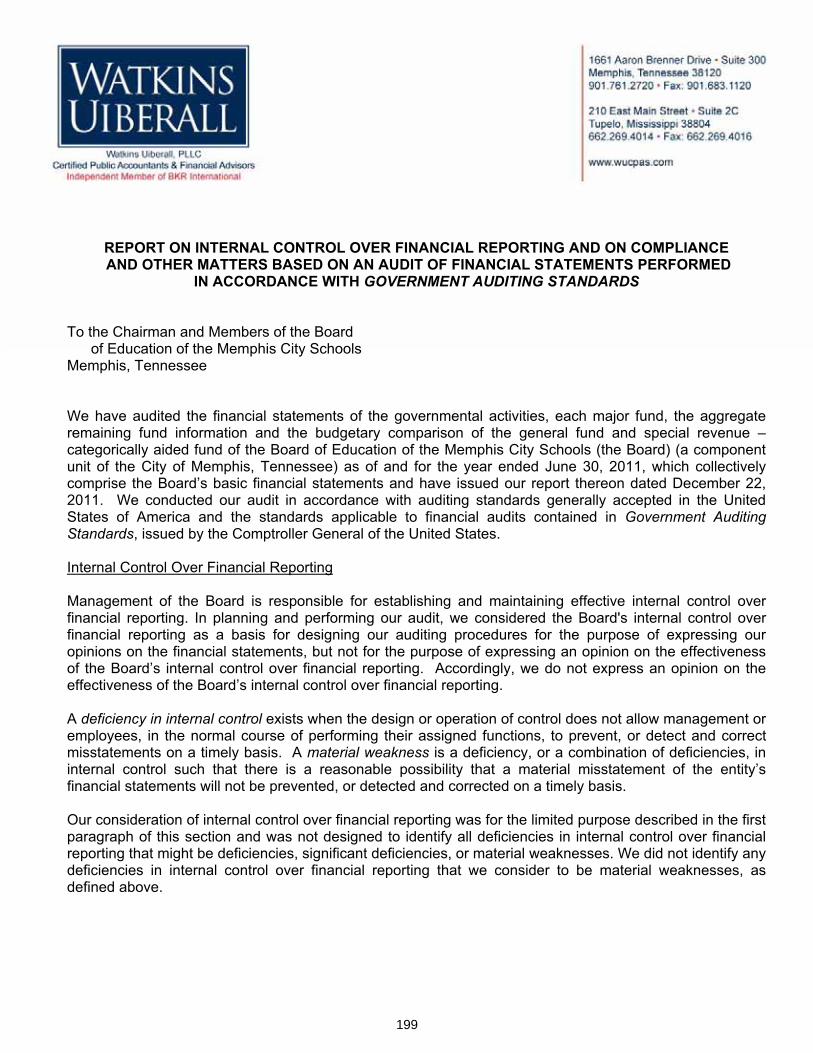
199
Independent Auditors Report on Internal Control over Financial Reporting and on Compliance and Other Matters
REPORT ON INTERNAL CONTROL OVER FINANCIAL REPORTING AND ON COMPLIANCE AND OTHER MATTERS BASED ON AN AUDIT OF FINANCIAL STATEMENTS PERFORMED
IN ACCORDANCE WITH GOVERNMENT AUDITING STANDARDS
To the Chairman and Members of the Board of Education of the Memphis City Schools Memphis, Tennessee
We have audited the financial statements of the governmental activities, each major fund, the aggregate remaining fund information and the budgetary comparison of the general fund and special revenue – categorically aided fund of the Board of Education of the Memphis City Schools (the Board) (a component unit of the City of Memphis, Tennessee) as of and for the year ended June 30, 2011, which collectively comprise the Board’s basic financial statements and have issued our report thereon dated December 22, 2011. We conducted our audit in accordance with auditing standards generally accepted in the United States of America and the standards applicable to financial audits contained in Government Auditing Standards, issued by the Comptroller General of the United States.
Internal Control Over Financial Reporting
Management of the Board is responsible for establishing and maintaining effective internal control over financial reporting. In planning and performing our audit, we considered the Board's internal control over financial reporting as a basis for designing our auditing procedures for the purpose of expressing our opinions on the financial statements, but not for the purpose of expressing an opinion on the effectiveness of the Board’s internal control over financial reporting. Accordingly, we do not express an opinion on the effectiveness of the Board’s internal control over financial reporting.
A deficiency in internal control exists when the design or operation of control does not allow management or employees, in the normal course of performing their assigned functions, to prevent, or detect and correct misstatements on a timely basis. A material weakness is a deficiency, or a combination of deficiencies, in internal control such that there is a reasonable possibility that a material misstatement of the entity’s financial statements will not be prevented, or detected and corrected on a timely basis.
Our consideration of internal control over financial reporting was for the limited purpose described in the first paragraph of this section and was not designed to identify all deficiencies in internal control over financial reporting that might be deficiencies, significant deficiencies, or material weaknesses. We did not identify any deficiencies in internal control over financial reporting that we consider to be material weaknesses, as defined above.
200
Compliance and Other Matters
As part of obtaining reasonable assurance about whether the Board’s financial statements are free of material misstatement, we performed tests of its compliance with certain provisions of laws, regulations, contracts, and grant agreements, noncompliance with which could have a direct and material effect on the determination of financial statement amounts. However, providing an opinion on compliance with those provisions was not an objective of our audit, and accordingly, we do not express such an opinion. The results of our tests disclosed no instances of noncompliance or other matters that are required to be reported under Government Auditing Standards.
This report is intended solely for the information and use of the Chairman and Members of the Board, management, others within the organization, the State of Tennessee, and federal awarding agencies and pass-through entities and is not intended to be and should not be used by anyone other than these specified parties.
Memphis, Tennessee December 22, 2011
�
specified parties.
Memphis Tennessee

201
This page left intentionally blank
202
Independent Auditor's Report on Compliance with Requirements applicable to each Major Program and on Internal Control over Compliance in Accordance with OMB Circular A-133
INDEPENDENT AUDITOR’S REPORT ON COMPLIANCE WITH REQUIREMENTS THAT COULD HAVE A DIRECT AND MATERIAL EFFECT ON EACH MAJOR PROGRAM AND ON INTERNAL CONTROL
OVER COMPLIANCE IN ACCORDANCE WITH OMB CIRCULAR A-133
To the Chairman and Members of the Board of Education of the Memphis City Schools Memphis, Tennessee
Compliance
We have audited the compliance of the Board of Education of the Memphis City Schools (the Board) (a component unit of the City of Memphis, Tennessee) with the types of compliance requirements described in the OMB Circular A-133 Compliance Supplement that could have a direct and material effect on each of the Board’s major federal programs for the year ended June 30, 2011. The Board's major federal programs are identified in the summary of auditor’s results section of the accompanying schedule of findings and questioned costs. Compliance with the requirements of laws, regulations, contracts and grants applicable to each of its major federal programs is the responsibility of the Board's management. Our responsibility is to express an opinion on the Board's compliance based on our audit.
We conducted our audit of compliance in accordance with auditing standards generally accepted in the United States of America; the standards applicable to financial audits contained in Government Auditing Standards, issued by the Comptroller General of the United States; and OMB Circular A-133, Audits of States, Local Governments, and Non-Profit Organizations. Those standards and OMB Circular A-133 require that we plan and perform the audit to obtain reasonable assurance about whether noncompliance with the types of compliance requirements referred to above that could have a direct and material effect on a major federal program occurred. An audit includes examining, on a test basis, evidence about the Board's compliance with those requirements and performing such other procedures as we considered necessary in the circumstances. We believe that our audit provides a reasonable basis for our opinion. Our audit does not provide a legal determination of the Board's compliance with those requirements.
In our opinion, the Board complied, in all material respects, with the compliance requirements referred to above that could have a direct and material effect on each of its major federal programs for the year ended June 30, 2011.
Internal Control Over Compliance
Management of the Board is responsible for establishing and maintaining effective internal control over compliance with requirements of laws, regulations, contracts, and grants applicable to federal programs. In planning and performing our audit, we considered the Board's internal control over compliance with the requirements that could have a direct and material effect on a major federal program to determine the
203
auditing procedures for the purpose of expressing our opinion on compliance and to test and report on internal control over compliance in accordance with OMB Circular A-133, but not for the purpose of expressing an opinion on the effectiveness of internal control over compliance. Accordingly, we do not express an opinion on the effectiveness of the Board’s internal control over compliance.
A deficiency in internal control over compliance exists when the design or operation of a control over compliance does not allow management or employees, in the normal course of performing their assigned functions, to prevent, or detect and correct, noncompliance with a type of compliance requirement of a federal program on a timely basis. A material weakness in internal control over compliance is a deficiency, or a combination of deficiencies, in internal control such that there is a reasonable possibility that material noncompliance with a type of compliance requirement of a federal program will not be prevented, or detected and corrected, on a timely basis.
Our consideration of internal control over compliance was for the limited purpose described in the first paragraph of this section and was not designed to identify all deficiencies in internal control over compliance that might be deficiencies, significant deficiencies, or material weaknesses. We did not identify any deficiencies in internal control over compliance that we consider to be material weaknesses, as defined above.
This report is intended solely for the information and use of the Chairman and Members of the Board, management, others within the organization, the State of Tennessee, and federal awarding agencies and pass-through entities and is not intended to be and should not be used by anyone other than these specified parties.
Memphis, Tennessee December 22, 2011 ��������
specified parties.
Memphis Tennessee
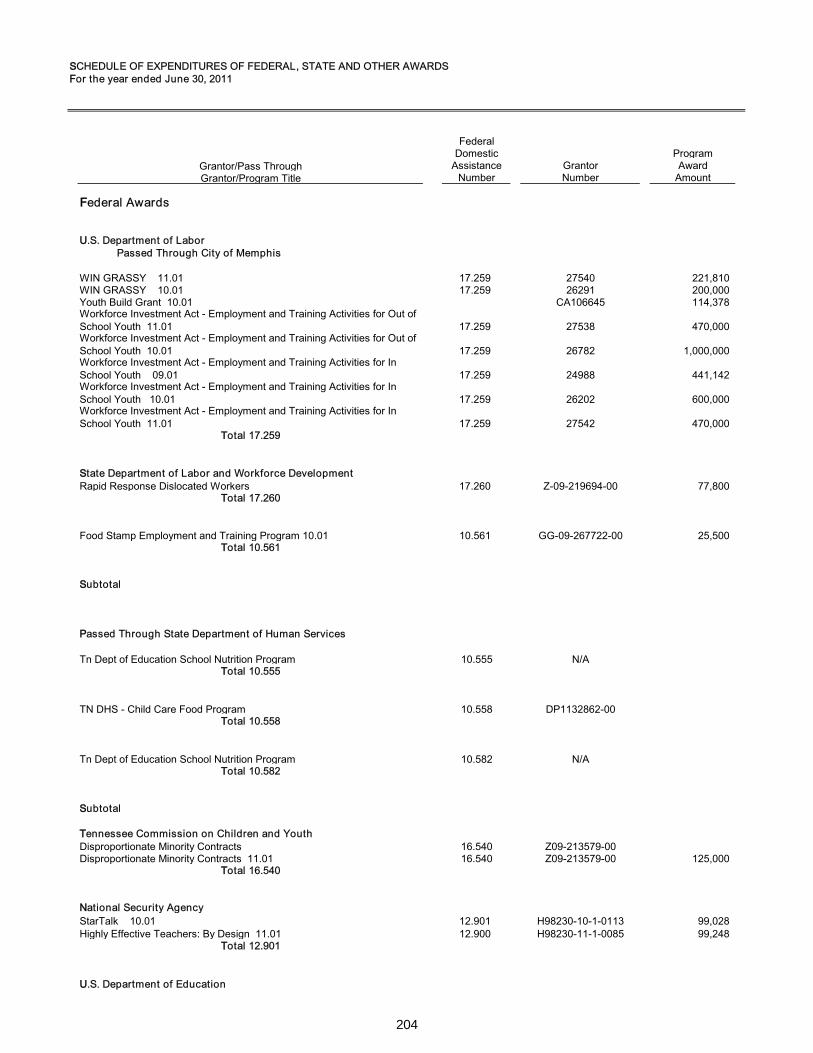
204
Schedule of Expenditures of Federal, State and Other AwardsSSCHEDULE OF EXPENDITURES OF FEDERAL, STATE AND OTHER AWARDSFFor the year ended June 30, 2011
FederalDomestic Program
Grantor/Pass Through Assistance Grantor AwardGrantor/Program Title Number Number Amount
FFederal Awards
UU.S. Department of Labor Passed Through City of Memphis
WIN GRASSY 11.01 17.259 27540 221,810WIN GRASSY 10.01 17.259 26291 200,000Youth Build Grant 10.01 CA106645 114,378Workforce Investment Act - Employment and Training Activities for Out of School Youth 11.01 17.259 27538 470,000Workforce Investment Act - Employment and Training Activities for Out of School Youth 10.01 17.259 26782 1,000,000Workforce Investment Act - Employment and Training Activities for In School Youth 09.01 17.259 24988 441,142Workforce Investment Act - Employment and Training Activities for In School Youth 10.01 17.259 26202 600,000Workforce Investment Act - Employment and Training Activities for In School Youth 11.01 17.259 27542 470,000
TTotal 17.259
SState Department of Labor and Workforce DevelopmentRapid Response Dislocated Workers 17.260 Z-09-219694-00 77,800
TTotal 17.260
Food Stamp Employment and Training Program 10.01 10.561 GG-09-267722-00 25,500TTotal 10.561
SSubtotal
PPassed Through State Department of Human Services
Tn Dept of Education School Nutrition Program 10.555 N/ATTotal 10.555
TN DHS - Child Care Food Program 10.558 DP1132862-00TTotal 10.558
Tn Dept of Education School Nutrition Program 10.582 N/ATTotal 10.582
SSubtotal
TTennessee Commission on Children and YouthDisproportionate Minority Contracts 16.540 Z09-213579-00Disproportionate Minority Contracts 11.01 16.540 Z09-213579-00 125,000
TTotal 16.540
NNational Security AgencyStarTalk 10.01 12.901 H98230-10-1-0113 99,028Highly Effective Teachers: By Design 11.01 12.900 H98230-11-1-0085 99,248
TTotal 12.901
UU.S. Department of Education
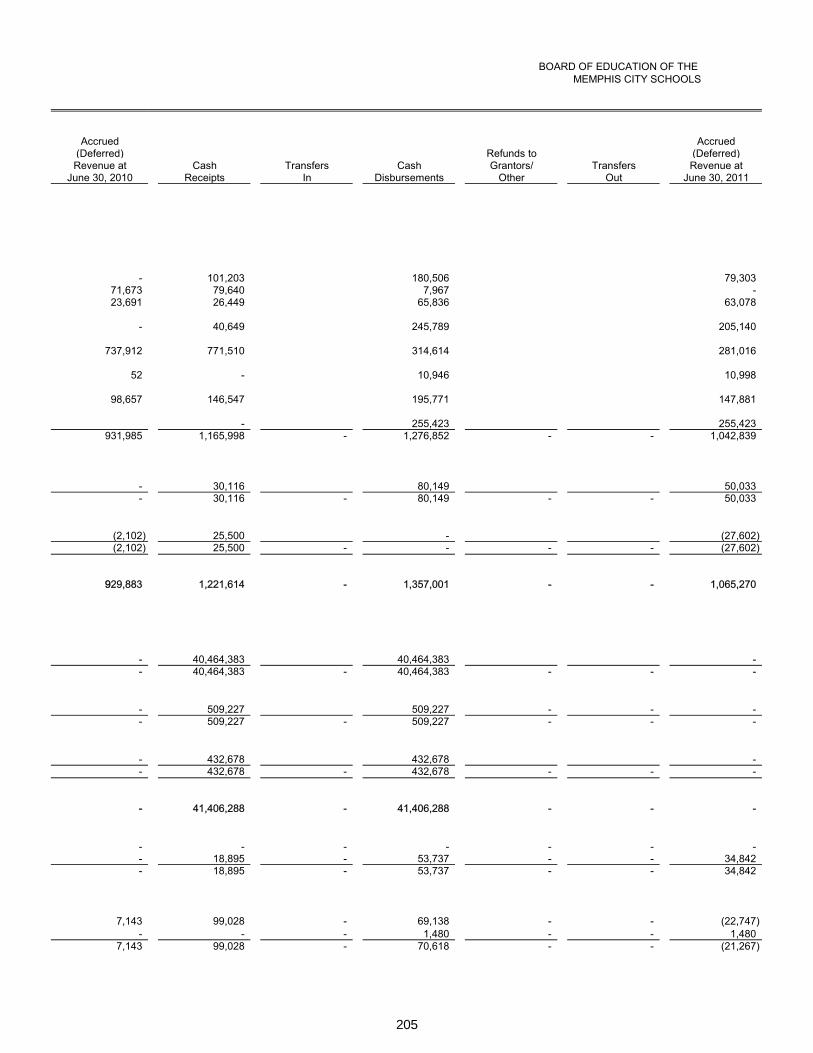
205
BOARD OF EDUCATION OF THE MEMPHIS CITY SCHOOLS
Accrued Accrued(Deferred) Refunds to (Deferred)Revenue at Cash Transfers Cash Grantors/ Transfers Revenue at
June 30, 2010 Receipts In Disbursements Other Out June 30, 2011
- 101,203 180,506 79,30371,673 79,640 7,967 -23,691 26,449 65,836 63,078
- 40,649 245,789 205,140
737,912 771,510 314,614 281,016
52 - 10,946 10,998
98,657 146,547 195,771 147,881
- 255,423 255,423931,985 1,165,998 - 1,276,852 - - 1,042,839
- 30,116 80,149 50,033- 30,116 - 80,149 - - 50,033
(2,102) 25,500 - (27,602)(2,102) 25,500 - - - - (27,602)
9929,883 1,221,614 - 1,357,001 - - 1,065,270
- 40,464,383 40,464,383 -- 40,464,383 - 40,464,383 - - -
- 509,227 509,227 - - -- 509,227 - 509,227 - - -
- 432,678 432,678 -- 432,678 - 432,678 - - -
-- 41,406,288 - 41,406,288 - - -
- - - - - - -- 18,895 - 53,737 - - 34,842- 18,895 - 53,737 - - 34,842
7,143 99,028 - 69,138 - - (22,747)- - - 1,480 - - 1,480
7,143 99,028 - 70,618 - - (21,267)
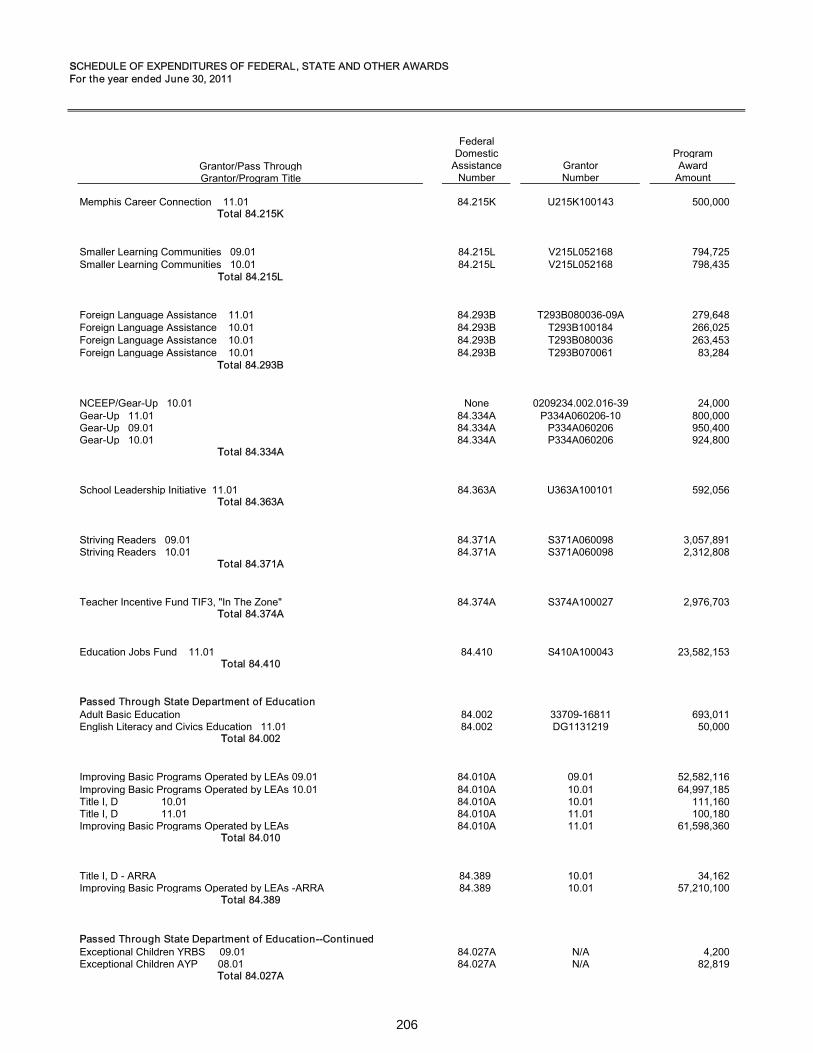
206
SSCHEDULE OF EXPENDITURES OF FEDERAL, STATE AND OTHER AWARDSFFor the year ended June 30, 2011
FederalDomestic Program
Grantor/Pass Through Assistance Grantor AwardGrantor/Program Title Number Number Amount
Memphis Career Connection 11.01 84.215K U215K100143 500,000TTotal 84.215K
Smaller Learning Communities 09.01 84.215L V215L052168 794,725Smaller Learning Communities 10.01 84.215L V215L052168 798,435
TTotal 84.215L
Foreign Language Assistance 11.01 84.293B T293B080036-09A 279,648Foreign Language Assistance 10.01 84.293B T293B100184 266,025Foreign Language Assistance 10.01 84.293B T293B080036 263,453Foreign Language Assistance 10.01 84.293B T293B070061 83,284
TTotal 84.293B
NCEEP/Gear-Up 10.01 None 0209234.002.016-39 24,000Gear-Up 11.01 84.334A P334A060206-10 800,000Gear-Up 09.01 84.334A P334A060206 950,400Gear-Up 10.01 84.334A P334A060206 924,800
TTotal 84.334A
School Leadership Initiative 11.01 84.363A U363A100101 592,056TTotal 84.363A
Striving Readers 09.01 84.371A S371A060098 3,057,891Striving Readers 10.01 84.371A S371A060098 2,312,808
TTotal 84.371A
Teacher Incentive Fund TIF3, "In The Zone" 84.374A S374A100027 2,976,703TTotal 84.374A
Education Jobs Fund 11.01 84.410 S410A100043 23,582,153TTotal 84.410
PPassed Through State Department of EducationAdult Basic Education 84.002 33709-16811 693,011English Literacy and Civics Education 11.01 84.002 DG1131219 50,000
TTotal 84.002
Improving Basic Programs Operated by LEAs 09.01 84.010A 09.01 52,582,116Improving Basic Programs Operated by LEAs 10.01 84.010A 10.01 64,997,185Title I, D 10.01 84.010A 10.01 111,160Title I, D 11.01 84.010A 11.01 100,180Improving Basic Programs Operated by LEAs 84.010A 11.01 61,598,360
TTotal 84.010
Title I, D - ARRA 84.389 10.01 34,162Improving Basic Programs Operated by LEAs -ARRA 84.389 10.01 57,210,100
TTotal 84.389
PPassed Through State Department of Education--ContinuedExceptional Children YRBS 09.01 84.027A N/A 4,200Exceptional Children AYP 08.01 84.027A N/A 82,819
TTotal 84.027A
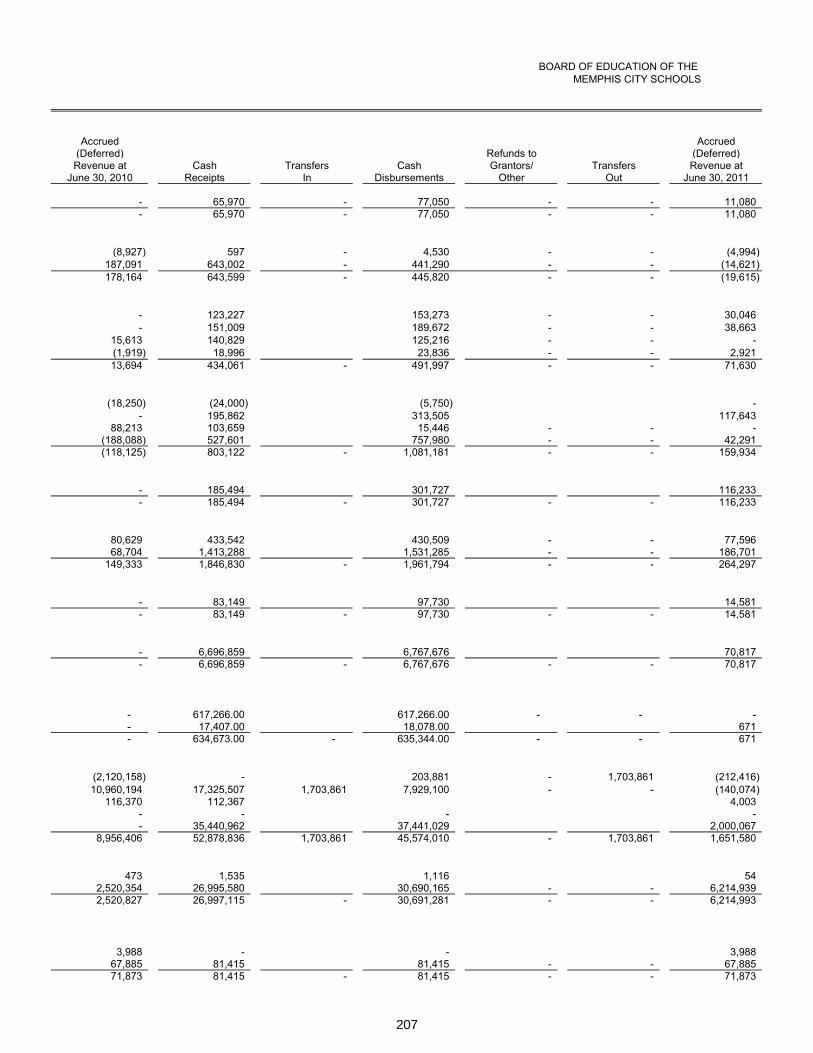
207
BOARD OF EDUCATION OF THE MEMPHIS CITY SCHOOLS
Accrued Accrued(Deferred) Refunds to (Deferred)Revenue at Cash Transfers Cash Grantors/ Transfers Revenue at
June 30, 2010 Receipts In Disbursements Other Out June 30, 2011
- 65,970 - 77,050 - - 11,080- 65,970 - 77,050 - - 11,080
(8,927) 597 - 4,530 - - (4,994)187,091 643,002 - 441,290 - - (14,621)178,164 643,599 - 445,820 - - (19,615)
- 123,227 153,273 - - 30,046- 151,009 189,672 - - 38,663
15,613 140,829 125,216 - - -(1,919) 18,996 23,836 - - 2,92113,694 434,061 - 491,997 - - 71,630
(18,250) (24,000) (5,750) -- 195,862 313,505 117,643
88,213 103,659 15,446 - - -(188,088) 527,601 757,980 - - 42,291(118,125) 803,122 - 1,081,181 - - 159,934
- 185,494 301,727 116,233- 185,494 - 301,727 - - 116,233
80,629 433,542 430,509 - - 77,59668,704 1,413,288 1,531,285 - - 186,701
149,333 1,846,830 - 1,961,794 - - 264,297
- 83,149 97,730 14,581- 83,149 - 97,730 - - 14,581
- 6,696,859 6,767,676 70,817- 6,696,859 - 6,767,676 - - 70,817
- 617,266.00 617,266.00 - - -- 17,407.00 18,078.00 671- 634,673.00 - 635,344.00 - - 671
(2,120,158) - 203,881 - 1,703,861 (212,416)10,960,194 17,325,507 1,703,861 7,929,100 - - (140,074)
116,370 112,367 4,003- - - -- 35,440,962 37,441,029 2,000,067
8,956,406 52,878,836 1,703,861 45,574,010 - 1,703,861 1,651,580
473 1,535 1,116 542,520,354 26,995,580 30,690,165 - - 6,214,9392,520,827 26,997,115 - 30,691,281 - - 6,214,993
3,988 - - 3,98867,885 81,415 81,415 - - 67,88571,873 81,415 - 81,415 - - 71,873
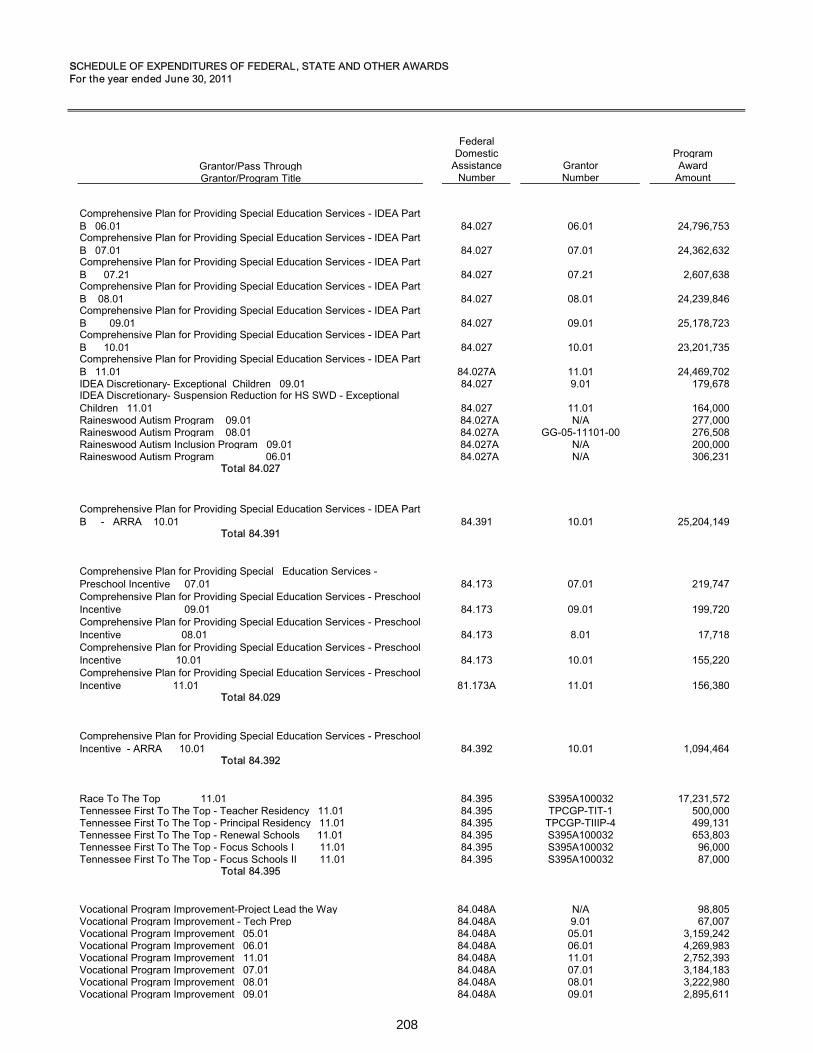
208
SSCHEDULE OF EXPENDITURES OF FEDERAL, STATE AND OTHER AWARDSFFor the year ended June 30, 2011
FederalDomestic Program
Grantor/Pass Through Assistance Grantor AwardGrantor/Program Title Number Number Amount
Comprehensive Plan for Providing Special Education Services - IDEA Part B 06.01 84.027 06.01 24,796,753Comprehensive Plan for Providing Special Education Services - IDEA Part B 07.01 84.027 07.01 24,362,632Comprehensive Plan for Providing Special Education Services - IDEA Part B 07.21 84.027 07.21 2,607,638Comprehensive Plan for Providing Special Education Services - IDEA Part B 08.01 84.027 08.01 24,239,846Comprehensive Plan for Providing Special Education Services - IDEA Part B 09.01 84.027 09.01 25,178,723Comprehensive Plan for Providing Special Education Services - IDEA Part B 10.01 84.027 10.01 23,201,735Comprehensive Plan for Providing Special Education Services - IDEA Part B 11.01 84.027A 11.01 24,469,702IDEA Discretionary- Exceptional Children 09.01 84.027 9.01 179,678IDEA Discretionary- Suspension Reduction for HS SWD - Exceptional Children 11.01 84.027 11.01 164,000Raineswood Autism Program 09.01 84.027A N/A 277,000Raineswood Autism Program 08.01 84.027A GG-05-11101-00 276,508Raineswood Autism Inclusion Program 09.01 84.027A N/A 200,000Raineswood Autism Program 06.01 84.027A N/A 306,231
TTotal 84.027
Comprehensive Plan for Providing Special Education Services - IDEA Part B - ARRA 10.01 84.391 10.01 25,204,149
TTotal 84.391
Comprehensive Plan for Providing Special Education Services - Preschool Incentive 07.01 84.173 07.01 219,747Comprehensive Plan for Providing Special Education Services - Preschool Incentive 09.01 84.173 09.01 199,720Comprehensive Plan for Providing Special Education Services - Preschool Incentive 08.01 84.173 8.01 17,718Comprehensive Plan for Providing Special Education Services - Preschool Incentive 10.01 84.173 10.01 155,220Comprehensive Plan for Providing Special Education Services - Preschool Incentive 11.01 81.173A 11.01 156,380
TTotal 84.029
Comprehensive Plan for Providing Special Education Services - Preschool Incentive - ARRA 10.01 84.392 10.01 1,094,464
TTotal 84.392
Race To The Top 11.01 84.395 S395A100032 17,231,572Tennessee First To The Top - Teacher Residency 11.01 84.395 TPCGP-TIT-1 500,000Tennessee First To The Top - Principal Residency 11.01 84.395 TPCGP-TIIIP-4 499,131Tennessee First To The Top - Renewal Schools 11.01 84.395 S395A100032 653,803Tennessee First To The Top - Focus Schools I 11.01 84.395 S395A100032 96,000Tennessee First To The Top - Focus Schools II 11.01 84.395 S395A100032 87,000
TTotal 84.395
Vocational Program Improvement-Project Lead the Way 84.048A N/A 98,805Vocational Program Improvement - Tech Prep 84.048A 9.01 67,007Vocational Program Improvement 05.01 84.048A 05.01 3,159,242Vocational Program Improvement 06.01 84.048A 06.01 4,269,983Vocational Program Improvement 11.01 84.048A 11.01 2,752,393Vocational Program Improvement 07.01 84.048A 07.01 3,184,183Vocational Program Improvement 08.01 84.048A 08.01 3,222,980Vocational Program Improvement 09.01 84.048A 09.01 2,895,611
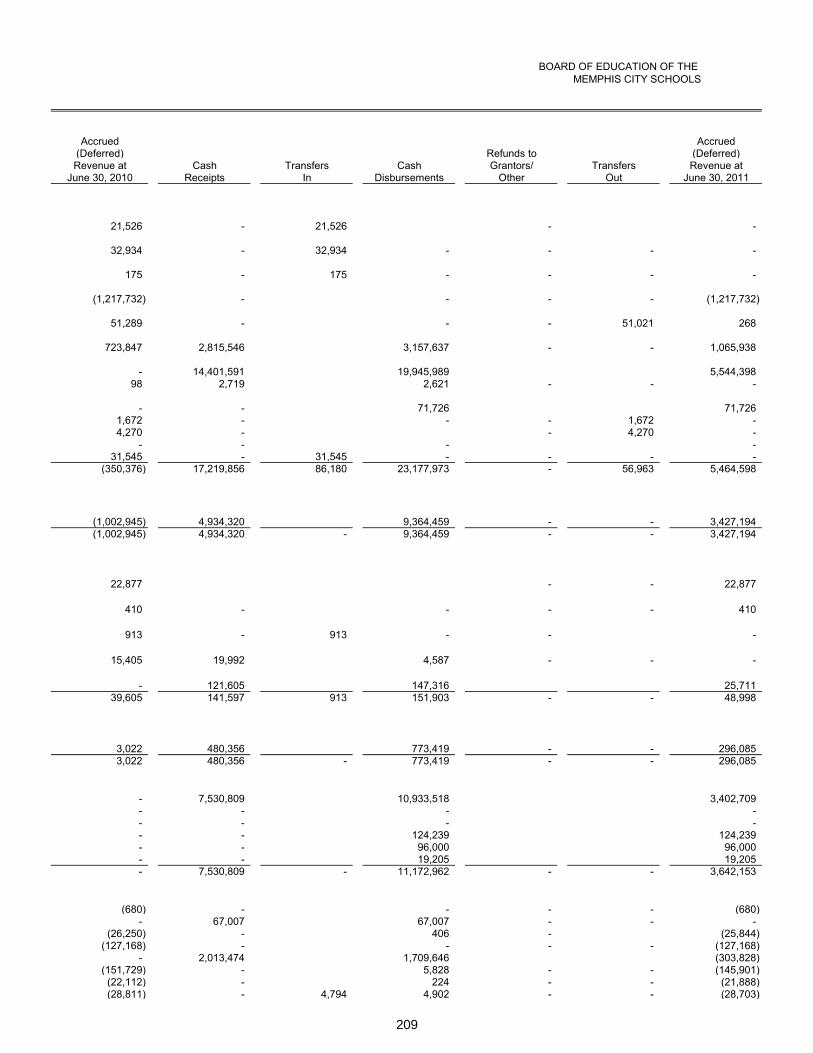
209
BOARD OF EDUCATION OF THE MEMPHIS CITY SCHOOLS
Accrued Accrued(Deferred) Refunds to (Deferred)Revenue at Cash Transfers Cash Grantors/ Transfers Revenue at
June 30, 2010 Receipts In Disbursements Other Out June 30, 2011
21,526 - 21,526 - -
32,934 - 32,934 - - - -
175 - 175 - - - -
(1,217,732) - - - - (1,217,732)
51,289 - - - 51,021 268
723,847 2,815,546 3,157,637 - - 1,065,938
- 14,401,591 19,945,989 5,544,39898 2,719 2,621 - - -
- - 71,726 71,7261,672 - - - 1,672 -4,270 - - 4,270 -
- - - -31,545 - 31,545 - - - -
(350,376) 17,219,856 86,180 23,177,973 - 56,963 5,464,598
(1,002,945) 4,934,320 9,364,459 - - 3,427,194(1,002,945) 4,934,320 - 9,364,459 - - 3,427,194
22,877 - - 22,877
410 - - - - 410
913 - 913 - - -
15,405 19,992 4,587 - - -
- 121,605 147,316 25,71139,605 141,597 913 151,903 - - 48,998
3,022 480,356 773,419 - - 296,0853,022 480,356 - 773,419 - - 296,085
- 7,530,809 10,933,518 3,402,709- - - -- - - -- - 124,239 124,239- - 96,000 96,000- - 19,205 19,205- 7,530,809 - 11,172,962 - - 3,642,153
(680) - - - - (680)- 67,007 67,007 - - -
(26,250) - 406 - (25,844)(127,168) - - - - (127,168)
- 2,013,474 1,709,646 (303,828)(151,729) - 5,828 - - (145,901)(22,112) - 224 - - (21,888)(28,811) - 4,794 4,902 - - (28,703)
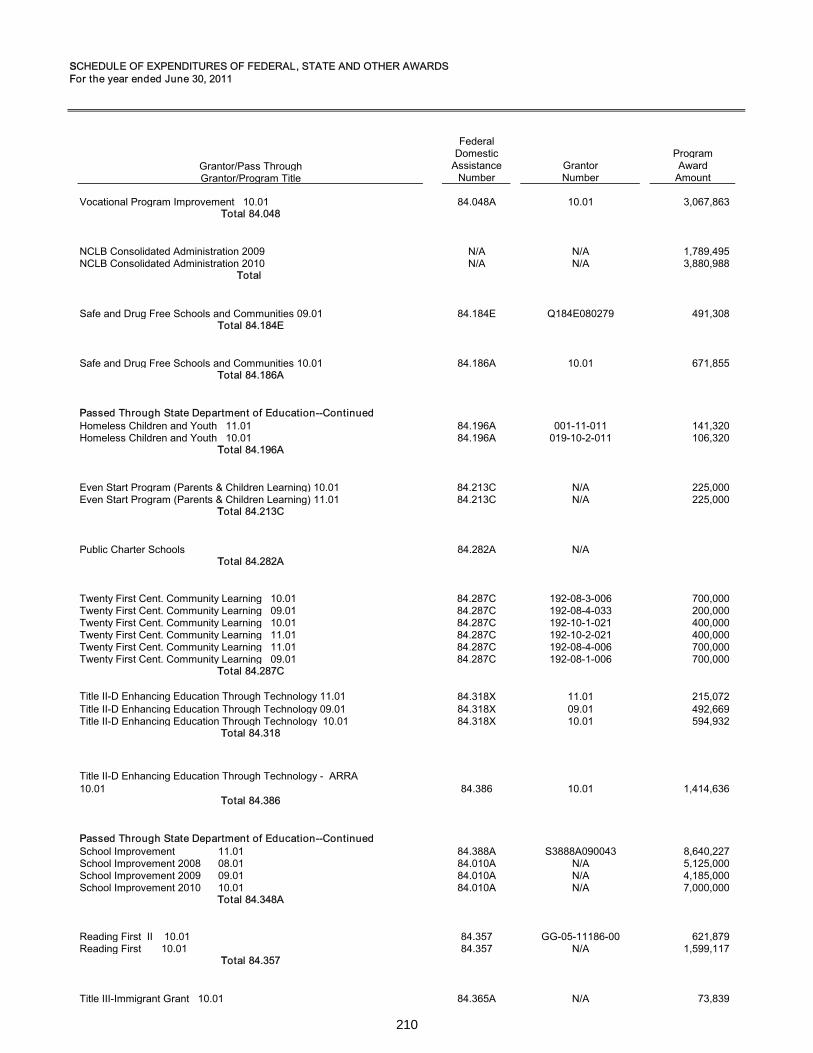
210
SSCHEDULE OF EXPENDITURES OF FEDERAL, STATE AND OTHER AWARDSFFor the year ended June 30, 2011
FederalDomestic Program
Grantor/Pass Through Assistance Grantor AwardGrantor/Program Title Number Number Amount
Vocational Program Improvement 10.01 84.048A 10.01 3,067,863TTotal 84.048
NCLB Consolidated Administration 2009 N/A N/A 1,789,495NCLB Consolidated Administration 2010 N/A N/A 3,880,988
TTotal
Safe and Drug Free Schools and Communities 09.01 84.184E Q184E080279 491,308TTotal 84.184E
Safe and Drug Free Schools and Communities 10.01 84.186A 10.01 671,855TTotal 84.186A
PPassed Through State Department of Education--ContinuedHomeless Children and Youth 11.01 84.196A 001-11-011 141,320Homeless Children and Youth 10.01 84.196A 019-10-2-011 106,320
TTotal 84.196A
Even Start Program (Parents & Children Learning) 10.01 84.213C N/A 225,000Even Start Program (Parents & Children Learning) 11.01 84.213C N/A 225,000
TTotal 84.213C
Public Charter Schools 84.282A N/ATTotal 84.282A
Twenty First Cent. Community Learning 10.01 84.287C 192-08-3-006 700,000Twenty First Cent. Community Learning 09.01 84.287C 192-08-4-033 200,000Twenty First Cent. Community Learning 10.01 84.287C 192-10-1-021 400,000Twenty First Cent. Community Learning 11.01 84.287C 192-10-2-021 400,000Twenty First Cent. Community Learning 11.01 84.287C 192-08-4-006 700,000Twenty First Cent. Community Learning 09.01 84.287C 192-08-1-006 700,000
TTotal 84.287C
Title II-D Enhancing Education Through Technology 11.01 84.318X 11.01 215,072Title II-D Enhancing Education Through Technology 09.01 84.318X 09.01 492,669Title II-D Enhancing Education Through Technology 10.01 84.318X 10.01 594,932
TTotal 84.318
Title II-D Enhancing Education Through Technology - ARRA 10.01 84.386 10.01 1,414,636
TTotal 84.386
PPassed Through State Department of Education--ContinuedSchool Improvement 11.01 84.388A S3888A090043 8,640,227School Improvement 2008 08.01 84.010A N/A 5,125,000School Improvement 2009 09.01 84.010A N/A 4,185,000School Improvement 2010 10.01 84.010A N/A 7,000,000
TTotal 84.348A
Reading First II 10.01 84.357 GG-05-11186-00 621,879Reading First 10.01 84.357 N/A 1,599,117
TTotal 84.357
Title III-Immigrant Grant 10.01 84.365A N/A 73,839
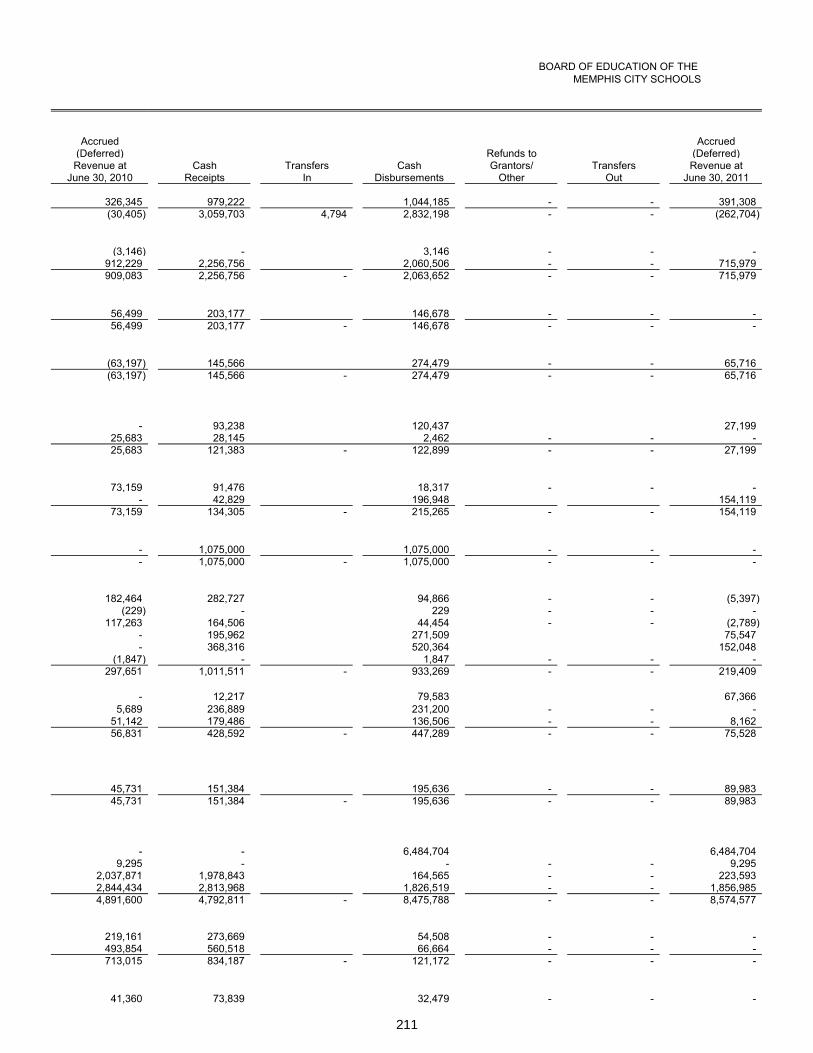
211
BOARD OF EDUCATION OF THE MEMPHIS CITY SCHOOLS
Accrued Accrued(Deferred) Refunds to (Deferred)Revenue at Cash Transfers Cash Grantors/ Transfers Revenue at
June 30, 2010 Receipts In Disbursements Other Out June 30, 2011
326,345 979,222 1,044,185 - - 391,308(30,405) 3,059,703 4,794 2,832,198 - - (262,704)
(3,146) - 3,146 - - -912,229 2,256,756 2,060,506 - - 715,979909,083 2,256,756 - 2,063,652 - - 715,979
56,499 203,177 146,678 - - -56,499 203,177 - 146,678 - - -
(63,197) 145,566 274,479 - - 65,716(63,197) 145,566 - 274,479 - - 65,716
- 93,238 120,437 27,19925,683 28,145 2,462 - - -25,683 121,383 - 122,899 - - 27,199
73,159 91,476 18,317 - - -- 42,829 196,948 154,119
73,159 134,305 - 215,265 - - 154,119
- 1,075,000 1,075,000 - - -- 1,075,000 - 1,075,000 - - -
182,464 282,727 94,866 - - (5,397)(229) - 229 - - -
117,263 164,506 44,454 - - (2,789)- 195,962 271,509 75,547- 368,316 520,364 152,048
(1,847) - 1,847 - - -297,651 1,011,511 - 933,269 - - 219,409
- 12,217 79,583 67,3665,689 236,889 231,200 - - -
51,142 179,486 136,506 - - 8,16256,831 428,592 - 447,289 - - 75,528
45,731 151,384 195,636 - - 89,98345,731 151,384 - 195,636 - - 89,983
- - 6,484,704 6,484,7049,295 - - - - 9,295
2,037,871 1,978,843 164,565 - - 223,5932,844,434 2,813,968 1,826,519 - - 1,856,9854,891,600 4,792,811 - 8,475,788 - - 8,574,577
219,161 273,669 54,508 - - -493,854 560,518 66,664 - - -713,015 834,187 - 121,172 - - -
41,360 73,839 32,479 - - -
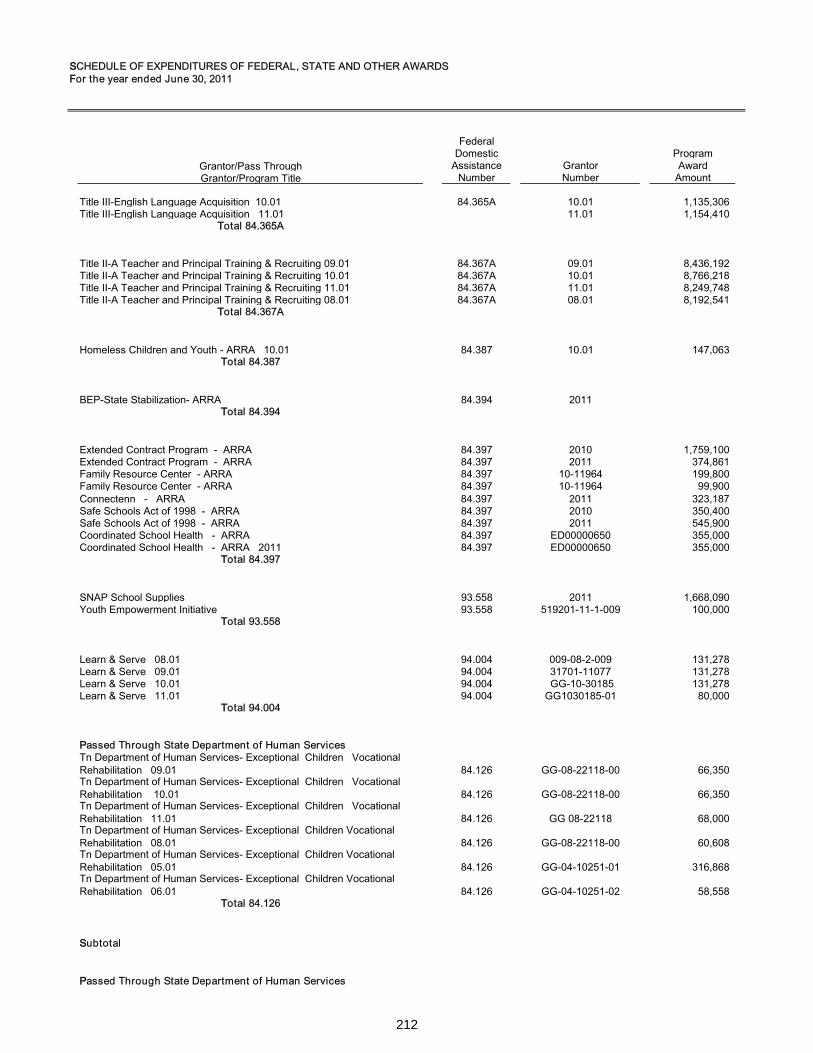
212
SSCHEDULE OF EXPENDITURES OF FEDERAL, STATE AND OTHER AWARDSFFor the year ended June 30, 2011
FederalDomestic Program
Grantor/Pass Through Assistance Grantor AwardGrantor/Program Title Number Number Amount
Title III-English Language Acquisition 10.01 84.365A 10.01 1,135,306Title III-English Language Acquisition 11.01 11.01 1,154,410
TTotal 84.365A
Title II-A Teacher and Principal Training & Recruiting 09.01 84.367A 09.01 8,436,192Title II-A Teacher and Principal Training & Recruiting 10.01 84.367A 10.01 8,766,218Title II-A Teacher and Principal Training & Recruiting 11.01 84.367A 11.01 8,249,748Title II-A Teacher and Principal Training & Recruiting 08.01 84.367A 08.01 8,192,541
TTotal 84.367A
Homeless Children and Youth - ARRA 10.01 84.387 10.01 147,063TTotal 84.387
BEP-State Stabilization- ARRA 84.394 2011TTotal 84.394
Extended Contract Program - ARRA 84.397 2010 1,759,100Extended Contract Program - ARRA 84.397 2011 374,861Family Resource Center - ARRA 84.397 10-11964 199,800Family Resource Center - ARRA 84.397 10-11964 99,900Connectenn - ARRA 84.397 2011 323,187Safe Schools Act of 1998 - ARRA 84.397 2010 350,400Safe Schools Act of 1998 - ARRA 84.397 2011 545,900Coordinated School Health - ARRA 84.397 ED00000650 355,000Coordinated School Health - ARRA 2011 84.397 ED00000650 355,000
TTotal 84.397
SNAP School Supplies 93.558 2011 1,668,090Youth Empowerment Initiative 93.558 519201-11-1-009 100,000
TTotal 93.558
Learn & Serve 08.01 94.004 009-08-2-009 131,278Learn & Serve 09.01 94.004 31701-11077 131,278Learn & Serve 10.01 94.004 GG-10-30185 131,278Learn & Serve 11.01 94.004 GG1030185-01 80,000
TTotal 94.004
PPassed Through State Department of Human ServicesTn Department of Human Services- Exceptional Children Vocational Rehabilitation 09.01 84.126 GG-08-22118-00 66,350Tn Department of Human Services- Exceptional Children Vocational Rehabilitation 10.01 84.126 GG-08-22118-00 66,350Tn Department of Human Services- Exceptional Children Vocational Rehabilitation 11.01 84.126 GG 08-22118 68,000Tn Department of Human Services- Exceptional Children Vocational Rehabilitation 08.01 84.126 GG-08-22118-00 60,608Tn Department of Human Services- Exceptional Children Vocational Rehabilitation 05.01 84.126 GG-04-10251-01 316,868Tn Department of Human Services- Exceptional Children Vocational Rehabilitation 06.01 84.126 GG-04-10251-02 58,558
TTotal 84.126
SSubtotal
PPassed Through State Department of Human Services
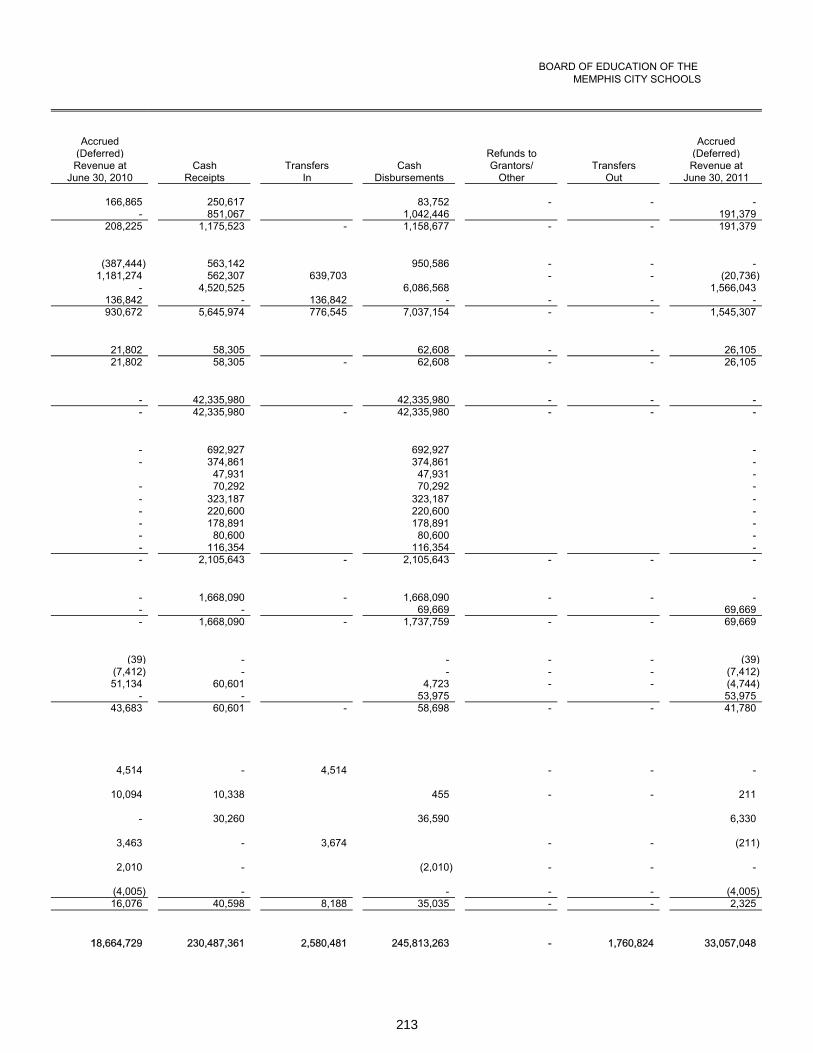
213
BOARD OF EDUCATION OF THE MEMPHIS CITY SCHOOLS
Accrued Accrued(Deferred) Refunds to (Deferred)Revenue at Cash Transfers Cash Grantors/ Transfers Revenue at
June 30, 2010 Receipts In Disbursements Other Out June 30, 2011
166,865 250,617 83,752 - - -- 851,067 1,042,446 191,379
208,225 1,175,523 - 1,158,677 - - 191,379
(387,444) 563,142 950,586 - - -1,181,274 562,307 639,703 - - (20,736)
- 4,520,525 6,086,568 1,566,043136,842 - 136,842 - - - -930,672 5,645,974 776,545 7,037,154 - - 1,545,307
21,802 58,305 62,608 - - 26,10521,802 58,305 - 62,608 - - 26,105
- 42,335,980 42,335,980 - - -- 42,335,980 - 42,335,980 - - -
- 692,927 692,927 -- 374,861 374,861 -
47,931 47,931 -- 70,292 70,292 -- 323,187 323,187 -- 220,600 220,600 -- 178,891 178,891 -- 80,600 80,600 -- 116,354 116,354 -- 2,105,643 - 2,105,643 - - -
- 1,668,090 - 1,668,090 - - -- - 69,669 69,669- 1,668,090 - 1,737,759 - - 69,669
(39) - - - - (39)(7,412) - - - - (7,412)51,134 60,601 4,723 - - (4,744)
- - 53,975 53,97543,683 60,601 - 58,698 - - 41,780
4,514 - 4,514 - - -
10,094 10,338 455 - - 211
- 30,260 36,590 6,330
3,463 - 3,674 - - (211)
2,010 - (2,010) - - -
(4,005) - - - - (4,005)16,076 40,598 8,188 35,035 - - 2,325
118,664,729 230,487,361 2,580,481 245,813,263 - 1,760,824 33,057,048
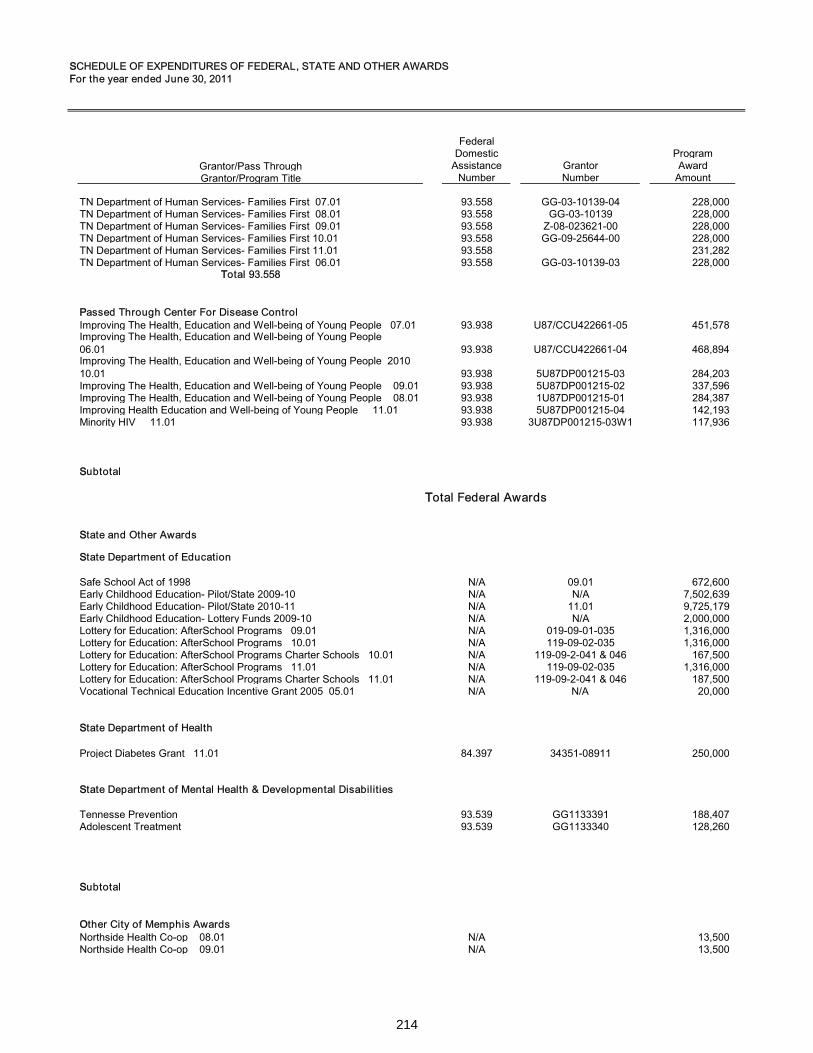
214
SSCHEDULE OF EXPENDITURES OF FEDERAL, STATE AND OTHER AWARDSFFor the year ended June 30, 2011
FederalDomestic Program
Grantor/Pass Through Assistance Grantor AwardGrantor/Program Title Number Number Amount
TN Department of Human Services- Families First 07.01 93.558 GG-03-10139-04 228,000TN Department of Human Services- Families First 08.01 93.558 GG-03-10139 228,000TN Department of Human Services- Families First 09.01 93.558 Z-08-023621-00 228,000TN Department of Human Services- Families First 10.01 93.558 GG-09-25644-00 228,000TN Department of Human Services- Families First 11.01 93.558 231,282TN Department of Human Services- Families First 06.01 93.558 GG-03-10139-03 228,000
TTotal 93.558
PPassed Through Center For Disease ControlImproving The Health, Education and Well-being of Young People 07.01 93.938 U87/CCU422661-05 451,578Improving The Health, Education and Well-being of Young People 06.01 93.938 U87/CCU422661-04 468,894Improving The Health, Education and Well-being of Young People 2010 10.01 93.938 5U87DP001215-03 284,203Improving The Health, Education and Well-being of Young People 09.01 93.938 5U87DP001215-02 337,596Improving The Health, Education and Well-being of Young People 08.01 93.938 1U87DP001215-01 284,387Improving Health Education and Well-being of Young People 11.01 93.938 5U87DP001215-04 142,193Minority HIV 11.01 93.938 3U87DP001215-03W1 117,936
SSubtotal
TTotal Federal Awards
SState and Other Awards
SState Department of Education
Safe School Act of 1998 N/A 09.01 672,600Early Childhood Education- Pilot/State 2009-10 N/A N/A 7,502,639Early Childhood Education- Pilot/State 2010-11 N/A 11.01 9,725,179Early Childhood Education- Lottery Funds 2009-10 N/A N/A 2,000,000Lottery for Education: AfterSchool Programs 09.01 N/A 019-09-01-035 1,316,000Lottery for Education: AfterSchool Programs 10.01 N/A 119-09-02-035 1,316,000Lottery for Education: AfterSchool Programs Charter Schools 10.01 N/A 119-09-2-041 & 046 167,500Lottery for Education: AfterSchool Programs 11.01 N/A 119-09-02-035 1,316,000Lottery for Education: AfterSchool Programs Charter Schools 11.01 N/A 119-09-2-041 & 046 187,500Vocational Technical Education Incentive Grant 2005 05.01 N/A N/A 20,000
SState Department of Health
Project Diabetes Grant 11.01 84.397 34351-08911 250,000
SState Department of Mental Health & Developmental Disabilities
Tennesse Prevention 93.539 GG1133391 188,407Adolescent Treatment 93.539 GG1133340 128,260
SSubtotal
OOther City of Memphis AwardsNorthside Health Co-op 08.01 N/A 13,500Northside Health Co-op 09.01 N/A 13,500
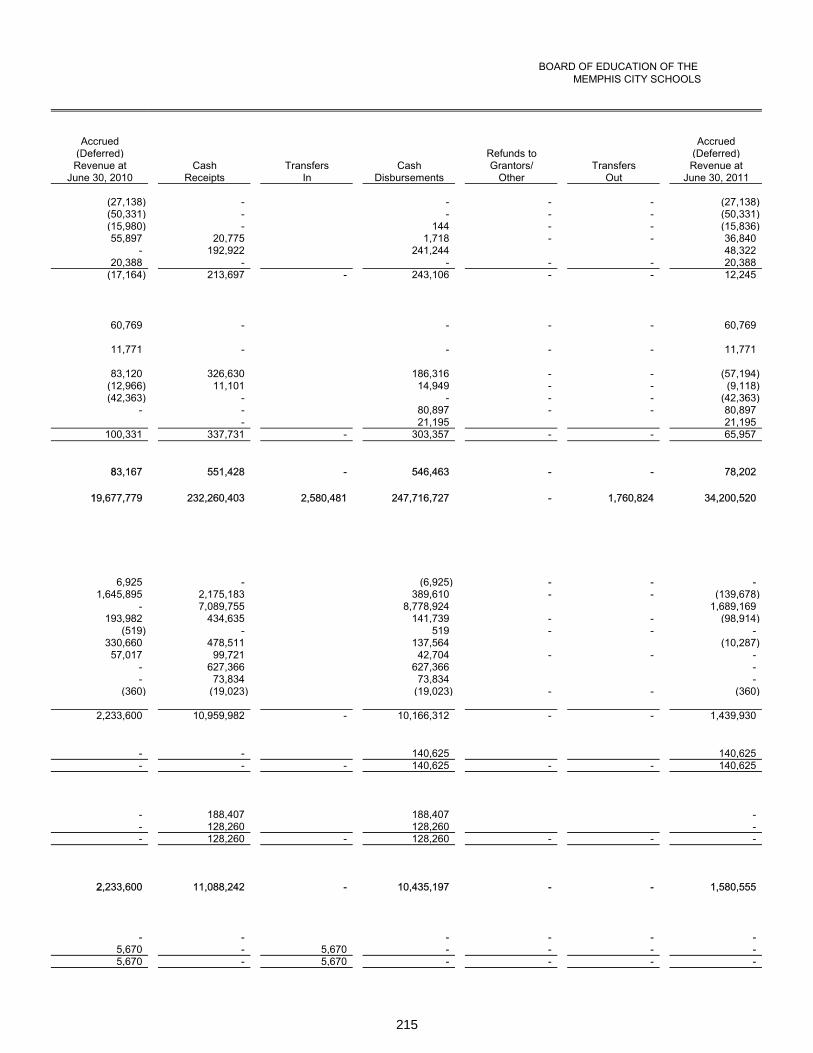
215
BOARD OF EDUCATION OF THE MEMPHIS CITY SCHOOLS
Accrued Accrued(Deferred) Refunds to (Deferred)Revenue at Cash Transfers Cash Grantors/ Transfers Revenue at
June 30, 2010 Receipts In Disbursements Other Out June 30, 2011
(27,138) - - - - (27,138)(50,331) - - - - (50,331)(15,980) - 144 - - (15,836)55,897 20,775 1,718 - - 36,840
- 192,922 241,244 48,32220,388 - - - - 20,388
(17,164) 213,697 - 243,106 - - 12,245
60,769 - - - - 60,769
11,771 - - - - 11,771
83,120 326,630 186,316 - - (57,194)(12,966) 11,101 14,949 - - (9,118)(42,363) - - - - (42,363)
- - 80,897 - - 80,897- 21,195 21,195
100,331 337,731 - 303,357 - - 65,957
883,167 551,428 - 546,463 - - 78,202
119,677,779 232,260,403 2,580,481 247,716,727 - 1,760,824 34,200,520
6,925 - (6,925) - - -1,645,895 2,175,183 389,610 - - (139,678)
- 7,089,755 8,778,924 1,689,169193,982 434,635 141,739 - - (98,914)
(519) - 519 - - -330,660 478,511 137,564 (10,287)57,017 99,721 42,704 - - -
- 627,366 627,366 -- 73,834 73,834 -
(360) (19,023) (19,023) - - (360)
2,233,600 10,959,982 - 10,166,312 - - 1,439,930
- - 140,625 140,625- - - 140,625 - - 140,625
- 188,407 188,407 -- 128,260 128,260 -- 128,260 - 128,260 - - -
22,233,600 11,088,242 - 10,435,197 - - 1,580,555
- - - - - -5,670 - 5,670 - - - -5,670 - 5,670 - - - -
216
SSCHEDULE OF EXPENDITURES OF FEDERAL, STATE AND OTHER AWARDSFFor the year ended June 30, 2011
FederalDomestic Program
Grantor/Pass Through Assistance Grantor AwardGrantor/Program Title Number Number Amount
SSubtotal
Total State and Other Awards
TTotal Federal, State and Other Awards
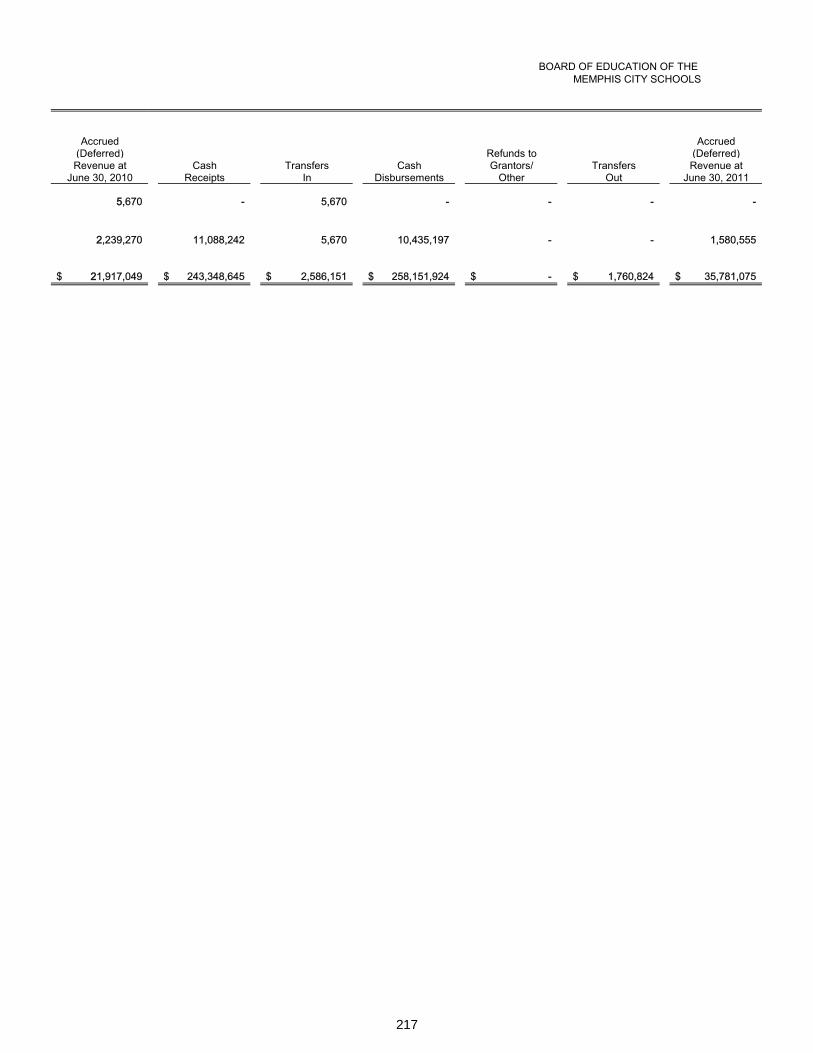
217
BOARD OF EDUCATION OF THE MEMPHIS CITY SCHOOLS
Accrued Accrued(Deferred) Refunds to (Deferred)Revenue at Cash Transfers Cash Grantors/ Transfers Revenue at
June 30, 2010 Receipts In Disbursements Other Out June 30, 2011
55,670 - 5,670 - - - -
22,239,270 11,088,242 5,670 10,435,197 - - 1,580,555
221,917,049$ 243,348,645$ 2,586,151$ 258,151,924$ -$ 1,760,824$ 35,781,075$

218
This page left intentionally blank
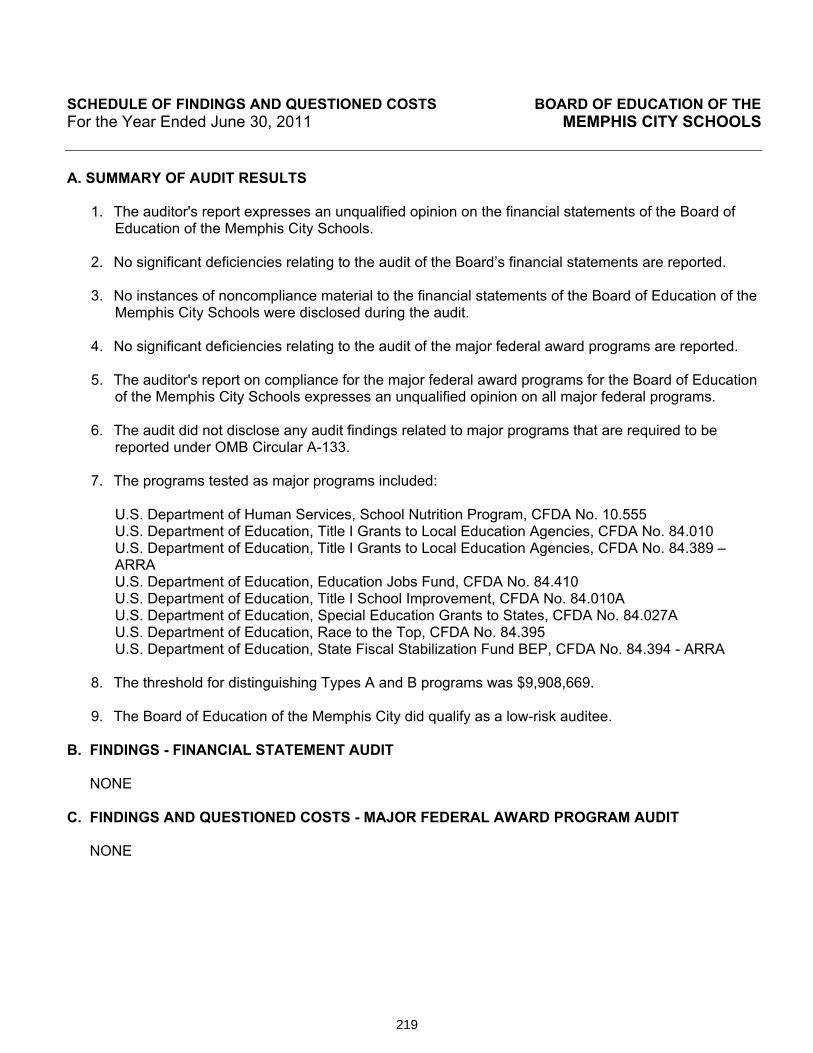
219
Schedule of Findings and Questioned Costs
SCHEDULE OF FINDINGS AND QUESTIONED COSTS BOARD OF EDUCATION OF THE For the Year Ended June 30, 2011 MEMPHIS CITY SCHOOLS
A. SUMMARY OF AUDIT RESULTS
1. The auditor's report expresses an unqualified opinion on the financial statements of the Board of Education of the Memphis City Schools.
2. No significant deficiencies relating to the audit of the Board’s financial statements are reported.
3. No instances of noncompliance material to the financial statements of the Board of Education of the Memphis City Schools were disclosed during the audit.
4. No significant deficiencies relating to the audit of the major federal award programs are reported.
5. The auditor's report on compliance for the major federal award programs for the Board of Education of the Memphis City Schools expresses an unqualified opinion on all major federal programs.
6. The audit did not disclose any audit findings related to major programs that are required to be reported under OMB Circular A-133.
7. The programs tested as major programs included:
U.S. Department of Human Services, School Nutrition Program, CFDA No. 10.555 U.S. Department of Education, Title I Grants to Local Education Agencies, CFDA No. 84.010 U.S. Department of Education, Title I Grants to Local Education Agencies, CFDA No. 84.389 – ARRA U.S. Department of Education, Education Jobs Fund, CFDA No. 84.410 U.S. Department of Education, Title I School Improvement, CFDA No. 84.010A U.S. Department of Education, Special Education Grants to States, CFDA No. 84.027A U.S. Department of Education, Race to the Top, CFDA No. 84.395 U.S. Department of Education, State Fiscal Stabilization Fund BEP, CFDA No. 84.394 - ARRA
8. The threshold for distinguishing Types A and B programs was $9,908,669.
9. The Board of Education of the Memphis City did qualify as a low-risk auditee.
B. FINDINGS - FINANCIAL STATEMENT AUDIT
NONE
C. FINDINGS AND QUESTIONED COSTS - MAJOR FEDERAL AWARD PROGRAM AUDIT
NONE

220
Summary of Prior Year Findings
SUMMARY SCHEDULE OF PRIOR YEAR AUDIT FINDINGS BOARD OF EDUCATION OF THE For the Year Ended June 30, 2011 MEMPHIS CITY SCHOOLS
NONE �

221

222
This page left intentionally blank


