Metallurgical Coal
Anglo American’s metallurgical coal business is Australia’s fourth biggest producer of coal and its number three exporter of metallurgical coal.
Coal stockpile – Anglo Metallurgical Coal, Australia
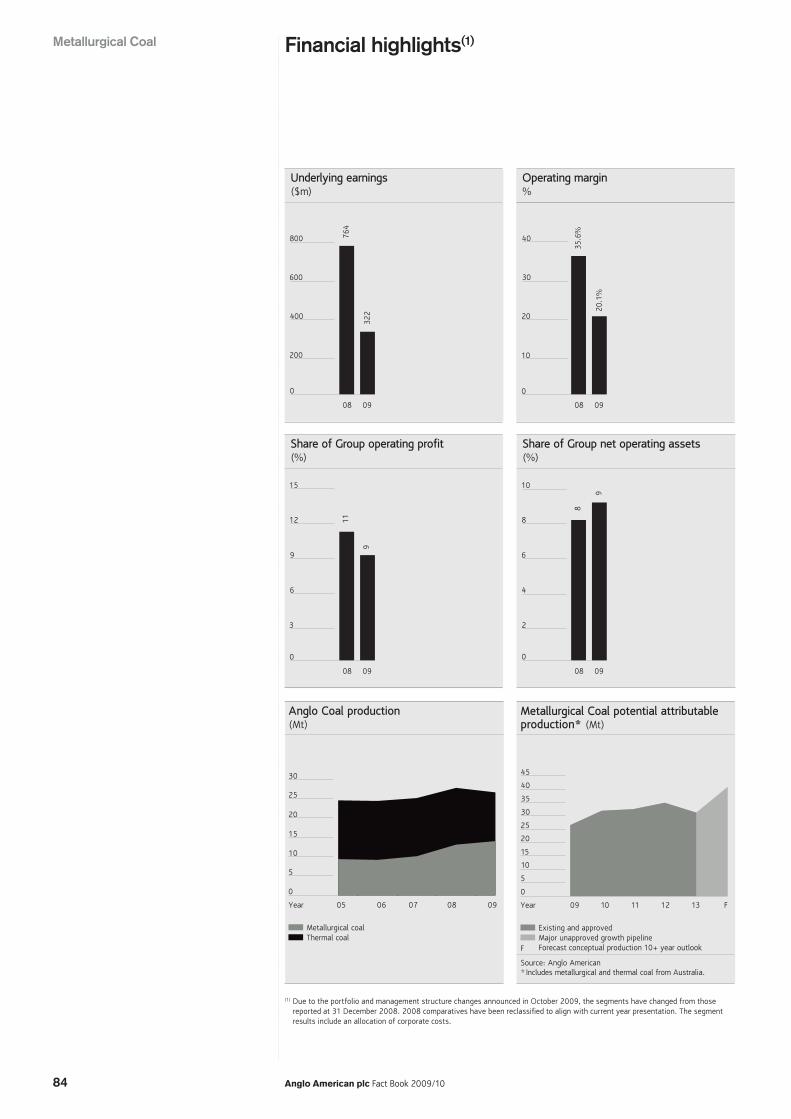
Share of Group operating profit(%)
0
3
6
9
12
15
9
11
0908
Underlying earnings($m)
0
200
400
600
800
322
764
0908
Operating margin%
0
10
20
30
40
20.1%
35.6%
0908
Share of Group net operating assets(%)
0
2
4
6
8
10
8
9
0908
30
25
20
15
10
5
0
Metallurgical coalThermal coal
Anglo Coal production (Mt)
05Year 09080706
Forecast conceptual production 10+ year outlook
Existing and approvedMajor unapproved growth pipeline
F
Metallurgical Coal potential attributable production* (Mt)
30
35
40
45
25
20
15
10
5
0
Source: Anglo American* Includes metallurgical and thermal coal from Australia.
09Year 13121110 F
84 Anglo American plc Fact Book 2009/10
Metallurgical Coal Financial highlights(1)
(1) Due to the portfolio and management structure changes announced in October 2009, the segments have changed from those reported at 31 December 2008. 2008 comparatives have been reclassified to align with current year presentation. The segment results include an allocation of corporate costs.
Anglo American plc Fact Book 2009/10 85
Metallurgical C
oal
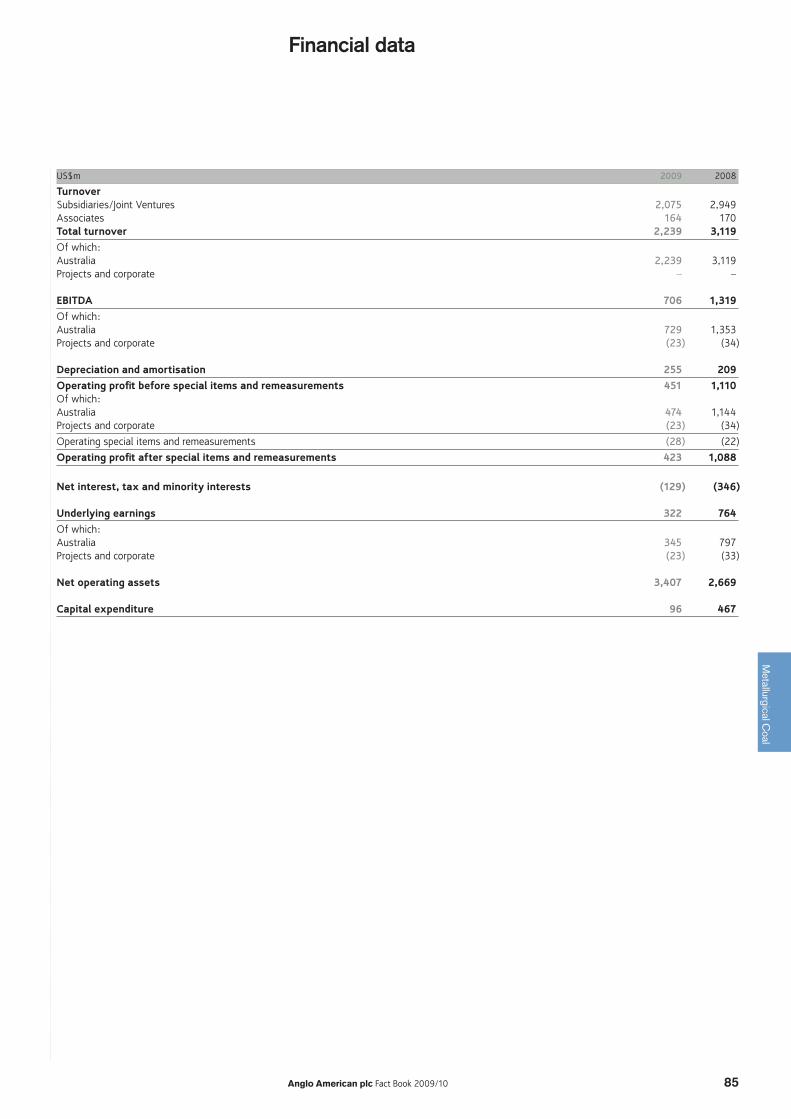
Financial data
US$m 2009 2008
TurnoverSubsidiaries/Joint Ventures 2,075 2,949 Associates 164 170Total turnover 2,239 3,119 Of which: Australia 2,239 3,119Projects and corporate – – EBITDA 706 1,319 Of which: Australia 729 1,353 Projects and corporate (23) (34) Depreciation and amortisation 255 209 Operating profit before special items and remeasurements 451 1,110 Of which: Australia 474 1,144Projects and corporate (23) (34)
Operating special items and remeasurements (28) (22)
Operating profit after special items and remeasurements 423 1,088 Net interest, tax and minority interests (129) (346) Underlying earnings 322 764Of which: Australia 345 797Projects and corporate (23) (33) Net operating assets 3,407 2,669 Capital expenditure 96 467
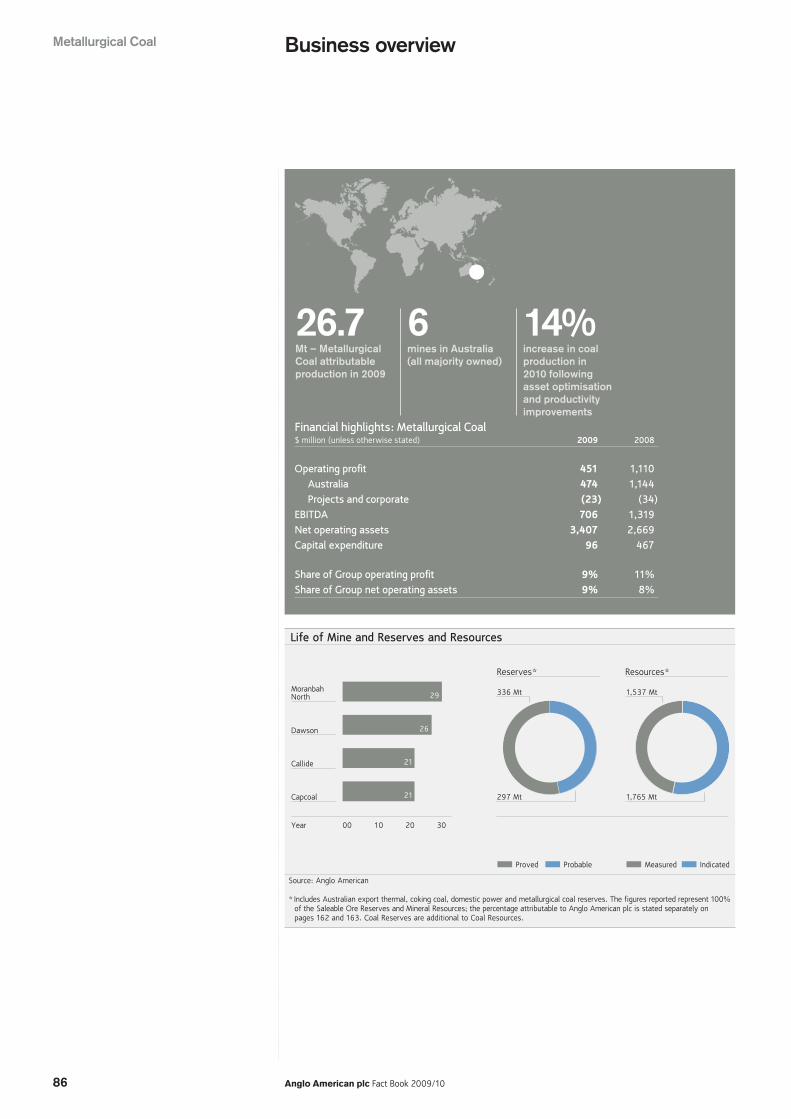
IndicatedProbable
Callide
Capcoal 297 Mt 1,765 Mt
Dawson
MoranbahNorth
Reserves*
21
21
26
29
Life of Mine and Reserves and Resources
00 302010
Proved Measured
Year
Resources*
336 Mt 1,537 Mt
Source: Anglo American
* Includes Australian export thermal, coking coal, domestic power and metallurgical coal reserves. The figures reported represent 100% of the Saleable Ore Reserves and Mineral Resources; the percentage attributable to Anglo American plc is stated separately on pages 162 and 163. Coal Reserves are additional to Coal Resources.
86 Anglo American plc Fact Book 2009/10
Business overview
Financial highlights: Metallurgical Coal$ million (unless otherwise stated) 2009 2008
Operating profit 451 1,110Australia 474 1,144Projects and corporate (23) (34)
EBITDA 706 1,319Net operating assets 3,407 2,669Capital expenditure 96 467
Share of Group operating profit 9% 11%Share of Group net operating assets 9% 8%
26.7Mt – Metallurgical Coal attributable production in 2009
6mines in Australia (all majority owned)
14%increase in coal production in 2010 following asset optimisation and productivity improvements
Metallurgical Coal
163
47
2
5
●●
●●
●●
Anglo American plc Fact Book 2009/10 87
Metallurgical C
oal
Key Underground Open Cut Other
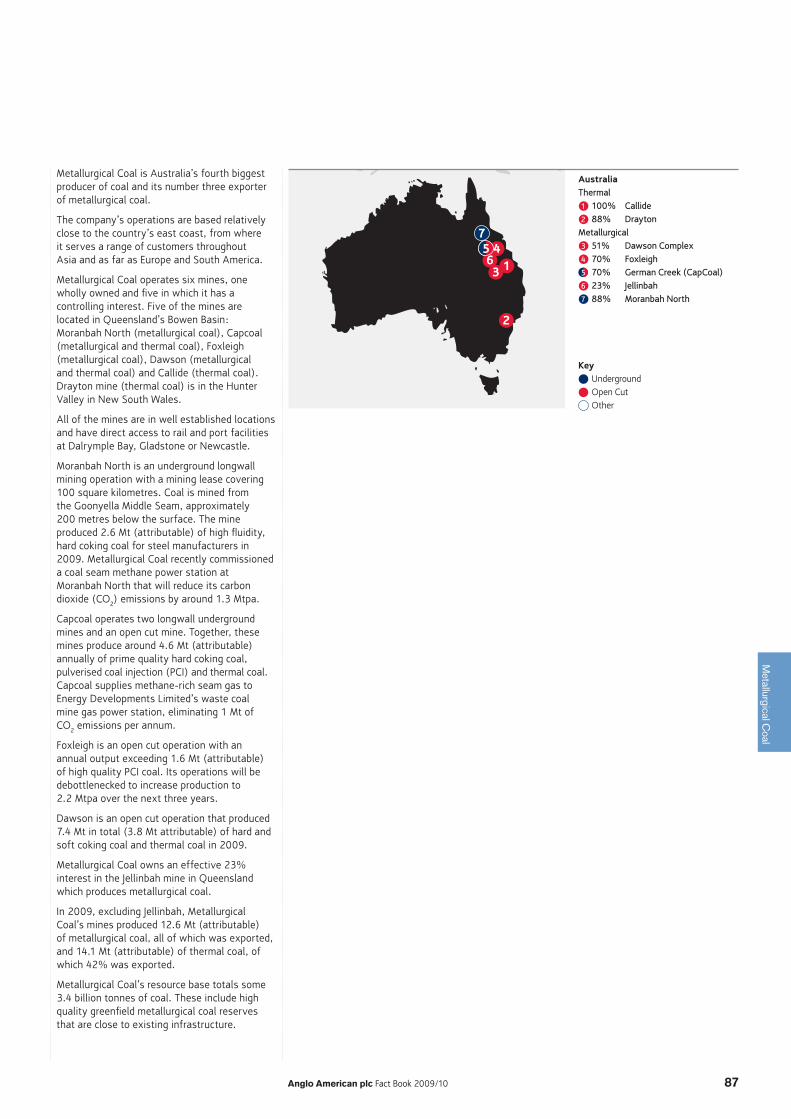
Metallurgical Coal is Australia’s fourth biggest producer of coal and its number three exporter of metallurgical coal.
The company’s operations are based relatively close to the country’s east coast, from where it serves a range of customers throughout Asia and as far as Europe and South America.
Metallurgical Coal operates six mines, one wholly owned and five in which it has a controlling interest. Five of the mines are located in Queensland’s Bowen Basin: Moranbah North (metallurgical coal), Capcoal (metallurgical and thermal coal), Foxleigh (metallurgical coal), Dawson (metallurgical and thermal coal) and Callide (thermal coal). Drayton mine (thermal coal) is in the Hunter Valley in New South Wales.
All of the mines are in well established locations and have direct access to rail and port facilities at Dalrymple Bay, Gladstone or Newcastle.
Moranbah North is an underground longwall mining operation with a mining lease covering 100 square kilometres. Coal is mined from the Goonyella Middle Seam, approximately 200 metres below the surface. The mine produced 2.6 Mt (attributable) of high fluidity, hard coking coal for steel manufacturers in 2009. Metallurgical Coal recently commissioned a coal seam methane power station at Moranbah North that will reduce its carbon dioxide (CO2) emissions by around 1.3 Mtpa.
Capcoal operates two longwall underground mines and an open cut mine. Together, these mines produce around 4.6 Mt (attributable) annually of prime quality hard coking coal, pulverised coal injection (PCI) and thermal coal. Capcoal supplies methane-rich seam gas to Energy Developments Limited’s waste coal mine gas power station, eliminating 1 Mt of CO2 emissions per annum.
Foxleigh is an open cut operation with an annual output exceeding 1.6 Mt (attributable) of high quality PCI coal. Its operations will be debottlenecked to increase production to 2.2 Mtpa over the next three years.
Dawson is an open cut operation that produced 7.4 Mt in total (3.8 Mt attributable) of hard and soft coking coal and thermal coal in 2009.
Metallurgical Coal owns an effective 23% interest in the Jellinbah mine in Queensland which produces metallurgical coal.
In 2009, excluding Jellinbah, Metallurgical Coal’s mines produced 12.6 Mt (attributable) of metallurgical coal, all of which was exported, and 14.1 Mt (attributable) of thermal coal, of which 42% was exported.
Metallurgical Coal’s resource base totals some 3.4 billion tonnes of coal. These include high quality greenfield metallurgical coal reserves that are close to existing infrastructure.
AustraliaThermal1 100% Callide2 88% DraytonMetallurgical3 51% Dawson Complex4 70% Foxleigh5 70% German Creek (CapCoal)6 23% Jellinbah7 88% Moranbah North
●●

88 Anglo American plc Fact Book 2009/10
Metallurgical coal markets improved in the second quarter owing to significant buying from China, initially of hard coking coal and subsequently a wider range of metallurgical coals, including PCI, thereby underpinning traditional benchmark prices at levels second only to those seen in 2008. The second half of the year saw a significant increase in demand from traditional customers in Japan, South Korea, India and Europe as steel industry production units ramped up.
Metallurgical coal is a key raw material for 70% of the world’s steel industry.
Each year, the world produces over 5 billion tonnes of hard coal, most of which is used in the country of origin. A small volume is traded across land borders such as those between the US and Canada or between the countries of the former Soviet Union. The international seaborne metallurgical coal market comprises some 200 Mt of metallurgical coal.
Produced in a relatively limited number of countries, metallurgical coal is primarily used in the steelmaking industry and includes hard coking coal, semi-soft coking coal and PCI coal. The chemical composition of the coal is fundamental to the steel producers’ raw material mix and product quality. The market for metallurgical coal has a bigger proportion of longer term, annually priced contracts, though increasingly, some steel companies are using short term contracts to meet the balance of their requirements. Demand in the sector is fundamentally driven by economic, industrial and steel demand growth. Price negotiations between Australian suppliers and Japanese steel producers have traditionally, though not always, set the trend that influences settlements throughout the market. Metallurgical Coal is a significant supplier to virtually all the world’s major steel producing groups.
Markets
Anglo American weighted average achieved FOB prices ($/tonne) 2009 2008
Export metallurgical 141.04 187.36
Export thermal 73.82 83.22
Domestic thermal 26.75 20.75
Attributable sales volumes (thousand tonnes) 2009 2008
Export metallurgical 11,542 13,147
Export thermal 6,239 5,780
Domestic thermal 8,604 9,682
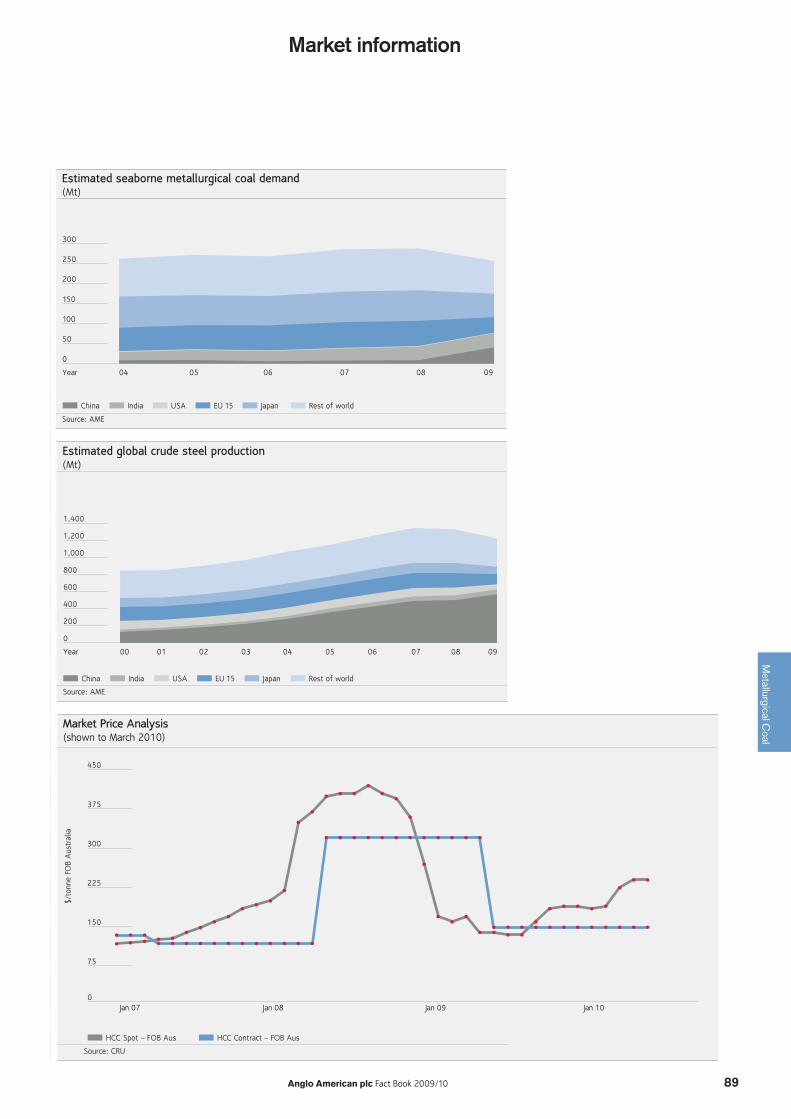
Following a year of tight market conditions and record prices in 2008, demand for coal was severely constrained in the first quarter as steelmaker inventories were wound down, particularly impacting the PCI coal market. Benchmark metallurgical coal prices retreated from their c.$300 per tonne peak in 2008 by up to 60%, reducing the average selling price for the year by 22%.
Industry overviewMetallurgical Coal
Japan Rest of worldUSAIndiaChina EU 15
250
200
150
100
50
0
300
Estimated seaborne metallurgical coal demand(Mt)
Source: AME
04Year 05 06 07 08 09
China India USA EU 15 Japan Rest of world
1,200
1,000
800
600
400
200
0
1,400
Estimated global crude steel production(Mt)
Source: AME
00Year 0807060504030201 09
0
75
150
225
300
375
450
Jan 07 Jan 08 Jan 09 Jan 10
Jan 00 Jan 02 Jan 04 Jan 06 Jan 08
2.0
3.5
2.5
3.0
1.5
1.0
0.5
0
160
310
210
260
110
60
$/to
nne
FOB
Aus
tral
ia
HCC Spot – FOB Aus HCC Contract – FOB Aus
Market Price Analysis (shown to March 2010)
LME Stocks, weeksPrice
Total LME stocks(1) and base metals price index (shown to April 2008)
(1) Al, Cu, Zn, Pb, Ni, Sn, and Cu Comex
Source: CRU
Anglo American plc Fact Book 2009/10 89
Metallurgical C
oal
Market information
90 Anglo American plc Fact Book 2009/10
Metallurgical Coal’s strategy is to be a large, low cost, reliable exporter of quality coal to steel producers worldwide from Queensland’s well established Bowen Basin.
Operational excellence is driven through a structured programme of asset optimisation that benchmarks performance for key activities to drive performance across the business to best practice standards.
Growth is driven both from optimising output from existing mines and from the ongoing development of a project pipeline underpinned by a comprehensive exploration and planning process.
Key to securing Metallurgical Coal’s future is the development of long term relationships with major customers in order to cultivate a stable market for its products. These relationships proved their worth during a period of uncertain demand in early 2009 when Metallurgical Coal’s product continued to be ordered in preference to that of a number of other producers.
Anglo American is committed to reducing the Group’s carbon emissions by supporting world leading technologies. As an example of this,
Metallurgical Coal recently became a cornerstone investor in Australian based MBD Energy, acquiring a 29% shareholding in the business. MBD Energy will soon commence trials of its leading-edge carbon capture and conversion technology, using algal synthesisers at three of Australia’s largest greenhouse gas emitting, coal fired power plants.
ProjectsProduction from the brownfield expansion projects at Dawson and Capcoal (Lake Lindsay) mines will continue to increase over the next two to three years as equipment productivity is raised to benchmark standards.
Significant greenfield projects continue to be studied at Grosvenor, Moranbah South and Dartbrook to meet expectations for growing demand for both metallurgical and thermal coal over the next decade.
It is expected that a first stage approval decision in relation to the approval and development of the 4.3 Mtpa Grosvenor metallurgical coal project in Australia will be taken during 2010.
Strategy and growth
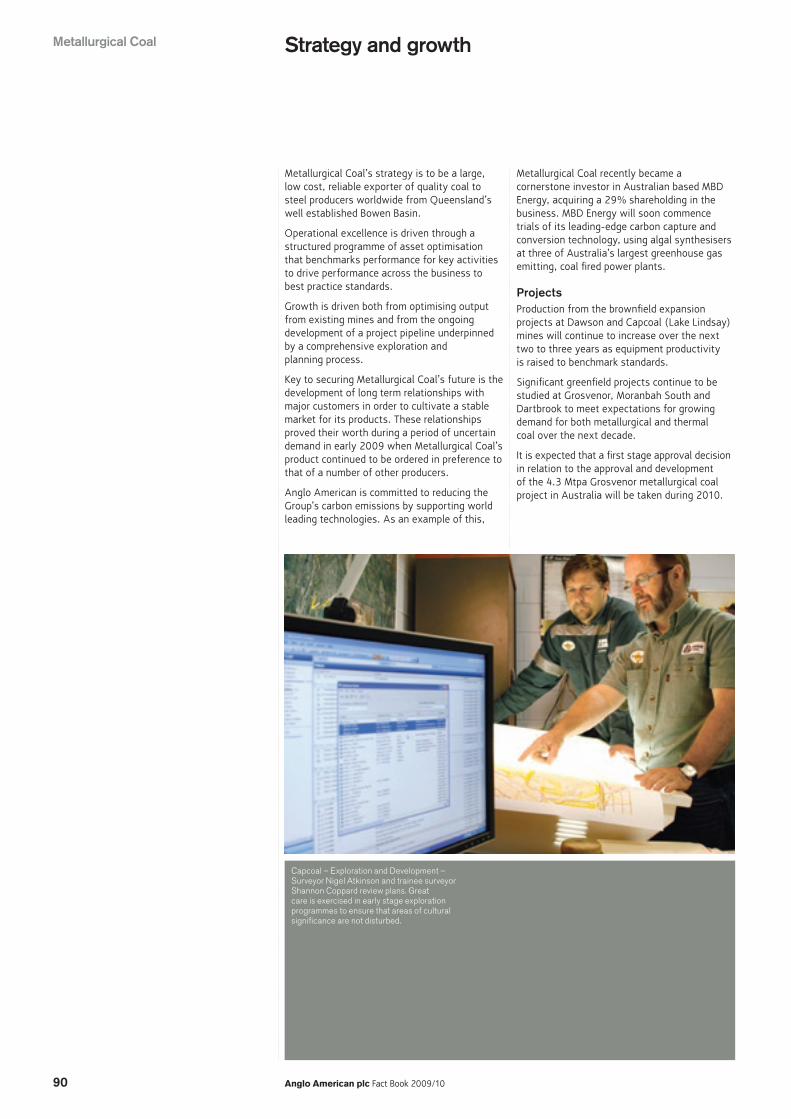
Capcoal – Exploration and Development – Surveyor Nigel Atkinson and trainee surveyor Shannon Coppard review plans. Great care is exercised in early stage exploration programmes to ensure that areas of cultural significance are not disturbed.
Metallurgical Coal
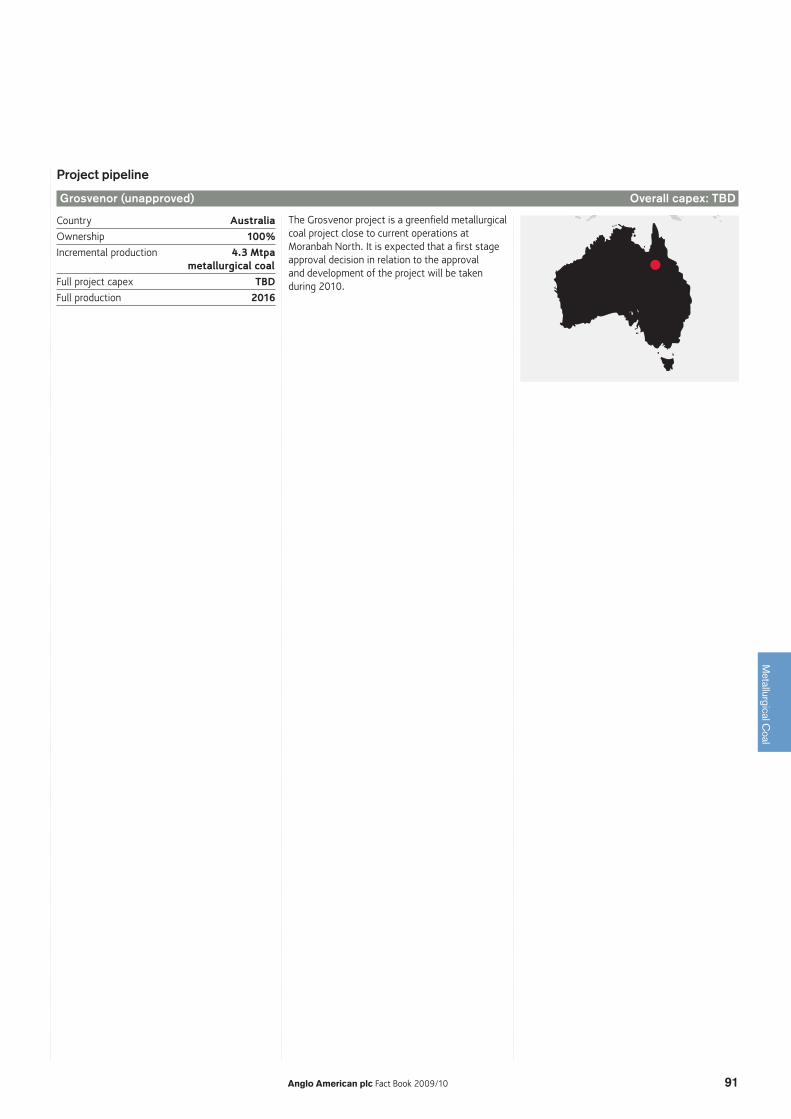
Grosvenor (unapproved) Overall capex: TBD
Project pipeline
Anglo American plc Fact Book 2009/10 91
Metallurgical C
oal
The Grosvenor project is a greenfield metallurgical coal project close to current operations at Moranbah North. It is expected that a first stage approval decision in relation to the approval and development of the project will be taken during 2010.
Country AustraliaOwnership 100%Incremental production 4.3 Mtpa metallurgical coalFull project capex TBDFull production 2016
92 Anglo American plc Fact Book 2009/10
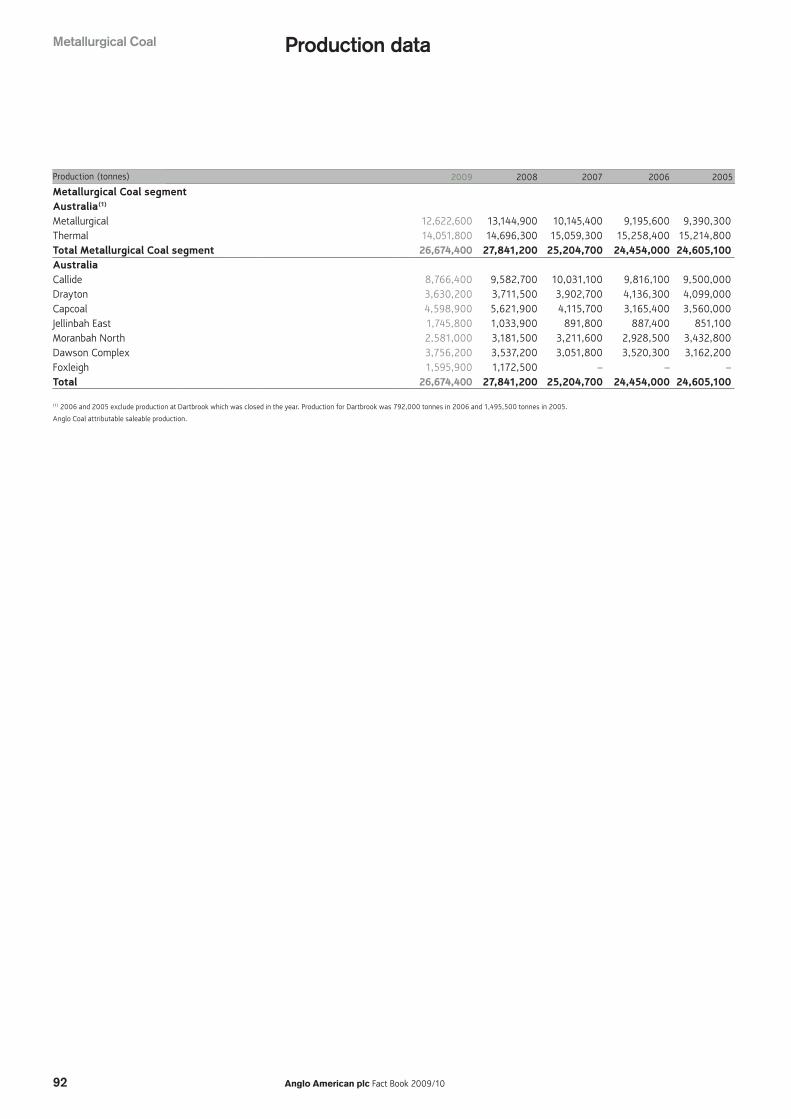
Production dataMetallurgical Coal
Production (tonnes) 2009 2008 2007 2006 2005
Metallurgical Coal segmentAustralia(1)
Metallurgical 12,622,600 13,144,900 10,145,400 9,195,600 9,390,300Thermal 14,051,800 14,696,300 15,059,300 15,258,400 15,214,800Total Metallurgical Coal segment 26,674,400 27,841,200 25,204,700 24,454,000 24,605,100AustraliaCallide 8,766,400 9,582,700 10,031,100 9,816,100 9,500,000Drayton 3,630,200 3,711,500 3,902,700 4,136,300 4,099,000Capcoal 4,598,900 5,621,900 4,115,700 3,165,400 3,560,000Jellinbah East 1,745,800 1,033,900 891,800 887,400 851,100Moranbah North 2,581,000 3,181,500 3,211,600 2,928,500 3,432,800Dawson Complex 3,756,200 3,537,200 3,051,800 3,520,300 3,162,200Foxleigh 1,595,900 1,172,500 – – –Total 26,674,400 27,841,200 25,204,700 24,454,000 24,605,100
(1) 2006 and 2005 exclude production at Dartbrook which was closed in the year. Production for Dartbrook was 792,000 tonnes in 2006 and 1,495,500 tonnes in 2005.
Anglo Coal attributable saleable production.
Anglo American plc Fact Book 2009/10 93
Metallurgical C
oal
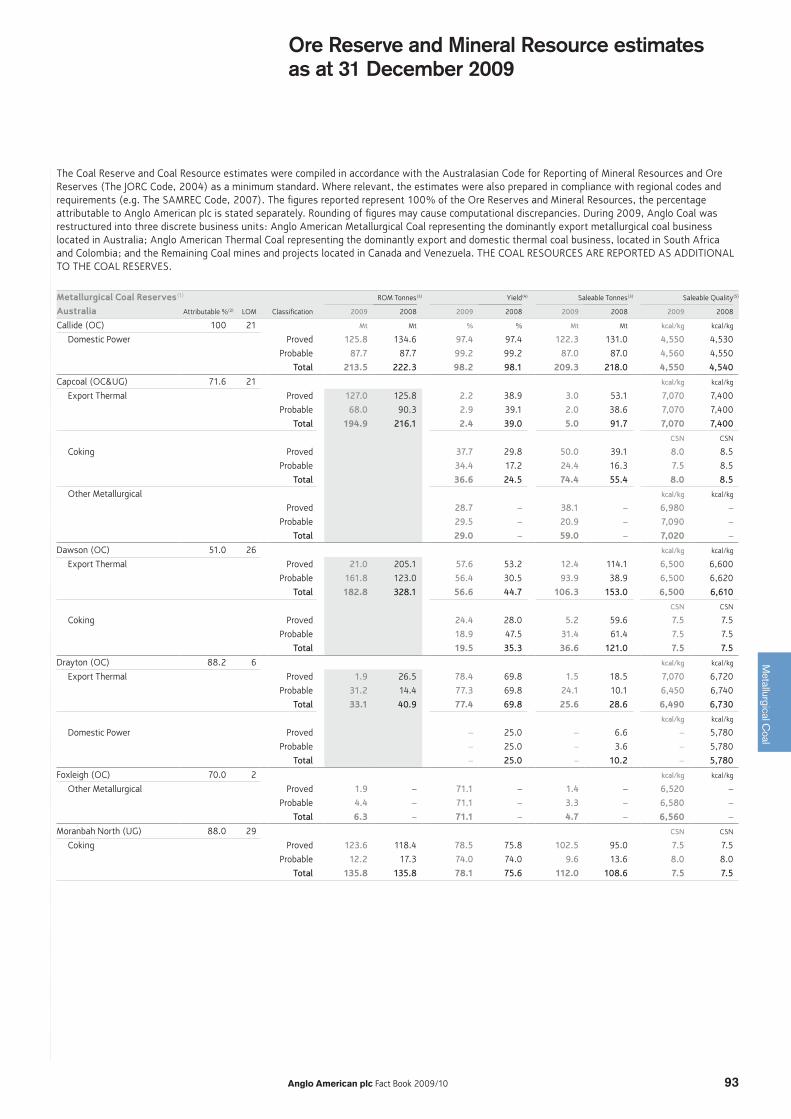
Ore Reserve and Mineral Resource estimates as at 31 December 2009
The Coal Reserve and Coal Resource estimates were compiled in accordance with the Australasian Code for Reporting of Mineral Resources and Ore Reserves (The JORC Code, 2004) as a minimum standard. Where relevant, the estimates were also prepared in compliance with regional codes and requirements (e.g. The SAMREC Code, 2007). The figures reported represent 100% of the Ore Reserves and Mineral Resources, the percentage attributable to Anglo American plc is stated separately. Rounding of figures may cause computational discrepancies. During 2009, Anglo Coal was restructured into three discrete business units: Anglo American Metallurgical Coal representing the dominantly export metallurgical coal business located in Australia; Anglo American Thermal Coal representing the dominantly export and domestic thermal coal business, located in South Africa and Colombia; and the Remaining Coal mines and projects located in Canada and Venezuela. THE COAL RESOURCES ARE REPORTED AS ADDITIONAL TO THE COAL RESERVES.
Metallurgical Coal Reserves(1) ROM Tonnes(3) Yield(4) Saleable Tonnes(3) Saleable Quality(5)
Australia Attributable %(2) LOM Classification 2009 2008 2009 2008 2009 2008 2009 2008
Callide (OC) 100 21 Mt Mt % % Mt Mt kcal/kg kcal/kg
Domestic Power Proved 125.8 134.6 97.4 97.4 122.3 131.0 4,550 4,530
Probable 87.7 87.7 99.2 99.2 87.0 87.0 4,560 4,550
Total 213.5 222.3 98.2 98.1 209.3 218.0 4,550 4,540
Capcoal (OC&UG) 71.6 21 kcal/kg kcal/kg
Export Thermal Proved 127.0 125.8 2.2 38.9 3.0 53.1 7,070 7,400
Probable 68.0 90.3 2.9 39.1 2.0 38.6 7,070 7,400
Total 194.9 216.1 2.4 39.0 5.0 91.7 7,070 7,400
CSN CSN
Coking Proved 37.7 29.8 50.0 39.1 8.0 8.5
Probable 34.4 17.2 24.4 16.3 7.5 8.5
Total 36.6 24.5 74.4 55.4 8.0 8.5
Other Metallurgical kcal/kg kcal/kg
Proved 28.7 – 38.1 – 6,980 –
Probable 29.5 – 20.9 – 7,090 –
Total 29.0 – 59.0 – 7,020 –
Dawson (OC) 51.0 26 kcal/kg kcal/kg
Export Thermal Proved 21.0 205.1 57.6 53.2 12.4 114.1 6,500 6,600
Probable 161.8 123.0 56.4 30.5 93.9 38.9 6,500 6,620
Total 182.8 328.1 56.6 44.7 106.3 153.0 6,500 6,610
CSN CSN
Coking Proved 24.4 28.0 5.2 59.6 7.5 7.5
Probable 18.9 47.5 31.4 61.4 7.5 7.5
Total 19.5 35.3 36.6 121.0 7.5 7.5
Drayton (OC) 88.2 6 kcal/kg kcal/kg
Export Thermal Proved 1.9 26.5 78.4 69.8 1.5 18.5 7,070 6,720
Probable 31.2 14.4 77.3 69.8 24.1 10.1 6,450 6,740
Total 33.1 40.9 77.4 69.8 25.6 28.6 6,490 6,730
kcal/kg kcal/kg
Domestic Power Proved – 25.0 – 6.6 – 5,780
Probable – 25.0 – 3.6 – 5,780
Total – 25.0 – 10.2 – 5,780
Foxleigh (OC) 70.0 2 kcal/kg kcal/kg
Other Metallurgical Proved 1.9 – 71.1 – 1.4 – 6,520 –
Probable 4.4 – 71.1 – 3.3 – 6,580 –
Total 6.3 – 71.1 – 4.7 – 6,560 –
Moranbah North (UG) 88.0 29 CSN CSN
Coking Proved 123.6 118.4 78.5 75.8 102.5 95.0 7.5 7.5
Probable 12.2 17.3 74.0 74.0 9.6 13.6 8.0 8.0
Total 135.8 135.8 78.1 75.6 112.0 108.6 7.5 7.5
94 Anglo American plc Fact Book 2009/10
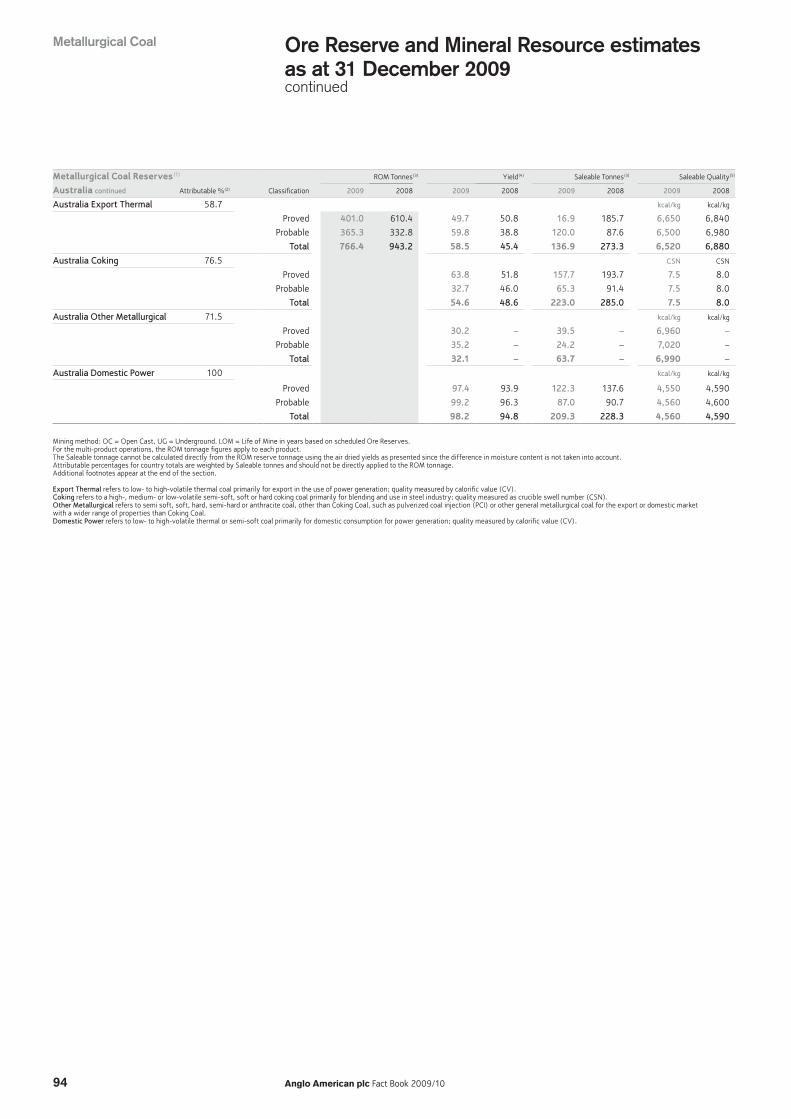
Metallurgical Coal Reserves(1) ROM Tonnes(3) Yield(4) Saleable Tonnes(3) Saleable Quality(5)
Australia continued Attributable %(2) Classification 2009 2008 2009 2008 2009 2008 2009 2008
Australia Export Thermal 58.7 kcal/kg kcal/kg
Proved 401.0 610.4 49.7 50.8 16.9 185.7 6,650 6,840
Probable 365.3 332.8 59.8 38.8 120.0 87.6 6,500 6,980
Total 766.4 943.2 58.5 45.4 136.9 273.3 6,520 6,880
Australia Coking 76.5 CSN CSN
Proved 63.8 51.8 157.7 193.7 7.5 8.0
Probable 32.7 46.0 65.3 91.4 7.5 8.0
Total 54.6 48.6 223.0 285.0 7.5 8.0
Australia Other Metallurgical 71.5 kcal/kg kcal/kg
Proved 30.2 – 39.5 – 6,960 –
Probable 35.2 – 24.2 – 7,020 –
Total 32.1 – 63.7 – 6,990 –
Australia Domestic Power 100 kcal/kg kcal/kg
Proved 97.4 93.9 122.3 137.6 4,550 4,590
Probable 99.2 96.3 87.0 90.7 4,560 4,600
Total 98.2 94.8 209.3 228.3 4,560 4,590
Mining method: OC = Open Cast, UG = Underground. LOM = Life of Mine in years based on scheduled Ore Reserves. For the multi-product operations, the ROM tonnage figures apply to each product. The Saleable tonnage cannot be calculated directly from the ROM reserve tonnage using the air dried yields as presented since the difference in moisture content is not taken into account. Attributable percentages for country totals are weighted by Saleable tonnes and should not be directly applied to the ROM tonnage. Additional footnotes appear at the end of the section. Export Thermal refers to low- to high-volatile thermal coal primarily for export in the use of power generation; quality measured by calorific value (CV). Coking refers to a high-, medium- or low-volatile semi-soft, soft or hard coking coal primarily for blending and use in steel industry; quality measured as crucible swell number (CSN). Other Metallurgical refers to semi soft, soft, hard, semi-hard or anthracite coal, other than Coking Coal, such as pulverized coal injection (PCI) or other general metallurgical coal for the export or domestic market with a wider range of properties than Coking Coal. Domestic Power refers to low- to high-volatile thermal or semi-soft coal primarily for domestic consumption for power generation; quality measured by calorific value (CV).
Ore Reserve and Mineral Resource estimates as at 31 December 2009continued
Metallurgical Coal
Anglo American plc Fact Book 2009/10 95
Metallurgical C
oal
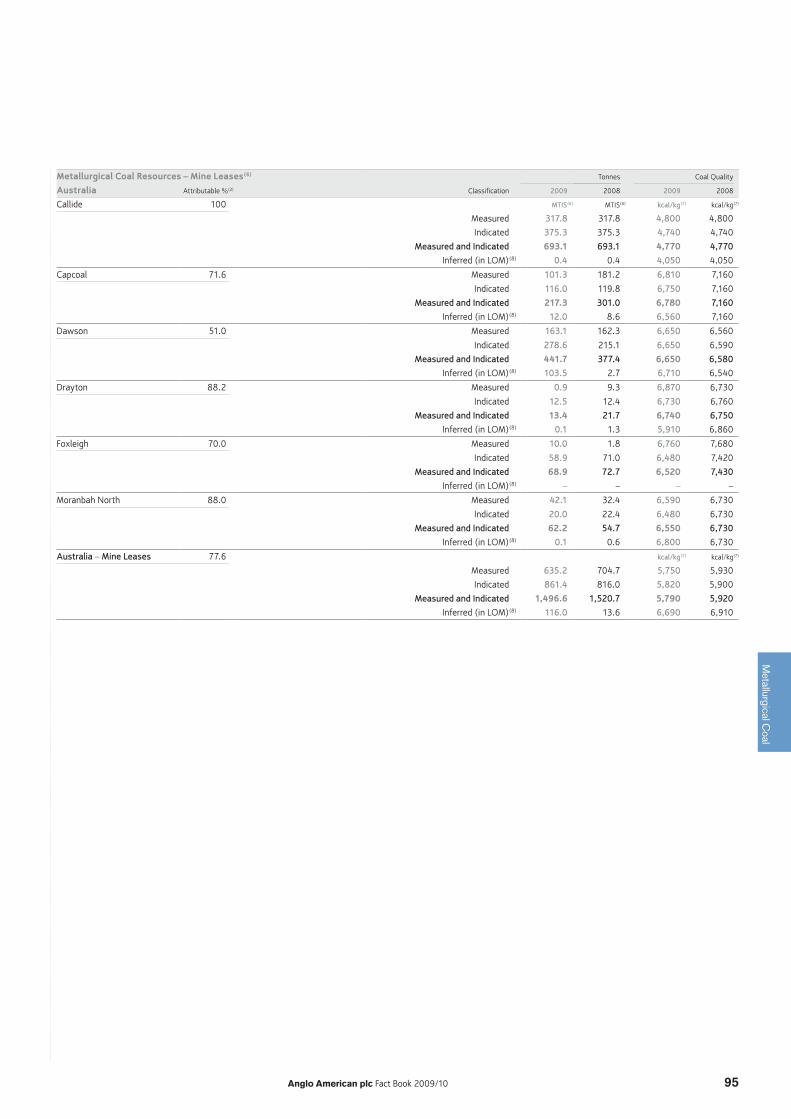
Metallurgical Coal Resources – Mine Leases(6) Tonnes Coal Quality
Australia Attributable %(2) Classification 2009 2008 2009 2008
Callide 100 MTIS(6) MTIS(6) kcal/kg(7) kcal/kg (7)
Measured 317.8 317.8 4,800 4,800
Indicated 375.3 375.3 4,740 4,740
Measured and Indicated 693.1 693.1 4,770 4,770
Inferred (in LOM)(8) 0.4 0.4 4,050 4,050
Capcoal 71.6 Measured 101.3 181.2 6,810 7,160
Indicated 116.0 119.8 6,750 7,160
Measured and Indicated 217.3 301.0 6,780 7,160
Inferred (in LOM)(8) 12.0 8.6 6,560 7,160
Dawson 51.0 Measured 163.1 162.3 6,650 6,560
Indicated 278.6 215.1 6,650 6,590
Measured and Indicated 441.7 377.4 6,650 6,580
Inferred (in LOM)(8) 103.5 2.7 6,710 6,540
Drayton 88.2 Measured 0.9 9.3 6,870 6,730
Indicated 12.5 12.4 6,730 6,760
Measured and Indicated 13.4 21.7 6,740 6,750
Inferred (in LOM)(8) 0.1 1.3 5,910 6,860
Foxleigh 70.0 Measured 10.0 1.8 6,760 7,680
Indicated 58.9 71.0 6,480 7,420
Measured and Indicated 68.9 72.7 6,520 7,430
Inferred (in LOM)(8) – – – –
Moranbah North 88.0 Measured 42.1 32.4 6,590 6,730
Indicated 20.0 22.4 6,480 6,730
Measured and Indicated 62.2 54.7 6,550 6,730
Inferred (in LOM)(8) 0.1 0.6 6,800 6,730
Australia – Mine Leases 77.6 kcal/kg(7) kcal/kg (7)
Measured 635.2 704.7 5,750 5,930
Indicated 861.4 816.0 5,820 5,900
Measured and Indicated 1,496.6 1,520.7 5,790 5,920
Inferred (in LOM)(8) 116.0 13.6 6,690 6,910
96 Anglo American plc Fact Book 2009/10
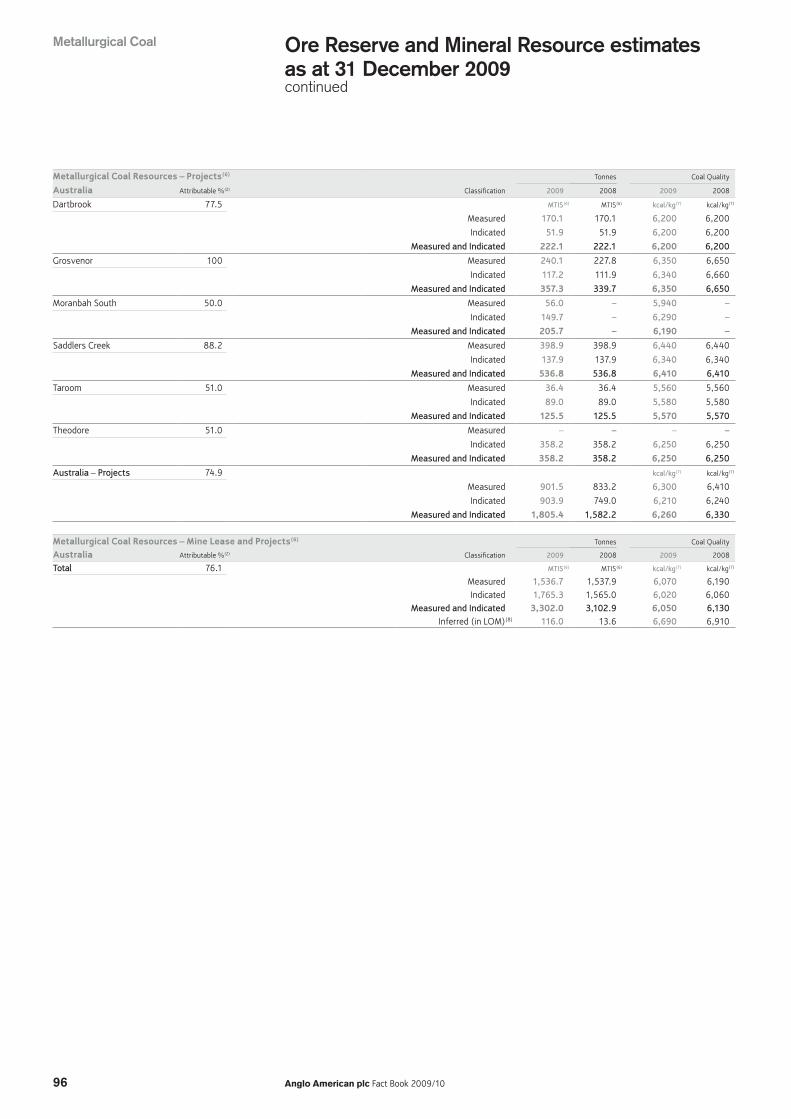
Ore Reserve and Mineral Resource estimates as at 31 December 2009continued
Metallurgical Coal Resources – Projects(6) Tonnes Coal Quality
Australia Attributable %(2) Classification 2009 2008 2009 2008
Dartbrook 77.5 MTIS(6) MTIS(6) kcal/kg(7) kcal/kg (7)
Measured 170.1 170.1 6,200 6,200
Indicated 51.9 51.9 6,200 6,200
Measured and Indicated 222.1 222.1 6,200 6,200
Grosvenor 100 Measured 240.1 227.8 6,350 6,650
Indicated 117.2 111.9 6,340 6,660
Measured and Indicated 357.3 339.7 6,350 6,650
Moranbah South 50.0 Measured 56.0 – 5,940 –
Indicated 149.7 – 6,290 –
Measured and Indicated 205.7 – 6,190 –
Saddlers Creek 88.2 Measured 398.9 398.9 6,440 6,440
Indicated 137.9 137.9 6,340 6,340
Measured and Indicated 536.8 536.8 6,410 6,410
Taroom 51.0 Measured 36.4 36.4 5,560 5,560
Indicated 89.0 89.0 5,580 5,580
Measured and Indicated 125.5 125.5 5,570 5,570
Theodore 51.0 Measured – – – –
Indicated 358.2 358.2 6,250 6,250
Measured and Indicated 358.2 358.2 6,250 6,250
Australia – Projects 74.9 kcal/kg(7) kcal/kg (7)
Measured 901.5 833.2 6,300 6,410
Indicated 903.9 749.0 6,210 6,240
Measured and Indicated 1,805.4 1,582.2 6,260 6,330
Metallurgical Coal Resources – Mine Lease and Projects(6) Tonnes Coal Quality
Australia Attributable %(2) Classification 2009 2008 2009 2008
Total 76.1 MTIS(6) MTIS(6) kcal/kg(7) kcal/kg (7)
Measured 1,536.7 1,537.9 6,070 6,190Indicated 1,765.3 1,565.0 6,020 6,060
Measured and Indicated 3,302.0 3,102.9 6,050 6,130Inferred (in LOM)(8) 116.0 13.6 6,690 6,910
Metallurgical Coal
Anglo American plc Fact Book 2009/10 97
Metallurgical C
oal
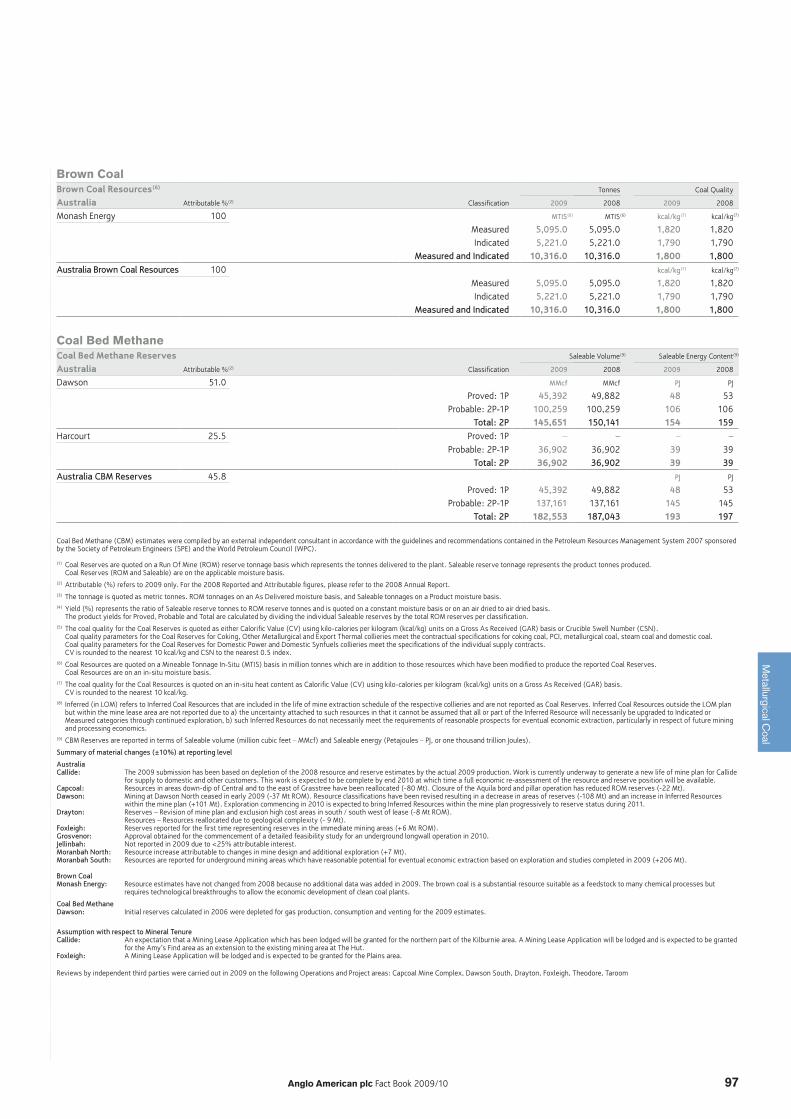
Brown CoalBrown Coal Resources(6) Tonnes Coal Quality
Australia Attributable %(2) Classification 2009 2008 2009 2008
Monash Energy 100 MTIS(6) MTIS(6) kcal/kg(7) kcal/kg (7)
Measured 5,095.0 5,095.0 1,820 1,820Indicated 5,221.0 5,221.0 1,790 1,790
Measured and Indicated 10,316.0 10,316.0 1,800 1,800Australia Brown Coal Resources 100 kcal/kg(7) kcal/kg (7)
Measured 5,095.0 5,095.0 1,820 1,820Indicated 5,221.0 5,221.0 1,790 1,790
Measured and Indicated 10,316.0 10,316.0 1,800 1,800
Coal Bed MethaneCoal Bed Methane Reserves Saleable Volume(9) Saleable Energy Content(9)
Australia Attributable %(2) Classification 2009 2008 2009 2008
Dawson 51.0 MMcf MMcf PJ PJ
Proved: 1P 45,392 49,882 48 53Probable: 2P-1P 100,259 100,259 106 106
Total: 2P 145,651 150,141 154 159Harcourt 25.5 Proved: 1P – – – –
Probable: 2P-1P 36,902 36,902 39 39Total: 2P 36,902 36,902 39 39
Australia CBM Reserves 45.8 PJ PJ
Proved: 1P 45,392 49,882 48 53Probable: 2P-1P 137,161 137,161 145 145
Total: 2P 182,553 187,043 193 197
Coal Bed Methane (CBM) estimates were compiled by an external independent consultant in accordance with the guidelines and recommendations contained in the Petroleum Resources Management System 2007 sponsored by the Society of Petroleum Engineers (SPE) and the World Petroleum Council (WPC).
(1) Coal Reserves are quoted on a Run Of Mine (ROM) reserve tonnage basis which represents the tonnes delivered to the plant. Saleable reserve tonnage represents the product tonnes produced. Coal Reserves (ROM and Saleable) are on the applicable moisture basis.
(2) Attributable (%) refers to 2009 only. For the 2008 Reported and Attributable figures, please refer to the 2008 Annual Report.(3) The tonnage is quoted as metric tonnes. ROM tonnages on an As Delivered moisture basis, and Saleable tonnages on a Product moisture basis.(4) Yield (%) represents the ratio of Saleable reserve tonnes to ROM reserve tonnes and is quoted on a constant moisture basis or on an air dried to air dried basis.
The product yields for Proved, Probable and Total are calculated by dividing the individual Saleable reserves by the total ROM reserves per classification.(5) The coal quality for the Coal Reserves is quoted as either Calorific Value (CV) using kilo-calories per kilogram (kcal/kg) units on a Gross As Received (GAR) basis or Crucible Swell Number (CSN).
Coal quality parameters for the Coal Reserves for Coking, Other Metallurgical and Export Thermal collieries meet the contractual specifications for coking coal, PCI, metallurgical coal, steam coal and domestic coal. Coal quality parameters for the Coal Reserves for Domestic Power and Domestic Synfuels collieries meet the specifications of the individual supply contracts. CV is rounded to the nearest 10 kcal/kg and CSN to the nearest 0.5 index.
(6) Coal Resources are quoted on a Mineable Tonnage In-Situ (MTIS) basis in million tonnes which are in addition to those resources which have been modified to produce the reported Coal Reserves. Coal Resources are on an in-situ moisture basis.
(7) The coal quality for the Coal Resources is quoted on an in-situ heat content as Calorific Value (CV) using kilo-calories per kilogram (kcal/kg) units on a Gross As Received (GAR) basis. CV is rounded to the nearest 10 kcal/kg.
(8) Inferred (in LOM) refers to Inferred Coal Resources that are included in the life of mine extraction schedule of the respective collieries and are not reported as Coal Reserves. Inferred Coal Resources outside the LOM plan but within the mine lease area are not reported due to a) the uncertainty attached to such resources in that it cannot be assumed that all or part of the Inferred Resource will necessarily be upgraded to Indicated or Measured categories through continued exploration, b) such Inferred Resources do not necessarily meet the requirements of reasonable prospects for eventual economic extraction, particularly in respect of future mining and processing economics.
(9) CBM Reserves are reported in terms of Saleable volume (million cubic feet – MMcf) and Saleable energy (Petajoules – PJ, or one thousand trillion Joules).
Summary of material changes (±10%) at reporting level
Australia Callide: The 2009 submission has been based on depletion of the 2008 resource and reserve estimates by the actual 2009 production. Work is currently underway to generate a new life of mine plan for Callide for supply to domestic and other customers. This work is expected to be complete by end 2010 at which time a full economic re-assessment of the resource and reserve position will be available. Capcoal: Resources in areas down-dip of Central and to the east of Grasstree have been reallocated (-80 Mt). Closure of the Aquila bord and pillar operation has reduced ROM reserves (-22 Mt).Dawson: Mining at Dawson North ceased in early 2009 (-37 Mt ROM). Resource classifications have been revised resulting in a decrease in areas of reserves (-108 Mt) and an increase in Inferred Resources
within the mine plan (+101 Mt). Exploration commencing in 2010 is expected to bring Inferred Resources within the mine plan progressively to reserve status during 2011.Drayton: Reserves – Revision of mine plan and exclusion high cost areas in south / south west of lease (-8 Mt ROM). Resources – Resources reallocated due to geological complexity (- 9 Mt).Foxleigh: Reserves reported for the first time representing reserves in the immediate mining areas (+6 Mt ROM). Grosvenor: Approval obtained for the commencement of a detailed feasibility study for an underground longwall operation in 2010. Jellinbah: Not reported in 2009 due to <25% attributable interest. Moranbah North: Resource increase attributable to changes in mine design and additional exploration (+7 Mt). Moranbah South: Resources are reported for underground mining areas which have reasonable potential for eventual economic extraction based on exploration and studies completed in 2009 (+206 Mt).
Brown Coal Monash Energy: Resource estimates have not changed from 2008 because no additional data was added in 2009. The brown coal is a substantial resource suitable as a feedstock to many chemical processes but
requires technological breakthroughs to allow the economic development of clean coal plants.
Coal Bed Methane Dawson: Initial reserves calculated in 2006 were depleted for gas production, consumption and venting for the 2009 estimates.
Assumption with respect to Mineral Tenure Callide: An expectation that a Mining Lease Application which has been lodged will be granted for the northern part of the Kilburnie area. A Mining Lease Application will be lodged and is expected to be granted for the Amy’s Find area as an extension to the existing mining area at The Hut. Foxleigh: A Mining Lease Application will be lodged and is expected to be granted for the Plains area.
Reviews by independent third parties were carried out in 2009 on the following Operations and Project areas: Capcoal Mine Complex, Dawson South, Drayton, Foxleigh, Theodore, Taroom

98 Anglo American plc Fact Book 2009/10
Metallurgical Coal


