103 Asian J Agric & Biol. 2019;7(1):103-115.
Asian J Agric & Biol. 2019;7(1): 103-115.
Microbiological quality and sensory evaluation of partially dried mango for fruit salad, Kerabu Mangga
Lani Mohd Nizam1, Adnan Nur Ardawati1, Mohd Maidin Nurmahani1*, Ibrahim Roshita2, Hassan Zaiton3 1School of Food Science and Technology, Universiti Malaysia Terengganu, 21030 Kuala Nerus, Terengganu, Malaysia 2Department of Chemical Engineering Technology, Faculty of Engineering Technology, Universiti Malaysia Perlis, Uniciti
Alam Campus Sg. Chuchuh, 02100 Pedang Besar, Perlis, Malaysia 3Faculty of Science and Technology, Universiti Sains Islam Malaysia (USIM), Bandar Baru Nilai, 71800 Nilai, Negeri
Sembilan, Malaysia
Abstract Kerabu Mangga is a fruit salad that is made from unripe matured mangoes. This salad
is prepared fresh mixed with other ingredients. Since this salad has limited shelf life,
the mango were dried at 60oC for one and two hours, then mixed with other ingredients
in an attempt to make this salad has longer shelf life and readily available when
mangoes are not in season. The effects of drying on water activity (aw), microbial load,
shelf life of ‘Kerabu Mangga’ during storage at room (28 ± 2ºC) and chilled (5 ± 1ºC)
temperatures as well as determination acceptance and nutrient compositions of the
prepared ‘Kerabu Mangga’ were carried out. Drying treatment reduced the initial water
activity (aw) of fresh mango from 0.994 to 0.953 and 0.874 after 1 and 2 h drying,
respectively, and the microbial load was reduced (~ 0.6 log10 CFU/g) after drying
treatments. Drying at 60°C affected significantly (p<0.05) the appearance and colour
of the dried mango slices, without affecting the overall acceptability of the prepared
Kerabu Mangga. Storage temperature affected significantly (p<0.05) the microbial
load (Total Plate Count), where chiller storage took 10 days compared to 12 h for room
temperature to reach spoilage to occur (normally at log10 6.00 CFU/g). For the nutrient
compositions, only carbohydrate contents showed significant increased at (P<0.05),
however, vitamin C content showed significant decreased (P<0.05). Drying for only 1
and 2 hours was found to be suitable for partially dried ‘Kerabu Mangga’ which resulted
in negligible effect on its overall acceptance. Drying the mango slices at 60oC for 2 h
resulted in longer shelf life than 1 h or without heat treatment.
Keywords: Microbiological quality, Sensory evaluation, Dried mango, Kerabu
mangga
How to cite this: Lani MN, Adnan NA, Nurmahani MM, Ibrahim R and Hasan Z, 2019. Microbiological
quality and sensory evaluation of partially dried mango for fruit salad, Kerabu Mangga.
Asian J. Agric. Biol. 7(1): 103-115.
This is an Open Access article distributed under the terms of the Creative Commons Attribution 3.0 License.
(https://creativecommons.org/licenses/by/3.0), which permits unrestricted use, distribution, and reproduction in any medium,
provided the original work is properly cited.
Introduction
Kerabu Mangga is a mango salad which is well-known
in Malaysia and usually served with other dishes. This
fruit salad consists a mixture of slices mangoes,
shallots, lemon grasses, torch ginger buds, bird’s eye
Original Article
Received: September 22, 2018
Accepted: February 19, 2019
Published: March 30, 2019
*Corresponding author email: [email protected]
AJAB
Lani Mohd Nizam et al
104 Asian J Agric & Biol. 2019;7(1):103-115.
chilies, dried shrimps, lime juice, toasted grated
coconut (‘kerisik’) and sugar. The preparation of
‘Kerabu Mangga’ does not involve any heat treatment.
Nguyen and Carlin (1994) reported that the microbial
counts of raw foods are typically ranged from 103
CFU/g to 109 CFU/g. However, after processing, it can
be reduced to a range from 103 CFU/g to 106 CFU/g.
Salmonella sp. was detected present in dried shrimps
(Iyer and Shrivastava, 1989) while Listeria
monocytogenes was isolated from ready-to-eat (RTE)
shrimp products (Ben Embarek, 1994). Fruits and
vegetables contain natural microbiota from the
environment and influenced by the transportation and
storage (Galati et al., 2013). In other study by Poubol
and Izumi 2006), the predominant genera in
mesophilic aerobic bacteria in mango cubes (‘Nam
Dokmai’) were Enterobacter, Klebsiellaand Pantoea
and in the yeasts were Candida, Cryptococcus,
and Rhodotorula. Since cooking is not involved in the
preparation of this mango salad, this product has
limited shelf life.
All the ingredients used are fresh and sliced that will
allow the exudates to support microbial growth during
storage that can have negative effect on the shelf life
quality of the product as well as pose a safety hazard.
It is envisaged that by partially drying the mango slices
can maintain low microbial number in the “Kerabu
Mangga”, thus making it possible for this product to
be widely available.
Therefore, the purpose of this study was to determine
the effect of using partially dried mango as the main
ingredient in an attempt to extend the shelf life and
consumer acceptability of the product. Determination
of the microbial loads (Aerobic Plate Count (APC),
Mould and Yeast count, Staphylococcus aureus and
Enterobacteriaceae count as well as the nutritional
composition of prepared “Kerabu Mangga were
carried out.
Material and Methods
Preparation of ‘Kerabu Mangga’
Matured mango of variety harum manis (maturity
index 1) and other ingredients needed for making
Kerabu Manga were purchased from the local market
at Batu Enam, Kuala Terengganu. Kerabu Mangga
was prepared following the recipe described by
Noraini (2004). About 30 g of the mango salad were
washed, skin peeled and sliced of size with the
thickness of 0.3 cm x 5 cm and then was packed in
sterile plastic bag prior to drying.
Drying of mango slices
The slices mango in the sterile plastic bags were
arranged in a single layer on the tray and immediately
dried in the oven 60oC (Model OGS60, ThermoFisher
Scientific, China) for either one or two hours. The
slices mango was dried using the oven dryer at a
constant temperature of 60°C. Kerabu Manga was
labelled A for control (fresh, sliced mango with no
heat treatment), B for mango dried for 1 h and C for
mango dried for 2 h. The other ingredients used in this
preparation were used fresh.
Water activity (aw) measurements
The water activity (aw) of slices mango samples was
measured at 25 ± 1°C by using an electronic dew-point
water activity meter, Aqualab Series 3 model TE
(Decagon Devices, Pullman, Washington, USA). The
equipment was calibrated with saturated salt solutions
in the aw range of interest (Favetto et al., 1983). For
each determination, two replicates were obtained and
the average was reported (Fontana, 2001).
Microbiological analysis
Aerobic plate count (APC)
The Aerobic Plate Count (APC) was used to evaluate
the microbiological quality of foods. High APC (> 106
CFU/g) indicates that the food is about to spoil.
Aseptically, 0.1 ml of appropriate dilution was spread
plated on Plate Count Agar medium (Merck,
Germany) and the plates were inverted and incubated
at 35°C for 24 hours (Ramli et al., 2014).
Yeast and Mould Count
Potato Dextrose Agar (PDA) acidified with 10%
tartaric acid was used to determine yeast and mould
count. Aseptically, 0.1ml of appropriate dilutions was
spread plated on PDA medium (Merck, Germany) and
the sterilized glass spreader was used to spread the
inoculums and the plate was allowed to dry for 15
minutes. The plates were inverted and incubated at
25°C for 120 hours (Ramli et al., 2014).
Staphylococcus aureus
The Baird Parker’s medium was used for the detection
and enumeration of Staphylococcus aureus. A 0.1 ml
of appropriate dilutions was spread plated on the
medium (Merck, Germany). The plates were inverted
and incubated at 35-37°C aerobically for 24 h. If no
colonies have developed, the plates were incubated for
further 24 h (Ramli et al., 2014).
Lani Mohd Nizam et al
105 Asian J Agric & Biol. 2019;7(1):103-115.
Enterobacteriaceae
Violet Red Bile Dextrose (VRBD) Agar contains
dextrose and designed to enumerate bacterial colonies
as a ‘total Enterobacteriaceae’. A 0.1ml of appropriate
dilutions were spread plated on VRBD medium and
allowed to dry for 15 minutes. The medium was
inverted to prevent condensation and incubated at
35°C for 24 h (Ramli et al., 2014).
Proximate Analyses
Moisture
Moisture content of samples was measured using air-
oven following official methods of Association of
Official Analytical Chemists (AOAC, 2000). A
material test chamber M720 (Binder GmbH,
Germany) was used to dry the samples till constant
weight was obtained. A 5 g of Kerabu mangga samples
in crucibles were dried in the oven at 105°C for 24 h.
After drying process, the crucibles were closed and
cooled in desiccators. The crucibles were weighed
without the lid and the percentage of moisture content
was calculated as described by the oven drying method
(AOAC, 2000).
Ash content
A drying ash method was used to determine the ash
content in ‘Kerabu Mangga’ samples (AOAC, 2000).
A 5g sample was weighed in the crucible and was
heated slowly until no smoke produced from the
sample. Then, the crucibles were transferred into the
muffle furnace at 550°C until the next day. The
remaining inorganic materials was cooled and
weighed and the percentage ash of ‘Kerabu mangga’
sample was calculated as follow:
𝑃𝑒𝑟𝑐𝑒𝑛𝑡𝑎𝑔𝑒 𝑜𝑓 𝑎𝑠ℎ
=𝑊𝑒𝑖𝑔ℎ𝑡 𝑜𝑓 𝑎𝑠ℎ
𝐼𝑛𝑖𝑡𝑖𝑎𝑙 𝑠𝑎𝑚𝑝𝑙𝑒 𝑤𝑒𝑖𝑔ℎ𝑡 𝑥 100
Crude fat content
Determination of crude fat content was performed
following Soxhlet method previously described by
AOAC, 2000. Extraction cups were dried at 100°C,
cooled and weighed (W2). Then, 2 g of sample (W1)
was weighed inside the extraction thimble and the
crude fat content process was determined by using the
Soxtec Extraction for 1 h using petroleum ether. The
ether was evaporated in distiller and the crude fat
obtained from aluminium container was dried at 103oC
for 2 hours using oven. The samples were evaporated
in desiccators for 15 to 20 minutes before it is weighed
(W3). Percentage of crude fat was calculated as
follows:
𝑃𝑒𝑟𝑐𝑒𝑛𝑡𝑎𝑔𝑒 𝑜𝑓 𝑐𝑟𝑢𝑑𝑒 𝑓𝑎𝑡 =𝑊3 − 𝑊2
𝑊1 𝑥 100
W1 = Sample weight (g)
W2 = Weight of extraction cup (g)
W3 = Weight of extraction cup with crude fat (g)
Crude protein content
The crude protein content of “Kerabu Mangga” was
determined using Kjeltec 2100 Distillation Unit
System according to method described by AOAC
(2000). A 2 g of ground “Kerabu Mangga” sample was
weighed and placed into the digestion flask. The
catalyst tablets of Kjeltabs Cu 3.5 and 12 ml H2SO4
was added into the digestion flask. Exhaust system
was connected to the digestion tubes in the rack and
then the water aspirator was operated to full flow. The
rack and the exhaust system was placed on the
Digested Heater Block D36 of 42°C and after 5
minutes, the water aspiration was turned down and
continued to digest. The digestion was completed
when green or blue solution was formed.
The exhaust system was connected to let it cooled for
10 to 20 minutes even after the rack of tubes was
removed. Then, 75 ml of distilled water was added.
For distillation process, 25 ml of boric acid and 10
drops of bromocresol green solution was prepared.
The digestion tube was placed in the distillation unit
and 50 ml sodium hydroxide (NaOH) solution was
added into the tube and steam generator distilled the
sample for 5 minutes. After that, the distillation was
titrated with hydrochloric acid (HCl) until the grey
point was achieved. A nitrogen-to-protein conversion
factor of 6.25 was used for the determination of crude
protein in the samples. Crude protein content was
calculated using the formula shown below:
𝑃𝑒𝑟𝑐𝑒𝑛𝑡𝑎𝑔𝑒 𝑜𝑓 𝑁 =(𝑇 − 𝐵) 𝑥 𝑁 𝑥 14.007
𝑊𝑒𝑖𝑔ℎ𝑡 𝑜𝑓 𝑠𝑎𝑚𝑝𝑙𝑒 𝑖𝑛 𝑚𝑔 𝑥 100
𝑃𝑒𝑟𝑐𝑒𝑛𝑡𝑎𝑔𝑒 𝑜𝑓 𝑐𝑟𝑢𝑑𝑒 𝑝𝑟𝑜𝑡𝑒𝑖𝑛 = % 𝑜𝑓 𝑁 𝑥 𝐹 𝑥 100
Where, T = Volume of sample titration
B = Volume of blank titration
N = Normality HCl/ acid
Crude fiber content
Lani Mohd Nizam et al
106 Asian J Agric & Biol. 2019;7(1):103-115.
The crude fiber was determined using Crude
Fibertec® 2021 Crude fiberCap system. Dried Crude
fiberCap capsule with lid was weighed as (W1). A 2.0
g of ‘Kerabu Mangga’ samples was added into the pre-
dried capsule (W2). The extraction flask was boiled
and added with sulphuric acid. Condensers were put
on extraction flask and the water pipe was opened for
reflux system for 20 minutes. The extraction flask was
washed and dried up. Then, the reagent was changed
from sulphuric acid with sodium hydroxide. Lastly,
the crude fiber was washed with acetone to remove the
crude fat. Capsule was added with 120 ml acetone and
stirred for 30 minute. The capsules were dried in oven
for 2 hour at 130°C. The capsule was weighed after
cooled for (W3). The capsule was then placed in
crucible for ashing for 4 hours at 600°C (W4). The
capsule was weighed again for (W5). The crude fiber
was determined by:
𝑃𝑒𝑟𝑐𝑒𝑛𝑡𝑎𝑔𝑒 𝑜𝑓 𝑐𝑟𝑢𝑑𝑒 𝑓𝑖𝑏𝑟𝑒
=𝑊3 − (𝑊1 𝑥 𝐶) − (𝑊5 − 𝑊4 − 𝐷)
𝑊2 𝑥 100
W1= Beginning capsule weight (g)
W2= Weight of sample (g)
W3= Weight of capsule + weight of residue (g)
W4= Weight of crucible (g)
W5= Weight for total ash (g)
C= Error
D= Capsule ash (g)
Carbohydrate The total carbohydrate content (%) in the samples was
calculated by difference method as follows:
𝐶𝑎𝑟𝑏𝑜ℎ𝑦𝑑𝑟𝑎𝑡𝑒 (%) = 100 − (% 𝑚𝑜𝑖𝑠𝑡𝑢𝑟𝑒 +% 𝑐𝑟𝑢𝑑𝑒 𝑝𝑟𝑜𝑡𝑒𝑖𝑛 + % 𝐶𝑟𝑢𝑑𝑒 𝑓𝑖𝑏𝑟𝑒 +% 𝐶𝑟𝑢𝑑𝑒 𝑓𝑎𝑡 + % 𝑎𝑠ℎ)
Ascorbic acid The amount of ascorbic acid were determined
according to Jagota and Dani (1982) method using
Folin reagent and the absorbance was read at 760 nm.
The standard solution was prepared by dissolving
0.05g of 2,6 dichlorophenolindophenol in 100 ml
distilled water and filtered. Ascorbic acid solution was
prepared by dissolving 0.05g ascorbic acid (Sigma-
Aldrich, Germany) in 60 ml 20% metaphosphoric acid
and diluted to 250 ml.
Sensory analysis
Three samples of ‘Kerabu Mangga’ stored at different
temperatures (Room Temperature and Chilled
Temperature) were placed in small closed plastic
containers and randomly coded. The samples were
presented to 30 untrained panellists in small trays. The
‘Kerabu Mangga’ samples were evaluated based on
six attributes which were the appearance, colour,
odour, flavour, texture and overall characteristics of
the samples. The attributes were scored using the 9-
points hedonic scale ranging from dislike extremely
(0) to like extremely (9). The sensory analysis was
carried out for one time in order to determine the
consumer’s acceptance of ‘Kerabu Mangga’ stored at
different temperatures.
Statistical analysis Statistical analyses were conducted using Minitab,
version 14 for Windows. All the determinations were
carried out in triplicate and data were expressed as
mean ± standard deviation. The significant differences
of means were compared using the Fisher’s LSD test
from one-way ANOVA (Analysis of Variance) at a
significant level of P < 0.05.
Results and Discussion Water activity (aw) measurement
Drying mango slices at 60oC for either one (sample B)
or two hours (sample C) significantly (p<0.05)
reduced the water activity compared to control
(sample A, mango slices without heat treatment)
(Figure 1). Raw non- heat treated mango slices showed
water activity (aw) which is 0.994. This result is similar
to that reported by Nieto et al. (2000) where aw of fresh
raw mango was 0.99. High aw of fresh mango (0.99)
would easily deteriorate during storage (Nieto et al.,
2000). Drying of mango slices at 60ºC reduced the aw
of sample B to 0.95 and 0.86 of sample C. Drying time
was shown to be the primary factors in influencing aw.
Although Pott et al. (2005) noted that drying mango
slice to final aw of 0.6 instead of 0.45 had reduced the
drying time significantly and enhanced the product
stability without affecting product colour and market
value, longer exposure of shredded mango at 60ºC
however, caused browning reaction. Park et al. (1980)
suggested that moderate drying temperature and high
water activity (aw) in the sample might be ascribed to
elevated polyphenol oxidase activities, resulting in the
formation of coloured quinoid compounds.

Lani Mohd Nizam et al
107 Asian J Agric & Biol. 2019;7(1):103-115.
Drying time of more than two hours has reduced more
than 30% of moisture content. Drying of shredded
mango for more than two hours resulted in
considerable shrinkage and produced an unacceptable
product. Shrinkage during drying of fruits occurs
when the viscoelastic matrix contracts into the space
previously occupied by the water removed from the
cells (Aguilera, 2003).
Fig. 1. Water activity (aw) measurement of
shredded mango. Values are the mean ± standard
deviation of two replicates (n = 2). Significant level
was defined at (P < 0.05).
Microbial analysis
Aerobic plate count (APC)
The control (sample A) had higher APC (4.90 CFU/g)
than the heat treated samples (Figure 2A) in the
beginning. However, towards the end of storage time,
there was no significant difference in all three samples
including those samples that have been dried at 60oC
for one or two hours. The reductions of APC at 0-hour
in treated samples were supported by previous study
by Bang et al. (2010) reported that dry heat treatment
for 6 hours significantly decreased the number
Escherichia coli O157:H7. Shaw et al. (1993) noted
that total bacterial count of mango skin ranged
between 4 and > 100 CFU/20 cm2. High bacteria
counts of mango flesh may be the result of
contamination during manual peeling process.
There was no significant difference (P > 0.05) between
drying time with Aerobic Plate Count (APC). Even
though the final aw after drying treatments was reduced
in the range of 0.85-0.99, bacteria could be detected
present in ‘Kerabu Mangga” made with the heat
treated mango slices. Sliced mango fruit are very
perishable because they contained less pericarp that
protect the fruit (Tovar et al., 2001). Additionally,
sliced fruits suffer physiological changes that occur in
wounded viable tissue (Baldwin et al., 1995). The
wounded viable tissues allow microbes to penetrate
into mango flesh and deteriorate it until become
undesirable. Sample A had the longest generation time
which was 1.64 hours. The generation times (gt) of
treated samples were as follows; Sample B- 1.31 hours
and Sample C- 1.39. Treated samples have shorter
generation time and the finding was supported by
Roday (1999) where the length of generation time was
influenced by the environmental factors such as food
availability, pH, temperature, moisture content, and
presence of oxygen and inhibitors effect. Generation
time became shorten if the condition is favorable and
lengthens if the condition is less favorable.
Fig. 2. Aerobic plate counts (APC) of different
samples of kerabu mangga stored at (i) room
temperature 28°C ± 2°C and (ii) chill temperature
5°C ± 1°C
Based on the calculated generation time, drying
treatment increased the generation time from 1.50
days for Sample A to 1.81 days for Sample B and 1.87
days for Sample C. Storing “Kerabu Mangga” at
0.75
0.8
0.85
0.9
0.95
1
A B C
Wate
r act
ivit
y (
aw
)
Sample
0.00
1.00
2.00
3.00
4.00
5.00
6.00
7.00
0 2 4 6 8 10 12 14
CFU/g
(log10)
Time (hour)
ABC
(i)
0.00
1.00
2.00
3.00
4.00
5.00
6.00
7.00
0 2 4 6 8 10 12 14
CF
U/g
(lo
g 1
0)
Time (Day)
A
B
C
(ii)
Lani Mohd Nizam et al
108 Asian J Agric & Biol. 2019;7(1):103-115.
chilling temperature (5°C) significantly (p<0.05)
reduced the Aerobic Plate Count (APC) and
lengthened the generation time (Figure 2B). There was
no clear trend observed between these samples at 14
days although the APC generally decreased until day
8 and started to increase towards day 12. Chilling of
fruits and vegetables does not completely inhibit
microorganisms but reduces the growth rates (Nguyen
and Carlin, 1994).
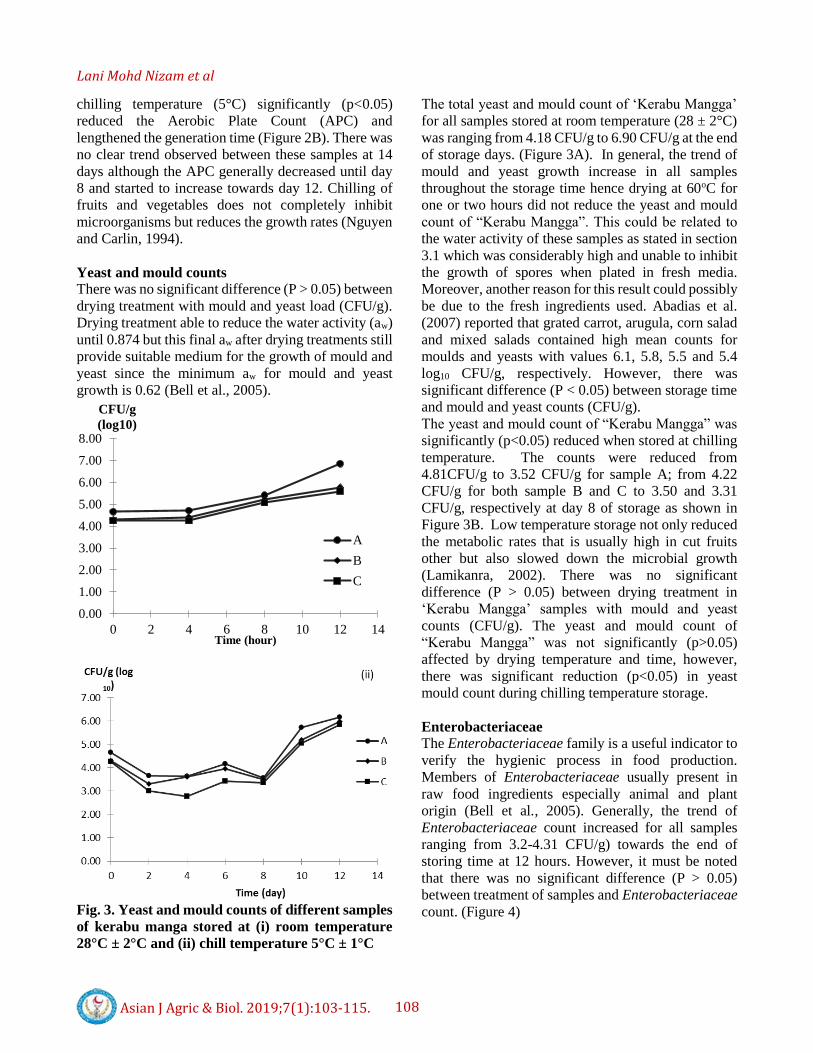
Yeast and mould counts
There was no significant difference (P > 0.05) between
drying treatment with mould and yeast load (CFU/g).
Drying treatment able to reduce the water activity (aw)
until 0.874 but this final aw after drying treatments still
provide suitable medium for the growth of mould and
yeast since the minimum aw for mould and yeast
growth is 0.62 (Bell et al., 2005).
Fig. 3. Yeast and mould counts of different samples
of kerabu manga stored at (i) room temperature
28°C ± 2°C and (ii) chill temperature 5°C ± 1°C
The total yeast and mould count of ‘Kerabu Mangga’
for all samples stored at room temperature (28 ± 2°C)
was ranging from 4.18 CFU/g to 6.90 CFU/g at the end
of storage days. (Figure 3A). In general, the trend of
mould and yeast growth increase in all samples
throughout the storage time hence drying at 60oC for
one or two hours did not reduce the yeast and mould
count of “Kerabu Mangga”. This could be related to
the water activity of these samples as stated in section
3.1 which was considerably high and unable to inhibit
the growth of spores when plated in fresh media.
Moreover, another reason for this result could possibly
be due to the fresh ingredients used. Abadias et al.
(2007) reported that grated carrot, arugula, corn salad
and mixed salads contained high mean counts for
moulds and yeasts with values 6.1, 5.8, 5.5 and 5.4
log10 CFU/g, respectively. However, there was
significant difference (P < 0.05) between storage time
and mould and yeast counts (CFU/g).
The yeast and mould count of “Kerabu Mangga” was
significantly (p<0.05) reduced when stored at chilling
temperature. The counts were reduced from
4.81CFU/g to 3.52 CFU/g for sample A; from 4.22
CFU/g for both sample B and C to 3.50 and 3.31
CFU/g, respectively at day 8 of storage as shown in
Figure 3B. Low temperature storage not only reduced
the metabolic rates that is usually high in cut fruits
other but also slowed down the microbial growth
(Lamikanra, 2002). There was no significant
difference (P > 0.05) between drying treatment in
‘Kerabu Mangga’ samples with mould and yeast
counts (CFU/g). The yeast and mould count of
“Kerabu Mangga” was not significantly (p>0.05)
affected by drying temperature and time, however,
there was significant reduction (p<0.05) in yeast
mould count during chilling temperature storage.
Enterobacteriaceae The Enterobacteriaceae family is a useful indicator to
verify the hygienic process in food production.
Members of Enterobacteriaceae usually present in
raw food ingredients especially animal and plant
origin (Bell et al., 2005). Generally, the trend of
Enterobacteriaceae count increased for all samples
ranging from 3.2-4.31 CFU/g) towards the end of
storing time at 12 hours. However, it must be noted
that there was no significant difference (P > 0.05)
between treatment of samples and Enterobacteriaceae
count. (Figure 4)
0.00
1.00
2.00
3.00
4.00
5.00
6.00
7.00
8.00
0 2 4 6 8 10 12 14
CFU/g
(log10)
Time (hour)
A
B
C

Lani Mohd Nizam et al
109 Asian J Agric & Biol. 2019;7(1):103-115.
Fig. 4. Enterobacteriaceae counts different samples
of kerabu manga stored at (i) room temperature
28°C ± 2°C and (ii) chill temperature 5°C ± 1°C
It was observed the total Enterobacteriaceae count
fluctuated during storage at 5ºC (Figure 4ii). During
the first six days, the Enterobacteriaceae count was
reduced, but increased after eight day storage for
sample A (control) and sample B (drying at 60oC for
one hour). In contrast, drying the mango slices at 60oC
for two hours totally eliminated Enterobacteriaceae
from the “Kerabu Mangga”. Similar observation was
reported by Bell et al. (2005) who reported that
Enterobacteriaceae should be absent in heat processed
foods because of the mild heat treatment.
Staphylococcus aureus
Staphylococcus aureus has been isolated from
vegetables and fresh cut products (Jo et al., 2011), but
there have no report of staphylococcal food poisoning
from such products. Humans may also be carriers of S.
aureus and can be present in skin cracks adjacent to
the fingernails, cuts and wounds (Lampila and
McMillin, 2012). In this study, the trend for S. aureus
count increased over storage time for all samples
(3.00-5.50 CFU/g) when stored at room temperature
(Figure 5i). This could be due to the preparation of
‘Kerabu Mangga’ sample in aseptic way which was no
direct contact with the handler.
Fig. 5. Staphylococcus aureus counts of different
samples of kerabu manga stored at (A) room
temperature 28°C ± 2°C and (B) chill temperature
5°C ± 1°C
However, there was significant difference (P < 0.05)
between storage time and S. aureus counts. The
biological environments of S. aureus are relatively
frequent contamination in foods but they compete
poorly with the spoilage of flora of most foods that
have high water activity (aw) (Narang, 2004). Thus,
0.00
1.00
2.00
3.00
4.00
5.00
6.00
0 2 4 6 8 10 12 14
CFU/g (log10)
Time hour)
A
B
C
(i)
0.00
1.00
2.00
3.00
4.00
5.00
6.00
7.00
0 5 10 15
CFU/g
(log 10)
Time (hour)
A
B
C
(i)
0.00
1.00
2.00
3.00
4.00
0 2 4 6 8 10 12 14
CFU/g
(log10)
Time (day)
A
B
C
(ii)
Lani Mohd Nizam et al
110 Asian J Agric & Biol. 2019;7(1):103-115.
even after 12 hours of storage, S. aureus count was still
considerable low. It was not significantly different of
storage between drying treatment of samples and
counts of S. aureus although there was reduction in
treated samples. The results indicated that drying
treatment did not significantly affected the S. aureus
count and could possibly be due to the water activity
level after drying which was 0.874. However, it must
be highlighted that the initial S. aureus count could
also be contributed by the raw ingredients used in this
study.
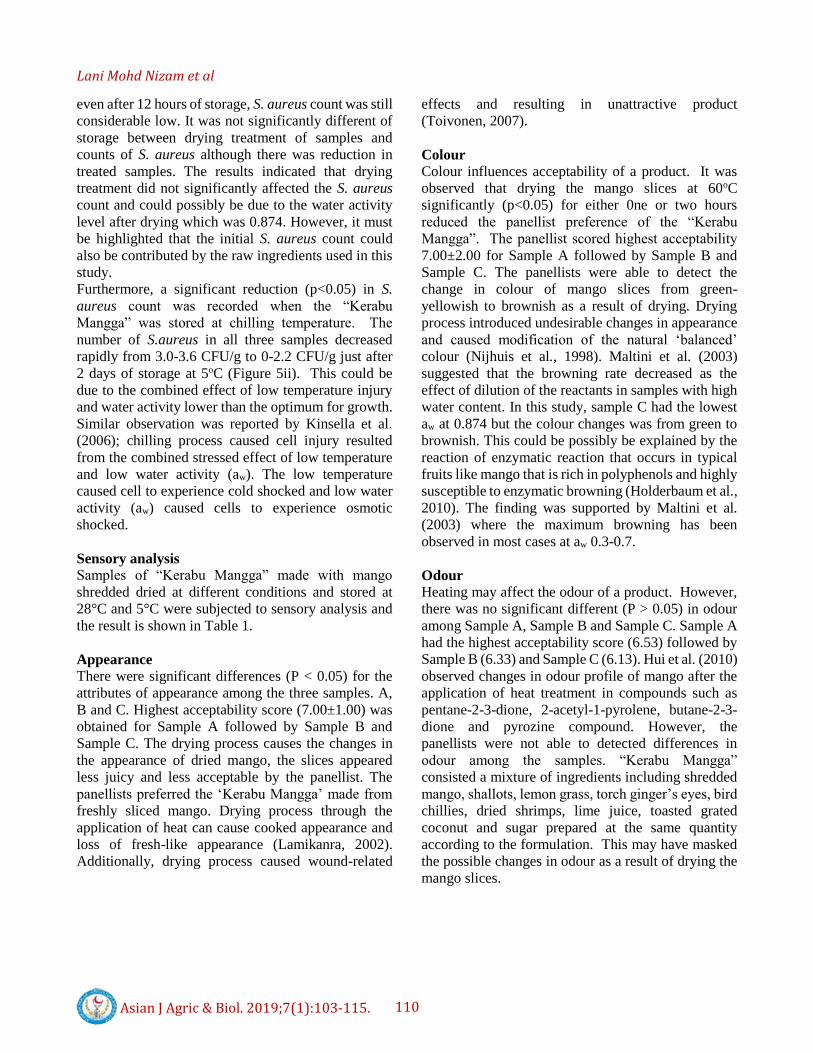
Furthermore, a significant reduction (p<0.05) in S.
aureus count was recorded when the “Kerabu
Mangga” was stored at chilling temperature. The
number of S.aureus in all three samples decreased
rapidly from 3.0-3.6 CFU/g to 0-2.2 CFU/g just after
2 days of storage at 5oC (Figure 5ii). This could be
due to the combined effect of low temperature injury
and water activity lower than the optimum for growth.
Similar observation was reported by Kinsella et al.
(2006); chilling process caused cell injury resulted
from the combined stressed effect of low temperature
and low water activity (aw). The low temperature
caused cell to experience cold shocked and low water
activity (aw) caused cells to experience osmotic
shocked.
Sensory analysis
Samples of “Kerabu Mangga” made with mango
shredded dried at different conditions and stored at
28°C and 5°C were subjected to sensory analysis and
the result is shown in Table 1.
Appearance There were significant differences (P < 0.05) for the
attributes of appearance among the three samples. A,
B and C. Highest acceptability score (7.00±1.00) was
obtained for Sample A followed by Sample B and
Sample C. The drying process causes the changes in
the appearance of dried mango, the slices appeared
less juicy and less acceptable by the panellist. The
panellists preferred the ‘Kerabu Mangga’ made from
freshly sliced mango. Drying process through the
application of heat can cause cooked appearance and
loss of fresh-like appearance (Lamikanra, 2002).
Additionally, drying process caused wound-related
effects and resulting in unattractive product
(Toivonen, 2007).
Colour Colour influences acceptability of a product. It was
observed that drying the mango slices at 60oC
significantly (p<0.05) for either 0ne or two hours
reduced the panellist preference of the “Kerabu
Mangga”. The panellist scored highest acceptability
7.00±2.00 for Sample A followed by Sample B and
Sample C. The panellists were able to detect the
change in colour of mango slices from green-
yellowish to brownish as a result of drying. Drying
process introduced undesirable changes in appearance
and caused modification of the natural ‘balanced’
colour (Nijhuis et al., 1998). Maltini et al. (2003)
suggested that the browning rate decreased as the
effect of dilution of the reactants in samples with high
water content. In this study, sample C had the lowest
aw at 0.874 but the colour changes was from green to
brownish. This could be possibly be explained by the
reaction of enzymatic reaction that occurs in typical
fruits like mango that is rich in polyphenols and highly
susceptible to enzymatic browning (Holderbaum et al.,
2010). The finding was supported by Maltini et al.
(2003) where the maximum browning has been
observed in most cases at aw 0.3-0.7.
Odour Heating may affect the odour of a product. However,
there was no significant different (P > 0.05) in odour
among Sample A, Sample B and Sample C. Sample A
had the highest acceptability score (6.53) followed by
Sample B (6.33) and Sample C (6.13). Hui et al. (2010)
observed changes in odour profile of mango after the
application of heat treatment in compounds such as
pentane-2-3-dione, 2-acetyl-1-pyrolene, butane-2-3-
dione and pyrozine compound. However, the
panellists were not able to detected differences in
odour among the samples. “Kerabu Mangga”
consisted a mixture of ingredients including shredded
mango, shallots, lemon grass, torch ginger’s eyes, bird
chillies, dried shrimps, lime juice, toasted grated
coconut and sugar prepared at the same quantity
according to the formulation. This may have masked
the possible changes in odour as a result of drying the
mango slices.
Lani Mohd Nizam et al
111 Asian J Agric & Biol. 2019;7(1):103-115.
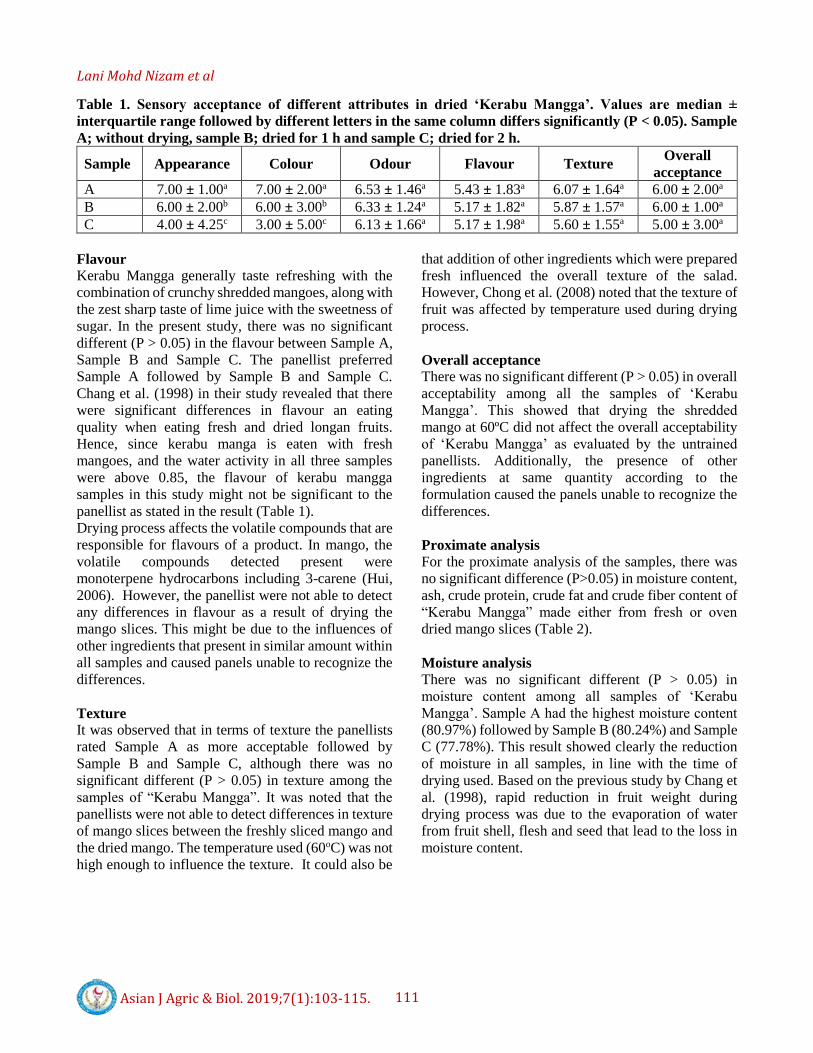
Table 1. Sensory acceptance of different attributes in dried ‘Kerabu Mangga’. Values are median ±
interquartile range followed by different letters in the same column differs significantly (P < 0.05). Sample
A; without drying, sample B; dried for 1 h and sample C; dried for 2 h.
Sample Appearance Colour Odour Flavour Texture Overall
acceptance
A 7.00 ± 1.00a 7.00 ± 2.00a 6.53 ± 1.46a 5.43 ± 1.83a 6.07 ± 1.64a 6.00 ± 2.00a
B 6.00 ± 2.00b 6.00 ± 3.00b 6.33 ± 1.24a 5.17 ± 1.82a 5.87 ± 1.57a 6.00 ± 1.00a
C 4.00 ± 4.25c 3.00 ± 5.00c 6.13 ± 1.66a 5.17 ± 1.98a 5.60 ± 1.55a 5.00 ± 3.00a
Flavour Kerabu Mangga generally taste refreshing with the
combination of crunchy shredded mangoes, along with
the zest sharp taste of lime juice with the sweetness of
sugar. In the present study, there was no significant
different (P > 0.05) in the flavour between Sample A,
Sample B and Sample C. The panellist preferred
Sample A followed by Sample B and Sample C.
Chang et al. (1998) in their study revealed that there
were significant differences in flavour an eating
quality when eating fresh and dried longan fruits.
Hence, since kerabu manga is eaten with fresh
mangoes, and the water activity in all three samples
were above 0.85, the flavour of kerabu mangga
samples in this study might not be significant to the
panellist as stated in the result (Table 1).
Drying process affects the volatile compounds that are
responsible for flavours of a product. In mango, the
volatile compounds detected present were
monoterpene hydrocarbons including 3-carene (Hui,
2006). However, the panellist were not able to detect
any differences in flavour as a result of drying the
mango slices. This might be due to the influences of
other ingredients that present in similar amount within
all samples and caused panels unable to recognize the
differences.
Texture It was observed that in terms of texture the panellists
rated Sample A as more acceptable followed by
Sample B and Sample C, although there was no
significant different (P > 0.05) in texture among the
samples of “Kerabu Mangga”. It was noted that the
panellists were not able to detect differences in texture
of mango slices between the freshly sliced mango and
the dried mango. The temperature used (60oC) was not
high enough to influence the texture. It could also be
that addition of other ingredients which were prepared
fresh influenced the overall texture of the salad.
However, Chong et al. (2008) noted that the texture of
fruit was affected by temperature used during drying
process.
Overall acceptance
There was no significant different (P > 0.05) in overall
acceptability among all the samples of ‘Kerabu
Mangga’. This showed that drying the shredded
mango at 60ºC did not affect the overall acceptability
of ‘Kerabu Mangga’ as evaluated by the untrained
panellists. Additionally, the presence of other
ingredients at same quantity according to the
formulation caused the panels unable to recognize the
differences.
Proximate analysis For the proximate analysis of the samples, there was
no significant difference (P>0.05) in moisture content,
ash, crude protein, crude fat and crude fiber content of
“Kerabu Mangga” made either from fresh or oven
dried mango slices (Table 2).
Moisture analysis
There was no significant different (P > 0.05) in
moisture content among all samples of ‘Kerabu
Mangga’. Sample A had the highest moisture content
(80.97%) followed by Sample B (80.24%) and Sample
C (77.78%). This result showed clearly the reduction
of moisture in all samples, in line with the time of
drying used. Based on the previous study by Chang et
al. (1998), rapid reduction in fruit weight during
drying process was due to the evaporation of water
from fruit shell, flesh and seed that lead to the loss in
moisture content.
Lani Mohd Nizam et al
112 Asian J Agric & Biol. 2019;7(1):103-115.
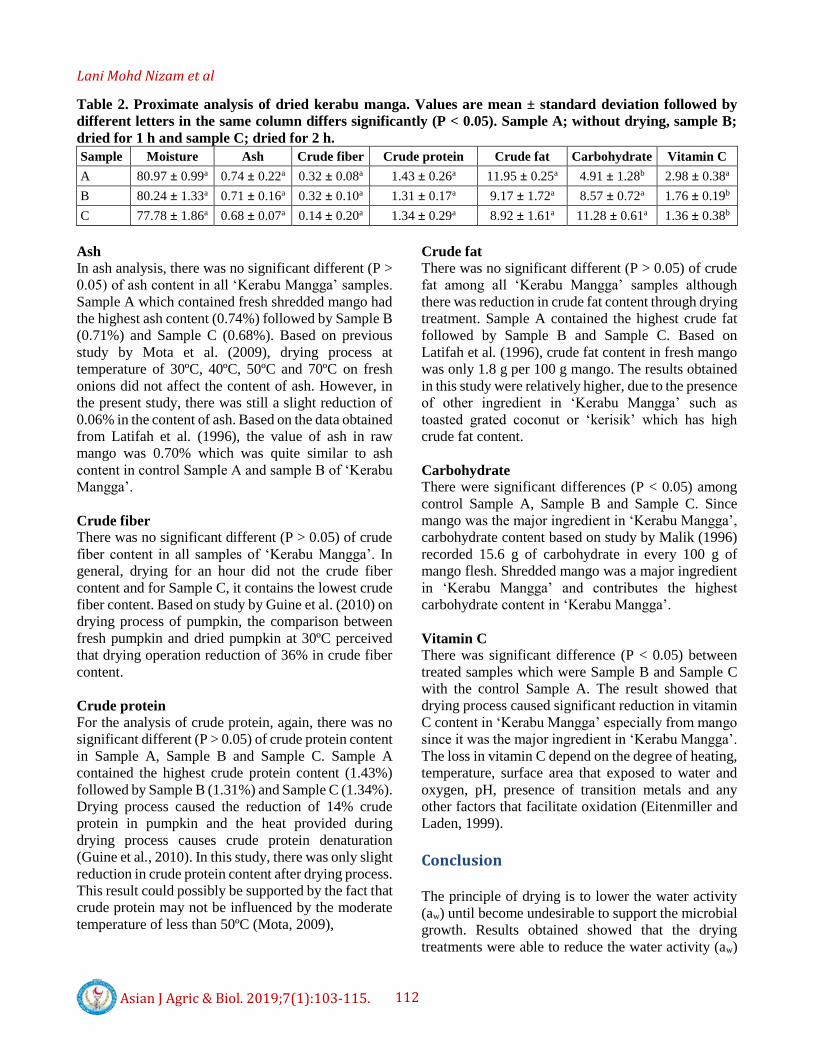
Table 2. Proximate analysis of dried kerabu manga. Values are mean ± standard deviation followed by
different letters in the same column differs significantly (P < 0.05). Sample A; without drying, sample B;
dried for 1 h and sample C; dried for 2 h.
Sample Moisture Ash Crude fiber Crude protein Crude fat Carbohydrate Vitamin C
A 80.97 ± 0.99a 0.74 ± 0.22a 0.32 ± 0.08a 1.43 ± 0.26a 11.95 ± 0.25a 4.91 ± 1.28b 2.98 ± 0.38a
B 80.24 ± 1.33a 0.71 ± 0.16a 0.32 ± 0.10a 1.31 ± 0.17a 9.17 ± 1.72a 8.57 ± 0.72a 1.76 ± 0.19b
C 77.78 ± 1.86a 0.68 ± 0.07a 0.14 ± 0.20a 1.34 ± 0.29a 8.92 ± 1.61a 11.28 ± 0.61a 1.36 ± 0.38b
Ash In ash analysis, there was no significant different (P >
0.05) of ash content in all ‘Kerabu Mangga’ samples.
Sample A which contained fresh shredded mango had
the highest ash content (0.74%) followed by Sample B
(0.71%) and Sample C (0.68%). Based on previous
study by Mota et al. (2009), drying process at
temperature of 30ºC, 40ºC, 50ºC and 70ºC on fresh
onions did not affect the content of ash. However, in
the present study, there was still a slight reduction of
0.06% in the content of ash. Based on the data obtained
from Latifah et al. (1996), the value of ash in raw
mango was 0.70% which was quite similar to ash
content in control Sample A and sample B of ‘Kerabu
Mangga’.
Crude fiber
There was no significant different (P > 0.05) of crude
fiber content in all samples of ‘Kerabu Mangga’. In
general, drying for an hour did not the crude fiber
content and for Sample C, it contains the lowest crude
fiber content. Based on study by Guine et al. (2010) on
drying process of pumpkin, the comparison between
fresh pumpkin and dried pumpkin at 30ºC perceived
that drying operation reduction of 36% in crude fiber
content.
Crude protein
For the analysis of crude protein, again, there was no
significant different (P > 0.05) of crude protein content
in Sample A, Sample B and Sample C. Sample A
contained the highest crude protein content (1.43%)
followed by Sample B (1.31%) and Sample C (1.34%).
Drying process caused the reduction of 14% crude
protein in pumpkin and the heat provided during
drying process causes crude protein denaturation
(Guine et al., 2010). In this study, there was only slight
reduction in crude protein content after drying process.
This result could possibly be supported by the fact that
crude protein may not be influenced by the moderate
temperature of less than 50ºC (Mota, 2009),
Crude fat
There was no significant different (P > 0.05) of crude
fat among all ‘Kerabu Mangga’ samples although
there was reduction in crude fat content through drying
treatment. Sample A contained the highest crude fat
followed by Sample B and Sample C. Based on
Latifah et al. (1996), crude fat content in fresh mango
was only 1.8 g per 100 g mango. The results obtained
in this study were relatively higher, due to the presence
of other ingredient in ‘Kerabu Mangga’ such as
toasted grated coconut or ‘kerisik’ which has high
crude fat content.
Carbohydrate There were significant differences (P < 0.05) among
control Sample A, Sample B and Sample C. Since
mango was the major ingredient in ‘Kerabu Mangga’,
carbohydrate content based on study by Malik (1996)
recorded 15.6 g of carbohydrate in every 100 g of
mango flesh. Shredded mango was a major ingredient
in ‘Kerabu Mangga’ and contributes the highest
carbohydrate content in ‘Kerabu Mangga’.
Vitamin C There was significant difference (P < 0.05) between
treated samples which were Sample B and Sample C
with the control Sample A. The result showed that
drying process caused significant reduction in vitamin
C content in ‘Kerabu Mangga’ especially from mango
since it was the major ingredient in ‘Kerabu Mangga’.
The loss in vitamin C depend on the degree of heating,
temperature, surface area that exposed to water and
oxygen, pH, presence of transition metals and any
other factors that facilitate oxidation (Eitenmiller and
Laden, 1999).
Conclusion The principle of drying is to lower the water activity
(aw) until become undesirable to support the microbial
growth. Results obtained showed that the drying
treatments were able to reduce the water activity (aw)

Lani Mohd Nizam et al
113 Asian J Agric & Biol. 2019;7(1):103-115.
from 0.994 in control sample to 0.953 for Sample B
and 0.874 for Sample C. In sensory analysis, the
appearance and colour attributes play a significant role
while in proximate analysis, only carbohydrate and
vitamin C content showed differences among
treatments. For the microbiological analysis, the
interaction of sample treatments and time of storage
upon the microbial load only presented in chilling
temperature storage for Aerobic Plate Count (APC),
Enterobacteriaceae and Staphylococcus aureus. All
the samples stored at room temperature showed no
interaction between treatment and time of storage
upon the microbial load. There was no significant
different between drying treatments applied in
microbial loads in all microbiological analysis except
the Enterobacteriaceae and Staphylococcus aureus
that stored at chilling temperature. However, there
were significant differences between storage upon
microbial load in all microbiological analysis since the
microbial load increased significantly from its initial
load. Finally, it can be concluded that the drying
treatment applied was unable to reduce the water
activity (aw) to the level that can inhibit the microbial
growth. Furthermore, the microbial source in ‘Kerabu
Mangga’ might potentially came from other
ingredients of ‘Kerabu Mangga’ that might present in
raw without further treatment applied. However, it is
interesting to mention that the shelf life of ‘Kerabu
Mangga’ stored at chilling temperature was longer
compared to room temperature storage due to
preservation through temperature and not due to the
drying treatment applied.
Contribution of Authors Lani MN: Responsibility for supervising research and
principal investigator of the financial support for the
project.
Adnan NA: Conducting the research and investigation
process, specifically data and evidence collection
Nurmahani MM: Managing and coordinating of
research activities leading to this publication.
Responsible for the final submission of manuscript.
Ibrahim R: Co-Supervisor and technical expert for
chemical analyses
Hassan Z: Mentoring, guiding the research ideas and
final proof read of the manuscript.
Disclaimer: None.
Conflict of Interest: None.
Source of Funding: None.
References
Abadias M, Usall J, Anguera M, Solsona C and Vinas
I, 2007. Microbiological quality of fresh,
minimally-processed fruit and vegetables, and
sprouts from retail establishment. Int. J. Food
Microbiol. 123: 121-129.
Aguilera JM, 2003. Drying and dried products under
the microscope. Food Sci. Technol. Int. 9(3): 173-
143.
AOAC (Association of Official Analytical
Chemistry), 2000. Method of analysis 17th ed.
AOAC, Method 967.21. International
Gaithersburg, Estenmiller MD and Landan, WO,
2003. Vitamin Analysis Chapter 11. Food
Analysis, 3rd ed. in SS Nelsen, Kluwer Academic,
New York.
Baldwin EA, Nisperos-Carriedo MO, and Baker RA,
1995. Edible coatings for lightly processed fruits
and vegetables. Hort Sci. 30(1): 35-38.
Bang J, Kim H, Beuchat LR and Ryu J, 2011.
Combined effects of chlorine dioxide, drying, and
dry heat treatment in inactivating microorganisms
on radish seeds. Food Microbiol. 28(1): 114-8.
Bell C, Neaves P and Williams AP, 2005. Food
microbiology and laboratory practice. United
Kingdom. Blackwell Science. Pp. 18-29.
Ben E, PK, 1994. Presence, detection and growth of
Listeria monocytogenes in seafoods: a review. Int
J. Food Microbiol. 23: 17-34.
Chang CY, Yu TH, Lin LY and Yen YH, 1998. The
effect of drying treatment on the flavour and
quality of longan fruit. Food flavours: formation,
analysis and packaging influences. Elsevier Sc.
Pp. 353-367
Chong CH, Chung LL, Cloke M, Hii CL, Abdullah LC
and Daud WRW, 2008. Drying kinetics and
product quality of dried chempedak. J. Food Eng.
88: 522-527.
Eitenmiller RR and Laden WO, 1999. Vitamin A and
b-carotene. Ascorbic acid. Thiamin. Vitamin B-6.
Folate. In: Eitenmiller RR and Laden WO (Eds.),
Vitamin Analysis for the Health and Food
Science. CRC Press, Boca Raton, Florida.
Favetto GJ, Resnik SL, Chirife J and Ferro Fonta´n C,
1983. Statistical evaluation of water activity
measurements obtained with the Vaisala Humicap
humidity meter. J. Food Sci. 487: 534–538.
Fontana AJ, 2001. Measurement of water activity. In
fundamentals of water activity. IFT Continuing
Lani Mohd Nizam et al
114 Asian J Agric & Biol. 2019;7(1):103-115.
Education Committee, June 14–15, Anaheim, CA,
USA.
Guine RPF, Pinho S and Barroca MJ, 2011. Study of
the convective drying of pumpkin (Cucurbita
maxima). Food Bioprod. Process. 89: 422-428.
Daniel Ferreira Holderbaum and Tomoyuki Kon,
2010. Enzymatic browning, polyphenol oxidase
activity, and polyphenols in four apple cultivars:
dynamics during fruit development. Hort. Sci.
45(8): 1150–1154.
Galati PC, Lataro RC, Souza, VM, Pereira de Martinis
EC and Chiarello PG, 2013. Microbiological
profile and nutritional quality of raw foods for
neutropenic patients under hospital care. Rev Bras
Hematol. Hemoter. 35(2): 94–98.
Hui YH and Barta J, 2006. Handbook of Fruits and
Fruit Processing. Blackwell Publishing. Pp. 132-
133, 647.
Iyer TSG and Shrivastava KP, 1989. Incidence and
Low Temperature Survival of Salmonella in
Fishery Products. Fish Technol. 26: 39-42.
Jagota SK and Dani HM, 1982. A new colorimetric
technique for the estimation of vitamin C using
Folin phenol reagent. Anal Biochem. 127(1): 178-
182.
Jay JM, Loessner MJ and Golden DA, 2005. Modern
Food Microbiology. Springer, New York.
Kinsella KJ, Sheridan JJ, Rowe TA, Butler F, Delgado
A, Quispe-Ramirez A, Blair IS and McDowell,
DA, 2006. Impact of a novel spray-chilling system
on surface microflora, water activity and weight
loss during beef carcass chilling. Food Microbiol.
23(5): 483-490.
Lampila LE and McMillin KW, 2012. Major microbial
hazards associated with packaged seafood. In
Advances in Meat, Poultry and Seafood
Packaging. Woodhead Publishing Series in Food
Science, Technology and Nutrition, Pp. 59-85.
Lamikanra O, 2002. Fresh cut fruits and vegetables.
CRC Press Publication. Pp. 268-269
Leistner L and Rodel W 1976. The stability of
intermediate foods with respect to
microorganisms, In: R. Davies, G.G. Birch and K.
J. Parker (Ed.), Applied Science Publishers,
London. Pp. 120-137.
Lenart A, 1996. Osmo-convective drying of fruits and
vegetables: technology and application. Dry
Technol. 14(2): 391-413.
Malik TA, 1996. Panduan Penanaman Mangga.
Malaysia. Institut Penyelidikan dan Kemajuan
Pertanian Malaysia (MARDI). Pp 1-16.
Maltini E, Torreggiani D, Venir E and Bertolo G,
2003. Water activity and preservation of plant
foods. Food Chem. 82: 79-86.
Min-Lin C, Fernando SY and Wei IC, 1996.
Occurrence of Listeria monocytogenes,
Salmonella spp., Escherichia coli and E.coli
O157: H7 in Vegetable Salads. Food Control 7(3):
135-140.
Mota CL, Luciano C, Dias A, Barroca MJ and Guine
RPF, 2009. Convection drying of onion: kinetics
and nutritional evaluation. Food Bioprod. Proc.
88: 115-123.
Nambi VE, Thangavel K and Jesudas DM, 2015.
Scientific classification of ripening period and
development of colour grade chart for Indian
mangoes (Mangifera indica L.) using multivariate
cluster analysis. Sci. Hort. 193: 90-98.
Narang SP, 2004. Food microbiology method of
enumeration. New Delhi: A.P.H Publishing
Corporation. p.22, 166.
National Research Council. 2001. Preventing the
forward contamination of Mars. The National
Academies Press. Washington DC.
Nguyen C and Carlin F, 1994. The microbiology of
minimally processed fresh fruits and vegetables.
Crit. Rev. Food. Sci. Nutr. 34(4): 371-401.
Nieto A, Castro MA and Alzamora SM., 2000.
Kinetics of moisture transfer during air drying of
blanched and/or osmotically dehydrated mango. J.
Food. Eng. 50: 175-185.
Nijhuis HH, Torringa HM,
Muresan S, Yuksel D, Leguijt C and Kloek W, 1
998. Approaches to improving the quality of dried
fruit and vegetables. Trends Food Sci. Technol.
9: 13–20.
Noraini S. 2004. Sajian, Keraian, Perancangan,
Penyediaan and Resipi. Business and Economics
[online]. Available from:
http://books.google.com.my/books [Accessed 26
February 2015].
Park YK, Sato HH, Almeida TD and Moretti, RH,
1980. Polyphenol oxidase of mango (Mangifera
indica var. Haden). J. Food Sci. 45(6): 1619-1621.
Poubol J and Izumi H, 2006. Physiology and
microbiological quality of fresh-cut mango cubes
as affected by high-O2 controlled atmospheres. J
Food Saf 70(6): M286-291.
Pott I, Neidhart S, Muhlbauer W and Carle R, 2005.
Quality improvement of non-sulphited mango
slices by drying at high temperatures. Innov.
Food Sci. Emerg. Technol. 6: 412-419.

Lani Mohd Nizam et al
115 Asian J Agric & Biol. 2019;7(1):103-115.
Ramli, NA, Lani MN, Ibrahim, R, Alias R and Hassan
Z. 2014. Microbiological quality of Malaysian
heritage food (‘Satar’) sold in Marang and
Kemaman, Terengganu, Malaysia. IJES. 3(11):
27-32.
Roday S, 1999. Food Hygiene and Sanitation. Tata
McGraw Hill Publishing Company Limited. New
Delhi. [online]. Available from:
http://books.google.com.my [Accessed 7 July
2010].
Russell NJ, 2002. Bacterial membrane: the effects of
chill storage and food processing. An overview.
Int. J. Food Microbiol. 79: 27-34.
Shaw REO, Guthrie JA, Dunlop KJ and Roberts R,
1993. Coliforms in processed mango: significant
and control. Int. J. Food Microbiol. 25: 51-61.
Toivonen PMA and Brummell DA, 2007.
Biochemical bases of appearance and texture
changes in fresh-cut fruit and vegetables.
Postharvest Biol. Technol. 48: 1-14.
Tovar B, García HS and Mata M. 2001. Physiology of
pre-cut mango. 1. ACC and ACC oxidase activity
of slices subjected to osmotic dehydration. Food
Res. Int. 34: 207-215.


