
SUPPLEMENTARY APPENDIX
MicroRNA expression-based outcome prediction in acute myeloid leukemia: novel insights through cross-platform integrative analyses
Velizar Shivarov,1 Anna Dolnik,2 Katharina M. Lang,2 Jan Krönke,2 Florian Kuchenbauer,2 Peter Paschka,2 Verena I. Gaidzik,2 HartmutDöhner,2 Richard F. Schlenk,2 Konstanze Döhner,2 and Lars Bullinger2
1Laboratory of Clinical Immunology, Sofiamed University Hospital, Sofia, Bulgaria; and 2Department of Internal Medicine III, University Hospital of Ulm,Germany
Correspondence: [email protected] doi:10.3324/haematol.2016.146555
MicroRNA expression based outcome prediction in AML (Supplement) 1
Supplemetary Materials and methods
Datasets selection
The training dataset including clinical information and processed and filtered miRNA
expression profiles of 91 patients previously analyzed at Ulm University, Germany (hereafter
referred as the Ulm dataset; samples were derived from patients entered within the German
AML Study Group HD-98A trial, NCT00146120) 1.
To select other datasets to be used for validation we searched public repositories for
microarray experiments with available clinical information on survival. The data portal of The
Cancer Genome Atlas (https://tcga-data.nci.nih.gov/tcga/tcgaHome2.jsp) provided data on a
total of 200 AML cases. We were able to extract clinical data and RNA-Sequencing data for
177 patients. This dataset served as a validation set for our study (hereafter referred as the
USA dataset). The number of features in the Ulm and the USA datasets were different. We
matched them and selected a total of 168 microRNAs that were common between the two
datasets. The expression matrices with only these 168 microRNAs were used in the study.
Ulm dataset detailed description
Adult AML patient samples [56 peripheral blood (PB) and 35 bone marrow (BM) specimens
from 91 AML cases] were provided by the German and Austrian AML Study Group
(AMLSG) with patient informed consent and institutional review board approval from all
participating centers. All patients had been entered between February 1998 and October 2002
into the AMLSG treatment protocol AML HD98A for younger adults (age ≤ 60 years).
Patients received intensive induction and consolidation therapy (for protocol details see
Schlenk et al. 2 2004 and Schaich et al.
3). Patient age at the time of diagnosis ranged from 19
to 60 years (median age 45). Clinical characteristics at the time of diagnosis were available
for almost all cases as detailed in Table S1 below.
Conventional cytogenetic (chromosome banding), and molecular genetic analyses (screening
for FLT3 internal tandem-duplications (ITD) and tyrosine kinase domain (TKD) mutations,
CEPBA and NPM1 mutations) were performed as previously described at the central
reference laboratory of the German and Austrian AMLSG at Ulm University 4-7
.
To screen miRNA expression in AML a miRNA microarray platform with a commercially
available oligonucleotide probe set was used (Ambion mirVana™ miRNA Probe Set, Ambion
MicroRNA expression based outcome prediction in AML (Supplement) 2
Inc.), which has already been successfully used to investigate miRNA profiles in tumors and
for which the performance has been validated by both Northern Blot analysis and quantitative
RT-PCR 8-10
.
In brief, this probe set representing 328 human miRNAs was spotted onto GAPS coated glass
slides (Corning Inc.). Then, total RNA was isolated from tumor samples and different tumor
cell lines, which served as common reference using the mirVana™ miRNA Isolation Kit
(Ambion Inc.). Of each total RNA sample 20µg was fractionated by polyacrylamide gel
electrophoresis (PAGE) using Ambion's flashPAGE Fractionator System (Ambion Inc.), and
the miRNA fractions for each sample were recovered. With the aid of the mirVana miRNA
Labeling Kit (Ambion Inc.) miRNA samples were prepared for microarray analysis using an
end-labeling strategy. In the first step, E. coli Poly(A) Polymerase and a mixture of
unmodified and amine-modified nucleotides were used to add a 20–50 nucleotide tail to the 3'
end of each miRNA sample. The amine-modified miRNAs were then purified and coupled to
amine-reactive labeled NHS-ester CyDye™ fluorochromes (Amersham Biosciences).
Following purification the Cy5-labeled AML and Cy3-labeled common reference samples
were mixed, cohybridized for 14 hours onto the miRNA microarrays and washed according to
the manufacturer’s protocol (Ambion Inc.). Finally, microarrays were scanned using an Axon
GenePix 4000B laser scanner (Axon Instruments) and extracted fluorescence ratios
(tumor/common reference) after subtracting the background using the GenePix Pro 6.0
software (Axon Instruments) were obtained. To identify differential miRNA expression
between samples, the fluorescent ratios were log2 transformed, normalized and filtered as
previously described 11
.
Model Building
In order to build a model based on the expression of survival-associated microRNAs we used
the Robust Likelihood-Based Survival Modeling with Microarray Data method 12
, which was
implemented to the rbsurv package for the R statistical environment. This technique utilizes
the partial likelihood of the Cox model and functions through the generation of multiple gene
(microRNAs in this case) models. It also divides the input dataset into training and validation
sets and performs multiple cross-validations of a series of gene models so that it finally
provides the optimal model based on the Akaike Information Criterion (AIC). Cox regression
coefficients for the microRNAs included in the model for both datasets were obtained using
the survival package for R. A total continuous score was calculated for each patient sample
using the Cox regression coefficients obtained for the Ulm dataset according to the formula:
MicroRNA expression based outcome prediction in AML (Supplement) 3
∑ where xij is the log-transformed expression value for the microRNA j in
patient i, and wj is the weight assigned to probe set j (here wj was the Cox regression
coefficient from the univariate analysis in the training set). The total score was calculated for
each patient sample in the training and the validation dataset. To build a binary score
classifying the sample to either a high or low score group it was obviously not possible to
select a cutoff identical for both datasets because the microRNA expression profiling
platforms were different. For that reason we defined a cut-off value specific for each total
score. This was performed using an on-line R based program for finding the optimal cut-off
values of Receiver Operating Characteristics (ROC) curves (http://molpath.charite.de/cutoff/)
13. Univariate and multivariate analyses for correlation of the continuous and discrete scores
with overall survival were performed for each of the datasets using the survival package. In
the subgroups analyses intermediate risk patients were analyzed together because of the
relatively small number in that subgroup.
Gene expression analysis
Raw mRNA expression data (.cel) files were downloaded from TCGA website. The
expression set was built with the affy package and preprocessed with the RMA procedure
from the same. Gene filtering was performed based on the IQR and CV values. Unsupervised
clustering was performed using the built-in R functions hclust and heatmap. Supervised
clustering and identification of the differentially expressed probes/genes was performed using
the limma package. P-values of the differentially expressed genes were corrected with the
Bonferoni-Hocheger procedure. Probe level data were collapsed to gene level using the
WGCNA package and annotated with the annotate and hgu133plus2.db packages.
DNA methylation analysis
Level 3 (processed) data including beta values from Infinium II platform for 41 patients with
CN-AML aged less than 61 years was retrieved from TCGA data portal. Differentially
methylated CpG sites were identified using the limma package and plotted as heatmaps using
the R low level heatmap function. CpG level data were collapsed to gene level after averaging
the beta values using the WGCNA package and annotated with the annotate and
IlluminaHumanMethylation450k.db packages.
Gene ontology analysis
Gene ontology analysis of differentially expressed genes was perfomed using the on-line tools
from the PANTHER database (http://www.pantherdb.org/). Statistical overrepresentation
MicroRNA expression based outcome prediction in AML (Supplement) 4
testing was performed as described before 14
. KEGG pathways overrepresentation analysis
was performed using the Web Gestal server (http://bioinfo.vanderbilt.edu/webgestalt/) 15
.
Gene set enrichment analysis
Gene set enrichment analysis (GSEA) was performed using the conventional on-line tool
developed at the Broad Institute (http://www.broadinstitute.org/gsea/index.jsp) 16
. Gene level
expression profiles for patients from the validation set were preprocessed and collapsed as
described above and loaded onto the server as .txt files. Phenotype containing files were
generated with Texmaker and loaded onto the server as .plc files. The collections of
oncogenic and gene ontology signatures from the Molecular Signatures Database (MSigDB)
were tested for enrichment.
Regulatory network building and analysis
MicroRNA-mRNA regulatory network was built using the CyTargetLinker 17
plug-in for the
Java-based program Cytoscape v. 3.0.2 18
. Gene ontology visualization of the enriched
molecular functions in the built microRNA-mRNA network was performed with the BiNGO
plug-in for the same platform 19
.
Differential exon usage (DEU) analysis
Level 3 (processed) RNA-Seq data for expressed exons for 40 CN-AML patients under 61
years-of-age were downloaded from TCGA web-site. The tag raw count level data were
compiled into a single data frame using conventional R functions. This expression set was
filtered for tags with low expression, i.e. tags with lower than 5 reads per million total reads
(cpm) in less than 10 samples were removed. Differentially expressed exons were identified
through a binomial test based procedure implemented by the edgeR package for
R/Bioconductor.
Common statistical procedures
All statistical procedures were performed using the R v. 3.0.1 environment for statistical
computing. Chi-squared test was used for assessment of the independence in the distribution
of categorical variables. Two sided t-test for independent samples was used to compare the
means of normally distributed continuous variables. Wilcoxon-Mann-Whitney test was used
to compare the medians of continuous variables without normal distribution. Shapiro-Wilk
test was used to assess the normality of distribution of continuous variables. For all statistical
test an alpha level of 0.05 was considered statistically significant.

MicroRNA expression based outcome prediction in AML (Supplement) 5
MicroRNA expression based outcome prediction in AML (Supplement) 6
Supplementary Figures
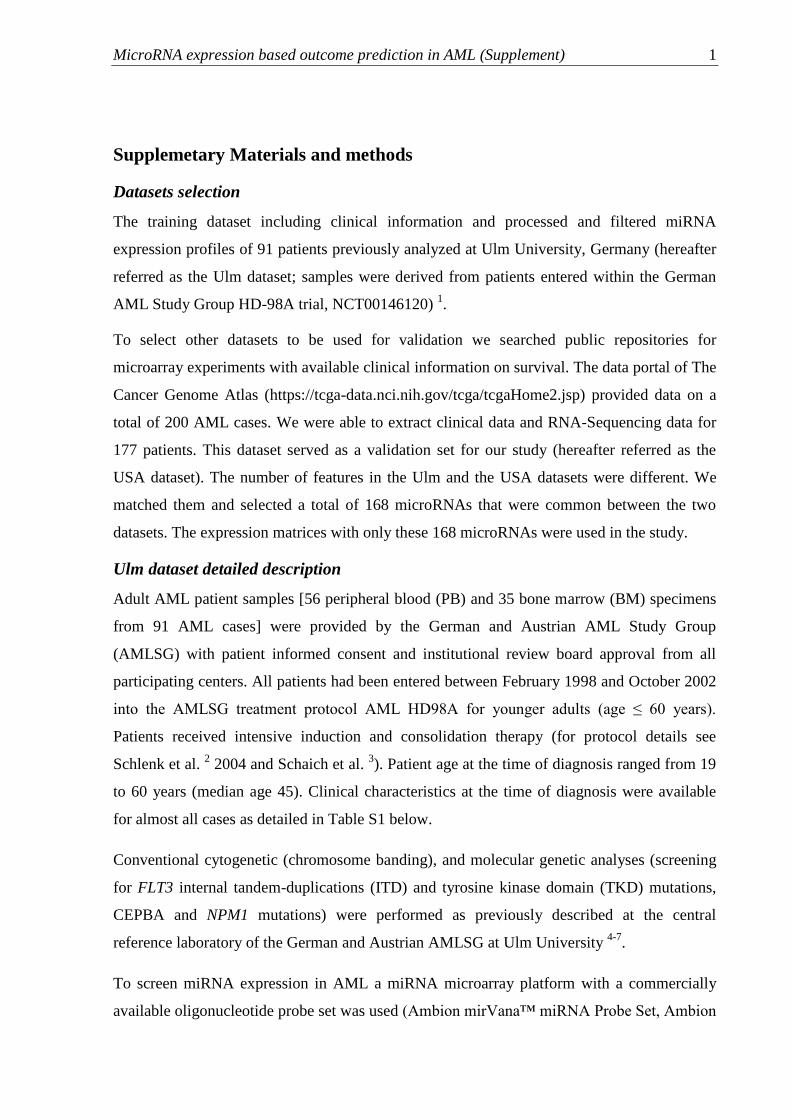
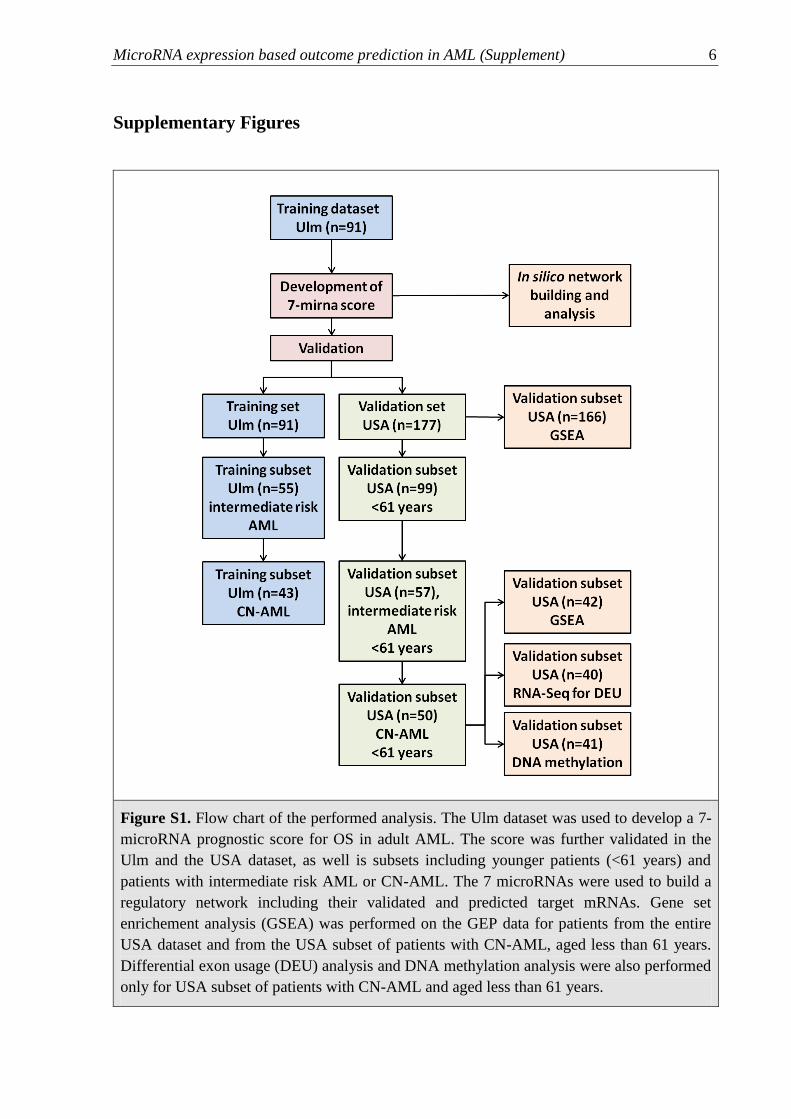
Figure S1. Flow chart of the performed analysis. The Ulm dataset was used to develop a 7-
microRNA prognostic score for OS in adult AML. The score was further validated in the
Ulm and the USA dataset, as well is subsets including younger patients (<61 years) and
patients with intermediate risk AML or CN-AML. The 7 microRNAs were used to build a
regulatory network including their validated and predicted target mRNAs. Gene set
enrichement analysis (GSEA) was performed on the GEP data for patients from the entire
USA dataset and from the USA subset of patients with CN-AML, aged less than 61 years.
Differential exon usage (DEU) analysis and DNA methylation analysis were also performed
only for USA subset of patients with CN-AML and aged less than 61 years.
MicroRNA expression based outcome prediction in AML (Supplement) 7
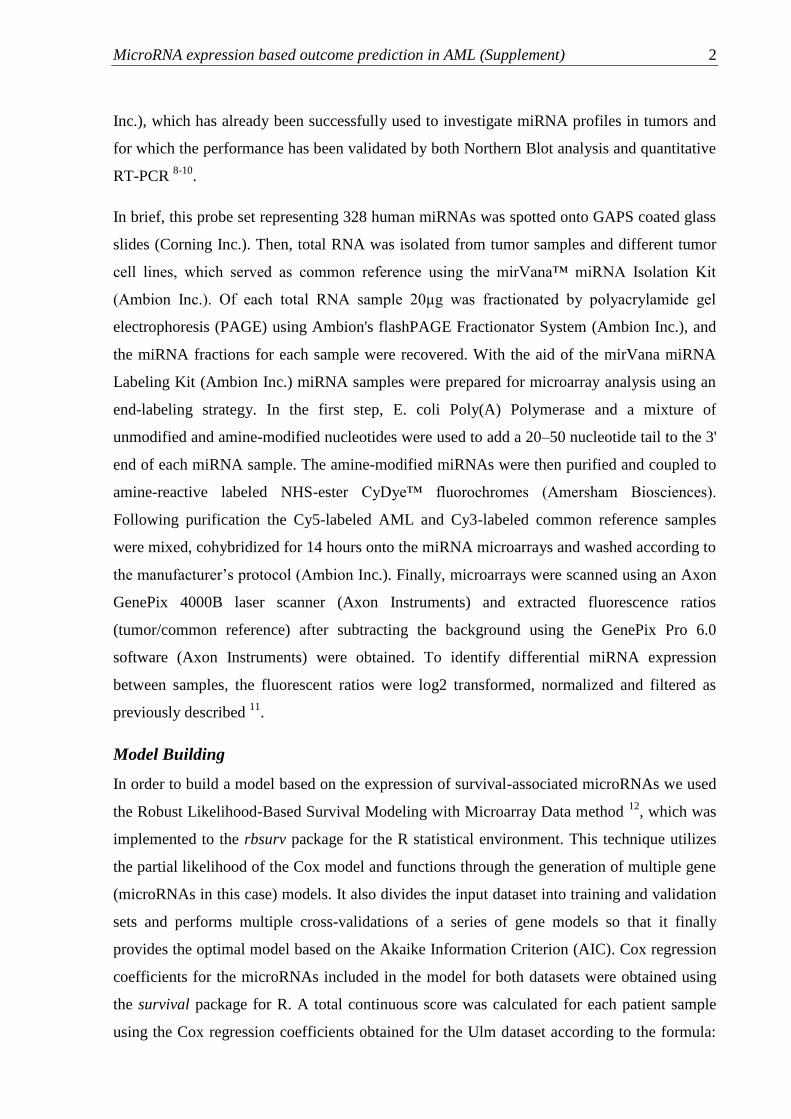
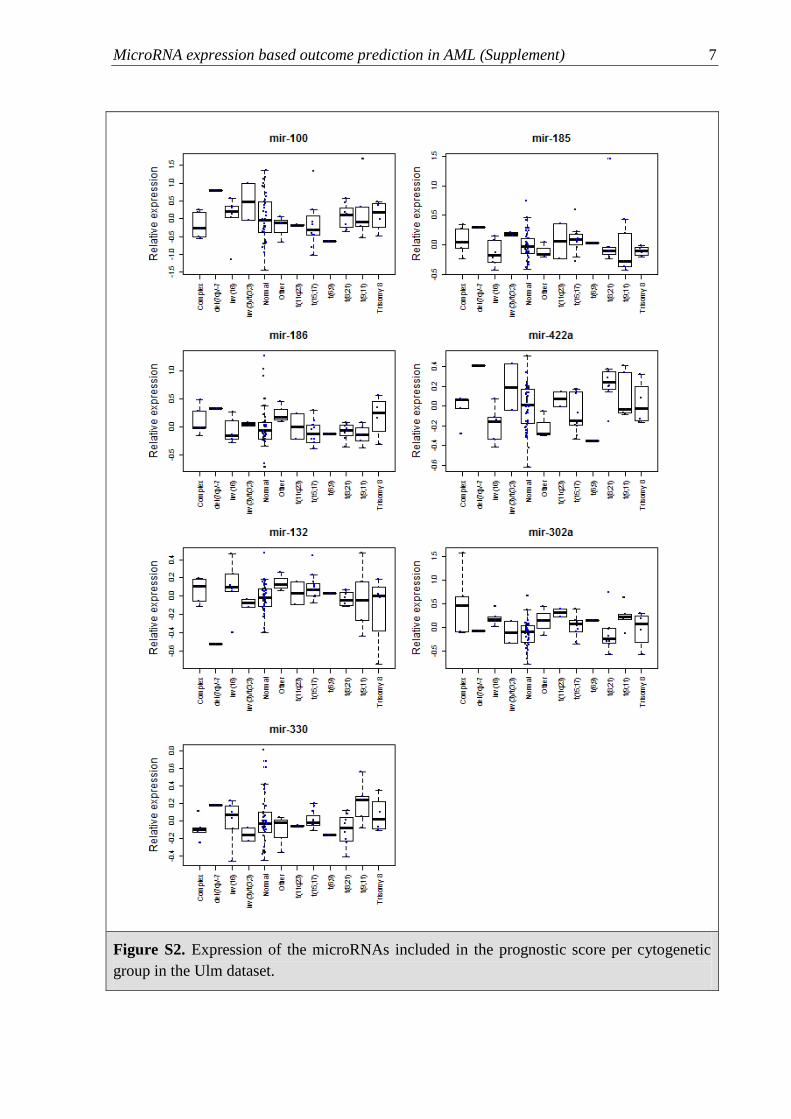
Figure S2. Expression of the microRNAs included in the prognostic score per cytogenetic
group in the Ulm dataset.
MicroRNA expression based outcome prediction in AML (Supplement) 8
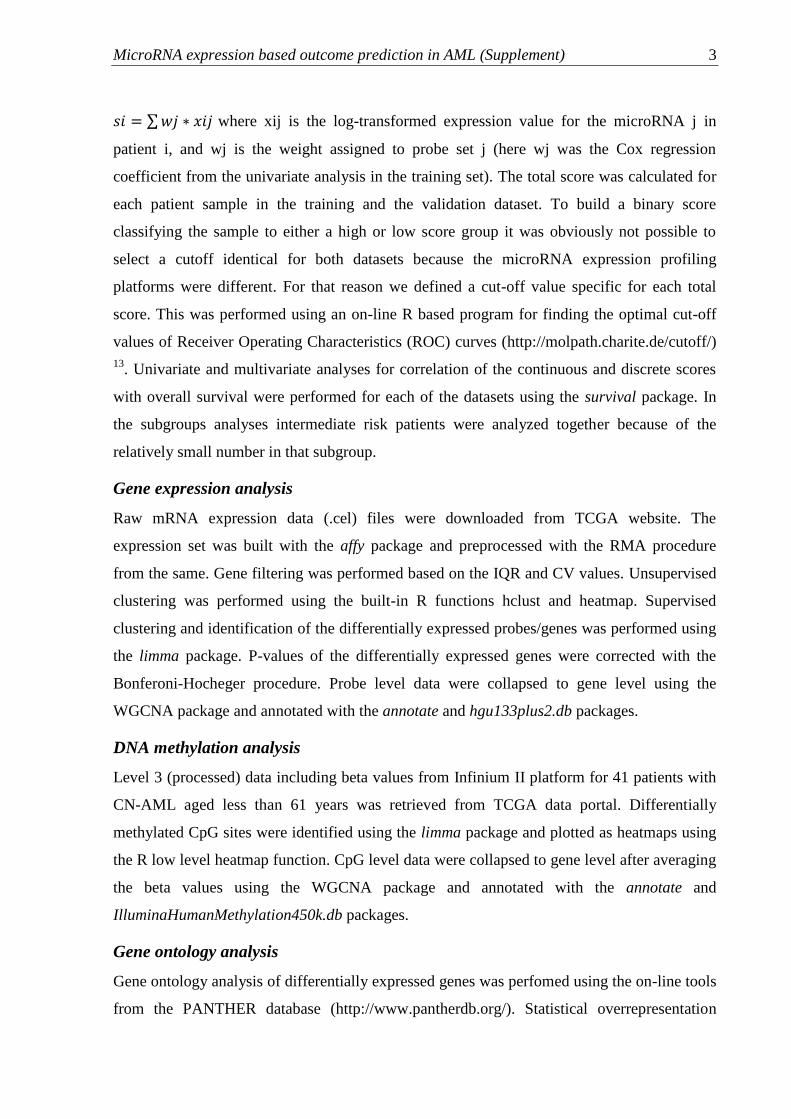
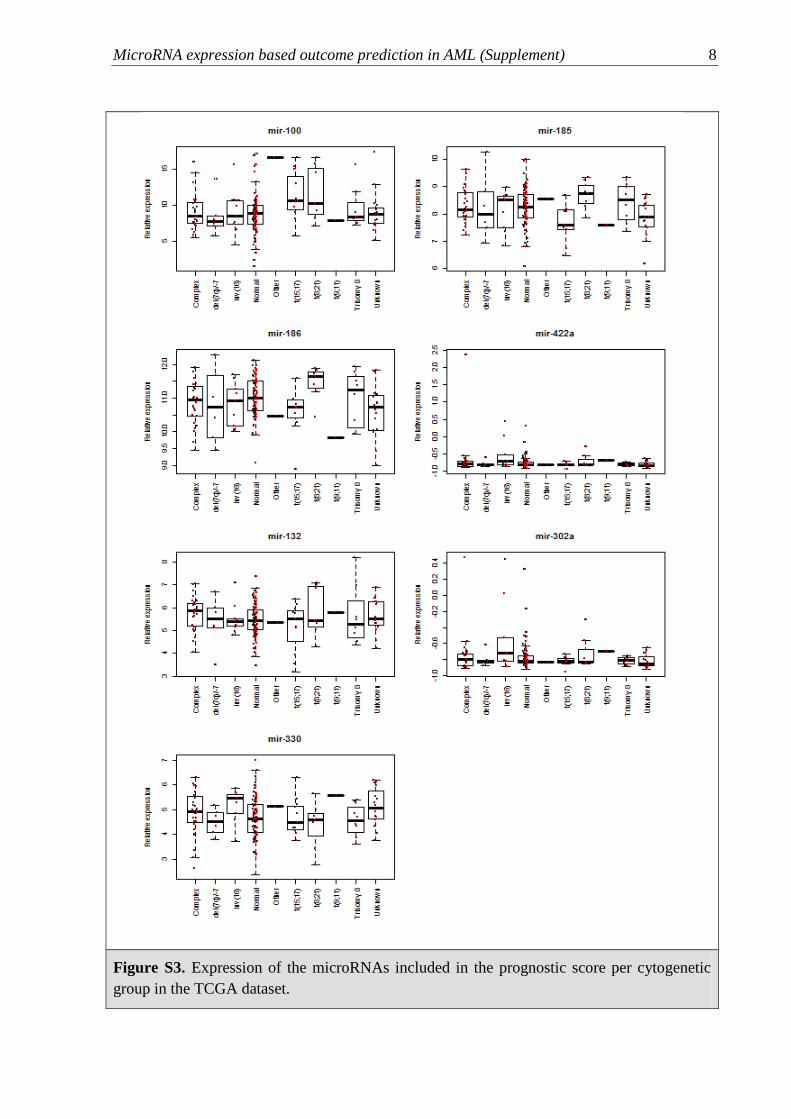
Figure S3. Expression of the microRNAs included in the prognostic score per cytogenetic
group in the TCGA dataset.

MicroRNA expression based outcome prediction in AML (Supplement) 9
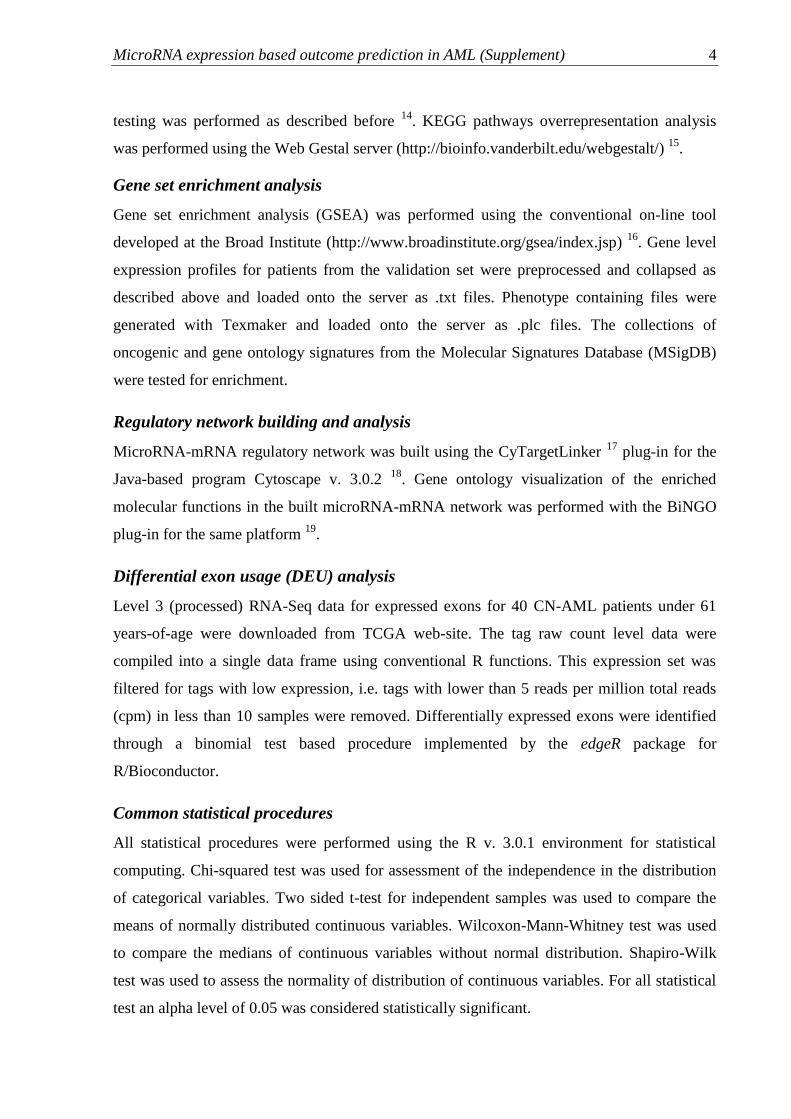
Figure S4. Optimal cut-off for the total score in the entire training and validations sets.
Left panel: ROC curve with the position of the cut-off point selected based on the lowest
p-value on the Log-rank test for the training dataset. Right panel: ROC curve with the
position of the cut-off point selected based on the lowest p-value on the Log-rank test for
the validation dataset.
Figure S5. Univariate analysis of the discrete score in the validation set including only the
patients under 61 years of age. Left panel: ROC curve for the continuous score with the
optimal cut-off point position. Right panel: Effect of the newly defined discrete score on
overall survival in the same subset of patients (Cox regression analysis).
MicroRNA expression based outcome prediction in AML (Supplement) 10
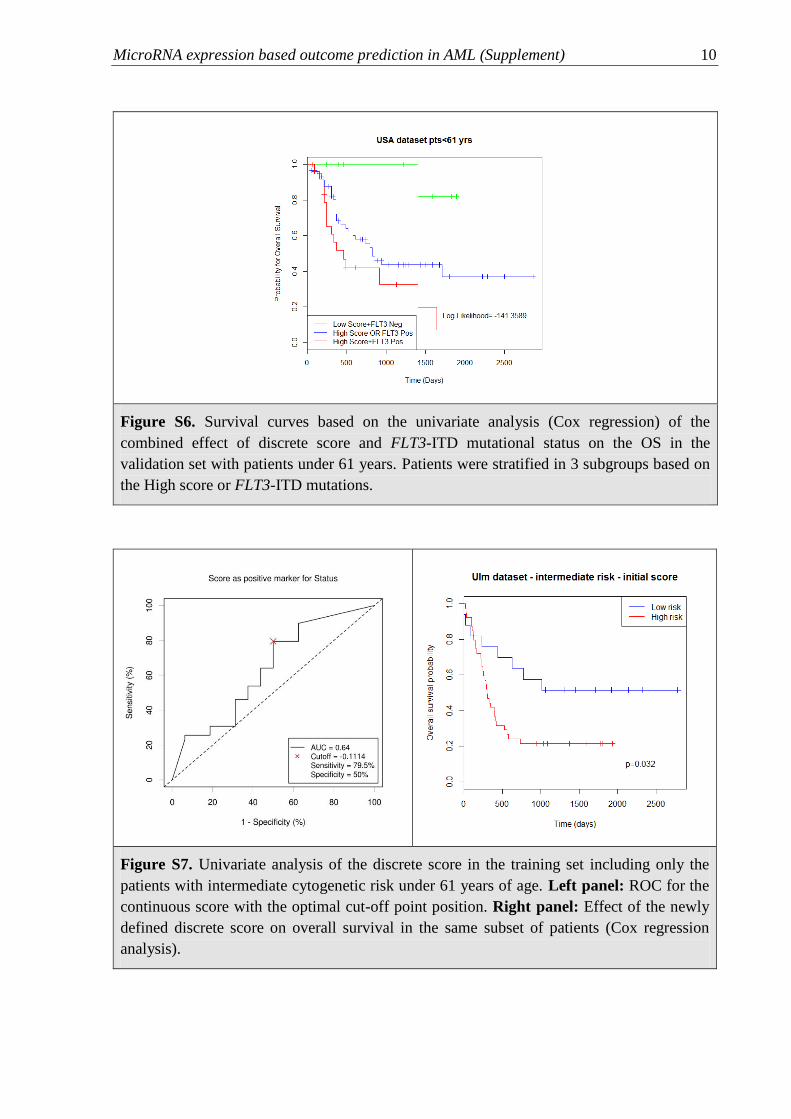
Figure S6. Survival curves based on the univariate analysis (Cox regression) of the
combined effect of discrete score and FLT3-ITD mutational status on the OS in the
validation set with patients under 61 years. Patients were stratified in 3 subgroups based on
the High score or FLT3-ITD mutations.
Figure S7. Univariate analysis of the discrete score in the training set including only the
patients with intermediate cytogenetic risk under 61 years of age. Left panel: ROC for the
continuous score with the optimal cut-off point position. Right panel: Effect of the newly
defined discrete score on overall survival in the same subset of patients (Cox regression
analysis).
MicroRNA expression based outcome prediction in AML (Supplement) 11
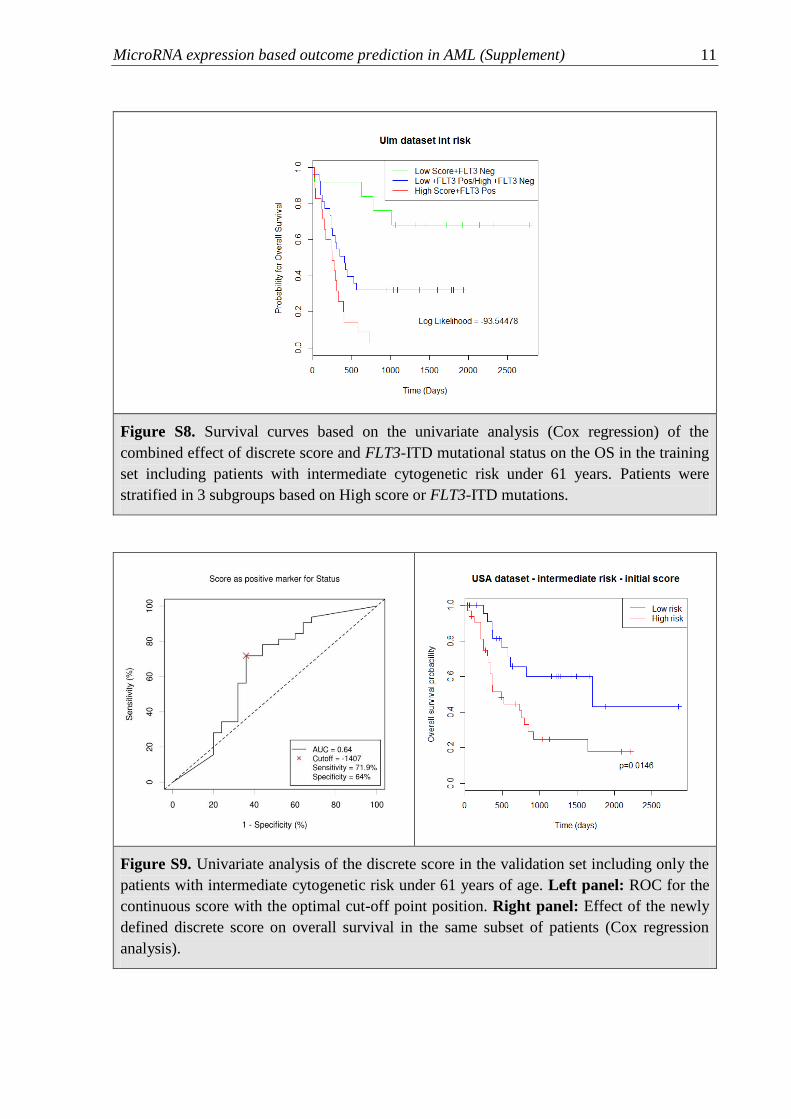
Figure S8. Survival curves based on the univariate analysis (Cox regression) of the
combined effect of discrete score and FLT3-ITD mutational status on the OS in the training
set including patients with intermediate cytogenetic risk under 61 years. Patients were
stratified in 3 subgroups based on High score or FLT3-ITD mutations.
Figure S9. Univariate analysis of the discrete score in the validation set including only the
patients with intermediate cytogenetic risk under 61 years of age. Left panel: ROC for the
continuous score with the optimal cut-off point position. Right panel: Effect of the newly
defined discrete score on overall survival in the same subset of patients (Cox regression
analysis).
MicroRNA expression based outcome prediction in AML (Supplement) 12
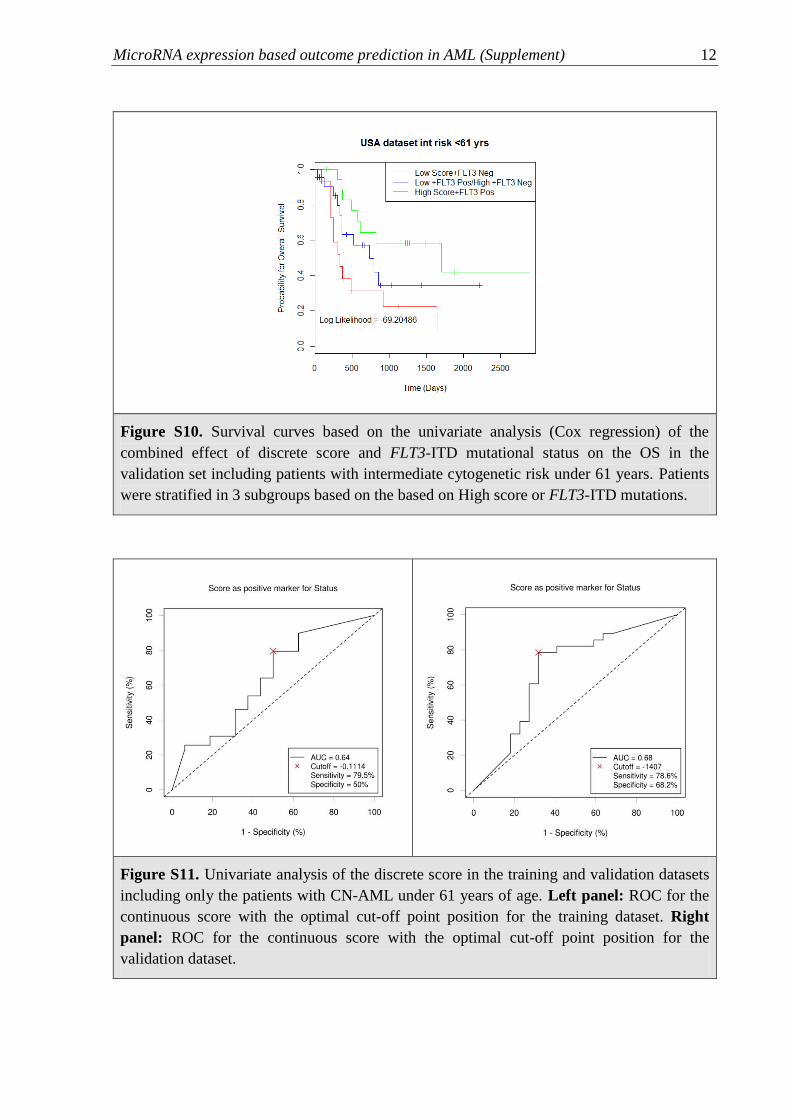
Figure S10. Survival curves based on the univariate analysis (Cox regression) of the
combined effect of discrete score and FLT3-ITD mutational status on the OS in the
validation set including patients with intermediate cytogenetic risk under 61 years. Patients
were stratified in 3 subgroups based on the based on High score or FLT3-ITD mutations.
Figure S11. Univariate analysis of the discrete score in the training and validation datasets
including only the patients with CN-AML under 61 years of age. Left panel: ROC for the
continuous score with the optimal cut-off point position for the training dataset. Right
panel: ROC for the continuous score with the optimal cut-off point position for the
validation dataset.
MicroRNA expression based outcome prediction in AML (Supplement) 13
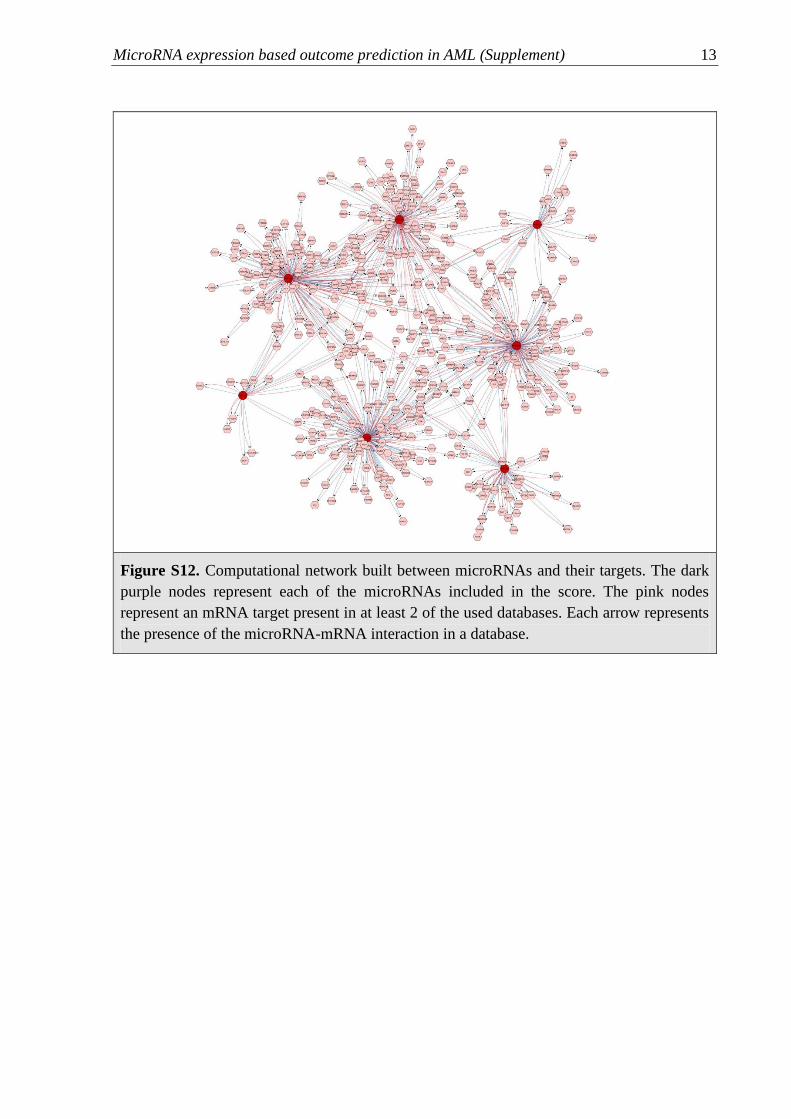
Figure S12. Computational network built between microRNAs and their targets. The dark
purple nodes represent each of the microRNAs included in the score. The pink nodes
represent an mRNA target present in at least 2 of the used databases. Each arrow represents
the presence of the microRNA-mRNA interaction in a database.
MicroRNA expression based outcome prediction in AML (Supplement) 14
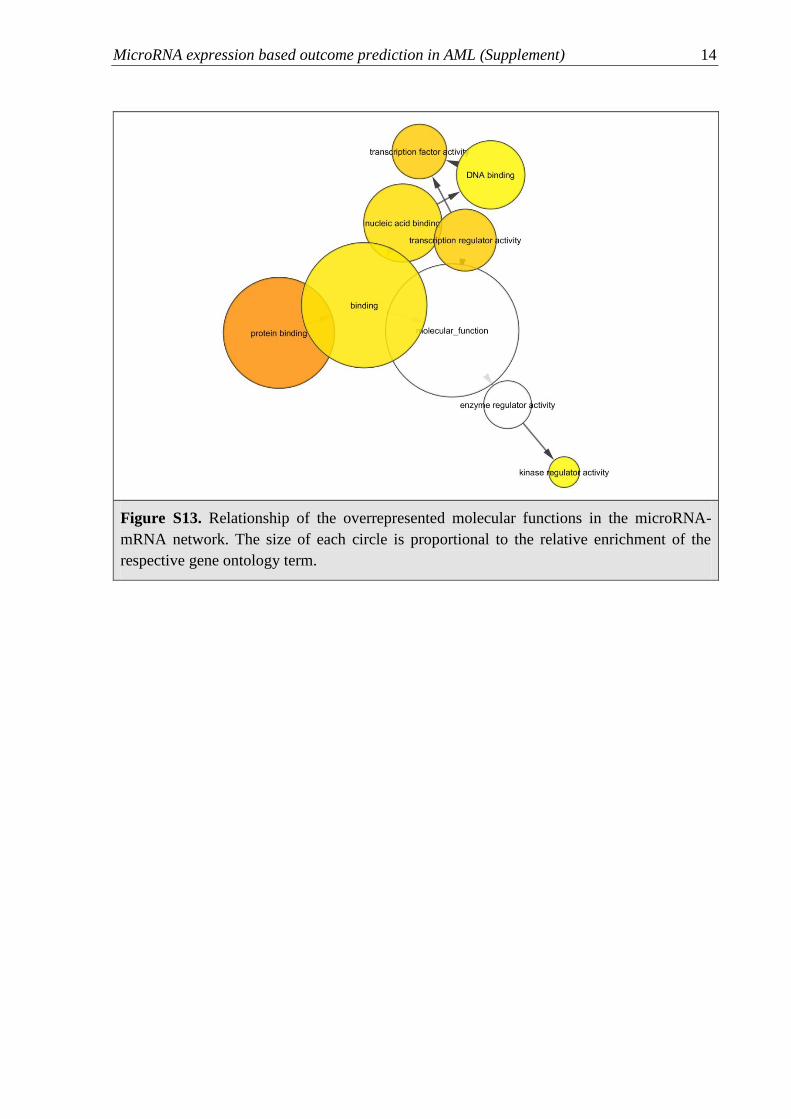
Figure S13. Relationship of the overrepresented molecular functions in the microRNA-
mRNA network. The size of each circle is proportional to the relative enrichment of the
respective gene ontology term.
MicroRNA expression based outcome prediction in AML (Supplement) 15
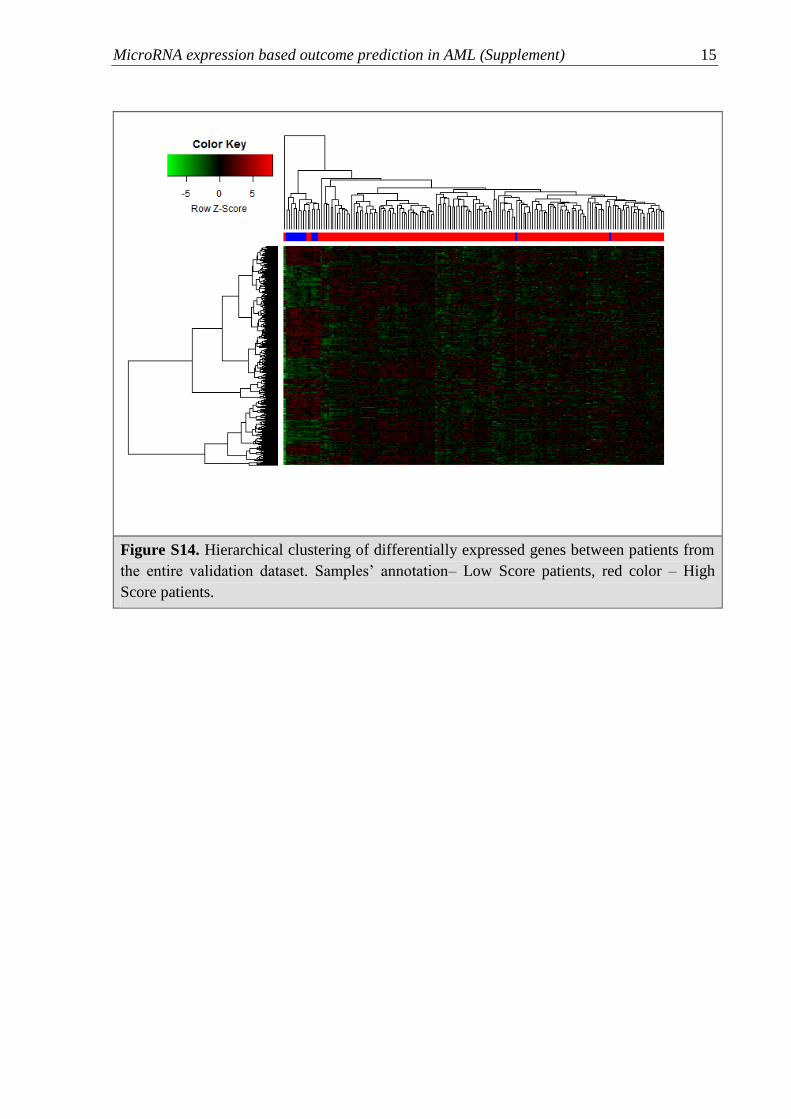
Figure S14. Hierarchical clustering of differentially expressed genes between patients from
the entire validation dataset. Samples’ annotation– Low Score patients, red color – High
Score patients.
MicroRNA expression based outcome prediction in AML (Supplement) 16
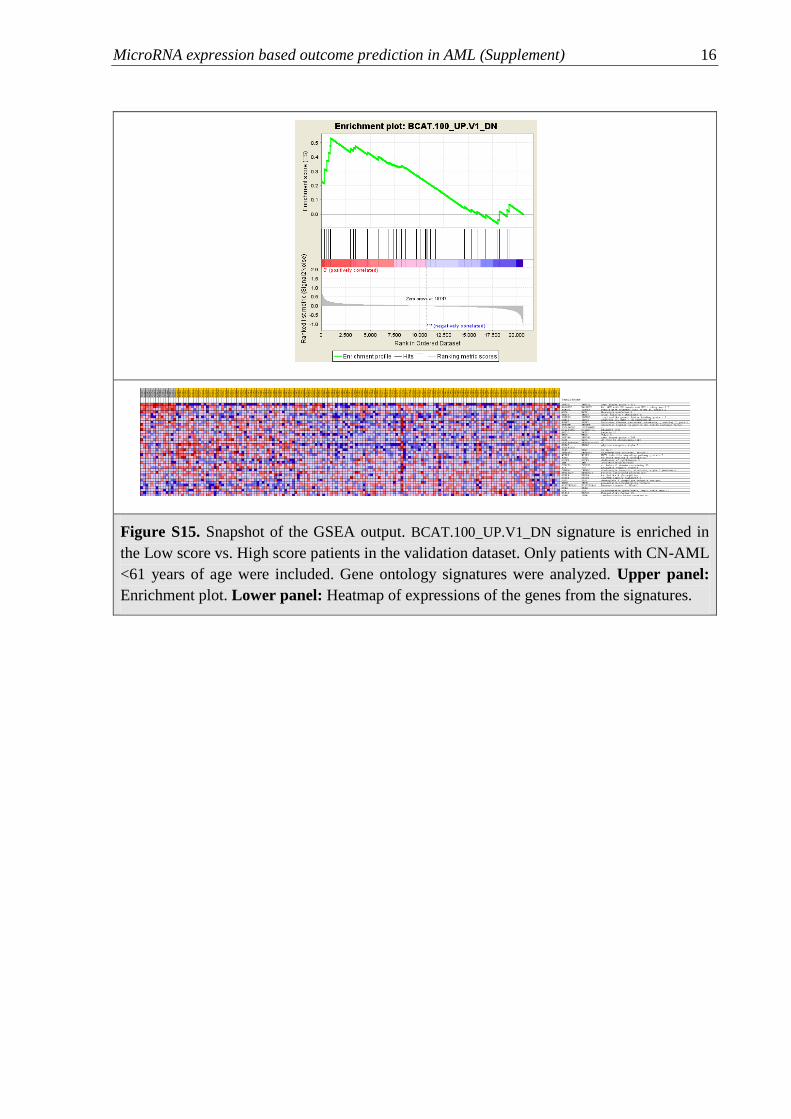
Figure S15. Snapshot of the GSEA output. BCAT.100_UP.V1_DN signature is enriched in
the Low score vs. High score patients in the validation dataset. Only patients with CN-AML
<61 years of age were included. Gene ontology signatures were analyzed. Upper panel:
Enrichment plot. Lower panel: Heatmap of expressions of the genes from the signatures.
MicroRNA expression based outcome prediction in AML (Supplement) 17
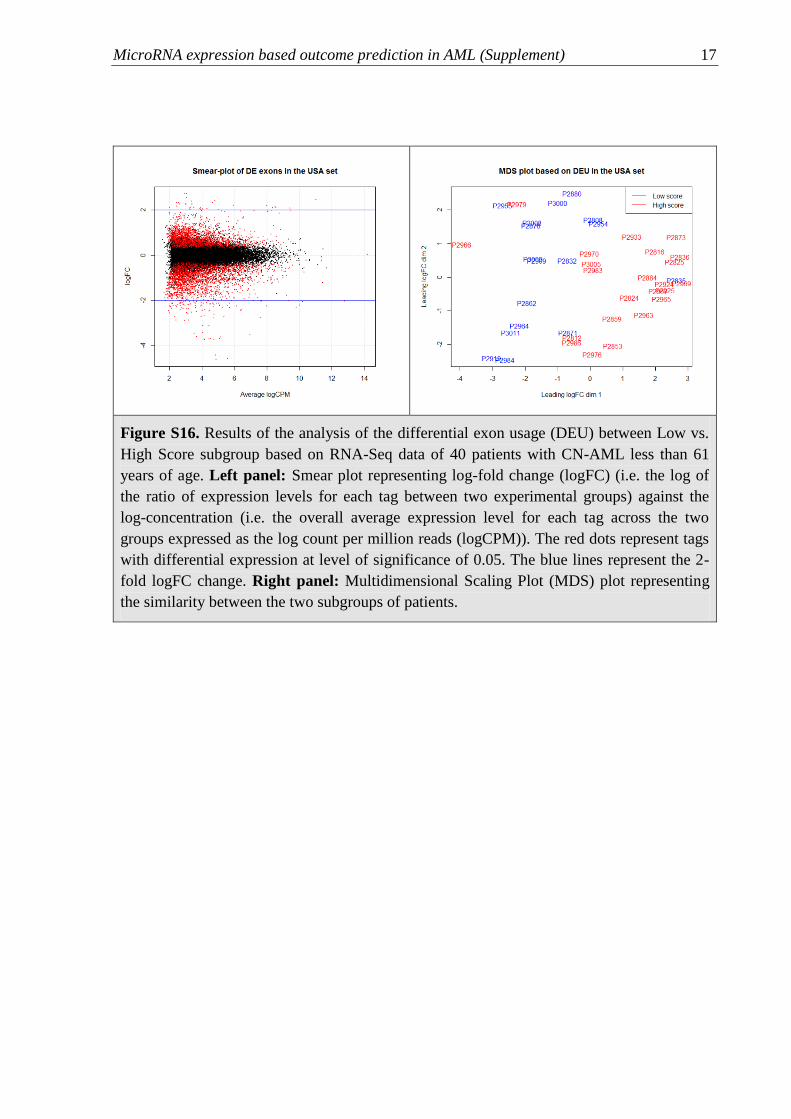
Figure S16. Results of the analysis of the differential exon usage (DEU) between Low vs.
High Score subgroup based on RNA-Seq data of 40 patients with CN-AML less than 61
years of age. Left panel: Smear plot representing log-fold change (logFC) (i.e. the log of
the ratio of expression levels for each tag between two experimental groups) against the
log-concentration (i.e. the overall average expression level for each tag across the two
groups expressed as the log count per million reads (logCPM)). The red dots represent tags
with differential expression at level of significance of 0.05. The blue lines represent the 2-
fold logFC change. Right panel: Multidimensional Scaling Plot (MDS) plot representing
the similarity between the two subgroups of patients.
MicroRNA expression based outcome prediction in AML (Supplement) 18
Supplementary Tables
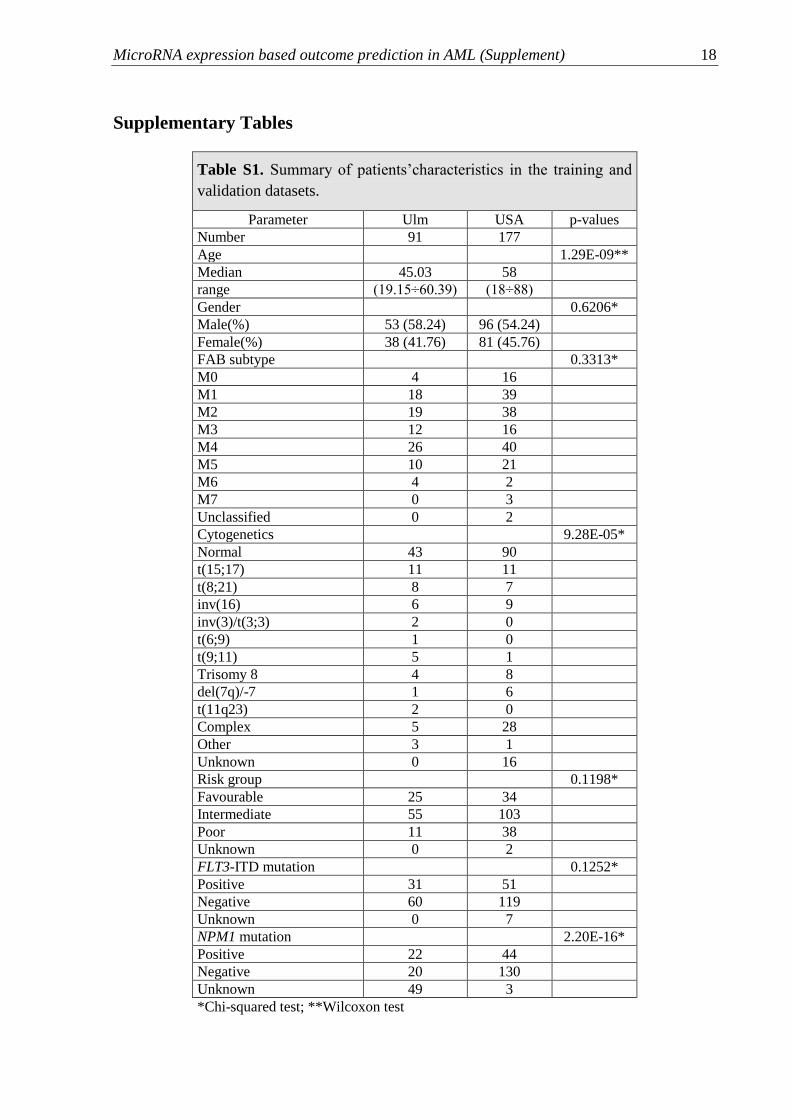
Table S1. Summary of patients’characteristics in the training and
validation datasets.
Parameter Ulm USA p-values
Number 91 177
Age
1.29E-09**
Median 45.03 58
range (19.15÷60.39) (18÷88)
Gender
0.6206*
Male(%) 53 (58.24) 96 (54.24)
Female(%) 38 (41.76) 81 (45.76)
FAB subtype
0.3313*
M0 4 16
M1 18 39
M2 19 38
M3 12 16
M4 26 40
M5 10 21
M6 4 2
M7 0 3
Unclassified 0 2
Cytogenetics
9.28E-05*
Normal 43 90
t(15;17) 11 11
t(8;21) 8 7
inv(16) 6 9
inv(3)/t(3;3) 2 0
t(6;9) 1 0
t(9;11) 5 1
Trisomy 8 4 8
del(7q)/-7 1 6
t(11q23) 2 0
Complex 5 28
Other 3 1
Unknown 0 16
Risk group
0.1198*
Favourable 25 34
Intermediate 55 103
Poor 11 38
Unknown 0 2
FLT3-ITD mutation
0.1252*
Positive 31 51
Negative 60 119
Unknown 0 7
NPM1 mutation
2.20E-16*
Positive 22 44
Negative 20 130
Unknown 49 3
*Chi-squared test; **Wilcoxon test
MicroRNA expression based outcome prediction in AML (Supplement) 19
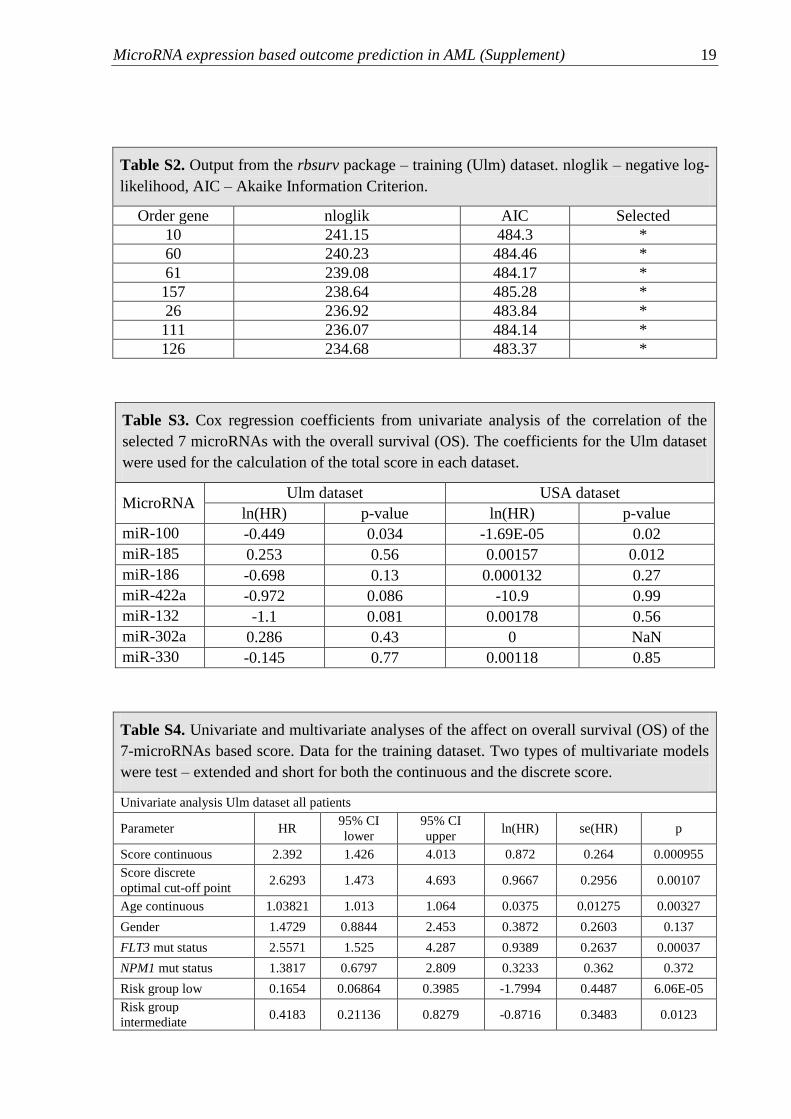
Table S2. Output from the rbsurv package – training (Ulm) dataset. nloglik – negative log-
likelihood, AIC – Akaike Information Criterion.
Order gene nloglik AIC Selected
10 241.15 484.3 *
60 240.23 484.46 *
61 239.08 484.17 *
157 238.64 485.28 *
26 236.92 483.84 *
111 236.07 484.14 *
126 234.68 483.37 *
Table S3. Cox regression coefficients from univariate analysis of the correlation of the
selected 7 microRNAs with the overall survival (OS). The coefficients for the Ulm dataset
were used for the calculation of the total score in each dataset.
MicroRNA Ulm dataset USA dataset
ln(HR) p-value ln(HR) p-value
miR-100 -0.449 0.034 -1.69E-05 0.02
miR-185 0.253 0.56 0.00157 0.012
miR-186 -0.698 0.13 0.000132 0.27
miR-422a -0.972 0.086 -10.9 0.99
miR-132 -1.1 0.081 0.00178 0.56
miR-302a 0.286 0.43 0 NaN
miR-330 -0.145 0.77 0.00118 0.85
Table S4. Univariate and multivariate analyses of the affect on overall survival (OS) of the
7-microRNAs based score. Data for the training dataset. Two types of multivariate models
were test – extended and short for both the continuous and the discrete score.
Univariate analysis Ulm dataset all patients
Parameter HR 95% CI
lower
95% CI
upper ln(HR) se(HR) p
Score continuous 2.392 1.426 4.013 0.872 0.264 0.000955
Score discrete
optimal cut-off point 2.6293 1.473 4.693 0.9667 0.2956 0.00107
Age continuous 1.03821 1.013 1.064 0.0375 0.01275 0.00327
Gender 1.4729 0.8844 2.453 0.3872 0.2603 0.137
FLT3 mut status 2.5571 1.525 4.287 0.9389 0.2637 0.00037
NPM1 mut status 1.3817 0.6797 2.809 0.3233 0.362 0.372
Risk group low 0.1654 0.06864 0.3985 -1.7994 0.4487 6.06E-05
Risk group
intermediate 0.4183 0.21136 0.8279 -0.8716 0.3483 0.0123

MicroRNA expression based outcome prediction in AML (Supplement) 20
Multivariate analysis Ulm dataset all patients
Extended model with continuous score
Parameter HR 95% CI
lower
95% CI
upper ln(HR) se(HR) p
Score continuous 1.48841 0.88461 2.5043 0.39771 0.26547 0.1341
Age continuous 1.0268 0.99952 1.0548 0.02644 0.01373 0.05419
Gender 1.4225 0.83517 2.4229 0.35242 0.27171 0.19462
FLT3 mut status 3.4592 1.88804 6.3379 1.24104 0.30894 5.89E-05
NPM1 mut status 1.10315 0.47041 2.587 0.09817 0.43486 0.82139
Risk group low 0.16175 0.05608 0.4666 -1.8217 0.54049 0.00075
Risk group
intermediate 0.3942 0.15165 1.0249 -0.93078 0.48745 0.0562
Short model with continuous score
Parameter HR 95% CI
lower
95% CI
upper ln(HR) se(HR) p
Score continuous 1.5632 0.9235 2.6462 0.4468 0.2686 0.09619
FLT3 mut status 3.3849 1.92767 5.9436 1.2193 0.2873 2.19E-05
Risk group low 0.1253 0.04594 0.3415 -2.0773 0.5118 4.92E-05
Risk group
intermediate 0.3175 0.15501 0.6501 -1.1474 0.3657 0.00171
Extended model with discrete score optimal cut-off point
Parameter HR 95% CI
lower
95% CI
upper ln(HR) se(HR) p
Score discrete 1.7726 0.93508 3.3603 0.57244 0.32632 0.079387
Age continuous 1.02487 0.99721 1.0533 0.02457 0.01396 7.85E-02
Gender 1.40268 0.8242 2.3872 0.33839 0.2713 0.212292
FLT3 mut status 3.4749 1.89677 6.3662 1.24558 0.30889 5.52E-05
NPM1 mut status 1.1151 0.4737 2.6252 0.10898 0.01396 0.078453
Risk group low 0.1555 0.05594 0.4321 -1.8612 0.52154 0.000359
Risk group
intermediate 0.3657 0.14203 0.9415 -1.00598 0.48251 0.037081
Short model with discrete score optimal cut-off point
Parameter HR 95% CI
lower
95% CI
upper ln(HR) se(HR) p
Score discrete optimal
cut 1.9279 1.03508 3.5909 0.6564 0.3173 0.03858
FLT3 mut status 3.3916 1.93922 5.9317 1.2213 0.2852 1.85E-05
Risk group low 0.1223 0.04653 0.3215 -2.1013 0.4931 2.03E-05
Risk group
intermediate 0.2896 0.14229 0.5893 -1.2393 0.3625 0.00063
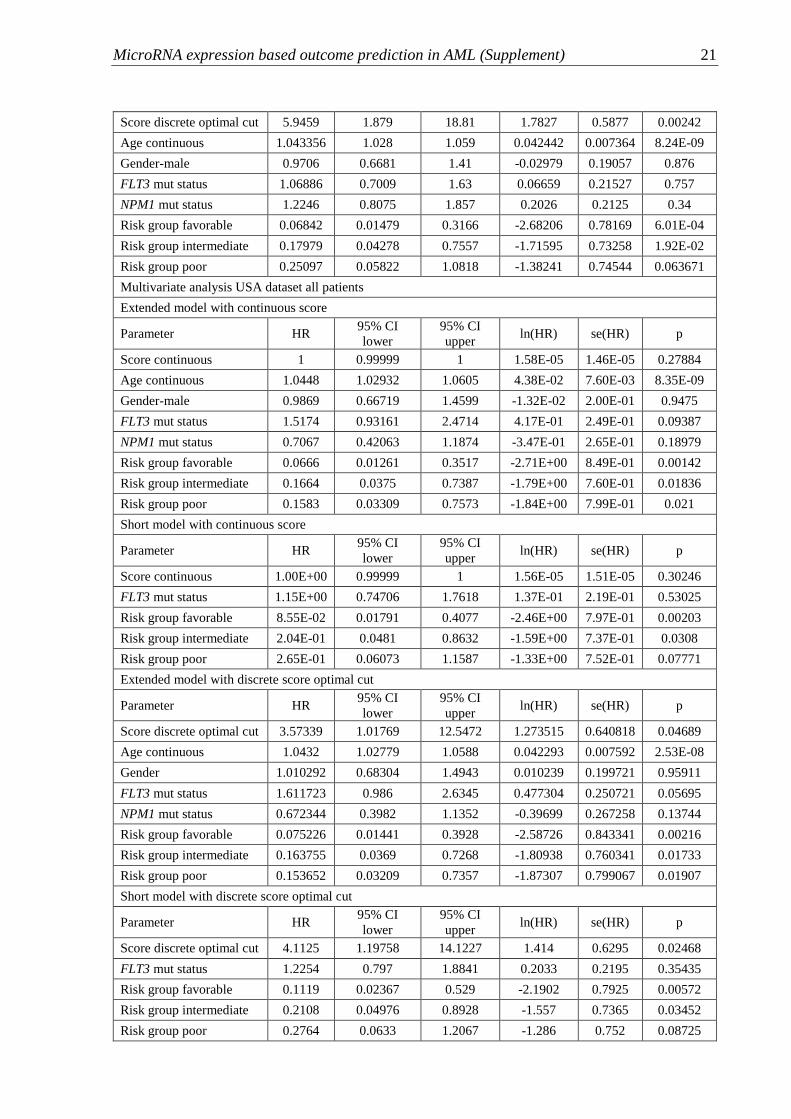
Table S5. Univariate and multivariate analyses of the effect on overall survival (OS) of the
7-microRNAs based score. Data for the validation dataset. Two types of multivariate
models were tested – extended and short for both the continuous and the discrete score.
Univariate analysis USA dataset all patients
Parameter HR 95% CI
lower
95% CI
upper ln(HR) se(HR) p
Score continuous 1 1 1 1 1.40E-05 0.0225
MicroRNA expression based outcome prediction in AML (Supplement) 21
Score discrete optimal cut 5.9459 1.879 18.81 1.7827 0.5877 0.00242
Age continuous 1.043356 1.028 1.059 0.042442 0.007364 8.24E-09
Gender-male 0.9706 0.6681 1.41 -0.02979 0.19057 0.876
FLT3 mut status 1.06886 0.7009 1.63 0.06659 0.21527 0.757
NPM1 mut status 1.2246 0.8075 1.857 0.2026 0.2125 0.34
Risk group favorable 0.06842 0.01479 0.3166 -2.68206 0.78169 6.01E-04
Risk group intermediate 0.17979 0.04278 0.7557 -1.71595 0.73258 1.92E-02
Risk group poor 0.25097 0.05822 1.0818 -1.38241 0.74544 0.063671
Multivariate analysis USA dataset all patients
Extended model with continuous score
Parameter HR 95% CI
lower
95% CI
upper ln(HR) se(HR) p
Score continuous 1 0.99999 1 1.58E-05 1.46E-05 0.27884
Age continuous 1.0448 1.02932 1.0605 4.38E-02 7.60E-03 8.35E-09
Gender-male 0.9869 0.66719 1.4599 -1.32E-02 2.00E-01 0.9475
FLT3 mut status 1.5174 0.93161 2.4714 4.17E-01 2.49E-01 0.09387
NPM1 mut status 0.7067 0.42063 1.1874 -3.47E-01 2.65E-01 0.18979
Risk group favorable 0.0666 0.01261 0.3517 -2.71E+00 8.49E-01 0.00142
Risk group intermediate 0.1664 0.0375 0.7387 -1.79E+00 7.60E-01 0.01836
Risk group poor 0.1583 0.03309 0.7573 -1.84E+00 7.99E-01 0.021
Short model with continuous score
Parameter HR 95% CI
lower
95% CI
upper ln(HR) se(HR) p
Score continuous 1.00E+00 0.99999 1 1.56E-05 1.51E-05 0.30246
FLT3 mut status 1.15E+00 0.74706 1.7618 1.37E-01 2.19E-01 0.53025
Risk group favorable 8.55E-02 0.01791 0.4077 -2.46E+00 7.97E-01 0.00203
Risk group intermediate 2.04E-01 0.0481 0.8632 -1.59E+00 7.37E-01 0.0308
Risk group poor 2.65E-01 0.06073 1.1587 -1.33E+00 7.52E-01 0.07771
Extended model with discrete score optimal cut
Parameter HR 95% CI
lower
95% CI
upper ln(HR) se(HR) p
Score discrete optimal cut 3.57339 1.01769 12.5472 1.273515 0.640818 0.04689
Age continuous 1.0432 1.02779 1.0588 0.042293 0.007592 2.53E-08
Gender 1.010292 0.68304 1.4943 0.010239 0.199721 0.95911
FLT3 mut status 1.611723 0.986 2.6345 0.477304 0.250721 0.05695
NPM1 mut status 0.672344 0.3982 1.1352 -0.39699 0.267258 0.13744
Risk group favorable 0.075226 0.01441 0.3928 -2.58726 0.843341 0.00216
Risk group intermediate 0.163755 0.0369 0.7268 -1.80938 0.760341 0.01733
Risk group poor 0.153652 0.03209 0.7357 -1.87307 0.799067 0.01907
Short model with discrete score optimal cut
Parameter HR 95% CI
lower
95% CI
upper ln(HR) se(HR) p
Score discrete optimal cut 4.1125 1.19758 14.1227 1.414 0.6295 0.02468
FLT3 mut status 1.2254 0.797 1.8841 0.2033 0.2195 0.35435
Risk group favorable 0.1119 0.02367 0.529 -2.1902 0.7925 0.00572
Risk group intermediate 0.2108 0.04976 0.8928 -1.557 0.7365 0.03452
Risk group poor 0.2764 0.0633 1.2067 -1.286 0.752 0.08725
MicroRNA expression based outcome prediction in AML (Supplement) 22
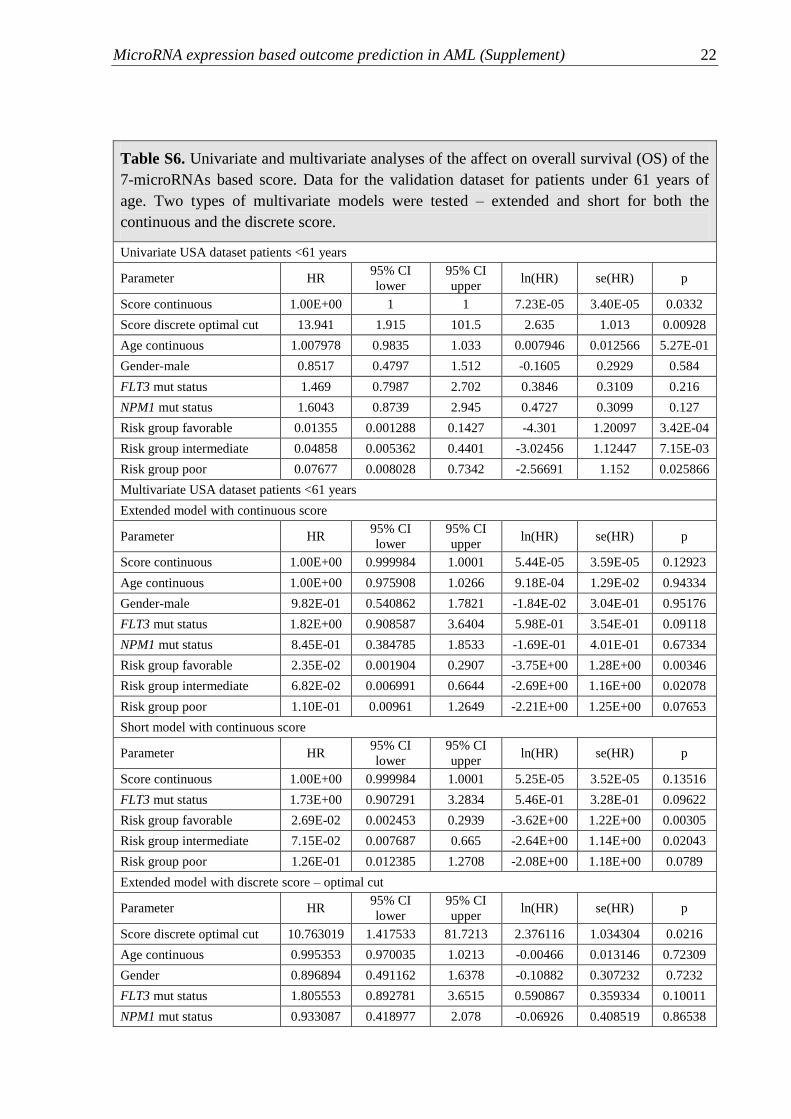
Table S6. Univariate and multivariate analyses of the affect on overall survival (OS) of the
7-microRNAs based score. Data for the validation dataset for patients under 61 years of
age. Two types of multivariate models were tested – extended and short for both the
continuous and the discrete score.
Univariate USA dataset patients <61 years
Parameter HR 95% CI
lower
95% CI
upper ln(HR) se(HR) p
Score continuous 1.00E+00 1 1 7.23E-05 3.40E-05 0.0332
Score discrete optimal cut 13.941 1.915 101.5 2.635 1.013 0.00928
Age continuous 1.007978 0.9835 1.033 0.007946 0.012566 5.27E-01
Gender-male 0.8517 0.4797 1.512 -0.1605 0.2929 0.584
FLT3 mut status 1.469 0.7987 2.702 0.3846 0.3109 0.216
NPM1 mut status 1.6043 0.8739 2.945 0.4727 0.3099 0.127
Risk group favorable 0.01355 0.001288 0.1427 -4.301 1.20097 3.42E-04
Risk group intermediate 0.04858 0.005362 0.4401 -3.02456 1.12447 7.15E-03
Risk group poor 0.07677 0.008028 0.7342 -2.56691 1.152 0.025866
Multivariate USA dataset patients <61 years
Extended model with continuous score
Parameter HR 95% CI
lower
95% CI
upper ln(HR) se(HR) p
Score continuous 1.00E+00 0.999984 1.0001 5.44E-05 3.59E-05 0.12923
Age continuous 1.00E+00 0.975908 1.0266 9.18E-04 1.29E-02 0.94334
Gender-male 9.82E-01 0.540862 1.7821 -1.84E-02 3.04E-01 0.95176
FLT3 mut status 1.82E+00 0.908587 3.6404 5.98E-01 3.54E-01 0.09118
NPM1 mut status 8.45E-01 0.384785 1.8533 -1.69E-01 4.01E-01 0.67334
Risk group favorable 2.35E-02 0.001904 0.2907 -3.75E+00 1.28E+00 0.00346
Risk group intermediate 6.82E-02 0.006991 0.6644 -2.69E+00 1.16E+00 0.02078
Risk group poor 1.10E-01 0.00961 1.2649 -2.21E+00 1.25E+00 0.07653
Short model with continuous score
Parameter HR 95% CI
lower
95% CI
upper ln(HR) se(HR) p
Score continuous 1.00E+00 0.999984 1.0001 5.25E-05 3.52E-05 0.13516
FLT3 mut status 1.73E+00 0.907291 3.2834 5.46E-01 3.28E-01 0.09622
Risk group favorable 2.69E-02 0.002453 0.2939 -3.62E+00 1.22E+00 0.00305
Risk group intermediate 7.15E-02 0.007687 0.665 -2.64E+00 1.14E+00 0.02043
Risk group poor 1.26E-01 0.012385 1.2708 -2.08E+00 1.18E+00 0.0789
Extended model with discrete score – optimal cut
Parameter HR 95% CI
lower
95% CI
upper ln(HR) se(HR) p
Score discrete optimal cut 10.763019 1.417533 81.7213 2.376116 1.034304 0.0216
Age continuous 0.995353 0.970035 1.0213 -0.00466 0.013146 0.72309
Gender 0.896894 0.491162 1.6378 -0.10882 0.307232 0.7232
FLT3 mut status 1.805553 0.892781 3.6515 0.590867 0.359334 0.10011
NPM1 mut status 0.933087 0.418977 2.078 -0.06926 0.408519 0.86538
MicroRNA expression based outcome prediction in AML (Supplement) 23
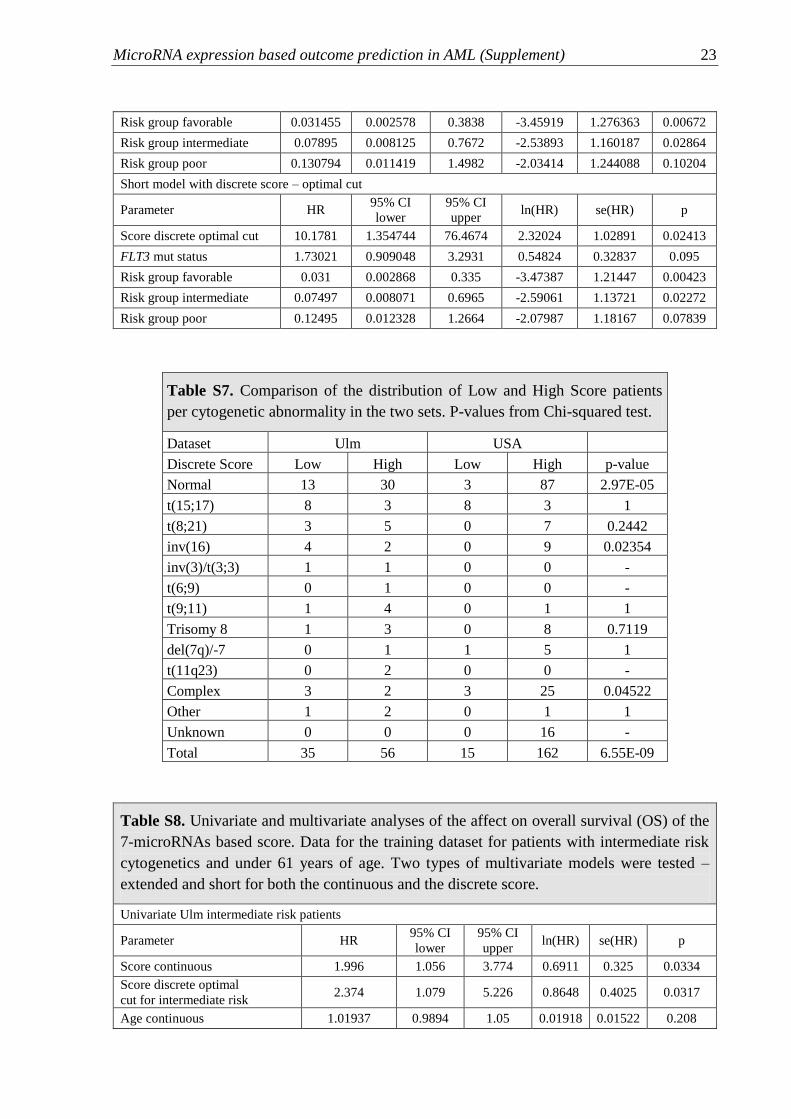
Risk group favorable 0.031455 0.002578 0.3838 -3.45919 1.276363 0.00672
Risk group intermediate 0.07895 0.008125 0.7672 -2.53893 1.160187 0.02864
Risk group poor 0.130794 0.011419 1.4982 -2.03414 1.244088 0.10204
Short model with discrete score – optimal cut
Parameter HR 95% CI
lower
95% CI
upper ln(HR) se(HR) p
Score discrete optimal cut 10.1781 1.354744 76.4674 2.32024 1.02891 0.02413
FLT3 mut status 1.73021 0.909048 3.2931 0.54824 0.32837 0.095
Risk group favorable 0.031 0.002868 0.335 -3.47387 1.21447 0.00423
Risk group intermediate 0.07497 0.008071 0.6965 -2.59061 1.13721 0.02272
Risk group poor 0.12495 0.012328 1.2664 -2.07987 1.18167 0.07839
Table S7. Comparison of the distribution of Low and High Score patients
per cytogenetic abnormality in the two sets. P-values from Chi-squared test.
Dataset Ulm USA
Discrete Score Low High Low High p-value
Normal 13 30 3 87 2.97E-05
t(15;17) 8 3 8 3 1
t(8;21) 3 5 0 7 0.2442
inv(16) 4 2 0 9 0.02354
inv(3)/t(3;3) 1 1 0 0 -
t(6;9) 0 1 0 0 -
t(9;11) 1 4 0 1 1
Trisomy 8 1 3 0 8 0.7119
del(7q)/-7 0 1 1 5 1
t(11q23) 0 2 0 0 -
Complex 3 2 3 25 0.04522
Other 1 2 0 1 1
Unknown 0 0 0 16 -
Total 35 56 15 162 6.55E-09
Table S8. Univariate and multivariate analyses of the affect on overall survival (OS) of the
7-microRNAs based score. Data for the training dataset for patients with intermediate risk
cytogenetics and under 61 years of age. Two types of multivariate models were tested –
extended and short for both the continuous and the discrete score.
Univariate Ulm intermediate risk patients
Parameter HR 95% CI
lower
95% CI
upper ln(HR) se(HR) p
Score continuous 1.996 1.056 3.774 0.6911 0.325 0.0334
Score discrete optimal
cut for intermediate risk 2.374 1.079 5.226 0.8648 0.4025 0.0317
Age continuous 1.01937 0.9894 1.05 0.01918 0.01522 0.208
MicroRNA expression based outcome prediction in AML (Supplement) 24
Gender 1.3624 0.7257 2.558 0.3093 0.3213 0.336
FLT3 mut status 4.5278 2.282 8.983 1.5102 0.3496 1.56E-05
NPM1 mut status 1.3817 0.6797 2.809 0.3233 0.362 0.372
Multivariate Ulm intermediate risk patients
Extended model with continuous score
Parameter HR 95% CI
lower
95% CI
upper ln(HR) se(HR) p
Score continuous 1.99993 0.8974 4.457 0.69311 0.40888 0.090044
Age continuous 1.05387 1.0134 1.096 0.05247 0.01997 0.008588
Gender-female 3.53504 1.5771 7.924 1.26272 0.4118 0.002167
FLT3 mut status 8.29041 2.7066 25.394 2.1151 0.57114 0.000213
NPM1 mut status 0.39092 0.1507 1.014 -0.93925 0.48634 0.053451
Short model with continuous score
Parameter HR 95% CI
lower
95% CI
upper ln(HR) se(HR) p
Score continuous 1.6407 0.8498 3.168 0.4951 0.3357 0.14
FLT3 mut status 4.0613 2.0332 8.112 1.4015 0.353 7.18E-05
Extended model discreet score – optimal cut
Parameter HR 95% CI
lower
95% CI
upper ln(HR) se(HR) p
Score discrete optimal cut for
intermediate risk 2.16295 0.8145 5.7441 0.77147 0.49832 0.121588
Age continuous 1.05741 1.0158 1.1007 0.05583 0.02047 0.006376
Gender 3.44067 1.5384 7.6951 1.23567 0.41068 0.002622
FLT3 mut status 8.42975 2.7784 25.5764 2.13177 0.56629 0.000167
NPM1 mut status 0.33293 0.1241 0.8934 -1.09981 0.50362 0.028976
Short model with discrete score – optimal cut
Parameter HR 95% CI
lower
95% CI
upper ln(HR) se(HR) p
Score discrete optimal cut 1.7088 0.753 3.878 0.5358 0.4181 0.200045
FLT3 mut status 3.9762 1.969 8.029 1.3803 0.3585 1.18E-04
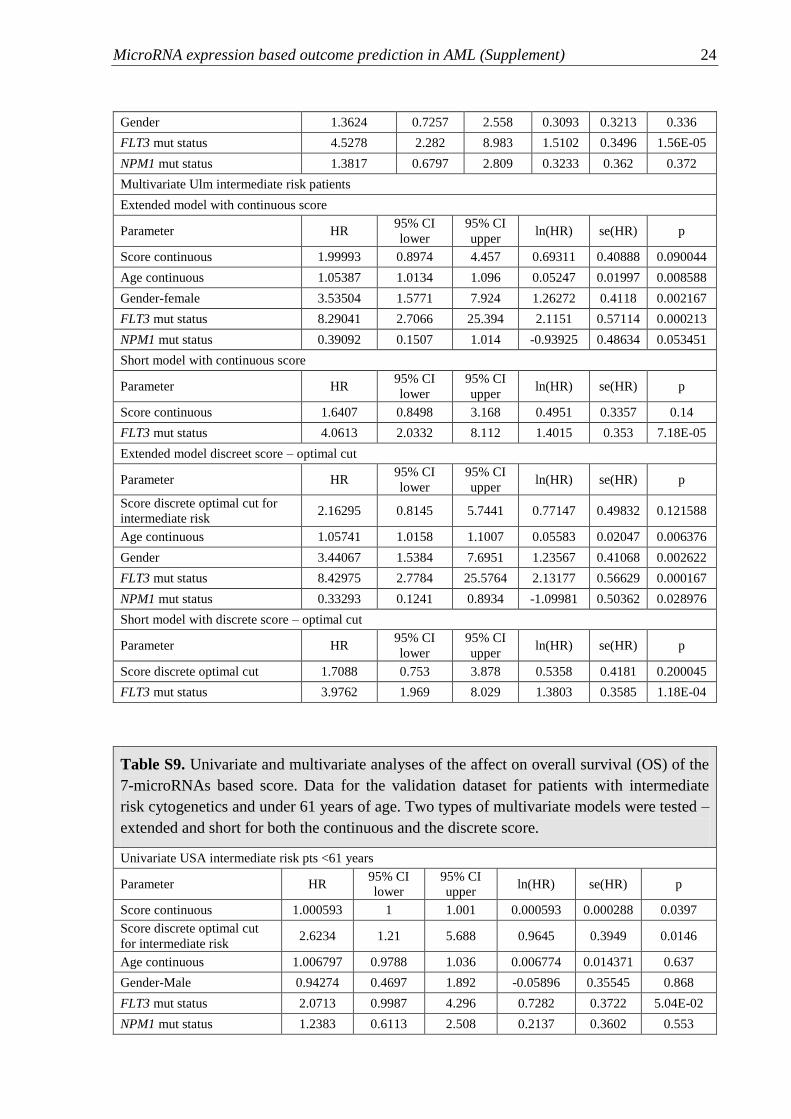
Table S9. Univariate and multivariate analyses of the affect on overall survival (OS) of the
7-microRNAs based score. Data for the validation dataset for patients with intermediate
risk cytogenetics and under 61 years of age. Two types of multivariate models were tested –
extended and short for both the continuous and the discrete score.
Univariate USA intermediate risk pts <61 years
Parameter HR 95% CI
lower
95% CI
upper ln(HR) se(HR) p
Score continuous 1.000593 1 1.001 0.000593 0.000288 0.0397
Score discrete optimal cut
for intermediate risk 2.6234 1.21 5.688 0.9645 0.3949 0.0146
Age continuous 1.006797 0.9788 1.036 0.006774 0.014371 0.637
Gender-Male 0.94274 0.4697 1.892 -0.05896 0.35545 0.868
FLT3 mut status 2.0713 0.9987 4.296 0.7282 0.3722 5.04E-02
NPM1 mut status 1.2383 0.6113 2.508 0.2137 0.3602 0.553
MicroRNA expression based outcome prediction in AML (Supplement) 25
Multivariate USA intermediate risk patients <61 years
Extended model with continuous score
Parameter HR 95% CI
lower
95% CI
upper ln(HR) se(HR) p
Score continuous 1.000523 0.9999 1.001 0.000523 0.000301 0.0822
Age continuous 0.993784 0.964 1.025 -0.00624 0.015532 0.6881
Gender-male 0.892001 0.4273 1.862 -0.11429 0.375479 0.7608
FLT3 mut status 2.263223 0.947 5.409 0.81679 0.444512 0.0661
NPM1 mut status 0.697945 0.2958 1.647 -0.35962 0.438048 0.4117
Short model with continuous score
Parameter HR 95% CI
lower
95% CI
upper ln(HR) se(HR) p
Score continuous 1.000468 0.9999 1.001 0.000467 0.000286 0.102
FLT3 mut status 1.847827 0.8543 3.997 0.61401 0.393628 1.19E-01
Extended model with discrete score optimal cut-off
Parameter HR 95% CI
lower
95% CI
upper ln(HR) se(HR) p
Score discrete optimal cut
for intermediate risk 2.775351 1.1963 6.439 1.020777 0.429373 0.0174
Age continuous 0.995008 0.9635 1.028 -0.005 0.016418 0.7605
Gender 0.97774 0.4641 2.06 -0.02251 0.380225 0.9528
FLT3 mut status 1.754128 0.7715 3.988 0.561972 0.419083 0.1799
NPM1 mut status 0.782724 0.3381 1.812 -0.24498 0.428224 0.5673
Short model with discrete score optimal cut-off
Parameter HR 95% CI
lower
95% CI
upper ln(HR) se(HR) p
Score discrete optimal cut 2.586 1.145 5.839 0.95 0.4156 0.0223
FLT3 mut status 1.559 0.731 3.325 0.4441 0.3864 2.51E-01
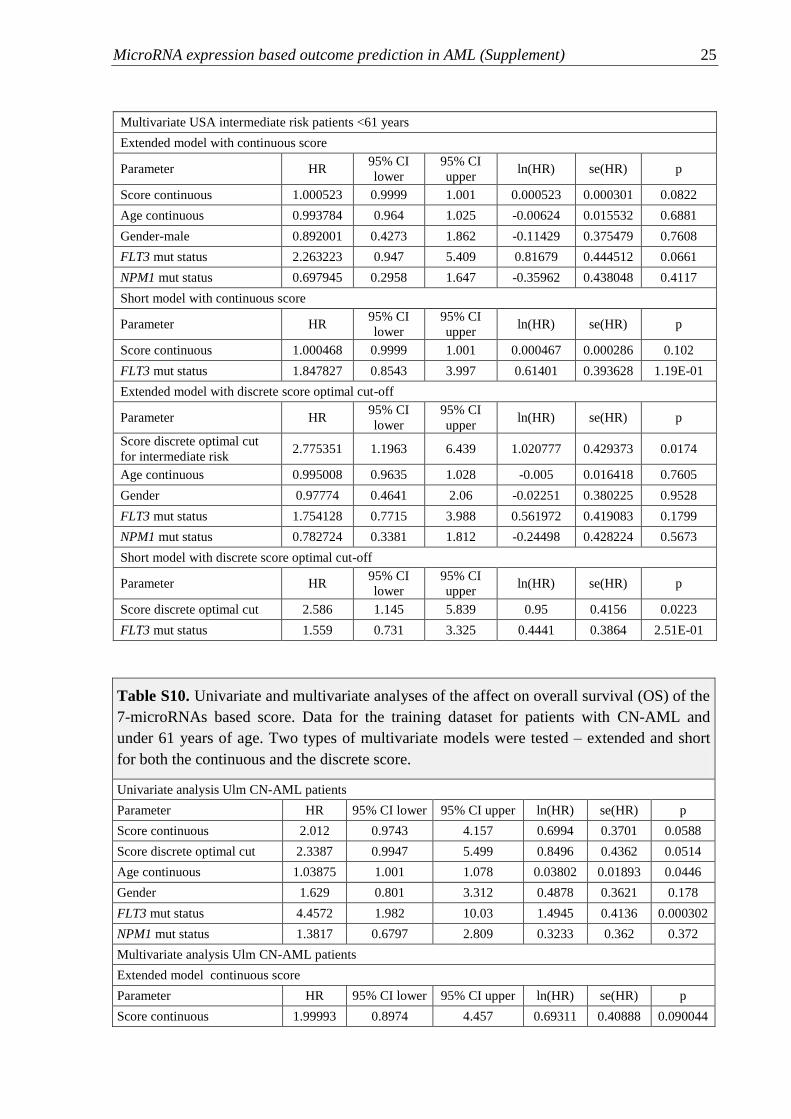
Table S10. Univariate and multivariate analyses of the affect on overall survival (OS) of the
7-microRNAs based score. Data for the training dataset for patients with CN-AML and
under 61 years of age. Two types of multivariate models were tested – extended and short
for both the continuous and the discrete score.
Univariate analysis Ulm CN-AML patients
Parameter HR 95% CI lower 95% CI upper ln(HR) se(HR) p
Score continuous 2.012 0.9743 4.157 0.6994 0.3701 0.0588
Score discrete optimal cut 2.3387 0.9947 5.499 0.8496 0.4362 0.0514
Age continuous 1.03875 1.001 1.078 0.03802 0.01893 0.0446
Gender 1.629 0.801 3.312 0.4878 0.3621 0.178
FLT3 mut status 4.4572 1.982 10.03 1.4945 0.4136 0.000302
NPM1 mut status 1.3817 0.6797 2.809 0.3233 0.362 0.372
Multivariate analysis Ulm CN-AML patients
Extended model continuous score
Parameter HR 95% CI lower 95% CI upper ln(HR) se(HR) p
Score continuous 1.99993 0.8974 4.457 0.69311 0.40888 0.090044
MicroRNA expression based outcome prediction in AML (Supplement) 26
Age continuous 1.05387 1.0134 1.096 0.05247 0.01997 0.008588
Gender 3.53504 1.5771 7.924 1.26272 0.4118 0.002167
FLT3 mut status 8.29041 2.7066 25.394 2.1151 0.57114 0.000213
NPM1 mut status 0.39092 0.1507 1.014 -0.93925 0.48634 0.053451
Short model continuous score
Parameter HR 95% CI lower 95% CI upper ln(HR) se(HR) p
Score continuous 3.9597 1.736 9.033 1.3762 0.4208 0.00107
FLT3 mut status 1.5619 0.728 3.351 0.4459 0.3895 2.52E-01
Extended model discrete score optimal cut-off
Parameter HR 95% CI lower 95% CI upper ln(HR) se(HR) p
Score discrete optimal cut 2.16295 0.8145 5.7441 0.77147 0.49832 0.121588
Age continuous 1.05741 1.0158 1.1007 0.05583 0.02047 0.006376
Gender 3.44067 1.5384 7.6951 1.23567 0.41068 0.002622
FLT3 mut status 8.42975 2.7784 25.5764 2.13177 0.56629 0.000167
NPM1 mut status 0.33293 0.1241 0.8934 -1.09981 0.50362 0.028976
Short model discrete score optimal cut-off
Parameter HR 95% CI lower 95% CI upper ln(HR) se(HR) p
Score discrete optimal cut 1.7242 0.6737 4.412 0.5448 0.4794 0.255845
FLT3 mut status 5.0587 1.9768 12.946 1.6211 0.4794 0.000721
NPM1 mut status 0.548 0.2259 1.329 -0.6015 0.4521 0.183376
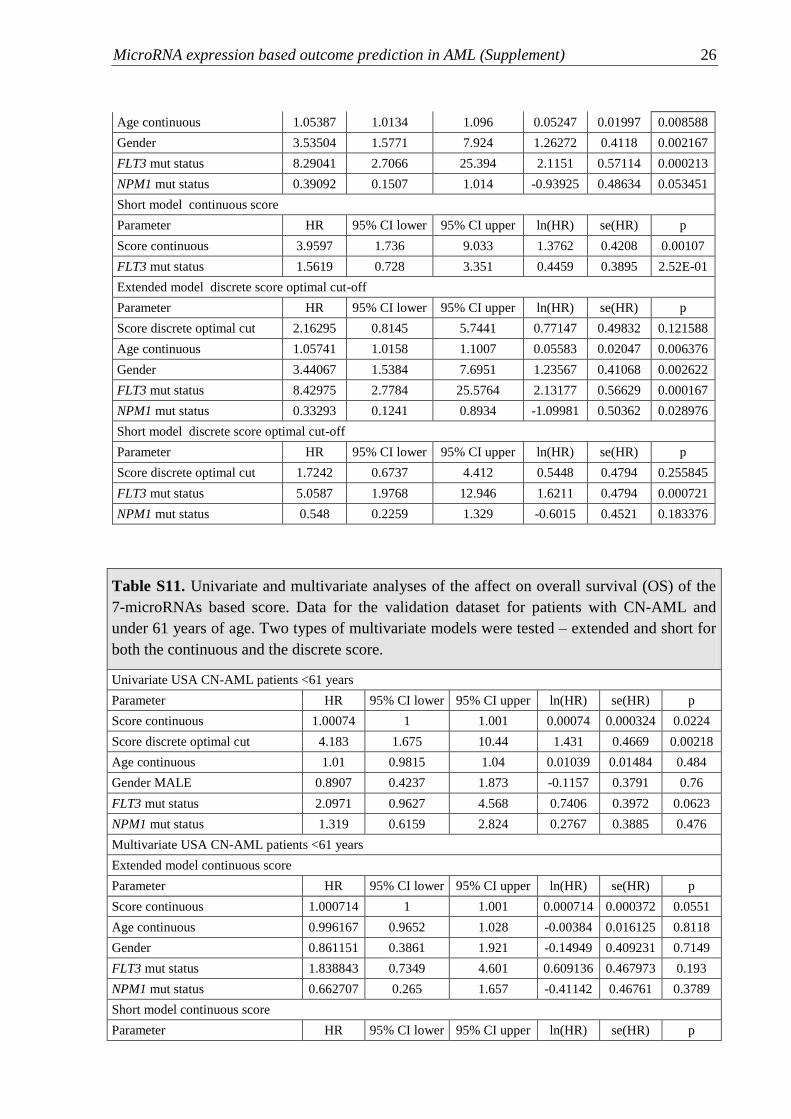
Table S11. Univariate and multivariate analyses of the affect on overall survival (OS) of the
7-microRNAs based score. Data for the validation dataset for patients with CN-AML and
under 61 years of age. Two types of multivariate models were tested – extended and short for
both the continuous and the discrete score.
Univariate USA CN-AML patients <61 years
Parameter HR 95% CI lower 95% CI upper ln(HR) se(HR) p
Score continuous 1.00074 1 1.001 0.00074 0.000324 0.0224
Score discrete optimal cut 4.183 1.675 10.44 1.431 0.4669 0.00218
Age continuous 1.01 0.9815 1.04 0.01039 0.01484 0.484
Gender MALE 0.8907 0.4237 1.873 -0.1157 0.3791 0.76
FLT3 mut status 2.0971 0.9627 4.568 0.7406 0.3972 0.0623
NPM1 mut status 1.319 0.6159 2.824 0.2767 0.3885 0.476
Multivariate USA CN-AML patients <61 years
Extended model continuous score
Parameter HR 95% CI lower 95% CI upper ln(HR) se(HR) p
Score continuous 1.000714 1 1.001 0.000714 0.000372 0.0551
Age continuous 0.996167 0.9652 1.028 -0.00384 0.016125 0.8118
Gender 0.861151 0.3861 1.921 -0.14949 0.409231 0.7149
FLT3 mut status 1.838843 0.7349 4.601 0.609136 0.467973 0.193
NPM1 mut status 0.662707 0.265 1.657 -0.41142 0.46761 0.3789
Short model continuous score
Parameter HR 95% CI lower 95% CI upper ln(HR) se(HR) p
MicroRNA expression based outcome prediction in AML (Supplement) 27
Score continuous 1.000617 0.9999 1.001 0.000617 0.000341 0.0706
FLT3 mut status 1.576361 0.6678 3.721 0.455119 0.438182 2.99E-01
Extended model discrete score optimal cut-off
Parameter HR 95% CI lower 95% CI upper ln(HR) se(HR) p
Score discrete optimal cut 6.645227 2.1373 20.661 1.893899 0.578762 0.00107
Age continuous 0.991339 0.9578 1.026 -0.0087 0.017535 0.61983
Gender 0.991991 0.4331 2.272 -0.00804 0.422817 0.98483
FLT3 mut status 1.246165 0.5297 2.932 0.220071 0.436486 0.61413
NPM1 mut status 0.626944 0.2538 1.549 -0.4669 0.461337 0.31151
Short model discrete score optimal cut-off
Parameter HR 95% CI lower 95% CI upper ln(HR) se(HR) p
Score discrete optimal cut 6.1157 2.0838 17.949 1.8109 0.5493 0.000979
FLT3 mut status 1.2621 0.5322 2.993 0.2328 0.4406 0.597225
NPM1 mut status 0.595 0.2524 1.403 -0.5192 0.4375 0.235372
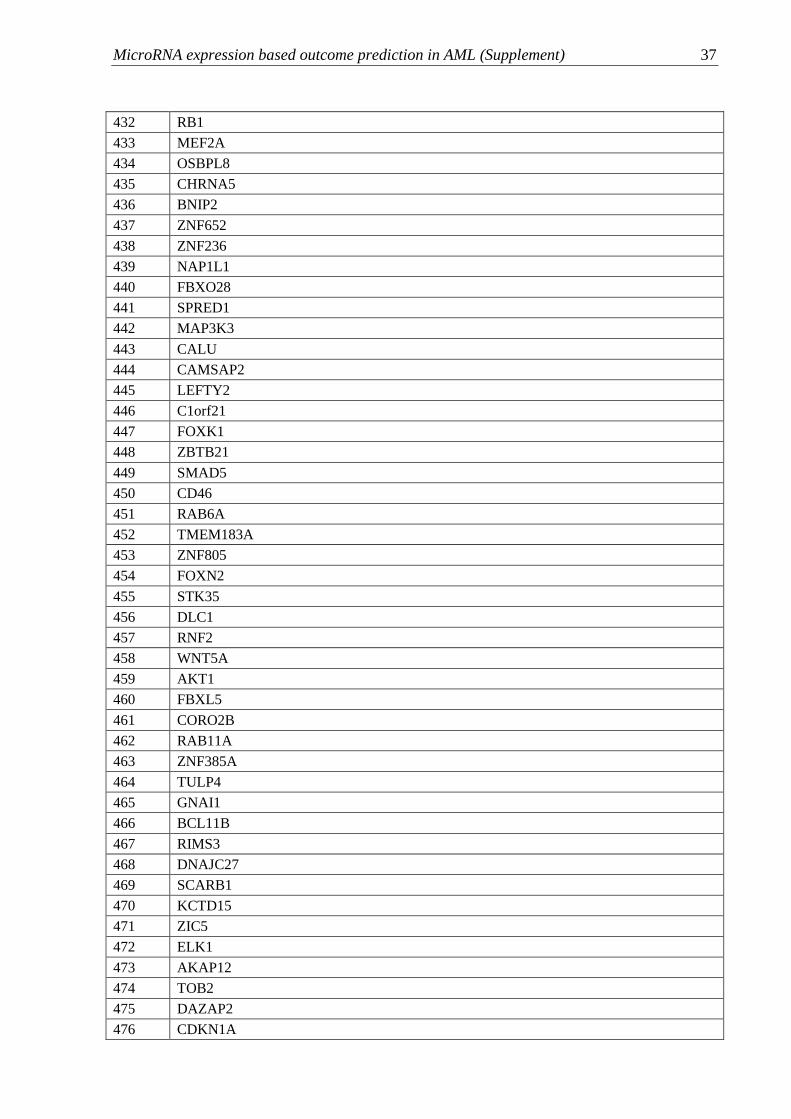
Table S12. List of common genes in the netweork analysis.
Number Gene Symbol
1 PHYHIP
2 HELZ
3 RPL23A
4 SERAC1
5 IL8
6 FRAP1
7 PAIP2
8 DCTN2
9 TFEB
10 H2AFZ
11 SPRY1
12 C9orf3
13 ZNF423
14 SETD1B
15 ENOSF1
16 RBM26
17 HRBL
18 PCYT1B
19 Q9NUU0_HUMAN
20 PABPC1
21 MYCBP2
22 PTPN21
23 CDC42
24 GRM3
25 SLC33A1
26 EPB41
MicroRNA expression based outcome prediction in AML (Supplement) 28
27 FAM76A
28 SPG3A
29 PCMT1
30 SCN3A
31 FIGF
32 YLPM1
33 KPNA2
34 ICAM2
35 PTPRD
36 PARP8
37 NFATC3
38 ASF1A
39 FBXW4
40 CHRNA10
41 C9orf94
42 LBX2
43 GTPBP4
44 GRM5
45 RFWD2
46 MTF1
47 AP1M1
48 C1orf122
49 APRV1_HUMAN
50 DMXL2
51 BCAT2
52 PRDM8
53 GRHL1
54 HBEGF
55 FGD4
56 CCL20
57 TRIP11
58 AFF4
59 BCAN
60 CHST2
61 POLQ
62 KLF15
63 SNRPD3
64 PCMT1
65 Q9HCM3_HUMAN
66 MED12L
67 KHDRBS3
68 AK2
69 AGBL2
70 LAMA3
71 TCF12
MicroRNA expression based outcome prediction in AML (Supplement) 29
72 TTK
73 CUEDC1
74 PRX
75 RBM12
76 CASP14
77 BAI1
78 C14orf145
79 RSRC2
80 SPATA5
81 C4orf35
82 GNL1
83 ANGPT4
84 EFCAB5
85 ACTR10
86 ZFP3
87 BBS1
88 FOXA1
89 PRRT2
90 RHOG
91 SPAST
92 C5orf15
93 CLDN11
94 GTF2H1
95 DDX26B
96 SYCP1
97 AOF1
98 SMARCA5
99 PURA
100 RGS22
101 CAST
102 ARPC1B
103 DDHD1
104 SDF2
105 HNRPUL2
106 GABARAP
107 PBX1
108 PCMTD1
109 RPP14
110 LIN7A
111 GFRA1
112 PABPC3
113 KIAA0515
114 MTCH2
115 MLL3
116 SUV420H2
MicroRNA expression based outcome prediction in AML (Supplement) 30
117 MBNL3
118 GAPVD1
119 RSBN1L
120 TLE4
121 FRK
122 KCNMA1
123 EIF4A2
124 PARS2
125 HSD11B1
126 HIF3A
127 ASF1B
128 LSM14B
129 GPM6B
130 PUM2
131 PPP1R1B
132 SLC2A1
133 PLK1
134 GRASP
135 CASP8
136 TCEAL1
137 ACVR1
138 CNN1
139 OLFM1
140 SHROOM1
141 MORC1
142 SOX21
143 ZNF292
144 RAPH1
145 ASB1
146 C1QBP
147 ENPEP
148 TCF7L1
149 RAI2
150 CENTG1
151 MED4
152 ORC5L
153 CC2D1A
154 FOXP2
155 TAOK2
156 TBX6
157 TRIM3
158 TDRKH
159 NTRK3
160 MAPRE3
161 PHF21A

MicroRNA expression based outcome prediction in AML (Supplement) 31
162 LRRFIP1
163 INSM1
164 SLC39A9
165 BFSP2
166 TUSC3
167 ZNF571
168 ING4
169 SLC25A28
170 C1orf128
171 ZDHHC9
172 SI
173 APBA1
174 SYDE1
175 PGGT1B
176 PAK6
177 ARID5B
178 SPTBN4
179 PHF7
180 SNX7
181 NTNG1
182 TEAD1
183 SBDS
184 TAC3
185 ARID4A
186 SLC46A3
187 APCDD1
188 SALL4
189 ARHGEF9
190 ZNF289
191 DUSP13
192 RIT1
193 MYOD1
194 MCAT
195 ZNF473
196 TRIM41
197 F12
198 IGF1R
199 CTDSPL2
200 HS3ST2
201 PLEKHG2
202 REN
203 SRPK2
204 HHIP
205 MBOAT5
206 PPP1R14C
MicroRNA expression based outcome prediction in AML (Supplement) 32
207 GPRASP2
208 CXorf36
209 FUBP1
210 FAM18B2
211 MTMR3
212 GEMIN8
213 EPB41L3
214 BVES
215 FGFR3
216 ST5
217 FBXL4
218 KCNIP2
219 SMARCA1
220 STXBP5L
221 CHIT1
222 CLSPN
223 Q8N467_HUMAN
224 RABEP1
225 PTCH1
226 YY1
227 ACVR2B
228 JARID1A
229 RUVBL1
230 ECT2
231 IL2
232 TUSC2
233 PPP1R9A
234 TRPV6
235 SLC12A8
236 FXR1
237 K0552_HUMAN
238 ZNF238
239 FNTB
240 ALAS2
241 ZNF597
242 IGBP1
243 TIMM9
244 MBD2
245 ITGB8
246 GOLT1A
247 VPS13C
248 RASA1
249 MTMR10
250 RLF
251 NP_997528.1
MicroRNA expression based outcome prediction in AML (Supplement) 33
252 DNAJA2
253 TMEM51
254 EIF4B
255 DYRK4
256 RORA
257 MAPK3
258 FRMPD2
259 SOSTDC1
260 PGM3
261 CRTC2
262 RELA
263 C11orf57
264 PPP2CB
265 NM_001011700.1
266 LRRC21
267 INTS6
268 NP_060170.1
269 C1orf32
270 MINK1
271 RYR2
272 KCNJ12
273 SIRT1
274 AMOT
275 C17orf74
276 NRAS
277 ZNF362
278 C19orf47
279 CROT
280 TP53INP1
281 NP_689963.2
282 CLK4
283 ARMCX6
284 TCF15
285 ATG9A
286 SSH2
287 FOXP2
288 IQSEC2
289 HN1
290 TMEM106A
291 LEMD3
292 NFIB
293 YIPF1
294 USP38
295 ITFG1
296 HES7
MicroRNA expression based outcome prediction in AML (Supplement) 34
297 HNRPR
298 CKS1B
299 NP_742017.1
300 FOXO3A
301 FAM130A2
302 RFC1
303 ZNF536
304 ARX
305 CNGA1
306 DNM3
307 TSHZ3
308 DNAJC8
309 PTPRM
310 NP_689968.1
311 PEA15
312 DARC
313 DBT
314 NP_219485.1
315 BCMO1
316 JMJD3
317 TXNIP
318 WDR37
319 PRKAR2A
320 SIX1
321 CHAD
322 SGMS1
323 TLN2
324 GDF5
325 CBLL1
326 SFRS10
327 RAB3IP
328 RSF1
329 NDUFB10
330 RPS6KA1
331 EP300
332 CMTM3
333 IRF1
334 RDBP
335 GCC2
336 PSPH
337 TMEM16B
338 TBCEL
339 NP_009007.2
340 MAP3K13
341 AP2M1
MicroRNA expression based outcome prediction in AML (Supplement) 35
342 TRIB2
343 ARHGAP30
344 SALL1
345 MUC13
346 ANKRD29
347 DYNLL2
348 C19orf43
349 KCND2
350 FKBP2
351 SEPT12
352 EIF4G3
353 NP_056002.1
354 FZD8
355 C12orf44
356 LGTN
357 MBNL2
358 VDAC2
359 RANBP3
360 ATP6V1F
361 OCIAD1
362 Q6ZU65_HUMAN
363 CCDC131
364 GPR128
365 HNRPUL2
366 CA2
367 ID2
368 SAMD12
369 MIA3
370 TRPC1
371 ADD2
372 S100B
373 MAPKAPK5
374 PDE1B
375 SCN9A
376 GPR6
377 EIF2S3
378 CC2D1B
379 EIF4E3
380 SYT5
381 BCDIN3
382 MKNK2
383 TJAP1
384 GBAS
385 PAN3
386 NEUROD2
MicroRNA expression based outcome prediction in AML (Supplement) 36
387 SFRS3
388 CSNK2A1P
389 SEC22A
390 ZNF644
391 GTDC1
392 EEF2K
393 EFEMP1
394 LHX8
395 SLC6A15
396 GPR12
397 E2F5
398 ST6GALNAC4
399 ANKRD34
400 LEFTY1
401 TARDBP
402 SS18L2
403 BAMBI
404 DERL2
405 HOXA1
406 CYP8B1
407 ZCCHC11
408 NR4A2
409 DTX3
410 DPH2
411 KLK5
412 GRIA3
413 BFSP1
414 DTWD1
415 TAF15
416 MRPS16
417 CBX6
418 NF2
419 C12orf34
420 CRK
421 THTPA
422 RBM41
423 CDC37
424 NP_055530.2
425 TRAFD1
426 SAP30L
427 NRP1
428 TSFM
429 C7orf43
430 CTSA
431 PSMA2
MicroRNA expression based outcome prediction in AML (Supplement) 37
432 RB1
433 MEF2A
434 OSBPL8
435 CHRNA5
436 BNIP2
437 ZNF652
438 ZNF236
439 NAP1L1
440 FBXO28
441 SPRED1
442 MAP3K3
443 CALU
444 CAMSAP2
445 LEFTY2
446 C1orf21
447 FOXK1
448 ZBTB21
449 SMAD5
450 CD46
451 RAB6A
452 TMEM183A
453 ZNF805
454 FOXN2
455 STK35
456 DLC1
457 RNF2
458 WNT5A
459 AKT1
460 FBXL5
461 CORO2B
462 RAB11A
463 ZNF385A
464 TULP4
465 GNAI1
466 BCL11B
467 RIMS3
468 DNAJC27
469 SCARB1
470 KCTD15
471 ZIC5
472 ELK1
473 AKAP12
474 TOB2
475 DAZAP2
476 CDKN1A
MicroRNA expression based outcome prediction in AML (Supplement) 38
477 E2F1
478 P2RX7
479 CCND1
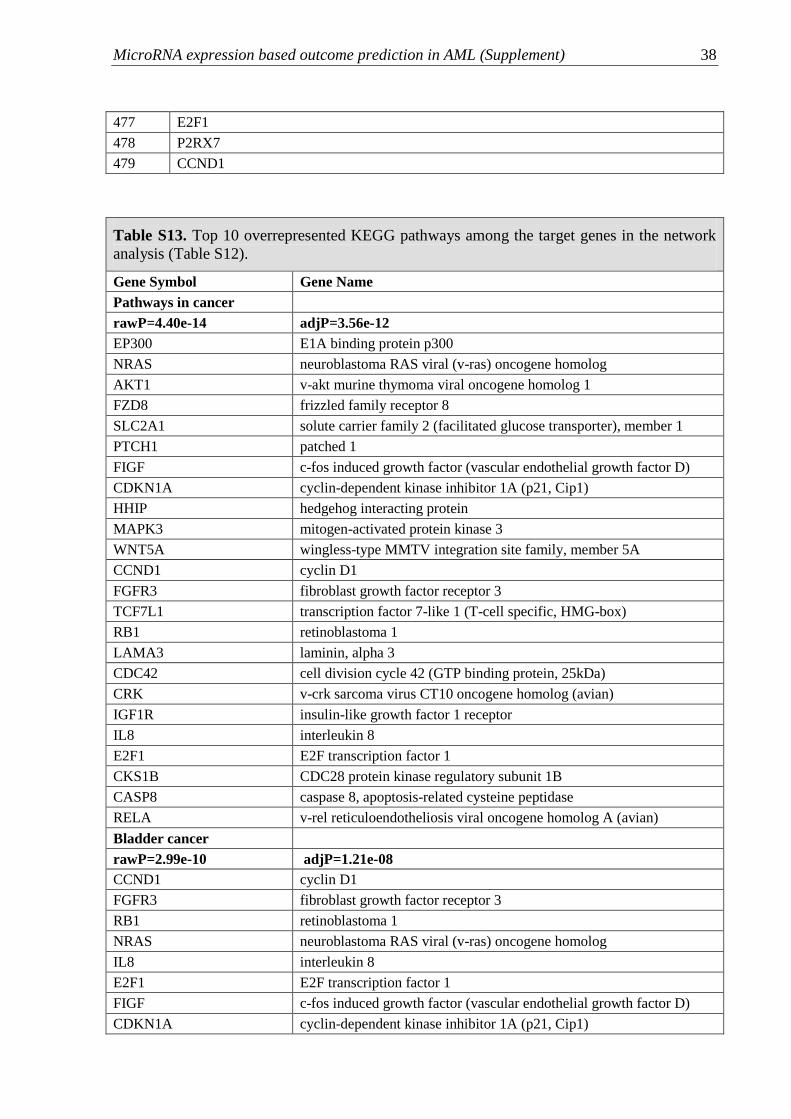
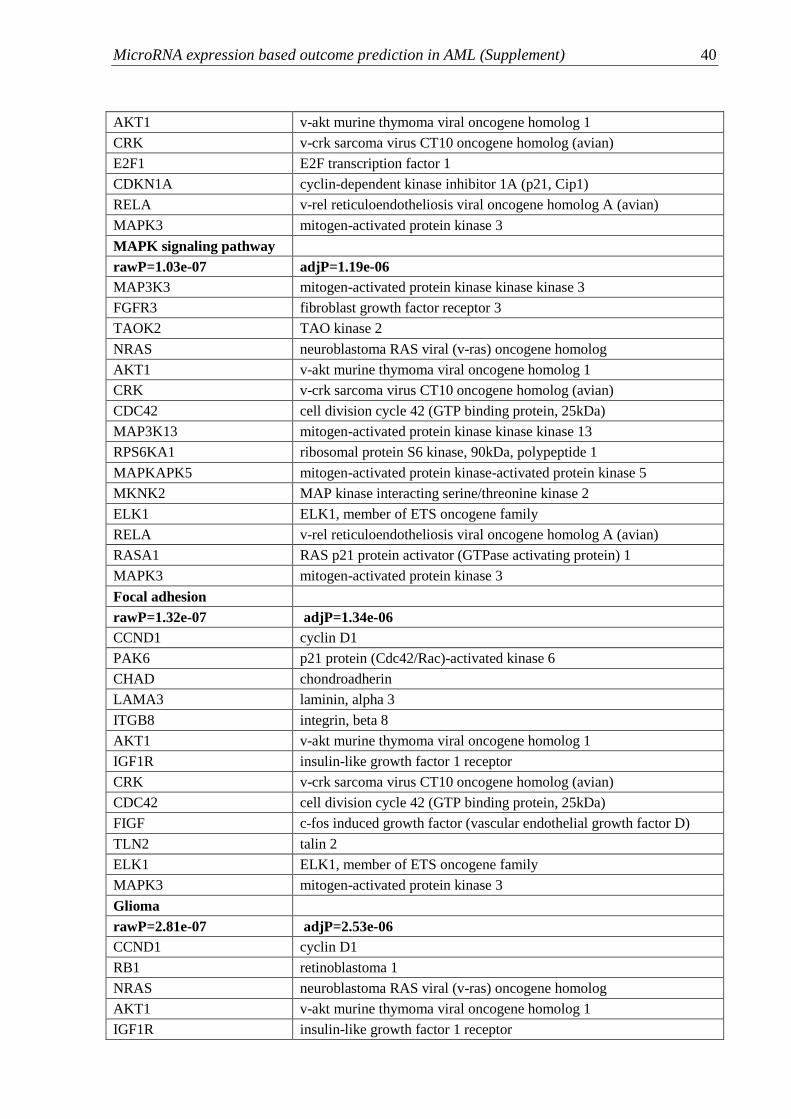
Table S13. Top 10 overrepresented KEGG pathways among the target genes in the network
analysis (Table S12).
Gene Symbol Gene Name
Pathways in cancer
rawP=4.40e-14 adjP=3.56e-12
EP300 E1A binding protein p300
NRAS neuroblastoma RAS viral (v-ras) oncogene homolog
AKT1 v-akt murine thymoma viral oncogene homolog 1
FZD8 frizzled family receptor 8
SLC2A1 solute carrier family 2 (facilitated glucose transporter), member 1
PTCH1 patched 1
FIGF c-fos induced growth factor (vascular endothelial growth factor D)
CDKN1A cyclin-dependent kinase inhibitor 1A (p21, Cip1)
HHIP hedgehog interacting protein
MAPK3 mitogen-activated protein kinase 3
WNT5A wingless-type MMTV integration site family, member 5A
CCND1 cyclin D1
FGFR3 fibroblast growth factor receptor 3
TCF7L1 transcription factor 7-like 1 (T-cell specific, HMG-box)
RB1 retinoblastoma 1
LAMA3 laminin, alpha 3
CDC42 cell division cycle 42 (GTP binding protein, 25kDa)
CRK v-crk sarcoma virus CT10 oncogene homolog (avian)
IGF1R insulin-like growth factor 1 receptor
IL8 interleukin 8
E2F1 E2F transcription factor 1
CKS1B CDC28 protein kinase regulatory subunit 1B
CASP8 caspase 8, apoptosis-related cysteine peptidase
RELA v-rel reticuloendotheliosis viral oncogene homolog A (avian)
Bladder cancer
rawP=2.99e-10 adjP=1.21e-08
CCND1 cyclin D1
FGFR3 fibroblast growth factor receptor 3
RB1 retinoblastoma 1
NRAS neuroblastoma RAS viral (v-ras) oncogene homolog
IL8 interleukin 8
E2F1 E2F transcription factor 1
FIGF c-fos induced growth factor (vascular endothelial growth factor D)
CDKN1A cyclin-dependent kinase inhibitor 1A (p21, Cip1)

MicroRNA expression based outcome prediction in AML (Supplement) 39
MAPK3 mitogen-activated protein kinase 3
TGF-beta signaling
pathway
rawP=8.24e-10 adjP=2.22e-08
EP300 E1A binding protein p300
LEFTY2 left-right determination factor 2
ACVR1 activin A receptor, type I
LEFTY1 left-right determination factor 1
E2F5 E2F transcription factor 5, p130-binding
PPP2CB protein phosphatase 2, catalytic subunit, beta isozyme
ID2 inhibitor of DNA binding 2, dominant negative helix-loop-helix
protein
SMAD5 SMAD family member 5
ACVR2B activin A receptor, type IIB
GDF5 growth differentiation factor 5
MAPK3 mitogen-activated protein kinase 3
Prostate cancer
rawP=1.55e-09 adjP=3.14e-08
CCND1 cyclin D1
EP300 E1A binding protein p300
RB1 retinoblastoma 1
TCF7L1 transcription factor 7-like 1 (T-cell specific, HMG-box)
NRAS neuroblastoma RAS viral (v-ras) oncogene homolog
AKT1 v-akt murine thymoma viral oncogene homolog 1
IGF1R insulin-like growth factor 1 receptor
E2F1 E2F transcription factor 1
CDKN1A cyclin-dependent kinase inhibitor 1A (p21, Cip1)
RELA v-rel reticuloendotheliosis viral oncogene homolog A (avian)
MAPK3 mitogen-activated protein kinase 3
Renal cell carcinoma
rawP=3.40e-08 adjP=5.51e-07
EP300 E1A binding protein p300
PAK6 p21 protein (Cdc42/Rac)-activated kinase 6
FIGF c-fos induced growth factor (vascular endothelial growth factor D)
NRAS neuroblastoma RAS viral (v-ras) oncogene homolog
AKT1 v-akt murine thymoma viral oncogene homolog 1
CRK v-crk sarcoma virus CT10 oncogene homolog (avian)
CDC42 cell division cycle 42 (GTP binding protein, 25kDa)
SLC2A1 solute carrier family 2 (facilitated glucose transporter), member 1
MAPK3 mitogen-activated protein kinase 3
Chronic myeloid leukemia
rawP=4.95e-08 adjP=6.68e-07
CCND1 cyclin D1
RB1 retinoblastoma 1
NRAS neuroblastoma RAS viral (v-ras) oncogene homolog
MicroRNA expression based outcome prediction in AML (Supplement) 40
AKT1 v-akt murine thymoma viral oncogene homolog 1
CRK v-crk sarcoma virus CT10 oncogene homolog (avian)
E2F1 E2F transcription factor 1
CDKN1A cyclin-dependent kinase inhibitor 1A (p21, Cip1)
RELA v-rel reticuloendotheliosis viral oncogene homolog A (avian)
MAPK3 mitogen-activated protein kinase 3
MAPK signaling pathway
rawP=1.03e-07 adjP=1.19e-06
MAP3K3 mitogen-activated protein kinase kinase kinase 3
FGFR3 fibroblast growth factor receptor 3
TAOK2 TAO kinase 2
NRAS neuroblastoma RAS viral (v-ras) oncogene homolog
AKT1 v-akt murine thymoma viral oncogene homolog 1
CRK v-crk sarcoma virus CT10 oncogene homolog (avian)
CDC42 cell division cycle 42 (GTP binding protein, 25kDa)
MAP3K13 mitogen-activated protein kinase kinase kinase 13
RPS6KA1 ribosomal protein S6 kinase, 90kDa, polypeptide 1
MAPKAPK5 mitogen-activated protein kinase-activated protein kinase 5
MKNK2 MAP kinase interacting serine/threonine kinase 2
ELK1 ELK1, member of ETS oncogene family
RELA v-rel reticuloendotheliosis viral oncogene homolog A (avian)
RASA1 RAS p21 protein activator (GTPase activating protein) 1
MAPK3 mitogen-activated protein kinase 3
Focal adhesion
rawP=1.32e-07 adjP=1.34e-06
CCND1 cyclin D1
PAK6 p21 protein (Cdc42/Rac)-activated kinase 6
CHAD chondroadherin
LAMA3 laminin, alpha 3
ITGB8 integrin, beta 8
AKT1 v-akt murine thymoma viral oncogene homolog 1
IGF1R insulin-like growth factor 1 receptor
CRK v-crk sarcoma virus CT10 oncogene homolog (avian)
CDC42 cell division cycle 42 (GTP binding protein, 25kDa)
FIGF c-fos induced growth factor (vascular endothelial growth factor D)
TLN2 talin 2
ELK1 ELK1, member of ETS oncogene family
MAPK3 mitogen-activated protein kinase 3
Glioma
rawP=2.81e-07 adjP=2.53e-06
CCND1 cyclin D1
RB1 retinoblastoma 1
NRAS neuroblastoma RAS viral (v-ras) oncogene homolog
AKT1 v-akt murine thymoma viral oncogene homolog 1
IGF1R insulin-like growth factor 1 receptor
MicroRNA expression based outcome prediction in AML (Supplement) 41
E2F1 E2F transcription factor 1
CDKN1A cyclin-dependent kinase inhibitor 1A (p21, Cip1)
MAPK3 mitogen-activated protein kinase 3
Pancreatic cancer
rawP=5.03e-07 adjP=4.07e-06
CCND1 cyclin D1
RB1 retinoblastoma 1
AKT1 v-akt murine thymoma viral oncogene homolog 1
CDC42 cell division cycle 42 (GTP binding protein, 25kDa)
E2F1 E2F transcription factor 1
FIGF c-fos induced growth factor (vascular endothelial growth factor D)
RELA v-rel reticuloendotheliosis viral oncogene homolog A (avian)
MAPK3 mitogen-activated protein kinase 3
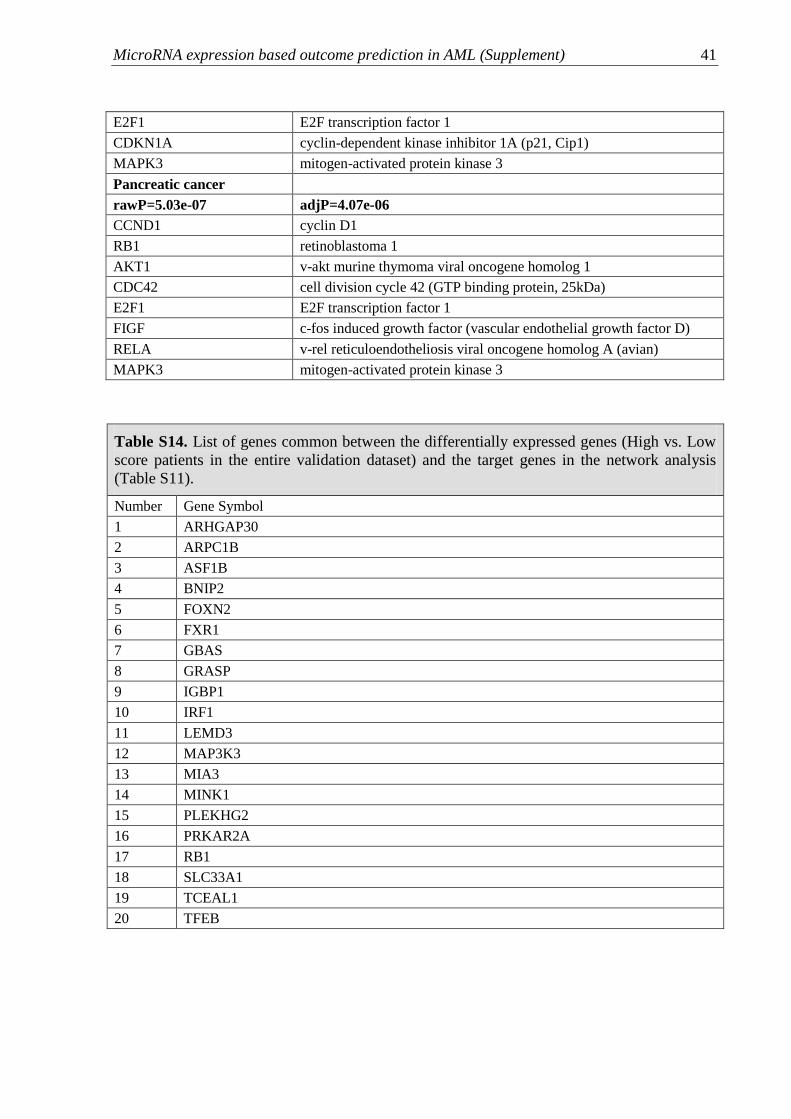
Table S14. List of genes common between the differentially expressed genes (High vs. Low
score patients in the entire validation dataset) and the target genes in the network analysis
(Table S11).
Number Gene Symbol
1 ARHGAP30
2 ARPC1B
3 ASF1B
4 BNIP2
5 FOXN2
6 FXR1
7 GBAS
8 GRASP
9 IGBP1
10 IRF1
11 LEMD3
12 MAP3K3
13 MIA3
14 MINK1
15 PLEKHG2
16 PRKAR2A
17 RB1
18 SLC33A1
19 TCEAL1
20 TFEB
MicroRNA expression based outcome prediction in AML (Supplement) 42
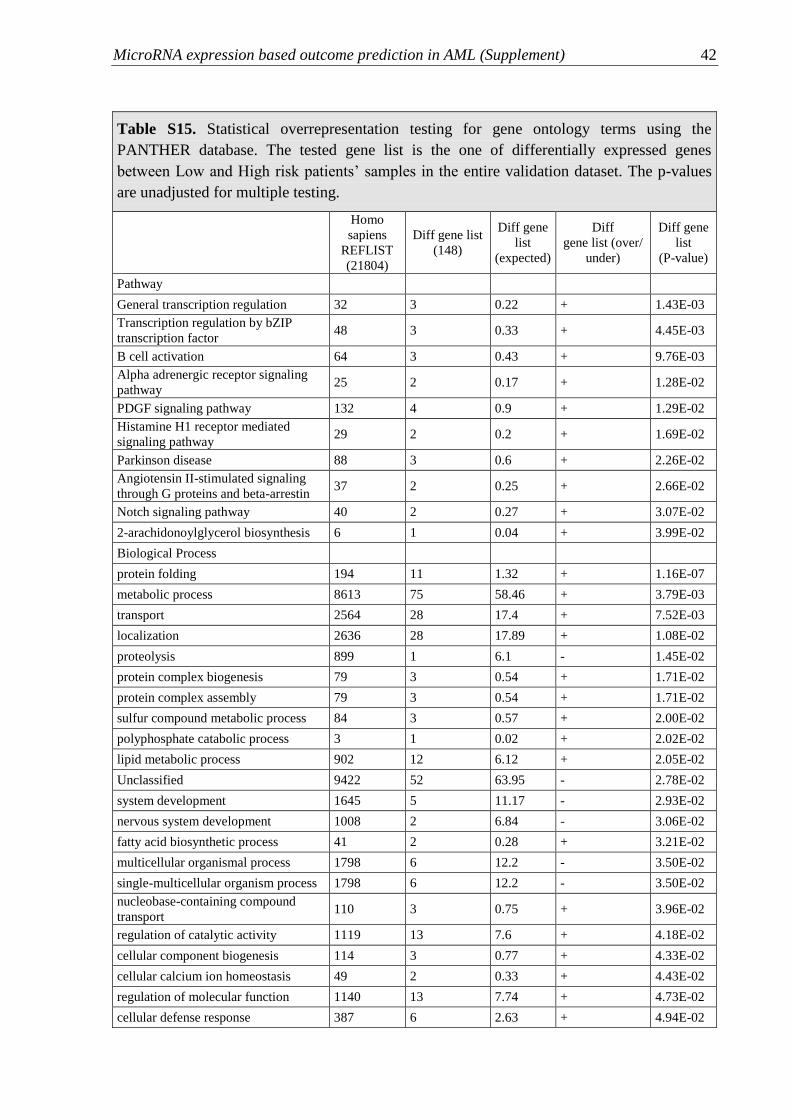
Table S15. Statistical overrepresentation testing for gene ontology terms using the
PANTHER database. The tested gene list is the one of differentially expressed genes
between Low and High risk patients’ samples in the entire validation dataset. The p-values
are unadjusted for multiple testing.
Homo
sapiens
REFLIST
(21804)
Diff gene list
(148)
Diff gene
list
(expected)
Diff
gene list (over/
under)
Diff gene
list
(P-value)
Pathway
General transcription regulation 32 3 0.22 + 1.43E-03
Transcription regulation by bZIP
transcription factor 48 3 0.33 + 4.45E-03
B cell activation 64 3 0.43 + 9.76E-03
Alpha adrenergic receptor signaling
pathway 25 2 0.17 + 1.28E-02
PDGF signaling pathway 132 4 0.9 + 1.29E-02
Histamine H1 receptor mediated
signaling pathway 29 2 0.2 + 1.69E-02
Parkinson disease 88 3 0.6 + 2.26E-02
Angiotensin II-stimulated signaling
through G proteins and beta-arrestin 37 2 0.25 + 2.66E-02
Notch signaling pathway 40 2 0.27 + 3.07E-02
2-arachidonoylglycerol biosynthesis 6 1 0.04 + 3.99E-02
Biological Process
protein folding 194 11 1.32 + 1.16E-07
metabolic process 8613 75 58.46 + 3.79E-03
transport 2564 28 17.4 + 7.52E-03
localization 2636 28 17.89 + 1.08E-02
proteolysis 899 1 6.1 - 1.45E-02
protein complex biogenesis 79 3 0.54 + 1.71E-02
protein complex assembly 79 3 0.54 + 1.71E-02
sulfur compound metabolic process 84 3 0.57 + 2.00E-02
polyphosphate catabolic process 3 1 0.02 + 2.02E-02
lipid metabolic process 902 12 6.12 + 2.05E-02
Unclassified 9422 52 63.95 - 2.78E-02
system development 1645 5 11.17 - 2.93E-02
nervous system development 1008 2 6.84 - 3.06E-02
fatty acid biosynthetic process 41 2 0.28 + 3.21E-02
multicellular organismal process 1798 6 12.2 - 3.50E-02
single-multicellular organism process 1798 6 12.2 - 3.50E-02
nucleobase-containing compound
transport 110 3 0.75 + 3.96E-02
regulation of catalytic activity 1119 13 7.6 + 4.18E-02
cellular component biogenesis 114 3 0.77 + 4.33E-02
cellular calcium ion homeostasis 49 2 0.33 + 4.43E-02
regulation of molecular function 1140 13 7.74 + 4.73E-02
cellular defense response 387 6 2.63 + 4.94E-02

MicroRNA expression based outcome prediction in AML (Supplement) 43
Molecular Function
protein disulfide isomerase activity 16 5 0.11 + 1.08E-07
small GTPase regulator activity 400 11 2.72 + 1.01E-04
isomerase activity 169 6 1.15 + 1.12E-03
lyase activity 209 5 1.42 + 1.45E-02
peroxidase activity 27 2 0.18 + 1.48E-02
protein binding 2855 29 19.38 + 1.67E-02
antioxidant activity 30 2 0.2 + 1.80E-02
anion channel activity 35 2 0.24 + 2.40E-02
guanyl-nucleotide exchange factor
activity 166 4 1.13 + 2.72E-02
transmembrane transporter activity 1076 13 7.3 + 3.21E-02
catalytic activity 5529 48 37.53 + 3.22E-02
enzyme regulator activity 1091 13 7.41 + 3.53E-02
peptidase activity 747 1 5.07 - 3.59E-02
pyrophosphatase activity 271 5 1.84 + 3.83E-02
transporter activity 1145 13 7.77 + 4.86E-02
PANTHER Protein Class
G-protein modulator 487 12 3.31 + 1.36E-04
isomerase 168 6 1.14 + 1.09E-03
Hsp70 family chaperone 17 2 0.12 + 6.13E-03
DNA binding protein 861 1 5.84 - 1.82E-02
Unclassified 9728 53 66.03 - 1.85E-02
anion channel 35 2 0.24 + 2.40E-02
guanyl-nucleotide exchange factor 166 4 1.13 + 2.72E-02
transporter 1069 13 7.26 + 3.07E-02
lyase 183 4 1.24 + 3.69E-02
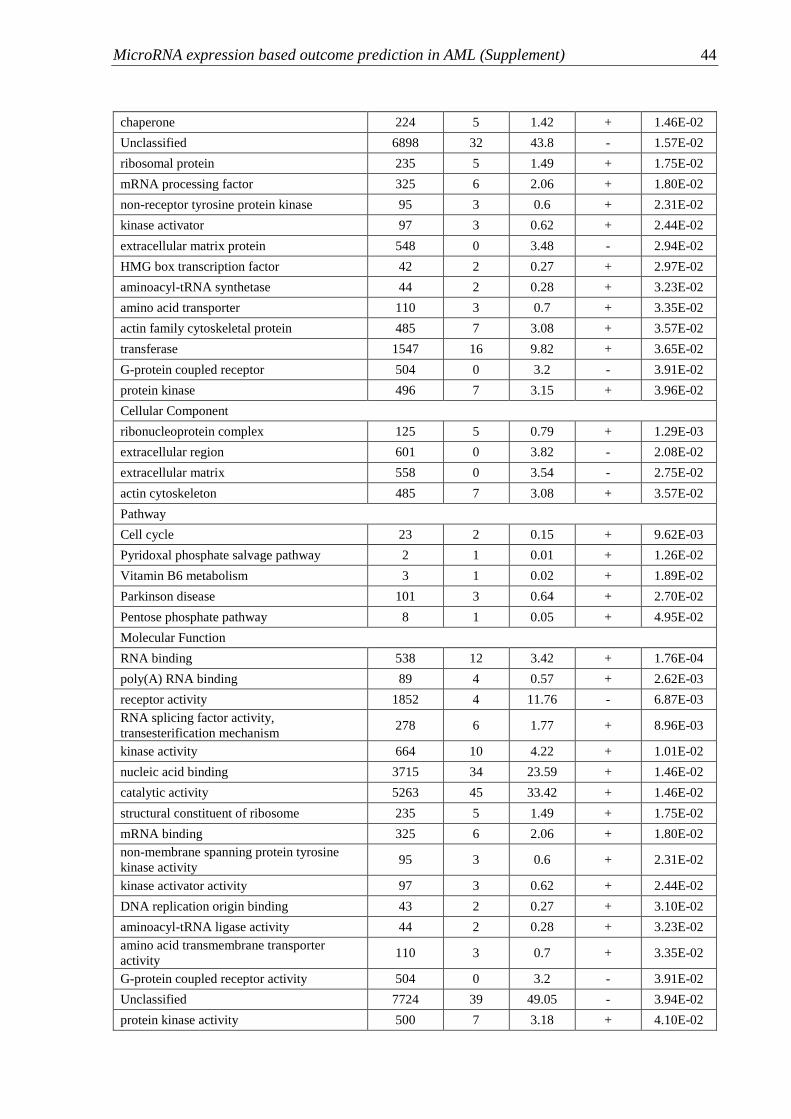
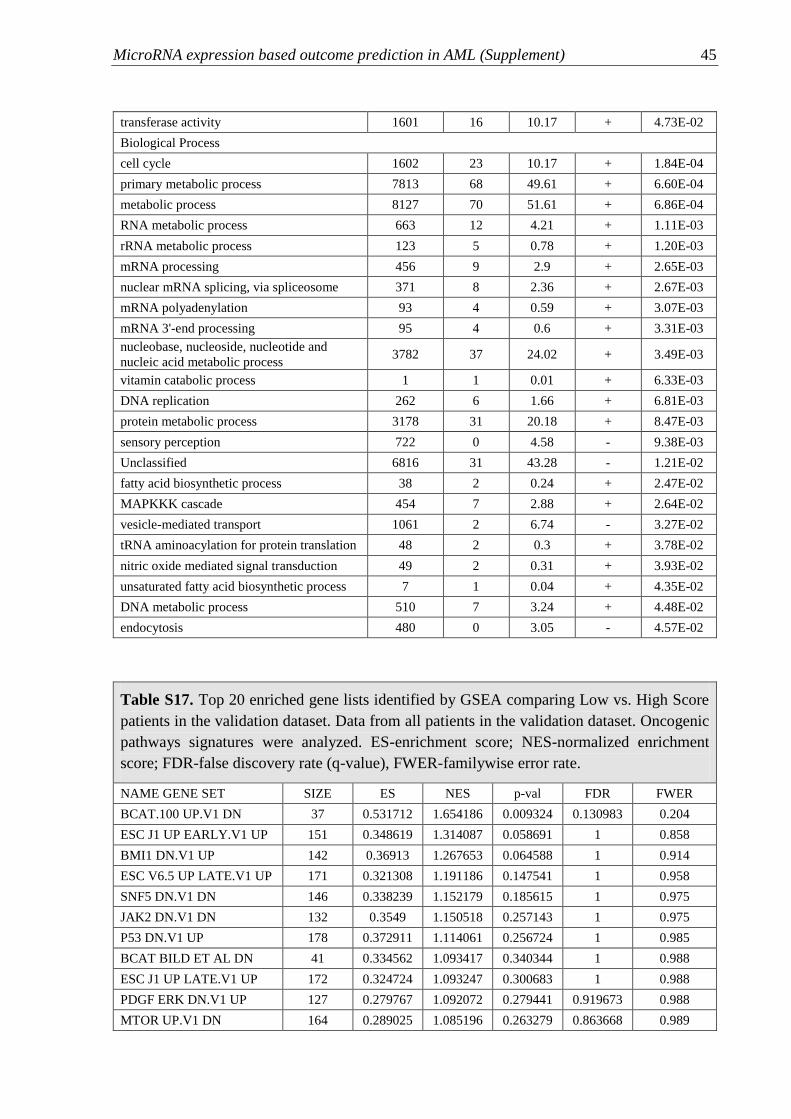
Table S16. Statistical overrepresentation testing for gene ontology terms using the
PANTHER database. The tested gene list is the one of differentially expressed genes
between Low and High risk patients’ samples in the validation dataset including only CN-
AML cases <61 years of age. The p-values are unadjusted for multiple testing.
Homo
sapiens
REFLIST
(20000)
Diff gene
list
(127)
Diff gene
list
(expecte
d)
Diff
gene list
(over/
under)
Diff gene
list
(P-value)
PANTHER Protein Class
chaperonin 28 3 0.18 + 8.04E-04
ribonucleoprotein 125 5 0.79 + 1.29E-03
mRNA polyadenylation factor 89 4 0.57 + 2.62E-03
RNA binding protein 1059 15 6.72 + 3.05E-03
receptor 1838 4 11.67 - 7.35E-03
mRNA splicing factor 278 6 1.77 + 8.96E-03
kinase 660 10 4.19 + 9.68E-03
MicroRNA expression based outcome prediction in AML (Supplement) 44
chaperone 224 5 1.42 + 1.46E-02
Unclassified 6898 32 43.8 - 1.57E-02
ribosomal protein 235 5 1.49 + 1.75E-02
mRNA processing factor 325 6 2.06 + 1.80E-02
non-receptor tyrosine protein kinase 95 3 0.6 + 2.31E-02
kinase activator 97 3 0.62 + 2.44E-02
extracellular matrix protein 548 0 3.48 - 2.94E-02
HMG box transcription factor 42 2 0.27 + 2.97E-02
aminoacyl-tRNA synthetase 44 2 0.28 + 3.23E-02
amino acid transporter 110 3 0.7 + 3.35E-02
actin family cytoskeletal protein 485 7 3.08 + 3.57E-02
transferase 1547 16 9.82 + 3.65E-02
G-protein coupled receptor 504 0 3.2 - 3.91E-02
protein kinase 496 7 3.15 + 3.96E-02
Cellular Component
ribonucleoprotein complex 125 5 0.79 + 1.29E-03
extracellular region 601 0 3.82 - 2.08E-02
extracellular matrix 558 0 3.54 - 2.75E-02
actin cytoskeleton 485 7 3.08 + 3.57E-02
Pathway
Cell cycle 23 2 0.15 + 9.62E-03
Pyridoxal phosphate salvage pathway 2 1 0.01 + 1.26E-02
Vitamin B6 metabolism 3 1 0.02 + 1.89E-02
Parkinson disease 101 3 0.64 + 2.70E-02
Pentose phosphate pathway 8 1 0.05 + 4.95E-02
Molecular Function
RNA binding 538 12 3.42 + 1.76E-04
poly(A) RNA binding 89 4 0.57 + 2.62E-03
receptor activity 1852 4 11.76 - 6.87E-03
RNA splicing factor activity,
transesterification mechanism 278 6 1.77 + 8.96E-03
kinase activity 664 10 4.22 + 1.01E-02
nucleic acid binding 3715 34 23.59 + 1.46E-02
catalytic activity 5263 45 33.42 + 1.46E-02
structural constituent of ribosome 235 5 1.49 + 1.75E-02
mRNA binding 325 6 2.06 + 1.80E-02
non-membrane spanning protein tyrosine
kinase activity 95 3 0.6 + 2.31E-02
kinase activator activity 97 3 0.62 + 2.44E-02
DNA replication origin binding 43 2 0.27 + 3.10E-02
aminoacyl-tRNA ligase activity 44 2 0.28 + 3.23E-02
amino acid transmembrane transporter
activity 110 3 0.7 + 3.35E-02
G-protein coupled receptor activity 504 0 3.2 - 3.91E-02
Unclassified 7724 39 49.05 - 3.94E-02
protein kinase activity 500 7 3.18 + 4.10E-02
MicroRNA expression based outcome prediction in AML (Supplement) 45
transferase activity 1601 16 10.17 + 4.73E-02
Biological Process
cell cycle 1602 23 10.17 + 1.84E-04
primary metabolic process 7813 68 49.61 + 6.60E-04
metabolic process 8127 70 51.61 + 6.86E-04
RNA metabolic process 663 12 4.21 + 1.11E-03
rRNA metabolic process 123 5 0.78 + 1.20E-03
mRNA processing 456 9 2.9 + 2.65E-03
nuclear mRNA splicing, via spliceosome 371 8 2.36 + 2.67E-03
mRNA polyadenylation 93 4 0.59 + 3.07E-03
mRNA 3'-end processing 95 4 0.6 + 3.31E-03
nucleobase, nucleoside, nucleotide and
nucleic acid metabolic process 3782 37 24.02 + 3.49E-03
vitamin catabolic process 1 1 0.01 + 6.33E-03
DNA replication 262 6 1.66 + 6.81E-03
protein metabolic process 3178 31 20.18 + 8.47E-03
sensory perception 722 0 4.58 - 9.38E-03
Unclassified 6816 31 43.28 - 1.21E-02
fatty acid biosynthetic process 38 2 0.24 + 2.47E-02
MAPKKK cascade 454 7 2.88 + 2.64E-02
vesicle-mediated transport 1061 2 6.74 - 3.27E-02
tRNA aminoacylation for protein translation 48 2 0.3 + 3.78E-02
nitric oxide mediated signal transduction 49 2 0.31 + 3.93E-02
unsaturated fatty acid biosynthetic process 7 1 0.04 + 4.35E-02
DNA metabolic process 510 7 3.24 + 4.48E-02
endocytosis 480 0 3.05 - 4.57E-02
Table S17. Top 20 enriched gene lists identified by GSEA comparing Low vs. High Score
patients in the validation dataset. Data from all patients in the validation dataset. Oncogenic
pathways signatures were analyzed. ES-enrichment score; NES-normalized enrichment
score; FDR-false discovery rate (q-value), FWER-familywise error rate.
NAME GENE SET SIZE ES NES p-val FDR FWER
BCAT.100 UP.V1 DN 37 0.531712 1.654186 0.009324 0.130983 0.204
ESC J1 UP EARLY.V1 UP 151 0.348619 1.314087 0.058691 1 0.858
BMI1 DN.V1 UP 142 0.36913 1.267653 0.064588 1 0.914
ESC V6.5 UP LATE.V1 UP 171 0.321308 1.191186 0.147541 1 0.958
SNF5 DN.V1 DN 146 0.338239 1.152179 0.185615 1 0.975
JAK2 DN.V1 DN 132 0.3549 1.150518 0.257143 1 0.975
P53 DN.V1 UP 178 0.372911 1.114061 0.256724 1 0.985
BCAT BILD ET AL DN 41 0.334562 1.093417 0.340344 1 0.988
ESC J1 UP LATE.V1 UP 172 0.324724 1.093247 0.300683 1 0.988
PDGF ERK DN.V1 UP 127 0.279767 1.092072 0.279441 0.919673 0.988
MTOR UP.V1 DN 164 0.289025 1.085196 0.263279 0.863668 0.989
MicroRNA expression based outcome prediction in AML (Supplement) 46
PIGF UP.V1 DN 171 0.314093 1.081415 0.345982 0.805912 0.99
PRC1 BMI UP.V1 DN 162 0.301105 1.080786 0.283019 0.746304 0.99
BCAT GDS748 DN 40 0.362938 1.077304 0.354762 0.704737 0.991
P53 DN.V2 DN 135 0.300739 1.071589 0.274554 0.67526 0.991
CRX NRL DN.V1 DN 111 0.293225 1.068822 0.343049 0.642169 0.991
ESC V6.5 UP LATE.V1 DN 152 0.277008 1.05273 0.356132 0.654048 0.994
CAHOY
OLIGODENDROCUTIC 89 0.293335 1.0467 0.357616 0.6344 0.994
PKCA DN.V1 DN 140 0.293089 1.044589 0.353081 0.606774 0.994
CRX DN.V1 UP 119 0.271124 1.028763 0.397849 0.61998 0.996
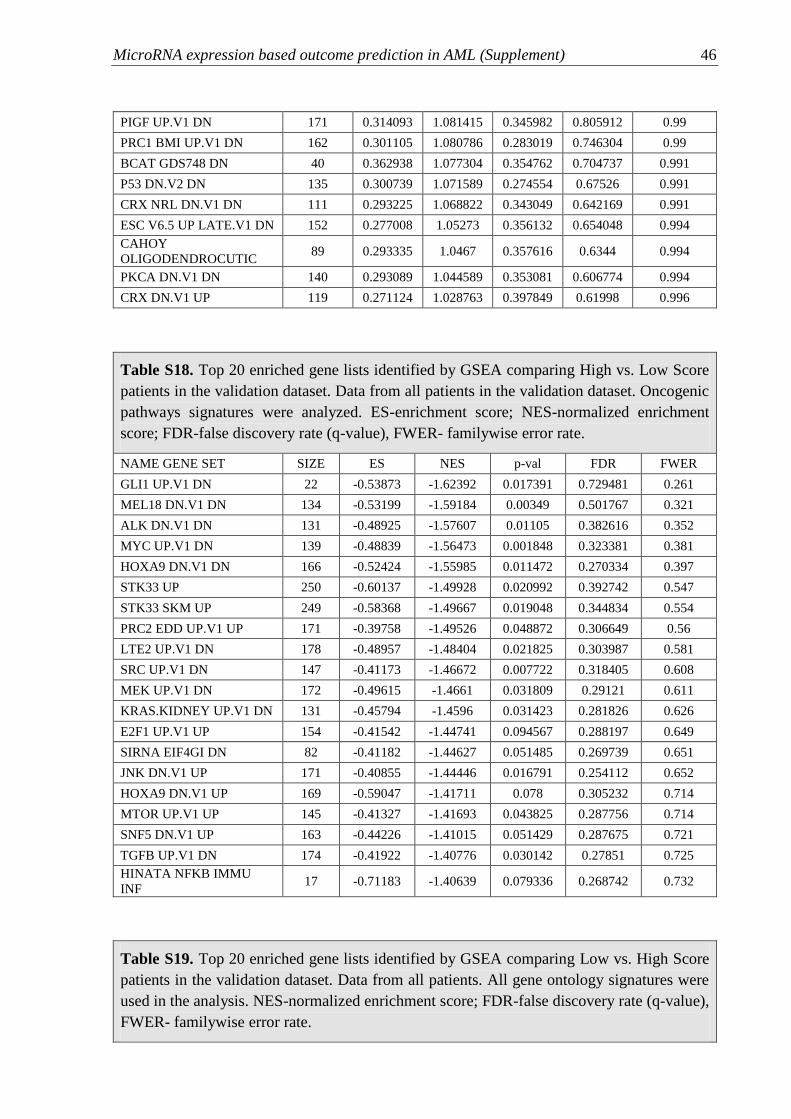
Table S18. Top 20 enriched gene lists identified by GSEA comparing High vs. Low Score
patients in the validation dataset. Data from all patients in the validation dataset. Oncogenic
pathways signatures were analyzed. ES-enrichment score; NES-normalized enrichment
score; FDR-false discovery rate (q-value), FWER- familywise error rate.
NAME GENE SET SIZE ES NES p-val FDR FWER
GLI1 UP.V1 DN 22 -0.53873 -1.62392 0.017391 0.729481 0.261
MEL18 DN.V1 DN 134 -0.53199 -1.59184 0.00349 0.501767 0.321
ALK DN.V1 DN 131 -0.48925 -1.57607 0.01105 0.382616 0.352
MYC UP.V1 DN 139 -0.48839 -1.56473 0.001848 0.323381 0.381
HOXA9 DN.V1 DN 166 -0.52424 -1.55985 0.011472 0.270334 0.397
STK33 UP 250 -0.60137 -1.49928 0.020992 0.392742 0.547
STK33 SKM UP 249 -0.58368 -1.49667 0.019048 0.344834 0.554
PRC2 EDD UP.V1 UP 171 -0.39758 -1.49526 0.048872 0.306649 0.56
LTE2 UP.V1 DN 178 -0.48957 -1.48404 0.021825 0.303987 0.581
SRC UP.V1 DN 147 -0.41173 -1.46672 0.007722 0.318405 0.608
MEK UP.V1 DN 172 -0.49615 -1.4661 0.031809 0.29121 0.611
KRAS.KIDNEY UP.V1 DN 131 -0.45794 -1.4596 0.031423 0.281826 0.626
E2F1 UP.V1 UP 154 -0.41542 -1.44741 0.094567 0.288197 0.649
SIRNA EIF4GI DN 82 -0.41182 -1.44627 0.051485 0.269739 0.651
JNK DN.V1 UP 171 -0.40855 -1.44446 0.016791 0.254112 0.652
HOXA9 DN.V1 UP 169 -0.59047 -1.41711 0.078 0.305232 0.714
MTOR UP.V1 UP 145 -0.41327 -1.41693 0.043825 0.287756 0.714
SNF5 DN.V1 UP 163 -0.44226 -1.41015 0.051429 0.287675 0.721
TGFB UP.V1 DN 174 -0.41922 -1.40776 0.030142 0.27851 0.725
HINATA NFKB IMMU
INF 17 -0.71183 -1.40639 0.079336 0.268742 0.732
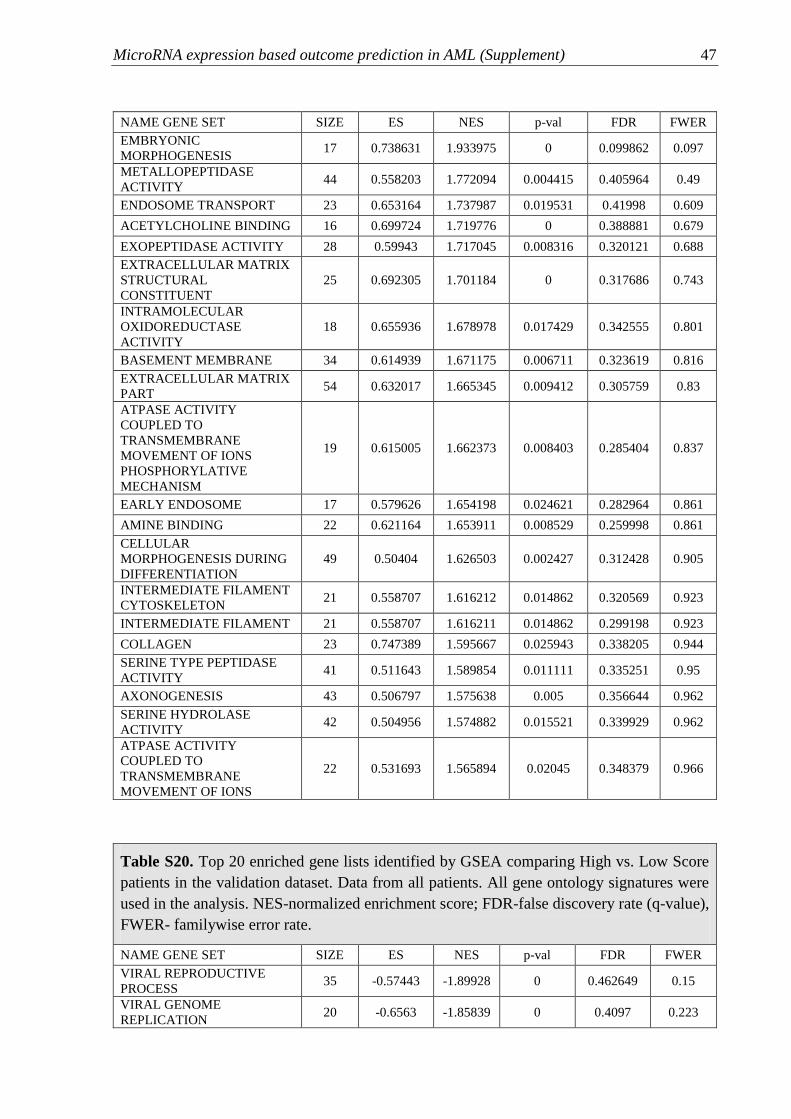
Table S19. Top 20 enriched gene lists identified by GSEA comparing Low vs. High Score
patients in the validation dataset. Data from all patients. All gene ontology signatures were
used in the analysis. NES-normalized enrichment score; FDR-false discovery rate (q-value),
FWER- familywise error rate.
MicroRNA expression based outcome prediction in AML (Supplement) 47
NAME GENE SET SIZE ES NES p-val FDR FWER
EMBRYONIC
MORPHOGENESIS 17 0.738631 1.933975 0 0.099862 0.097
METALLOPEPTIDASE
ACTIVITY 44 0.558203 1.772094 0.004415 0.405964 0.49
ENDOSOME TRANSPORT 23 0.653164 1.737987 0.019531 0.41998 0.609
ACETYLCHOLINE BINDING 16 0.699724 1.719776 0 0.388881 0.679
EXOPEPTIDASE ACTIVITY 28 0.59943 1.717045 0.008316 0.320121 0.688
EXTRACELLULAR MATRIX
STRUCTURAL
CONSTITUENT
25 0.692305 1.701184 0 0.317686 0.743
INTRAMOLECULAR
OXIDOREDUCTASE
ACTIVITY
18 0.655936 1.678978 0.017429 0.342555 0.801
BASEMENT MEMBRANE 34 0.614939 1.671175 0.006711 0.323619 0.816
EXTRACELLULAR MATRIX
PART 54 0.632017 1.665345 0.009412 0.305759 0.83
ATPASE ACTIVITY
COUPLED TO
TRANSMEMBRANE
MOVEMENT OF IONS
PHOSPHORYLATIVE
MECHANISM
19 0.615005 1.662373 0.008403 0.285404 0.837
EARLY ENDOSOME 17 0.579626 1.654198 0.024621 0.282964 0.861
AMINE BINDING 22 0.621164 1.653911 0.008529 0.259998 0.861
CELLULAR
MORPHOGENESIS DURING
DIFFERENTIATION
49 0.50404 1.626503 0.002427 0.312428 0.905
INTERMEDIATE FILAMENT
CYTOSKELETON 21 0.558707 1.616212 0.014862 0.320569 0.923
INTERMEDIATE FILAMENT 21 0.558707 1.616211 0.014862 0.299198 0.923
COLLAGEN 23 0.747389 1.595667 0.025943 0.338205 0.944
SERINE TYPE PEPTIDASE
ACTIVITY 41 0.511643 1.589854 0.011111 0.335251 0.95
AXONOGENESIS 43 0.506797 1.575638 0.005 0.356644 0.962
SERINE HYDROLASE
ACTIVITY 42 0.504956 1.574882 0.015521 0.339929 0.962
ATPASE ACTIVITY
COUPLED TO
TRANSMEMBRANE
MOVEMENT OF IONS
22 0.531693 1.565894 0.02045 0.348379 0.966
Table S20. Top 20 enriched gene lists identified by GSEA comparing High vs. Low Score
patients in the validation dataset. Data from all patients. All gene ontology signatures were
used in the analysis. NES-normalized enrichment score; FDR-false discovery rate (q-value),
FWER- familywise error rate.
NAME GENE SET SIZE ES NES p-val FDR FWER
VIRAL REPRODUCTIVE
PROCESS 35 -0.57443 -1.89928 0 0.462649 0.15
VIRAL GENOME
REPLICATION 20 -0.6563 -1.85839 0 0.4097 0.223

MicroRNA expression based outcome prediction in AML (Supplement) 48
VIRAL INFECTIOUS CYCLE 31 -0.55503 -1.82549 0.001984 0.4117 0.301
REGULATION OF JNK
ACTIVITY 20 -0.68939 -1.77204 0.003899 0.598964 0.448
TRANSLATION 154 -0.39181 -1.76046 0 0.546608 0.481
IMMUNE EFFECTOR
PROCESS 37 -0.62989 -1.75297 0.001825 0.49277 0.498
DOUBLE STRANDED RNA
BINDING 16 -0.68154 -1.74748 0.009634 0.446529 0.514
POSITIVE REGULATION OF
JNK ACTIVITY 18 -0.70717 -1.73399 0.003953 0.446997 0.557
SENSORY PERCEPTION OF
CHEMICAL STIMULUS 16 -0.68807 -1.72405 0.001859 0.439978 0.591
REGULATION OF RAS
PROTEIN SIGNAL
TRANSDUCTION
17 -0.72079 -1.71808 0.00381 0.419031 0.608
RESPONSE TO VIRUS 47 -0.62093 -1.71187 0.00365 0.403924 0.629
REGULATION OF DEFENSE
RESPONSE 18 -0.73872 -1.70735 0.001969 0.388848 0.644
RESPONSE TO ORGANIC
SUBSTANCE 28 -0.56564 -1.69952 0.013944 0.383828 0.662
RESPONSE TO WOUNDING 173 -0.58322 -1.69752 0.005495 0.364243 0.669
REGULATION OF SMALL
GTPASE MEDIATED
SIGNAL TRANSDUCTION
21 -0.667 -1.69528 0.003781 0.346916 0.674
CELL PROJECTION
BIOGENESIS 23 -0.63204 -1.69433 0.00996 0.32762 0.675
REGULATION OF SIGNAL
TRANSDUCTION 200 -0.46633 -1.68949 0.005758 0.322812 0.689
VIRAL REPRODUCTION 40 -0.47741 -1.68741 0.002049 0.31131 0.694
INFLAMMATORY
RESPONSE 115 -0.61775 -1.6747 0.005629 0.333534 0.735
MICROTUBULE BASED
MOVEMENT 16 -0.55829 -1.6734 0.017647 0.320388 0.74
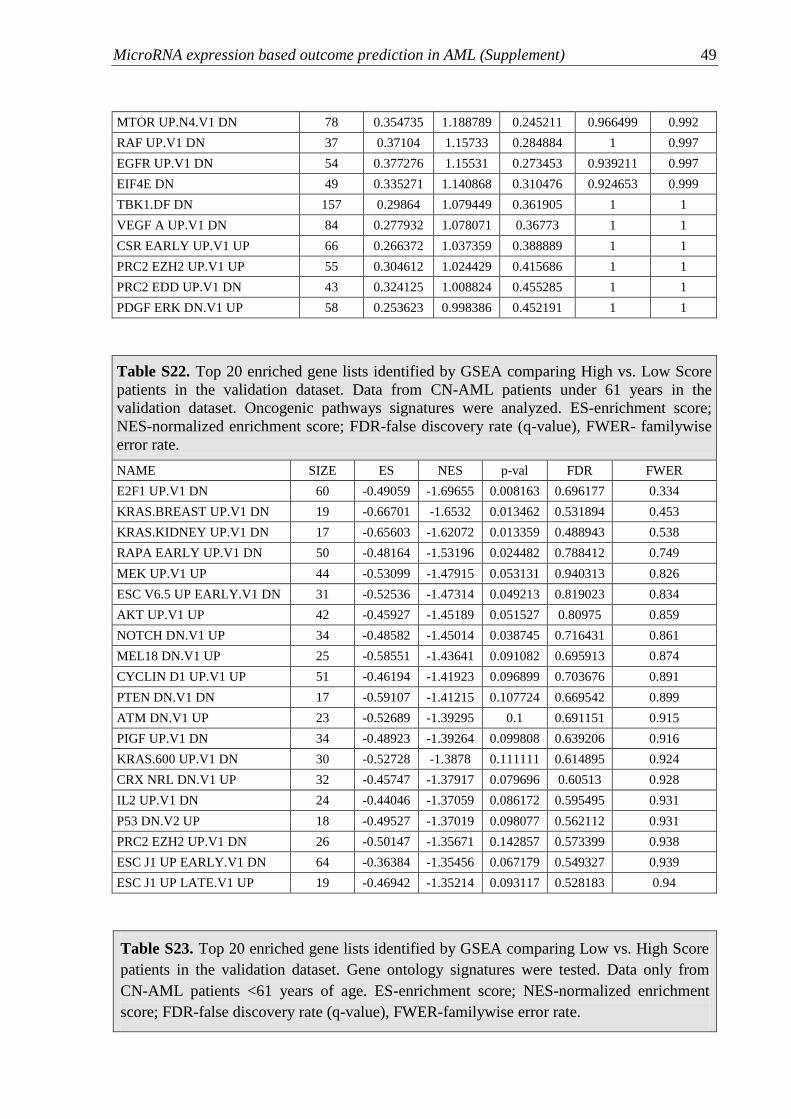
Table S21. Top 20 enriched gene lists identified by GSEA comparing Low vs. High Score
patients in the validation dataset. Data from CN-AML patients under 61 years in the
validation dataset. Oncogenic pathways signatures were analyzed. ES-enrichment score;
NES-normalized enrichment score; FDR-false discovery rate (q-value), FWER- familywise
error rate.
NAME SIZE ES NES NOM FDR FWER
GCNP SHH UP LATE.V1 UP 88 0.389021 1.395961 0.074 1 0.919
GCNP SHH UP EARLY.V1 UP 81 0.357089 1.389002 0.093069 1 0.928
ERB2 UP.V1 DN 74 0.485871 1.373032 0.138943 1 0.934
PIGF UP.V1 UP 96 0.400453 1.365455 0.18618 1 0.942
CAHOY
OLIGODENDROCUTIC 19 0.43277 1.353207 0.087318 0.929165 0.946
TBK1.DN.48HRS DN 20 0.419822 1.309505 0.121704 0.98995 0.968
JAK2 DN.V1 DN 58 0.443678 1.293639 0.159309 0.924756 0.975
MEK UP.V1 DN 64 0.416323 1.267586 0.214844 0.926577 0.983
BCAT BILD ET AL DN 24 0.413627 1.205744 0.278846 1 0.99
DCA UP.V1 DN 47 0.425082 1.204118 0.22619 0.996961 0.99
MicroRNA expression based outcome prediction in AML (Supplement) 49
MTOR UP.N4.V1 DN 78 0.354735 1.188789 0.245211 0.966499 0.992
RAF UP.V1 DN 37 0.37104 1.15733 0.284884 1 0.997
EGFR UP.V1 DN 54 0.377276 1.15531 0.273453 0.939211 0.997
EIF4E DN 49 0.335271 1.140868 0.310476 0.924653 0.999
TBK1.DF DN 157 0.29864 1.079449 0.361905 1 1
VEGF A UP.V1 DN 84 0.277932 1.078071 0.36773 1 1
CSR EARLY UP.V1 UP 66 0.266372 1.037359 0.388889 1 1
PRC2 EZH2 UP.V1 UP 55 0.304612 1.024429 0.415686 1 1
PRC2 EDD UP.V1 DN 43 0.324125 1.008824 0.455285 1 1
PDGF ERK DN.V1 UP 58 0.253623 0.998386 0.452191 1 1
Table S22. Top 20 enriched gene lists identified by GSEA comparing High vs. Low Score
patients in the validation dataset. Data from CN-AML patients under 61 years in the
validation dataset. Oncogenic pathways signatures were analyzed. ES-enrichment score;
NES-normalized enrichment score; FDR-false discovery rate (q-value), FWER- familywise
error rate.
NAME SIZE ES NES p-val FDR FWER
E2F1 UP.V1 DN 60 -0.49059 -1.69655 0.008163 0.696177 0.334
KRAS.BREAST UP.V1 DN 19 -0.66701 -1.6532 0.013462 0.531894 0.453
KRAS.KIDNEY UP.V1 DN 17 -0.65603 -1.62072 0.013359 0.488943 0.538
RAPA EARLY UP.V1 DN 50 -0.48164 -1.53196 0.024482 0.788412 0.749
MEK UP.V1 UP 44 -0.53099 -1.47915 0.053131 0.940313 0.826
ESC V6.5 UP EARLY.V1 DN 31 -0.52536 -1.47314 0.049213 0.819023 0.834
AKT UP.V1 UP 42 -0.45927 -1.45189 0.051527 0.80975 0.859
NOTCH DN.V1 UP 34 -0.48582 -1.45014 0.038745 0.716431 0.861
MEL18 DN.V1 UP 25 -0.58551 -1.43641 0.091082 0.695913 0.874
CYCLIN D1 UP.V1 UP 51 -0.46194 -1.41923 0.096899 0.703676 0.891
PTEN DN.V1 DN 17 -0.59107 -1.41215 0.107724 0.669542 0.899
ATM DN.V1 UP 23 -0.52689 -1.39295 0.1 0.691151 0.915
PIGF UP.V1 DN 34 -0.48923 -1.39264 0.099808 0.639206 0.916
KRAS.600 UP.V1 DN 30 -0.52728 -1.3878 0.111111 0.614895 0.924
CRX NRL DN.V1 UP 32 -0.45747 -1.37917 0.079696 0.60513 0.928
IL2 UP.V1 DN 24 -0.44046 -1.37059 0.086172 0.595495 0.931
P53 DN.V2 UP 18 -0.49527 -1.37019 0.098077 0.562112 0.931
PRC2 EZH2 UP.V1 DN 26 -0.50147 -1.35671 0.142857 0.573399 0.938
ESC J1 UP EARLY.V1 DN 64 -0.36384 -1.35456 0.067179 0.549327 0.939
ESC J1 UP LATE.V1 UP 19 -0.46942 -1.35214 0.093117 0.528183 0.94
Table S23. Top 20 enriched gene lists identified by GSEA comparing Low vs. High Score
patients in the validation dataset. Gene ontology signatures were tested. Data only from
CN-AML patients <61 years of age. ES-enrichment score; NES-normalized enrichment
score; FDR-false discovery rate (q-value), FWER-familywise error rate.

MicroRNA expression based outcome prediction in AML (Supplement) 50
NAME GENE SET SIZE ES NES p-val FDR FWER
RNA SPLICING 55 0.566 1.859 0.004 0.287 0.174
MRNA PROCESSING GO 0006397 46 0.579 1.809 0.002 0.267 0.288
RNA PROCESSING 103 0.498 1.799 0.002 0.197 0.309
MRNA METABOLIC PROCESS 53 0.561 1.796 0.000 0.152 0.314
PROTEIN RNA COMPLEX
ASSEMBLY 39 0.538 1.775 0.010 0.157 0.369
RIBONUCLEOPROTEIN COMPLEX
BIOGENESIS
AND ASSEMBLY
50 0.513 1.743 0.014 0.185 0.453
RNA SPLICINGVIA
TRANSESTERIFICATION
REACTIONS
23 0.600 1.725 0.017 0.189 0.503
TRANSLATION REGULATOR
ACTIVITY 19 0.559 1.687 0.013 0.236 0.591
TRANSLATIONAL INITIATION 19 0.550 1.670 0.035 0.246 0.636
RNA BINDING 123 0.438 1.655 0.010 0.256 0.677
TRANSLATION FACTOR ACTIVITY
NUCLEIC
ACID BINDING
18 0.553 1.635 0.025 0.276 0.709
HELICASE ACTIVITY 26 0.551 1.602 0.065 0.337 0.774
DNA DEPENDENT DNA
REPLICATION 30 0.573 1.565 0.078 0.417 0.832
RNA METABOLIC PROCESS 415 0.352 1.538 0.008 0.473 0.866
SPLICEOSOME 29 0.471 1.537 0.070 0.446 0.868
DNA REPLICATION 57 0.504 1.521 0.091 0.467 0.890
MICROTUBULE BINDING 17 0.515 1.514 0.048 0.464 0.894
REGULATION OF TRANSLATIONAL
INITIATION 15 0.524 1.492 0.097 0.509 0.916
RIBONUCLEOPROTEIN COMPLEX 78 0.410 1.485 0.083 0.502 0.920
ONE CARBON COMPOUND
METABOLIC PROCESS 17 0.495 1.471 0.097 0.529 0.931
Table S24. Top 20 enriched gene lists identified by GSEA comparing High vs. Low Score
patients in the validation dataset. Data only from CN-AML patients <61 years of age. Gene
ontology signatures were tested. ES-enrichment score; NES-normalized enrichment score;
FDR-false discovery rate (q-value), FWER-familywise error rate.
NAME GENE SET SIZE ES NES p-val FDR FWER
ACTIVE TRANSMEMBRANE
TRANSPORTER ACTIVITY 33 -0.50482 -1.71966 0.006186 1 0.507
SUBSTRATE SPECIFIC
TRANSPORTER ACTIVITY 82 -0.4715 -1.66382 0.012632 1 0.646
RECEPTOR SIGNALING
PROTEIN ACTIVITY 31 -0.55097 -1.65845 0.02 0.976944 0.66
INTRINSIC TO PLASMA
MEMBRANE 157 -0.43399 -1.60681 0 1 0.762
INTEGRAL TO PLASMA
MEMBRANE 157 -0.43399 -1.60681 0 0.937743 0.762
PLASMA MEMBRANE PART 200 -0.42923 -1.60264 0.008493 0.813661 0.77
TRANSMEMBRANE 73 -0.44029 -1.60049 0.023061 0.71084 0.776
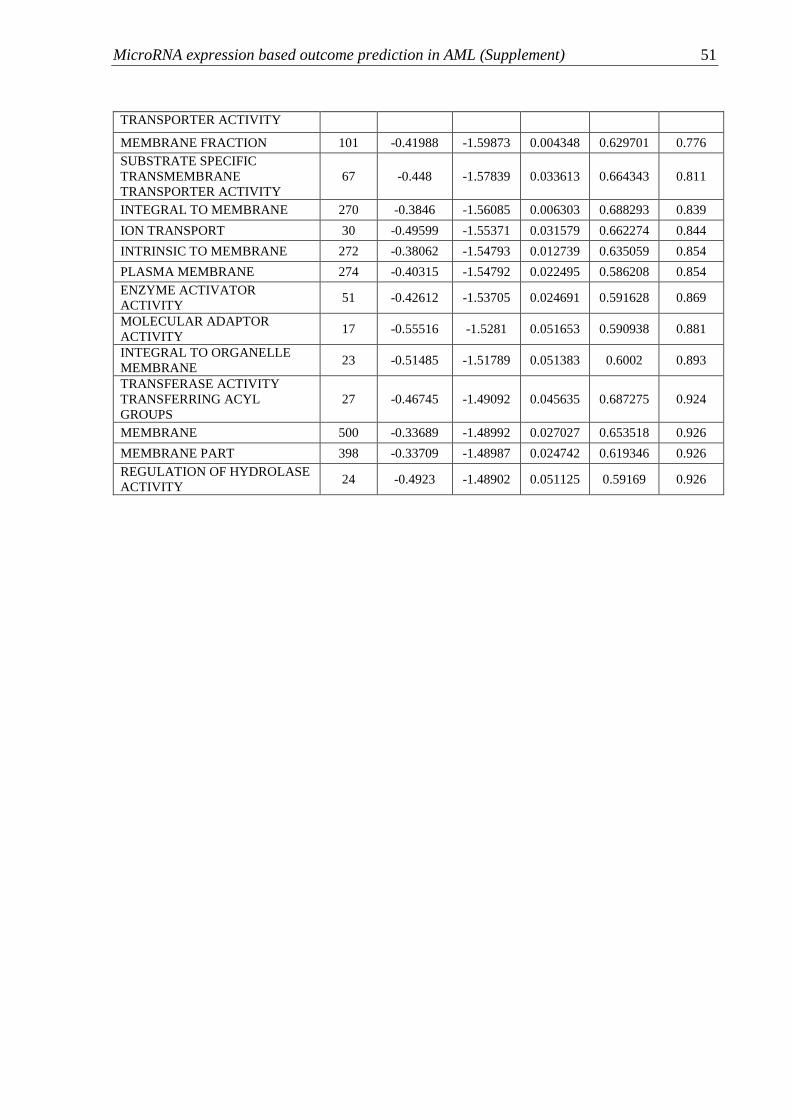
MicroRNA expression based outcome prediction in AML (Supplement) 51
TRANSPORTER ACTIVITY
MEMBRANE FRACTION 101 -0.41988 -1.59873 0.004348 0.629701 0.776
SUBSTRATE SPECIFIC
TRANSMEMBRANE
TRANSPORTER ACTIVITY
67 -0.448 -1.57839 0.033613 0.664343 0.811
INTEGRAL TO MEMBRANE 270 -0.3846 -1.56085 0.006303 0.688293 0.839
ION TRANSPORT 30 -0.49599 -1.55371 0.031579 0.662274 0.844
INTRINSIC TO MEMBRANE 272 -0.38062 -1.54793 0.012739 0.635059 0.854
PLASMA MEMBRANE 274 -0.40315 -1.54792 0.022495 0.586208 0.854
ENZYME ACTIVATOR
ACTIVITY 51 -0.42612 -1.53705 0.024691 0.591628 0.869
MOLECULAR ADAPTOR
ACTIVITY 17 -0.55516 -1.5281 0.051653 0.590938 0.881
INTEGRAL TO ORGANELLE
MEMBRANE 23 -0.51485 -1.51789 0.051383 0.6002 0.893
TRANSFERASE ACTIVITY
TRANSFERRING ACYL
GROUPS
27 -0.46745 -1.49092 0.045635 0.687275 0.924
MEMBRANE 500 -0.33689 -1.48992 0.027027 0.653518 0.926
MEMBRANE PART 398 -0.33709 -1.48987 0.024742 0.619346 0.926
REGULATION OF HYDROLASE
ACTIVITY 24 -0.4923 -1.48902 0.051125 0.59169 0.926
MicroRNA expression based outcome prediction in AML (Supplement) 52
Supplementary Bibliography
1. Russ AC, Sander S, Luck SC, et al. Integrative nucleophosmin mutation-associated
microRNA and gene expression pattern analysis identifies novel microRNA - target gene interactions
in acute myeloid leukemia. Haematologica. 2011;96(12):1783-1791.
2. Schlenk RF, Benner A, Krauter J, et al. Individual patient data-based meta-analysis of patients
aged 16 to 60 years with core binding factor acute myeloid leukemia: a survey of the German Acute
Myeloid Leukemia Intergroup. J Clin Oncol. 2004;22(18):3741-3750.
3. Schaich M, Schlenk RF, Al-Ali HK, et al. Prognosis of acute myeloid leukemia patients up to
60 years of age exhibiting trisomy 8 within a non-complex karyotype: individual patient data-based
meta-analysis of the German Acute Myeloid Leukemia Intergroup. Haematologica. 2007;92(6):763-
770.
4. Frohling S, Schlenk RF, Breitruck J, et al. Prognostic significance of activating FLT3
mutations in younger adults (16 to 60 years) with acute myeloid leukemia and normal cytogenetics: a
study of the AML Study Group Ulm. Blood. 2002;100(13):4372-4380.
5. Frohling S, Skelin S, Liebisch C, et al. Comparison of cytogenetic and molecular cytogenetic
detection of chromosome abnormalities in 240 consecutive adult patients with acute myeloid
leukemia. J Clin Oncol. 2002;20(10):2480-2485.
6. Frohling S, Schlenk RF, Stolze I, et al. CEBPA mutations in younger adults with acute
myeloid leukemia and normal cytogenetics: prognostic relevance and analysis of cooperating
mutations. J Clin Oncol. 2004;22(4):624-633.
7. Dohner K, Schlenk RF, Habdank M, et al. Mutant nucleophosmin (NPM1) predicts favorable
prognosis in younger adults with acute myeloid leukemia and normal cytogenetics: interaction with
other gene mutations. Blood. 2005;106(12):3740-3746.
8. Johnson SM, Grosshans H, Shingara J, et al. RAS is regulated by the let-7 microRNA family.
Cell. 2005;120(5):635-647.
9. Martinez I, Gardiner AS, Board KF, Monzon FA, Edwards RP, Khan SA. Human
papillomavirus type 16 reduces the expression of microRNA-218 in cervical carcinoma cells.
Oncogene. 2008;27(18):2575-2582.
10. Shingara J, Keiger K, Shelton J, et al. An optimized isolation and labeling platform for
accurate microRNA expression profiling. RNA. 2005;11(9):1461-1470.
11. Bullinger L, Dohner K, Bair E, et al. Use of gene-expression profiling to identify prognostic
subclasses in adult acute myeloid leukemia. N Engl J Med. 2004;350(16):1605-1616.
12. Cho HJ, Yu A, Kim S, Kang J, Hong SM. Robust likelihood-based survival modeling with
microarray data. Journal of Statistical Software. 2009;29(1):
13. Budczies J, Klauschen F, Sinn BV, et al. Cutoff Finder: a comprehensive and straightforward
Web application enabling rapid biomarker cutoff optimization. PLoS One. 2012;7(12):e51862.
14. Mi H, Muruganujan A, Casagrande JT, Thomas PD. Large-scale gene function analysis with
the PANTHER classification system. Nat Protoc. 2013;8(8):1551-1566.
15. Wang J, Duncan D, Shi Z, Zhang B. WEB-based GEne SeT AnaLysis Toolkit (WebGestalt):
update 2013. Nucleic Acids Res. 2013;41(Web Server issue):W77-83.
16. Subramanian A, Tamayo P, Mootha VK, et al. Gene set enrichment analysis: a knowledge-
based approach for interpreting genome-wide expression profiles. Proc Natl Acad Sci U S A.
2005;102(43):15545-15550.
17. Kutmon M, Kelder T, Mandaviya P, Evelo CT, Coort SL. CyTargetLinker: a cytoscape app to
integrate regulatory interactions in network analysis. PLoS One. 2013;8(12):e82160.
18. Shannon P, Markiel A, Ozier O, et al. Cytoscape: a software environment for integrated
models of biomolecular interaction networks. Genome Res. 2003;13(11):2498-2504.
19. Maere S, Heymans K, Kuiper M. BiNGO: a Cytoscape plugin to assess overrepresentation of
gene ontology categories in biological networks. Bioinformatics. 2005;21(16):3448-3449.


