
MEANINGFULLY DIFFERENT BRANDS
Charles Foster – Millward Brown MEAPraveen Abraham – Millward Brown Egypt

is the set of associations
(ideas, memories and
feelings) in the mind of a
consumer.
What is
a brand?KNOWLEDGE
Facts about the brand
(an understanding of what
it is, what it’s called,
what it looks like)
EMOTIONFeelings,
social values,
desirability
EXPERIENCEWhat the brand experience
is/would be like
(its benefits, how it is
used or found)

Meaningfully different brands,
properly amplified, create sustainable
financial value growth.
W E K N O W T H A T … .

Salient
DifferentMeaningful
The five key inputs…
Meets Needs
Affinity
Unique
Dynamic
Awareness Intensity
The MDS approach has inputs which short, quick, & easier to administer Please drag each brand onto the scale to indicate how different they seem to others in the market. You can place more than one brand in each box or leave a box empty. Please place all brands on the scale before continuing.This type of questioning improved the model fit by 16%
Further development work through BrandZ:
>40 countries, >50,00 brands, >800,000 consumers
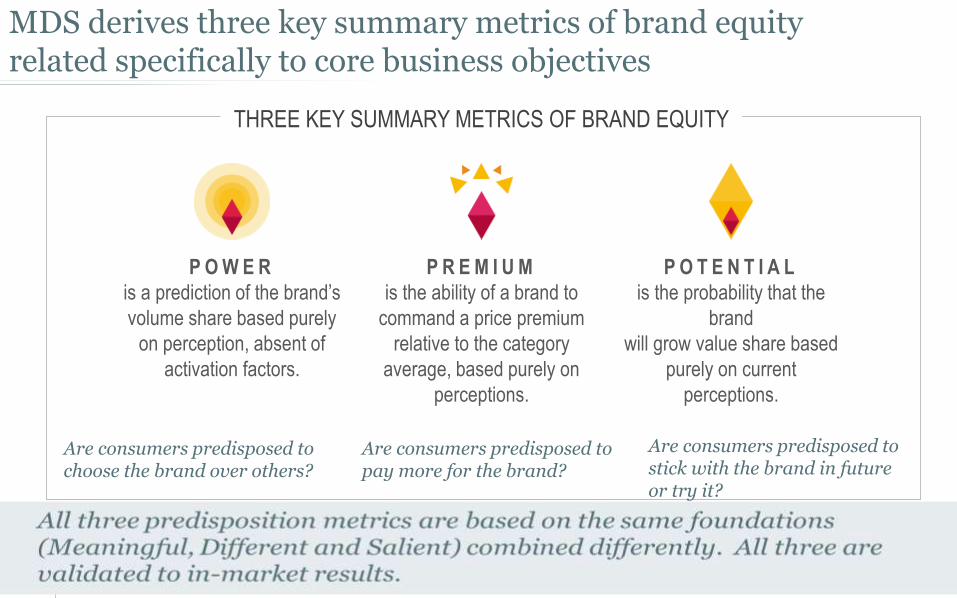
MDS derives three key summary metrics of brand equity related specifically to core business objectives
P O W E R
is a prediction of the brand’s
volume share based purely
on perception, absent of
activation factors.
P R E M I U M
is the ability of a brand to
command a price premium
relative to the category
average, based purely on
perceptions.
P O T E N T I A L
is the probability that the
brand
will grow value share based
purely on current
perceptions.
THREE KEY SUMMARY METRICS OF BRAND EQUITY
Are consumers predisposed to choose the brand over others?
Are consumers predisposed to pay more for the brand?
Are consumers predisposed to stick with the brand in future or try it?

Meaningfully different brands…
7
E A C H O F T H E S E M E T R I C S A R E C R E A T E D F R O M M E A S U R E S O F H O W M E A N I N G F U L , D I F F E R E N T A N D S A L I E N T B R A N D S A R E .
… Have much greater
POTENTIAL to gain
value share in the future
… Can command a
price PREMIUM
… Have the POWER
to capture significantly
MORE VOLUME
POWER
PREMIUM
POTENTIAL

Apple: unique personality and tangible product innovation = differentiation
worth paying for
137 248 131
137 158 272
Avr = 100
$147b
MEANINGFUL DIFFERENT SALIENT
Avr = 100
Coca-Cola: first to mind for billions of thirsty people = dominant volume share
for impulse category
$80b

10
Great metrics, derived from simple, short
questionnaires, need smart data
capturing techniques

Mobile interviewing is the fastest growing methodology in the world, because…
11
Consumers busier
Less accessible housing
Poorer quality ‘traditional’ data
Demand for faster feedback

Why consider mobile surveys?
12
ACTUALLY THE REAL QUESTION SHOULD BE WHY NOT?
1.91 BILLION
37% GROWTH
15% OF WEB
smartphones users by the end of 2015
– overtaking laptops and PCs*
in the number of global 3G subscribers in the past year**
traffic comes via mobile – more than double last year;
Mobile traffic share already over 50% in India and China***
*Source: e.Marketer Global report June 2014 **Source: Informa WCIS;
***Source: StatCounter Global Stats, 9/12

Mobile Internet
13

Mobile Internet
14

Egypt smartphone growth…
15SOURCE : e-marketer Dec 2014
18.2 million users in 2015
Among top 10 on growth rate

16
KEY INSIGHTS WE HAVE SEEN FROM MOBILE DATA
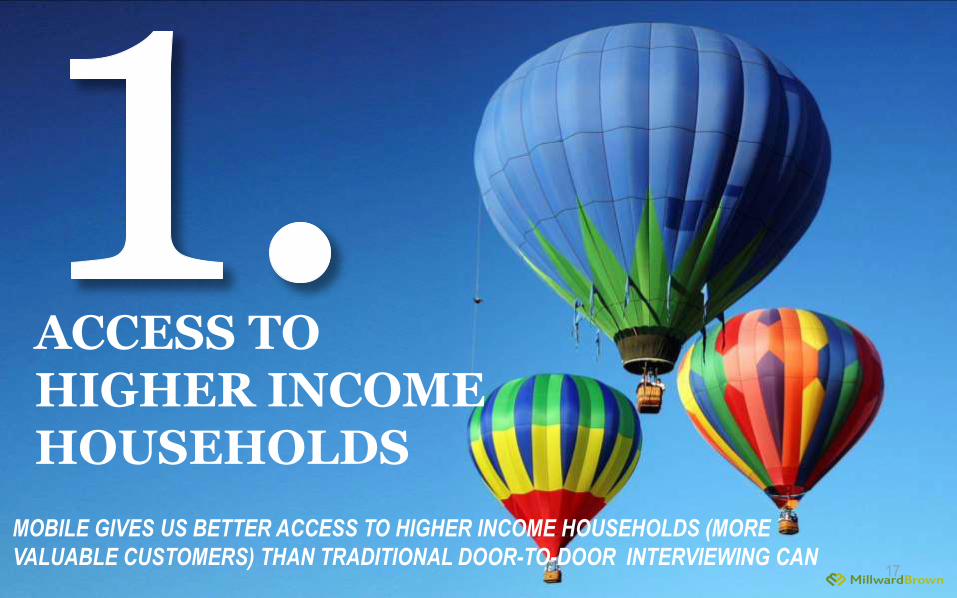
17
ACCESS TO HIGHER INCOME HOUSEHOLDS
MOBILE GIVES US BETTER ACCESS TO HIGHER INCOME HOUSEHOLDS (MORE
VALUABLE CUSTOMERS) THAN TRADITIONAL DOOR-TO-DOOR INTERVIEWING CAN

18
MOBILE DATA MATCHES UP TO MARKET SHARE
OVER TIME, MOBILE DATA MATCHES UP TO MARKET REALITY EVEN MORE DUE TO
THE ABILITY TO COVER WIDER GEOGRAPHIES NATIONALLY
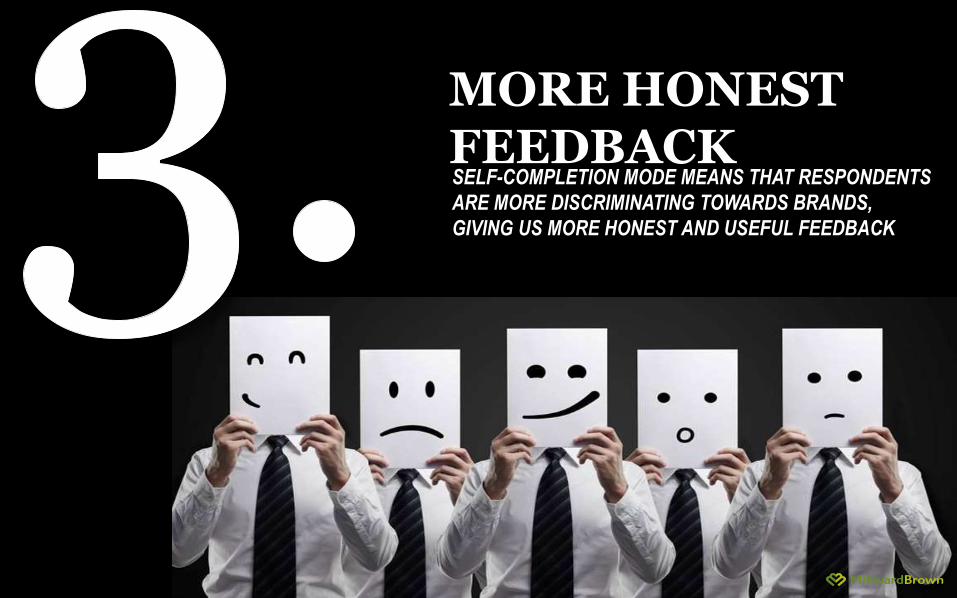
19
MORE HONEST FEEDBACKSELF-COMPLETION MODE MEANS THAT RESPONDENTS
ARE MORE DISCRIMINATING TOWARDS BRANDS,
GIVING US MORE HONEST AND USEFUL FEEDBACK

20
NOT AN ISSUE CAPTURING OPEN ENDED RESPONSES

21
SCREEN SIZE DOESN’T MATTER –RESPONSES ARE CONSISTENT

22
MOBILE SURVEYS GIVE YOU GREAT SHORT TERM ADVANTAGES
Consumers are connected to their
mobile phones all the time and find
it comfortable and engaging as a
communication medium better
interview context
Studies have shown that without
interviewers (over)prompting, mobile data is
more discriminating between brands and
reflect market reality better better data
quality
Speed of data access and deliverables
increases significantly.

OUR QUALITY CONTROL MEASURES (all automated)

24
Brand Equity Study
completed via
Mobile in Egypt
Mobile Phone
Brands…

25
Data quality is impressive on
Mobile
Data quality is
impressive on Mobile

26
Increased Engagement
MOBILE CAPI

SYNCING IS MORE THAN JUST GETTING GREATER FREQUENCY
27
Technology
helps
getting
better
coverage
for the study
& proof of
data
capture

It helps us
zoom in into
every
location to
have the
spread of
interviews
Cairo
Alex

Study de ta i l s – Who & What?
29
Males and Females
Between 15 – 40 Years Old
Currently have an active
SIM in Egypt
Samples from Pan Egypt
1. Mobile handset brand
equity
2. Mobile internet behavior

Quick Facts
30
88%answered the surveys
using SMARTPHONE
38%Are from Dual SIM phone
46%Answered using a
SAMSUNG Device
3 DAYSTo conduct
514 interviews
Minutes on
average to
complete
the survey

No environment is 100% mobile-free anymore!!
Relaxing 89% Travelling 61% With Friends 55% Watching TV 54%
While in bed 50% While Eating 23% In a Store In toilet 13%13%

Handsets or Hand sticks?!
32
89% go online on their phone daily
87%I don’t leave their home without their smart phones
I first look into my phone for mails, messages, updates, or
calls once I wake up82%
Says that they would rather sacrifice TV than Smartphone86%

HOW CAN ADVERTISERS TAKE ADVANTAGE
35
The challenge for advertisers is to:
INTRODUCING THE BRAND PROPELLER

36
38.3 17 16.7 13.5 6.5
Meaningful
154
Different
127
Salient
149
135106
168
108
73
88
133
69
87
113
105
80
Take a Guess : Which Brands have higher Power?
Identify the propeller of brands.
37
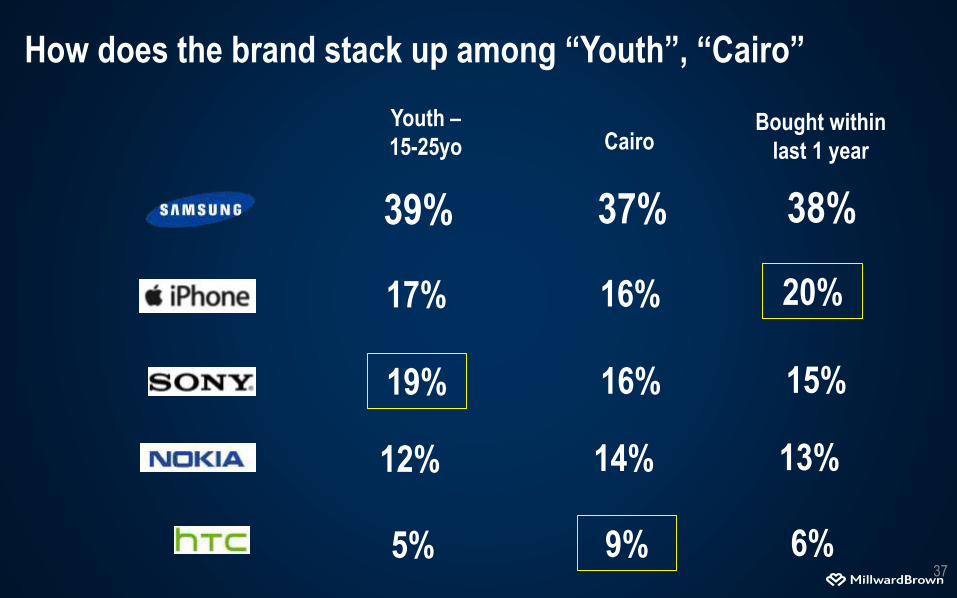
How does the brand stack up among “Youth”, “Cairo”
Youth –
15-25yo Cairo
39%
17%
19%
12%
5%
37%
16%
16%
14%
9%
Bought within
last 1 year
38%
20%
15%
13%
6%
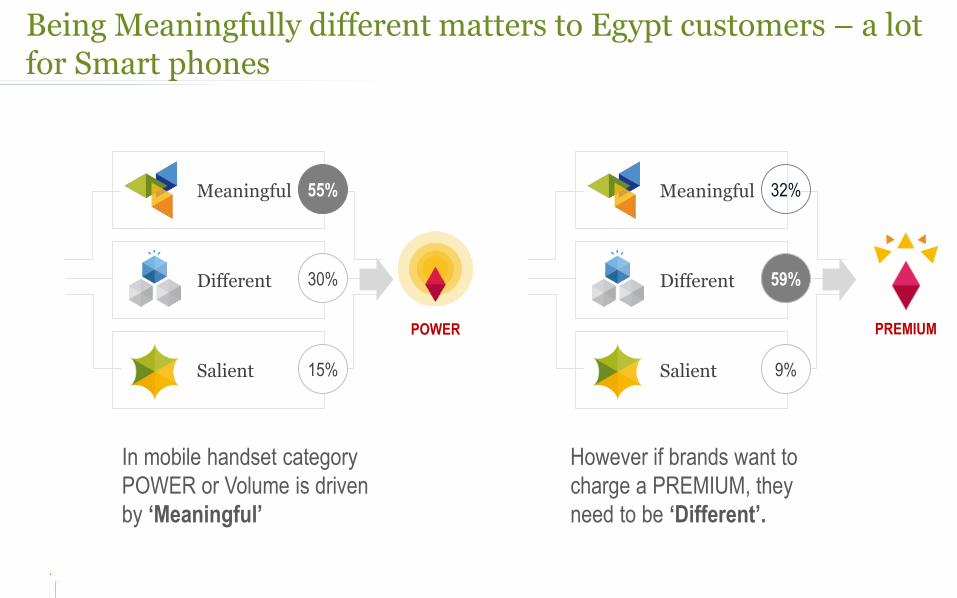
Being Meaningfully different matters to Egypt customers – a lot for Smart phones
Meaningful
Salient
Different
32%
59%
9%
Meaningful
Salient
Different
55%
30%
15%
POWER PREMIUM
In mobile handset category
POWER or Volume is driven
by ‘Meaningful’
However if brands want to
charge a PREMIUM, they
need to be ‘Different’.

Equity Map of mobile brands
39
iPhone along with Samsung and HTC are the meaningfully different brands ;
Microsoft and BB are considered different
Samsung
iPhone
SonyNokia
HTC
Huawei
Other Chinese Brands
Blackberry
LG
G-Tide
Microsoft
35
55
75
95
115
135
155
175
31 51 71 91 111 131 151
MEANINGFUL
DIF
FE
RE
NT
SIZE OF POINT = SALIENT

What contributes to being Meaningful & Different
in smart phone Brands?
40

Image Diagnosis - Marketing Levers
We build models for each study which help us identify how image associations group together
to drive the components of equity.
Emotional
Superior
Relevance
Service
Modern
Makes me feel empowered
Makes me feel always connected
Technologically advanced
Innovative brand
Offers a wide range of products
Easy to use
Best after sales services
Stylish design
Meaningful
Salient
Different
55%
30%
15%
POWER

Which attributes should I focus on to drive equity?
The emotional factors has the highest importance to be able to see the brand as
MEANINGUL and while technical superiority helps the brands to be seen DIFFERENT
31%
22%18%
12%
17%
Meaningful
Contribution to Meaningful
22%
30%18%
15%
15%
Different
11%
3%
57%
27%
2%
Salient
Contribution to SalientContribution to Different
Emotional Superior Relevance Service Style

Tapping in to brand’s potential
45

Potential of brands to grow in future
POWER
POTENTIAL
38.3 17 16.7 13.5 6.5
90 82 56 34 77

Momentum of mobile brands
47
HTC shows high growth potential to its share of equity while Nokia in Cooling off stage…
Samsung
iPhone
Sony
Nokia
HTC
Huawei
Other Chinese Brands
Blackberry
LG
G-TideMicrosoft
0
10
20
30
40
50
60
70
80
90
100
0.0% 5.0% 10.0% 15.0% 20.0% 25.0% 30.0% 35.0% 40.0% 45.0%
PO
TE
NT
IAL
POWER % (share)
Is y
our
bran
d se
t to
grow
in th
e fu
ture
?
Are consumers predisposed
to choose you?
HotHeating Up
Cold Cooling Off
HTC is a hot brand (with high
power and potential) among
high income and older
audience and from Cairo
MS Lumia is having a very
high momentum among lower
income and age audience

But the story doesn't ends here …
48
Predisposition doesn’t always translate to action. Distribution and pricing
factors often intervene in the pragmatic forms of availability, visibility &
affordability – these can be barriers or facilitators to purchase.
Brand
PredispositionBrand Selection

Hence, its necessary to understand the linkage between Predisposition and Volume…
49
Brand Selection
% of market which is
CONVERTED to you at
the point of purchase
(i.e. RISK)
% of market which is
DIVERTED away
from you
(i.e OPPURTUNITY)
The language is aligned to how you, as marketers, intuitively think about your brand’s performance

Samsung and Nokia are the only brand that gained on its market share with more conversion at POS than others…
50
Power Fulfilled
at point of sale
Diverted at
point of sale
To
tal s
har
e o
f cl
aim
ed u
sag
eConverted at
point of sale
Power Score 38.3% 17.0% 16.7% 13.5% 6.5%
25.5%
5.3% 4.8% 8.6%
1.7%
20.7%
2.4% 2.9%
20.7%
1.2%
12.8% 11.6% 11.9%
4.9% 4.9%
1
2
3Net gain/loss +7.9 -9.3 -9.0 +15.8 -4.2
Actual Volume 46.2% 7.7% 7.7% 29.3% 2.3%

51
Power Fulfilled
at point of sale
Diverted at
point of sale
To
tal s
har
e o
f cl
aim
ed u
sag
eConverted at
point of sale
Power Score 38.3%
25.5%
5.3% 4.8% 8.6%
1.7%
20.7%
2.4% 2.9%
20.7%
1.2%
12.8% 11.6% 11.9%
4.9% 4.9%
1
2
3Net gain/loss +7.9
Actual Volume 46.2%
9.13
iPhone Sony Nokia htc others
5.76 6.38 2.18
1. Whom I lost to / gained from?
Samsung gained on volume from iPhone, Sony and htc while losing majorly to Nokia (Lumia)

52
2. Why we gained / lost at POS – Waterfall chart
38.346.2
4.2 -2 -21.5
3.93.1
2.21-2.6
PowerScore
Notavailable
Attractivecolor /design
Salesmanreco
Freeapplications
Bundleoffers
Notdisplayed
User friendly Price ClaimedVolumeshare
Non availability and non display of other pre-disposed brands (iPhone, htc ) made
consumers buy Samsung …
Attractive color/design (of Lumia) coupled with sales man recommendation on windows
platform and price edge made consumers deviate from Samsung …

53
To Sum up
The MDS framework:
Digital data-collection
Helps you build meaningful brands & grow brand value
Holistic in approach, yet can diagnose in detail the
barriers & facilitators to brand growth
Validated and linked to brands’ financial performance.
Consumers are spending more time on digital devices
Gives us better access to different consumer profiles
Better quality data with realistically short questionnaires

54
create meaningful
IMPACT


