
MINOS Flux Determination
Žarko Pavlović
Pittsburgh, 12/07/12

2
Outline
• Introduction
• MINOS experiment and NuMI beam
• Calculating flux and systematic errors
• Fitting the ND data (Beam tuning)
• Conclusion
3
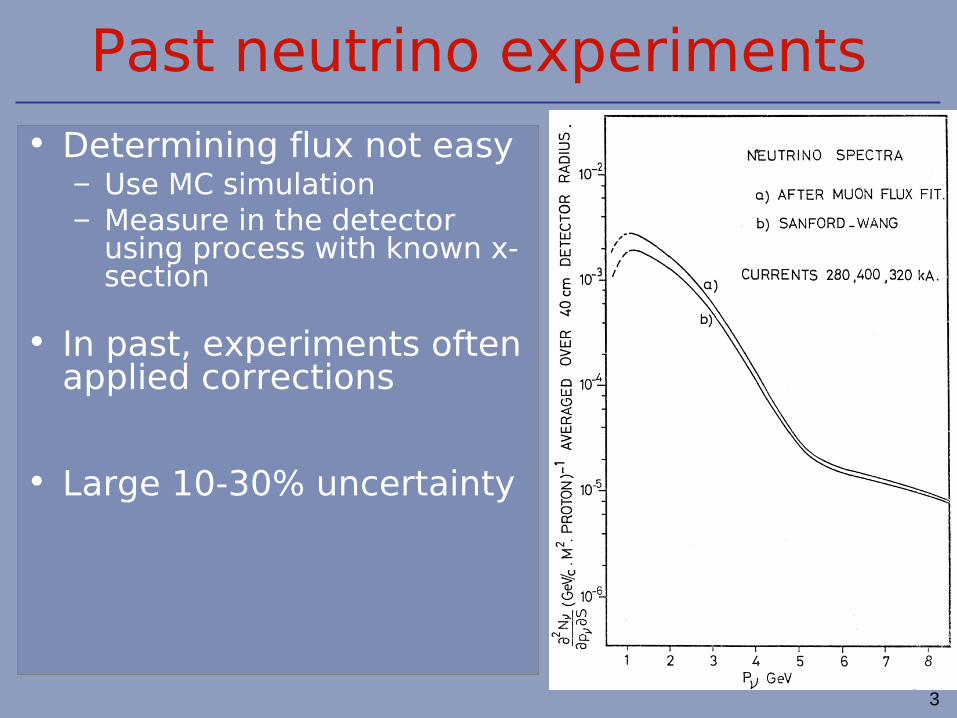
Past neutrino experiments• Determining flux not easy
– Use MC simulation– Measure in the detector
using process with known x-section
• In past, experiments often applied corrections
• Large 10-30% uncertainty
4
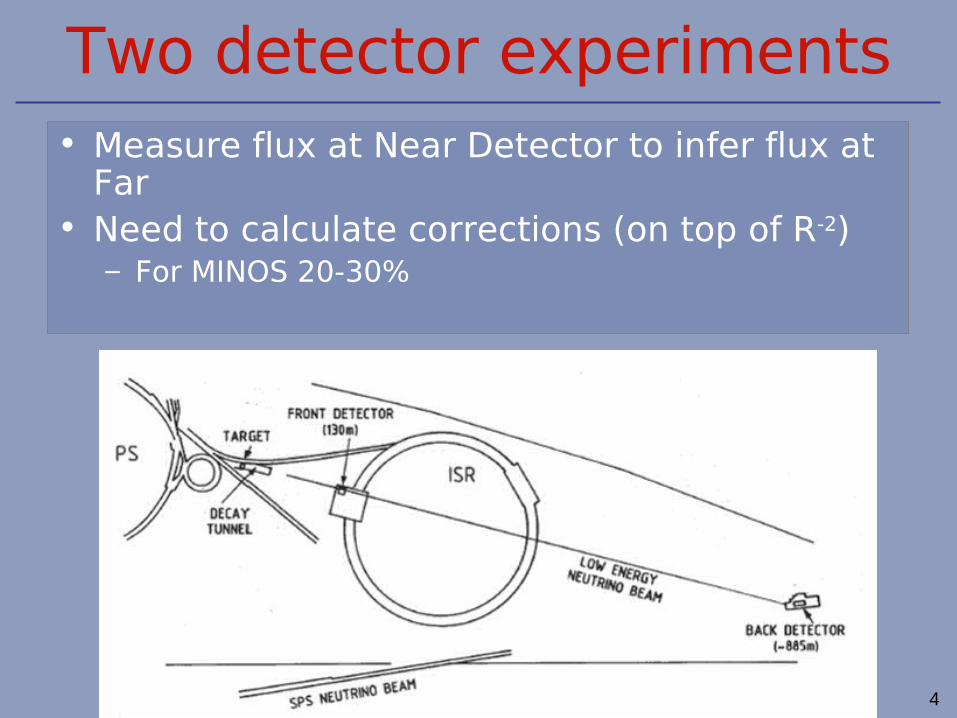
Two detector experiments• Measure flux at Near Detector to infer flux at
Far• Need to calculate corrections (on top of R-2)
– For MINOS 20-30%
5
MINOS Experiment
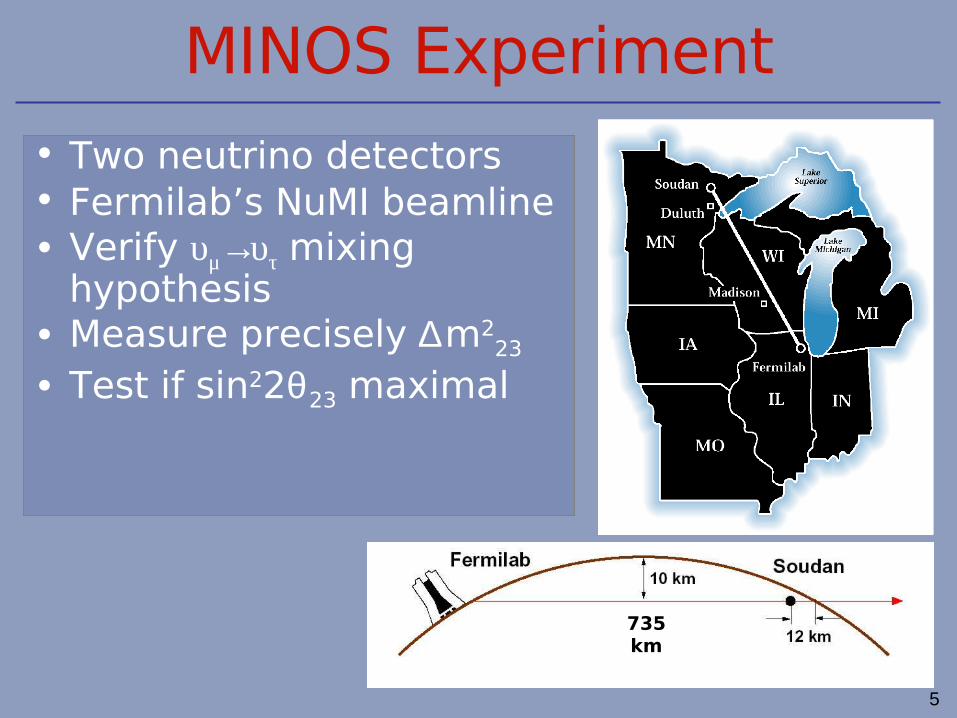
• Two neutrino detectors• Fermilab’s NuMI
beamline• Verify υμ→υτ mixing
hypothesis • Measure precisely
∆m223
• Test if sin22θ23 maximal
735 km
• Two neutrino detectors• Fermilab’s NuMI beamline• Verify υμ→υτ mixing
hypothesis • Measure precisely ∆m2
23 • Test if sin22θ23 maximal
6
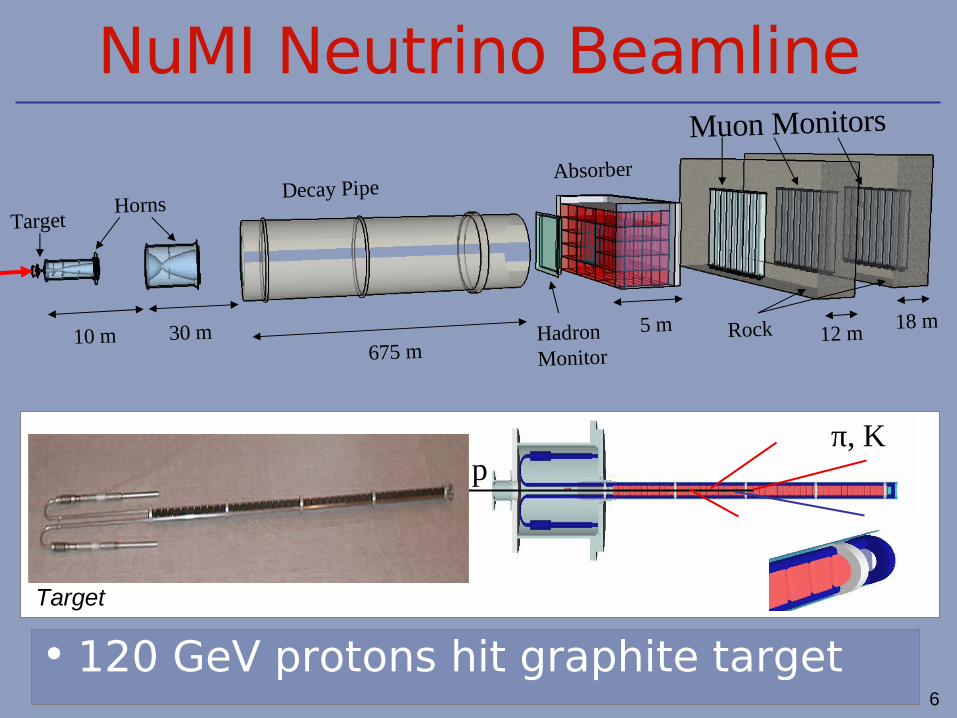
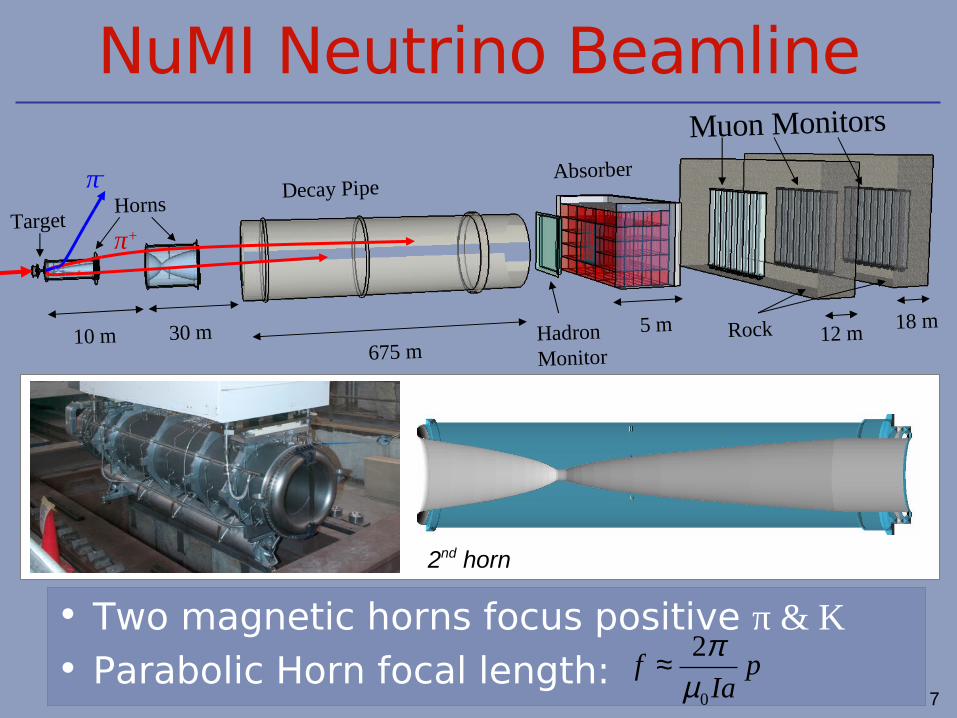
NuMI Neutrino Beamline
• 120 GeV protons hit graphite target
TargetHorns
Decay PipeAbsorber
Hadron Monitor
Muon Monitors
Rock10 m 30 m675 m
5 m 12 m 18 m
π, Kp
Target
7
NuMI Neutrino Beamline
• Two magnetic horns focus positive π & K
• Parabolic Horn focal length:
TargetHorns
Decay PipeAbsorber
Hadron Monitor
Muon Monitors
Rock
π+
10 m 30 m675 m
5 m 12 m 18 m
pIa
f0
2
µπ≈
π-
2nd horn
8
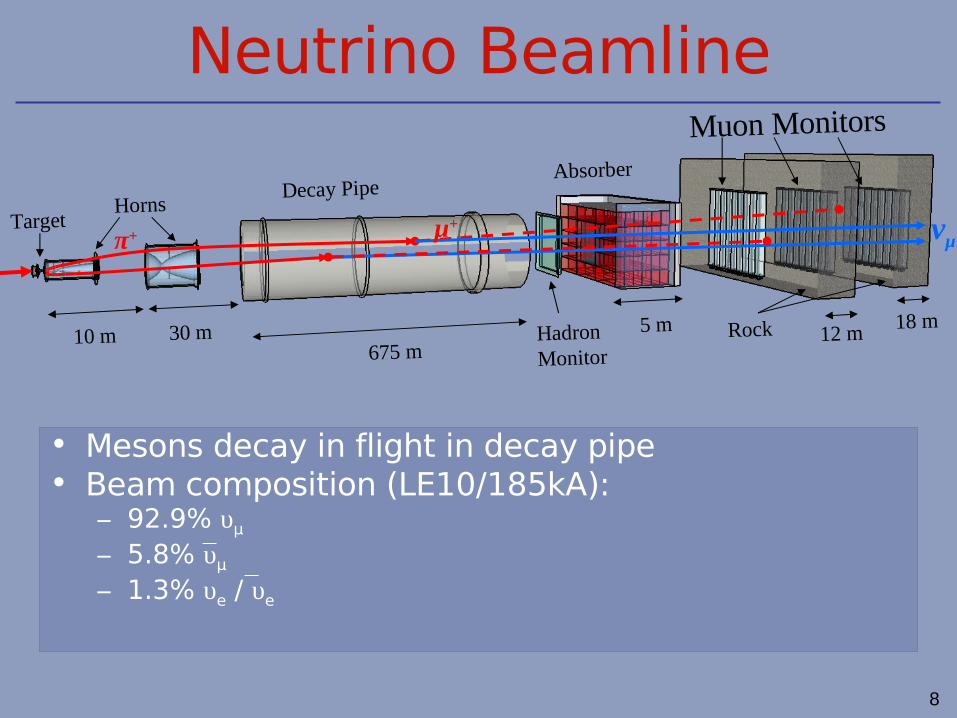
Neutrino Beamline
• Mesons decay in flight in decay pipe• Beam composition (LE10/185kA):
– 92.9% υμ – 5.8% υμ – 1.3% υe / υe
νμTarget
HornsDecay Pipe
Absorber
Hadron Monitor
Muon Monitors
Rock
μ+π+
10 m 30 m675 m
5 m 12 m 18 m
12/06/12
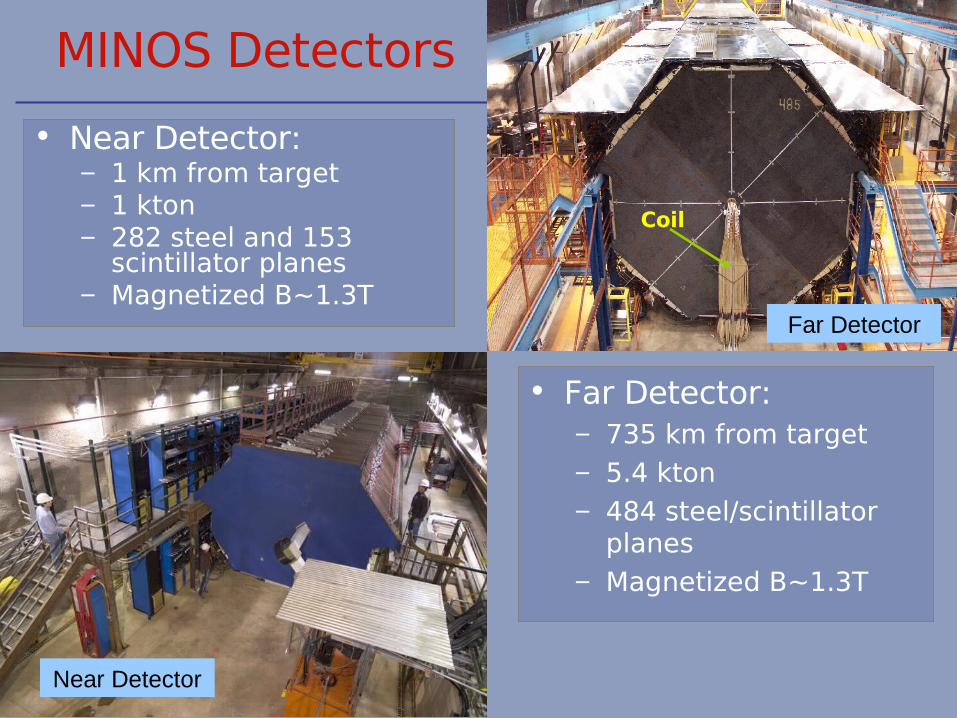
MINOS Detectors
• Near Detector:– 1 km from target– 1 kton– 282 steel and 153
scintillator planes– Magnetized B~1.3T
Coil
• Far Detector:– 735 km from target– 5.4 kton– 484 steel/scintillator
planes– Magnetized B~1.3T
Near Detector
Far Detector
12/06/12
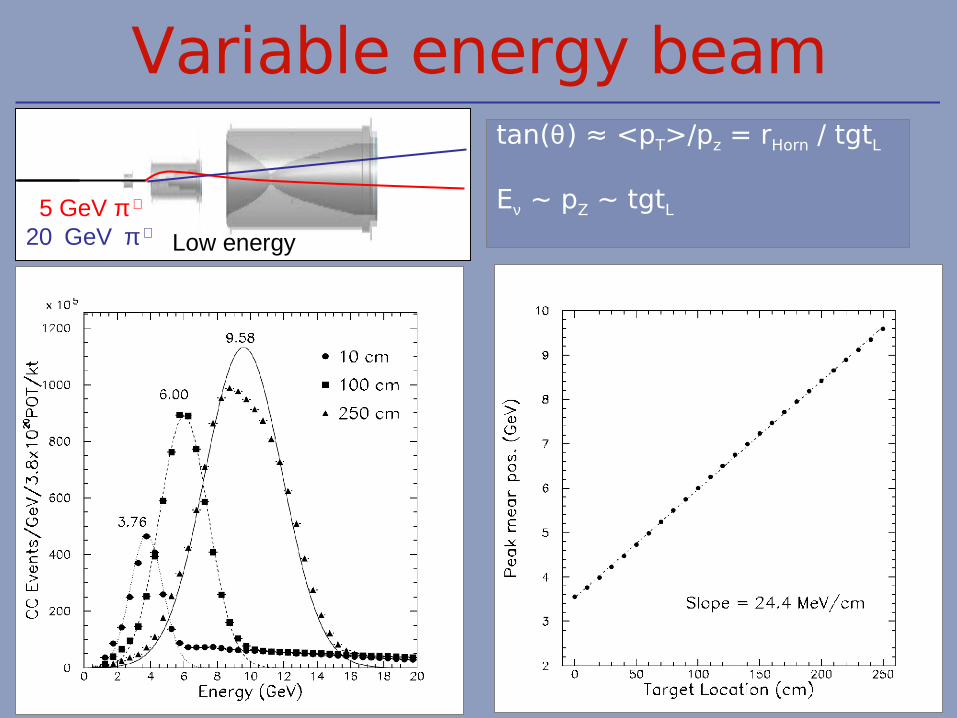
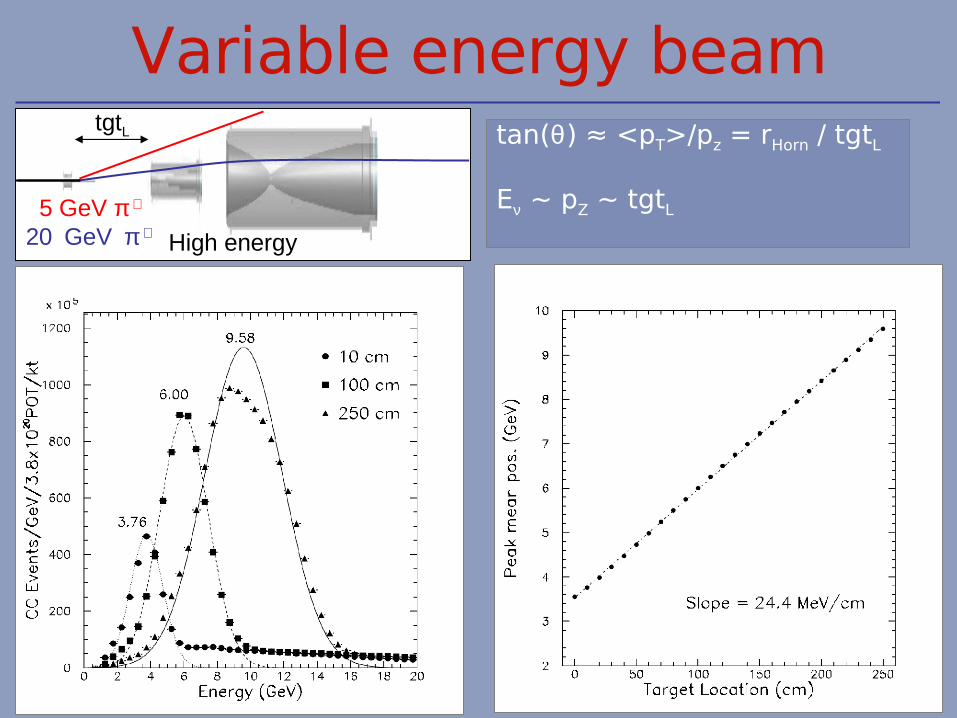
Variable energy beam
5 GeV π +
20 GeV π+
tan(θ) ≈ <pT>/pz = rHorn / tgtL
Eν ~ pZ ~ tgtL
Low energy
5 GeV π +
20 GeV π +
12/06/12
Variable energy beam
5 GeV π +
20 GeV π +
tan(θ) ≈ <pT>/pz = rHorn / tgtL
Eν ~ pZ ~ tgtL
tgtL
High energy
12
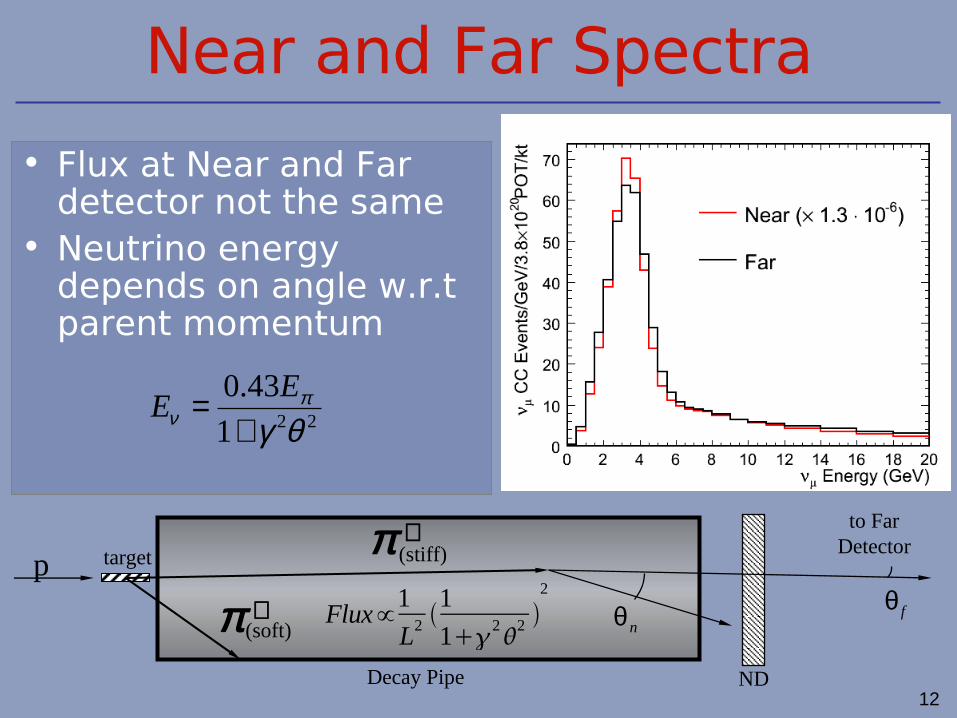
Near and Far Spectra
• Flux at Near and Far detector not the same
• Neutrino energy depends on angle w.r.t parent momentum
θ f
to FarDetector
Decay Pipe
π +
π +(soft)
(stiff)
θ n
target
ND
221
43.0
θγπ
ν += E
E
p
Flux∝1
L2 1
12
2 2
12/06/12
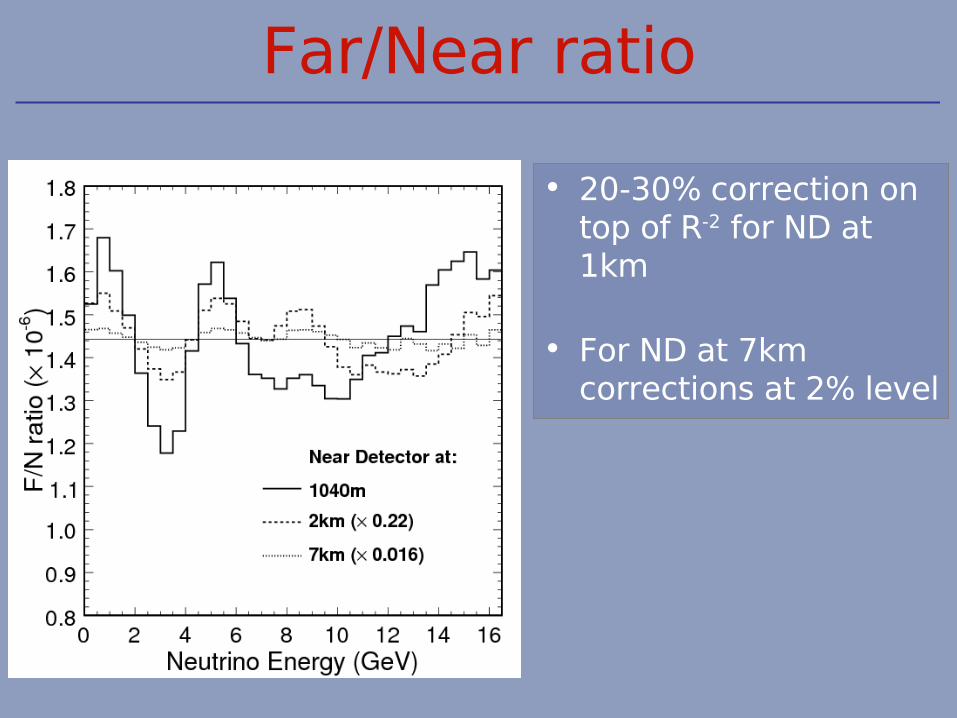
Far/Near ratio
• 20-30% correction on top of R-2 for ND at 1km
• For ND at 7km corrections at 2% level

12/06/12
Study of Beam systematics
• Non-hadron production1. Proton beam2. Secondary focusing modelling3. MC geometry
• Hadron Production
NB: Much of the inputs backed up with beamline instrumentation
12/06/12
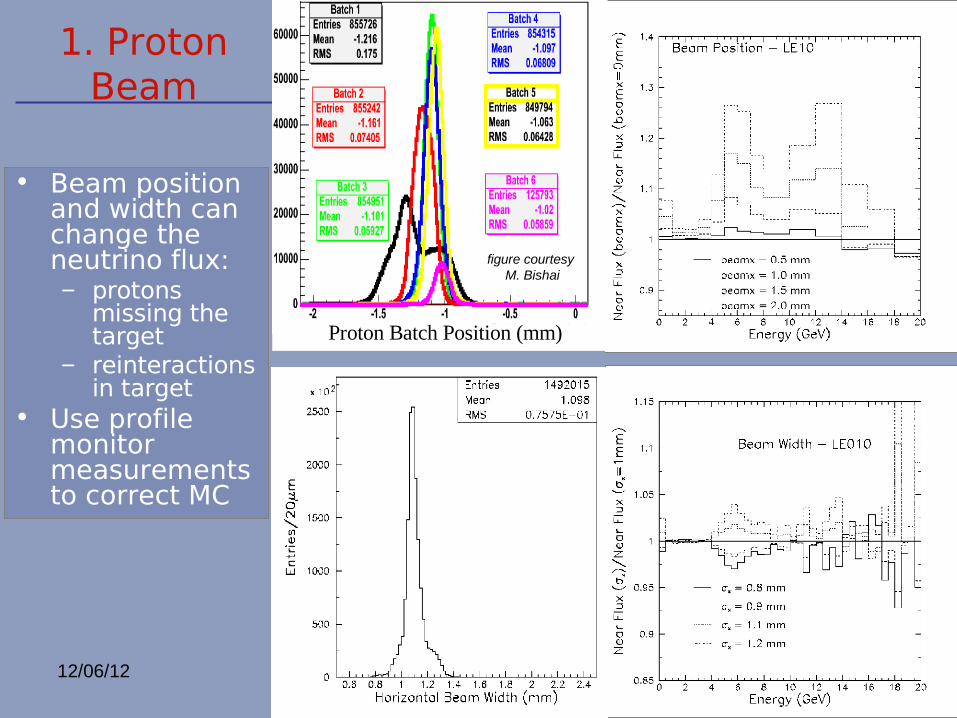
1. Proton Beam
• Beam position and width can change the neutrino flux:– protons
missing the target
– reinteractions in target
• Use profile monitor measurements to correct MC
Proton Batch Position (mm)
figure courtesy M. Bishai
12/06/12
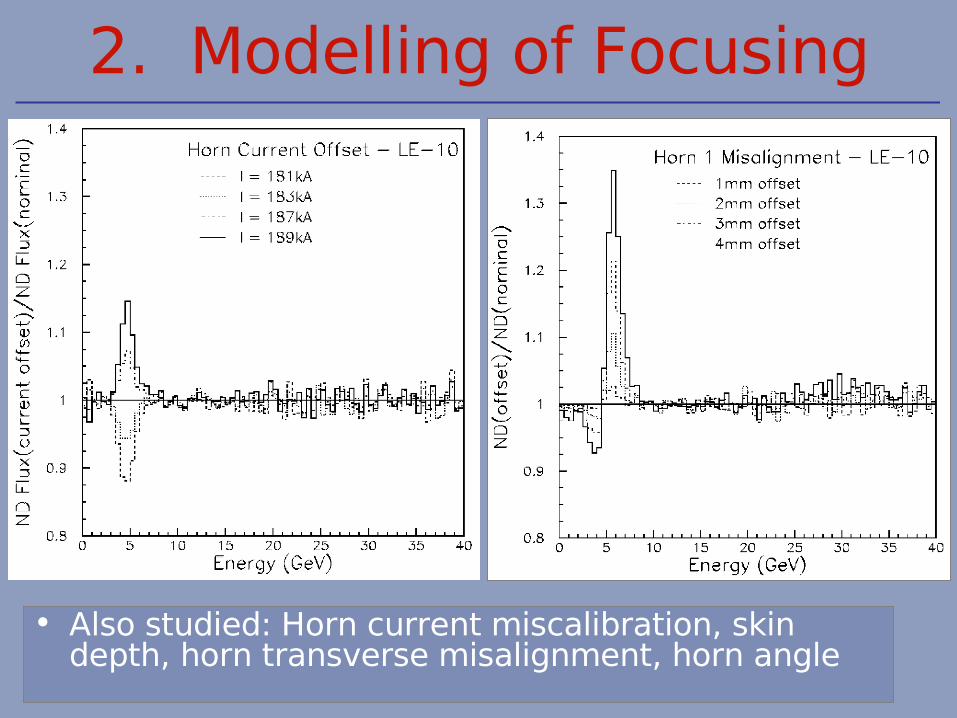
2. Modelling of Focusing
• Also studied: Horn current miscalibration, skin depth, horn transverse misalignment, horn angle
17
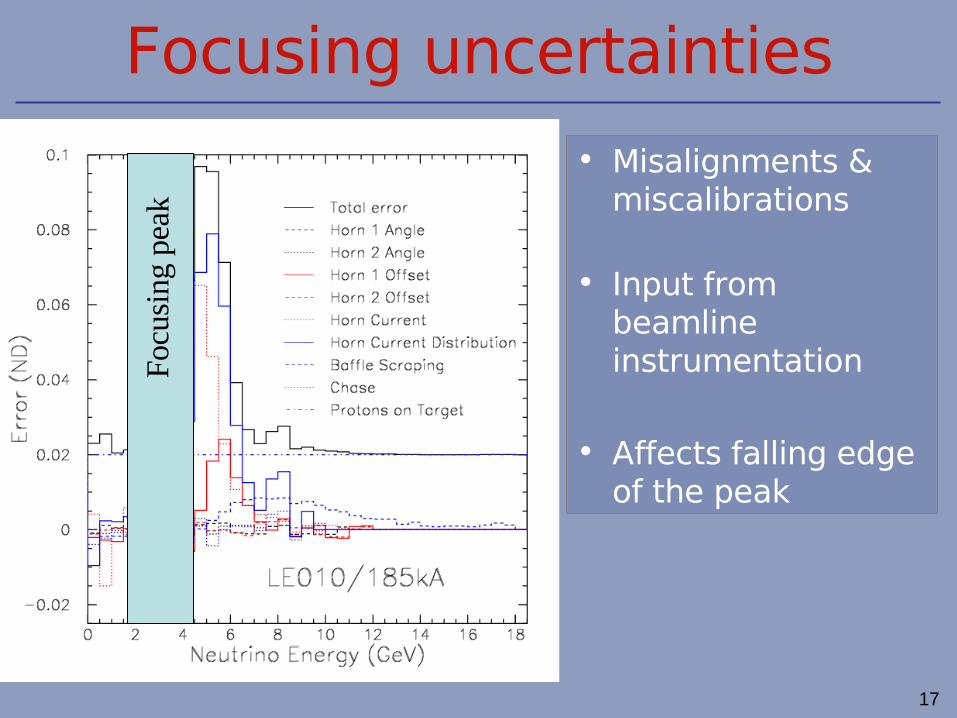
Focusing uncertainties
• Misalignments & miscalibrations
• Input from beamline instrumentation
• Affects falling edge of the peak
Focu
sing
pea
k

18
Hadron production
• Proton beam momentum
• Target material
• Thick target
19
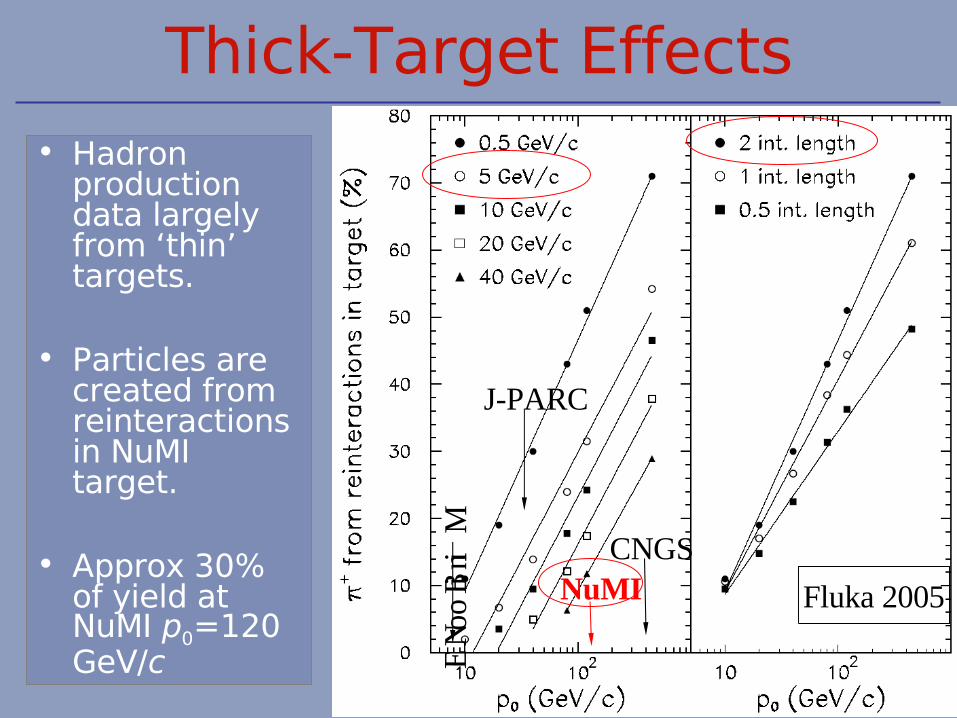
Thick-Target Effects• Hadron
production data largely from ‘thin’ targets.
• Particles are created from reinteractions in NuMI target.
• Approx 30% of yield at NuMI p0=120 GeV/c
MiniB
ooNE
NuMICNGS
J-PARC
Fluka 2005
20
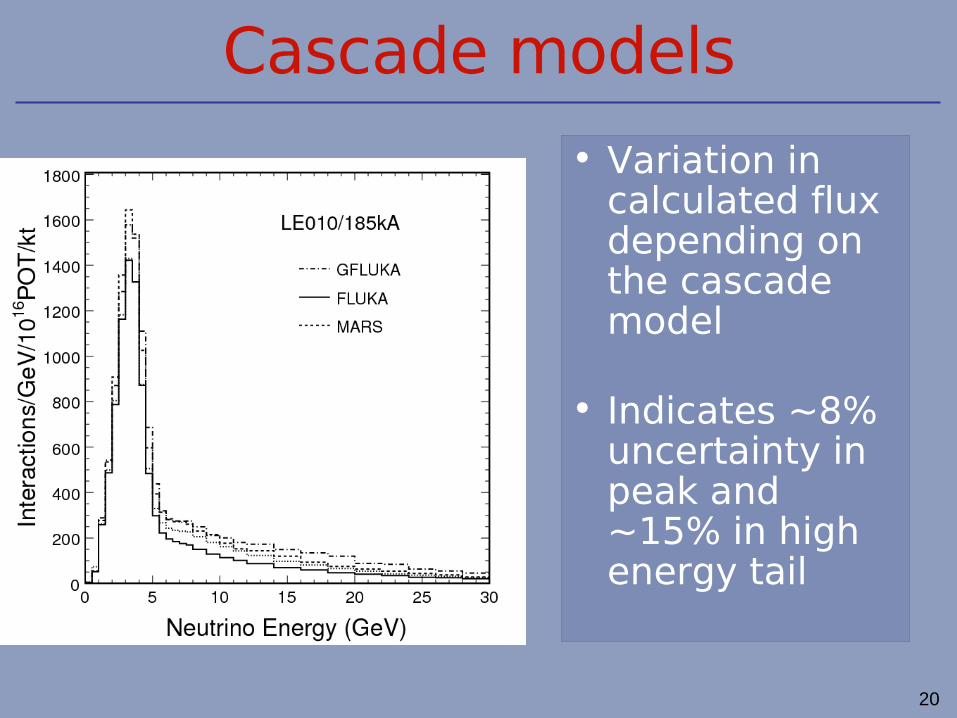
Cascade models
• Variation in calculated flux depending on the cascade model
• Indicates ~8% uncertainty in peak and ~15% in high energy tail
12/06/12
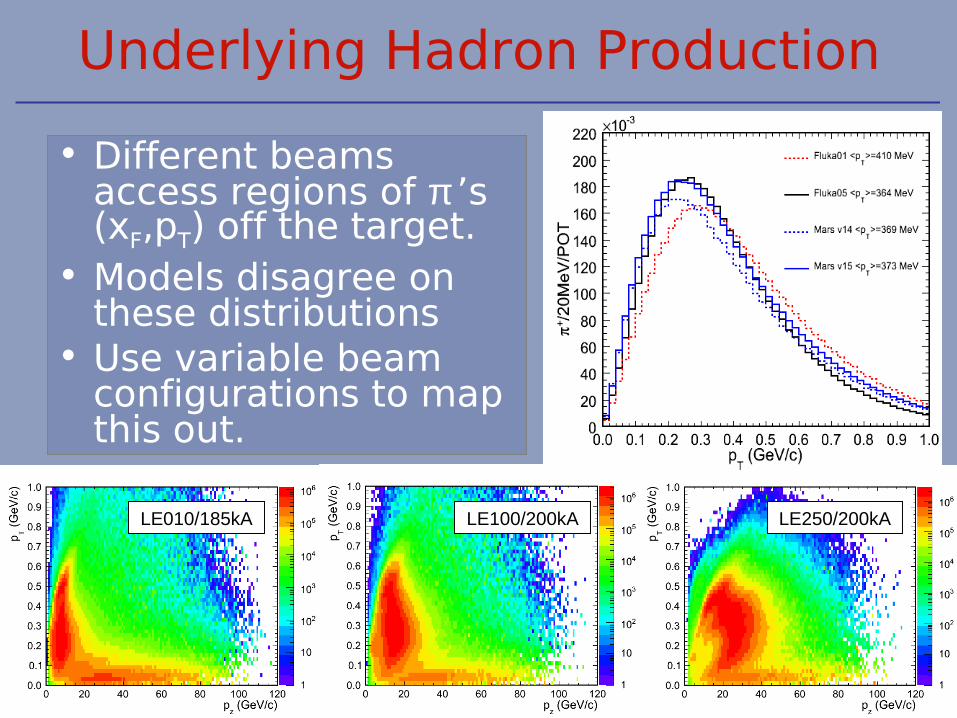
Underlying Hadron Production
• Different beams access regions of π ’s (xF,pT) off the target.
• Models disagree on these distributions
• Use variable beam configurations to map this out.
LE010/185kA LE100/200kA LE250/200kA

12/7/12
Hadron Production
• Same pT-xF bin contributes differently to different beams
LE010/185kA
LE100/200kA
LE250/200kA
LE010/185kA
LE100/200kA
LE250/200kA
LE010/185kA
LE100/200kA
LE250/200kA
23
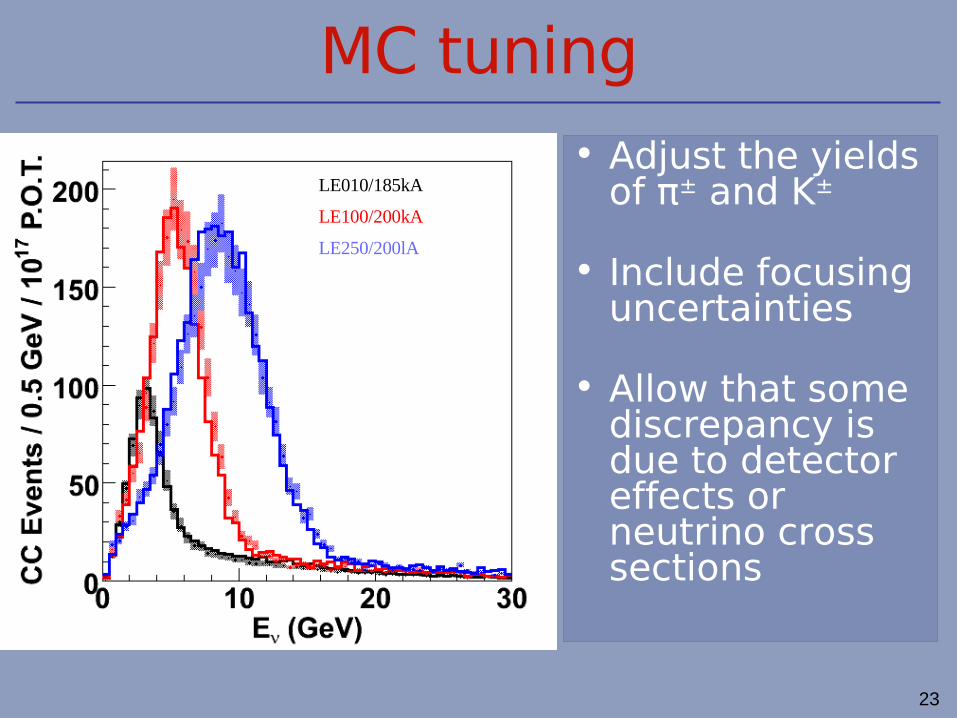
MC tuning
• Adjust the yields of π± and K±
• Include focusing uncertainties
• Allow that some discrepancy is due to detector effects or neutrino cross sections
LE010/185kA
LE100/200kA
LE250/200lA
24
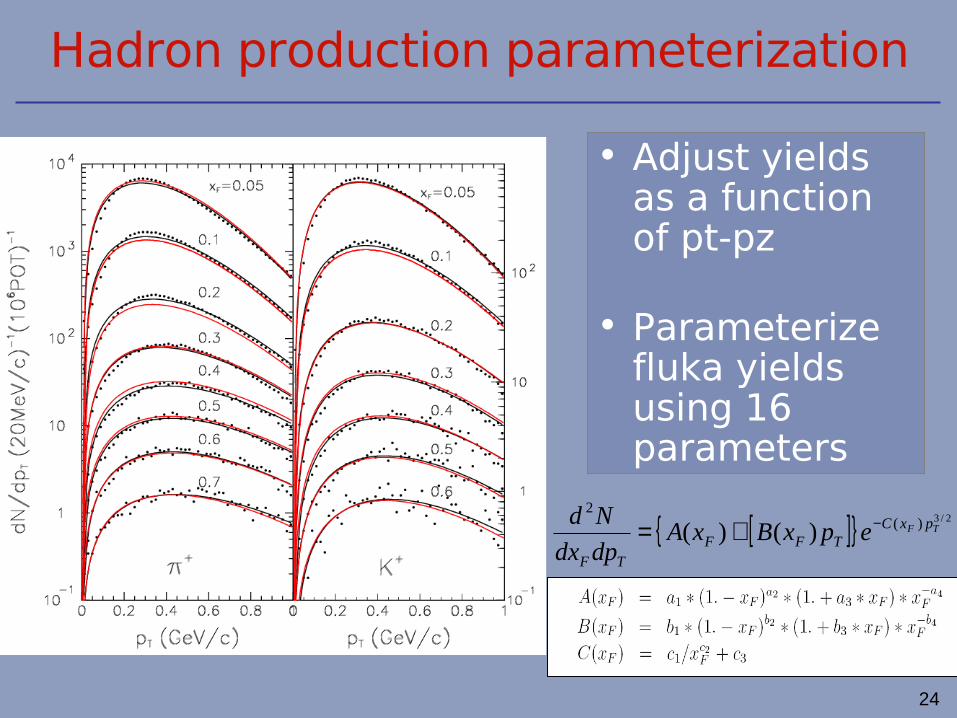
Hadron production parameterization
• Adjust yields as a function of pt-pz
• Parameterize fluka yields using 16 parameters
[ ]{ } 2/3)(2
)()( TF pxCTFF
TF
epxBxAdpdx
Nd −+=

25
Tuning MC• Fit ND data from all beam
configurations
• Simultaneously fit νμ and νμ spectraυμ LE010/185kALE010/185kA LE100/200kA LE250/200kA
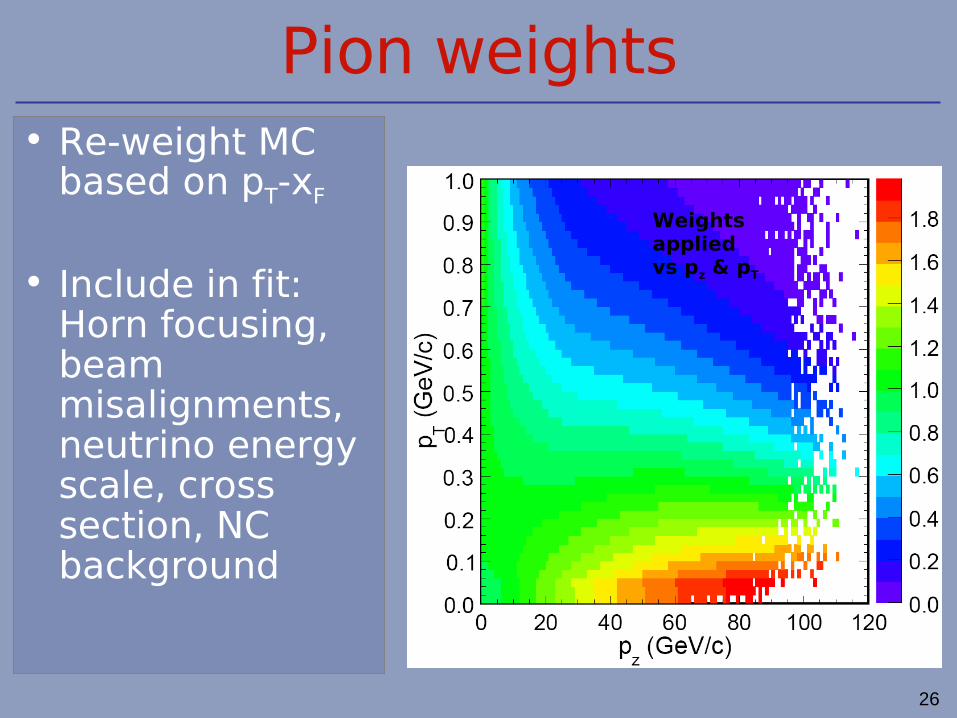
26
Pion weights• Re-weight MC
based on pT-xF
• Include in fit: Horn focusing, beam misalignments, neutrino energy scale, cross section, NC background
Weights applied vs pz & pT
27
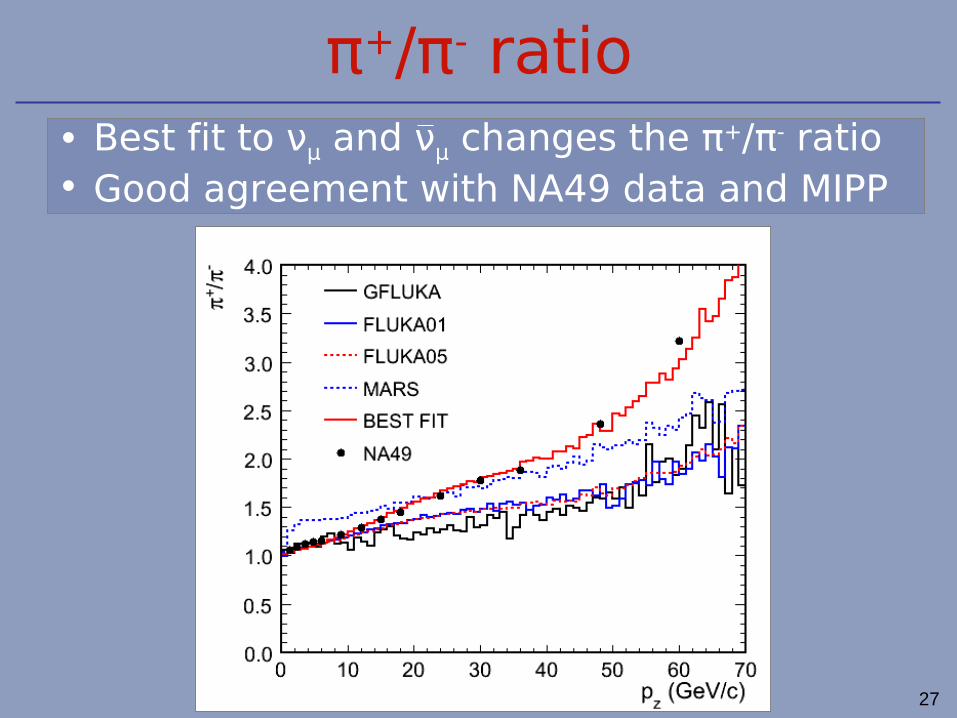
π+/π- ratio• Best fit to νμ and νμ changes the π+/π- ratio• Good agreement with NA49 data and MIPP

28
Far/Near Ratio
• Fits to ND data constrain the F/N ratio
• Errors are at <2% level
29
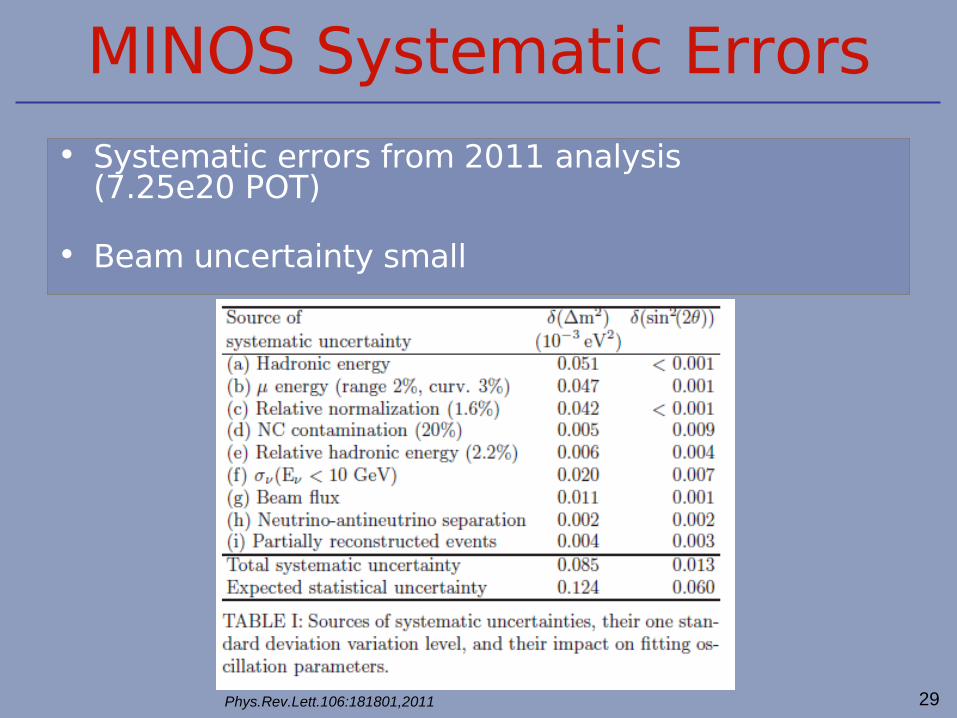
MINOS Systematic Errors• Systematic errors from 2011 analysis
(7.25e20 POT)
• Beam uncertainty small
Phys.Rev.Lett.106:181801,2011
30
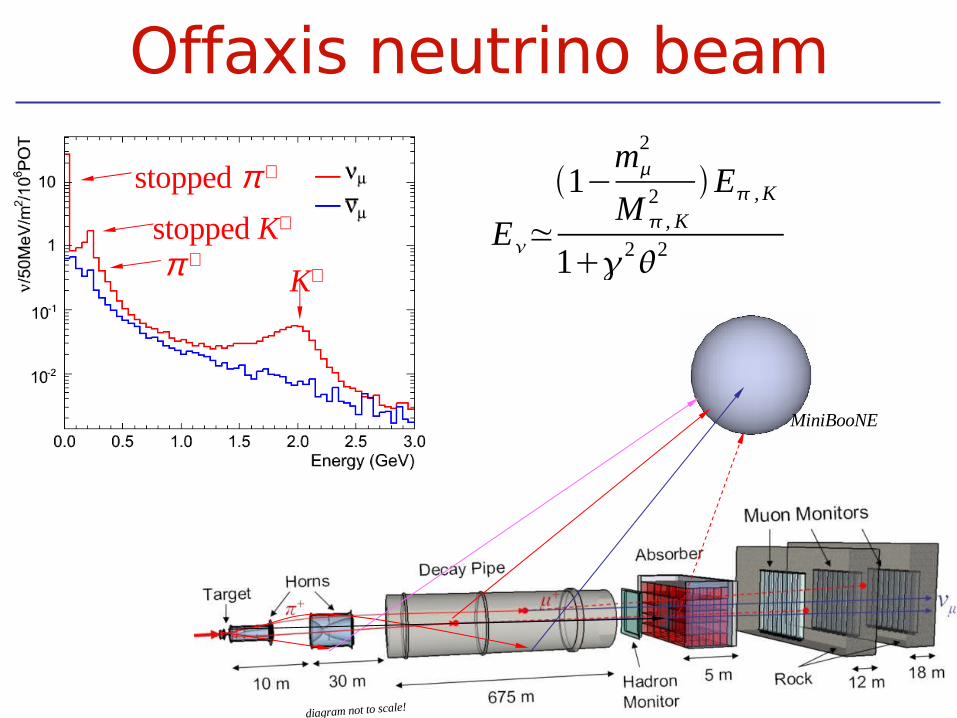
Offaxis neutrino beam
MiniBooNE
diagram not to scale!
K+π +stopped K+
stopped π +
E≃
1−m
2
M , K2 E , K
122
31
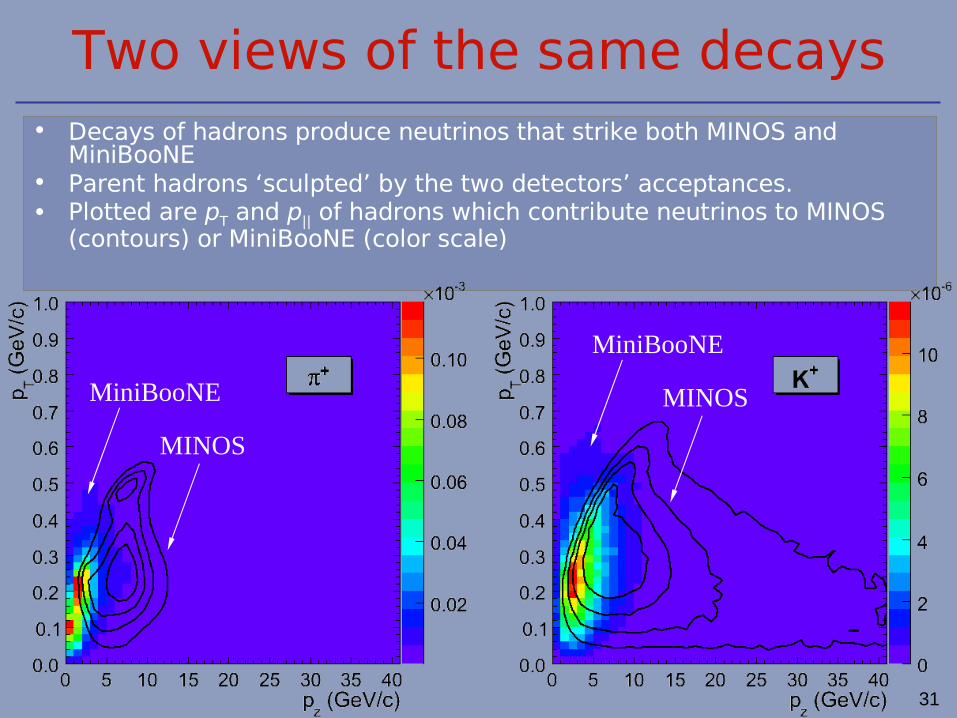
Two views of the same decays• Decays of hadrons produce neutrinos that strike both MINOS and
MiniBooNE• Parent hadrons ‘sculpted’ by the two detectors’ acceptances.• Plotted are pT and p|| of hadrons which contribute neutrinos to MINOS
(contours) or MiniBooNE (color scale)
MINOS
MiniBooNE MINOS
MiniBooNE

32
NumiBooNE
• Good agreement between data and MC
33
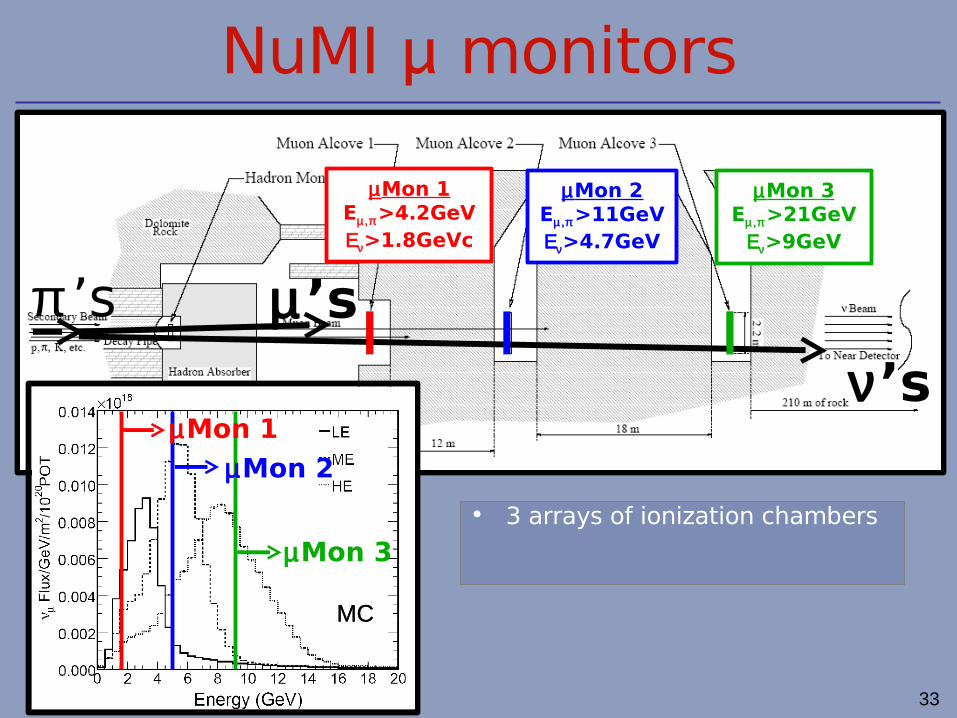
NuMI μ monitors
π ’s µ ’s
ν’s
µMon 1Eµ,π >4.2GeVΕν>1.8GeVc
µMon 2Eµ,π >11GeVΕν>4.7GeV
µMon 3Eµ,π >21GeV
Εν>9GeV
µMon 1
µMon 3
µMon 2
MCMC
• 3 arrays of ionization chambers
34
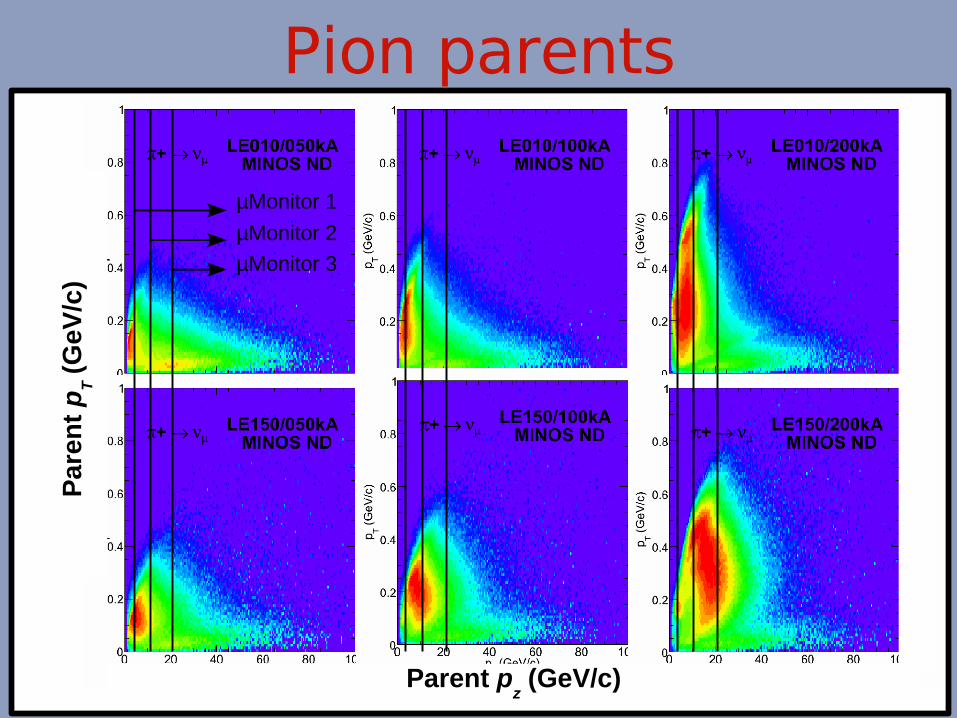
Pion parentsP
are
nt pT (
Ge
V/ c
)
Parent pz (GeV/c)
µMonitor 1
µMonitor 2
µMonitor 3
35
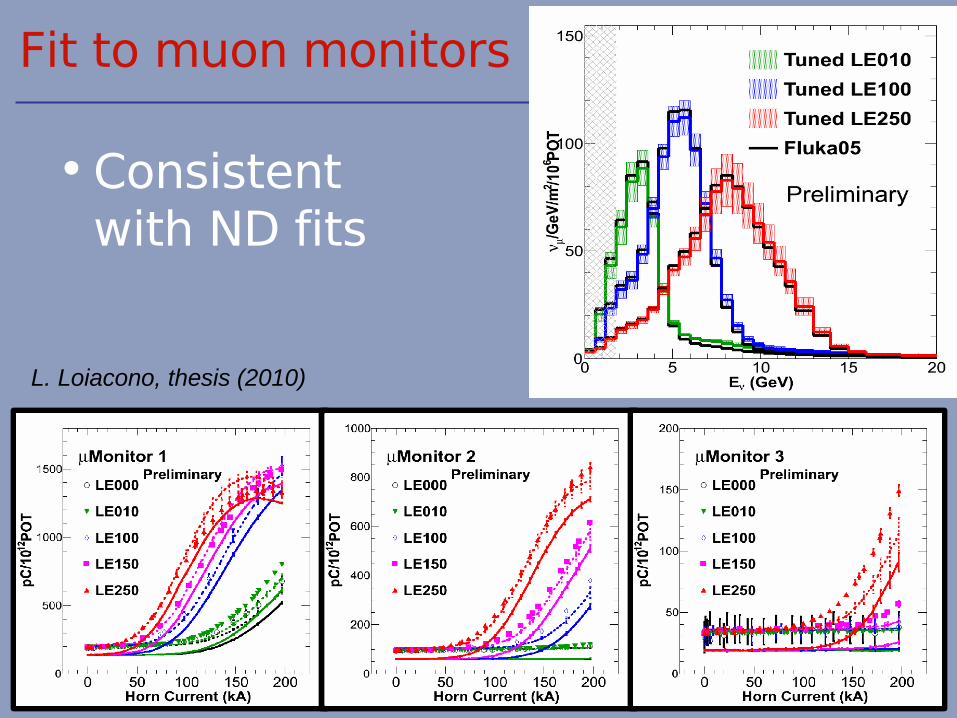
Fit to muon monitors
• Consistent with ND fits
L. Loiacono, thesis (2010)
36
Conclusion
• MINOS tunes hadron production to simultaneously fit all ND data
• Technique independent of particle production experiments
• Beam systematics well constrained

37
Backup

38
F/N focusing uncertainties
• F/N ratio affected at 2% level
12/06/12
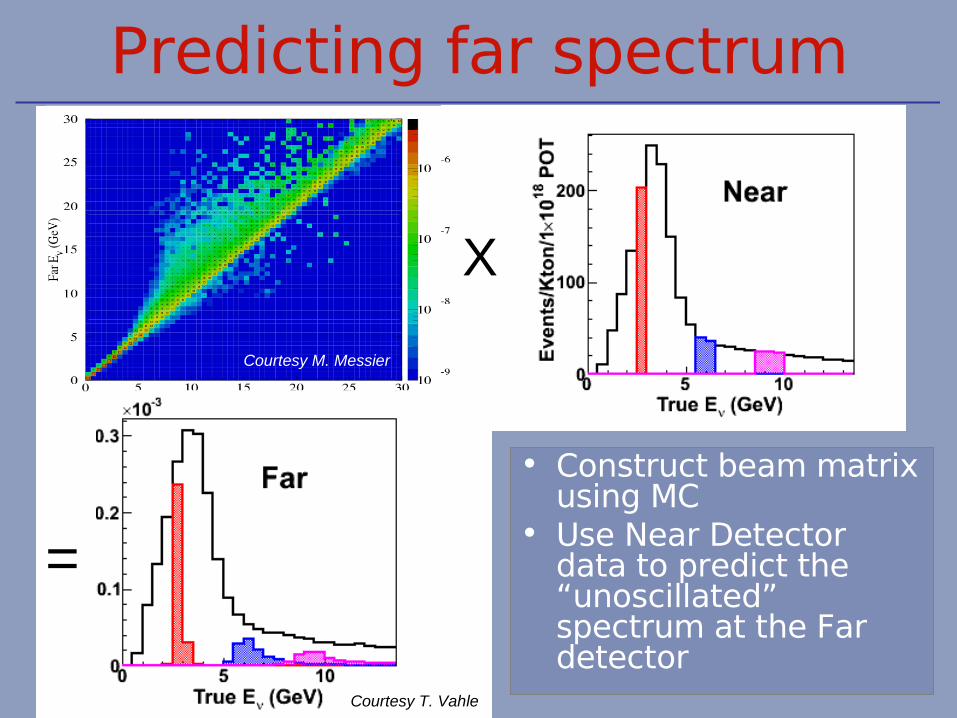
Predicting far spectrum
• Construct beam matrix using MC
• Use Near Detector data to predict the “unoscillated” spectrum at the Far detector
X
=
Courtesy M. Messier
Courtesy T. Vahle


