
Modeling and Predicting FaceRecognition System Performance
Based on Analysis of Similarity Scores
Peng Wang, Member, IEEE,Qiang Ji, Sr. Member, IEEE, and
James L. Wayman, Sr. Member, IEEE
Abstract—This paper presents methods of modeling and predicting face
recognition (FR) system performance based on analysis of similarity scores. We
define the performance of an FR system as its recognition accuracy, and consider
the intrinsic and extrinsic factors affecting its performance. The intrinsic factors of
an FR system include the gallery images, the FR algorithm, and the tuning
parameters. The extrinsic factors include mainly query image conditions. For
performance modeling, we propose the concept of “perfect recognition,” based on
which a performance metric is extracted from perfect recognition similarity scores
(PRSS) to relate the performance of an FR system to its intrinsic factors. The PRSS
performance metric allows tuning FR algorithm parameters offline for near optimal
performance. In addition, the performance metric extracted from query images is
used to adjust face alignment parameters online for improved performance. For
online prediction of the performance of an FR system on query images, features are
extracted from the actual recognition similarity scores and their corresponding
PRSS. Using such features, we can predict online if an individual query image can
be correctly matched by the FR system, based on which we can reduce the
incorrect match rates. Experimental results demonstrate that the performance of an
FR system can be significantly improved using the presented methods.
Index Terms—Face recognition, similarity scores, performance modeling,
performance prediction, image quality.
Ç
1 INTRODUCTION
WITH current applications of computer vision systems to theautomatic recognition of humans from various forms of imagery,algorithmic and system performance modeling and prediction isreceiving increasing attention because of the impact such systemshave on both collective security and personal privacy [14]. Oneform of automated human recognition currently receiving greatresearch interest is face recognition (FR), which is the subject ofongoing US government evaluation campaigns [1]. This paperpresents generic methods to model and predict the face recognitionsystem performance based on an analysis of similarity scores.Here, the “performance” of a face recognition system is definedonly as its accuracy in correctly matching face images. Otheraspects of performance, such as speed, cost, availability, andmaintainability, are not considered in this paper.
Many methods have been developed to improve a singlerecognition algorithm and to make the most use of each image[15]. However, all of the current methods have their own limitationsin that they may show good accuracy under some environments, butmay also show deteriorated performance under other environmentsdue to many affecting factors. Some testing has shown that failures in
recognizing persons are strongly associated with both the conditionsof the collection environment and the properties of the subjects beingrecognized [7]. All the factors affecting the face recognition systemperformance can be categorized into two kinds: intrinsic andextrinsic factors. The intrinsic factors of an FR system include itsgallery set, the algorithm, and its parameters.1 The extrinsic factorsare primarily image conditions of queries, including face rotationangles, expressions, and illumination.
In this paper, instead of trying to improve a specific algorithm,
we present generic methods to model face recognition performance
and to predict if query images can be correctly recognized by an FR
system. By doing that, the performance of an FR system can be
improved in the following aspects: 1) the FR system parameters can
be automatically tuned only using gallery images for improved
performance based on performance modeling, 2) given query
images, their recognition results can be predicted to identify images
that may be mismatched, so that further actions, such as human
intervention, can be taken to improve recognition accuracy, and
3) the query image parameters (i.e., face alignment in this paper),
can be optimized to achieve better recognition accuracy.
Specifically, our methods are based on an analysis of similarity
scores output from face recognition systems. First, we present a
performance metric by analyzing similarity scores calculated from
intrinsic factors of an FR system. We show that the obtained
performance metric can guide offline system parameter tuning
without acquiring additional data. Second, we present a similarity
score-based method to predict online the recognition results of
query images into two cases: correct match and incorrect match. A
recognition result of a query image is a correct match if the top match
of the query image corresponds to a gallery image of the correct face.
Usually, the recognition failure caused by an incorrect match has
high cost in biometric systems, and our method, through perfor-
mance prediction, intends to identify the query images whose
recognitions are most likely failed. Humans can be alerted about
these images for further actions, therefore improving the system
performance. Third, we present a method, which is also based on
analysis of similarity scores, to adjust alignment of query images
(i.e., eye positions) online to achieve better recognition accuracy.
The rest of this paper is organized as follows: Related work is
reviewed in Section 2. In Section 3, performance modeling for face
recognition is introduced. The method of predicting face recogni-
tion results is presented in Section 4. Experimental results are
discussed in Section 5. The paper concludes in Section 6 with a
summary and discussion of future work.
2 RELATED WORK
Much work has been done already on performance modeling and
prediction of biometric systems such as fingerprint recognition
[11], iris recognition [10], [9], and face recognition [8], [7], [3].
Specifically, in the work by Tabassi et al. [11], the quality of a
fingerprint image is defined as the normalized distance between
matching and nonmatching similarity scores. An 11-dimensional
feature vector is extracted to identify the presence of feature points,
e.g., minutia, and outliers. Then, a Neural Network classifier is
trained using the extracted feature vector to predict query images
into five levels of quality. Their method shows that images of
higher quality usually have better accuracy in recognition, but
their method cannot predict individual recognition results. Schmid
et al. provide a probabilistic estimation of the lower performance
bound of iris recognition algorithms based on an analysis of the
Hamming distance between query and gallery iris images [9].
However, the lower bounds obtained from both the Chernoff
IEEE TRANSACTIONS ON PATTERN ANALYSIS AND MACHINE INTELLIGENCE, VOL. 29, NO. 4, APRIL 2007 665
. P. Wang is with the Department of Radiology, Section of Biomedical ImageAnalysis, University of Pennsylvania, 3600 Market Street, Suite 380,Philadelphia, PA 19104. E-mail: [email protected].
. Q. Ji is with the Department of Electrical, Computer, and SystemsEngineering, Rensselaer Polytechnic Institute, Troy, NY 12180.E-mail: [email protected].
. J.L. Wayman is with the Office of Graduate Studies and Research, San JoseState University, San Jose, CA 95192. E-mail: [email protected].
Manuscript received 31 Jan. 2006; revised 24 June 2006; accepted 22 Sept.2006; published online 18 Jan. 2007.Recommended for acceptance by S. Prabhakar, J. Kittler, D. Maltoni,L. O’Gorman, and T. Tan.For information on obtaining reprints of this article, please send e-mail to:[email protected] and reference IEEECSLog Number TPAMISI-0070-0106.Digital Object Identifier no. 10.1109/TPAMI.2007.1015.
1. The definitions of terms used for face recognition, such as gallery, query,and rank 1 recognition, comply with FERET and FRGC specifications [8], [7].
0162-8828/07/$25.00 � 2007 IEEE Published by the IEEE Computer Society
bound theory and the Large Deviation theory only provide
approximate error estimates. They cannot be used to predict either
the individual recognition results or the performance of systems
that do not use likelihood ratio methods for recognition.
In face recognition, some empirical evaluation methods design
specific training and testing sets, such as experimental settings in
FERET and FRGC [8], [7], to study the system performance.
Although such methods can directly assess the performance of an
FR system under general circumstances, they cannot perform online
performance prediction. To understand the factors affecting the FR
algorithms, Givens et al. use a generalized linear model to analyze
how some human characteristics, including age, race, gender, skin,
glasses, and expression, affect the face recognition accuracy [3].
Their model needs to explicitly identify each affecting factor, which
is an extremely difficult task in practical implementation. In
addition, the identified factors can never be exhaustive.
Some other work predicts system performance using similarity
scores. Li et al. propose to cluster the similarity scores into different
sets, and then use the distance among the sets as features. AdaBoost
is then used to select and combine these features to detect
misclassification of a face recognition system [5]. AdaBoost usually
needs a large number of features and many training samples. For
example, more than 10,000 samples are used in [5]. However, such a
large number of training samples are difficult to collect for practical
systems. The similarity scores are also used to predict closed-set
Cumulative Match Characteristic (CMC) curves with a small set of
gallery data [4], [13]. In these methods, the rank k recognition results
are modeled using parametric models whose parameters are
estimated from a small gallery set. These methods work well only
when gallery and query images are obtained under the same
conditions, and they cannot predict individual recognition results.
3 PERFORMANCE MODELING
3.1 Model of Face Recognition Systems
There is no shortage of algorithmic approaches to face recognition
[15]. Typically, the function of an FR system is to map a query image
to a label that represents its identity. In an FR system, the gallery set
is denoted as G ¼ fg1; g2; . . . ; gng, consisting of n gallery images
whose identity is known to the algorithm. The query set is denoted
as Q ¼ fx1; x2; . . . ; xmg, consisting of m query images whose
identity is unknown to the algorithm. A face recognition algorithm
measures the similarity between query images and each gallery
image. For rank k recognition, which is generally used in closed-set
searches, the system outputs labels of the gallery images corre-
sponding to the k top matches [8]. In this paper, unless otherwise
specified, we define recognition rate as the rate of correct matches at
rank 1. To quantitatively evaluate the performance of a closed-set FR
system, the Cumulative Matching Characteristic (CMC) curve is
used [8].
For most FR systems, the similarity score plays an important role
since it connects both intrinsic and extrinsic factors of an FR system.
The similarity score is denoted as Sðxi; gjÞ or Sði; jÞ, for the
comparison between the query xi and the gallery gj, and a larger
similarity score means a potentially closer match. In our method of
closed-set analysis, all the similarity scores of a query image xi are
sorted in a descending order, and are further normalized to the
range [0, 1], thus the similarity scores of using different gallery
images and different measurement methods can be compared. After
sorting and normalization, the set of similarity scores for data xi are
represented as Si ¼ fSði; j1Þ ¼ 1; Sði; j2Þ; . . . ; Sði; jnÞ ¼ 0g, where jkis the index of the gallery image corresponding to the kth sorted
similarity score. Under the assumption that, for each query image,
there is one and only one gallery image from the same person, we
call the largest similarity score the “matching” score and the
remaining similarity scores “nonmatching” scores.
3.2 Perfect Recognition
Given all the intrinsic factors of an FR system, including gallery
images and algorithm parameters, its performance depends only
upon the extrinsic factors, i.e., characteristics of query images.
Empirical evaluation methods require a large set of query images
with ground truth to evaluate the performance, and the resulting
analysis cannot generalize to images taken under different
environments. In this work, we utilize statistical analysis of
similarity scores to characterize the relationship between the
intrinsic factors of an FR system and its performance under different
environments. To this end, the concept of “perfect recognition” is
introduced.
In “perfect recognition,” the gallery setG is duplicated to produce
the query setQ, i.e.,Q ¼ G ¼ fg1; . . . ; gng. The “perfect recognition”
uses the duplicated set for recognition, and obtains similarity scores
of the each query image xi: Si ¼ fSðgi; g1Þ; Sðgi; g2Þ; . . . ; Sðgi; gnÞg,i ¼ 1; . . . ; n. Such similarity scores are called “Perfect Recognition
Similarity Scores” (PRSS). For simplicity, the normalized and sorted
PRSS are also denoted as fSði; j1Þ; . . . ; Sði; jnÞg, i ¼ 1; . . . ; n, where
Sði; jkÞ corresponds to the kth largest perfect recognition similarity
score in Si. Since PRSS encode information of all the intrinsic factors
affecting the FR system performance, including gallery images and
FR algorithms, they can be used to model the part of the FR’s
performance due to intrinsic factors.
3.3 Performance Metric from Similarity Scores
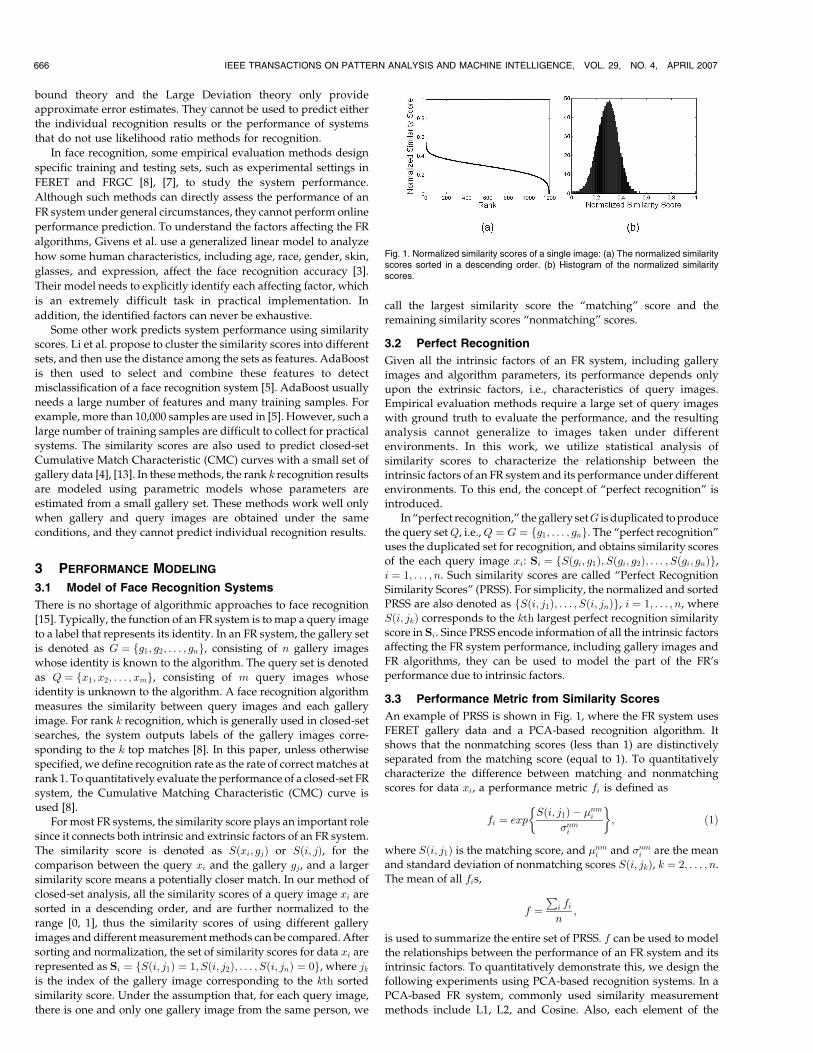
An example of PRSS is shown in Fig. 1, where the FR system uses
FERET gallery data and a PCA-based recognition algorithm. It
shows that the nonmatching scores (less than 1) are distinctively
separated from the matching score (equal to 1). To quantitatively
characterize the difference between matching and nonmatching
scores for data xi, a performance metric fi is defined as
fi ¼ expSði; j1Þ � �nmi
�nmi
� �; ð1Þ
where Sði; j1Þ is the matching score, and �nmi and �nmi are the mean
and standard deviation of nonmatching scores Sði; jkÞ, k ¼ 2; . . . ; n.
The mean of all fis,
f ¼P
i fin
;
is used to summarize the entire set of PRSS. f can be used to model
the relationships between the performance of an FR system and its
intrinsic factors. To quantitatively demonstrate this, we design the
following experiments using PCA-based recognition systems. In a
PCA-based FR system, commonly used similarity measurement
methods include L1, L2, and Cosine. Also, each element of the
666 IEEE TRANSACTIONS ON PATTERN ANALYSIS AND MACHINE INTELLIGENCE, VOL. 29, NO. 4, APRIL 2007
Fig. 1. Normalized similarity scores of a single image: (a) The normalized similarityscores sorted in a descending order. (b) Histogram of the normalized similarityscores.
subspace feature vector can be normalized by its corresponding
standard deviation in the PCA subspace such that the similarity is
measured in the Mahalanobis space [2]. Therefore, the parameters
can be the dimension of subspace (dim), the measurement methods
(L1, L2, or Cosine measurements), and the measurement space
(“Euclidean” or “Mahalanobis”). In the following experiments,
parameters of the recognition algorithm are varied and f is
calculated for each set of parameters using only gallery data. The
actual recognition rates ð�Þ using each set of parameters are
computed using different query sets in FERET and FRGC, as shown
in Fig. 2.
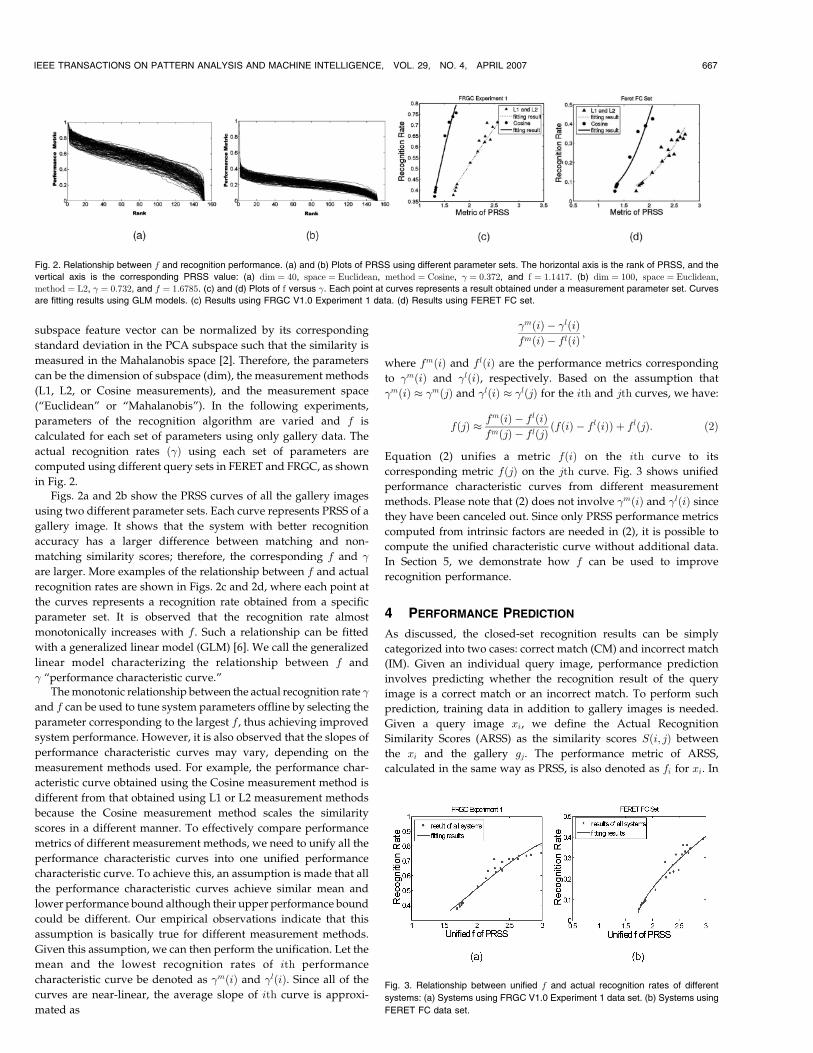
Figs. 2a and 2b show the PRSS curves of all the gallery images
using two different parameter sets. Each curve represents PRSS of a
gallery image. It shows that the system with better recognition
accuracy has a larger difference between matching and non-
matching similarity scores; therefore, the corresponding f and �
are larger. More examples of the relationship between f and actual
recognition rates are shown in Figs. 2c and 2d, where each point at
the curves represents a recognition rate obtained from a specific
parameter set. It is observed that the recognition rate almost
monotonically increases with f . Such a relationship can be fitted
with a generalized linear model (GLM) [6]. We call the generalized
linear model characterizing the relationship between f and
� “performance characteristic curve.”The monotonic relationship between the actual recognition rate �
and f can be used to tune system parameters offline by selecting the
parameter corresponding to the largest f , thus achieving improved
system performance. However, it is also observed that the slopes of
performance characteristic curves may vary, depending on the
measurement methods used. For example, the performance char-
acteristic curve obtained using the Cosine measurement method is
different from that obtained using L1 or L2 measurement methods
because the Cosine measurement method scales the similarity
scores in a different manner. To effectively compare performance
metrics of different measurement methods, we need to unify all the
performance characteristic curves into one unified performance
characteristic curve. To achieve this, an assumption is made that all
the performance characteristic curves achieve similar mean and
lower performance bound although their upper performance bound
could be different. Our empirical observations indicate that this
assumption is basically true for different measurement methods.
Given this assumption, we can then perform the unification. Let the
mean and the lowest recognition rates of ith performance
characteristic curve be denoted as �mðiÞ and �lðiÞ. Since all of the
curves are near-linear, the average slope of ith curve is approxi-
mated as
�mðiÞ � �lðiÞfmðiÞ � flðiÞ ;
where fmðiÞ and flðiÞ are the performance metrics corresponding
to �mðiÞ and �lðiÞ, respectively. Based on the assumption that
�mðiÞ � �mðjÞ and �lðiÞ � �lðjÞ for the ith and jth curves, we have:
fðjÞ � fmðiÞ � flðiÞfmðjÞ � flðjÞ ðfðiÞ � f
lðiÞÞ þ flðjÞ: ð2Þ
Equation (2) unifies a metric fðiÞ on the ith curve to its
corresponding metric fðjÞ on the jth curve. Fig. 3 shows unified
performance characteristic curves from different measurement
methods. Please note that (2) does not involve �mðiÞ and �lðiÞ since
they have been canceled out. Since only PRSS performance metrics
computed from intrinsic factors are needed in (2), it is possible to
compute the unified characteristic curve without additional data.
In Section 5, we demonstrate how f can be used to improve
recognition performance.
4 PERFORMANCE PREDICTION
As discussed, the closed-set recognition results can be simply
categorized into two cases: correct match (CM) and incorrect match
(IM). Given an individual query image, performance prediction
involves predicting whether the recognition result of the query
image is a correct match or an incorrect match. To perform such
prediction, training data in addition to gallery images is needed.
Given a query image xi, we define the Actual Recognition
Similarity Scores (ARSS) as the similarity scores Sði; jÞ between
the xi and the gallery gj. The performance metric of ARSS,
calculated in the same way as PRSS, is also denoted as fi for xi. In
IEEE TRANSACTIONS ON PATTERN ANALYSIS AND MACHINE INTELLIGENCE, VOL. 29, NO. 4, APRIL 2007 667
Fig. 2. Relationship between f and recognition performance. (a) and (b) Plots of PRSS using different parameter sets. The horizontal axis is the rank of PRSS, and the
vertical axis is the corresponding PRSS value: (a) dim ¼ 40, space ¼ Euclidean, method ¼ Cosine, � ¼ 0:372, and f ¼ 1:1417. (b) dim ¼ 100, space ¼ Euclidean,
method ¼ L2, � ¼ 0:732, and f ¼ 1:6785. (c) and (d) Plots of f versus �. Each point at curves represents a result obtained under a measurement parameter set. Curves
are fitting results using GLM models. (c) Results using FRGC V1.0 Experiment 1 data. (d) Results using FERET FC set.
Fig. 3. Relationship between unified f and actual recognition rates of different
systems: (a) Systems using FRGC V1.0 Experiment 1 data set. (b) Systems using
FERET FC data set.

fact, PRSS can be seen as a special case of ARSS since the query set
in perfect recognition is the duplication of the gallery set.
In our method, the differences between the ARSS and its
corresponding PRSS are used as features for individual recognition
result prediction. Mathematically, the similarity score difference
vector D1xi
of the rank 1 recognition is defined as:
d1kðxiÞ ¼ Sði; jkÞ � S0ðj1; jkÞD1xi¼ d1
1ðxiÞw1; . . . ; d1nðxiÞwn
� �;
ð3Þ
where Sði; jkÞ is the kth score of ARSS. To prevent confusion
between PRSS and ARSS, we use S0ðj1; jkÞ to denote the kth score
of PRSS corresponding to a rank 1 recognition result, where jk is
the index of the gallery image corresponding to the kth sorted
similarity score and n is the total number of gallery images. The
difference of kth similarity score d1kðxiÞ is smoothed by a weight wk
to emphasize the scores of the first several ranks since they are
more important for recognition. In our work, wk is defined as
wk ¼ exp�ðk� 1Þ2
2�2r
( );
where �r is set as 20.Besides D1
xi, we also include the differences at more recognition
ranks to expand a feature vector for performance prediction. At the
rank m, the difference vector is Dmxi¼ fdm1 ðxiÞw1; . . . ; dmn ðxiÞwng,
where dmk ðxiÞ ¼ Sði; jkÞ � S0ðjm; jkÞ. S0ðjm; jkÞ is the corresponding
perfect recognition similarity score at the rank m. The extracted
feature vector V is then defined as in (4):
V ¼ ðd11ðxiÞw1; . . . ; d1
KðxiÞwK; d21ðxiÞw1; . . . ;
d2KðxiÞwK; . . . ; dm1 ðxiÞw1; . . . ; dmKðxiÞwKÞ:
ð4Þ
In the feature vector V, the differences between ARSS and PRSS at
the firstM ranks are used, and within each rank, only the difference
of the firstK scores are used. So, totally, there areM �K elements in
the feature vector. Given such defined features, a Support Vector
Machine (SVM) is trained using collected training data to predict the
face recognition result of the individual query image as either a
correct match or an incorrect match.The algorithm of performance prediction is summarized in
Table 1. It needs to be noted that when predicting incorrectly, the
performance predictor could commit two kinds of mistakes: false
positive and false negative. False positive is defined as an incorrect
prediction that classifies an incorrect match as a correct match. The
false negative, on the other hand, is defined as an incorrect
prediction that classifies a correct match as an incorrect match.
5 EXPERIMENTS
Two face databases, FERET [8] and FRGC V1.0 [7], are used in our
experiments. FERET uses a fixed gallery image set and different
query image sets to study recognition performance under changes
of facial expressions (FB), illumination (FC), and age (Dup1). In
FRGC Experiment 1, both gallery and query images are taken under
controlled environments while query images in Experiment 4 are
taken under much less controlled conditions of lighting, pose angle,
and facial expression. We apply a PCA-based recognition method,
in which each face is normalized to the size of 45� 30 pixels. The
pixel intensity is further normalized by histogram equalization. In
the following experiments, we show, respectively, the results of
offline parameter tuning using performance modeling, recognition
result prediction, and online face alignment refinement.
5.1 Offline Parameter Selection
For the first experiment, the performance characteristic curves for
different measurement methods are first unified into one curve by
the linear correction describ ed in Section 3.3, and the parameter set
corresponding to the largest unified f is selected as the optimal
parameter set. As a result, the selected parameter set for FERET is
[200, Cosine, Mahalanobis], which means that the system uses
200 PCA coefficients, the Cosine measurement method, and the
Mahalanobis space. The parameter set selected for FRGC V1.0
Experiments 1 and 4 is [120, Cosine, Mahalanobis]. To verify the
optimality of the selected parameters, we exhaustively test the
recognition rates of all possible parameters, and compare them with
the recognition rates of selected parameter sets, as summarized in
Table 2, which also shows the parameters corresponding to maximal
actual recognition rate. From the table, we can observe that different
query sets need different parameters to achieve the best recognition
rate. However, the offline selected parameters can achieve near-
optimal accuracy for different query sets acquired under different
environments. This is even true for the data sets with large accuracy
ranges, such as FERET FC. This experiment demonstrates the
optimality of the selected parameter set only using gallery images,
as well as its capability of generalization to different query sets.
668 IEEE TRANSACTIONS ON PATTERN ANALYSIS AND MACHINE INTELLIGENCE, VOL. 29, NO. 4, APRIL 2007
TABLE 1Performance Prediction Algorithm
TABLE 2Summary of Offline Parameter Selection
5.2 Recognition Result Prediction
The following experiments demonstrate how our method predicts
individual recognition results, and improves recognition perfor-
mance. The difference values between ARSS and PRSS are extracted
to train a performance predictor (e.g., SVM) to classify individual
recognition results as either a correct match or an incorrect match.
We validate the performance predictor through a cross-validation,
in which 50 percent data is used for training, and the remaining
50 percent is used for validation. To assess the generalization
capability of the performance predictor, two types of cross-
validation methods, i.e., intraset and interset validation methods,
are applied. In the intraset validation method, all the query sets are
merged into one query set. The training data is uniformly sampled
from the merged set, and then the predictor is validated on the
remaining data of the merged set. In the interset validation method,
the predictor is trained using data selected from only some of the
sets, and is validated on the other sets. For example, when using
FERET data sets, the predictor is trained with data from the FB (or
FC and Dup1) set, and validated on the FC and Dup1 (or FB) sets.
When using FRGC V1.0 data sets, the predictor is trained on the
Experiment 1 (or the Experiment 4 ) set, and validated on the
Experiment 4 (or the Experiment 1) set. The intraset validation
method assumes that the testing data is obtained from the same
environment as the training data while the interset validation
method simulates the situation where the training and testing data
are acquired from different environments.
The false positive rates and false negative rates of the
performance predictor are summarized in Table 3 for both intraset
and interset validation. The overall error rate of the performance
predictor is between 15 percent and 25 percent for FERET sets and
FRGC Experiment 1 while FRGC Experiment 4 shows worse
accuracy. Table 3 shows that the accuracy of the interset validation
is only slightly worse than the accuracy of the intraset validation,
which demonstrates that this prediction method is not constrained
in a specific environment, but can be applied in various environ-
ments after the predictor has been trained.Since the performance predictor can identify the query images
that are most likely mismatched by an FR system, such actions can
be taken with respect to these images as reacquiring them or fusing
multiple recognition modalities. For this study, only the images
predicted to result in correct matches will be preserved for
recognition; therefore, improving the overall system performance.
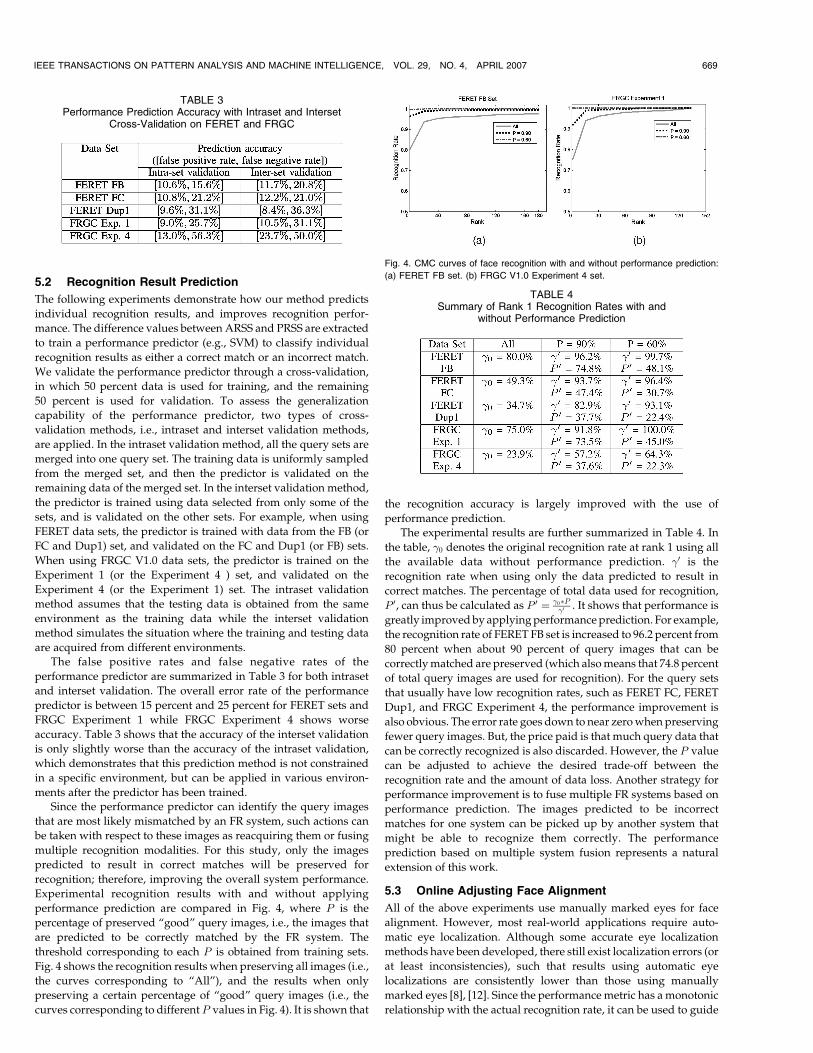
Experimental recognition results with and without applying
performance prediction are compared in Fig. 4, where P is the
percentage of preserved “good” query images, i.e., the images that
are predicted to be correctly matched by the FR system. The
threshold corresponding to each P is obtained from training sets.
Fig. 4 shows the recognition results when preserving all images (i.e.,
the curves corresponding to “All”), and the results when only
preserving a certain percentage of “good” query images (i.e., the
curves corresponding to different P values in Fig. 4). It is shown that
the recognition accuracy is largely improved with the use of
performance prediction.
The experimental results are further summarized in Table 4. In
the table, �0 denotes the original recognition rate at rank 1 using all
the available data without performance prediction. �0 is the
recognition rate when using only the data predicted to result in
correct matches. The percentage of total data used for recognition,
P 0, can thus be calculated as P 0 ¼ �0�P�0 . It shows that performance is
greatly improved by applying performance prediction. For example,
the recognition rate of FERET FB set is increased to 96.2 percent from
80 percent when about 90 percent of query images that can be
correctly matched are preserved (which also means that 74.8 percent
of total query images are used for recognition). For the query sets
that usually have low recognition rates, such as FERET FC, FERET
Dup1, and FRGC Experiment 4, the performance improvement is
also obvious. The error rate goes down to near zero when preserving
fewer query images. But, the price paid is that much query data that
can be correctly recognized is also discarded. However, the P value
can be adjusted to achieve the desired trade-off between the
recognition rate and the amount of data loss. Another strategy for
performance improvement is to fuse multiple FR systems based on
performance prediction. The images predicted to be incorrect
matches for one system can be picked up by another system that
might be able to recognize them correctly. The performance
prediction based on multiple system fusion represents a natural
extension of this work.
5.3 Online Adjusting Face Alignment
All of the above experiments use manually marked eyes for face
alignment. However, most real-world applications require auto-
matic eye localization. Although some accurate eye localization
methods have been developed, there still exist localization errors (or
at least inconsistencies), such that results using automatic eye
localizations are consistently lower than those using manually
marked eyes [8], [12]. Since the performance metric has a monotonic
relationship with the actual recognition rate, it can be used to guide
IEEE TRANSACTIONS ON PATTERN ANALYSIS AND MACHINE INTELLIGENCE, VOL. 29, NO. 4, APRIL 2007 669
TABLE 3Performance Prediction Accuracy with Intraset and Interset
Cross-Validation on FERET and FRGC
Fig. 4. CMC curves of face recognition with and without performance prediction:
(a) FERET FB set. (b) FRGC V1.0 Experiment 4 set.
TABLE 4Summary of Rank 1 Recognition Rates with and
without Performance Prediction

the adjustment of the initial eye positions, whether automatically or
manually marked, for better recognition. Assuming that there are
k-pairs of eye position candidates, the performance metric fi is
calculated for the query face image which is aligned using the
ith eye-pair candidate. The eye-pair candidate producing the
highest fi is selected for face alignment prior to providing
recognition results.
In the following experiments, for each eye, nine candidate eye
positions (the initial eye position plus its eight neighbors) are
searched. Table 5 compares the recognition rates of using the
original eye and adjusted eye positions, where the automatic eyedetection method described in [12] is used. It is observed that the
face recognitions of using adjusted eyes outperform those of using
initial eye position estimates. Also, the eye locations adjusted from
automatic eye locations provide better recognition rates than those
of manually marked eyes. These experiments demonstrate that the
manually marked eyes do not always provide the best face
alignment for recognition, and that face recognition performance
can be improved with the use of our presented face alignment
adjustment method.
6 SUMMARY
In this paper, we present our work on performance modeling and
prediction of face recognition systems based on the analysis of
similarity scores. We introduce the concept of “perfect recognition”
and derive a performance metric based on the perfect recognition
similarly scores to model the relationships between the intrinsic
factors of an FR system and its performance. The performance
metric is subsequently used to tune the FR system parametersoffline. The performance metric calculated from query images can
be used to adjust face alignment online for improved recognition
accuracy. By comparing the perfect recognition similarity scores
with the actual recognition similarity scores, we present a method to
predict the recognition results of individual query data. Experi-
mental results demonstrate that the methods provide various ways
to improve the performance of face recognition systems. While our
method is not specifically designed for the PCA method, its
applicability to other FR methods need be studied. One future
work will be further validation of our method with additional data
sets and with different recognition methodologies. Another future
work is to extend the proposed methods to databases that containmultiple gallery and query images for each face. We also plan to
apply the methods to other biometric systems, such as fingerprint
and iris recognition.
ACKNOWLEDGMENTS
The research described in this paper is supported in part by a grant
(N41756-03-C-4028) to Rensselaer Polytechnic Institute from the
Task Support Working Group (TSWG) of the United States.
REFERENCES
[1] Anon, “Face Recognition Vendor Test,” 2006.[2] R. Beveridge, D. Bolme, M. Teixeira, and B. Draper, “The CSU Face
Identification Evaluation System User’s Guide: Version 5.0,” ComputerScience Dept., Colorado State Univ., May 2003.
[3] G. Givens, J.R. Beveridge, B.A. Draper, P. Grother, and P.J. Phillips, “HowFeatures of the Human Face Affect Recognition: A Statistical Comparison ofThree Face Recognition Algorithms,” Proc. IEEE Int’l Conf. Computer Visionand Pattern Recognition, vol. 2, 2004.
[4] A.Y. Johnson, J. Sun, and A.F. Bobick, “Using Similarity Scores from a SmallGallery to Estimate Recognition Performance for Larger Galleries,” Proc.IEEE Int’l Workshop Analysis and Modeling of Faces and Gestures, pp. 100-103,2003.
[5] W. Li, X. Gao, and T.E. Boult, “Predicting Biometric System Failure,” Proc.IEEE Int’l Conf. Computational Intelligence for Homeland Security and PersonalSafety, pp. 57-64, 2005.
[6] P. McCullagh and J.A. Nelder, Generalized Linear Models, second ed.Chapman & Hall/CRC, 1989.
[7] P.J. Phillips, P.J. Flynn, T. Scruggs, K.W. Bowyer, J. Chang, K. Hoffman, J.Marques, J. Min, and W. Worek, “Overview of the Face Recognition GrandChallenge,” Proc. IEEE Int’l Conf. Computer Vision and Pattern Recognition,pp. 947-954, 2005.
[8] P.J. Phillips, H. Moon, S.A. Rizvi, and P.J. Rauss, “The FERET EvaluationMethodology for Face-Recognition Algorithms,” IEEE Trans. PatternAnalysis and Machine Intelligence, vol. 22, no. 10, pp. 1090-1104, Oct. 2000.
[9] N.A. Schmid, B. Cukic, M. Ketkar, and H. Singh, “Performance Analysis ofIris Based Identification System at the Matching Score Level,” Proc. Int’lConf. Acoustics, Speech, and Signal Processing, vol. 2, pp. 93-96, 2005.
[10] N.A. Schmid and J.A. O’Sullivan, “Performance Prediction Methodologyfor Biometric Systems Using a Large Deviations Approach,” IEEE Trans.Signal Processing, vol. 52, no. 10, pp. 3036-3045, 2004.
[11] E. Tabassi, C.L. Wilson, and C.L. Watson, “Fingerprint Image Quality,”Technical Report NISTIR 7151, Nat’l Inst. of Standards and Technology,2004.
[12] P. Wang, M.B. Green, Q. Ji, and J. Wayman, “Automatic Eye Detection andits Validation,” Proc. IEEE Workshop Face Recognition Grand ChallengeExperiments, 2005.
[13] R. Wang and B. Bhanu, “Learning Models for Predicting RecognitionPerformance,” Proc. IEEE Int’l Conf. Computer Vision, 2005.
[14] Biometric Systems Technology, Design and Performance Evaluation, J. Wayman,A. Jain, D. Maltoni, and D. Maio, eds. Springer, 2005.
[15] W. Zhao, R. Chellappa, P.J. Philips, and A. Rosenfeld, “Face Recognition: ALiterature Survery,” ACM Computing Survey, vol. 35, pp. 399-458, 2003.
. For more information on this or any other computing topic, please visit ourDigital Library at www.computer.org/publications/dlib.
670 IEEE TRANSACTIONS ON PATTERN ANALYSIS AND MACHINE INTELLIGENCE, VOL. 29, NO. 4, APRIL 2007
TABLE 5Summary of Rank 1 Recognition Rate with Adjusted Eyes


