
i
MODELING OF FUEL CELL VEHICLE BASED ON PHYSICAL MODEL OF DIFFERENT
COMPONENTS IN MATLAB/SIMULINK
MR.PIPAT TANGSIRIPAISAN
A THESIS SUBMITTED IN PARTIAL FULFILMENT OF THE REQUIREMENTS
FOR THE DEGREE OF MASTER OF SCIENCE
IN AUTOMOTIVE ENGINEERING
SIRINDHORN INTERNATIONAL THAI-GERMAN GRADUATE SCHOOL OF ENGINEERING
(TGGS)
GRADUATE COLLEGE
KING MONGKUT’S INSTITUTE OF TECHNOLOGY NORTH BANGKOK
ACADEMIC YEAR 2007
COPYRIGHT OF KING MONGKUT’S INSTITUTE OF TECHNOLOGY NORTH BANGKOK
ii
Name : Mr. Pipat Tangsiripaisan Thesis Title : Modeling of Fuel Cell Vehicle Based on Physical Model of
Different Components in Matlab/Simulink Major Field : Automotive Engineering King Mongkut’s Institute of Technology North Bangkok Thesis Advisor : Professor Dr. –Ing. habil. Jan-Welm Biermann Academic Year : 2007
Abstract As the resources of crude oil decrease more and more, alternative propulsion
systems have to be found. Fuel cell systems offer clean and efficient energy production and are currently under intensive development by several manufacturers for both stationary and mobile applications. The viability, efficiency and robustness of this technology depend on understanding, predicting and controlling the unique transient behaviour of the fuel cell systems. Furthermore, simulations support the investigation and development of specific control strategies.
Within this thesis a global model of a fuel cell vehicle based on physical models of the different components has to be developed. This model is based on a pure hydrogen fuel cell system powered by a 80 kW direct hydrogen PEMFC. Some of needed model are already available and have to be adjusted for the implementation into a global model. Missing component models have to be developed within this thesis. Two different models of fuel cell stacks are available at Institut für Krafahrwesen Aachen (IKA). These models have to be compared and the use for the global model has to be verified. The transient behaviour captured in the model should include flow characteristics, inertia dynamics, lumped volume manifold filling dynamics, reactant pressure and reactor temperatures.
(Total 69 pages)
Keywords : Fuel cell, Hybrid, Battery, Supercapacitor, transient behavior, control strategy
______________________________________________________________Advisor

iii
ชอ : นายพพฒน ตงสรไพศาล ชอวทยานพนธ : การจาลองรถยนตขบเคลอนดวยระบบกาเนดไฟฟาทใช
ออกซเจนและไฮโดรเจนแบบรวมสองแหลงพลงงาน โดยใชพนฐานจากการจาลองทางกายภาพของสวนประกอบทงหมดในรถยนต โดยใชโปรแกรม Matlab/Simulink
สาขาวชา : วศวกรรมยานยนต สถาบนเทคโนโลยพระจอมเกลาพระนครเหนอ อาจารยทปรกษาวทยานพนธหลก : ศาสตราจารย ดร. Jan-Welm Biermann
ปการศกษา : 2550
บทคดยอ ในขณะทโลกเรากาลงพฒนา นามนซงถอเปนพลงงานหลกกาลงลดลงเรอยๆ พลงงาน
ทางเลอกใหม เชน การกาเนดพลงงานไฟฟาจากออกซเจนและไฮโดรเจน (Fuel Cells) ถกนามาศกษาอยางจรงจง ทงการใชงานประจาตามสถานทตางๆ และใชงานบนยานพาหนะ เนองมาจากประสทธภาพทสงและเปนพลงงานทสะอาด การเขาใจถงพฤตกรรมตอบสนอง การควบคมรวมถงการทานายพฤตกรรมจะชวยพฒนา ประสทธภาพ ความทนทาน และความตอเนองของพลงงาน การเรยนรและพฒนาขนแรก สามารถทาไดโดยการจาลองการทางาน โดยอาศยการคานวณซงจะสนบสนนเหตผลและยทธวธการในการควบคม
วทยานพนธนจะพฒนาการจาลองพฤตกรรมของยานยนตพลงงานไฮโรเจน โดยมพนฐานจากการคานวณทางกายภาพของสวนประกอบตางๆ โดยพจารณารถยนตพลงงานไฮโดรเจนโดยใชโพลเมอรแยกกระแสไฟฟาขนาด 80 กโลวตต สวนประกอบหลกของการจาลองไดถกพฒนาขนภายใตโครงการ HyTRAN เรยบรอยแลว สวนประกอบทขาดจะถกสรางขนในวทยานพนธฉบบน นอกจากนการจาลองการทางานของแหลงพลงงานไฮโดรเจนทแตกตางกนสองการจาลอง จะถกเปรยบเทยบถงขอดและขอเสย และนาไปใชในการวเคราะหระบบการทางานแบบรวมสองแหลงพลงงาน (Hybrid) โดยคานงถงพฤตกรรมการเคลอนทแบบไมคงท ความดน และอณหภมของอากาศและไฮโดรเจน
(วทยานพนธมจานวนทงสน 69 หนา) คาสาคญ : แหลงพลงงานจากไฮโดรเจนและออกซเจน, พลงงานรวมตงแตสองแหลงพลงงาน,
แบตเตอรร, ซปเปอรคารปาซเตอร, พฤตกรรมไมคงท, ยทธวธในการควบคม
_____________________________________________อาจารยทปรกษาวทยานพนธหลก

iv
ACKNOWLEDGEMENTS
I would like to thank and express my sincere graduate to Professsor Dr. -Ing. habil. Jan-Welm Biermann and Assistant Professor Dr. Saiprasit Koetniyom for their advice and guidance. I have learned an immense amount of knowledge in one year. It has been my most productive year. I also would like to thank my advisors, Dipl -Ing Jan Hammer and Dipl –Ing Kai Scholz-Starke, for their helpful guidance and suggestion at Institut für Krafahrwesen Aachen (IKA). I greatly appreciate the support from the DAAD and TGGS Scholarship that gave me a wonderful chance to do my master thesis at RWTH-Aachen University. Pipat Tangsiripaisan

v
TABLE OF CONTENTS
Page
Abstract (in English) ii Abstract (in Thai) iii Acknowledgements iv List of Tables vi List of Figures vii List of Abbreviations and Symbols ix Chapter 1 Introduction 1 1.1 Introduction 1 1.2 Objective 1 1.3 Scope of study 1 1.4 Impact of benefits from research 2 1.5 Literature Review 2 Chapter 2 Fuel cell system 4 2.1 Basic theory of fuel cell 4 2.2 Fuel cell propulsion 6 Chapter 3 Modeling of a fuel cell vehicle 8 3.1 HyTRAN-TP1 global model 8 3.2 Comparison of IKA and Pukrushpan fuel cell stack model 11 3.3 Summary of the global model 22 Chapter 4 Modeling of a hybrid fuel cell vehicle 23 4.1 Characteristics of battery and supercapacitor 24 4.2 Configurations of fuel cell hybrid powertrains 27 4.3 Control strategy 30 4.4 Global model of hybrid fuel cell vehicle 31 Chapter 5 Simulation 37 5.1 Base power requirement calculations 38 5.2 Simulation input 39 5.3 Simulation output 40 Chapter 6 Conclusion 60 References 61 Appendix A Power DC-DC Converter details 63 Appendix B Cost of Energy Storage 67 Biography 69

vi
LIST OF TABLES
Table Page 4-1 Input and Output for the Power bus model 36 5-1 Assumed parameters for the default vehicle 37 5-2 Study cases comparison 39 5-3 Vehicle Performance 40 5-4 Initial conditions 42 5-5 Power consumption 43 5-6 Energy Storage 52 5-7 Performance comparison on different battery sizes 53 5-8 Performance comparison on different supercapacitor sizes 53 5-9 Fuel economy comparison on different battery sizes 55 5-10 Fuel economy comparison on different supercapacitor sizes 55 5-11 Power consumption of 53kW fuel cell stack 58 5-12 Fuel consumption and System efficiency comparison 59 B-1 Cost of energy storage 68

vii
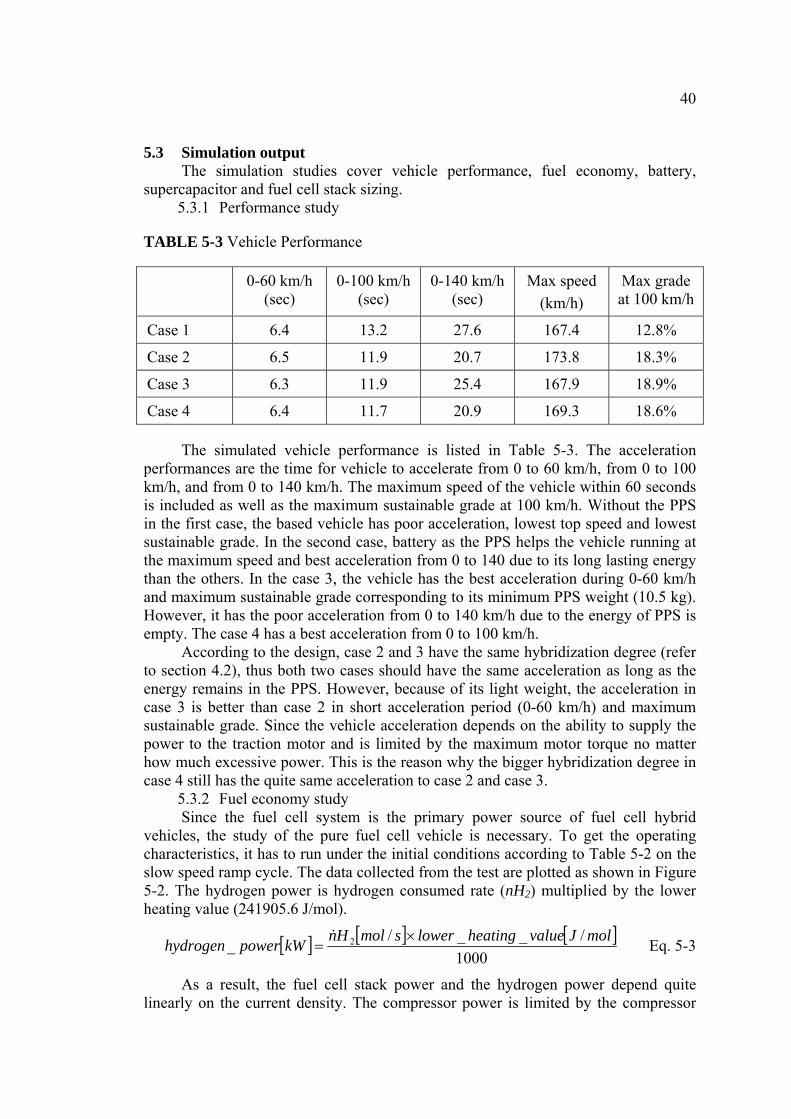
LIST OF FIGURES Figure Page 2-1 Fuel cell diagram 4 2-2 Fuel cell structure 5 2-3 Typical fuel cell polarization curve 6 2-4 Automotive fuel cell propulsion system 6 3-1 HyTRAN-TP1 global model 9 3-2 IKA stack model 12 3-3 Pukrushpan stack model 12 3-4 Static comparison 14 3-5 Voltage drop caused by different types of losses: (a) Activation losses (b) Ohmic losses (c) Concentration losses (d) Total losses 15 3-6 Original polarization curve 16 3-7 Modified 1 polarization curve 16 3-8 Modified 2 polarization curve 16 3-9 Modified Pukrushpan Stack model 17 3-10 IKA Vehicle Speed 18 3-11 Pukrushpan Vehicle Speed 18 3-12 FC Gross Power 19 3-13 Mechanical Power 19 3-14 Compressor Power 20 3-15 Compressor speed 20 3-16 Oxygen Flowrate 21 3-17 Hydrogen Flowrate 21 4-1 Typical operating characteristics of a fuel cell system 23 4-2 Series Hybrid Electric Drivetrain 24 4-3 Battery model 25 4-4 battery charge and discharge efficiency 25 4-5 Comparison of specific energy and power of different energy source 26 4-6 Supercapacitor model 27 4-7 hybrid powertrain: (a) Fuel cell with battery (b) Fuel cell with supercapacitor (c) Fuel cell with Battery and supercapacitor 28 4-8 Powers DC/DC Converter Model 29 4-9 Losses of Motor and Inverter Model 30 4-10 Control strategy flow chart 32 4-11 Global model of hybrid fuel cell vehicle 33 4-12 Electric motor control model in VCU 34 4-13 Electric motor model 34 4-14 Power bus model 35 5-1 Fiat Panda 38 5-2 The system power 41 5-3 The operating characteristics of the pure fuel cell vehicle 42 5-4 Case 1 (fuel cell alone drive) on NEDC 45 5-5 Case 2 (battery 40 modules) on NEDC 45 5-6 Case 3 (supercapacitor 12 cells) on NEDC 46 5-7 Case 4 (supercapacitor 40 cells) on NEDC 46

viii
LIST OF FIGURES (CONTINUED) Figure Page 5-8 Case 1 (fuel cell alone drive) on HYZEM-Highway 47 5-9 Case 2 (battery 40 modules) on HYZEM-Highway 47 5-10 Case 3 (supercapacitor 12 cells) on HYZEM-Highway 48 5-11 Case 4 (supercapacitor 40 cells) on HYZEM-Highway 48 5-12 Case 1 (fuel cell alone drive) on FTP75 49 5-13 Case 2 (battery 40 modules) on FTP75 49 5-14 Case 3 (supercapacitor 12 cells) on FTP75 50 5-15 Case 4 (supercapacitor 40 cells) on FTP75 50 5-16 Case 2 on NEDC from 780 to 1180 sec. 51 5-17 Parametric study for fuel cell-battery hybrid 54 5-18 Parametric study for fuel cell-supercapacitor hybrid 54 5-19 System power for the 53 kW fuel cell stack 56 5-20 System efficiency for the 53 kW fuel cell stack 57 A-1 Power DC-DC Dimension 64 A-2 Power DC-DC Efficiency Map 66
ix
LIST OF ABBREVIATIONS AND SYMBOLS Af = Front area [m2] C = Capacitance of the supercapacitor CD = Aero dynamic drag coefficient c1 = Constant 1 used in activation loss c2 = Constant 2 used in concentration loss c3 = Constant 3 used in concentration loss E = Open circuit voltage [Volt] fr = Rolling resistance coefficient g = gravity HD = Hybridization degree i = Current [Amp] iL = Leakage current [Amp] imax = Constants that depend on the temperature and the reactant partial
pressure k1 = Correction factor 1 k2 = Correction factor 2 m = Vehicle mass [kg] OCV = Open circuit voltage which Pe = Fuel cell stack supplies the base power [kW] PESS = Power of the energy storage device [kW] Pfc = Fuel cell power [kW] Ptot = Total power [kW] Q(i) = Amount of electric charge transported by a current of 1 ampere in 1
second Rint = Internal resistance [Ω] RL = Dielectric resistance [Ω] Rohm = Internal electrical resistance [Ω.cm2] RS = Series resistance [Ω] SOC = State of charge SOC0 = Initial value of SOC v0 = Voltage drop at zero current density [Volt] vact = Activation loss [Volt] vconc = Concentration loss [Volt] vfc = Fuel cell voltage [Volt] vohm = Ohmic loss [Volt] V = Voltage at the battery terminals [Volt] V0 = Thermodynamic voltage [Volt] VC = Electric potential [Volt] Vt = Terminal voltage of a supercapacitor [Volt] ρa = Air density [kg/m3] ηem = Motor average efficiency ηt = Transmission efficient δ = Mass factor
1
CHAPTER 1 INTRODUCTION
1.1 Introduction
Fuel cells are considered to be one of the advanced power sources for automotive applications. Compared with the internal combustion engine (ICE), fuel cells have the advantages of high efficiency and much lower emissions. The efficiency can be three times more than the conventional internal combustion engines because a fuel cell is not subject to the “Carnot cycle” efficiency limit and directly converts the free energy in fuel into electrical energy without any moving parts. Moreover, because there is no CO2 and other harmful emissions, a fuel cell is considered as a clean energy source and the only by product is water. Therefore, many researches and works of fuel cell vehicle are currently developed.
However, compared to internal combustion engine, the pure fuel cell vehicles still have some disadvantages such as a heavy weight, slow power response and long start-up time. To remit these incidents, hybrid concepts are studied and introduced. The easy and fast way is using the simulation technique which is an indirect method of studying the behaviour of systems at the design stage. It also supports the investigation and development of specific control strategies under realistic driving conditions. Based on the HyTRAN-TP1 model, the hybrid system is set up in Matlab/Simulink environment.
1.2 Objective
The objective is to increase the overall performance of the fuel cell vehicle such as heavy weight, slow power response, and fuel economy regarding complexity, cost, dynamics and efficiency.
1.3 Scope of study
Within in this thesis a global model of a fuel cell vehicle based on physical models of the different components has to be developed. This model is based on a pure hydrogen fuel cell system powered by a 80kW direct hydrogen PEMFC. Some of the needed models are already available and have to be adjusted for the implementation into the global model. Missing component models have to be developed within this thesis. Two different models of fuel cell stacks are available at ika. These models have to be compared and the use for the global model has to be verified. The transient behaviour captured in the model should include flow characteristics, inertia dynamics, lumped volume manifold filling dynamics, reactant pressure and reactor temperatures.
Using the developed model as basis, different models of storage systems (battery, supercapacitor) have to be added to the model to reflect a hybrid structure allowing using recuperated energy. The developed hybrid global model and the implemented control strategies have to be evaluated by simulating the behaviour within different drive cycles. The influence of the control strategies on energy consumption and dynamic behaviour has to be investigated.

2
1.4 Impact of benefits from research Fuel cells are widely regarded as a potential alternative stationary and mobile
power source. This study finds out the basic control strategies which can be use as a based document to develop an effective hybrid fuel cell vehicle in the future. Moreover, the developed model can be use for the HyTRAN-TP1 project.
1.5 Literature Review
A comparison of electric, internal combustion engine hybrid and fuel cell vehicle shows that fuel cell vehicles could make to the realisation of sustainable energy in the future [1, 2]. However, to achieve the high performance and efficiency of the fuel cell vehicle, the hybrid system needs to be studied and implemented. [3] shows that, the hybridization allows recuperation of braking energy, reducing fuel consumption by about 11-13%, depending on the drive cycle.
It is known that, the steady-state fuel cell system model is typically used for component sizing, static trade-off analysis, and cumulative fuel consumption or hybridization studies. This model is not suitable for transient behavior and control study; instead the dynamic fuel cell system model is favorably preferred. There are many existing works in fuel cell hybrid vehicle modelling using the simulation technique [4, 5, 6]. However, none of this work considers the dynamic model and transient behaviour of fuel cell system. This is probably due to the computation time and also the availability of appropriate dynamic models of each part. The dynamic model of PEMFC is admirably developed and described in [7]. A good agreement is found between experiments and simulations in [8]. This work also demonstrates the significance and necessary of the dynamic model.
Many of existing works show that the supercapacitor (ultracapacitor) is more suitable than battery in order to assist the fuel cell vehicle [4], [9]. [10] develops the dynamic fuel cell/ultracapacitor hybrid system. With the excellent ultracapacitor assistance, the hybrid system achieve responsive performance in both steady-state and transient operation. However, it still lacks some significant dynamic components, such as a compressor, a cooling system, and an electrical motor.
The good fuel consumption of a fuel cell/battery hybrid vehicle with specific drive cycles is present by the simulation results of [6]. In other words, the ideal minimization of fuel consumption can be achieved only when the driving scenario is known a priori. This journal also shows the systematic framework to optimize the component sizing.
This study presents the hybrid fuel cell global model which consists of the dynamic component models, such as fuel cell stack, compressor, traction motor, drivetrain, and cooling system. The energy storage systems are integrated for allowing regenerative braking energy. Moreover, the basic control strategy is also present to find the improvement of both performance and fuel consumption.
This thesis is divided into six chapters. The first chapter is devoted to Introduction. The second chapter describes some backgrounds concerning the basic theory of fuel cell and the fuel cell propulsion system for automotive application. The third chapter explains the pure fuel cell vehicle model with general components including the control unit. In the fourth chapter not only the needed component models for hybrid fuel cell vehicle but also the control strategy and power bus model are described and integrated into the pure fuel cell vehicle according to Chapter 3.

3
The simulation results are then presented in the fifth chapter revealing the importance of hybridisation and possible improvements. The last chapter then summarizes and suggests some possibilities for further development.

4
CHAPTER 2 FUEL CELL SYSTEM
2.1 Basic theory of fuel cell
The fuel cell is an electrochemical device that converts the chemical energy directly into electricity and heat. A fuel cell consists of an electrolyte located in the middle between two electrodes. Hydrogen gas passes over one electrode (anode) while the air passes over another (cathode). The electrolyte has a special property that allows positive ions (protons) to pass through while blocking electrons.
−+ +⇒ eHH 442 2 Eq. 2-1
The hydrogen protons flow through the electrolyte while the electrons flow through an external circuit (Figure 2-1). The hydrogen protons and electrons combine with oxygen flow through the cathode, and produce water.
OHeHO 22 244 ⇒++ −+ Eq. 2-2
The overall reaction of a fuel cell is
OHOH 222 22 ⇒+ Eq. 2-3
FIGURE 2-1 Fuel cell diagram
Depending on fuel cell operating conditions, the voltage produced from one cell is between 0 to 1 volts [11]. The typical cell operates at 0.7 volt and to get higher voltage, multiple cells are stacked in series. The total stack voltage is number of cells multiplied by the average cell voltage. Like other electric devices, there are electric resistances in the fuel cell. During the reaction, the loss is dissipated in the form of heat.
The fuel cells are distinguished mainly by type of electrolyte used in the cells. The different cell characteristics, such as cell material, operating temperature, and fuel
5
cell diversity, make each type of fuel cell suitable for different applications. In automotive and portable applications, Polymer Electrolyte Membrane Fuel Cell (PEMFC) is considered. The intensive development over the past decade lead PEMFC surpasses all other fuel cells types. Its advantages are high power density, which is over 2 kW/l and 2 W/cm2 [12], long life as well as low corrosion due to a solid electrolyte which provides excellent resistance to gas crossover, safer and rapid start-up because of low operating temperature 40-80 °C.
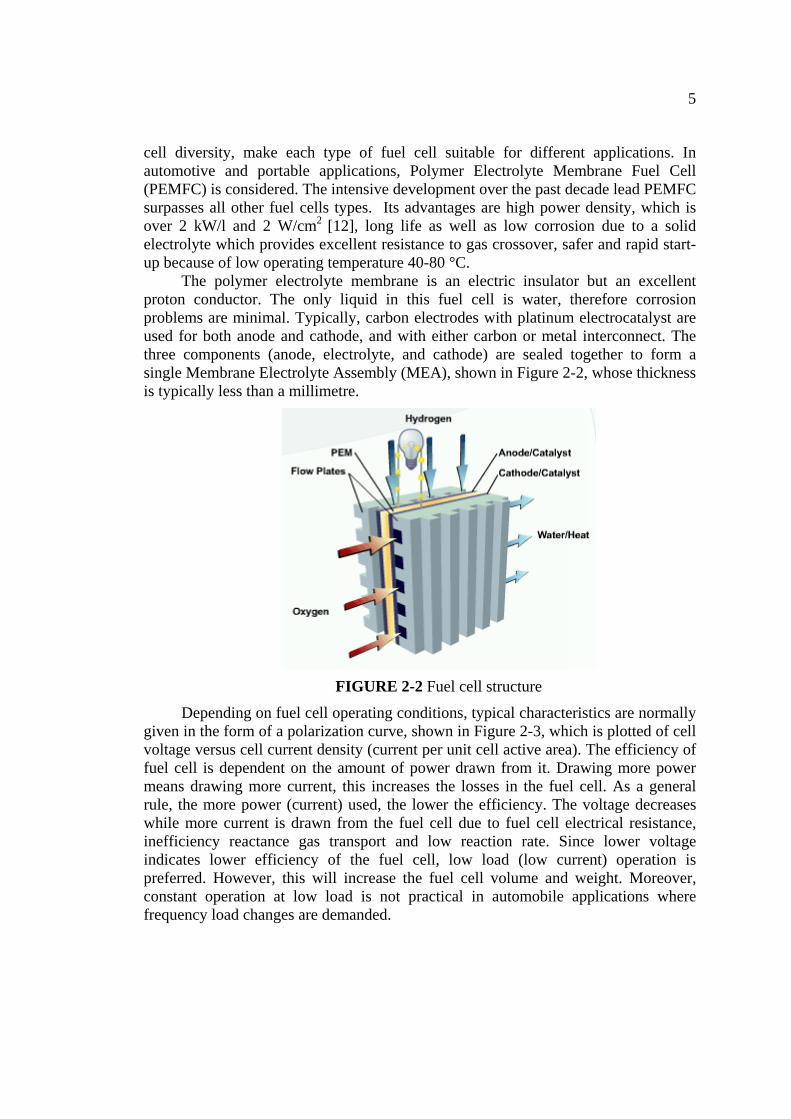
The polymer electrolyte membrane is an electric insulator but an excellent proton conductor. The only liquid in this fuel cell is water, therefore corrosion problems are minimal. Typically, carbon electrodes with platinum electrocatalyst are used for both anode and cathode, and with either carbon or metal interconnect. The three components (anode, electrolyte, and cathode) are sealed together to form a single Membrane Electrolyte Assembly (MEA), shown in Figure 2-2, whose thickness is typically less than a millimetre.
FIGURE 2-2 Fuel cell structure
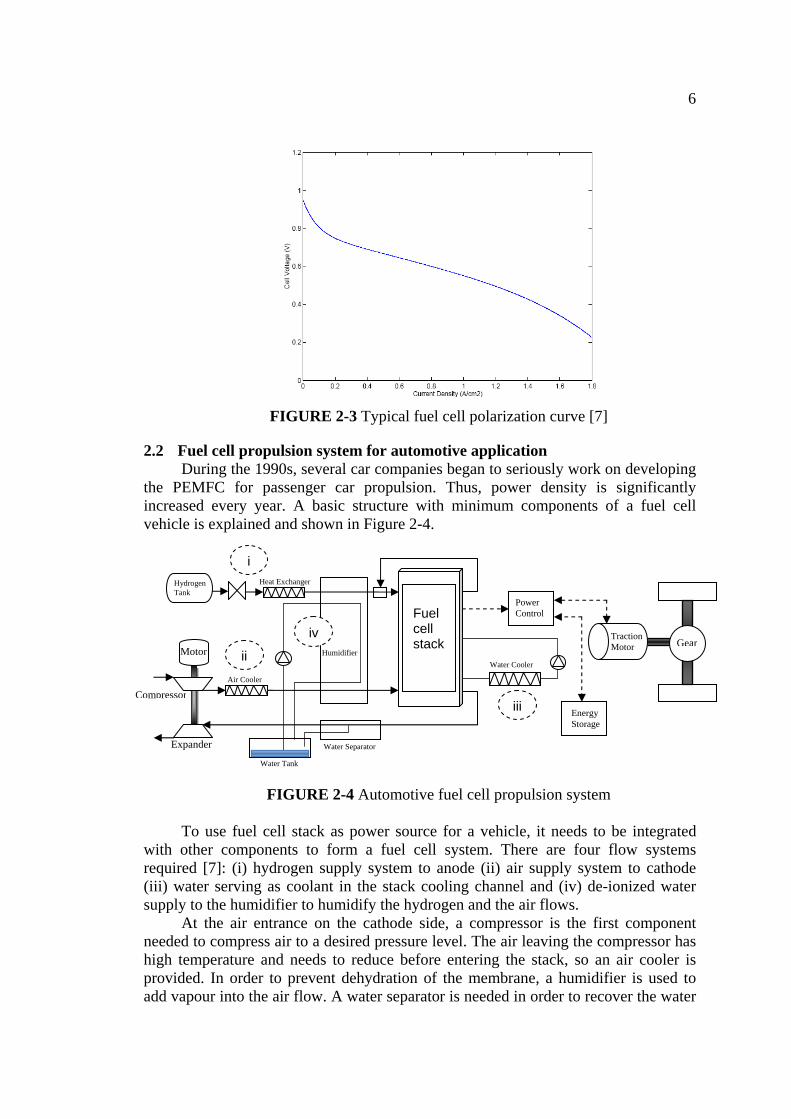
Depending on fuel cell operating conditions, typical characteristics are normally given in the form of a polarization curve, shown in Figure 2-3, which is plotted of cell voltage versus cell current density (current per unit cell active area). The efficiency of fuel cell is dependent on the amount of power drawn from it. Drawing more power means drawing more current, this increases the losses in the fuel cell. As a general rule, the more power (current) used, the lower the efficiency. The voltage decreases while more current is drawn from the fuel cell due to fuel cell electrical resistance, inefficiency reactance gas transport and low reaction rate. Since lower voltage indicates lower efficiency of the fuel cell, low load (low current) operation is preferred. However, this will increase the fuel cell volume and weight. Moreover, constant operation at low load is not practical in automobile applications where frequency load changes are demanded.
6
FIGURE 2-3 Typical fuel cell polarization curve [7]
2.2 Fuel cell propulsion system for automotive application During the 1990s, several car companies began to seriously work on developing
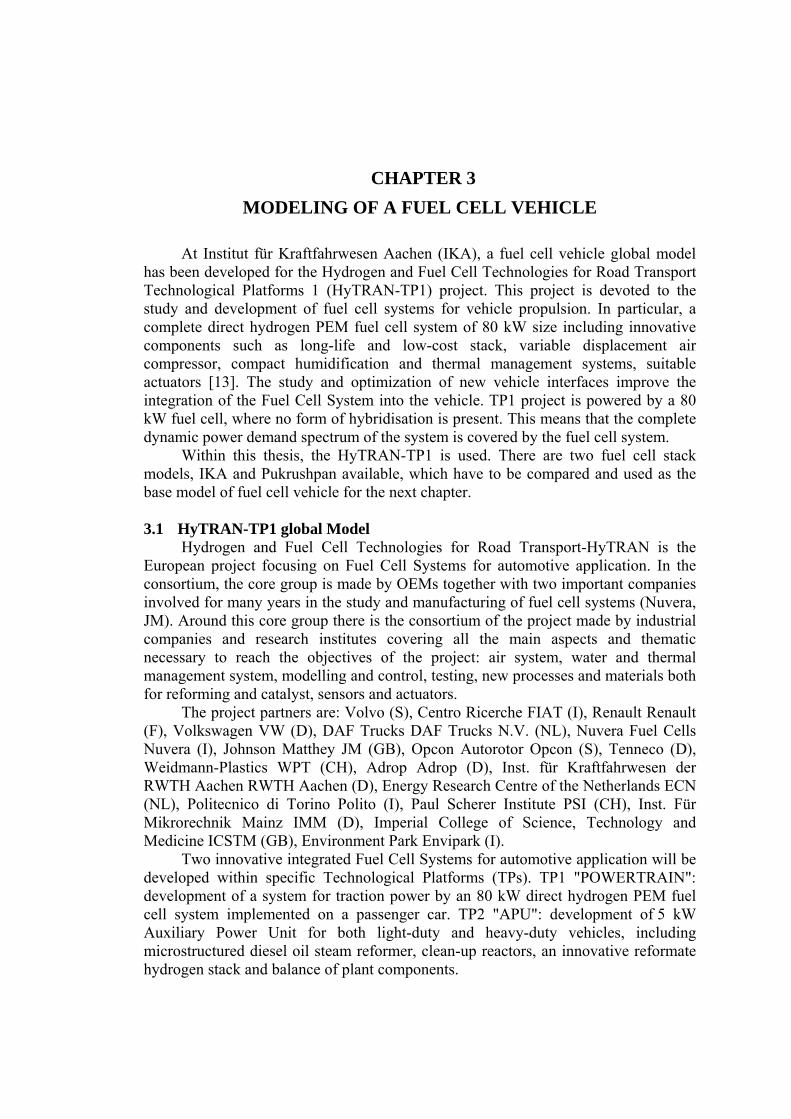
the PEMFC for passenger car propulsion. Thus, power density is significantly increased every year. A basic structure with minimum components of a fuel cell vehicle is explained and shown in Figure 2-4.
FIGURE 2-4 Automotive fuel cell propulsion system To use fuel cell stack as power source for a vehicle, it needs to be integrated
with other components to form a fuel cell system. There are four flow systems required [7]: (i) hydrogen supply system to anode (ii) air supply system to cathode (iii) water serving as coolant in the stack cooling channel and (iv) de-ionized water supply to the humidifier to humidify the hydrogen and the air flows.
At the air entrance on the cathode side, a compressor is the first component needed to compress air to a desired pressure level. The air leaving the compressor has high temperature and needs to reduce before entering the stack, so an air cooler is provided. In order to prevent dehydration of the membrane, a humidifier is used to add vapour into the air flow. A water separator is needed in order to recover the water
Fuel cell stack
i
ii
iv
iii
Motor
Expander
Compressor Air Cooler
Hydrogen Tank
Heat Exchanger
Water Tank
Gear
Water Separator
Traction Motor
Energy Storage
Water Cooler
Power Control
Humidifier

7
from vapour, the only product of the fuel cells which is carried by the air leaving the stack. An integrated expander is the useful component in order to recover energy from the pressurized air exhaust stream and enhance the overall efficiency of the pressurized air supply system.
On the anode side, a hydrogen tank stores pressurized hydrogen or liquid hydrogen and supplies hydrogen to the system. A valve is used to control the flow rate of hydrogen. To control the hydrogen temperature, the heat exchanger is equipped. As same as at the cathode side, a humidifier is also used to add vapour into the hydrogen flow. Since the temperature of the stack must be maintained below 80 °C for proper reaction, the excessive heat released in the fuel cell reaction is controlled by a water coolant. As illustrated in Figure 2-4, the coolant leaving the stack then passes through a heat exchanger or a radiator in order to remove heat from the system.
Finally, a power control gathers the power produced from fuel cell stack and supplies to the traction motor connected to the vehicle drivetrain. In order to perform the vehicle as a hybrid vehicle, a peaking power source, such as battery or supercapacitor is added.
During vehicle operation, various load levels as well as sudden load changes are expected. For fuel cell vehicles to be commercialized, these vehicle operations need to be well handled. During this transient, the control system is required to maintain optimum temperature, membrane hydration, and partial pressure of the reactants in order to avoid detrimental degradation of the fuel cell voltage, and thus, an efficiency reduction and fuel cell life shortening.
8
CHAPTER 3 MODELING OF A FUEL CELL VEHICLE
At Institut für Kraftfahrwesen Aachen (IKA), a fuel cell vehicle global model
has been developed for the Hydrogen and Fuel Cell Technologies for Road Transport Technological Platforms 1 (HyTRAN-TP1) project. This project is devoted to the study and development of fuel cell systems for vehicle propulsion. In particular, a complete direct hydrogen PEM fuel cell system of 80 kW size including innovative components such as long-life and low-cost stack, variable displacement air compressor, compact humidification and thermal management systems, suitable actuators [13]. The study and optimization of new vehicle interfaces improve the integration of the Fuel Cell System into the vehicle. TP1 project is powered by a 80 kW fuel cell, where no form of hybridisation is present. This means that the complete dynamic power demand spectrum of the system is covered by the fuel cell system.
Within this thesis, the HyTRAN-TP1 is used. There are two fuel cell stack models, IKA and Pukrushpan available, which have to be compared and used as the base model of fuel cell vehicle for the next chapter.
3.1 HyTRAN-TP1 global Model
Hydrogen and Fuel Cell Technologies for Road Transport-HyTRAN is the European project focusing on Fuel Cell Systems for automotive application. In the consortium, the core group is made by OEMs together with two important companies involved for many years in the study and manufacturing of fuel cell systems (Nuvera, JM). Around this core group there is the consortium of the project made by industrial companies and research institutes covering all the main aspects and thematic necessary to reach the objectives of the project: air system, water and thermal management system, modelling and control, testing, new processes and materials both for reforming and catalyst, sensors and actuators.
The project partners are: Volvo (S), Centro Ricerche FIAT (I), Renault Renault (F), Volkswagen VW (D), DAF Trucks DAF Trucks N.V. (NL), Nuvera Fuel Cells Nuvera (I), Johnson Matthey JM (GB), Opcon Autorotor Opcon (S), Tenneco (D), Weidmann-Plastics WPT (CH), Adrop Adrop (D), Inst. für Kraftfahrwesen der RWTH Aachen RWTH Aachen (D), Energy Research Centre of the Netherlands ECN (NL), Politecnico di Torino Polito (I), Paul Scherer Institute PSI (CH), Inst. Für Mikrorechnik Mainz IMM (D), Imperial College of Science, Technology and Medicine ICSTM (GB), Environment Park Envipark (I).
Two innovative integrated Fuel Cell Systems for automotive application will be developed within specific Technological Platforms (TPs). TP1 "POWERTRAIN": development of a system for traction power by an 80 kW direct hydrogen PEM fuel cell system implemented on a passenger car. TP2 "APU": development of 5 kW Auxiliary Power Unit for both light-duty and heavy-duty vehicles, including microstructured diesel oil steam reformer, clean-up reactors, an innovative reformate hydrogen stack and balance of plant components.

9
FIGURE 3-1 HyTRAN-TP1 global model
3.1.1 The structure of the HyTRAN-TP1 global model can be divided into three parts.
3.1.1.1 The first part is located at the low of the model called the propulsion system. This part consists of the physical components of vehicle, reduction gear, traction motor, power plant, DC/DC converter, and cooling system.
3.1.1.2 The second part is located at the right side of the model called the control logic. This part contains the control mechanisms for all propulsion system submodels. The different test cycles can be selected in this part.
3.1.1.3 Lastly, in the left side, the simulation part is located. This part deals with general settings, which is composed of data about the general ambient conditions, simulation settings as well as the possibility to manual induce failure events into the system.
3.1.2 The general process of the TP1 model can be summarized below. 3.1.2.1 Driving and Cycle model: It provides the time and driving speed
which works as the vehicle demand of the whole simulation process. Inside the model, the acceleration pedal displacement is created by the PID control comparing between the speed demand and real vehicle speed.
2
1
3

10
3.1.2.2 Control Unit model: The function of this model is to calculate the data gathered from the submodels and provide them back for the entire simulation. Firstly, for the electric motor model, the motor torque demand is linearly proportional to acceleration pedal displacement. Secondly, for the vehicle model, the brake pedal displacement is provided to the vehicle brake model for calculating the resistive torque. Thirdly, for the fuel cell stack model, the oxygen and hydrogen stoichiometry targets are provided. Fourthly, the compressor speed demand is calculated and provided for compressor model. Finally, the hydrogen demand and the cathode pressure are provided to the hydrogen tank model in order to regulate the hydrogen valve.
3.1.2.3 Motor model: To calculate the motor torque, the motor model needs three inputs; namely, the motor torque demand, the electrical voltage and the motor speed. The first input comes from the control unit model while the electrical voltage, and the motor speed are calculated from fuel cell power plant model and reduction gear model respectively.
3.1.2.4 Fuel cell power plant model: This model consists of a dynamical compressor model, a hydrogen supply model, a water tank, and a fuel cell stack model. The fuel cell stack model calculates the air demand and the electrical voltage from the electric motor, compressor and auxiliary current requirements. In order to sufficiently supply air to the cathode side, the compressor model is essential. On the contrary, at the anode side, we assume that the hydrogen tank model is always pressurized and the valve can be accurately adjusted for both volume and pressure.
3.1.2.5 Cooling system: The model is used to release the excessive heat from the heat exchanger from cathode and anode sides, the fuel cell stack, and the losses from electric motor. With a fixed voltage by the DC/DC converter, the power consumption can be expressed as the current.
3.1.2.6 DC/DC converter model: In order to supply the auxiliaries with a unique constant voltage, this model is necessary. The fuel cell stack voltage and the auxiliary currents are inputs while the fixed voltage and the demanded current are outputs.
3.1.2.7 Reduction gear model: As a general function of reduction gear, this model converts the input torque into the appropriate output torque which is proportional to the gear ratio while the output rotational speed decreases. The motor torque and motor inertia comes from the electrical motor model while the reduction gear speed comes from the vehicle model. Three outputs are gear torque, gear inertia, and motor speed. The first two outputs are provided to the vehicle model and another to the electric motor model.
3.1.2.8 Vehicle model: To calculate the vehicle dynamics, the torque and moment of inertia are obtained from the reduction gear model while the brake pedal displacement comes from the control unit model. The mechanical power which measured at traction wheel is calculated from this model. At the output side, the real vehicle speed is provided to the control unit in order to create the displacement of pedal and to the cooling system in order to calculate the mass air flow though radiator.
With cooperative working of all submodels, this global model enables the simulation to perform multiple tasks. Not only the study the system behaviour but also the development the control strategies are favourably supported. By comparing simulated data with measurements, the accuracy of the physical submodels can be

11
verified. Finally, this global model can be used to observe the reaction of the system to failures and to create warning levels and emergency conditions due to the failure inspection model located in the simulation part.
3.2 Comparison of IKA and Pukrushpan fuel cell stack models
One of the tasks is to compare the performance between two fuel cell stack models, IKA and Pukrushpan model. The fuel cell stack model is located in the power plant submodel in the first part on Figure 3-1. The main functions of this model are to calculate the fuel cells stack voltage which used in the propulsion system and the auxiliary system, and to calculate the properties of the substances for both inlet and outlet flow, such as mass flow, pressure, humidity, temperature, and water production.
First of all, the different components and functions of two fuel cell stack models are explained. Both two stacks have to be adjusted to be 80 kW power. The related parameters are the number of cells stacked in series and fuel cell active area. The number of cells is adjusted to be 384 cells and the active area is 360 cm2. Two polarization curves are determined by the static tests and the results will be compared and analyzed. Finally, the dynamic test with NEDC is evaluated.
3.2.1 IKA fuel cell stack model The inputs of IKA fuel cell stack model consist of the properties of hydrogen
from anode and air from cathode, namely molar flowrate, temperature and pressure. The outputs are stack voltage, stack temperature, outlet pressure and outlet substances properties. The stack is composed of three main subsystems; electric, thermodynamic and thermal (Figure 3-2).
3.2.1.1 The electric model calculates the fuel cell stack voltage form 3 parameters, mean pressure, operating temperature and stack current. The calculation is done by interpolation and extrapolation method in the 3-D lookup-table of the experimental data from Nuvera Fuel Cells (a global leader company in development and advancement of multi-fuel processing and fuel cell technology).
3.2.1.2 The thermodynamic model deals with the chemical properties of the media from both cathode and anode sides. Their pressure drops are determined by the assumption of a lumped volume - The volumes along the supply line are lumped into one volume.
3.2.1.3 The thermal model calculates the fuel cell stack temperature by balancing the enthalpy of all media entering and leaving the stack and the heat released from the water cooling system which should be in the range of 60-80 °C.

12
FIGURE 3-2 IKA stack model
FIGURE 3-3 Pukrushpan stack model
13
3.2.2 Pukrushpan fuel cell stack model The Pukrushpan stack model is received from http://www.springer.com. This
model is devoted for noncommercial education and research purposes. System-level dynamic models are derived from the physical principles of processes involved. This dynamic model is not only suitable for control study but also transient behavior analysis.
The inputs and outputs of Pukrushpan stack model are quite similar to IKA model except for the difference in flowrate unit. As shown in Figure 3-3, this stack model is composed of 4 subsystems, Anode mass flow, Cathode mass flow, Membrane water transport and Stack voltage model.
3.2.2.1 The cathode mass flow model represents the air flow behaviour inside the cathode of the fuel cell stack. The model is developed using the mass conservation principle and thermodynamic of air.
3.2.2.2 In the anode mass flow model, hydrogen partial pressure and anode flow humidity are determined by balancing the mass flow of hydrogen and water in the anode. Additionally, the flow channel and the backing layer of all cells are lumped.
3.2.2.3 The membrane water transport represents the water content in the membrane and the rate of mass flow of water across the membrane which are functions of stack current and the relative humidity of the flow inside the anode and cathode flow channel.
3.2.2.4 The fuel cell stack voltage model calculates the voltage which is produced by the fuel cell system. The open circuit voltage of the fuel cell is calculated from the energy balance between chemical energy in the reactants and electrical energy. Three main types of losses; namely, activation, ohmic, and concentration losses in the fuel cell are explained (Equation 4-1).
3.2.3 The difference between IKA and Pukrushpan model are divided into four main differences in the fuel cell stack model.
3.2.3.1 Voltage calculation The Pukrushpan stack model determines the voltage by the calculation which is
the energy balance between chemical energy in the reactants and electrical energy subtracted by three main types of losses, namely activation loss, ohmic loss, and concentration loss (Equation 3-2). The IKA stack model determines the voltage by interpolation and extrapolation method in the lookup-table of Matlab/simulink from the experimental data.
3.2.3.2 Reactants calculation The Pukrushpan stack model uses the mass conservation principle and
thermodynamic of air to calculate the mass flowrate (kg/s). The IKA stack model also uses the same principles but the flowrate results are in the different unit, molar flow (mol/s).
3.2.3.3 Water activity calculation The Pukrushpan stack model has the membrane water transport model which
can predict the dehydration effect in the fuel cell stack. The IKA stack model assumes that the reactants are fully humidified from the humidifier provided before entering the fuel cell stack.
14
3.2.3.4 Temperature calculation The Pukrushpan stack model assumes the ideal cooling system that can control
the temperature without any error, so the stack temperature has been fixed. The IKA stack model calculates the fuel cell stack temperature by balancing the enthalpy of all media entering and leaving the stack and the heat released from the water cooling system.
3.2.4 Static comparison
-K-
kg/s to mol/s
P_Ano_in
K_Ano_in1
nH2O_liq
Out1
Subsystem1
In1
nH2O_liqOut1
Subsystem
Stack voltage
Stack Current
Anode Flow in
Cathode Flow in
Stack Temperature
OM Pressure (Pa)
Anode Flow out
Cathode Flow out
Anode Pressure
Cathode Pressure
O2 Partial Pressure (Pa)
O2 Excess ratio
H2 Excess ratio1
Stack Voltage
Stack Pukrushpan
Scope
4-D T(u)
LookupTable (n-D)
1e5
Gain
I_FC
P,K,n_ano_in
K,ncat_in
K,n_cool_in
Pcat_out (Pa)
U_FC
P,n,Kano_out
P,n,Kcat_out
P,n,K ano H2O liq out
P,n,K cat H2O liq out
Pcat_in
Fuel Cell Stack
2.009
Display9
1.938e+005
Display82.073e+005
Display7
0
332
1.938e+005
0.9364
Display6
0.009291
332
2.073e+005
1
0.1178
Display5
2.11e+005
Display4
2.03e+005
0.04999
0.3744
0.07155
335.3
Display3
1.928e+005
0.007164
0.01108
0.0788
0
0
0
335.3
Display2
2.03
Display14 1
Display12
335.9
Display1
336
Display
36
Current (A)
0.5
2
2
0
273+59
332
0
IO2ratio Vector
Cathode flow
IM Pressure
Anode Pressure
Anode Inlet Flow
Anode Inlet Flow Control
K
n
<P>
<K>
K
O2 stoich
P(bar)
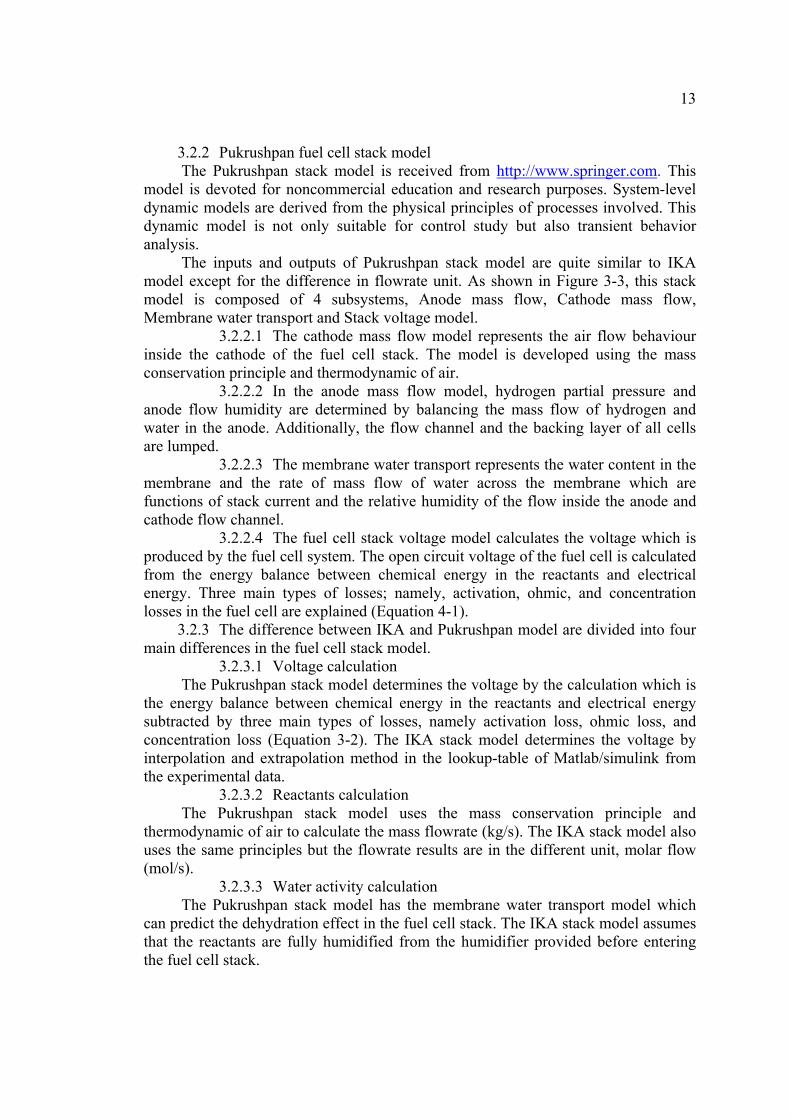
FIGURE 3-4 Static comparison
Two stacks are connected to the same fixed requirements; namely, current, pressure, temperature and O2 excessive ratio. The assumptions are:
3.2.4.1 O2 fraction = 0.21 3.2.4.2 H2 outlet = 0 3.2.4.3 Humidity = 100% 3.2.4.4 Operating pressure = (cathode pressure + anode pressure)/2 3.2.4.5 O2 excess ratio = 2
The Figure 3-6, 3-7, and 3-8 are obtained from IKA and Pukrushpan model which operated at steady state and at designed conditions. They show only effect of different operating pressure on the voltage of two models. The O2 excess ratio is 2 and controlled by the air flow rate which depends on the air compressor speed. Operating pressure is controlled by the cathode outlet pressure.
The differences of the polarization curves are evaluated and show in Figure 3-6. In the same conditions, the values of the IKA model are quite higher than the Pukrushpan model. Since the polarization data of the IKA model is based on the experimental data, the Pukrushpan model which is based on the equations has to be adjusted according to the real phenomena from the experiment.
15
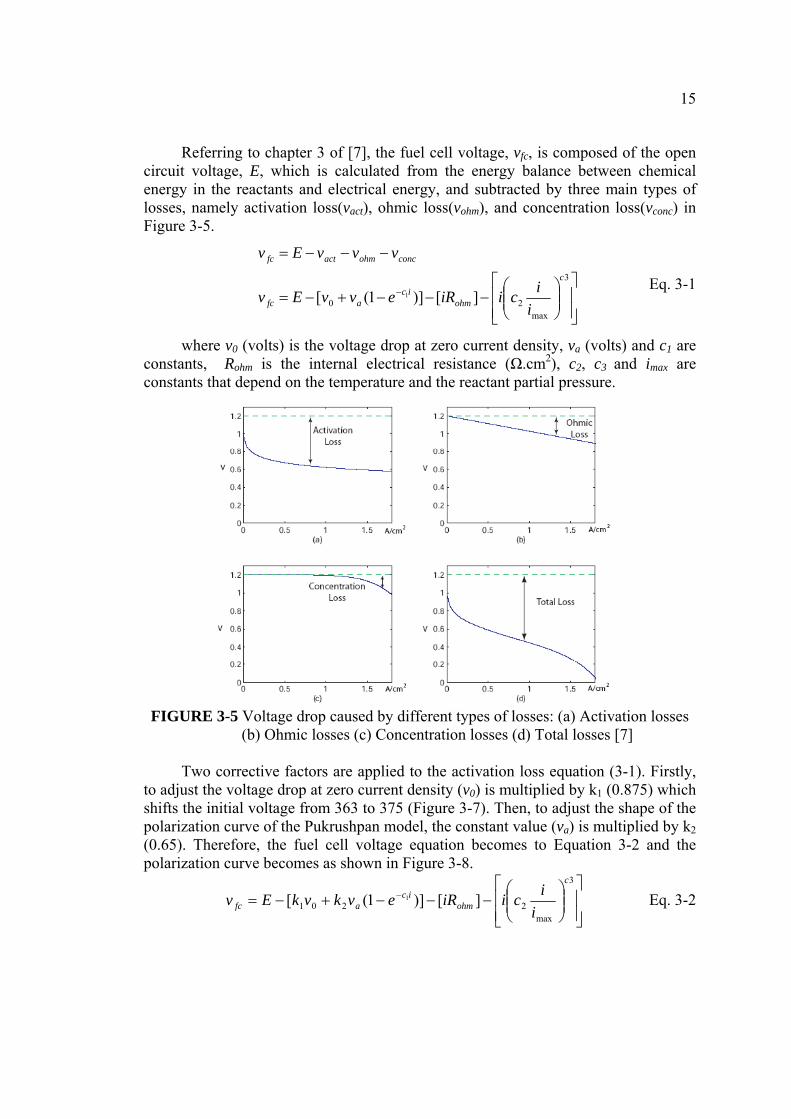
Referring to chapter 3 of [7], the fuel cell voltage, vfc, is composed of the open circuit voltage, E, which is calculated from the energy balance between chemical energy in the reactants and electrical energy, and subtracted by three main types of losses, namely activation loss(vact), ohmic loss(vohm), and concentration loss(vconc) in Figure 3-5.
⎥⎥⎦
⎤
⎢⎢⎣
⎡⎟⎟⎠
⎞⎜⎜⎝
⎛−−−+−=
−−−=
−
3
max20 ][)]1([ 1
c
ohmic
afc
concohmactfc
iiciiRevvEv
vvvEv
Eq. 3-1
where v0 (volts) is the voltage drop at zero current density, va (volts) and c1 are constants, Rohm is the internal electrical resistance (Ω.cm2), c2, c3 and imax are constants that depend on the temperature and the reactant partial pressure.
FIGURE 3-5 Voltage drop caused by different types of losses: (a) Activation losses
(b) Ohmic losses (c) Concentration losses (d) Total losses [7] Two corrective factors are applied to the activation loss equation (3-1). Firstly,
to adjust the voltage drop at zero current density (v0) is multiplied by k1 (0.875) which shifts the initial voltage from 363 to 375 (Figure 3-7). Then, to adjust the shape of the polarization curve of the Pukrushpan model, the constant value (va) is multiplied by k2 (0.65). Therefore, the fuel cell voltage equation becomes to Equation 3-2 and the polarization curve becomes as shown in Figure 3-8.
⎥⎥⎦
⎤
⎢⎢⎣
⎡⎟⎟⎠
⎞⎜⎜⎝
⎛−−−+−= −
3
max2201 ][)]1([ 1
c
ohmic
afc iiciiRevkvkEv Eq. 3-2

16
FIGURE 3-6 Original Polarization curve
FIGURE 3-7 Modified 1 Polarization curve
FIGURE 3-8 Modified 2 Polarization curve
17
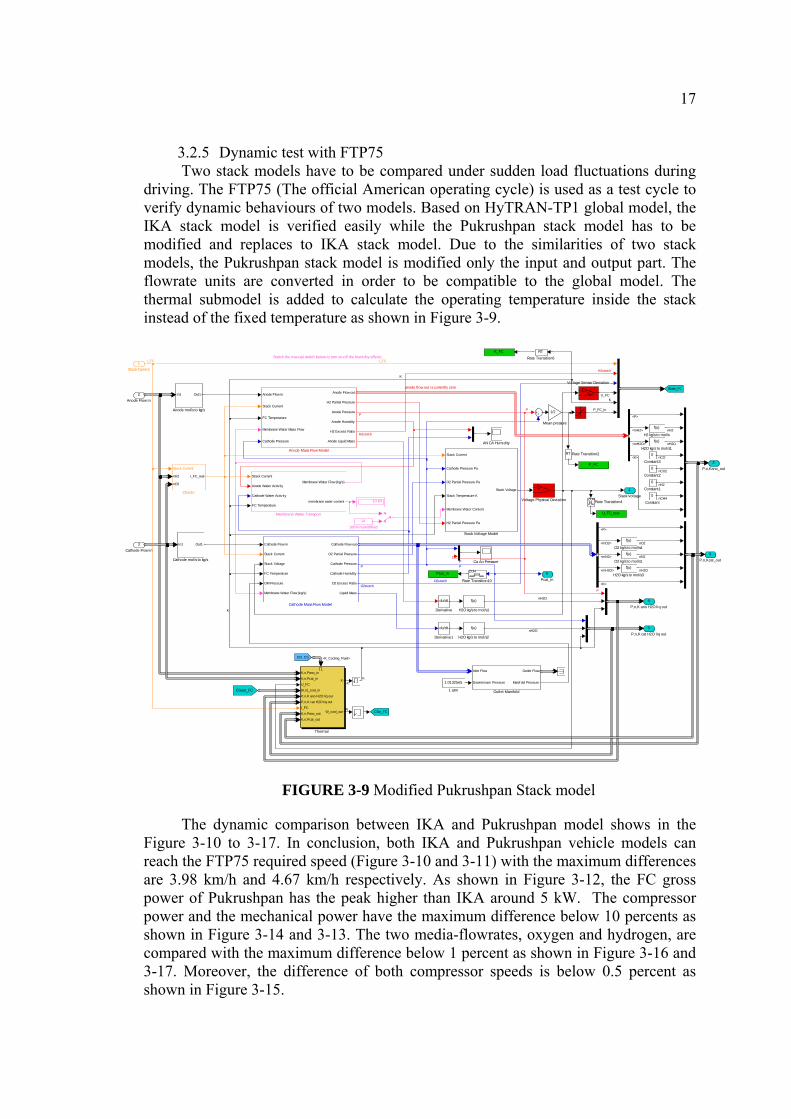
3.2.5 Dynamic test with FTP75 Two stack models have to be compared under sudden load fluctuations during
driving. The FTP75 (The official American operating cycle) is used as a test cycle to verify dynamic behaviours of two models. Based on HyTRAN-TP1 global model, the IKA stack model is verified easily while the Pukrushpan stack model has to be modified and replaces to IKA stack model. Due to the similarities of two stack models, the Pukrushpan stack model is modified only the input and output part. The flowrate units are converted in order to be compatible to the global model. The thermal submodel is added to calculate the operating temperature inside the stack instead of the fixed temperature as shown in Figure 3-9.
anode flow out is currently zero
Switch the manual switch below to turn on-off the humidity effects
6Pcat_in
5P,n,K cat H2O liq out
4P,n,K ano H2O liq out
3P,n,Kcat_out
2P,n,Kano_out
1Stack Voltage
State_FC
CSin_FC
Voltage Sensor Deviation
Voltage Physical Deviation
K,n,Pano_inK,n,Pcat_inU_FC[K,n]_cool_in
P,n,K ano H2O liq outP,n,K cat H2O liq outI_FCK,n,Pano_outK,n,Pcat_out
K
W_cool_out
Thermal
Stack Current
Cathode Pressure Pa
O2 Partial Pressure Pa
Stack Temperature K
Membrane Water Content
H2 Partial Pressure Pa
Stack Voltage
Stack Voltage Model
RT
Rate Transition6
ZOHRate Transition4
RT Rate Transition2
ZOH
Rate Transition10
f(u)
O2 kg/s to mol/s4f(u)
O2 kg/s to mol/s1
Stack Current
Anode Water Activity
Cathode Water Activ ity
FC Temperature
Membrane Water Flow (kg/s)
membrane water content
Membrane Water Transport
1/2
Mean pressure
f(u)
H2O kg/s to mol/s3
f(u)
H2O kg/s to mol/s2
f(u)
H2O kg/s to mol/s1
f(u)
H2 kg/s to mol/s
CSout_FC
Ctrl_CS
K_FC
U_FC_real
Pcat_in
P_FC
10.63
du/dt
Derivative1
du/dt
Derivative
0
Constant3
0
Constant2
0
Constant1
0
Constant
Stack Current
nH2
nO2
I_FC_real
Check I
In1 Out1
Cathode mol/s to kg/s
Cathode Flow in
Stack Current
Stack Voltage
FC Temperature
OM Pressure
Membrane Water Flow (kg/s)
Cathode Flow out
O2 Partial Pressure
Cathode Pressure
Cathode Humidity
O2 Excess Ratio
Liquid Mass
Cathode Mass Flow Model
Ca An Pressure
In1 Out1
Anode mol/s to kg/s
Anode Flow in
Stack Current
FC Temperature
Membrane Water Mass Flow
Cathode Pressure
Anode Flow out
H2 Partial Pressure
Anode Pressure
Anode Humidity
H2 Excess Ratio
Anode Liquid Mass
Anode Mass Flow Model
AN CA Humidity
14100% humidified
1.01325e5
1 atm
Inlet Flow
Downstream Pressure
Outlet Flow
Manifold Pressure
Outlet Manifold
f(u)
H2O kg/s to mol/s1
3Cathode Flow in
2Anode Flow in
1Stack Current
O2stoichO2stoich
P
PP
PPP
H2stoich
H2stoich
P_FC_in
nH2O
<P>
nCO
nCO2
nN2
nCH4
nH2O
nH2O
nH2
<mH2O>
<mH2>
nN2
nH2O
nO2
<P>
<mH2O>
<mO2>
<mN2>
<K>
<K>
I_FCI_FC
<K_Cooling_Fluid>
W
K
K
K
K
K
U_FC
FIGURE 3-9 Modified Pukrushpan Stack model
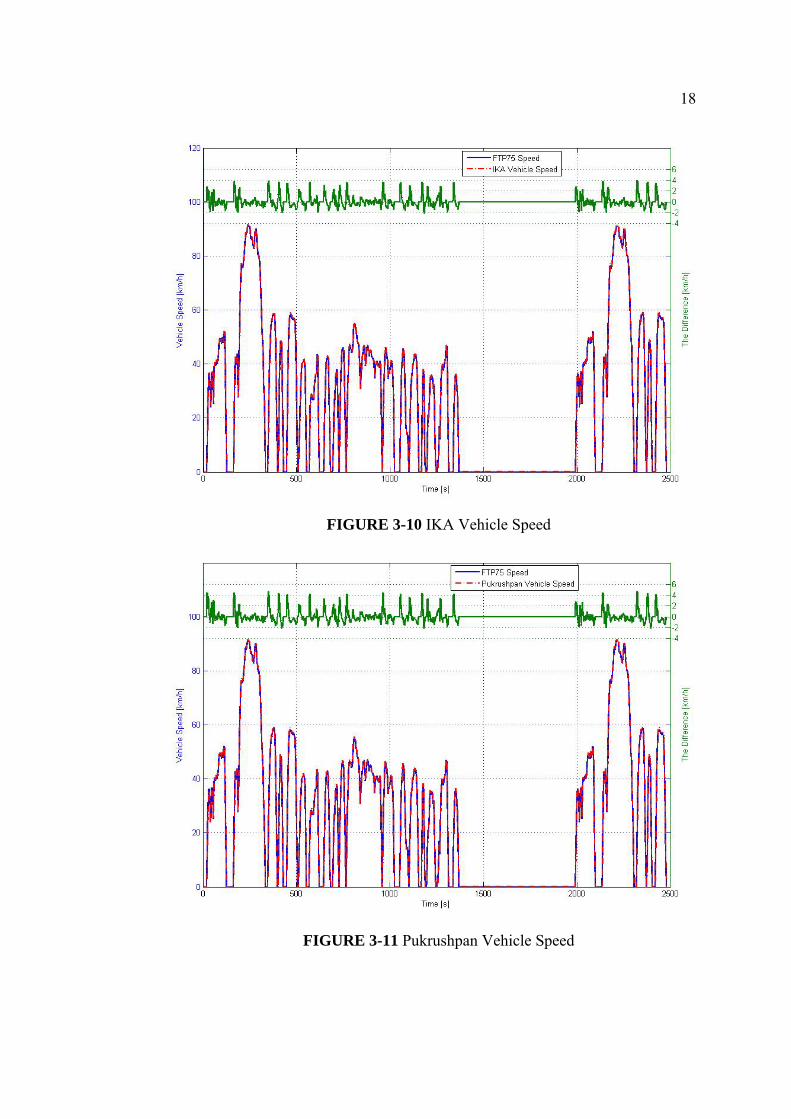
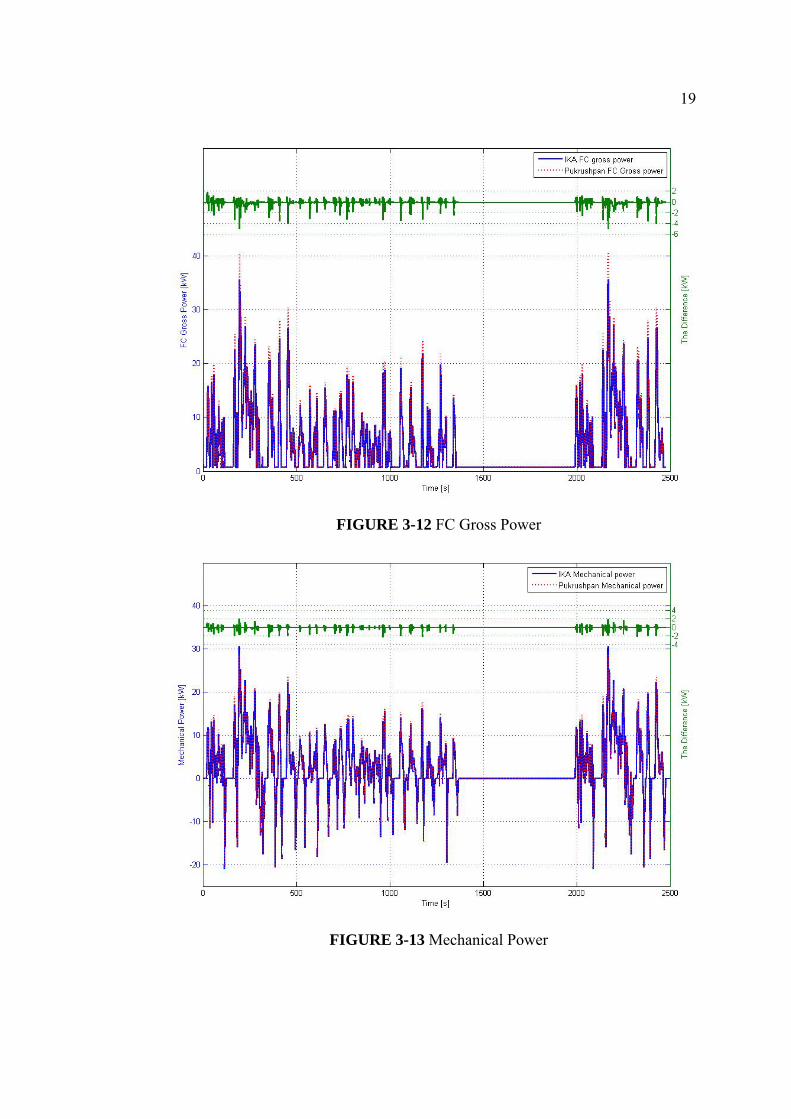
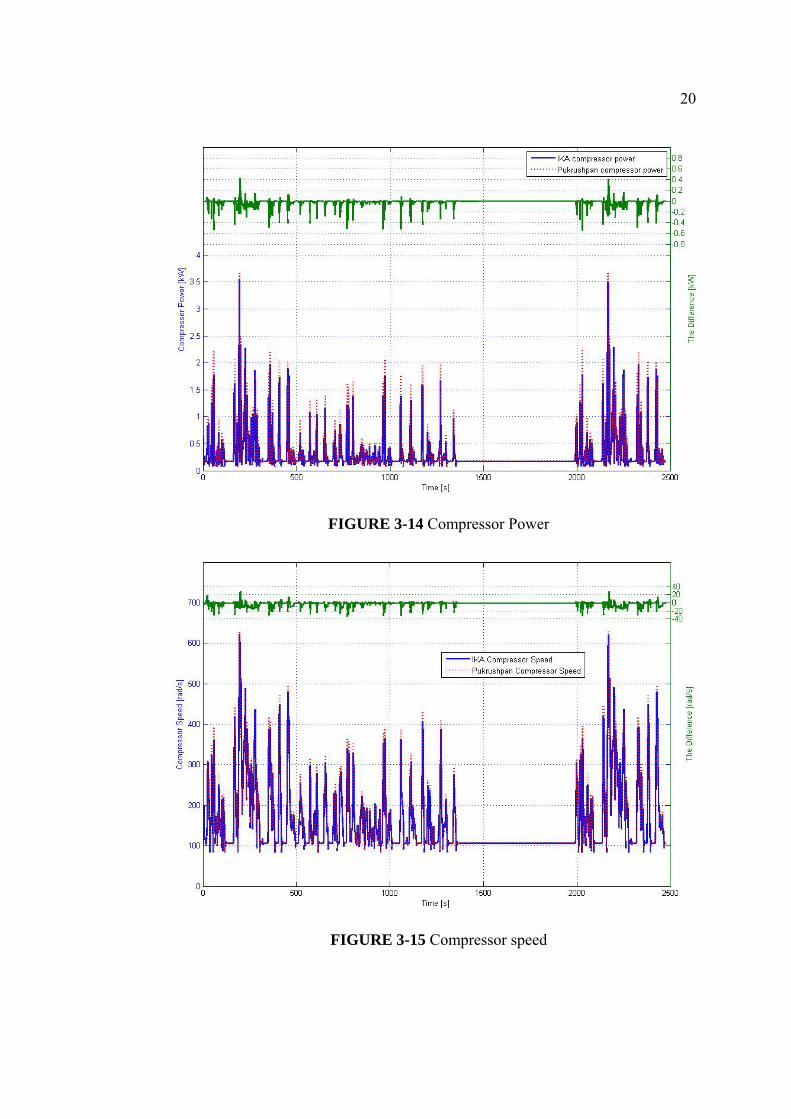
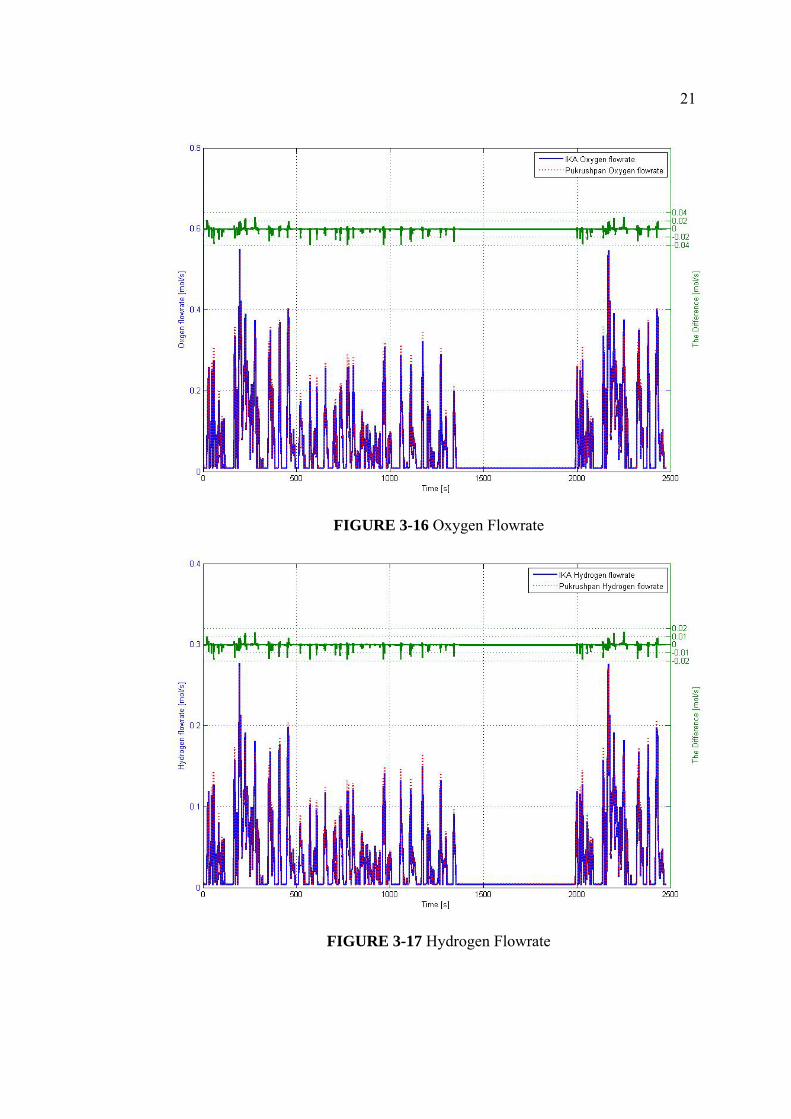
The dynamic comparison between IKA and Pukrushpan model shows in the Figure 3-10 to 3-17. In conclusion, both IKA and Pukrushpan vehicle models can reach the FTP75 required speed (Figure 3-10 and 3-11) with the maximum differences are 3.98 km/h and 4.67 km/h respectively. As shown in Figure 3-12, the FC gross power of Pukrushpan has the peak higher than IKA around 5 kW. The compressor power and the mechanical power have the maximum difference below 10 percents as shown in Figure 3-14 and 3-13. The two media-flowrates, oxygen and hydrogen, are compared with the maximum difference below 1 percent as shown in Figure 3-16 and 3-17. Moreover, the difference of both compressor speeds is below 0.5 percent as shown in Figure 3-15.
18
FIGURE 3-10 IKA Vehicle Speed
FIGURE 3-11 Pukrushpan Vehicle Speed
19
FIGURE 3-12 FC Gross Power
FIGURE 3-13 Mechanical Power
20
FIGURE 3-14 Compressor Power
FIGURE 3-15 Compressor speed
21
FIGURE 3-16 Oxygen Flowrate
FIGURE 3-17 Hydrogen Flowrate

22
3.3 Summary of the global model After comparisons of two fuel cell stack models, the Pukrushpan fuel cell stack
model is selected for our global model. The reasons are: 3.3.1 The Pukrushpan model can determine the voltage precisely because it
calculates the voltage from the losses equations (Equation 3-2) while IKA model determines by interpolation and extrapolation method in the lookup-table of Matlab/simulink from the experimental data.
3.3.2 Due to the ‘Membrane water transport’ model, the Pukrushpan model can predict the dehydration effect in the fuel cell stack.
3.3.3 The stack voltage from static comparison is quite similar as well as the dynamic behaviours from dynamic test. It means that the Pukrushpan model can be used in the global model.
23
CHAPTER 4 MODELING OF A HYBRID FUEL CELL VEHICLE
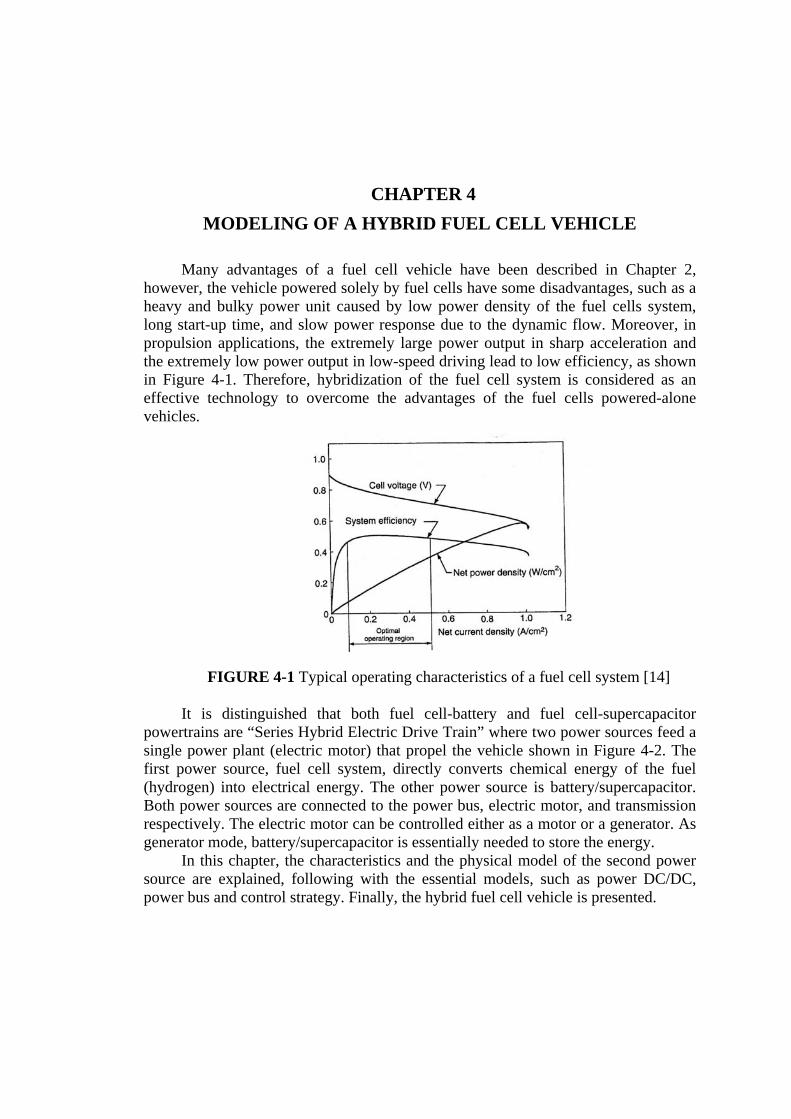
Many advantages of a fuel cell vehicle have been described in Chapter 2,
however, the vehicle powered solely by fuel cells have some disadvantages, such as a heavy and bulky power unit caused by low power density of the fuel cells system, long start-up time, and slow power response due to the dynamic flow. Moreover, in propulsion applications, the extremely large power output in sharp acceleration and the extremely low power output in low-speed driving lead to low efficiency, as shown in Figure 4-1. Therefore, hybridization of the fuel cell system is considered as an effective technology to overcome the advantages of the fuel cells powered-alone vehicles.
FIGURE 4-1 Typical operating characteristics of a fuel cell system [14]
It is distinguished that both fuel cell-battery and fuel cell-supercapacitor
powertrains are “Series Hybrid Electric Drive Train” where two power sources feed a single power plant (electric motor) that propel the vehicle shown in Figure 4-2. The first power source, fuel cell system, directly converts chemical energy of the fuel (hydrogen) into electrical energy. The other power source is battery/supercapacitor. Both power sources are connected to the power bus, electric motor, and transmission respectively. The electric motor can be controlled either as a motor or a generator. As generator mode, battery/supercapacitor is essentially needed to store the energy.
In this chapter, the characteristics and the physical model of the second power source are explained, following with the essential models, such as power DC/DC, power bus and control strategy. Finally, the hybrid fuel cell vehicle is presented.

24
FIGURE 4-2 Series Hybrid Electric Drivetrain
4.1 Characteristics of battery and supercapacitor The battery and the supercapacitor are considered as energy storage devices that
store energy, delivery energy (discharge), and collect energy (charge). They are potential energy storage devices for electric vehicle (EV) and hybrid electric vehicle (HEV) applications, especially for peaking power source (PPS) and energy recuperation from braking. There are a number of requirements for energy storage applied in an automotive application, such as specific energy, specific power, efficiency, maintenance requirements, costs, environmental friendliness and safety. For HEV application, specific power is the first consideration, because all the energy is supplied from the main energy source (engine or fuel cell) and sufficiency power is needed to ensure vehicle performance, such as acceleration, hill climbing, and regenerative braking.
4.1.1 Battery The battery is an electrochemical device that converts chemical energy into
electrical energy during discharge and converts electrical energy into chemical energy during charge. In general, a battery has a high energy density but relative low power density (but still higher than a fuel cell) as shown in Figure 4-5. It can store much energy but is incapable of providing or accepting of the power in a short time because of its internal resistance. There are many types of battery, such as Lead-Acid, Nickel-based, and Lithium-based battery. The physical model of the general battery consists of many parameters. One of an important parameter is the state of charge (SOC) which can be expressed as
( )∫−=iQ
idtSOCSOC 0 , Eq. 4-1
where SOC0 is the initial value of the SOC, Q(i) is the amount of electric charge transported by a current of 1 ampere in 1 second. For discharging i is positive, and negative for charging. While the energy delivered from the battery can be expressed as
( ) ( )dttiSOCiVECt
∫=0
, , Eq. 4-2
where V(i,SOC) is the voltage at the battery terminals, which is a function of the battery current and SOC. The voltage can be expressed as
( ) int, iROCVSOCiV −= , Eq. 4-3
where OCV is the open circuit voltage which is the function of the SOC, and Rint is internal resistance which is the function of the SOC and the value still vary depending
First Power Source
Power Bus Second
Power Source or Storage Energy
Transmission System
Electric Motor
25
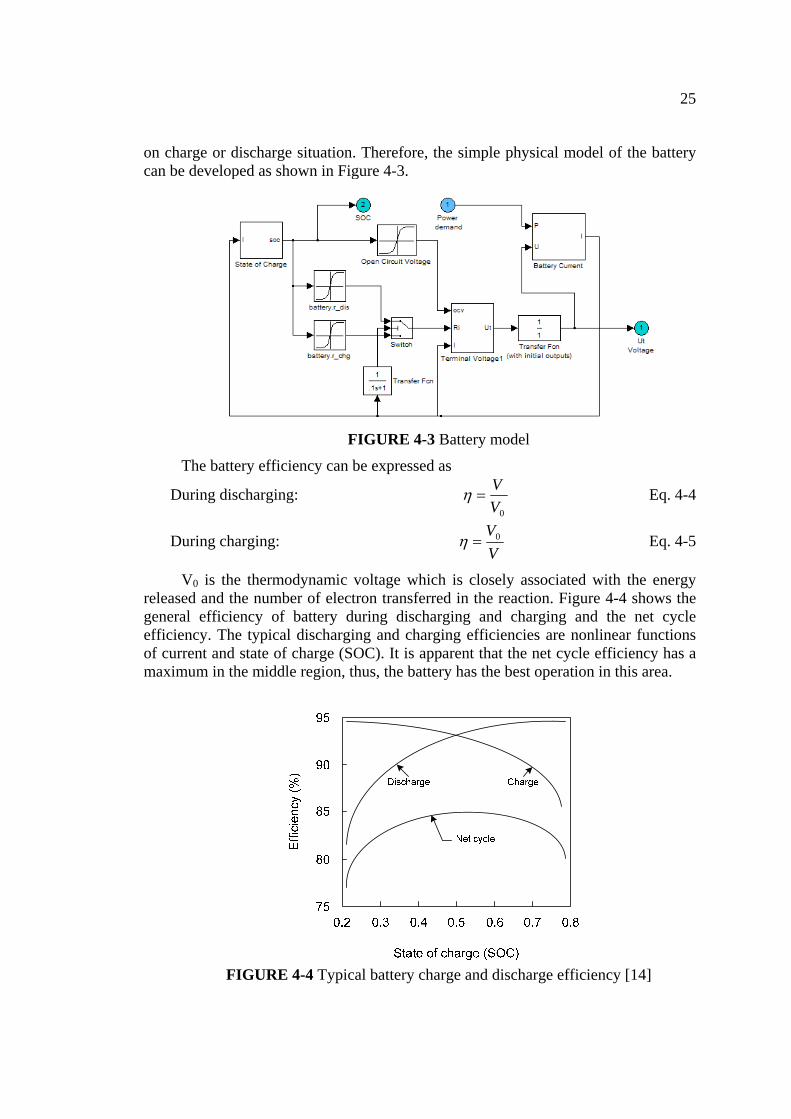
on charge or discharge situation. Therefore, the simple physical model of the battery can be developed as shown in Figure 4-3.
FIGURE 4-3 Battery model
The battery efficiency can be expressed as
During discharging: 0V
V=η Eq. 4-4
During charging: VV0=η Eq. 4-5
V0 is the thermodynamic voltage which is closely associated with the energy released and the number of electron transferred in the reaction. Figure 4-4 shows the general efficiency of battery during discharging and charging and the net cycle efficiency. The typical discharging and charging efficiencies are nonlinear functions of current and state of charge (SOC). It is apparent that the net cycle efficiency has a maximum in the middle region, thus, the battery has the best operation in this area.
FIGURE 4-4 Typical battery charge and discharge efficiency [14]
26
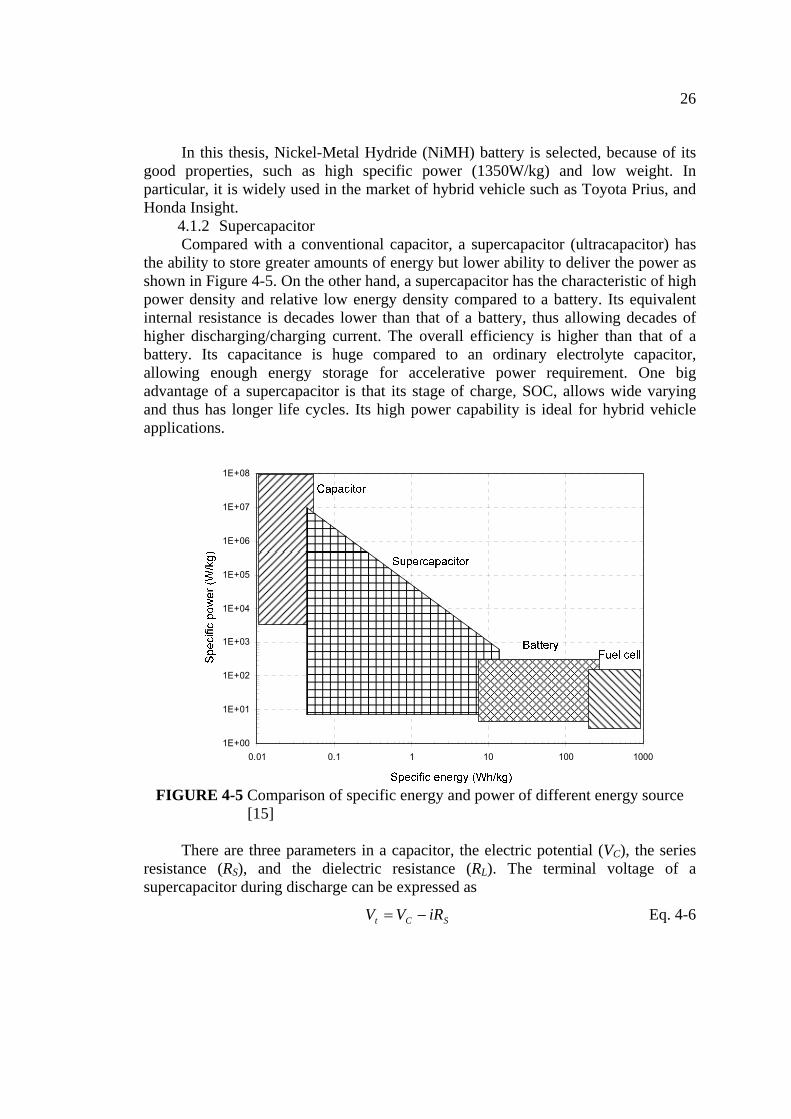
In this thesis, Nickel-Metal Hydride (NiMH) battery is selected, because of its good properties, such as high specific power (1350W/kg) and low weight. In particular, it is widely used in the market of hybrid vehicle such as Toyota Prius, and Honda Insight.
4.1.2 Supercapacitor Compared with a conventional capacitor, a supercapacitor (ultracapacitor) has
the ability to store greater amounts of energy but lower ability to deliver the power as shown in Figure 4-5. On the other hand, a supercapacitor has the characteristic of high power density and relative low energy density compared to a battery. Its equivalent internal resistance is decades lower than that of a battery, thus allowing decades of higher discharging/charging current. The overall efficiency is higher than that of a battery. Its capacitance is huge compared to an ordinary electrolyte capacitor, allowing enough energy storage for accelerative power requirement. One big advantage of a supercapacitor is that its stage of charge, SOC, allows wide varying and thus has longer life cycles. Its high power capability is ideal for hybrid vehicle applications.
1E+00
1E+01
1E+02
1E+03
1E+04
1E+05
1E+06
1E+07
1E+08
0.01 0.1 1 10 100 1000
FIGURE 4-5 Comparison of specific energy and power of different energy source
[15] There are three parameters in a capacitor, the electric potential (VC), the series
resistance (RS), and the dielectric resistance (RL). The terminal voltage of a supercapacitor during discharge can be expressed as
SCt iRVV −= Eq. 4-6

27
The electric potential of a capacitor can be expressed as
⎟⎠⎞
⎜⎝⎛ +−=
Cii
dtdV LC , Eq. 4-7
where C is the capacitance of the ultracapacitor. The leakage iL can be expressed as
L
CL R
Vi = Eq. 4-8
Substituting Eq. 4-8 into Eq. 4-7, one can obtain
Ci
CRV
dtdV
L
CC −= Eq. 4-9
The modelling of supercapacitor that is available at IKA as shown in Figure 4-6.
3Pdiss
2U_sc
1Q
Vc_inVc_out
Sign
Product5
Product4
Product3
Product2
Product1
Product
u2
MathFunction1
uv
MathFunction
1s
Integrator
Vc
Ileak
Pdiss
EPR
supercapacitor.gamma_const_phase(ind)
InitQ(ind)
p(ind)
T(ind)
R(ind)
|u|
Abs
1I
FIGURE 4-6 Supercapacitor model
4.2 Configurations of fuel cell hybrid powertrains Because fuel cell and battery/supercapacitor have advantages and disadvantages
of their own, it should be beneficial to have a hybrid powertrain, in which the fuel cell system supplies base power while peak power of acceleration is supplied by a battery or a supercapacitor. Moreover, hybrid systems have the ability to recuperate braking energy.
The hybridization degree is defined as [4]:
PfcPP
HDESS
ESS
+= Eq. 4-10
where ESSP is the power of the energy storage device and fcP is the fuel cell power.
28
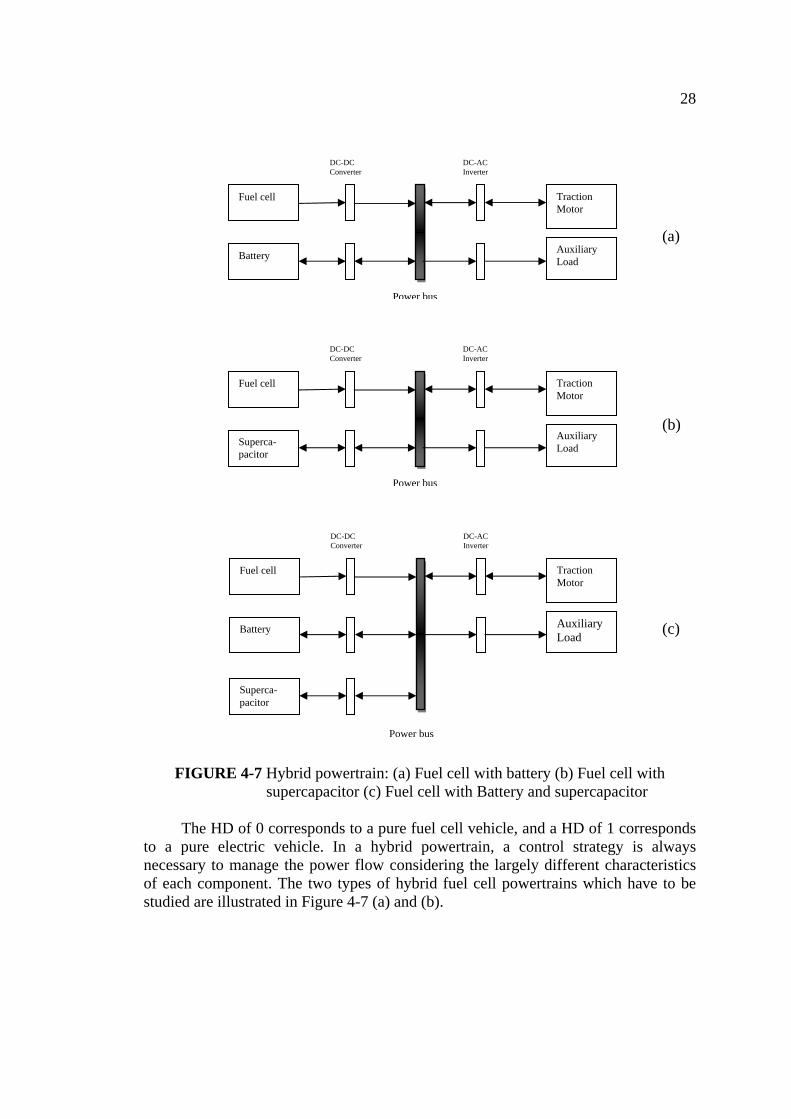
FIGURE 4-7 Hybrid powertrain: (a) Fuel cell with battery (b) Fuel cell with supercapacitor (c) Fuel cell with Battery and supercapacitor
The HD of 0 corresponds to a pure fuel cell vehicle, and a HD of 1 corresponds
to a pure electric vehicle. In a hybrid powertrain, a control strategy is always necessary to manage the power flow considering the largely different characteristics of each component. The two types of hybrid fuel cell powertrains which have to be studied are illustrated in Figure 4-7 (a) and (b).
(a)
(b)
(c)
Power bus
DC-AC Inverter
DC-DC Converter
Fuel cell
Battery
Traction Motor
Auxiliary Load
Power bus
DC-AC Inverter
DC-DC Converter
Fuel cell
Superca-pacitor
Traction Motor
Auxiliary Load
DC-AC Inverter
DC-DC Converter
Fuel cell
Battery
Traction Motor
Auxiliary Load
Superca-pacitor
Power bus

29
4.2.1 Power DC/DC Converter Another important device needed in the hybrid system is Power DC/DC
Converter. It serves the need to modify the electrical energy, both voltage and current, and maintains the output voltage at a fixed value whatever change of the power source is (i.e. fuel cells, battery and supercapacitor).
As efficiency is at the premium in a power electronic device, the losses that a power electronic device generates must be as low as possible. The efficiency can be expressed as
ii
oo
input
output
VIVI
PP
××
==η Eq. 4-11
while P is power, I is current and V is voltage. The power DC/DC converter model (Figure 4-8) is developed based on the
efficiency data of the BDC412 model produced by BRUSA [Appendix A]. It is able to regulate the high-voltage side, the voltage on the fuel cell or peaking power source side and can provide energy for the traction and auxiliary systems. Moreover, it allows the backward current from the electric motor in the regenerative braking mode to battery and/or supercapacitor as a storage energy device.
1I_batt
Saturation
Power DC-DC
Memory
1
Constant
1.discahrge2.curent3.charge
3Idcbus_batt
2U_batt
1U_bus
FIGURE 4-8 Powers DC/DC Converter Model
4.2.2 DC/AC Inverter The DC/AC inverter is an electrical device that converts direct current to
alternating current. For electric vehicle drive, it controls the operating speed of an AC motor by controlling the frequency and voltage of the power supplied to the motor. As same as DC/DC converter, efficiency is at the premium and expressed as Eq. 4-11.
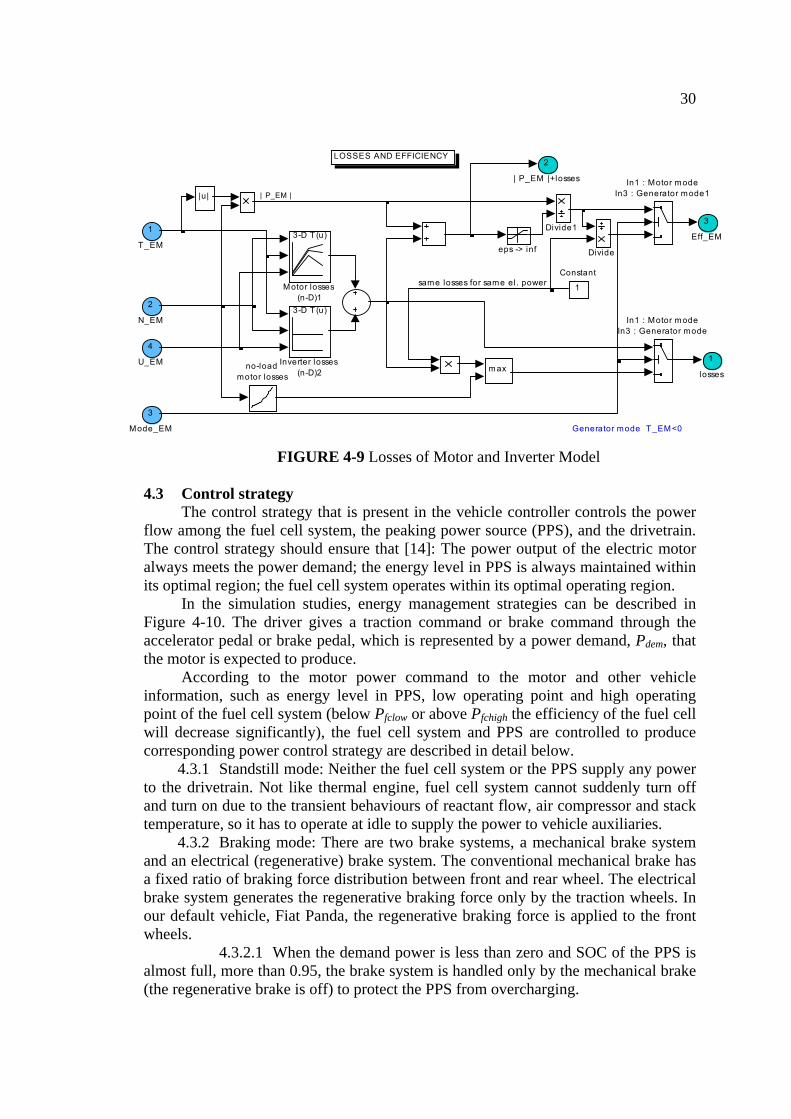
In our model, the DC/AC inverter is combined in the electric motor model and assumed that the losses are very low and constant in all operating region. The losses of motor and inverter are shown in Figure 4-9.
30
same losses for same el . power
Generator mode T_EM<0
LOSSES AND EFFICIENCY
3
Eff_EM
2
| P_EM |+losses
1
lossesno-load
motor losses
eps -> inf
3-D T (u)
Motor losses (n-D)1
max
3-D T (u)
Inverter losses (n-D)2
In1 : Motor modeIn3 : Generator mode1
In1 : Motor modeIn3 : Generator mode
Divide1
Divide
1
Constant
|u|
4
U_EM
3
Mode_EM
2
N_EM
1
T_EM
| P_EM |
FIGURE 4-9 Losses of Motor and Inverter Model
4.3 Control strategy
The control strategy that is present in the vehicle controller controls the power flow among the fuel cell system, the peaking power source (PPS), and the drivetrain. The control strategy should ensure that [14]: The power output of the electric motor always meets the power demand; the energy level in PPS is always maintained within its optimal region; the fuel cell system operates within its optimal operating region.
In the simulation studies, energy management strategies can be described in Figure 4-10. The driver gives a traction command or brake command through the accelerator pedal or brake pedal, which is represented by a power demand, Pdem, that the motor is expected to produce.
According to the motor power command to the motor and other vehicle information, such as energy level in PPS, low operating point and high operating point of the fuel cell system (below Pfclow or above Pfchigh the efficiency of the fuel cell will decrease significantly), the fuel cell system and PPS are controlled to produce corresponding power control strategy are described in detail below.
4.3.1 Standstill mode: Neither the fuel cell system or the PPS supply any power to the drivetrain. Not like thermal engine, fuel cell system cannot suddenly turn off and turn on due to the transient behaviours of reactant flow, air compressor and stack temperature, so it has to operate at idle to supply the power to vehicle auxiliaries.
4.3.2 Braking mode: There are two brake systems, a mechanical brake system and an electrical (regenerative) brake system. The conventional mechanical brake has a fixed ratio of braking force distribution between front and rear wheel. The electrical brake system generates the regenerative braking force only by the traction wheels. In our default vehicle, Fiat Panda, the regenerative braking force is applied to the front wheels.
4.3.2.1 When the demand power is less than zero and SOC of the PPS is almost full, more than 0.95, the brake system is handled only by the mechanical brake (the regenerative brake is off) to protect the PPS from overcharging.
31
4.3.2.2 If the SOC of the PPS is less than 0.95 and the braking power is less than the maximum regenerative braking power, the PPS absorbs the regenerative braking energy. Otherwise, if the braking power is more than the maximum regenerative braking power, the mechanical brake will supply the excess.
4.3.3 Traction mode: 4.3.3.1 If the power demand is higher than the high operating point of the
fuel cell system, and the energy level of PPS is higher than the minimum line, the hybrid traction is used. In other words, the fuel cell system operates at high operating point and the remaining power demand is supplied by the PPS. In case of the power demand is still higher than this condition, fuel cell will operates above the high operating point to supply the exceeding power but not more than its maximum power. Otherwise, if the SOC of the PPS is below than the minimum line, the power comes from the fuel cell system only.
4.3.3.2 If the power demand is lower than the low operating point of the fuel cell system, and the PPS’s the energy level is less than the maximum line, the fuel cell system operates at its low operating point. The part of power goes to the drivetrain while another part goes to charge the PPS. Otherwise, if the PPS does not need charging (the energy level is close to its maximum value), the fuel cell system operates at idle and the PPS alone drives the vehicle. In latter case, the peak power that the PPS can produce is higher than the power demand.
4.3.3.3 If the load power is higher than the low operating point and less than the high operating point of the fuel cell system, and the PPS does not need charging, the fuel cell system alone drive the vehicle. Otherwise, if the PPS does need charging, the fuel cell system goes to the high operating point to drive the vehicle and the rest power is used to charge the PPS.

32
FIGURE 4-10 Control strategy flow chart
Pdem - demand power Pbr - mechanical braking power Pfc - power of the fuel cell system Pfcidle - the minimum net design power output of FC Pfchigh - FC power at high operating point Pfclow - FC power at low operating point Ppps - power of peaking power source Pppsmax - peak power that PPS can produce Pppsmin - peak power that PPS can absorb E - energy level of PPS (SOC) Emin - bottom line of the energy storage in the PPS Emax - top line of the energy storage in PPS
Pfc = Pdem Ppps = 0 If E > Emax
Pfc = Pfchigh Ppps = Pfc – Pdem
No PPS Charging
Yes FC traction
If Pdem> Pfchigh Pfc = Pdem Ppps = 0 If E < Emin
Ppps = Pppsmax Pfc = Pdem - Ppps
Pdem > Pfchigh+Pppsmax
Pfc = Pfchigh Ppps = Pdem - Pfc
No
Yes Hybrid traction
No Hybrid traction (PPS on demand)
Yes Hybrid traction
(Low efficiency)
Yes FC traction
Yes Mechanical Brake only
Yes Brake Pfc=Pfcidle
No Yes
Mech. Brake & Regenerative
No Regenerative braking only
No Regenerative
Ppps = Pdem Pbr = 0
If Pdem > Pppsmin Ppps = Pppsmin Pbr= Pdem - Ppps
If Pdem < 0 Pdem= Pbr Ppps = 0 If E > 0.95
Traction power
command Ptr
Braking power
command Pbr
Pdem
If Pdem≤ Pfclow Pfc = Pfclow Ppps = Pfclow - Pdem If E < Emax
Pfc = Pfcidle Ppps = Pdem-Pfcidle
Yes PPS charging or traction
No No FC run at idle and PPS traction
Yes PPS Charging
33
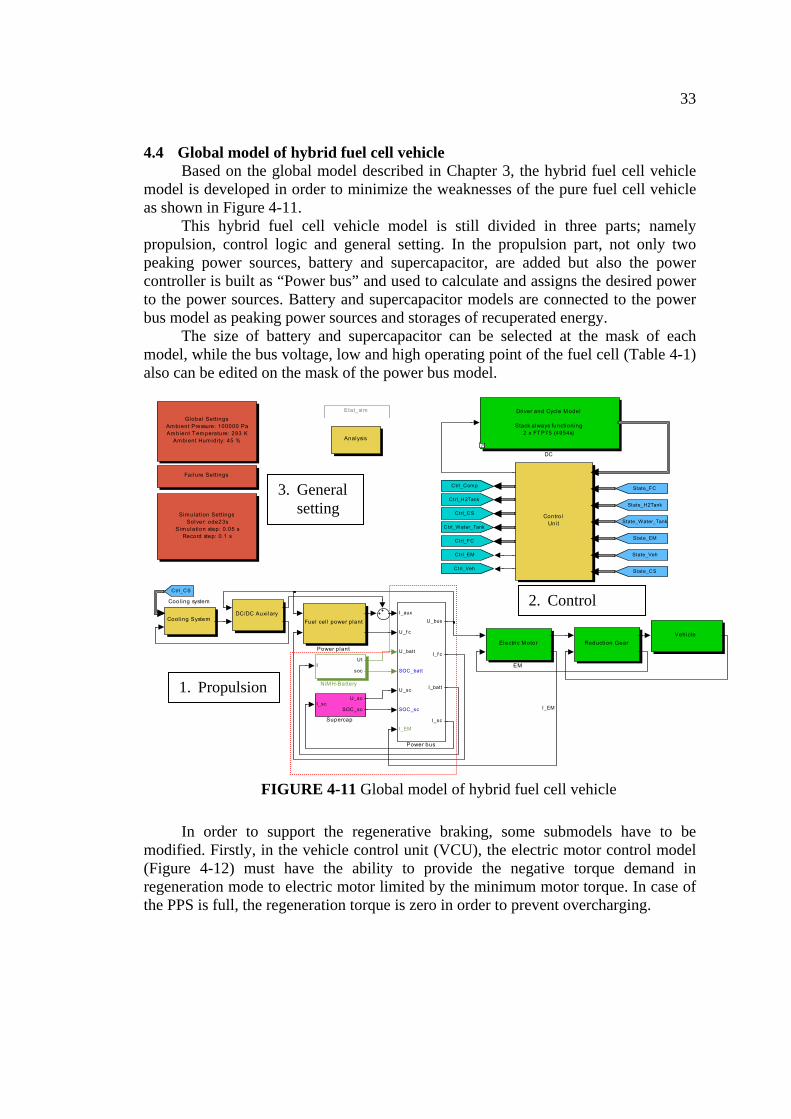
4.4 Global model of hybrid fuel cell vehicle Based on the global model described in Chapter 3, the hybrid fuel cell vehicle
model is developed in order to minimize the weaknesses of the pure fuel cell vehicle as shown in Figure 4-11.
This hybrid fuel cell vehicle model is still divided in three parts; namely propulsion, control logic and general setting. In the propulsion part, not only two peaking power sources, battery and supercapacitor, are added but also the power controller is built as “Power bus” and used to calculate and assigns the desired power to the power sources. Battery and supercapacitor models are connected to the power bus model as peaking power sources and storages of recuperated energy.
The size of battery and supercapacitor can be selected at the mask of each model, while the bus voltage, low and high operating point of the fuel cell (Table 4-1) also can be edited on the mask of the power bus model.
Vehicle
ControlUnit
I_scU_sc
SOC_sc
Supercap
State_Water_Tank
State_CS
State_Veh
State_H2Tank
State_EM
Simulation Settings Solver: ode23s
Simulation step: 0.05 s Record step: 0.1 s
Reduction Gear
Fuel cel l power plant
Power plant
I_aux
U_f c
U_batt
SOC_batt
U_sc
SOC_sc
I_EM
U_bus
I_f c
I_batt
I_sc
Power bus
IUt
soc
NiMH-Battery
Global Settings Ambient Pressure: 100000 Pa Ambient T emperature: 293 K
Ambient Humidity: 45 %
State_FC
Fai lure Settings
Ctrl_CS
Etat_sim
Electric Motor
EM
DC/DC Auxi lary
Driver and Cycle Model
Stack always functioning2 x FTP75 (4954s)
DC
Ctrl_H2Tank
Ctrl_Water_Tank
Ctrl_Veh
Ctrl_FC
Ctrl_EM
Ctrl_Comp
Ctrl_CS
Cool ing System
Cool ing system
Analysis
I_EM
FIGURE 4-11 Global model of hybrid fuel cell vehicle
In order to support the regenerative braking, some submodels have to be modified. Firstly, in the vehicle control unit (VCU), the electric motor control model (Figure 4-12) must have the ability to provide the negative torque demand in regeneration mode to electric motor limited by the minimum motor torque. In case of the PPS is full, the regeneration torque is zero in order to prevent overcharging.
1. Propulsion
3. General setting
2. Control

34
1Out1
torque gradient l im i ter
bk
acc1
acc
T m inmotor
-K-
T max
Switch
Rate T ransition3Max Brake
forceRegeneration State& Max brake force
If (no PPS) or (PPS ful l )then No regeneration ( T >= 0 )
and Electric brake force = 0
-K-
Force => Torque T_desired
1. can regen3. no regen
1In1
FIGURE 4-12 Electric motor control model in VCU
Following with electric motor model (Figure 4-13), since the demand torque is negative, thus the calculating is done by 2D lookup table “mintorque” block. This value will be compared between desired torque (T_desired) and real torque calculated by the current. The output torque is the maximum of these three values.
T ORQUE AND CURRENT ESTIMATION
4
Losses
3
Eff_EM
2
I_EM
1
T_EM
min torquegenerator mode1
max torquemotor mode1
x
/
good div2
x
/
good div1
x
/
good div
1
0.05s+1Transfer Fcn
Term inator2
Term inator1
Term inator
Saturation6
Saturation5
Saturation4
Saturation3
Saturation2
Saturation1
max
minm in
max
Memory2
Memory
Lossesand
Efficiency
Losses and Effciency2
Lossesand
Efficiency
Losses and Effciency1
In1 : Motor modeIn3 : Generator mode2
In1 : Motor modeIn3 : Generator mode1
[0.9]
IC6
[100]
IC5
[100]
IC3
[0.9]
IC2
[0.5]
IC1
P_desired
Goto
-1
Gain
[I_aux]
From4
[I_comp]
From3
[Idcbus_sc]
From2
[Idcbus_batt]
From1
dcbus_FC_real]
From
u>=0
/
Add2
Add1
Add
|u|
|u|
|u|
|u|
3
U_EM
2T_Desired
1
N_EM
U_EM
U_EM
N_EM
Mode
ModeEta
|P_EM|+Losses
P
P_desired
P_desired
T_el
FIGURE 4-13 Electric motor model
Moreover, in the vehicle model, the total mass of vehicle has to include the PPS
weights in order to calculate the correct vehicle inertia.
35
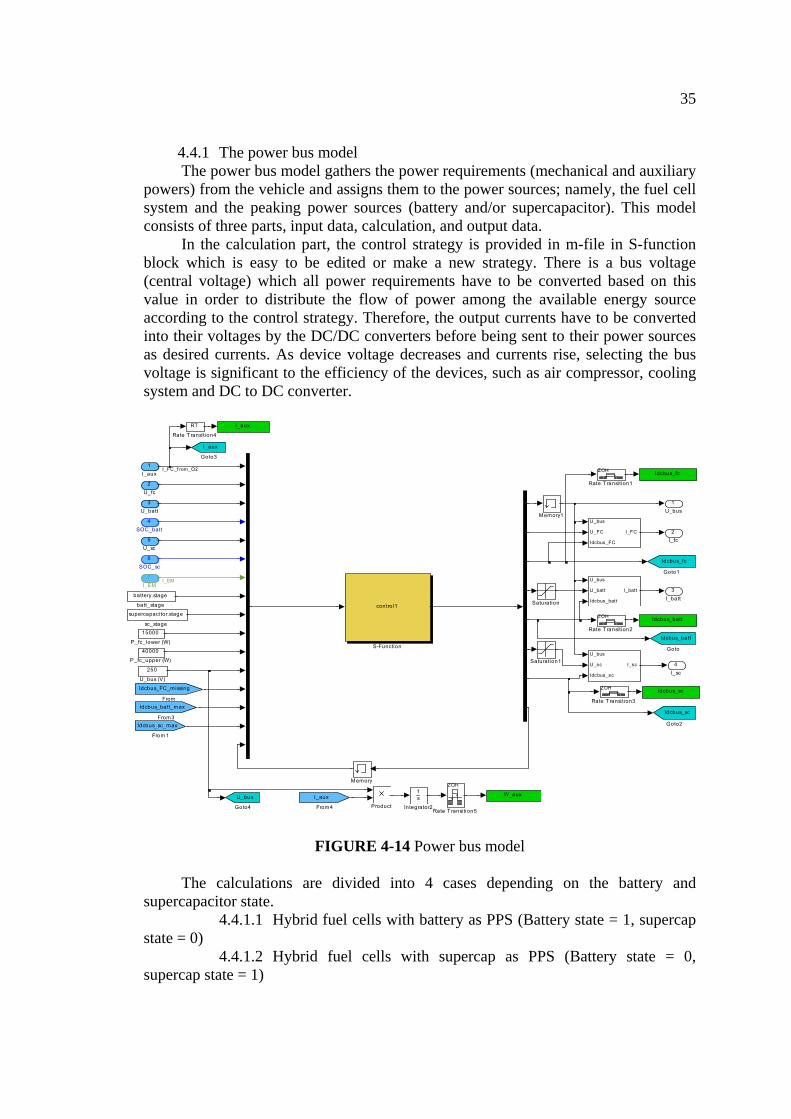
4.4.1 The power bus model The power bus model gathers the power requirements (mechanical and auxiliary
powers) from the vehicle and assigns them to the power sources; namely, the fuel cell system and the peaking power sources (battery and/or supercapacitor). This model consists of three parts, input data, calculation, and output data.
In the calculation part, the control strategy is provided in m-file in S-function block which is easy to be edited or make a new strategy. There is a bus voltage (central voltage) which all power requirements have to be converted based on this value in order to distribute the flow of power among the available energy source according to the control strategy. Therefore, the output currents have to be converted into their voltages by the DC/DC converters before being sent to their power sources as desired currents. As device voltage decreases and currents rise, selecting the bus voltage is significant to the efficiency of the devices, such as air compressor, cooling system and DC to DC converter.
4I_sc
3I_batt
2I_fc
1U_bus
supercapaci tor.stage
sc_stage
battery.stage
batt_stage
250
U_bus (V)
W_aux
Idcbus_sc
Idcbus_fc
Idcbus_batt
Saturation1
Saturationcontrol1
S-Function
ZOH
Rate T ransition5
RT
Rate T ransition4
ZOH
Rate T ransi tion3
ZOH
Rate T ransition2
ZOH
Rate T ransition1
Product
40000
P_fc_upper (W)
15000
P_fc_lower (W)
Memory1
Memory
1s
Integrator2
U_bus
Goto4
I_aux
Goto3
Idcbus_sc
Goto2
Idcbus_fc
Goto1
Idcbus_batt
Goto
I_aux
From4
Idcbus_batt_max
From3Idcbus_sc_max
From1
Idcbus_FC_missing
From
I_aux
U_bus
U_sc
Idcbus_sc
I_sc
U_bus
U_batt
Idcbus_batt
I_batt
U_bus
U_FC
Idcbus_FC
I_FC
7I_EM
6SOC_sc
5U_sc
4SOC_batt
3U_batt
2U_fc
1I_aux
I_FC_f rom_O2
I_EM
FIGURE 4-14 Power bus model
The calculations are divided into 4 cases depending on the battery and
supercapacitor state. 4.4.1.1 Hybrid fuel cells with battery as PPS (Battery state = 1, supercap
state = 0) 4.4.1.2 Hybrid fuel cells with supercap as PPS (Battery state = 0,
supercap state = 1)
36
4.4.1.3 Hybrid fuel cells with battery and supercap as PPS (Battery state = 1, supercap state =1)
4.4.1.4 The fuel cell vehicle without PPS (Battery state = 0, supercap state = 0)
The first two cases use the same control strategy explained in the Figure 4-10(a) and (b). The third case is not mentioned in the thesis and prepared for further study.
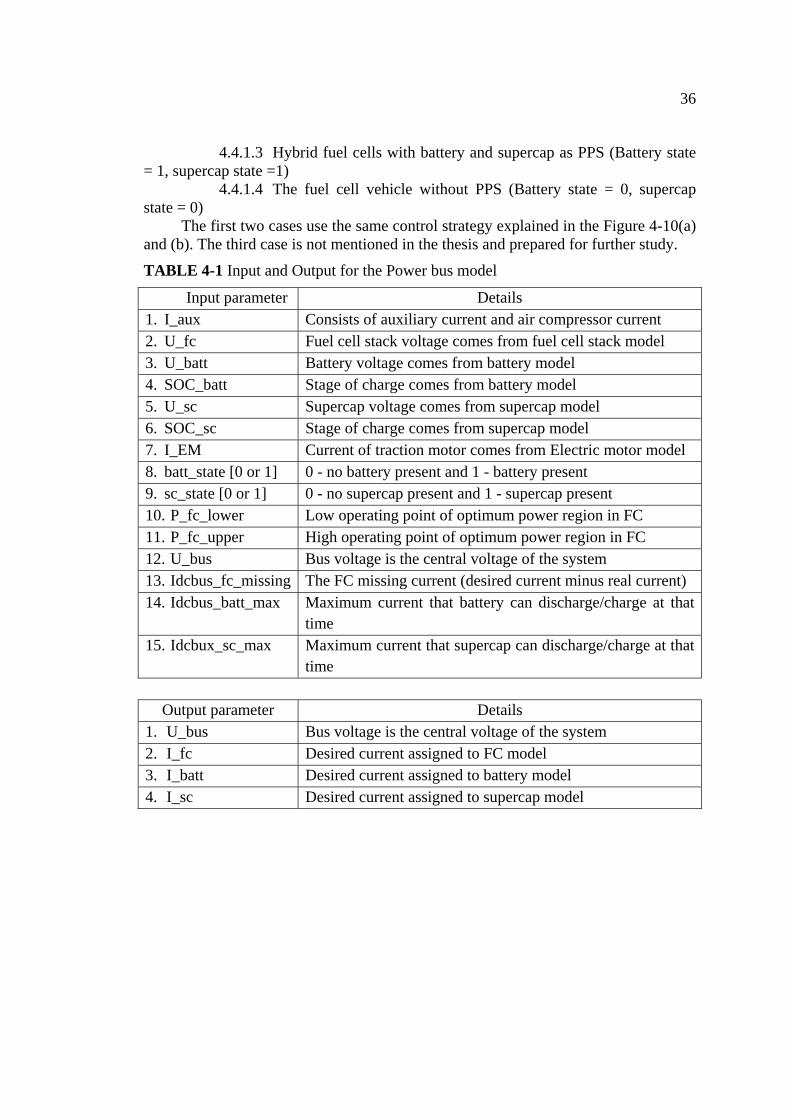
TABLE 4-1 Input and Output for the Power bus model
Input parameter Details 1. I_aux Consists of auxiliary current and air compressor current 2. U_fc Fuel cell stack voltage comes from fuel cell stack model 3. U_batt Battery voltage comes from battery model 4. SOC_batt Stage of charge comes from battery model 5. U_sc Supercap voltage comes from supercap model 6. SOC_sc Stage of charge comes from supercap model 7. I_EM Current of traction motor comes from Electric motor model 8. batt_state [0 or 1] 0 - no battery present and 1 - battery present 9. sc_state [0 or 1] 0 - no supercap present and 1 - supercap present 10. P_fc_lower Low operating point of optimum power region in FC 11. P_fc_upper High operating point of optimum power region in FC 12. U_bus Bus voltage is the central voltage of the system 13. Idcbus_fc_missing The FC missing current (desired current minus real current) 14. Idcbus_batt_max Maximum current that battery can discharge/charge at that
time 15. Idcbux_sc_max Maximum current that supercap can discharge/charge at that
time
Output parameter Details 1. U_bus Bus voltage is the central voltage of the system 2. I_fc Desired current assigned to FC model 3. I_batt Desired current assigned to battery model 4. I_sc Desired current assigned to supercap model

37
CHAPTER 5 SIMULATION
To compare the fuel economy and performance of the two types of fuel cell hybrid powertrains, the default vehicle, Fiat Panda (Figure 5-1) powered by PEM fuel cell is used as a baseline vehicle. The first type is the fuel cell vehicle with battery and the second type is the fuel cell vehicle with supercapacitor.
5.1 Base power requirement calculations
TABLE 5-1 Assumed parameters for the default vehicle
Parameters Value Unit Vehicle mass (Kerb weight 840 kg, Thermal engine 120 kg, Gear box 50 kg, Empty tank mass 15 kg)
655 Kg
Gravity, g 9.81 m/s2 Rolling resistance coefficient, fr 0.012 - Transmission efficient, ηt 0.92 - Air density, ρa 1.2 Kg/m3 Aero dynamic drag coefficient, CD 0.6530 - Front area, Af 2.0 m2 Wheel radius (155/80 R13) 0.289 m Average electrical accessory load 300 W Vehicle cargo mass 185 Kg Electric motor +Gear box mass 90+50 Kg Fuel cell system mass 220 Kg Total vehicle mass (655+185+140+220) 1200 Kg
In the hybrid powertrain, fuel cell stack supplies the base power, Pe, to meet the vehicle power requirement for cruising and/or driving on road with grade. The equation is [4]
emt
fDare
VigmVACfgmP
ηηρ
⋅⋅
⋅⋅⋅++⋅⋅=
1000)( 2
21
, Eq. 5-1
where m is the vehicle mass (assumed to be 1200 kg); i is road grade; nem is motor average efficiency (assumed to be 0.90). Then, from calculation, Pe is 25 kW under cruised speed of 100 km/h on flat road; Pe is 75.6 kW under maximum speed of 150 km/h on flat road; assuming a maximum grade of 10% at 100 km/h, Pe is 64.5 kW. This determines the size of the fuel cell for steady driving. This clearly explains that the power of fuel cell stack is 80 kW.
38
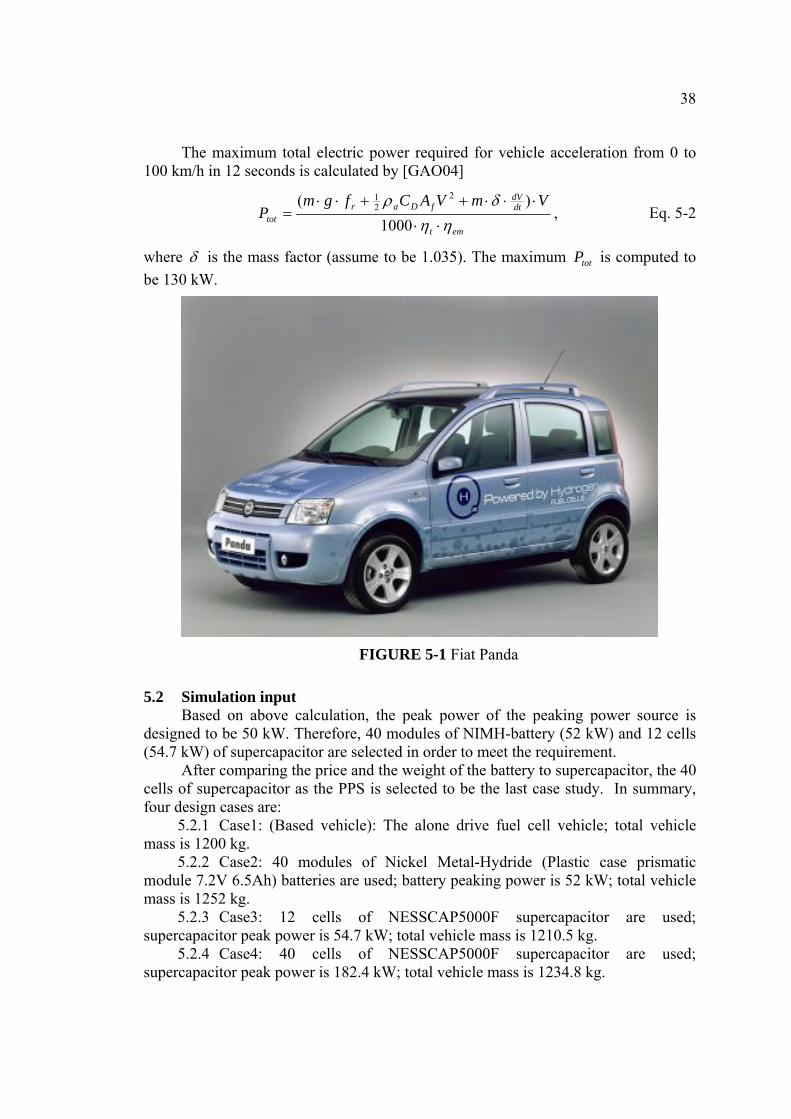
The maximum total electric power required for vehicle acceleration from 0 to 100 km/h in 12 seconds is calculated by [GAO04]
emt
dtdV
fDartot
VmVACfgmP
ηηδρ
⋅⋅
⋅⋅⋅++⋅⋅=
1000)( 2
21
, Eq. 5-2
where δ is the mass factor (assume to be 1.035). The maximum totP is computed to be 130 kW.
FIGURE 5-1 Fiat Panda
5.2 Simulation input Based on above calculation, the peak power of the peaking power source is
designed to be 50 kW. Therefore, 40 modules of NIMH-battery (52 kW) and 12 cells (54.7 kW) of supercapacitor are selected in order to meet the requirement.
After comparing the price and the weight of the battery to supercapacitor, the 40 cells of supercapacitor as the PPS is selected to be the last case study. In summary, four design cases are:
5.2.1 Case1: (Based vehicle): The alone drive fuel cell vehicle; total vehicle mass is 1200 kg.
5.2.2 Case2: 40 modules of Nickel Metal-Hydride (Plastic case prismatic module 7.2V 6.5Ah) batteries are used; battery peaking power is 52 kW; total vehicle mass is 1252 kg.
5.2.3 Case3: 12 cells of NESSCAP5000F supercapacitor are used; supercapacitor peak power is 54.7 kW; total vehicle mass is 1210.5 kg.
5.2.4 Case4: 40 cells of NESSCAP5000F supercapacitor are used; supercapacitor peak power is 182.4 kW; total vehicle mass is 1234.8 kg.

39
TABLE 5-2 Study cases comparison
Setting Case 1 (Base) Case 2 Vehicle class Fiat Panda Fiat Panda Fuel Hydrogen Hydrogen Oxidant Air Air Fuel storage Compressed gas, 700 bar Compressed gas, 700 bar Drive cycle NEDC, HYZEM-Highway and FTP75 NEDC, HYZEM-Highway and FTP75 Fuel cell 80 kW, PEMFC 80 kW, PEMFC
Peaking Power Source (PPS)
No PPS
Battery NiMH Model: Panasonic Prismatic 40 Module Nominal Voltage: 40x7.2 V (288 V) Nominal Capacitor 6.5 Ah Specific Power: 40x1300 W (52 kW) Specific Energy: 46 Wh/kg Total weight: 52 kg including case Max. Stored Energy: 1.913 kWh
Cost of PPS ($) 0 1920 (Appendix: B)
Motor Permanent magnet, water cooling 200 Nm, nmax = 6000 rpm, 80 kW
Permanent magnet, water cooling 200 Nm, nmax = 6000 rpm, 80 kW
Driving strategy Fuel cell drive alone Function of SOC Total vehicle mass 1200 kg 1252 kg
Setting Case 3 Case 4 Vehicle class Fiat Panda Fiat Panda Fuel Hydrogen Hydrogen Oxidant Air Air Fuel storage Compressed gas, 700 bar Compressed gas, 700 bar Drive cycle NEDC, HYZEM-Highway and FTP75 NEDC, HYZEM-Highway and FTP75 Fuel cell 80 kW, PEMFC 80 kW, PEMFC
Peaking Power Source (PPS)
Supercapacitor NESSCAP 5000F Model: HP5000P-0027A, 12 cells Nominal Voltage: 12x2.7 V (32.4 V) Specific Power: 12x4559 W (54.7 kW) Speific Energy: 5.82 Wh/kg Total weight: 10.44 kg Max.stored Energy: 60.76 Wh
Supercapacitor NESSCAP 5000F Model: HP5000P-0027A, 40 cells Nominal Voltage: 40x2.7 V (108 V) Specific Power: 40x4559 W(182.4kW) Speific Energy: 5.82 Wh/kg Total weight: 34.8 kg Max. Stored Energy: 202.5 Wh
Cost of PPS ($) 600 2000
Motor Permanent magnet, water cooling 200 Nm, nmax = 6000 rpm, 80 kW
Permanent magnet, water cooling 200 Nm, nmax = 6000 rpm, 80 kW
Driving strategy Function of SOC Function of SOC Total vehicle mass 1210.5 kg 1234.8 kg
40
5.3 Simulation output The simulation studies cover vehicle performance, fuel economy, battery,
supercapacitor and fuel cell stack sizing. 5.3.1 Performance study
TABLE 5-3 Vehicle Performance
0-60 km/h (sec)
0-100 km/h (sec)
0-140 km/h (sec)
Max speed (km/h)
Max grade at 100 km/h
Case 1 6.4 13.2 27.6 167.4 12.8%
Case 2 6.5 11.9 20.7 173.8 18.3%
Case 3 6.3 11.9 25.4 167.9 18.9%
Case 4 6.4 11.7 20.9 169.3 18.6%
The simulated vehicle performance is listed in Table 5-3. The acceleration performances are the time for vehicle to accelerate from 0 to 60 km/h, from 0 to 100 km/h, and from 0 to 140 km/h. The maximum speed of the vehicle within 60 seconds is included as well as the maximum sustainable grade at 100 km/h. Without the PPS in the first case, the based vehicle has poor acceleration, lowest top speed and lowest sustainable grade. In the second case, battery as the PPS helps the vehicle running at the maximum speed and best acceleration from 0 to 140 due to its long lasting energy than the others. In the case 3, the vehicle has the best acceleration during 0-60 km/h and maximum sustainable grade corresponding to its minimum PPS weight (10.5 kg). However, it has the poor acceleration from 0 to 140 km/h due to the energy of PPS is empty. The case 4 has a best acceleration from 0 to 100 km/h.
According to the design, case 2 and 3 have the same hybridization degree (refer to section 4.2), thus both two cases should have the same acceleration as long as the energy remains in the PPS. However, because of its light weight, the acceleration in case 3 is better than case 2 in short acceleration period (0-60 km/h) and maximum sustainable grade. Since the vehicle acceleration depends on the ability to supply the power to the traction motor and is limited by the maximum motor torque no matter how much excessive power. This is the reason why the bigger hybridization degree in case 4 still has the quite same acceleration to case 2 and case 3.
5.3.2 Fuel economy study Since the fuel cell system is the primary power source of fuel cell hybrid
vehicles, the study of the pure fuel cell vehicle is necessary. To get the operating characteristics, it has to run under the initial conditions according to Table 5-2 on the slow speed ramp cycle. The data collected from the test are plotted as shown in Figure 5-2. The hydrogen power is hydrogen consumed rate (nH2) multiplied by the lower heating value (241905.6 J/mol).
[ ] [ ] [ ]1000
/__/_ 2 molJvalueheatinglowersmolHnkWpowerhydrogen ×=&
Eq. 5-3
As a result, the fuel cell stack power and the hydrogen power depend quite linearly on the current density. The compressor power is limited by the compressor

41
motor model, however, it still plays the major role among the other auxiliary powers. The net fuel cell power is the fuel cell power subtracted by all auxiliary powers. The mechanical power is calculated at the traction wheels.
PowerAuxiliaryAllPowerStackFCPowerFCNet ______ −= Eq. 5-4
FIGURE 5-2 The system power
In Figure 5-3, the cell voltage is same as polarization curve as shown in Figure 2-3. The fuel cell stack power is denoted by the current density. The system efficiency is obtained from the mechanical power divided by the hydrogen power.
[ ] 100__%_ ×=powerHydrogenpowerMechanicalefficiencySystem Eq. 5-5
The maximum of system efficiency is around 50 percent and the optimal operating region is between 7800 to 27700 Watts by fixed system efficiency above 48 percent. These two values will be used as the low operating point and high operating point for optimum power region in FC.
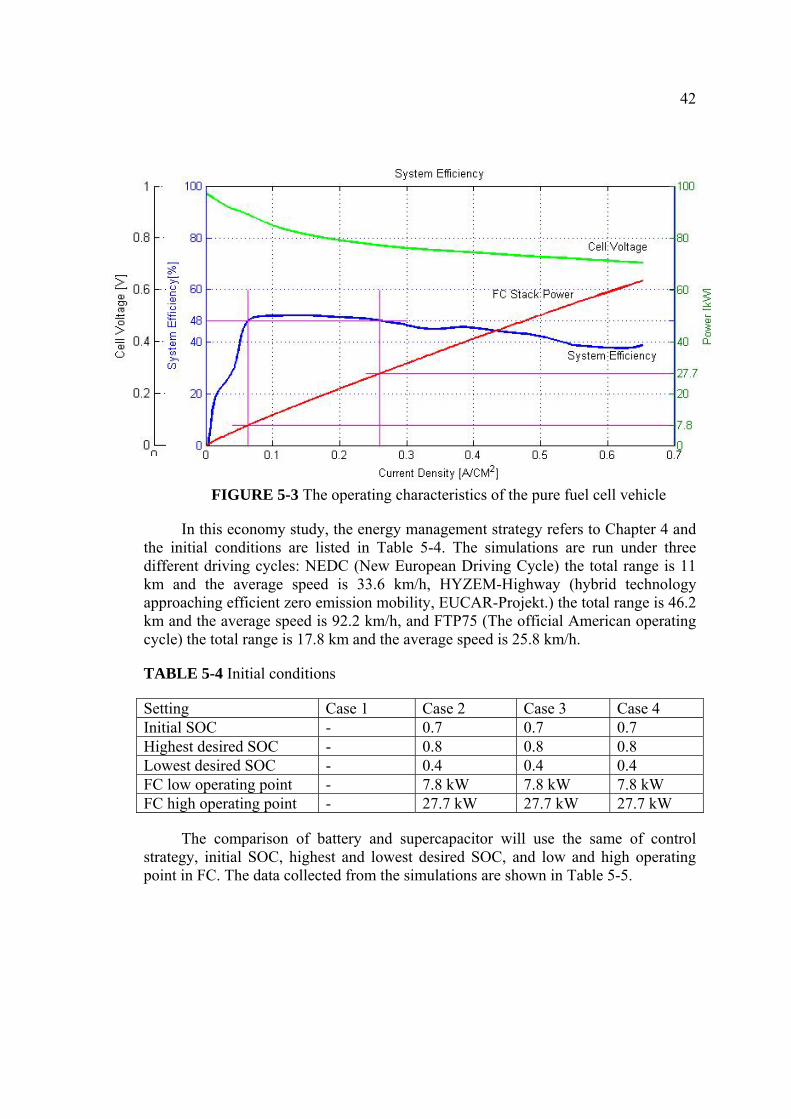
42
FIGURE 5-3 The operating characteristics of the pure fuel cell vehicle
In this economy study, the energy management strategy refers to Chapter 4 and the initial conditions are listed in Table 5-4. The simulations are run under three different driving cycles: NEDC (New European Driving Cycle) the total range is 11 km and the average speed is 33.6 km/h, HYZEM-Highway (hybrid technology approaching efficient zero emission mobility, EUCAR-Projekt.) the total range is 46.2 km and the average speed is 92.2 km/h, and FTP75 (The official American operating cycle) the total range is 17.8 km and the average speed is 25.8 km/h.
TABLE 5-4 Initial conditions
Setting Case 1 Case 2 Case 3 Case 4 Initial SOC - 0.7 0.7 0.7 Highest desired SOC - 0.8 0.8 0.8 Lowest desired SOC - 0.4 0.4 0.4 FC low operating point - 7.8 kW 7.8 kW 7.8 kW FC high operating point - 27.7 kW 27.7 kW 27.7 kW
The comparison of battery and supercapacitor will use the same of control strategy, initial SOC, highest and lowest desired SOC, and low and high operating point in FC. The data collected from the simulations are shown in Table 5-5.

43
TABLE 5-5 Power consumption
Drive cycle Case 1 Case 2 Case 3 Case4
NEDC 11 km
H2 energy consumption [kWh] 2.6771 3.0553 2.6417 2.6200 SOC at the end - 0.8081 0.8949 0.8476 Sum PPS energy [kWh] - -0.2068 -0.0118 -0.0299 Net used energy [kWh] 2.6771 2.8485 2.6299 2.5901 Motor recuperative energy [kWh] - 0.1467 0.1393 0.1422
Mechanical energy [kWh] 1.2042 1.2396 1.2135 1.2291 Fuel consumption [kWh/km] 0.2434 0.2590 0.2391 0.2355 System efficiency [%] 44.98 44.20 45.94 47.46
HYZEM 46.2 km
H2 energy consumption [kWh] 18.9408 15.8502 17.0256 15.6857 SOC at the end - 0.7691 0.7823 0.6888 Sum PPS energy [kWh] - -0.1321 -0.0050 0.0023 Net used energy [kWh] 18.9408 15.7181 17.0206 15.6880 Motor recuperative energy [kWh] - 0.3724 3.522 3.607
Mechanical energy [kWh] 7.4544 7.5975 7.5012 7.5586 Fuel consumption [kWh/km] 0.4100 0.3402 0.3684 0.3396 System efficiency [%] 39.36 48.34 44.06 48.18
FTP75 17.8 km
H2 energy consumption [kWh] 4.7711 4.2379 4.1974 4.1118 SOC at the end - 0.6945 0.8801 0.7393 Sum PPS energy [kWh] - 0.0105 -0.0109 -0.0080 Net used energy [kWh] 4.7711 4.2484 4.1865 4.1038 Motor recuperative energy [kWh] - 0.3490 0.3314 0.3367
Mechanical energy [kWh] 1.9531 2.0247 1.9785 2.0072 Fuel consumption [kWh/km] 0.2680 0.2387 0.2352 0.2306 System efficiency [%] 40.94 47.66 47.26 48.91
The hydrogen energy consumption is the total amount of hydrogen (mol) multiplied by the lower heating value (J/mol). The sum PPS energy is obtained by balancing of SOC at the end of the drive cycle multiplied by the maximum stored energy of PPS which is provided in Table 5-2. Negative value means the excessive stored energy in PPS compared to the initial. The net used energy is the summation of the hydrogen consumption and the sum PPS energy. The motor recuperative energy is obtained by integration of the negative motor output power and multiplied by the motor efficiency. The mechanical energy is obtained by integration of the positive mechanical power calculated at the traction wheel. The fuel consumption is the Net

44
used energy divided by the total distance of each test cycle. Finally, the system efficiency is the result of mechanical power divided by the net energy consumption.
To better illustrate the difference and facilitate the comparison and analysis, the power demand and vehicle speed, the fuel cell power and cell efficiency, and the PPS power and SOC are plotted versus time. The simulation results under NEDC, HYZEM-highway, and FTP75 are given in Figure 5-4 to 5-7, Figure 5-8 to 5-11, and Figure 5-12 to 5-15 respectively.
From the all figures, the real vehicle speed is plotted in subscription (a) and corresponds to the test cycle. The power demand is the sum of the electrical motor and the auxiliary power demands including the compressor. The power demand shows the good response to the vehicle speed, for example, the power demand increases when accelerate, deceases to the lower power level when run at constant velocity and deceases to zero when decelerate. If there is a PPS, the regenerative mode is active, so the negative power is possible. The fuel cell power and the cell efficiency are shown in subscription (b). Due to the fuel cell stack cannot rapidly turn-off and turn-on, so it must operate at idle and during this time the cell efficiency is high (77%). For hybrid system, the PPS and its state of charge (SOC) are shown in subscription (c). With the initial SOC (0.7), the fuel cell stack has to charge the PPS until the SOC reaches the desired level (0.8). It is apparently seen that the battery needs more energy and time than the others due to its highest specific energy. Its SOC curve also is the smoothest.
The motor recuperative energy can be expressed as the energy storage recuperative ability because it is calculated by negative motor output power limited by the energy storage conditions such as the specific power and the state of charge. From Table 5-5, case 2, 3 and 4 show the motor recuperative energy without much difference. This means the NiMH battery and the supercapacitor have the sufficient ability to recuperate the braking energy in the simulation conditions. It is noted that case 2 has the highest mechanical energy as well as motor recuperative energy due to its maximum weight. However, the real recuperate energy must include the efficiency of AC/DC converter, DC/DC converter and internal loss of the energy storage.
In conclusion, on NEDC, the hybrid vehicles perform better than pure fuel cell vehicle except for the fuel cell-battery hybrid because of the losses of charging at high velocity during the time from 970 to 1050 second or the unsuitable energy management strategy for this situation. In contrast, the fuel cell-supercapacitor hybrid in case 3 and 4 improves the fuel consumption by 3.6% and 3.9% respectively. Case 4 has better performance than case 3 because there is more stored energy that can meet the vehicle power requirement for acceleration. For example in Figure 5-5 (a), the maximum of the power demand is higher than the others because of lacking of the PPS power. The compressor has to boost the speed to supply the sufficient oxygen to cathode of fuel cell stack. Therefore, it needs more power demand.

45
FIGURE 5-4 Case 1 (fuel cell alone drive) on NEDC
FIGURE 5-5 Case 2 (battery 40 modules) on NEDC
(a)
(b)
Time [s]
(a)
(b)
(c)
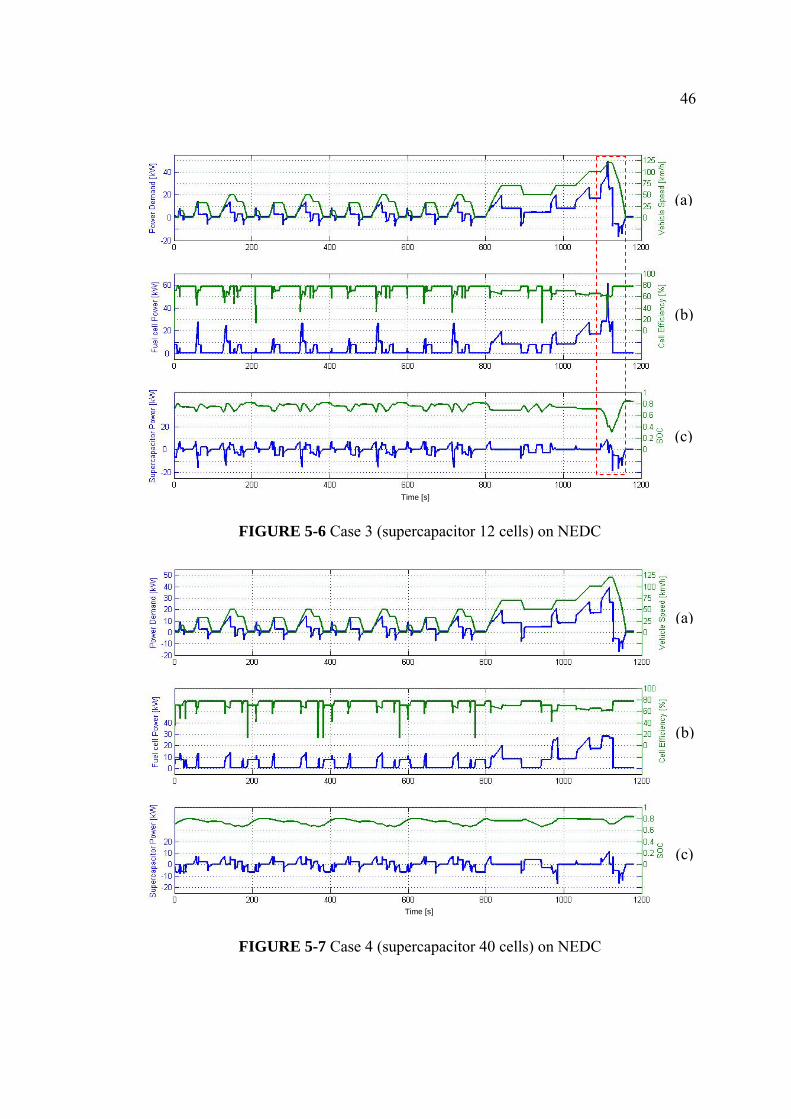
46
FIGURE 5-6 Case 3 (supercapacitor 12 cells) on NEDC
FIGURE 5-7 Case 4 (supercapacitor 40 cells) on NEDC
Time [s]
(a)
(b)
(c)
(a)
(b)
(c)
Time [s]

47
FIGURE 5-8 Case 1 (fuel cell alone drive) on HYZEM-Highway
FIGURE 5-9 Case 2 (battery 40 modules) on HYZEM-Highway
Time [s]
(a)
(b)
(c)
(a)
(b)
48
FIGURE 5-10 Case 3 (supercapacitor 12 cells) on HYZEM-Highway
FIGURE 5-11 Case 4 (supercapacitor 40 cells) on HYZEM-Highway
(a)
(b)
(c)
Time [s]
(a)
(b)
(c)

49
FIGURE 5-12 Case 1 (fuel cell alone drive) on FTP75
FIGURE 5-13 Case 2 (battery 40 modules) on FTP75
(a)
(b)
(c)
(a)
(b)
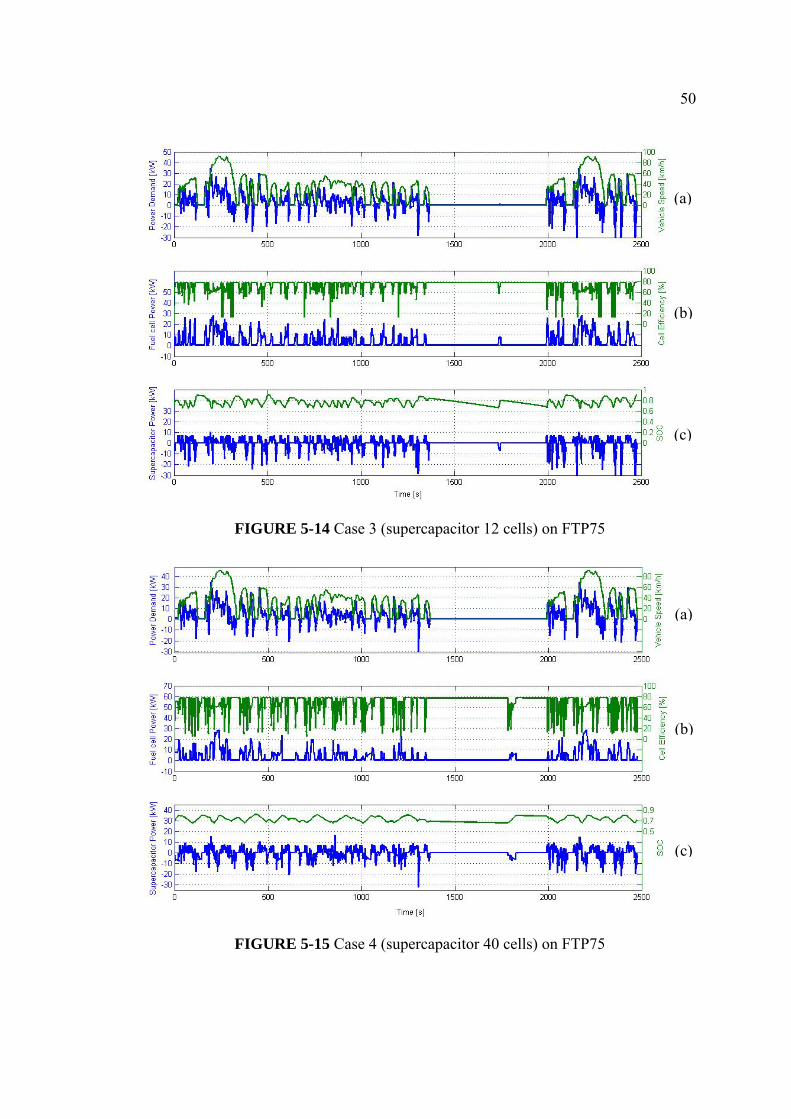
50
FIGURE 5-14 Case 3 (supercapacitor 12 cells) on FTP75
FIGURE 5-15 Case 4 (supercapacitor 40 cells) on FTP75
(a)
(b)
(c)
(a)
(b)
(c)
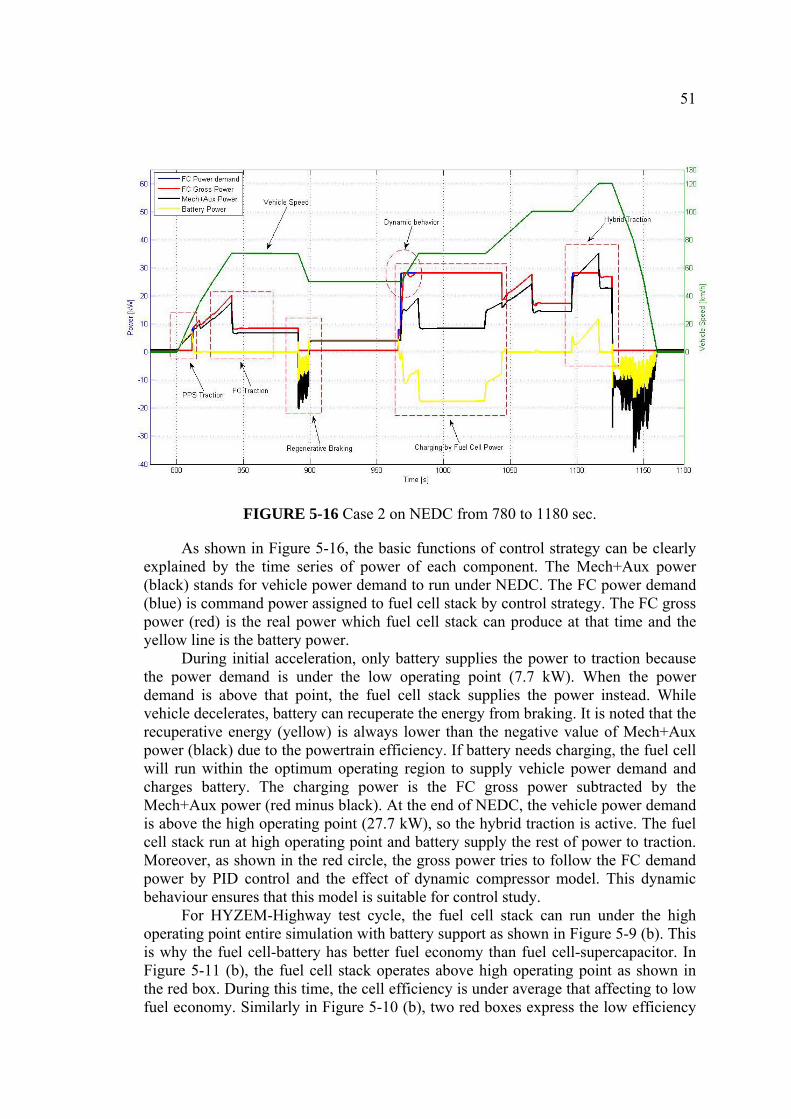
51
FIGURE 5-16 Case 2 on NEDC from 780 to 1180 sec.
As shown in Figure 5-16, the basic functions of control strategy can be clearly explained by the time series of power of each component. The Mech+Aux power (black) stands for vehicle power demand to run under NEDC. The FC power demand (blue) is command power assigned to fuel cell stack by control strategy. The FC gross power (red) is the real power which fuel cell stack can produce at that time and the yellow line is the battery power.
During initial acceleration, only battery supplies the power to traction because the power demand is under the low operating point (7.7 kW). When the power demand is above that point, the fuel cell stack supplies the power instead. While vehicle decelerates, battery can recuperate the energy from braking. It is noted that the recuperative energy (yellow) is always lower than the negative value of Mech+Aux power (black) due to the powertrain efficiency. If battery needs charging, the fuel cell will run within the optimum operating region to supply vehicle power demand and charges battery. The charging power is the FC gross power subtracted by the Mech+Aux power (red minus black). At the end of NEDC, the vehicle power demand is above the high operating point (27.7 kW), so the hybrid traction is active. The fuel cell stack run at high operating point and battery supply the rest of power to traction. Moreover, as shown in the red circle, the gross power tries to follow the FC demand power by PID control and the effect of dynamic compressor model. This dynamic behaviour ensures that this model is suitable for control study.
For HYZEM-Highway test cycle, the fuel cell stack can run under the high operating point entire simulation with battery support as shown in Figure 5-9 (b). This is why the fuel cell-battery has better fuel economy than fuel cell-supercapacitor. In Figure 5-11 (b), the fuel cell stack operates above high operating point as shown in the red box. During this time, the cell efficiency is under average that affecting to low fuel economy. Similarly in Figure 5-10 (b), two red boxes express the low efficiency
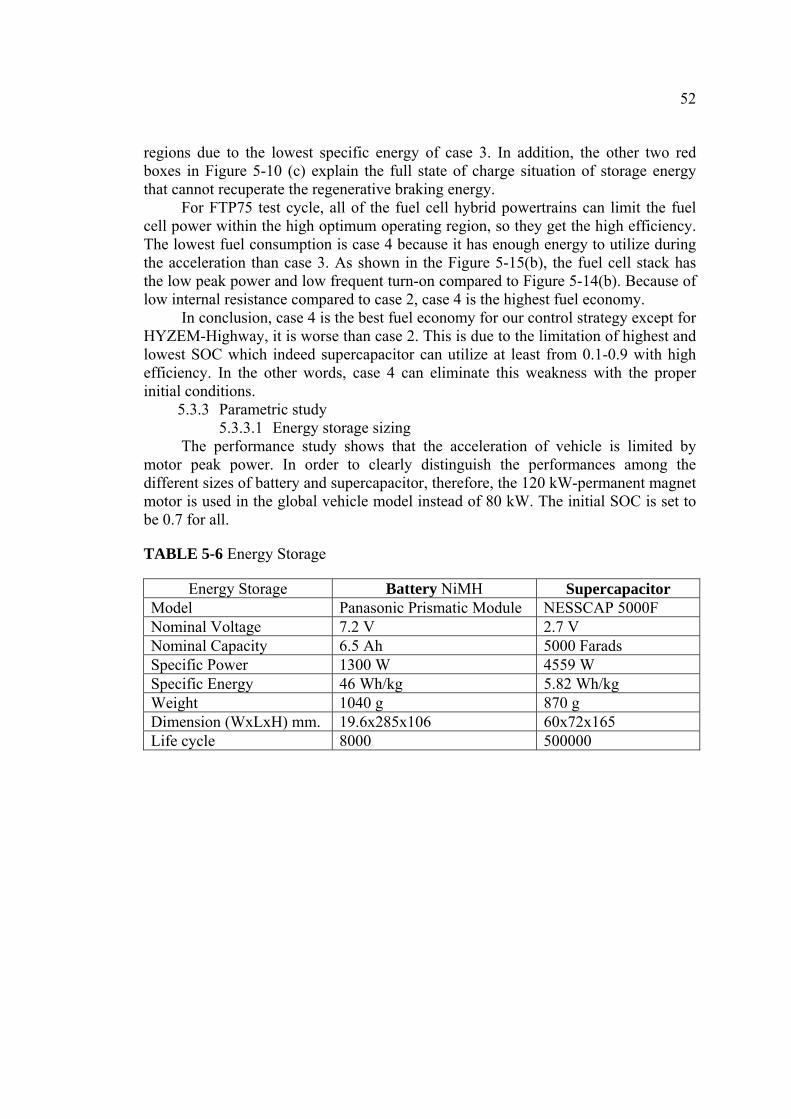
52
regions due to the lowest specific energy of case 3. In addition, the other two red boxes in Figure 5-10 (c) explain the full state of charge situation of storage energy that cannot recuperate the regenerative braking energy.
For FTP75 test cycle, all of the fuel cell hybrid powertrains can limit the fuel cell power within the high optimum operating region, so they get the high efficiency. The lowest fuel consumption is case 4 because it has enough energy to utilize during the acceleration than case 3. As shown in the Figure 5-15(b), the fuel cell stack has the low peak power and low frequent turn-on compared to Figure 5-14(b). Because of low internal resistance compared to case 2, case 4 is the highest fuel economy.
In conclusion, case 4 is the best fuel economy for our control strategy except for HYZEM-Highway, it is worse than case 2. This is due to the limitation of highest and lowest SOC which indeed supercapacitor can utilize at least from 0.1-0.9 with high efficiency. In the other words, case 4 can eliminate this weakness with the proper initial conditions.
5.3.3 Parametric study 5.3.3.1 Energy storage sizing
The performance study shows that the acceleration of vehicle is limited by motor peak power. In order to clearly distinguish the performances among the different sizes of battery and supercapacitor, therefore, the 120 kW-permanent magnet motor is used in the global vehicle model instead of 80 kW. The initial SOC is set to be 0.7 for all.
TABLE 5-6 Energy Storage
Energy Storage Battery NiMH SupercapacitorModel Panasonic Prismatic Module NESSCAP 5000F Nominal Voltage 7.2 V 2.7 V Nominal Capacity 6.5 Ah 5000 Farads Specific Power 1300 W 4559 W Specific Energy 46 Wh/kg 5.82 Wh/kg Weight 1040 g 870 g Dimension (WxLxH) mm. 19.6x285x106 60x72x165 Life cycle 8000 500000
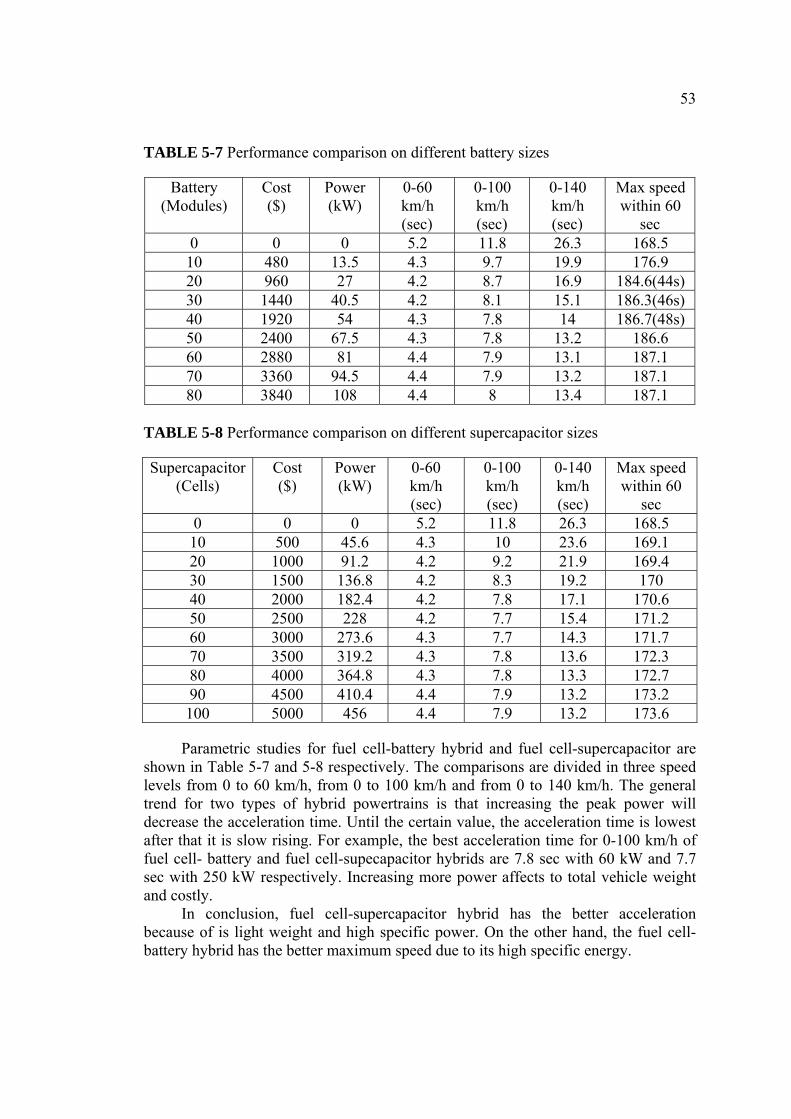
53
TABLE 5-7 Performance comparison on different battery sizes
Battery (Modules)
Cost ($)
Power (kW)
0-60 km/h (sec)
0-100 km/h (sec)
0-140 km/h (sec)
Max speed within 60
sec 0 0 0 5.2 11.8 26.3 168.5 10 480 13.5 4.3 9.7 19.9 176.9 20 960 27 4.2 8.7 16.9 184.6(44s) 30 1440 40.5 4.2 8.1 15.1 186.3(46s) 40 1920 54 4.3 7.8 14 186.7(48s) 50 2400 67.5 4.3 7.8 13.2 186.6 60 2880 81 4.4 7.9 13.1 187.1 70 3360 94.5 4.4 7.9 13.2 187.1 80 3840 108 4.4 8 13.4 187.1
TABLE 5-8 Performance comparison on different supercapacitor sizes
Supercapacitor (Cells)
Cost ($)
Power (kW)
0-60 km/h (sec)
0-100 km/h (sec)
0-140 km/h (sec)
Max speed within 60
sec 0 0 0 5.2 11.8 26.3 168.5 10 500 45.6 4.3 10 23.6 169.1 20 1000 91.2 4.2 9.2 21.9 169.4 30 1500 136.8 4.2 8.3 19.2 170 40 2000 182.4 4.2 7.8 17.1 170.6 50 2500 228 4.2 7.7 15.4 171.2 60 3000 273.6 4.3 7.7 14.3 171.7 70 3500 319.2 4.3 7.8 13.6 172.3 80 4000 364.8 4.3 7.8 13.3 172.7 90 4500 410.4 4.4 7.9 13.2 173.2 100 5000 456 4.4 7.9 13.2 173.6
Parametric studies for fuel cell-battery hybrid and fuel cell-supercapacitor are shown in Table 5-7 and 5-8 respectively. The comparisons are divided in three speed levels from 0 to 60 km/h, from 0 to 100 km/h and from 0 to 140 km/h. The general trend for two types of hybrid powertrains is that increasing the peak power will decrease the acceleration time. Until the certain value, the acceleration time is lowest after that it is slow rising. For example, the best acceleration time for 0-100 km/h of fuel cell- battery and fuel cell-supecapacitor hybrids are 7.8 sec with 60 kW and 7.7 sec with 250 kW respectively. Increasing more power affects to total vehicle weight and costly.
In conclusion, fuel cell-supercapacitor hybrid has the better acceleration because of is light weight and high specific power. On the other hand, the fuel cell-battery hybrid has the better maximum speed due to its high specific energy.
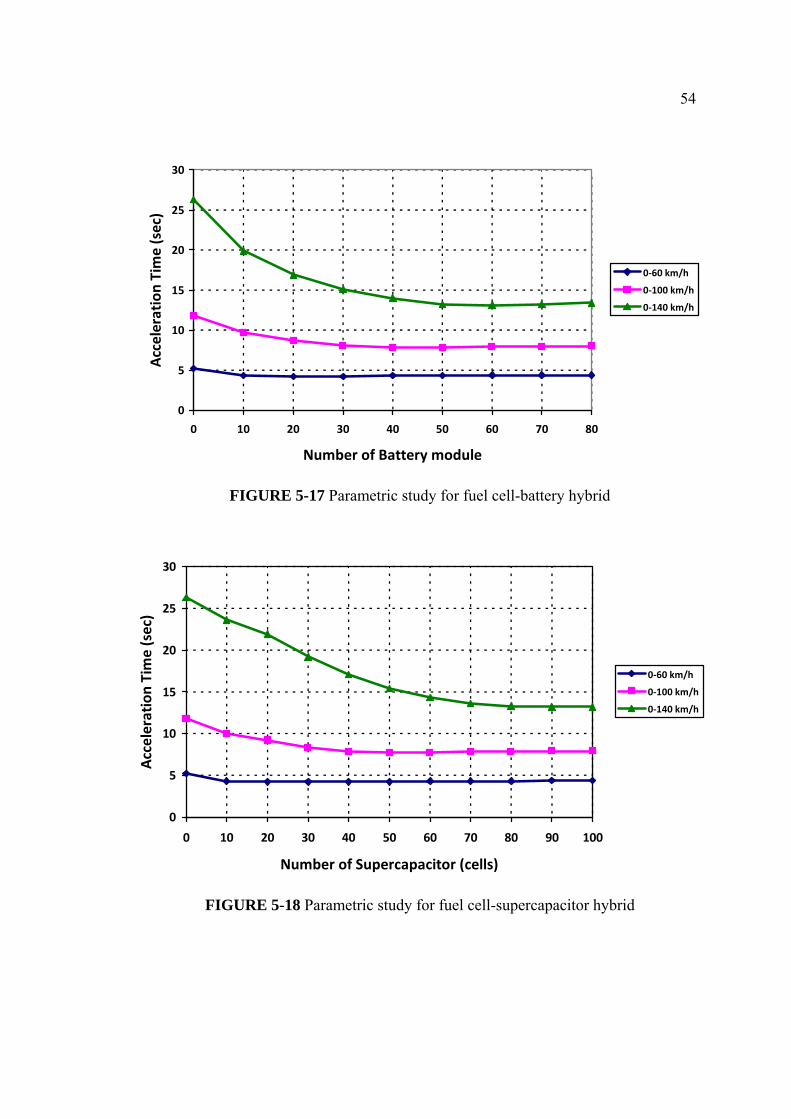
54
0
5
10
15
20
25
30
0 10 20 30 40 50 60 70 80
Number of Battery module
Acceleration Time (sec)
0‐60 km/h
0‐100 km/h
0‐140 km/h
FIGURE 5-17 Parametric study for fuel cell-battery hybrid
0
5
10
15
20
25
30
0 10 20 30 40 50 60 70 80 90 100
Number of Supercapacitor (cells)
Acceleration Time (sec)
0‐60 km/h
0‐100 km/h
0‐140 km/h
FIGURE 5-18 Parametric study for fuel cell-supercapacitor hybrid

55
Concerning to the fuel consumption, the simulation with different size of battery and supercapacitor on FTP75 are evaluated and presented in the table.
TABLE 5-9 Fuel economy comparison on different battery sizes
Battery module
10 20 30 40 50 60 H2 energy consumption [kWh] 4.4389 4.2942 4.4920 4.2379 4.4103 4.8631
SOC at the end 0.7380 0.7219 0.7830 0.6945 0.7375 0.7920
Sum PPS energy [kWh] -0.0182 -0.0209 -0.1191 0.0105 -0.0897 -0.2640
Net used energy [kWh] 4.4207 4.2733 4.3729 4.2484 4.3206 4.5991
Mechanical energy [kWh] 1.9785 1.9939 2.0093 2.0247 2.0403 2.0556 Fuel consumption [kWh/km] 0.2484 0.2401 0.2457 0.2387 0.2427 0.2584
System efficiency [%] 44.76 46.66 45.95 47.66 47.22 45.09
TABLE 5-10 Fuel economy comparison on different supercapacitor sizes
Supercapacitor (Cells)
12 20 40 60 80 100 H2 energy consumption [kWh] 4.1974 4.1494 4.1118 4.1582 4.2679 4.3064
SOC at the end 0.8801 0.7725 0.7393 0.6957 0.7719 0.7449
Sum PPS energy [kWh] -0.0109 -0.0088 -0.0080 0.0013 -0.0291
-0.0227
Net used energy [kWh] 4.1865 4.1406 4.1038 4.1595 4.2388 4.2837
Mechanical energy [kWh] 1.9785 1.9866 2.0072 2.0267 2.0477 2.0684
Fuel consumption [kWh/km] 0.2352 0.2326 0.2306 0.2337 0.2381 0.2407
System efficiency [%] 47.26 47.98 48.91 48.72 48.31 48.03
The comparison shows that the best battery size is 40 modules and supercapacitor is 40 cells which are our case study. The supercapacitor has fuel consumption and system efficiency better than the battery because of its low weight and low internal resistance.
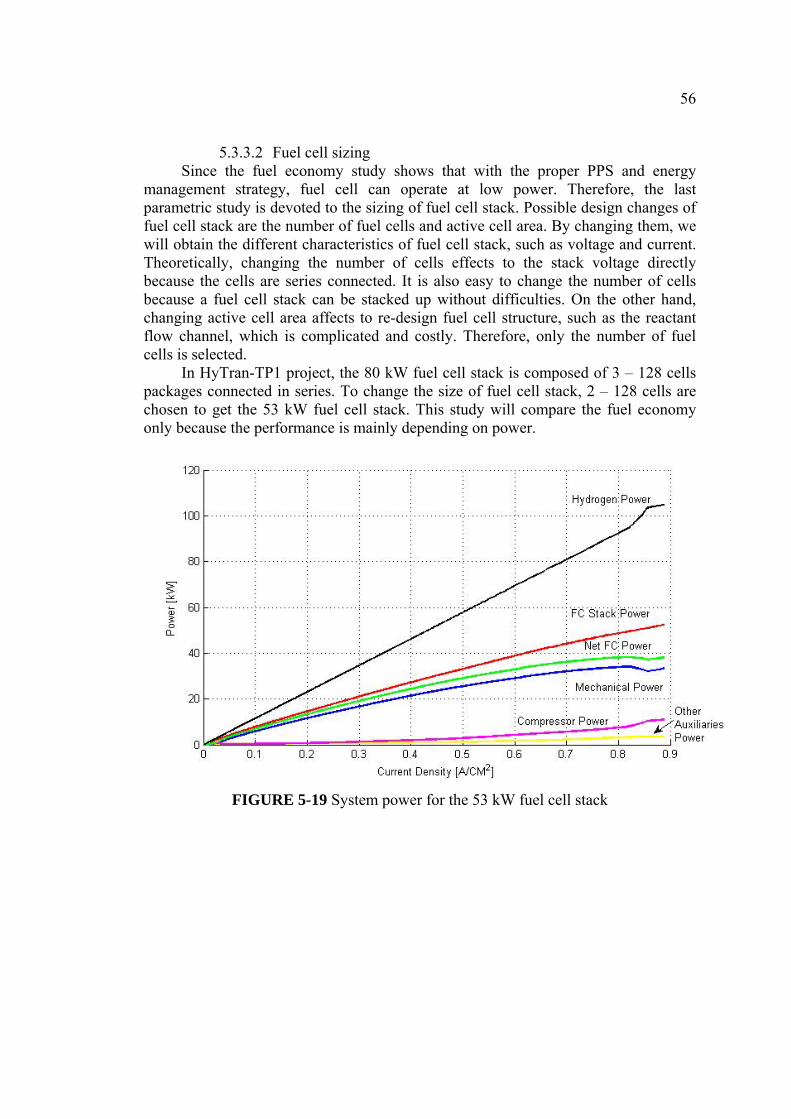
56
5.3.3.2 Fuel cell sizing Since the fuel economy study shows that with the proper PPS and energy
management strategy, fuel cell can operate at low power. Therefore, the last parametric study is devoted to the sizing of fuel cell stack. Possible design changes of fuel cell stack are the number of fuel cells and active cell area. By changing them, we will obtain the different characteristics of fuel cell stack, such as voltage and current. Theoretically, changing the number of cells effects to the stack voltage directly because the cells are series connected. It is also easy to change the number of cells because a fuel cell stack can be stacked up without difficulties. On the other hand, changing active cell area affects to re-design fuel cell structure, such as the reactant flow channel, which is complicated and costly. Therefore, only the number of fuel cells is selected.
In HyTran-TP1 project, the 80 kW fuel cell stack is composed of 3 – 128 cells packages connected in series. To change the size of fuel cell stack, 2 – 128 cells are chosen to get the 53 kW fuel cell stack. This study will compare the fuel economy only because the performance is mainly depending on power.
FIGURE 5-19 System power for the 53 kW fuel cell stack

57
FIGURE 5-20 System efficiency for the 53 kW fuel cell stack
The system powers and the system efficiency are plotted in Figure 5-19 and
Figure 5-20 respectively. The system efficiency is found out by the same procedure as section 5.3.2. By limiting the system efficiency at 48 percents, the low operating point is 6.14 kW and the high operating point is 22.91 kW. These values are used as a fixed parameter for the control strategy. We assumed that the weight of fuel cell stack will linearly decrease by 33% (70 kg). The study is still divided into 4 cases.
Case 1 (Based vehicle): The alone drive fuel cell vehicle; total vehicle mass is 1130 kg.
Case 2: 40 modules of Nickel Metal-Hydride (Plastic case prismatic module 7.2V 6.5Ah) batteries are used; battery peaking power is 52 kW; total vehicle mass is 1182 kg.
Case 3: 12 cells of NESSCAP5000F supercapacitor are used; supercapacitor peak power is 54.7 kW; total vehicle mass is 1140.5 kg.
Case 4: 40 cells of NESSCAP5000F supercapacitor are used; supercapacitor peak power is 182.4 kW; total vehicle mass is 1164.8 kg.
The simulations are performed under the NEDC, HYZEM-Highway, and FTP75 and the results are shown in Table 5-11.

58
TABLE 5-11 Power consumption of 53 kW fuel cell stack
Drive cycle Case 1 Case 2 Case 3 Case4
NEDC
11 km
H2 energy consumption [kWh] 2.6195 2.4880 2.5004 2.4866
SOC at the end - 0.6963 0.8769 0.7986
Sum PPS energy [kWh] - 0.0071 -0.0107 -0.0200
Net used energy [kWh] 2.6195 2.4951 2.4897 2.4666
Motor recuperative energy [kWh] - 0.1365 0.1285 0.1318
Mechanical energy [kWh] 1.1603 1.1953 1.1696 1.1849
Fuel consumption [kWh/km] 0.2381 0.2268 0.2263 0.2242
System efficiency [%] 44.30 47.91 46.98 48.03
HYZEM
46.2 km
H2 energy consumption [kWh] 19.3679 16.3707 17.8503 16.4966
SOC at the end - 0.7805 0.8510 0.7594
Sum PPS energy [kWh] - -0.1540 -0.0092 -0.0120
Net used energy [kWh] 19.3679 16.2167 17.8411 16.4846
Motor recuperative energy [kWh] - 0.3474 0.3256 0.3357
Mechanical energy [kWh] 7.2918 7.4313 7.3355 7.3925
Fuel consumption [kWh/km] 0.4192 0.3510 0.3862 0.3568
System efficiency [%] 37.65 45.82 41.12 44.81
FTP75
17.8 km
H2 energy consumption [kWh] 4.5981 4.4762 4.0018 3.9560
SOC at the end - 0.7966 0.8522 0.7090
Sum PPS energy [kWh] - -0.1848 -0.0092 -0.0018
Net used energy [kWh] 4.5981 4.2914 3.9926 3.9542
Motor recuperative energy [kWh] - 0.3261 0.3088 31.53
Mechanical energy [kWh] 1.8711 1.9421 1.8963 1.9252
Fuel consumption [kWh/km] 0.2583 0.2411 0.2243 0.2221
System efficiency [%] 40.69 45.25 47.49 48.69
As same as the 80 kW hybrid fuel cell stack, two types of hybrid powertrains with 53 kW fuel cell stack have the better fuel economy compared to 53 kW fuel cell vehicle. For example, running on NEDC shows that case 2, case 3 and case 4 have lower fuel consumption by 4.7%, 5.0% and 5.8% respectively.
Focusing on fuel economy parameters, the comparison of 80 kW and 53 kW fuel cell stacks are shown in Table 5-12.
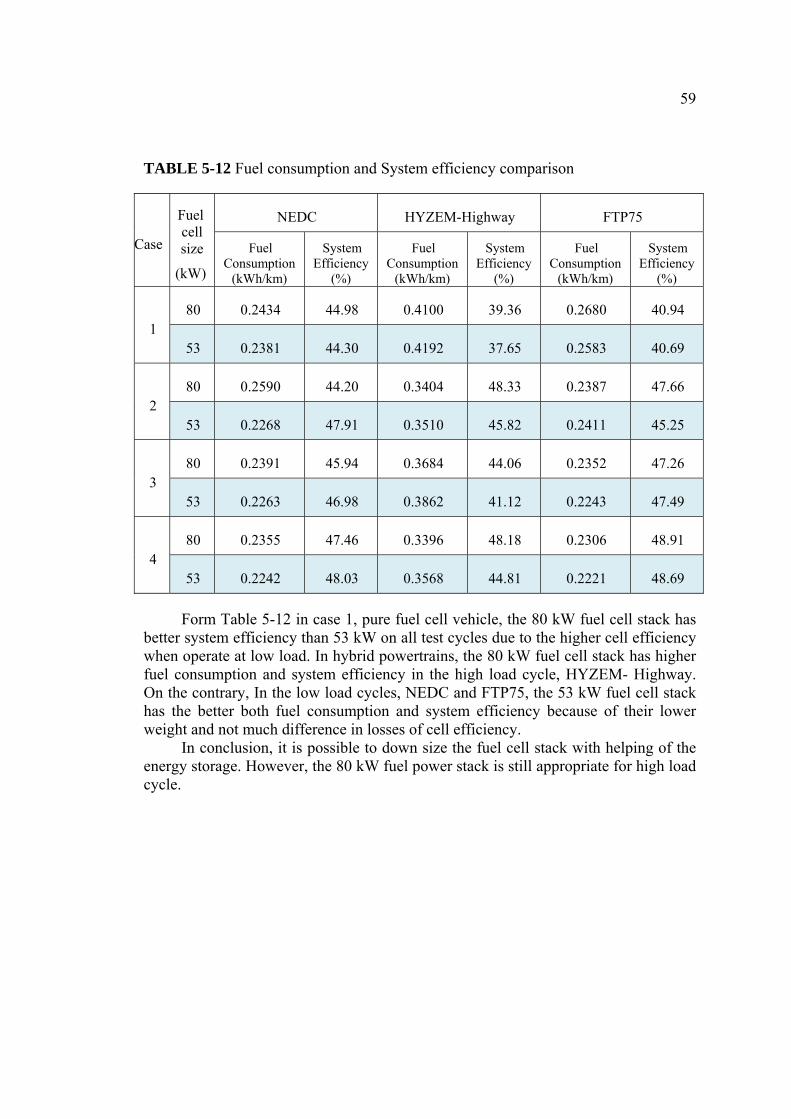
59
TABLE 5-12 Fuel consumption and System efficiency comparison
Case
Fuel cell size
(kW)
NEDC HYZEM-Highway FTP75
Fuel Consumption
(kWh/km)
System Efficiency
(%)
Fuel Consumption
(kWh/km)
System Efficiency
(%)
Fuel Consumption
(kWh/km)
System Efficiency
(%)
1 80 0.2434 44.98 0.4100 39.36 0.2680 40.94
53 0.2381 44.30 0.4192 37.65 0.2583 40.69
2 80 0.2590 44.20 0.3404 48.33 0.2387 47.66
53 0.2268 47.91 0.3510 45.82 0.2411 45.25
3 80 0.2391 45.94 0.3684 44.06 0.2352 47.26
53 0.2263 46.98 0.3862 41.12 0.2243 47.49
4 80 0.2355 47.46 0.3396 48.18 0.2306 48.91
53 0.2242 48.03 0.3568 44.81 0.2221 48.69
Form Table 5-12 in case 1, pure fuel cell vehicle, the 80 kW fuel cell stack has better system efficiency than 53 kW on all test cycles due to the higher cell efficiency when operate at low load. In hybrid powertrains, the 80 kW fuel cell stack has higher fuel consumption and system efficiency in the high load cycle, HYZEM- Highway. On the contrary, In the low load cycles, NEDC and FTP75, the 53 kW fuel cell stack has the better both fuel consumption and system efficiency because of their lower weight and not much difference in losses of cell efficiency.
In conclusion, it is possible to down size the fuel cell stack with helping of the energy storage. However, the 80 kW fuel power stack is still appropriate for high load cycle.
60
CHAPTER 6 CONCLUSION
Based on pure fuel cell vehicle model in HyTRAN-TP1 project, this work develops the global model of fuel cell vehicle with the Pukrushpan fuel cell stack. Two big advantages of the Pukrushpan fuel cell stack are much accurate stack voltage calculated by losses equations and dehydration effect is predictable. This work also develops a hybrid fuel cell vehicle model which proves the better performance and economy compared to fuel cell alone drive vehicle. This series hybrid model with control strategy is proposed as a basic of the development and utilized as a valuable tool in Matlab/Simulink environment.
Although the fuel cell-NiMH battery hybrid has excellent both performances and fuel economy, the fuel cell-supercapacitor hybrid is better. The mainly reasons are lower internal resistance and weight which is suitable for automotive application. However, the study of mixing battery and supercapacitor is recommended. Moreover, the fuel cell stack size can be reduced with helping of the storage energy.
The strategy shows good results but not the best. This strategy can use as based strategy and the further study should focus on the other parameters. For example, since charging at the high vehicle speed leads the high fuel consumption, so at the high speed, the appropriate level of SOC should be concerned. Another example is the air compressor efficiency due to it takes the major consumption among the auxiliaries.
The global model agrees with several results of the publications in the literature, however, it still needs to be verified with the real experiment.
61
REFERENCES 1. Mierlo, JV., Maggetto, G., and Lataire, Ph. Which energy source for road
transport in future? A comparison of battery, hybrid and fuel cell vehicles. Department of Electrical Engineering and Energy Technology (ETEC), Vrije Universiteit Brussel, 2006.
2. Rittmar von Helmolt, UE. “Fuel cell vehicles: Status 2007.” Journal of Power Source. 165(2007) : 833-843.
3. Bossel, U. Efficiency of Hydrogen Fuel Cell, Diesel-SOFC-Hybrid and Battery Electric Vehicles. [Online] 2003. [cited 2007 Aug 10]. Available from : http://www.efcf.com/reports/E04.pdf.
4. GAO, W. et al. Performance Comparison of a Fuel Cell-Battery Hybrid Powertrain and a Fuel Cell-Ultracapacitor Hybrid Powertrain. Center for Advanced Vehicular System, Mississippi State University, 2004.
5. Abd El-Aal, A. Modelling and Simulation of a Photovoltaic Fuel cell Hybrid System. Dissertation for the degree of Doctor in Engineering, University of Kassel, Germany, 2005.
6. Kim, M. and Peng, H. Power management and design optimization of fuel cell/battery hybrid vehicles. Department of Mechanical Engineering, University of Michigan, Ann Arbor, 2006.
7. Pukrushpan, JT., Stefanopoulou, AG., and Peng, H. Control of Fuel Cell Power Systems: Principles, Modeling, Analysis and Feedback Design. Michigan : Springer, 2004.
8. Pathapati PR., Xue X., and Tang J. A new dynamic model for predicting transient phenomena in a PEM fuel cell system. Department of Mechanical Engineering, The University of Connecticut, USA, 2004.
9. Cegnar E J., Hess H L. and Johnson B K. A purely Ultracapacitor Energy Storage System for Hybrid Electric Vehicles Utilizing a Microcontroller-Based dc-dc Boost Converter. Department of Electrical and Computer Engineering University of Idaho Moscow, 2004.
10. Uzunoglu, M., and Alam MS. Dynamic modeling, design and simulation of a PEM fuel cell/ultra-capacitor hybrid system for vehicular applications. Department of Electrical and Computer Engineering, University of South Alabama, 2006.
11. Larminie, J. and Dicks, A. Fuel cell system explained. 2nd edition. London : John Wiley & Sons, 2003.
12. EG&G Technical Services Inc. Fuel Cell Handbook . 7th edition. Washington : U.S. Department of Energy, 2004.
13. Tillemans, FWA. Basis of design HyTRAN: 80 kWe (PEM) fuel cell system for automotive applications. [Online] 2004. [cited 2007 Aug 15]. Available from : http://ec.europa.eu/research/energy/pdf/hydrogen_synopses_en.pdf.
14. Ehsani, M., Gao, Y., et al. Modern Electric, Hybrid Electric, and Fuel Cell Vehicles: Fundamentals, Theory, and Design. Florida : CRC Press, 2004.

62
15. Wallentowitz, H., Biermann, J. W., and Gnörich, B. Abschlussbericht: Wege zur Markteinführung alternativer Fahrzeugantrieb – Eine technische Analyse. Institue für Kraftfahrwesen Aachen (ika), RWTH Aachen, Germany, 2004.

63
APPENDIX A
Power DC-DC Converter details

64
FIGURE A-1 Power DC-DC Dimension
The BDC412 is a bidirectional DC/DC-converter with common minus on high-side and low-side. The power stage has been realized with the new resonant SoftSwing™ - topology, which reduces switching losses to an absolute minimum and results in an excellent EMC-behaviour. As a consequence the device is extremely compact and light weight.
A.1 Terminology
A.1.1 High voltage, Power interface (HV): High-side (HS), Fuel cell circuit (FCC) and Low-side (LS), Battery circuit (BC)
A.1.2 Low voltage, Control interface (LV): Auxiliary supply (AUX)
Reference: www.brusa.biz

65
A.2 Absolute maximum ratings A.2.1 Maximum voltage on high-side and low-side: VHSmax, VLSmax = 450V A.2.2 Maximum permissible relation between low-side and high-side:
(VLS/VHS)max = 95% A.2.3 Maximum auxiliary voltage: VAUXmax = 32V A.2.4 Maximum inlet cooling water temperature: Twater@inlet = 65°C A.2.5 Minimum flow rate of cooling water: vwater = 4l/min A.2.6 Operating ambient temperature range: Tambient = -25°C…+85°C A.2.7 Storage ambient temperature range: Tambient = -40C…+105°C A.2.8 Voltage range high-side: VHS = 125V - 425V A.2.9 Voltage range low-side (for a controllable operation, it must be ULS <
UHS): VLS = 100V - 400V A.2.10 Permissible current range low-side: ILS = ± 150A A.2.11 Auxiliary voltage range (CAN and RS232-communication possible):
UAUX = 7 - 32V A.2.12 Efficiency (at ILS > 20A): η = 97 - 99% A.2.13 Switching frequency of power stage: f = 23,4375kHz A.2.14 Sampling rate of main and limiting control loops: f = 46,875kHz A.2.15 Maximum regulation deviation of regulators: ± 1A, ± 2V A.2.16 Step response of low-side current regulator: < 1ms A.2.17 Step response of high-side voltage regulator: < 10ms A.2.18 Voltage rippel on high voltage side (at ILS > 20A): < 2V
A.3 Mechanical parameters A.3.1 Dimensions (length x width x height): l x w x h = 333 x 195.5 x 110mm A.3.2 Volume (without connectors): V = 7.2l A.3.3 Weight (without connectors on customer side): m = 10.25kg A.3.4 Housing characteristics: IP64, Aluminum, Waterproof pressure balance
integrated
A.4 Efficiency maps A.4.1 The efficiency of the BDC412 is shown in two different diagrams:
Visualization at constant low-side voltage VLS in dependence of the load current ILS and high-side voltage VHS. Visualization at constant load current ILS in dependence of the voltages VLS and VHS.
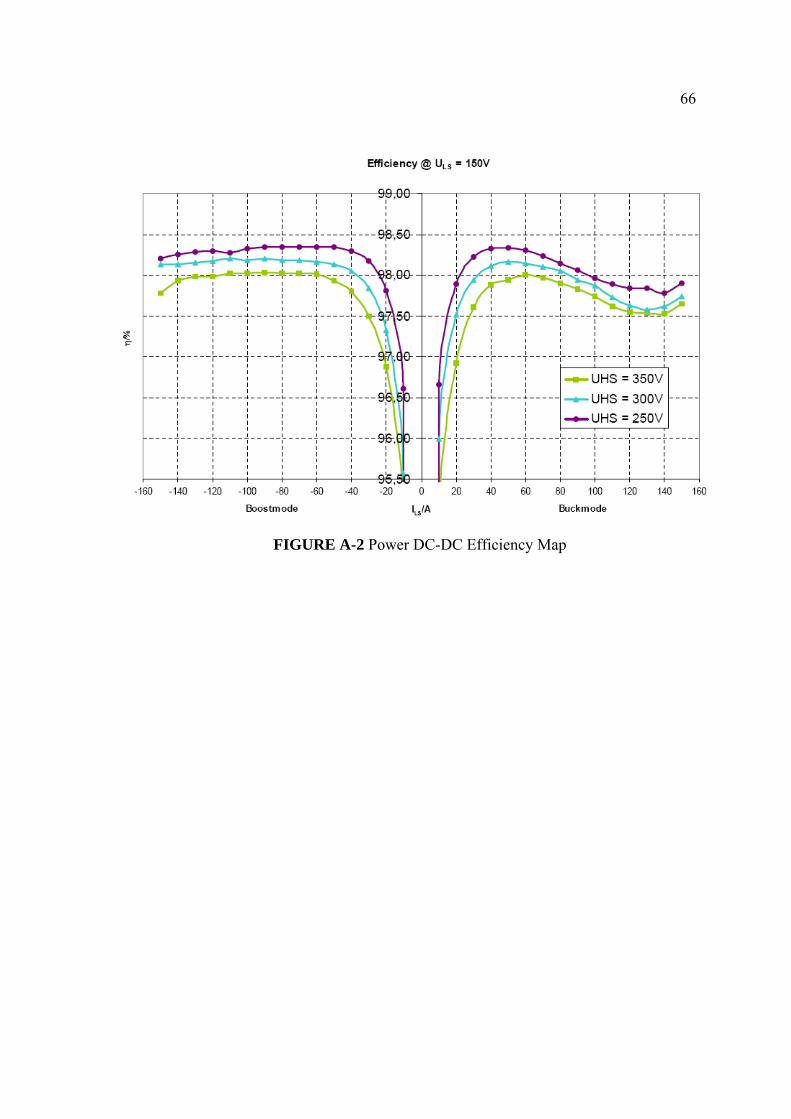
66
FIGURE A-2 Power DC-DC Efficiency Map
67
APPENDIX B
Cost of Energy Storage
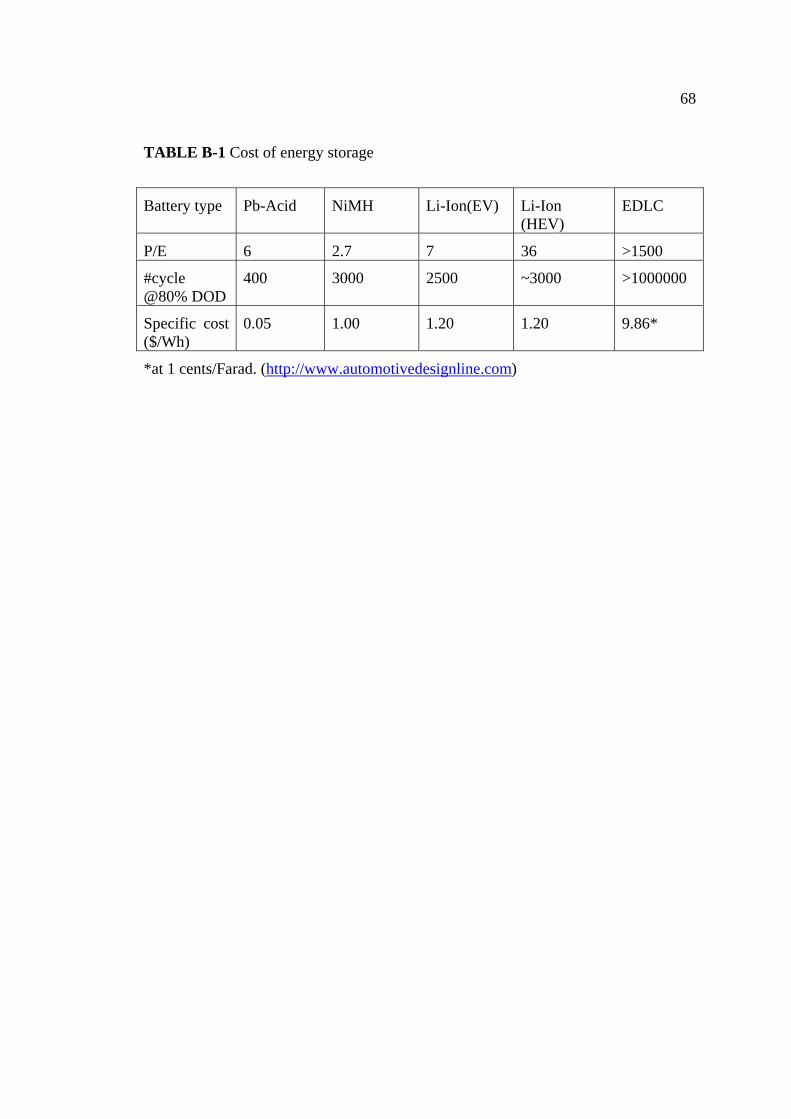
68
TABLE B-1 Cost of energy storage
Battery type Pb-Acid NiMH Li-Ion(EV) Li-Ion (HEV)
EDLC
P/E 6 2.7 7 36 >1500
#cycle @80% DOD
400 3000 2500 ~3000 >1000000
Specific cost ($/Wh)
0.05 1.00 1.20 1.20 9.86*
*at 1 cents/Farad. (http://www.automotivedesignline.com)

69
BIOGRAPHY Name : Mr. Pipat Tangsiripaisan Thesis Title : Modeling of Fuel Cell Vehicle Based on Physical Model of Different
Components in Matlab/Simulink Major Field : Automotive Engineering Biography
For my education, I graduated the bachelor degree in Mechanical Engineering GPA 2.85 from Chulalongkorn University in 2001. I started my first work as technical sale in MAERSK LINE for 1 year. Since 2002, I have worked as research and development engineer in SIKOR group to provide electric cart and bus. One of our products serves the leaders of APEC in 2003. Now I got the scholarship from SIKOR group to study the master degree in Automotive Engineering at TGGS, KMITNB.


