Portland State University Portland State University
PDXScholar PDXScholar
Environmental Science and Management Faculty Publications and Presentations Environmental Science and Management
2-24-2015
Modeling Predator Habitat to Enhance Modeling Predator Habitat to Enhance
Reintroduction Planning Reintroduction Planning
Shiloh Michael Halsey Portland State University, [email protected]
William J. Zielinski USDA Forest Service
Robert M. Scheller Portland State University, [email protected]
Follow this and additional works at: https://pdxscholar.library.pdx.edu/esm_fac
Part of the Environmental Health and Protection Commons, Environmental Monitoring Commons,
Forest Management Commons, and the Sustainability Commons
Let us know how access to this document benefits you.
Citation Details Citation Details Halsey, S.M., Zielinski, W.J., Scheller, Robert M. (2015). Modeling predator habitat to enhance reintroduction planning. Landscape Ecology.
This Article is brought to you for free and open access. It has been accepted for inclusion in Environmental Science and Management Faculty Publications and Presentations by an authorized administrator of PDXScholar. Please contact us if we can make this document more accessible: [email protected].

RESEARCH ARTICLE
Modeling predator habitat to enhance reintroductionplanning
Shiloh M. Halsey • William J. Zielinski •
Robert M. Scheller
Received: 21 May 2014 / Accepted: 16 February 2015
� Springer Science+Business Media Dordrecht 2015
Abstract
Context The success of species reintroduction often
depends on predation risk and spatial estimates of
predator habitat. The fisher (Pekania pennanti) is a
species of conservation concern and populations in the
western United States have declined substantially in
the last century. Reintroduction plans are underway,
but the ability of the species to establish a self-
sustaining population is affected by predation from its
primary predator, the bobcat (Lynx rufus).
Objectives To develop a habitat model that incor-
porates both habitat of the focal species and the spatial
patterning of predator habitat. To locate areas of
densely aggregated habitat that would be suitable for
reintroduction.
Methods Using camera survey data, we modeled the
association between bobcat presence and environmen-
tal features using a classification tree. We applied this
model to a spatial analysis of fisher habitat and
identified reintroduction areas in the southern Wash-
ington Cascade Range.
Results The classification tree predicted bobcat
detection based on elevation and mean tree diameter.
The final model identified fisher reintroduction loca-
tions primarily in or near existing wilderness areas.
Fisher habitat areas identified considering both habitat
and predation risk differed from those identified
without considering predation.
Conclusion Our spatial approach is unique among
fisher reintroduction plans by accounting for both
resource requirements and risk of predation. It can be
used as a template for future reintroduction efforts in
other regions and for other species. Using similar
models to refine population management and reintro-
duction should improve the probability of successful
population establishment and stability.
Keywords Fisher (Pekania pennanti) � Bobcat
(Lynx rufus) � Reintroduction � Predation � Habitat
modeling � Classification tree
Introduction
A spatial assessment of predation risk is an essential
step in modeling habitat for a prey species (Banks et al.
2002; Ormerod 2002; Moseby et al. 2011; McCleery
et al. 2013). Relative risk varies with the abundance
and distribution of predator habitat, a consideration
that should affect the management of species of
conservation concern (Mao et al. 2005; Atwood et al.
S. M. Halsey (&) � R. M. Scheller
Dynamic Ecosystems and Landscapes Lab, Portland State
University, 1719 SW 10th Ave, Portland, OR 97201, USA
e-mail: [email protected]
W. J. Zielinski
Redwood Sciences Laboratory, USDA Forest Service
Pacific Southwest Research Station, 1700 Bayview Drive,
Arcata, CA 95521, USA
123
Landscape Ecol
DOI 10.1007/s10980-015-0177-5

2009; Poessel et al. 2011; Gorini et al. 2012; Wengert
et al. 2014). A thorough habitat and risk management
strategy should consider the habitat needs of the prey
as well as the habitat of its primary predators. We
evaluated the habitat of a carnivore of conservation
concern (the fisher, Pekania pennanti) as affected by
the spatial distribution of habitat for its primary
predator, the bobcat (Lynx rufus).
The fisher is a medium-sized member of the
Mustelidae whose historic range in the western United
States once spread throughout the northern Rocky
Mountains, the Cascade and Coast Ranges, and the
Sierra Nevada (Powell 1993; Lofroth et al. 2010). Due
to trapping and habitat fragmentation, the abundance
of fisher in the Pacific states has declined dramatically
and is now limited to several, isolated populations in
southwestern Oregon, northern California, the south-
ern Sierra Nevada in central California, and the
Olympic Peninsula of Washington (Ingram 1973;
Aubry and Lewis 2003; Spencer et al. 2011; Lewis
et al. 2012). Trapping of fishers in Washington was
prohibited in 1933, but populations were already
substantially reduced; statewide surveys from 1989 to
2000 failed to detect the presence of fishers (Aubry
and Houston 1992; Lewis and Hayes 2004). The fisher
has recently been reintroduced to the Olympic Penin-
sula, but is still listed as an endangered species in
Washington (Lewis et al. 2011). The U.S. Fish and
Wildlife Service has proposed listing the West Coast
distinct population segment of fisher as threatened
under the Endangered Species Act (U.S. Federal
Register, 7 October 2014).
Reintroductions are an effective way to reestab-
lish carnivores that have been extirpated from their
native habitat, and the fisher has been one of the
most successfully reintroduced carnivores in North
America (Vinkey et al. 2006; Schwartz 2007; Ewen
et al. 2012; Lewis et al. 2012). Fisher populations,
however, expand slowly and are particularly vul-
nerable to bobcat predation (Gilbert 2000; Lewis
et al. 2011; Wengert et al. 2014). Bobcats are the
most common predator on fishers in California,
responsible for up to 77 % of female fisher mortality
(Wengert 2013). Moreover, most bobcat predation
on females occurs from March to July, when
females may have dependent young whose sec-
ondary deaths can magnify the negative effect of
bobcat predation on the fisher population (Wengert
et al. 2014). Fishers released into the Olympic
Peninsula of Washington between 2008 and 2010
were fitted with radio collars, and although the
causes of their deaths was not always determined, it
appears that predation, especially by bobcat, was a
significant mortality factor (Lewis et al. 2011).
Predation was also a dominant factor in a fisher
translocation effort in Montana where over half of
the fishers were killed by predators (Roy 1991).
Although coyotes (Canis latrans) and mountain
lions (Puma concolor) prey on fishers, it occurs
less commonly than predation by bobcats (Wengert
2013). Further, the large home ranges of mountain
lions would result in distribution models that would
be more general and less likely to affect choices for
fisher reintroduction sites.
The distribution of bobcats in the Pacific Northwest
is not well understood and, given their role as a key
predator, bobcat habitat analysis should be a part of
reintroduction planning for fishers. Released fishers
will inevitably encounter bobcat predation as they
expand from reintroduction sites into the broader
landscape, but the likelihood of these encounters can
be reduced by selecting reintroduction locations where
bobcat abundance is likely to be low. Because female
fishers are expected to maintain more fidelity to
reintroduction sites than males (Lewis et al. 2011),
mitigating the negative effects of bobcat predation at
these sites may disproportionately benefit female
fishers whose survival rates are the most influential
demographic parameter influencing population
growth (Buskirk et al. 2012).
Our goal was to locate areas where potential fisher
habitat overlapped areas with a low likelihood of
bobcat presence. We combined existing survey data
with new camera survey results to develop a model
of bobcat habitat in the southern Washington Cas-
cades. We incorporated the results into a fisher
habitat model and used these results to recommend
areas of aggregated fisher habitat which would
reduce predation and give transplanted fishers an
improved chance to survive and reproduce. We
intend to inform future fisher reintroductions in
Washington and guide future monitoring and re-
search. Our research used a novel approach to habitat
modeling for reintroductions that can be used as a
model for future release efforts in other regions and
for other species.
Landscape Ecol
123

Methods
Study area
The Washington Department of Fish and Wildlife
(WA-DFW) carried out a feasibility assessment in
2004 and identified the southern Washington Cas-
cades, the Olympic Peninsula, and the North Cascades
as possible locations for a reintroduction of fisher
(Lewis and Hayes 2004). The Olympic Peninsula was
chosen as the first location and reintroductions
occurred in 2008, 2009 and 2010 (Lewis et al.
2011). Our study area in the southern Washington
Cascades was highlighted as a candidate reintroduc-
tion region (Lewis 2013) and is centered on federal
land, assuming that public lands are the most likely
locations for reintroduction. The geographic center of
the study area is located at 46.49102 latitude by -
121.64149 longitude. The 9842 km2 study area en-
compasses the southern part of the Mt. Baker-
Snoqualmie (MBS) and Wenatchee National Forests
(WNF) (3351 km2), Mount Rainier National Park
(MRNP) (954 km2), and the Gifford Pinchot National
Forest (GPNF) (5537 km2), which includes the Mount
St. Helens National Volcanic Monument. The area is
characterized by large tracts of coniferous forest and
the volcanic peaks of Mount Rainier, Mount St.
Helens, and Mount Adams. Douglas fir (Psuedotsuga
menziesii), western hemlock (Tsuga heterophylla), red
alder (Alnus rubra), bigleaf maple (Acer macrophyl-
lum), western red cedar (Thuja plicata), and grand fir
(Abies grandis) dominate the canopy of the Cascade
Range. The forests of this region exist in varying
stages of succession due to a history of logging and
fires (Knick et al. 1985).
Data layers for modeling
We acquired the forest data layers from Landscape
Ecology, Modeling, Mapping and Analysis (LEMMA:
http://lemma.forestry.oregonstate.edu). The data were
derived from a gradient nearest neighbor approach,
which uses a multivariate gradient analysis linking
field plot data, satellite imagery, and maps of envi-
ronmental variables to create a raster grid of large
ecoregions in California, Oregon, and Washington.
Raster data were delivered and analyzed in a 30 m
resolution. The accuracy of the LEMMA data was
estimated by comparing predicted values with
measurements from plots on the ground; the correla-
tion coefficient and root mean squared error (normal-
ized measure) for canopy cover was 0.75 and 0.20 and
for QMDA was 0.72 and 0.43, respectively (http://
lemma.forestry.oregonstate.edu/data/structure-maps).
The inventory plots used to create the LEMMA data
layers represent a span of 15 years of forest inventory
data from western Washington, including the eastern
portion of the Cascade Range. The spacing for ground-
validation sampling plots was roughly 5.5 km, except
for the plots in United States Forest Service Region 6
land, which are approximately 2.7 km apart, with a
total of 5587 ground-truth plots (http://lemma.
forestry.oregonstate.edu/data/structure-maps). The
elevation layer was acquired from the United States
Geological Survey (National Elevation Dataset: http://
ned.usgs.gov/).
Fisher habitat suitability map
A fisher habitat suitability map was created to identify
areas of high suitability prior to considering the effect
of bobcat distribution. The fisher habitat model was
based on considering three variables often associated
with fisher suitability which serve as critical compo-
nents influencing survival: canopy cover, elevation,
and tree diameter (quadratic mean diameter of all
dominant and co-dominant trees: QMDA) (Powell
1993; Jacobson et al. 2003; Lewis and Hayes 2004;
Zielinski et al. 2004; Davis et al. 2007; Lofroth et al.
2010; Aubry et al. 2013; Schwartz et al. 2013).
Fishers are strongly associated with dense canopy,
which provides resting sites, refuge from predators,
and habitat for prey (Carroll et al. 1999; Purcell et al.
2009; Zielinski et al. 2010; Scheller et al. 2011;
Buchanan et al. 2013). Canopy also intercepts snow,
and deep snow affects fisher survival by increasing
their energy expenditure and reducing mobility
(Aubry and Houston 1992; Krohn et al. 1995). On
the basis of research conducted by Zielinski et al.
(2004), we designated area with a canopy closure
[60 % as suitable fisher habitat. Elevation is also a
good predictor of fisher occurrence in western North
America. High elevation areas are generally unsuit-
able for fishers due to increased snow depths,
decreased prey density, lower tree cover, and smaller
tree size as well as a lower density of snags and
downed wood, which fishers use for resting and den
sites (Powell 1993; Krohn et al. 1995; Jacobson et al.
Landscape Ecol
123
2003; Aubry et al. 2013). Aubry and Houston (1992)
described historical records of fishers in western
Washington up to 1800 m, and Zielinski et al.
(1997) found the highest elevation of northern
California fishers to be around 1700 m. Based on
fisher habitat studies from the western United States
and from similar recommendations of the feasibility
assessment for the reintroduction of fishers in Wash-
ington, we set the upper limit of suitable habitat at
1676 m (Lewis and Hayes 2004; Zielinski et al. 2010;
Spencer et al. 2011; Lewis 2014). Large diameter trees
are important resources for resting and denning,
however, intermediate-sized trees also provide value
as resting sites and cover (Powell 1993; Lofroth et al.
2010; Schwartz et al. 2013). Lewis (2014) found that
habitat use of female fishers reintroduced on the
Olympic Peninsula was strongly related to the pro-
portion of area in stands classified as having interme-
diate and large diameter trees. Zielinski et al. (2004)
also found that the highest proportion area of fisher
home ranges (60.7 %) in the Sierra Nevada were in
areas with moderately sized trees (29–61 cm). In order
to include both intermediate and large trees, we
assigned areas with [29 cm dbh QMDA as potential
habitat. There are other factors that previous habitat
models have highlighted as associated with fisher
occurrence, such as total forest biomass, tree diameter
diversity, percent hardwood, diameter of hardwoods,
annual precipitation, and topographic relief (Carroll
et al. 1999; Davis et al. 2007; Zielinski et al. 2010;
Spencer et al. 2011). We have distilled a broad set of
fisher habitat information to create a general yet
predictive model that is specifically aimed at deter-
mining locations where the minimum requirements for
fisher survival are present. This includes those areas
where trees are large enough for denning and resting,
and forested areas with enough canopy at low enough
elevation to ensure there is adequate prey and snow
depths that will not impede fisher movements.
Using this information, a simple algorithm was
used to identify areas of suitable fisher habitat. We
combined raster layers to determine locations where
all three habitat components (cover, elevation, and
QMDA) were of sufficient value. If canopy cover
was [60 %, QMDA was [29 cm, and elevation
was \1676 m, a cell was considered suitable; if any
one of these conditions was not met, it was unsuitable.
To locate areas where habitat cells were most densely
aggregated, we calculated cell density using the kernel
density tool in ArcGIS. A search radius of 3534 m was
used so that the density weighting function would only
count cells within the diameter of an average female
fisher home range of 9.8 km2 (Zielinski et al. 2004).
This function gave greater weight to cells closest to the
focal cell, the observation point, and this weight
diminished until it reached the full search distance.
Bobcat survey data
Bobcat distributions were assembled using survey data
obtained from three sources, each employing a similar
survey method of baited, motion triggered camera sets
on a 28-day survey duration (Zielinski and Kucera
1995; Long et al. 2010). The first set of surveys was
conducted by the National Park Service at MRNP
from 2002 to 2004 (N = 50). These surveys supplied
data on a variety of species, including bobcats. The
second set of surveys was collected from high
elevation areas throughout the study area with surveys
spanning from 2009 to 2013 (N = 169). This effort
was carried out by the Cascades Carnivore Project, a
non-profit organization focused on researching carni-
vores in the Cascade Range. We conducted surveys
within the GPNF from June to November 2012. Our
camera surveys were intended to determine detection
and non-detection of bobcat (N = 24). The surveys
were conducted in a range of habitat types from high
elevation alpine areas to low elevation coniferous
forests. The three data sources supplied a total of 243
survey locations. Very little bobcat detection work has
been conducted in the region so we had no estimates of
probability of detection if present, thus failing to
detect is not the same as absence. However, we applied
a survey approach that reduces false absence in other
species, and we assumed detection probabilities were
similar to that of other mesocarnivores (Zielinski and
Kucera 1995; Slauson et al. 2012).
Modeling bobcat habitat
Similar to fishers, habitat variations exist where
bobcats are found, but certain habitat variables appear
to be associated with bobcat occurrence. Tree cover is
a common habitat feature for the species, and during
the breeding season, fine scale habitat factors such as
downed wood, understory density, caves, and rock
outcroppings become increasingly important (Hansen
Landscape Ecol
123
2007; Tucker et al. 2008). We chose predictor
variables that, collectively, represent structural and
compositional characteristics that are often associated
with descriptions of bobcat habitat. They included
percent canopy cover, percent coniferous canopy
cover, quadratic mean diameter of trees (QMDA),
basal area of coniferous trees [2.5 cm dbh, and
elevation (Knick et al. 1985; Koehler and Hornocker
1989; Koehler et al. 1991; Neale and Sacks 2001;
Benson et al. 2004; Blankenship et al. 2006; Litvaitis
et al. 2006).
We created 100 m radius buffers (*35 raster cells)
around each of our survey sites to assess neighboring
forest conditions for the purpose of developing our
bobcat model. Within each buffer, we calculated the
mean of the forest structural and compositional data
using the zonal statistics tool in ArcGIS.
We modeled bobcat occurrence as a function of the
selected environmental predictor variables using a
classification tree. Classification trees do not assume
normal distributions and can include non-linear rela-
tionships (De’ath and Fabricius 2000; Munoz and
Felicısimo 2004; Baker et al. 2006). A classification
tree highlights variation of a response variable by
splitting the data, stepwise, at decision ‘‘nodes’’ and
dividing the data into more homogeneous groups. The
splitting of the variables is hierarchical; the variable at
the top of the tree is the most important and each
subsequent variable is only invoked after making a
binary decision at the previous node. The classification
tree was run using the ‘rpart’ package in R statistical
software. The final classification tree was subjected to
cross validation to evaluate how robust the predictions
were to variations in the input data. We created twenty
different subsets of the data (ten using 80 % of the data
to run the model and 20 % to test the model, and ten
using 85 % of the data to run the model and 15 % to
test the model). We used two variations to examine if
varying the subset amount affected validation.
Integrating bobcat and fisher modeling results
A spatial application of the bobcat model was
necessary to identify areas with high and low likeli-
hoods of bobcat detection that could be related to the
areas of suitable fisher habitat. This required using the
bobcat habitat classification tree to first rank spatial
cells according to the likelihood of bobcat absence.
The habitat values and rates of bobcat detection, as
established in the classification tree, determined the
location of the division (or ‘break’) points in the
reclassification of raster cells in ArcGIS. Next, we
summed the layers to determine ranks according to
fisher habitat suitability and likelihood of bobcat
absence in the raster cells. The kernel density tool was
applied using a search radius of 3534 m and weighting
more heavily those cells with a higher likelihood of
bobcat absence. This highlighted areas of densely
aggregated fisher habitat cells that also contained a
relatively high likelihood of bobcat absence. Finally,
we created maps showing the density of fisher habitat
cells. Relative habitat values were distinguished using
the natural breaks method in ArcGIS, which enabled
us to locate the are as with the greatest densities of
highly ranked fisher habitat and to highlight potential
reintroduction locations.
Results
Fisher habitat analysis
The initial fisher habitat analysis, conducted prior to
integrating it with the bobcat habitat model, revealed
that the largest aggregations of predicted habitat
occurred in three regions: (A) an area southeast of
Mount Rainier along the northeast border of the
Tatoosh Wilderness where the GPNF, WNF, and
MRNP meet; (B) the southern tip of the GPNF near
private lands; and (C) the center of the GPNF
southeast of Mount St. Helens (Fig. 1). The locations
in the southern part of the study area are low elevation
coniferous forests close to areas of light development.
The northern location is a densely forested, mid to
high-elevation area surrounded by three wilderness
areas. Overall, the map depicts fairly evenly dispersed
suitable habitat throughout most of the study area
except in the eastern boundary near the drier parts of
the Cascade Range.
Bobcat survey data
The bobcat surveys yielded 213 non-detection and 30
detection observations from 243 sites. Of the non-
detection sites, 66 had either overlapping buffers with
another non-detection site or were in very close
proximity (\2 km) to a detection site. When a non-
detection site overlapped another non-detection site or
Landscape Ecol
123

was within 2 km of the buffer of a detection site, the
non-detection site was excluded to avoid overweight-
ing a particular area as non-detection and to account
for the possibility of a false negative. Excluding these
66 sites resulted in a total of 147 non-detection sites
(Fig. 2).
Classification tree
The classification tree model had three nodes, using
two variables: elevation and QMDA (Fig. 3). The
tree’s first split, and therefore its most important, was
at 1303 m elevation. The probability of bobcat
Fig. 1 Map of suitable
fisher habitat density before
the integration of the bobcat
distribution model results.
a The largest aggregation of
suitable fisher habitat is
located along the northeast
border of the Tatoosh
Wilderness just southeast of
Mount Rainier. b The
second largest aggregation
of fisher habitat is located in
the very southern part of the
Gifford Pinchot National
Forest near private lands.
c The third ranking is made
up of three smaller
aggregations of dense
habitat and is located in the
center of the Gifford Pinchot
National Forest southeast of
Mount St. Helens
Landscape Ecol
123
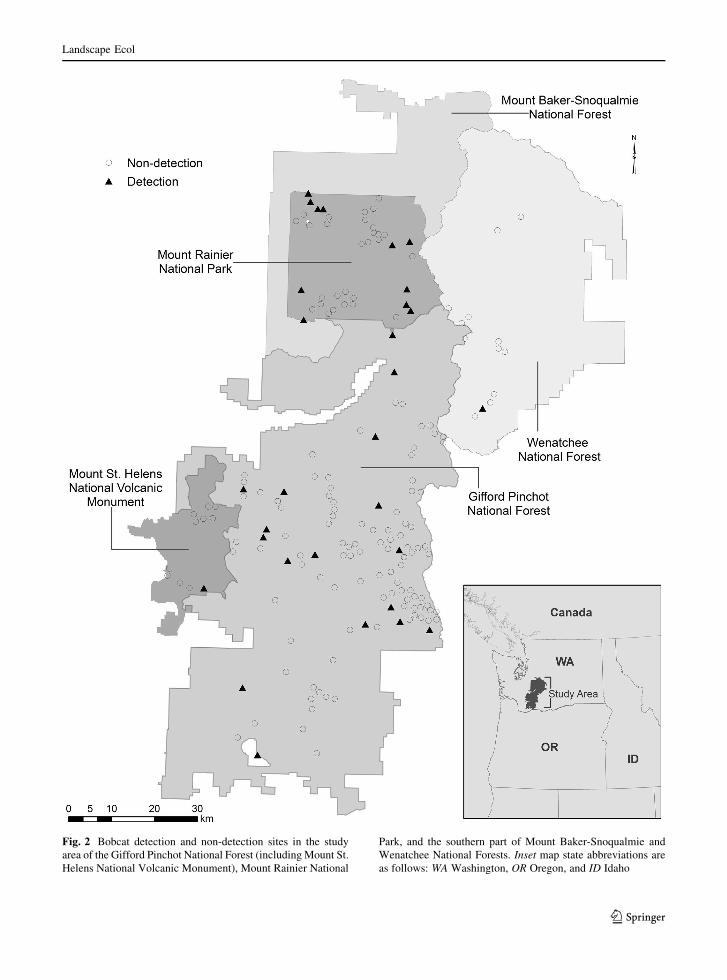
Fig. 2 Bobcat detection and non-detection sites in the study
area of the Gifford Pinchot National Forest (including Mount St.
Helens National Volcanic Monument), Mount Rainier National
Park, and the southern part of Mount Baker-Snoqualmie and
Wenatchee National Forests. Inset map state abbreviations are
as follows: WA Washington, OR Oregon, and ID Idaho
Landscape Ecol
123
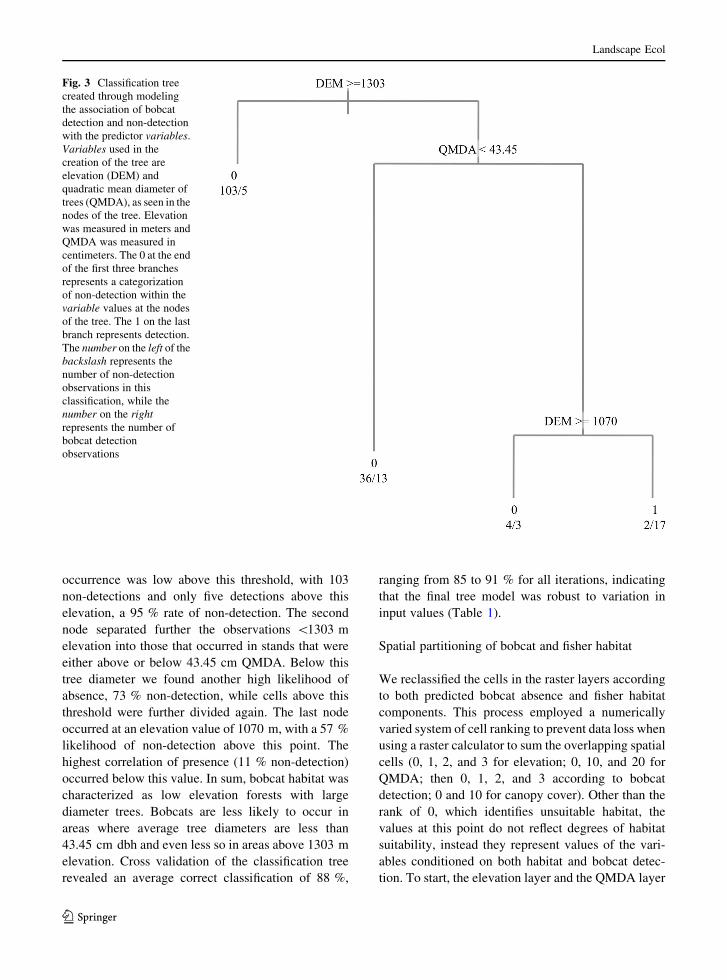
occurrence was low above this threshold, with 103
non-detections and only five detections above this
elevation, a 95 % rate of non-detection. The second
node separated further the observations \1303 m
elevation into those that occurred in stands that were
either above or below 43.45 cm QMDA. Below this
tree diameter we found another high likelihood of
absence, 73 % non-detection, while cells above this
threshold were further divided again. The last node
occurred at an elevation value of 1070 m, with a 57 %
likelihood of non-detection above this point. The
highest correlation of presence (11 % non-detection)
occurred below this value. In sum, bobcat habitat was
characterized as low elevation forests with large
diameter trees. Bobcats are less likely to occur in
areas where average tree diameters are less than
43.45 cm dbh and even less so in areas above 1303 m
elevation. Cross validation of the classification tree
revealed an average correct classification of 88 %,
ranging from 85 to 91 % for all iterations, indicating
that the final tree model was robust to variation in
input values (Table 1).
Spatial partitioning of bobcat and fisher habitat
We reclassified the cells in the raster layers according
to both predicted bobcat absence and fisher habitat
components. This process employed a numerically
varied system of cell ranking to prevent data loss when
using a raster calculator to sum the overlapping spatial
cells (0, 1, 2, and 3 for elevation; 0, 10, and 20 for
QMDA; then 0, 1, 2, and 3 according to bobcat
detection; 0 and 10 for canopy cover). Other than the
rank of 0, which identifies unsuitable habitat, the
values at this point do not reflect degrees of habitat
suitability, instead they represent values of the vari-
ables conditioned on both habitat and bobcat detec-
tion. To start, the elevation layer and the QMDA layer
Fig. 3 Classification tree
created through modeling
the association of bobcat
detection and non-detection
with the predictor variables.
Variables used in the
creation of the tree are
elevation (DEM) and
quadratic mean diameter of
trees (QMDA), as seen in the
nodes of the tree. Elevation
was measured in meters and
QMDA was measured in
centimeters. The 0 at the end
of the first three branches
represents a categorization
of non-detection within the
variable values at the nodes
of the tree. The 1 on the last
branch represents detection.
The number on the left of the
backslash represents the
number of non-detection
observations in this
classification, while the
number on the right
represents the number of
bobcat detection
observations
Landscape Ecol
123

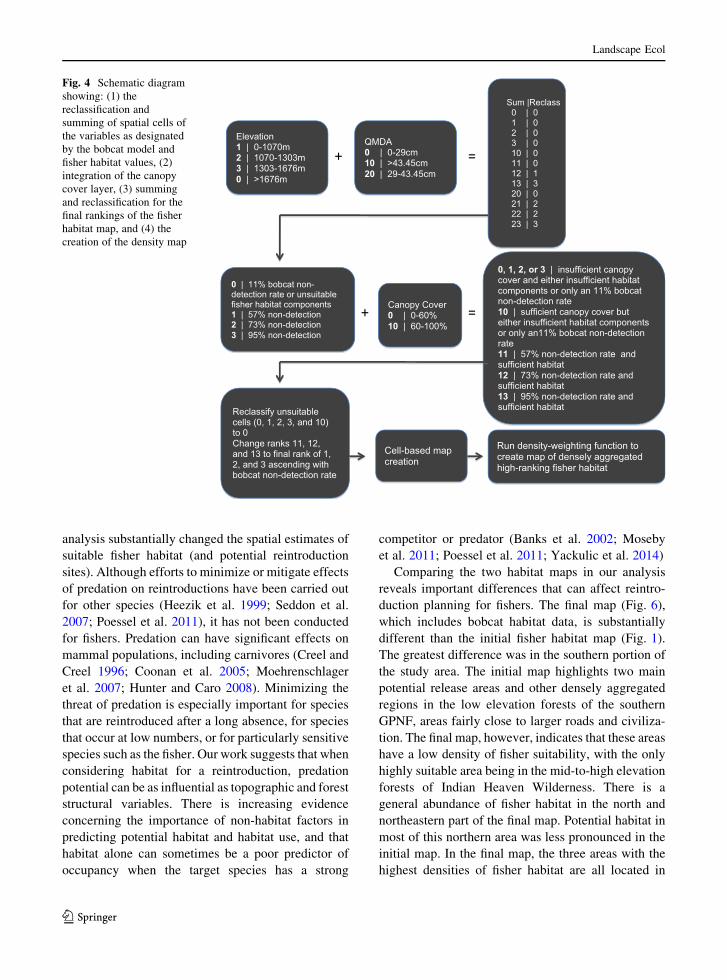
were summed (Fig. 4, upper left boxes) and the
resulting values (0 through 23) were then reclassified
down to 0, 1, 2, and 3 according to bobcat non-
detection rates as well as the two fisher habitat
variables (Fig. 4, upper right and middle left boxes).
This layer was combined with canopy cover and
reclassified again into four categories resulting in a
composite score reflecting bobcat detection and the
suite of fisher habitat variables (Fig. 4, middle row and
lower left box). The addition of the canopy cover layer
used a similar nomenclature, combining the classified
cells of canopy cover (0: unsuitable and 10: suitable)
with the previously reclassified layers (0, 1, 2, and 3).
We reclassified the resulting values (0, 1, 2, 3, 10, 11,
12, and 13) a final time to reflect the likelihood of
bobcat absence (3: 95 % observed non-detection of
bobcat, 2: 73 % non-detection, 1: 57 % non-detection,
and 0: 11 % non-detection or a cell without suitable
fisher habitat components).
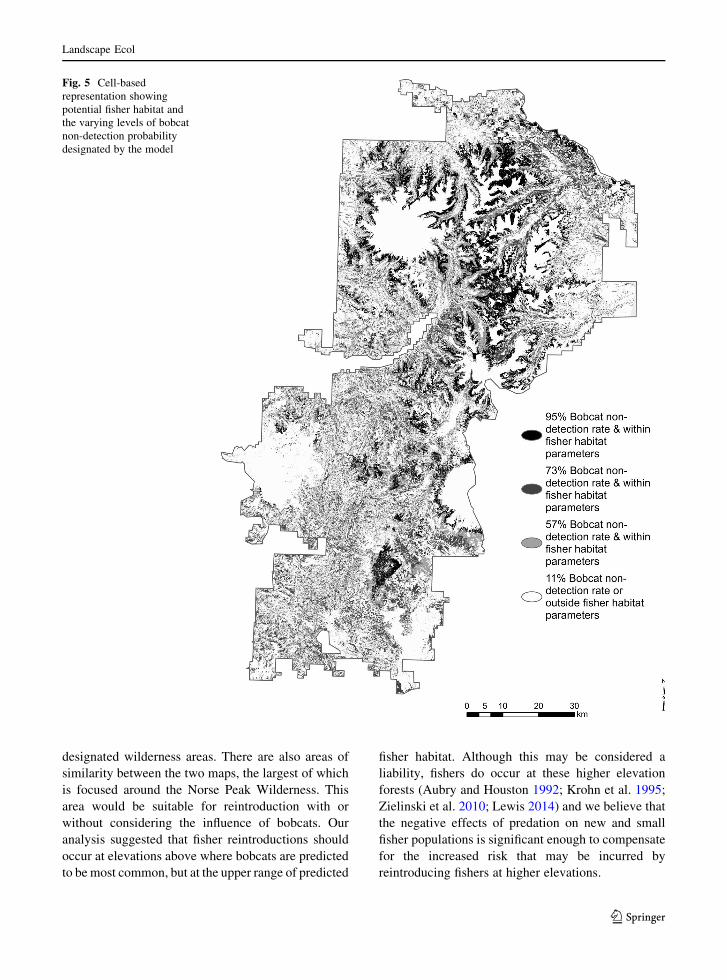
The reclassification procedure resulted in a cell-
based map of predicted habitat suitability for fisher
(Fig. 5). We then applied the kernel density function
and gave higher weight to cells with a higher
likelihood of bobcat absence. Cells ranked 0 were
excluded from this function because these cells were
classified as unsuitable or with a high bobcat detection
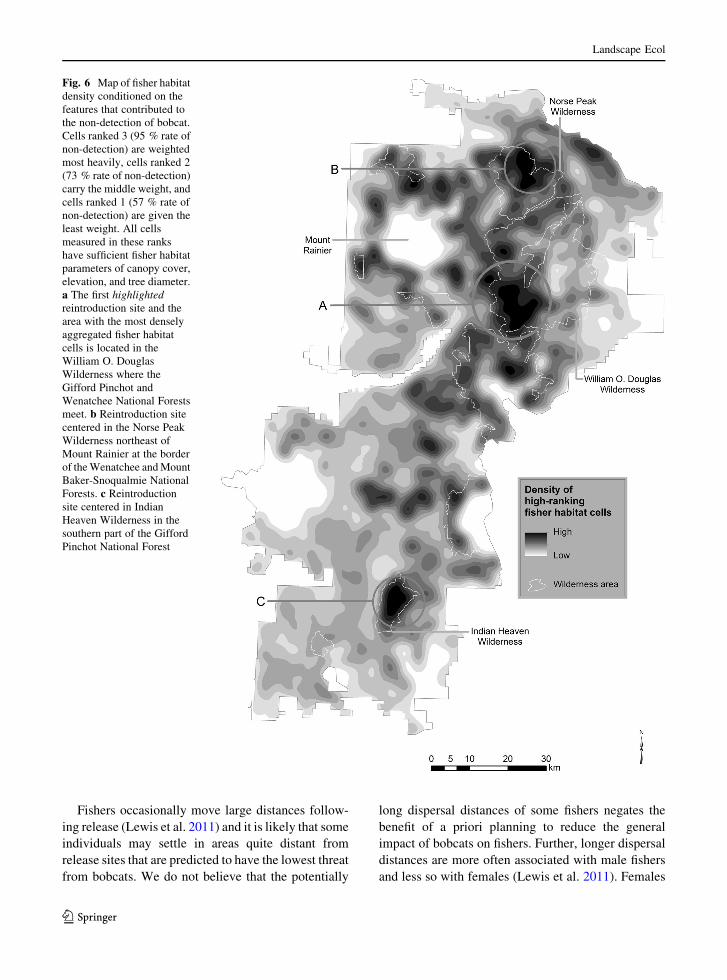
rate. After applying the kernel density weighting
function, three areas emerged as likely locations for
fisher reintroduction (Fig. 6). The most densely
aggregated habitat areas were: (A) the southern
portion of the William O. Douglas Wilderness at the
border of the GPNF and WNF, (B) the Norse Peak
Wilderness northeast of Mount Rainier at the border of
MBS and WNF, and (C) Indian Heaven Wilderness in
the southern part of the GPNF.
Discussion
Our research uncovered previously unexplored varia-
tions of fisher habitat suitability by incorporating the
influence of habitat of a key predator, the bobcat. We
demonstrated that incorporating the results of the
bobcat distribution model with the basic fisher habitat
Table 1 Ten iterations of the cross-validation of survey data using 80 or 85 % of the data to run the model and 20 or 15 % to
validate
Subset
amount (%)
Correctly
classified (%)
Incorrectly
classified (%)
Variables used
80/20 91 9 Elevation, tree diameter
87 13 Elevation, tree diameter
90 10 Elevation, tree diameter, canopy cover
89 11 Elevation, tree diameter
87 13 Elevation, tree diameter
88 12 Elevation, tree diameter
87 13 Elevation, tree diameter
88 12 Elevation, tree diameter
86 14 Elevation, tree diameter
85 15 Elevation
85/15 88 12 Elevation, tree diameter
90 10 Elevation, tree diameter, basal area of conifers
89 11 Elevation, tree diameter
88 12 Elevation, tree diameter
87 13 Elevation, tree diameter
88 12 Elevation, tree diameter, canopy cover
89 11 Elevation, tree diameter, canopy cover
86 14 Elevation, tree diameter
89 11 Elevation, tree diameter
87 13 Elevation, tree diameter, canopy cover
Landscape Ecol
123
analysis substantially changed the spatial estimates of
suitable fisher habitat (and potential reintroduction
sites). Although efforts to minimize or mitigate effects
of predation on reintroductions have been carried out
for other species (Heezik et al. 1999; Seddon et al.
2007; Poessel et al. 2011), it has not been conducted
for fishers. Predation can have significant effects on
mammal populations, including carnivores (Creel and
Creel 1996; Coonan et al. 2005; Moehrenschlager
et al. 2007; Hunter and Caro 2008). Minimizing the
threat of predation is especially important for species
that are reintroduced after a long absence, for species
that occur at low numbers, or for particularly sensitive
species such as the fisher. Our work suggests that when
considering habitat for a reintroduction, predation
potential can be as influential as topographic and forest
structural variables. There is increasing evidence
concerning the importance of non-habitat factors in
predicting potential habitat and habitat use, and that
habitat alone can sometimes be a poor predictor of
occupancy when the target species has a strong
competitor or predator (Banks et al. 2002; Moseby
et al. 2011; Poessel et al. 2011; Yackulic et al. 2014)
Comparing the two habitat maps in our analysis
reveals important differences that can affect reintro-
duction planning for fishers. The final map (Fig. 6),
which includes bobcat habitat data, is substantially
different than the initial fisher habitat map (Fig. 1).
The greatest difference was in the southern portion of
the study area. The initial map highlights two main
potential release areas and other densely aggregated
regions in the low elevation forests of the southern
GPNF, areas fairly close to larger roads and civiliza-
tion. The final map, however, indicates that these areas
have a low density of fisher suitability, with the only
highly suitable area being in the mid-to-high elevation
forests of Indian Heaven Wilderness. There is a
general abundance of fisher habitat in the north and
northeastern part of the final map. Potential habitat in
most of this northern area was less pronounced in the
initial map. In the final map, the three areas with the
highest densities of fisher habitat are all located in
Elevation1 | 0-1070m2 | 1070-1303m3 | 1303-1676m0 | >1676m
0 | 11% bobcat non-detection rate or unsuitablefisher habitat components1 | 57% non-detection2 | 73% non-detection3 | 95% non-detection
+QMDA0 | 0-29cm10 | >43.45cm20 | 29-43.45cm
=
Sum |Reclass0 | 01 | 02 | 03 | 010 | 011 | 012 | 113 | 320 | 021 | 222 | 223 | 3
+ Canopy Cover0 | 0-60%10 | 60-100%
=
0, 1, 2, or 3 | insufficient canopycover and either insufficient habitatcomponents or only an 11% bobcatnon-detection rate10 | sufficient canopy cover buteither insufficient habitat componentsor only an11% bobcat non-detectionrate11 | 57% non-detection rate andsufficient habitat12 | 73% non-detection rate andsufficient habitat13 | 95% non-detection rate andsufficient habitatReclassify unsuitable
cells (0, 1, 2, 3, and 10)to 0Change ranks 11, 12,and 13 to final rank of 1,2, and 3 ascending withbobcat non-detection rate
Cell-based map creation
Run density-weighting function to create map of densely aggregated high-ranking fisher habitat
Fig. 4 Schematic diagram
showing: (1) the
reclassification and
summing of spatial cells of
the variables as designated
by the bobcat model and
fisher habitat values, (2)
integration of the canopy
cover layer, (3) summing
and reclassification for the
final rankings of the fisher
habitat map, and (4) the
creation of the density map
Landscape Ecol
123
designated wilderness areas. There are also areas of
similarity between the two maps, the largest of which
is focused around the Norse Peak Wilderness. This
area would be suitable for reintroduction with or
without considering the influence of bobcats. Our
analysis suggested that fisher reintroductions should
occur at elevations above where bobcats are predicted
to be most common, but at the upper range of predicted
fisher habitat. Although this may be considered a
liability, fishers do occur at these higher elevation
forests (Aubry and Houston 1992; Krohn et al. 1995;
Zielinski et al. 2010; Lewis 2014) and we believe that
the negative effects of predation on new and small
fisher populations is significant enough to compensate
for the increased risk that may be incurred by
reintroducing fishers at higher elevations.
Fig. 5 Cell-based
representation showing
potential fisher habitat and
the varying levels of bobcat
non-detection probability
designated by the model
Landscape Ecol
123
Fishers occasionally move large distances follow-
ing release (Lewis et al. 2011) and it is likely that some
individuals may settle in areas quite distant from
release sites that are predicted to have the lowest threat
from bobcats. We do not believe that the potentially
long dispersal distances of some fishers negates the
benefit of a priori planning to reduce the general
impact of bobcats on fishers. Further, longer dispersal
distances are more often associated with male fishers
and less so with females (Lewis et al. 2011). Females
Fig. 6 Map of fisher habitat
density conditioned on the
features that contributed to
the non-detection of bobcat.
Cells ranked 3 (95 % rate of
non-detection) are weighted
most heavily, cells ranked 2
(73 % rate of non-detection)
carry the middle weight, and
cells ranked 1 (57 % rate of
non-detection) are given the
least weight. All cells
measured in these ranks
have sufficient fisher habitat
parameters of canopy cover,
elevation, and tree diameter.
a The first highlighted
reintroduction site and the
area with the most densely
aggregated fisher habitat
cells is located in the
William O. Douglas
Wilderness where the
Gifford Pinchot and
Wenatchee National Forests
meet. b Reintroduction site
centered in the Norse Peak
Wilderness northeast of
Mount Rainier at the border
of the Wenatchee and Mount
Baker-Snoqualmie National
Forests. c Reintroduction
site centered in Indian
Heaven Wilderness in the
southern part of the Gifford
Pinchot National Forest
Landscape Ecol
123
are more often the victims of bobcat predation
(Wengert et al. 2014), therefore females are the most
likely to benefit from being translocated to sites where
bobcat predation risk is lower.
Our cross validation suggests that our bobcat model
is robust to variation in the input data. Post reintro-
duction monitoring in the study area would be needed
to conduct traditional validation for the combined
model and for validation of the fisher model. In the
meantime, we feel that local validation of the fisher
model would be unsuitable because the closest
populations of fishers are in areas with substantially
different forest types, such as the coastal forests of the
Olympic Peninsula of Washington and the drier
climate in southern Oregon. Zielinski et al. (2010)
found fisher habitat in western coastal forests of
California to be predicted by distinct spatial phe-
nomenon associated with east to west precipitation
gradients and other geographic predictors that would
make inter-regional validation approaches less robust.
To improve confidence in our model, we have instead
extrapolated from a large body of research and a range
of western United States fisher habitat areas to produce
a general model for fisher habitat in our study area.
The results of our work can enhance the manage-
ment and reintroduction of rare or endangered prey
species. First, it can be applied to inform the location of
future reintroductions when estimates of the spatial
partitioning of habitat and predation risk can reduce
mortality and increase population viability. Second, it
can be used for hypothesis testing and as a predictive
tool to highlight where individuals are expected to
establish home ranges and to survive. If predators have
negative effects on reintroductions, they are likely to
also influence the establishment of home ranges and
survival well after the early stages of reintroduction.
Using release efforts as an investigative tool is an
often-overlooked, yet important research opportunity
(Seddon et al. 2007). Lastly, our approach can be used
to identify specific locations for future research and
monitoring efforts to examine the ongoing interactions
of two species, particularly where their predicted
habitat overlaps. This will increase the ability for
researchers to examine whether species are experienc-
ing competition, reduced dispersal, or a source-sink
dynamic. This approach can refine monitoring and can
direct analysis once reintroductions are underway and
after home ranges have been established.
Acknowledgments The Gifford Pinchot Task Force
(gptaskforce.org) generously supplied survey equipment and
funding for this research. Survey data from the National Park
Service and the Cascades Carnivore Project were valuable
additions to the work. Greta Wengert offered important insights
from fisher and bobcat studies in California, and Jeffrey Lewis
(WA-DFW) provided valuable review comments.
References
Atwood TC, Gese EM, Kunkel KE (2009) Spatial partitioning of
predation risk in a multiple predator-multiple prey system.
J Wildl Manag 73:876–884
Aubry KB, Houston DB (1992) Distribution and status of the
fisher (Martes pennanti) in Washington. Northwest Nat
73:69–79
Aubry KB, Lewis JC (2003) Extirpation and reintroduction of
fishers (Martes pennanti) in Oregon: implications for their
conservation in the Pacific states. Biol Conserv 114:79–90
Aubry KB, Raley CM, Buskirk SW, Zielinski WJ, Schwartz
MK, Golightly RT, Purcell KL, Weir RD, Yaeger JS (2013)
Meta-analyses of habitat selection by fishers at resting sites
in the pacific coastal region. J Wildl Manag 77:965–974
Baker C, Lawrence R, Montagne C, Patten D (2006) Mapping
wetlands and riparian areas using landsat ETM? imagery
and decision-tree-based models. Wetlands 26:465–474
Banks PB, Norrdahl K, Korpimaki E (2002) Mobility decisions
and the predation risks of reintroduction. Biol Conserv
103:133–138
Benson JF, Chamberlain MJ, Leopold BD (2004) Land tenure
and occupation of vacant home ranges by bobcats (Lynx
rufus). J Mammal 85:983–988
Blankenship TL, Haines AM, Tewes ME, Silvy NJ (2006)
Comparing survival and cause-specific mortality between
resident and transient bobcats (Lynx rufus). Wildl Biol
12:297–303
Buchanan JB, Lundquist RW, Aubry KB (2013) Winter
populations of Douglas’ squirrels in different-aged Dou-
glas-fir forests. J Wildl Manag 54:577–581
Buskirk SW, Bowman J, Gilbert JH (2012) Population biology
and matrix demographic modeling of American martens
and fishers. In: Aubry KB, Zielinski WJ, Raphael MG,
Proulx G, Buskirk SW (eds) Biology and conservation of
martens, sables, and fishers: a new synthesis. Cornell
University Press, Ithaca, pp 77–92
Caro T, Hunter J (2008) Interspecific competition and predation
in American carnivore families. Ethol Ecol Evol
20:295–324
Carroll C, Zielinski WJ, Noss RF (1999) Using presence-ab-
sence data to build and test spatial habitat models for the
Fisher in the Klamath Region, USA. Conserv Biol
13:1344–1359
Coonan TJ, Schwemm CA, Roemer GW, Garcelon DK, Munson
L (2005) Decline of an island fox subspecies to near ex-
tinction. Southwestern Nat 50:32–41
Creel S, Creel NM (1996) Limitation of African wild dogs by
competition with larger carnivores. Conserv Biol
10:526–538
Landscape Ecol
123
Davis FW, Seo C, Zielinski WJ (2007) Regional variation in
home-range-scale habitat models for fisher (Martes pen-
nanti) in California. Ecol Appl 17:2195–2213
De’ath G, Fabricius KE (2000) Classification and regression
trees: a powerful yet simple technique for ecological data
analysis. Ecology 81:3178–3192
Ewen JG, Armstrong DP, Parker KA, Seddon PJ (eds) (2012)
Reintroduction biology, 1st edn. Wiley-Blackwell, Oxford
Gilbert JH (2000) Impacts of reestablished fishers on bobcat
populations in Wisconsin. Dissertation, University of
Wisconsin-Madison, Madison
Gorini L, Linnell JD, May R, Panzacchi M, Boitani L, Odden M,
Nilsen EB (2012) Habitat heterogeneity and mammalian
predator-prey interactions. Mamm Rev 42:55–77
Hansen K (2007) Bobcat: master of survival, 1st edn. Oxford
University Press, New York
Heezik YV, Seddon PJ, Maloney RF (1999) Helping reintro-
duced houbara bustards avoid predation: effective anti-
predator training and the predictive value of pre-release
behavior. Anim Conserv 2:155–163
Ingram R (1973) Wolverine, fisher, and marten in Central
Oregon. Central Region Administrative Report. Oregon
State Game Commission, Salem
Jacobson JE, Lewis JC, Snyder MC (2003) Assessment of fisher
habitat in Washington State. Tier 1 Refinement and Tier 2
Final Report. Washington Department of Fish and Wild-
life, Olympia
Knick ST, Brittell JD, Sweeney SJ (1985) Population charac-
teristics of bobcats in Washington state. J Wildl Manag
49:721–728
Koehler GM, Hornocker MG (1989) Influences of seasons on
bobcats in Idaho. J Wildl Manag 53:197–202
Koehler GM, Hornocker MG (1991) Seasonal resource use
among mountain lions, bobcats, and coyotes. J Mammal
72:391–396
Krohn WB, Elowe KD, Boone RB (1995) Relations among
fishers, snow, and martens: development and evaluation of
two hypotheses. For Chron 71:97–105
Lewis JC (2013) Implementation plan for reintroducing fishers
to the Cascade Mountain Range in Washington. Wash-
ington Department of Fish and Wildlife, Olympia
Lewis JC (2014) Post-release movements, survival, and re-
source selection of fishers (Pekania pennanti) translocated
to the Olympic Peninsula of Washington. Dissertation,
University of Washington
Lewis JC, Hayes GE (2004) Feasibility assessment for reintro-
ducing fishers to Washington. Final Report. Washington
Department of Fish and Wildlife, Olympia
Lewis JC, Happe PJ, Jenkins KJ, Manson DJ (2011) Olympic
fisher reintroduction project: progress report 2008–2011.
Washington Department of Fish and Wildlife, Olympia
Lewis JC, Powell RA, Zielinski WJ (2012) Carnivore translo-
cations and conservation: insights from population models
and field data for fishers (Martes pennanti). PLoS One
7:e32726
Litvaitis JA, Tash JP, Stevens CL (2006) The rise and fall of
bobcat populations in New Hampshire: relevance of his-
torical harvests to understanding current patterns of abun-
dance and distribution. Biol Conserv 128:517–528
Lofroth EC, Raley CM, Finley LL, Naney RH (2010) Conser-
vation of fishers (Martes pennanti) in south-central British
Columbia, western Washington, western Oregon, and
California. USDI Bureau of Land Management, Denver
Long RA, Donovan TM, MacKay P, Zielinski WJ, Buzas JS
(2010) Predicting carnivore occurrence with noninvasive
surveys and occupancy modeling. Landscape Ecol
26:327–340
Mao JS, Boyce MS, Smith DW, Singer FJ, Vales DJ, Vore JM,
Merrill EH (2005) Habitat selection by elk before and after
wolf reintroduction in Yellowstone National Park. J Wildl
Manag 69:1691–1707
McCleery R, Oli MK, Hostetler JA, Karmacharya B, Greene D,
Winchester C, Gore J, Sneckenberger S, Castleberry SB,
Mengak MT (2013) Are declines of an endangered mam-
mal predation-driven and can a captive breeding and re-
lease program aid their recovery? J Zool 291:59–68
Moehrenschlager A, List R, Macdonald DW (2007) Escaping
intraguild predation: Mexican kit foxes survive while
coyotes and golden eagles kill Canadian swift foxes.
J Mammal 88:1029–1039
Moseby KE, Read JL, Paton DC, Copley P, Hill BM, Crisp HA
(2011) Predation determines the outcome of 10 reintro-
duction attempts in arid South Australia. Biol Conserv
144:2863–2872
Munoz J, Felicısimo AM (2004) Comparison of statistical
methods commonly used in predictive modelling. J Veg Sci
15:285–292
Neale JCC, Sacks BN (2001) Resource utilization and inter-
specific relations of sympatric bobcats and coyotes. Oikos
94:236–249
Ormerod SJ (2002) Applied issues with predators and predation:
editor’s introduction. J Appl Ecol 39:181–188
Poessel SA, Breck SW, Biggins DE, Livieri TM, Crooks KR,
Angeloni L (2011) Landscape features influence postre-
lease predation on endangered black-footed ferrets.
J Mammal 92:732–741
Powell R (1993) The fisher: life history, ecology, and behavior,
2nd edn. University of Minnesota Press, Minneapolis
Purcell KL, Mazzoni AK, Mori SR, Boroski BB (2009) Resting
structures and resting habitat of fishers in the southern
Sierra Nevada, CA. For Ecol Manag 258:2696–2706
Roy KD (1991) Ecology of reintroduced fishers in the Cabinet
Mountains of northwestern Montana. Thesis, University of
Montana, Missoula
Schwartz MK (2007) Ancient DNA confirms native Rocky
Mountain fisher (Martes pennanti) avoided early 20th
century extinction. J Mammal 88:921–925
Scheller RM, Spencer WD, Rustigian-Romsos H, Syphard AD,
Ward BC, Strittholt JR (2011) Using stochastic simulation
to evaluate competing risks of wildfires and fuels man-
agement on an isolated forest carnivore. Landscape Ecol
26:1491–1504
Schwartz MK, DeCesare NJ, Jimenez BS, Copeland JP, Mel-
quist WE (2013) Stand- and landscape-scale selection of
large trees by fishers in the Rocky Mountains of Montana
and Idaho. For Ecol Manage 305:103–111
Seddon PJ, Armstrong DP, Maloney RF (2007) Developing the
science of reintroduction biology. Conserv Biol 21:303–312
Slauson KM, Baldwin JA, Zielinski WJ (2012) Occupancy es-
timation and modeling in martes research and monitoring.
In: Aubry KB, Zielinski WJ, Raphael MG, Proulx G,
Buskirk SW (eds) Biology and conservation of martens,
Landscape Ecol
123
sables, and fishers: a new synthesis. Cornell University
Press, Ithaca, pp 343–368
Spencer WD, Rustigian-Romsos H, Strittholt J, Scheller R,
Zielinski WJ, Truex R (2011) Using occupancy and
population models to assess habitat conservation opportu-
nities for an isolated carnivore population. Biol Conserv
144:788–803
Tucker SA, Clark WR, Gosselink TE (2008) Space use and
habitat selection by bobcats in the fragmented landscape of
South-Central Iowa. J Wildl Manag 72:1114–1124
Vinkey RS, Schwartz MK, McKelvey KS, Foresman KR, Pil-
grim KL, Giddings BJ, Lofroth EC (2006) When reintro-
ductions are augmentations: the genetic legacy of fisher
(Martes pennanti) in Montana. J Mammal 87:265–271
Wengert G (2013) Ecology of intraguild predation on fishers
(Martes pennanti) in California. Dissertation, University of
California, Davis
Wengert GM, Gabriel MW, Matthews SM, Higley JM, Sweitzer
RA, Thompson CM, Purcell KL, Barrett RH, Woods LW,
Green RE, Keller SM, Gaffney PM, Jones M, Sacks BN
(2014) Using DNA to describe and quantify interspecific
killing of fishers in California. J Wildl Manag 78:603–611
Yackulic CB, Reid J, Nichols JD, Hines JE, Davis R, Forsman E
(2014) The roles of competition and habitat in the dy-
namics of populations and species distributions. Ecology
95:265–279
Zielinski WJ, Kucera TE (1995) American marten, fisher, lynx,
and wolverine: survey methods for their detection. General
Technical Report PSW-GTR-157. USDA Forest Service-
Pacific Southwest Research Station, Albany
Zielinski WJ, Truex RL, Ogan C, Busse K (1997) Detection
surveys for fishers and American martens in California,
1989-1994: summary and interpretations. In: Proulx G,
Bryant HN, Woodard PM (eds) Martes: taxonomy, ecol-
ogy, techniques, and management. The Provincial Museum
of Alberta, Edmonton, pp 372–392
Zielinski WJ, Truex RL, Schmidt GA, Schelexer FV, Schmidt
KN, Barrett RH (2004) Home range characteristics of
fishers in California. J Mammal 85:649–657
Zielinski WJ, Dunk JR, Yaeger JS, LaPlante DW (2010)
Developing and testing a landscape-scale habitat suitability
model for fisher (Martes pennanti) in forests of interior
northern California. For Ecol Manag 260:1579–1591
Landscape Ecol
123


