
MODELS OF GESTATIONAL DIABETES AND OFFSPRING OUTCOMES IN MICE
_______________________________________
A Dissertation
presented to
the Faculty of the Graduate School
at the University of Missouri-Columbia
_______________________________________________________
In Partial Fulfillment
of the Requirements for the Degree
Doctor of Philosophy
_____________________________________________________
by
OMONSEIGHO OWOMARE TALTON
Dr. Laura Schulz, Dissertation Supervisor
DECEMBER 2017
The undersigned, appointed by the dean of the Graduate School, have examined the dissertation entitled:
MODELS OF GESTATIONAL DIABETES AND OFFSPRING OUTCOMES IN MICE
presented by Omonseigho Owomare Talton,
candidate for the degree of doctor of philosophy
and hereby certify that, in their opinion, it is worthy of acceptance.
Dr. Laura Schulz
Dr. David Setzer
Dr. Susan Nagel
Dr. Michael F. Smith

DEDICATION
I dedicate my dissertation to those that have inspired, supported and advanced my
academic pursuits. Firstly, to God from whom are all things, as “it is the glory of God to
conceal a matter, but to search out a matter is the honor of kings.” To my husband C.J,
for your strong support and encouragement. I am grateful to have had you with me on
this journey. To our daughter, Noelle who has brought us an incredible amount of joy. To
my parents, Drs. Alfred and Pamela Esangbedo, and siblings Ame and Enato; thank you
for your love, provision, and for pushing me to excel. To my parents-in-law, Clay and
Tracy Talton, thank you for providing a place of rest and for always cheering me on. To
Dr. Peter Goldman, my first Biology professor, in whose home I had my first American
Thanksgiving. To Convergence Church for being a family away from natural family. I
am unable to write down the names of all the teachers, staff, friends, and countless other
individuals that have left incredible impacts on my life, but I am grateful to all of you.

ii
ACKNOWLEDGEMENTS
I must start by thanking my mentor and dissertation supervisor, Dr. Laura Schulz for the
opportunity to work in the lab. Your mentorship is unmatched, and I am a better scientist
for it. Thank you for being supportive and inspiring. Special thanks to Dr. Nagel, Dr.
Setzer and Dr. Fielding-Smith for serving on my committee and providing guidance
throughout graduate school. I would like to acknowledge all past and present graduate
students in the Schulz lab who have advised and supported me: Kelly Pollock, Gerialisa
Von Gronigen Case, Megan Sheridan, Rowan Karvas and Jenna DeCata. I especially
want to thank Dr. Kathleen Pennington and Dr. Arin Kettle Oestreich, former post-docs
for your mentorship and friendship during your time at Mizzou and beyond. Keenan
Bates, Kylie Hohensee, Jennifer Kaiser, Hannah Blackmore, and Ericka Scott are
undergraduates and high school students who have helped me accomplish this
dissertation, and given me the opportunity to be a mentor. I had the privilege of doing
rotations in the labs of Dr. Michael R. Roberts, Dr. Anand Chandrasekhar and Drs. Lorin
and Mirela Milescu; valuable experiences that I am grateful for. Thank you to Rebecca
Welly for assistance using the metabolic cages for the GDM model studies. I gratefully
acknowledge the support provided by Ming Yang and the Veterans Affairs Biomolecular
Imaging Center at the Harry S. Truman Veterans Affairs Hospital and the University of
Missouri-Columbia. Dr. Elizabeth Parks provided advice for the determination of liver
triglyceride content in the hyperleptinemia model studies.

iii
TABLE OF CONTENTS
ACKNOWLEDGEMENTS ii
LIST OF TABLES v
LIST OF FIGURES vi
ABSTRACT vii
CHAPTERS
I. REVIEW OF THE LITERATURE
Gestational Diabetes – Definition, Prevalence and Risk Factors 1
Normal versus GDM Pregnancy 2
Offspring Outcomes of GDM 4
Mechanisms Underlying GDM Offspring Outcomes 6
Rodent models for GDM pregnancy 10
Current Rodent Models of GDM 12
Research Goals 21
II. MATERNAL HYPERLEPTINEMIA IMPROVES OFFSPRING INSULIN
SENSITIVITY IN MICE

iv
Abstract 26
Introduction 27
Materials and Methods 29
Results 36
Discussion 40
III. MATERNAL GLUCOSE INTOLERANCE INCREASES OFFSPRING ADIPOSE
MASS AND INSULIN SIGNALING IN MICE
Abstract 57
Introduction 58
Methods 60
Results 67
Discussion 70
BIBLIOGRAPHY 86
VITA 127

v
LIST OF TABLES
I-1. IADSPG and ACOG criteria for diagnosing gestational diabetes mellitus 24
II-1. Primer Table 48
III-1. Primer Table 77

vi
LIST OF FIGURES
II-1. Insulin response in wildtype offspring 49
II-2. Pancreatic endocrine cell counts 50
II-3. Real-time PCR analysis of glucose metabolic gene expression in liver 51
II-4. Magnetic Resonance Imaging and serum measurements in adult offspring 52
II-5. Real-time PCR analysis of lipid metabolic gene expression in adipose tissue 53
II-6. Real-time PCR analysis of lipid metabolic gene expression in liver tissue 54
II-7. Lipid accumulation in livers of offspring at 31 weeks 55
III-1. Offspring weights 78
III-2. Body fat percentage measured by Magnetic Resonance Imaging 79
III-3. Food consumption and energy expenditure 80
III-4. Respiratory quotient 81
III-5. Steady state mRNA levels of genes related to beta oxidation 82
III-6. Steady state mRNA levels of genes related to fatty acid synthesis 83
III-7. Serum leptin and triglycerides and liver triglycerides 84
III-8. Glucose control in offspring 85

vii
MODELS OF GESTATIONAL DIABETES AND OFFSPRING OUTCOMES IN MICE
Omonseigho O. Talton
Dr. Laura C. Schulz, Dissertation Supervisor
ABSTRACT
Gestational diabetes mellitus (GDM) is the most common pregnancy disorder. GDM
pregnancies result in offspring that are more likely to develop metabolic syndrome in
adolescence than the background population. As offspring experience these adverse
effects during their reproductive years, GDM has the potential to propagate disease for
many generations.
Hyperleptinemia, a key characteristic of both GDM and maternal obesity has not been
studied in isolation to determine its role in programming offspring outcomes.
Hyperglycemia in the absence of obesity has also not been widely modeled without
surgical or chemical means. My research goal was to study the offspring outcomes of
these two facets of GDM in C57B6 mice.
We observed that maternal hyperleptinemia improved offspring insulin sensitivity, and
protected the offspring from developing glucose intolerance. These outcomes were partly
mediated by reduced fatty acid accumulation in the liver. Our findings suggest that
maternal hyperleptinemia is protective of offspring glucose control.
Maternal hyperglycemia in lean dams increased offspring adiposity while glucose
tolerance was unchanged. This effect was mediated by a preference for glucose over

viii
lipids for substrate utilization, and multiple gene expression changes in the male adipose
tissue and liver. Our results indicate that lean maternal hyperglycemia results in
metabolically healthy obesity in offspring.
This work demonstrates that GDM in lean women may not negatively affect glucose
tolerance, and that maternal hyperleptinemia may mediate this, through improving insulin
sensitivity. It supports other data that suggest that the liver and adipose tissue are key
regulators of whole body metabolism.

1
CHAPTER I
REVIEW OF THE LITERATURE
Gestational Diabetes – Definition, Prevalence and Risk Factors
Gestational diabetes mellitus (GDM), described as glucose intolerance during pregnancy
[1], is the most common complication of gestation and affects one in seven pregnancies
worldwide according to the International Diabetes Federation [2].
In 2010 the prevalence of GDM was up to 14% in the United States [3], with a relative
increase of 122% between the late 1980s and the mid-2000s [4]. Recent studies place the
global prevalence as high as 25% depending on the diagnostic criteria used [5], making
GDM a global epidemic. The American Congress of Obstetricians and Gynecologists (ACOG)
guidelines commonly used in the USA and International Association of the Diabetes and
Pregnancy Study Groups (IADPSG) criteria preferred outside the United States provide the
most common criteria for diagnosing GDM (Table 1).
Typically diagnosed in women during the middle of pregnancy, GDM has a number of
risk factors. A meta-analysis of twenty GDM studies spanning 2000 to 2005 revealed that
the odds ratio for developing GDM was 3.56 for obese women compared to lean women
[6]. Obesity is accompanied by insulin resistance, and in obese women, this has been
suggested to bethe basis for a higher risk of developing GDM [7]. In a study of 455
women, Hedderson et al showed that women from Hispanic and Asian backgrounds are
more likely to develop GDM than Caucasians and African-Americans [8]. Aside from
maternal BMI and ethnic background, a previous history of GDM [9] and parental

2
diabetes [10] are also risk factors. While the cause of GDM remains unknown, it involves
prior insulin resistance [11], and impairments in the maternal adaptation to glucose
control during pregnancy.
Normal versus GDM Pregnancy
Normal pregnancy is characterized by modulations in insulin sensitivity to mediate
glucose control. During early pregnancy, insulin sensitivity is similar to that of the non-
pregnant state. [12] This is partly to allow insulin-mediated lipogenesis to occur, building
maternal fat stores for the latter part of pregnancy and lactation [13]. As gestation
advances, insulin sensitivity declines and by the third trimester, insulin sensitivity is 50%
lower in pregnant compared to non-pregnant women [14, 15]. This is partially facilitated
through an increase in maternal estrogen, progesterone, and human placental lactogen,
which inhibit insulin signaling in peripheral tissues [16]. These pregnancy hormones
cause insulin resistance by decreasing levels and subsequent phosphorylation of the
insulin receptor (IR) and insulin receptor substrate 1 (IRS-1) in skeletal muscle [17]. PI-3
kinase activity downstream of IR is also inhibited by placental hormones further
inhibiting insulin signaling [18]. Accompanying this increased insulin resistance is
reduced blood glucose, which drops as pregnancy progresses. The cause for the decrease
is the redirection of maternal glucose to the fetus, to accommodate its growing energy
requirements [19].
In the fasted state, this maternal insulin resistance results in the preferential trafficking of
glucose to the maternal-fetal interface, where glucose is diffused into fetal blood. Insulin
resistance promotes this by reducing the uptake of glucose by maternal tissues and by

3
uninhibited hepatic glucose production [12]. Maternal feeding results in a rise in blood
glucose which, under pregnancy-induced insulin resistance, would result in
hyperglycemia. To compensate for the reduced insulin action in maternal tissues, and
prevent post-prandial hyperglycemia during pregnancy, the pancreas expands to increase
insulin secretion [20, 21]. This maintains maternal blood glucose levels and results in
hyperinsulinemia as part of the normal milieu of pregnancy [19]. Thus, despite insulin
resistance similar to what is observed in type 2 diabetics, pregnant women are not
glucose intolerant.
In women with gestational diabetes, there is higher-than-normal post-prandial blood
glucose in maternal circulation due to increased insulin resistance and inadequate insulin
response to glucose [22-25]. Additionally, hepatic glucose production is higher in GDM
pregnancies, due to increased insulin resistance [12]. As GDM pregnancies progress,
insulin sensitivity decreases by the same proportion as it does in normal pregnancy. The
apparent further reductions in insulin sensitivity are due to lower insulin sensitivity in the
pre-gravid state, which has been observed in both lean and obese GDM women [26].
There remains much to be elucidated about the pathophysiology of GDM; however
studies have revealed some of the mechanisms underlying the development of gestational
hyperglycemia. Insulin resistance in GDM pregnancy involves further reductions of IR
protein levels and reduced phosphorylation of IR as well [17]. The insulin response is
further weakened by an inability of the pancreas to expand in response to the stress of
pregnancy [27, 28]. Thus despite being high, insulin levels are not sufficient to overcome
the degree of insulin resistance encountered by GDM women, and post-prandial
hyperglycemia results.
4
Gestational diabetes is a health concern because of the complications that follow in
affected pregnancies. Premature labor, preeclampsia and fetal macrosomia often resulting
in shoulder dystocia are some of the common issues associated with GDM pregnancies
[29-32]. The effects of GDM go beyond the pregnancy, affecting the future health of the
mother. Women with GDM are seven times more likely to develop type 2 diabetes than
women with normal glycemia during gestation [33], and more likely to experience
recurring GDM in subsequent pregnancies [4].
Offspring Outcomes of GDM
The consequences of GDM are compounded by numerous adverse outcomes in the
offspring. Left untreated, GDM fetuses have a four-fold higher risk of stillbirth. Less
severe perinatal complications of GDM at the time of birth include shoulder dystocia,
fetuses who are large for gestational age and fetal hypoglycemia [34, 35].
Of additional concern are the long-term negative effects in offspring, particularly when
occurring in offspring of reproductive age. Children born to mothers with GDM are
predisposed to diabetes and obesity in adulthood. The Diabetes in Pregnancy study,
founded in Northwestern University, contains data on a large cohort of women enrolled
between 1977 and 1983 and is used to study the offspring of women with GDM. Using
these data, Silverman et al showed that maternal diabetes conferred an increase in glucose
intolerance and hyperinsulinemia in adolescent offspring [36]. The Arizonian Pima
Indian population has a high prevalence of diabetes, and glucose tolerance data has also
been collected on that group to study diabetic pregnancies. Exposure to maternal diabetes
is the major risk factor for the high prevalence of diabetes in the children of Pima Indians

5
[37]. In a Pima Indian study of siblings born to mothers before or after a diagnosis of
diabetes, the siblings born after the diagnosis had an increased risk for developing
diabetes when compared to siblings born prior, with an odds ratio of 3.7 [38]. Pettitt et al
showed that the prevalence of non-insulin-dependent diabetes in Pima Indian offspring of
GDM mothers is 45% compared to 1.4% in offspring not exposed to diabetes in utero
[39]. Studies have also been conducted in populations at a low risk for developing GDM
with similar results [40, 41], including a Danish study which determined that the
prevalence of impaired glucose tolerance was 21% for 18-27 year old offspring born to
GDM mothers compared to 4% for offspring of women from the background population
[42].
A study of the Pima Indian population showed that offspring born to diabetic mothers had
a higher incidence of obesity than those born to non-diabetic mothers [43]. In the same
population, siblings had different birth weights depending on whether they were born
before or after their mother was diagnosed with diabetes, with children born after the
diagnosis weighing more [38]. A European study including over 280,000 men determined
that exposure to maternal diabetes increased offspring BMI independently of maternal
BMI [44]. Other human studies show the same higher risk for obesity in offspring of
GDM mothers [45-48] including a multi-ethnic study showed that as maternal glycemia
values from a glucose challenge test increased, so did offspring obesity in children aged
5-7 years [49]. Further evidence of the association between maternal GDM and offspring
obesity comes from intervention studies, including a follow-up study in offspring born to
GDM women who were treated with insulin [50]. Compared to offspring of untreated

6
mothers, the offspring that were exposed to insulin-treated GDM in utero had decreased
adiposity.
Aside from obesity and diabetes, offspring born to mothers with gestational diabetes are
also at an increased risk for developing GDM in their own pregnancies, with one study
showing that women exposed to in utero hyperglycemia are more likely to develop GDM
than the background population [51].
The rising rates of childhood obesity, diabetes, and metabolic syndrome are a cause for
concern both for the present and future. While therapies exist to control diabetes and
obesity, including drugs and lifestyle interventions, they are still leading causes of death,
and confer a heavy burden on the economy. Since GDM pregnancies are implicated in
promoting these offspring diseases [52], there is a compelling basis for research into how
GDM affects offspring. Studies that can elucidate these mechanisms and present
therapeutic strategies are essential in curbing the negative effects of the disease on
individual lives as well as society at large.
Mechanisms Underlying GDM Offspring Outcomes
Genetic
Diabetes and obesity, often termed “diabesity” are the two main offspring outcomes
associated with GDM. Combinations of genetic and environmental factors mediate the
development of diabetes and obesity in offspring of GDM mothers. There are several
gene variants associated with GDM and type 2 diabetes [53, 54], and studies have shown
that mutations in maturity onset diabetes in the young (MODY) genes are also associated

7
with increased risk of GDM [55]. The clustering of GDM among families, and among
certain ethnic groups also point toward genetic inheritance; in fact, one study shows that
nearly 80% of type 2 diabetics have either one or both parents with diabetes [56]. Thus
women with diabetes during pregnancy might carry GDM-associated polymorphisms and
transmit them genetically to their offspring.
The aforementioned study demonstrated that the risk of developing diabetes was much
higher if the mother had diabetes than the father [56], suggesting that maternal diabetes is
a stronger determinant of the offspring phenotype. Numerous other studies have
confirmed this stronger association of maternal diabetes with both diabetes and obesity in
offspring [57-60], including a compelling study which showed that siblings born to
mothers prior to a diagnosis of diabetes weighed less than their siblings born afterwards
[38]. These data suggest that independent of genetic inheritance, the intrauterine
environment also confers offspring outcomes.
Direct effects of Intrauterine Environment
The intrauterine environment of a GDM pregnancy is characterized by increased fetal
availability of glucose, leading to fetuses that are large for gestational age [61, 62].
Maternal blood glucose is diffused across a concentration gradient to the fetus, as
maternal blood in the intervillous space bathes the placental villi containing fetal blood
vessels [63]. Higher post-prandial blood glucose levels in GDM mothers, due to
insufficient insulin response, promote glucose uptake to the fetus, resulting in a
macrosomic, or large-for-gestational age (LGA) fetus. Pedersen’s hypothesis states that
maternal hyperglycemia promotes fetal hyperglycemia which then promotes a

8
hyperactive fetal pancreas than secretes high levels of insulin in response to glucose
which has angiogenic effects on the fetus [64]. Ample studies show that birth weight and
cord insulin/C-peptide levels correlate, supporting this hypothesis [65-68].
The placenta responds to changes in maternal hormones, and alters fetal growth
accordingly [69]. Insulin receptors are expressed on the human placenta, primarily on the
maternal side in early pregnancy, with a progressive shift toward the fetal side with
advancing gestation [70, 71]. Maternal and fetal insulin, elevated in GDM pregnancies,
may act on placental receptors to affect fetal growth. Additionally, Jansson et al, along
with other groups, have shown that elevated levels of insulin can increase the activity of
amino acid transport systems in the placenta, potentially promoting fetal growth and
metabolism [72, 73]. The larger placentas in GDM pregnancies may also increase
nutrient transfer and fetal growth [74].
As such, the in utero environment of GDM pregnancies directly affects fetal outcomes,
promoting fetal macrosomia, which confers an increased risk of developing obesity in
adolescence [75, 76]. Studies have also found that high BMI increases the risk for type 2
diabetes [77, 78], thus there is evidence that offspring predisposition to diabetes and
obesity is directly due to in utero insults. Examining the effect of offspring macrosomia
on future risk for metabolic diseases such as obesity, high blood pressure, and diabetes in
offspring, Boney et al showed that the prevalence of metabolic syndrome was higher in
6-11 year old children who were large for gestational age (LGA) and born to a mother
with GDM than LGA offspring from a mother with normal glucose tolerance [79]. This
implies that aside from macrosomia, exposure to maternal glucose intolerance in utero
promotes long-term impaired health of the offspring.

9
Developmental Programming and Epigenetics
The study of how the maternal environment during early development can program
offspring susceptibility for diseases later in life is referred to as the developmental origins
of health and disease [80-82], and originates with the historical Dutch Hunger Winter
studies. Women who were pregnant during Holland’s 1944 famine were severely
undernourished. They gave birth to offspring who went on to develop metabolic diseases
such as diabetes, obesity, and hypertension in adulthood [83-85]. Santos et al. recently
studied 7-year-old children of diabetic mothers and observed a positive association
between maternal diabetes and offspring adiposity independent of maternal BMI and
offspring birthweight [86]. This provides evidence that the effects of maternal diabetes on
offspring adiposity are largely due to programming events in the uterus, and other studies
indicate that the maternal milieu comprising GDM can alter fetal tissues conferring
disease risk beyond genetic inheritance and beyond birth weight [87].
Epigenetics, which literally means “above genetics,” refers to mitotic or meiotic
inheritance without changes in DNA or gene sequence. Epigenetic modifications,
including DNA methylation, histone acetylation and imprinting, affect which genes are
silenced and expressed and can change the pattern of inheritance [88]. The external
environment influences mitotic inheritance through changes in the epigenome [89, 90],
and specifically, high insulin and glucose have been shown to affect the epigenetic
regulation of gene expression in a hepatic cell line [91]. In pancreatic islets from patients
with type 2 diabetes, differential DNA methylation was observed compared to non-
diabetic control subjects [92]. In another study, a pancreatic beta cell line exposed to high
glucose had increased DNA methylation of the insulin promoter compared to control

10
[93]. During early development, the epigenome is most susceptible to change; thus,
changes in the maternal environment during fetal development have an increased
potential to alter the methylation status [94]. In comparing genome-wide methylation
patterns between fetuses from mothers with and without GDM, Haertle et al found that
GDM offspring have a different epigenetic status, with methylation differences spanning
multiple genes in fetal cord blood [95]. Other studies have shown that GDM alters
placental and cord blood gene methylation [96, 97] in pathways related to metabolic
disease [98]. Thus epigenetic changes in utero due to GDM might program a greater
susceptibility to diseases like obesity and diabetes by changing the expression of genes
involved in the development of these diseases.
Rodent models for GDM pregnancy
These studies in humans confirm that GDM programs offspring risk for metabolic
disease, but they are limited in the scope of the work that can be done. Ethical
boundaries, the lack of non-invasive imaging techniques, and sample size limitations do
not allow detailed study into how GDM affects various tissues in offspring, and how
these in utero effects result in long-term development of disease. Additionally, the
difficulty in following up with children of diabetic mothers into adulthood, and improper
completion of questionnaires and surveys typically used to collect data also present
challenges. The aforementioned reasons detail the need for animal models to study the
phenotypes observed in GDM offspring and their underlying mechanisms. Various
animal models have been used to model GDM pregnancy, including sheep [99, 100],
monkeys [101], and pigs [102, 103]. Conducting studies in these larger animals is cost-

11
inhibiting, which is part of the reason why rodents are the preferred models of GDM
pregnancy [104].
Aside from their small size and the economics of their maintenance, there are many
factors that make rodents an ideal model of GDM pregnancy. In studying the link
between maternal insults and offspring outcomes, the placenta, as the site of nutrient and
oxygen transfer, is of importance. While it is clear that no animal model can recapitulate
human placentation, [105] rodents have an advantage over other animals in that they have
structurally similar placentas to humans [106, 107]. Both possess a hemochorial placenta,
in which the maternal blood is in direct contact with the fetal trophoblast cells.
Additionally, studies have shown molecular similarity with conserved genes between
human and mouse sites of placental transfer [108], namely the villous tree and labyrinth
in humans and mice respectively. The physiology of rodent pregnancy also confers
multiple benefits. Pregnancy in mice and rats lasts approximately 3 weeks, which allows
studies to be performed more quickly than in animals with longer gestation periods.
Rodent pregnancy is also multiparous, which reduces the number of animals required to
obtain an adequate offspring sample size.
Finally, mouse models of GDM are able to recapitulate many of the features observed in
GDM such as reduced insulin response [109-111], spontaneous glucose intolerance [109,
112], impairments in pancreatic adaptation to pregnancy [109, 113, 114], as well as many
of the offspring outcomes clinically observed such as macrosomia/fetal growth restriction
[115-118], and a predisposition to type 2 diabetes and obesity in adulthood [118-121].

12
Current Rodent Models of GDM
Surgical
The beta cells of the pancreas are the site of insulin production. During early pregnancy,
hyperinsulinemia develops to promote the passive diffusion of glucose to the fetus, and
this diversion of glucose is maintained in late pregnancy by elevated levels of placental
hormones, which promote insulin resistance [20, 122]. Insulin production must increase
to protect against maternal hyperglycemia in late pregnancy, and this is facilitated by beta
cell expansion through hypertrophy [20, 114, 123]. In human pregnancy, a postmortem
study has suggested that deficient beta cell expansion drives the pathophysiology of
GDM [28]. Consequently pancreas excision has been used a model of GDM.
Surgical removal of part of the pancreas and the beta cells therein recapitulates
inadequate beta cell proliferation and produces a mild diabetic phenotype during
pregnancy; however, not many studies have been performed using this technique in
rodents [124, 125], and only one group has examined fetal outcomes to my knowledge.
The fetal mortality rate among offspring of pancreatectomized rats was higher than in
controls, and the offspring had higher birth weights and aberrant glucose tolerance
compared to controls [126]. The invasiveness of surgery, high mortality and high
abortion rates have contributed to the disuse of pancreatectomized rodents in GDM
studies [104]. In addition, removal of whole portions of the pancreas attenuate both
endocrine and exocrine pancreas functions, which has implications beyond maternal
hyperglycemia for food processing and digestion [127].
13
Chemically induced
An alternative to pancreatectomy is the selective ablation of the insulin producing beta
cells which proliferate during gestation [114]. This has the benefit of leaving the
remainder of the pancreas intact for exocrine functions, and can be accomplished through
the administration of drugs that selectively destroy beta cells. Alloxan and streptozotocin
(STZ) are two drugs that kill beta cells upon administration, and while alloxan was
developed first, the latter has less dangerous side effects, and is consequently the
preferred drug for use in animal models [127]. STZ is similar in structure to glucose, such
that it can enter the GLUT2 channel receptors located on pancreatic beta cells. Upon
entry, STZ educes an inflammatory response resulting in beta cell death [128].
GDM models using STZ vary in the dosage and timing of STZ administration. High
doses result in more severe maternal hyperglycemia than that observed in typical GDM,
while lower doses give moderate hyperglycemia [129]. Deeds et al have reviewed the
STZ doses typically used in mice [128].
The various streptozotocin treatments result in different fetal outcomes. Moderate
maternal hyperglycemia from single or low doses of STZ can result in macrosomic
offspring or offspring with no differences in birth weight [129, 130]. Correspondingly,
when dams are given one or more high doses of streptozotocin resulting in severe
maternal hyperglycemia, their offspring present with low birth weights (37,[129]. Both
fetal outcomes are observed in GDM pregnancies at a higher rate than in the background
population [131, 132]. In adulthood, offspring of STZ diabetic dams display aberrant
glucose tolerance regardless of the dosage [121, 129, 130].

14
STZ-treated dams make good models of hyperglycemia that is due to insulin-deficiency
in pregnancy [133], and are particularly useful in studying populations with pre-existing
diabetes prior to pregnancy since the model more closely resembles type 1 diabetes than
GDM [133]. Additionally, STZ models of GDM recapitulate the incidence of neural tube
defects observed in children of GDM mothers [134]. As a result this model has been
widely used to study the development of these congenital malformations in offspring
from diabetic pregnancies [134-136].
STZ, particularly in one or more high doses has proven toxic to other tissues, and can
cause nephropathy, among other diseases [137-139]. To avoid these side effects of the
STZ drug on pregnancy and embryogenesis, the drug must be given prior to pregnancy,
resulting in diabetes that carries over to pregnancy, rather than diabetes that develops
during pregnancy [140]. Additionally, treatment during pregnancy risks direct effects of
STZ on the fetus; one study has shown that STZ crosses the placenta in rhesus monkeys
[141], although in this study, no further effects were observed. Prager and Padmanabhan
have separately shown that STZ induces morphological changes in the rat placenta [142,
143] which has implications for fetal growth and may be responsible for the growth
restriction observed in fetuses of STZ-induced diabetic dams.
An additional caveat of STZ and surgical models of diabetes is that typically, GDM
women develop hyperglycemia spontaneously, rather than as a direct consequence of an
intervention. Additionally, women with GDM do not display the same severity of
hyperglycemia observed in most STZ models [129]. As a result, the offspring phenotype
produced may be due to any number of the maternal insults caused by STZ
administration.

15
Diet-induced
Feeding rodents a long-term high fat diet results in hyperglycemia and abnormal glucose
tolerance, along with obesity. When fed a 45% kcal/fat diet 6 weeks prior to mating and
throughout gestation and lactation, Sprague-Dawley rats more than doubled in weight and
developed glucose intolerance prior to pregnancy, but did not exhibit fasting
hyperinsulinemia and hyperglycemia until mid-gestation [115]. Offspring were
macrosomic at birth and by 7 weeks of age, they exhibited increased body weight. Other
phenotypes in the offspring of the diet-induced GDM dams included increased adiposity,
hyperinsulinemia, markedly reduced expression of IR-beta and liver steatosis compared
to offspring of lean controls [115]. A limitation of this model is that glucose intolerance
develops prior to pregnancy, thus is more suitable as a model of type 2 diabetes during
pregnancy than of GDM.
Models of long-term (4-12 weeks) high-fat (45% - 60% kcal/fat)-induced GDM exist
wherein glucose intolerance begins during gestation [111, 144-146], and offspring
outcomes are similar with a propensity towards obesity, non-alcoholic fatty liver disease
and diabetes beginning at 13-15 weeks of age [145, 146]. The high-fat fed rodent is
commonly used to model GDM as it is a largely side-effect-free method of inducing
GDM, as well as being effective and relatively simple. The spontaneous development of
glucose intolerance only during pregnancy is an added benefit, as it is similar to the
pathophysiology of clinical GDM in obese women.
However studies have shown that high maternal BMI causes adverse pregnancy
outcomes independently of maternal hyperglycemia [147, 148], including a lot of the

16
same offspring outcomes that are observed in diet-induced GDM models, such as weight
gain, inflammation, and elevated lipid accumulation in the liver [149]. Maternal high-fat
feeding has been found to alter the developmental programming of offspring, with effects
on the epigenome predisposing the offspring for metabolic syndrome [150-153].
Additionally, obesity has implications for germ cell development. Studies by the Moley
lab have shown that diet-induced obesity in mice results in oocyte abnormalities [154-
156]. In one study, Jungheim et al showed that feeding C57BL6 mice a 35.8% g/fat diet
for 16 weeks resulted in increased follicular death, and decreased size and growth of
oocytes [157]. Thus the effects of maternal high fat feeding on the oocytes might also
affect offspring development.
In spite of these concerns, the high-fat-induced GDM model remains ideal for
recapitulating the effects of obese GDM on offspring outcomes, which is present in about
42% percent of the GDM human population [158]. More women of child-bearing age are
obese now than ever in history [159], and obesity is a major risk factor for the
development of GDM [160]. It also serves to confirm and mimic studies characterizing
the effects of maternal hyperglycemia on offspring in humans that are also often
performed in obese individuals [65, 161].
It is important to separate maternal hyperglycemia from maternal obesity in studying
their respective outcomes on offspring. Indeed, many studies on the effects of maternal
obesity on offspring health make no mention of maternal glycemia, whereas the
aforementioned studies show that the two comorbidities often present together.
Epidemiological research has shown that around 30% of women with GDM are lean
[162], outlining the need for GDM models that are representative of this population.
17
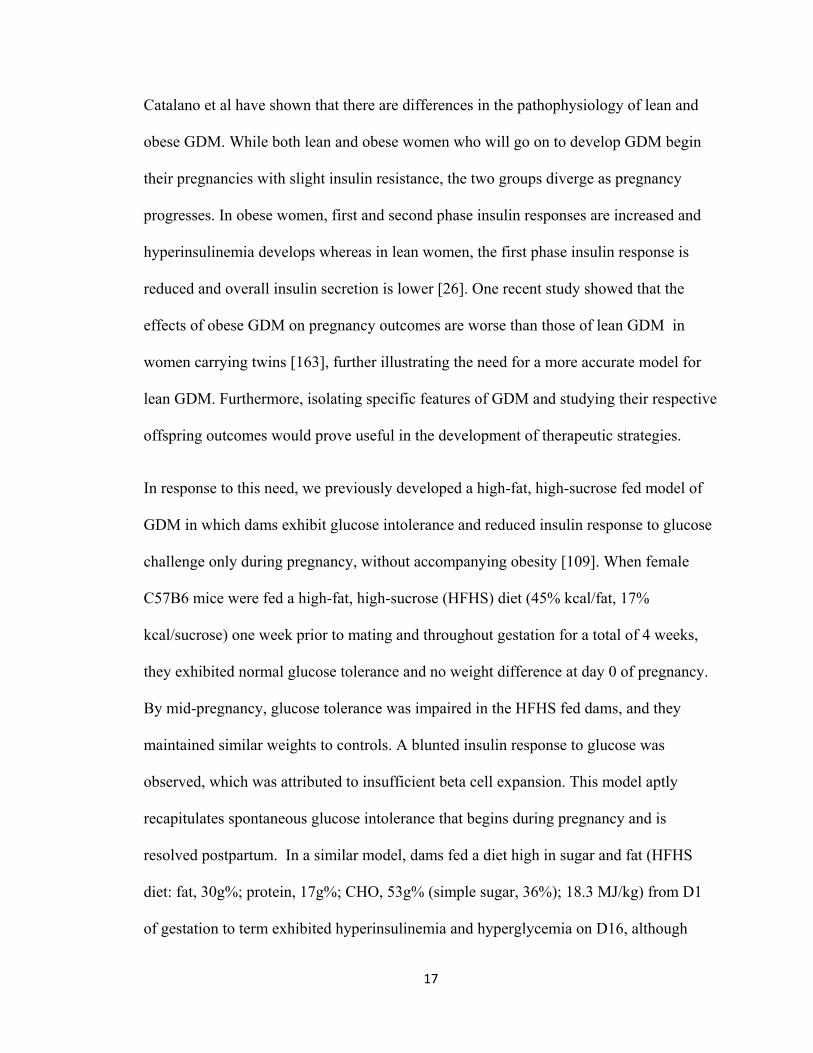
Catalano et al have shown that there are differences in the pathophysiology of lean and
obese GDM. While both lean and obese women who will go on to develop GDM begin
their pregnancies with slight insulin resistance, the two groups diverge as pregnancy
progresses. In obese women, first and second phase insulin responses are increased and
hyperinsulinemia develops whereas in lean women, the first phase insulin response is
reduced and overall insulin secretion is lower [26]. One recent study showed that the
effects of obese GDM on pregnancy outcomes are worse than those of lean GDM in
women carrying twins [163], further illustrating the need for a more accurate model for
lean GDM. Furthermore, isolating specific features of GDM and studying their respective
offspring outcomes would prove useful in the development of therapeutic strategies.
In response to this need, we previously developed a high-fat, high-sucrose fed model of
GDM in which dams exhibit glucose intolerance and reduced insulin response to glucose
challenge only during pregnancy, without accompanying obesity [109]. When female
C57B6 mice were fed a high-fat, high-sucrose (HFHS) diet (45% kcal/fat, 17%
kcal/sucrose) one week prior to mating and throughout gestation for a total of 4 weeks,
they exhibited normal glucose tolerance and no weight difference at day 0 of pregnancy.
By mid-pregnancy, glucose tolerance was impaired in the HFHS fed dams, and they
maintained similar weights to controls. A blunted insulin response to glucose was
observed, which was attributed to insufficient beta cell expansion. This model aptly
recapitulates spontaneous glucose intolerance that begins during pregnancy and is
resolved postpartum. In a similar model, dams fed a diet high in sugar and fat (HFHS
diet: fat, 30g%; protein, 17g%; CHO, 53g% (simple sugar, 36%); 18.3 MJ/kg) from D1
of gestation to term exhibited hyperinsulinemia and hyperglycemia on D16, although

18
they weighed less than control dams [164]. The isolation of GDM from the confounding
variable of maternal obesity provides a promising model for studying the etiology of lean
GDM, and its offspring outcomes.
Genetic
Prolactin
Knockouts in a number of genes have resulted in the development of spontaneous
hyperglycemia during pregnancy, including knockouts of the prolactin and leptin
receptors.
During mouse and human pregnancy, prolactin levels are elevated, as estrogen and
progesterone promote pituitary secretion of prolactin that is required for mammary gland
development [165]. Prolactin, along with placental lactogen, acts through the prolactin
receptor to stimulate pancreatic beta cell proliferation to counteract heightened insulin
resistance [20, 21]. As such, mice lacking the prolactin receptor are deficient in the beta
cell remodeling required for glucose control during pregnancy. Banerjee et al
demonstrated that conditional inactivation of the prolactin receptor on beta cell islets in
mice results in decreased beta cell mass, reduced insulin secretion and glucose
intolerance in mice during pregnancy [166].
Knockout mice are more widely used as GDM models. Homozygous Prlr-/− mice are
glucose intolerant prior to [167] and during pregnancy [168] however, they also exhibit
severely decreased fertility and, when pregnancy is successful, do not lactate [169],
whereas heterozygotes (Prlr+/−) are fertile and display hyperglycemia, decreased islet

19
mass, and impaired beta cell proliferation during but not before pregnancy [113]. Female
offspring of Prlr+/− mice have a higher likelihood of developing GDM in their own
pregnancies, due to decreased beta cell proliferation during pregnancy [170, 171]
consistent with human data showing that there is a higher risk of GDM in pregnancies of
women born to mothers with GDM [51, 172].
Leptin
Pregnancy is a state of hyperleptinemia and leptin resistance, and the action of leptin has
been widely studied during pregnancy. Leptin, a 16 kDa protein encoded by the obesity
gene, was discovered in 1994 by Zhang et al [173] and is best known for regulating food
intake, which led to it being aptly named for the Greek word “leptos” meaning thin.
Leptin is a cytokine produced by adipocytes that reflects adipose tissue mass. Secretion
of leptin by adipocytes signals satiety, decreasing food intake, and increasing energy
expenditure [174-176]. In the years since its discovery, the known functions of leptin
have quickly expanded from a homeostatic regulator, to, among many other things, a key
reproductive hormone [177]. Leptin is required for pregnancy, as proven by studies
which show that leptin null animals are infertile, and that leptin administration to null
mice reverses this [178, 179]. In the non-pregnant state, leptin acts through its receptors
to maintain energy balance and influence reproduction. The leptin receptor (LEPR) is a
receptor tyrosine kinase and member of the class I cytokine family of receptors [180].
Leptin receptors exist as 6 different isoforms, as a result of alternative splicing of the
same gene; LEPRa-f. LEPb is the primary signaling form of the receptor, and highly
expressed in the hypothalamus in humans and mice. The remaining isoforms have limited
ability to transduce leptin signals, with LEPRe lacking the transmembrane and

20
intracellular domains [181]. The leptin receptor intracellular domain contains docking
sites for Janus kinase (JAK) and other kinases, which activate signaling cascades [181].
During pregnancy, adipose tissue mass expands to increase maternal nutrient stores [182]
and consequently, leptin secretion is elevated [183]. However hyperleptinemia is present
prior to increased adiposity [184] suggesting that it is promoted by other factors as well.
In fact, there is evidence that the human placenta produces and secretes leptin, which
contributes to the elevated leptin levels in maternal circulation during pregnancy [185,
186]. Leptin levels are elevated to ~ 2 fold in humans [187] and ~10 fold in rodents [188]
In rodents, the placenta does not produce leptin, but the increased production of the
soluble form of the leptin receptor, LEPRe, from the rat and mouse placentae is largely
responsible for increased serum levels of leptin by increasing the half-life of circulating
leptin [189, 190].
The purpose for elevated leptin levels is not fully known. The high levels of leptin in
maternal circulation during pregnancy are unaccompanied by decreased food intake and a
reduction in adipose mass, thus pregnancy is a state of leptin resistance. Ladyman et al
have performed elegant studies detailing the attenuation of the JAK/STAT signaling
pathways of leptin during pregnancy. Upon leptin administration, hypothalamic STAT3
phosphorylation was reduced in pregnant rats [191] and mice [192] compared to controls,
and food intake was not suppressed. Leptin does not cross the placenta [193, 194] but
both human and mouse placentas contain leptin receptors [195, 196]. Moreover, leptin
has been shown to regulate placental nutrient transport [72], indicating that it plays a role
in the growth and development of the fetus. In GDM, hyperleptinemia beyond that
observed in normal pregnancy is observed [197, 198].

21
Homozygous leptin receptor mutant mice (Lepr-/-) have been used as a model for
diabetes, however, the null mice are sterile, precluding their use in programming studies
[199]. Mice that are heterozygous for the leptin receptor mutation are severely
hyperleptinemic and display spontaneous glucose intolerance during pregnancy, leading
to their use as a model of GDM [200]. Yamashita et al observed that offspring of Lepr+/-
dams are macrosomic, and as adults the female offspring were hyperinsulinemic [112].
Unfortunately, other groups have been unable to reproduce the GDM phenotype. Plows et
al. performed controlled experiments to identify possible contributors to the presence of
GDM in some studies, and absence in others [201]. They did not observe GDM in any of
their experimental models, and there were no clear associations with any potential
contributors, leading to the conclusion that the Lepr+/- mouse is not an appropriate model
of GDM. Nonetheless, the model consistently displays hyperleptinemia above normal
pregnancy levels [201], as observed in GDM [202], and may be useful for determining
what role this characteristic of GDM pregnancy plays in conferring offspring outcomes.
Research Goals
Deficient in the literature are isolated studies, where specific facets of GDM are assessed
to determine their role in mediating the outcome measures observed in GDM, specifically
diabetes and obesity. This is essential in understanding the pathophysiology of GDM, and
its method of altering offspring phenotypes. It is also necessary in identifying factors that
can be modulated by lifestyle and drug interventions to curb the negative effects of the
disease.

22
The aim of the first study was to determine the role that hyperleptinemia, which is
exacerbated in GDM pregnancies, played in programming offspring metabolic outcomes.
Leptin has been implicated in the developmental programming of offspring health [203-
206], and is present in many rodent models of GDM and maternal obesity. However, in
these animal models it is accompanied by maternal glucose intolerance, and obesity, and
its independent effects on offspring metabolism had not been shown. Our study compared
offspring from two maternal hyperleptinemic models to their respective controls. We
developed the first model of hyperleptinemia using the Lepr+/- mouse. Lepr-/-) mice
have a mutation in the gene that encodes the leptin receptor, resulting in a truncated long
form of the leptin receptor. Homozygous mice are hyperleptinemic, obese, diabetic, and
infertile. As previously mentioned, GDM is spontaneously developed during the
pregnancies of some heterozygous mice, but it did not develop in ours. Our heterozygous
Lepr+/- mice had a normal glucose tolerance phenotype, but exhibited hyperleptinemia.
For the second hyperleptinemic model, wildtype females were implanted with mini-
osmotic pumps which release leptin (350ng/hr), or saline prior to mating, and throughout
gestation. The LEP dams have mild hyperleptinemia compared to the DB dams, allowing
for dose-dependent studies. Weights and activity had previously been analyzed in the
offspring of these mice, with offspring of hyperleptinemic dams having lower weights
and increased activity [204]. Assessments of offspring metabolism including glucose and
lipid control suggested that maternal hyperleptinemia alone does not cause metabolic
disease in offspring, and may be protective of insulin and leptin sensitivity.
The aim of the second study was to study the isolated effects of maternal glucose
intolerance during gestation on offspring outcomes. As models of GDM are often

23
confounded by maternal obesity, or the side effects of drug treatment and genetic
manipulations, we wanted to remove those factors. Additionally, we wanted a model that
was representative of lean GDM women. Using the lean GDM model developed by
Pennington et al [109] and previously described, we assessed offspring metabolism. Our
findings indicate that maternal glucose intolerance in lean dams has moderate effects on
offspring, programming increased adiposity without predisposing the offspring to
develop diabetes.

24
IADSPG ACOG
24‐28 week test Fasted 2hr 75g OGTT Non‐fasting 1hr 50g GCT
Fasted 3hr 100g OGTT
Basis of GDM Diagnosis 1 abnormal value on OGTT 1 positive screen, 2 abnormal values on OGTT
Glucose Target Level for Diagnosis
Screen: >130 mg/dL
Fasting glucose: 92 mg/dL Fasting glucose: 95 mg/dL
1hr glucose: 180 mg/dL 1hr glucose: 180 mg/dL
2hr glucose: 153 mg/dL 2hr glucose: 155 mg/dL
3hr glucose: 140 mg/dL
Table 1. IADSPG and ACOG criteria for diagnosing gestational diabetes mellitus [207].

25
CHAPTER II
MATERNAL HYPERLEPTINEMIA IMPROVES OFFSPRING INSULIN SENSITIVITY IN MICE
This chapter has been published in the journal Endocrinology
Talton OO, Pennington KA, Pollock KE, Bates K, Ma L, Ellersieck MR, Schulz LC. Maternal hyperleptinemia improves offspring insulin sensitivity in mice. Endocrinology, 2016, 157:2636–2648.
Omonseigho O. Taltona,b, Kathleen A. Penningtona†, Kelly E. Pollocka,c, Keenan Batesa,b, Lixin Mad, Mark R. Ellersieckc Laura Clamon Schulza,b,c*
a Department of Obstetrics, Gynecology, and Women’s Health, University of Missouri, Columbia, MO, USA b Division of Biological Sciences, University of Missouri, Columbia, MO, USA c Division of Animal Sciences, University of Missouri, Columbia, MO, USA d Department of Radiology, University of Missouri, Columbia, MO, USA, and Biomolecular Imaging Center at the Harry S. Truman Veterans Affairs Hospital, Columbia, MO, USA
Abbreviations: GDM (gestational diabetes mellitus), NAFLD (non-alcoholic fatty liver disease), GTT (glucose tolerance test), CD (chow diet), HFD (high fat, high sucrose diet)

26
Abstract
Maternal obesity and gestational diabetes are prevalent worldwide. Offspring of mothers
with these conditions weigh more and are predisposed to metabolic syndrome. A
hallmark of both conditions is maternal hyperleptinemia, but the role of elevated leptin
levels during pregnancy on developmental programming is largely unknown. We
previously found that offspring of hyperleptinemic mothers weighed less, and had
increased activity. The goal of this study was to determine whether maternal leptin affects
offspring insulin sensitivity by investigating offspring glucose metabolism and lipid
accumulation. Offspring from two maternal hyperleptinemic models were compared. The
first model of hyperleptinemia is the Leprdb/+ mouse, which has a mutation in one copy of
the gene that encodes the leptin receptor, resulting in a truncated long form of the
receptor, and hyperleptinemia. Wildtype females served as the control for the Leprdb/+
females. For the second hyperleptinemic model, wildtype females were implanted with
mini-osmotic pumps which released leptin (350ng/hr), or saline (as the control) just prior
to mating, and throughout gestation. In the offspring of these dams, we measured glucose
tolerance, serum leptin, insulin, and triglyceride levels, liver triglycerides, pancreatic
alpha and beta cell numbers, body composition, incidence of non-alcoholic fatty acid
disease (NAFLD), and the expression of key metabolic genes in liver and adipose tissue.
We found that the offspring of hyperleptinemic dams exhibited improved glucose
tolerance, reduced insulin and leptin concentrations, reduced liver triglycerides, and a
lower incidence of NAFLD. Overall, maternal hyperleptinemia was beneficial for
offspring glucose and lipid metabolism.

27
Introduction
Pregnancies complicated by gestational diabetes mellitus (GDM) are on the rise globally.
Recent data place the prevalence of GDM in the United States at 9.2%, or up to 18%, by
some diagnostic criteria [3]. GDM has emerged as a risk factor not only for adverse
maternal health outcomes [208, 209], but for a number of childhood conditions related to
metabolic syndrome [210], wherein researchers have found that children born to women
with GDM have an increased risk for obesity [211, 212] and type 2 diabetes [213, 214].
There is compelling evidence linking GDM to the development of offspring type 2
diabetes. Damm et al. showed that children born to women with GDM were over seven
times more likely to develop type 2 diabetes than the background population [215], and
Hamman et al. found that the association between GDM and offspring diabetes prevailed
regardless of age, sex or ethnicity [216]. In one study, children born to the same mother
prior to, or after a maternal diagnosis of diabetes were compared. The children exposed to
diabetes in utero had a risk of developing diabetes exceeding threefold that of siblings
born prior to the diagnosis [38].
Leptin, an adipose-derived satiety hormone that is elevated during pregnancy [217], is
significantly higher in pregnant women with GDM [197, 202, 218], suggestive of leptin
resistance. In the non-pregnant state, leptin promotes energy expenditure and decreases
food intake [219-221]. Leptin has also been shown to increase insulin sensitivity [222],
and in leptin-null mice, leptin treatment normalizes serum insulin and improves glucose
tolerance, correcting diabetes [223]. During obesity, leptin levels are high
(hyperleptinemia) but do not serve to reduce food intake or BMI, indicating leptin

28
resistance [224]. Additionally, elevating plasma leptin to a level similar to that observed
in overweight and insulin resistant people decreased glucose-mediated insulin secretion
[225]. This suggests that under high leptin conditions, leptin resistance leads to a lack of
leptin action that promotes insulin resistance and obesity.
The in utero environment affects offspring metabolism, a phenomenon referred to as
developmental programming [226-228]. While maternal leptin does not cross the
placenta to directly act on the fetus [229, 230] it has been implicated in developmental
programming. We have previously hypothesized that elevations in maternal leptin during
maternal obesity and GDM contribute to the mal-programming of the fetus [204].
Alternatively, maternal leptin signaling may improve offspring metabolism, such that
leptin resistance impairs it. To test this, we studied the offspring of hyperleptinemic dams
using a pharmacological hyperleptinemia model (dams infused with leptin via osmotic
pumps compared to saline treated controls), and a genetic hyperleptinemia model
(Leprdb/+ dams compared to wildtype controls). Rather than promoting offspring
macrosomia and obesity, exposure to high maternal leptin resulted in lower offspring
weights and increased offspring activity [204]. Others have also found that maternal
hyperleptinemia resulting from acute leptin treatment during late gestation [205], or
genetic disposition [231] reduced diet-induced obesity in offspring.
These studies indicate that leptin resistance, rather than high leptin itself, may be
problematic in GDM and maternal obesity. That is, a lack of leptin action promotes the
programming of offspring obesity, which normal leptin action protects against. In the
present study, the aim was to determine whether maternal leptin also protects insulin
sensitivity in offspring, by examining glucose tolerance and insulin concentrations in the

29
same offspring in which weights and behavior were previously assessed [204].
Additionally, factors that may influence insulin sensitivity, including offspring body fat
percentage, liver triglyceride accumulation, and serum leptin levels were examined.
Hepatic steatosis, and non-alcoholic fatty liver disease (NAFLD) are implicated in the
pathogenesis of type 2 diabetes. Furthermore, NAFLD can be developmentally
programmed by an adverse maternal environment, such as that of high fat fed dams
[232]. We previously found evidence that the combination of hyperleptinemia and caloric
restriction in dams alters the risk of NAFLD [233]. Thus, in the present study, liver
histopathology and triglyceride content were examined, as well as the expression of two
genes, Cd36 and Srebp1c, which transport fatty acids into the liver. These have been
implicated in NAFLD, and the developmental programming of NAFLD [232, 234-240].
Additionally, we assessed levels of transcripts encoding Hsd11b, which metabolizes
cortisol, and which is altered in the liver of sheep that have increased lipid accumulation
following developmental exposure to maternal undernutrition [241].
Materials and Methods
Animals and Tissue Collection
Animal procedures were approved by the University of Missouri Institutional Animal
Care and Use Committee and performed according to the NIH Guide for the Care and
Use of Laboratory Animals. The Leprdb colony was established as previously described
[204] by mating Leprdb/+ males from Jackson Laboratories (Bar Harbor, Maine) with
wildtype females from the University of Missouri. Data reported here were collected
from mice involved in behavioral experiments that have been published previously [204].

30
We studied the effects of maternal hyperleptinemia using two different models; a genetic
model (WT vs. DB/+) and a pharmacological model (SAL vs. LEP).
In the genotypic model, wildtype females (treatment group WT) served as the control
group for Leprdb/+ females (DB/+). DB/+ females have a point mutation in one copy of
Leprb; the long form of the leptin receptor, excising the portion of the cytoplasmic region
of the receptor that is responsible for leptin signaling [242]. The DB/+ females were
mated with wildtype males, and reciprocal crosses (wildtype females mated with Leprdb/+
males) were performed to ensure that each litter contained an equal proportion of
offspring genotypes [204].
In the pharmacological model, wildtype females infused with saline (SAL) throughout
gestation via insertion of a subcutaneous Alzet Mini-Osmotic Pump (Model 2004, Durect
Corporation, Cupertino, CA) served as the controls for wildtype females with
subcutaneously inserted leptin-filled pumps (LEP). Surgeries were performed a week
before mating with wildtype males [204].
Maternal characteristics were reported previously [204]. Briefly, DB/+ females exhibited
severe hyperleptinemia (127.0 ng/ml vs 53.1 ng/ml WT), while LEP females exhibited
milder hyperleptinemia (47.7 ng/ml vs 31.4 ng/ml SAL), allowing for dose dependent
studies. DB/+ dams weighed significantly more than WT controls, while LEP dam
weights were only numerically higher than SAL controls. Maternal fasting glucose,
serum insulin, and serum leptin were not different among treatment groups [204].
Forty-nine females were mated, producing 20 litters (7 WT, 3 DB/+, 4 SAL, 6 LEP).
Two months later, an additional 63 females were mated, producing 32 litters (6 WT, 8
31
DB/+, 10 SAL, 8 LEP). Pups were genotyped at weaning, as previously described [204]
and up to two male and two female wildtype offspring from each litter were retained for
study. Offspring from the first mating were kept on a standard chow diet (LabDiet 5008
Purina, St. Louis, MO) along with two male offspring from dams mated in the second
period, to provide a sufficient sample size for the chow diet cohort (male offspring: n= 11
WT, 8 DB/+, 8 SAL, 10 LEP; female offspring: n= 11 WT, 6 DB/+, 8 SAL, 10 LEP).
Offspring from the second mating period were placed on a high fat, high sucrose diet
(45% kcal/fat DIO HFD D12451, Research Diets, New Brunswick, NJ) at 23 weeks of
age (male offspring: n= 9 WT, 12 DB/+, 20 SAL, 14 LEP; female offspring: 8 WT, 9
DB/+, 18 SAL, 16 LEP). Weights and behavior data for these offspring were reported
previously [204].
All offspring were sacrificed by CO2 inhalation at 31 weeks of age, following ad libitum
food access. At sacrifice, blood was collected via cardiac puncture, and then centrifuged
to obtain serum which was stored at -20oC. Liver, subcutaneous fat and visceral fat were
excised and snap-frozen in liquid nitrogen prior to storage at -80oC. Pancreatic samples
were fixed in 4% paraformaldehyde (PFA), paraffin-embedded and stored at room
temperature. Liver samples were also fixed in 4%PFA, and embedded in Optimum
Cutting Temperature Compound (Fisher Scientific, Pittsburgh, PA) prior to storage at
−80oC.
Glucose Tolerance Tests
At 30 weeks of age, glucose tolerance was assessed in the offspring following the Animal
Models of Diabetic Complications Consortium protocol. The OneTouch Ultra glucose

32
meter was used to measure blood glucose levels as instructed by the manufacturer
(LifeScan Inc.). Following a 6 hour fast, blood glucose was measured from a sample
collected from a tail vein incision. Offspring were then given an intra-peritoneal injection
of 1mg/g body weight glucose, and blood was collected at 15, 30, 60 and 120 minutes
post-injection for glucose determination. GraphPad Prism (GraphPad Software, San
Diego California USA) was used to obtain a value for the area under the curve for each
animal as a measure of glucose tolerance.
Serum Insulin
Serum insulin was measured in offspring in terminal blood collections from mice with
free access to food. Insulin concentrations were measured using the Rat/Mouse Insulin
ELISA kit (Millipore, St. Charles, MO intra-assay variation: 14%, inter-assay variation:
3%) according to the manufacturer's instructions, save that the primary antibody was
incubated overnight.
RNA Isolation and qRT-PCR
RNA was isolated from offspring liver, subcutaneous adipose tissue, and visceral adipose
tissue samples collected upon sacrifice at 31 weeks. Liver samples of approximately
30mg were homogenized in 500ml TRI Reagent (Sigma-Aldrich, St. Louis MO) on a
General Laboratory Homogenizer (OMNI International, Kennesaw, GA). Phase-lock gel
tubes (5 Prime Inc., Gaithersburg, MD) were used to separate the aqueous phase and
further RNA isolation was performed using the RNeasy Mini Kit (Qiagen, Valencia, CA)
by using the manufacturer's protocol. Adipose tissue samples of approximately 60 mg
were homogenized in 1 mL TRI Reagent. Samples were centrifuged to separate and

33
remove the lipid layer and RNA isolation was performed using the Nucleospin RNA
Clean-up kit (Clonetech, Mountain View, CA; Mancherey-Nagel, Bethlehem, PA)
following the manufacturer's protocol. Genomic DNA was eliminated from all RNA
samples using the Turbo DNA-Free Kit (Ambion by Life Technologies, Grand Island,
NY).
One µg of liver RNA, or 500 ng adipose RNA were reverse transcribed using the
SuperScript First-Strand Synthesis System (Invitrogen Life Technologies, Carlsbad, CA)
according to the manufacturer's protocol with random hexamer primers. Real-time PCR
with SYBR Green Master Mix (Superarray, Qiagen, Valencia, CA) was performed to
quantify the relative mRNA concentrations of genes involved in (1) glucose metabolism:
Gck, Ghr, Igf1r, Igfbp1 and Insr; and (2) lipid accumulation: Cd36, Hsd11b1 and
Srebp1c in liver and of Lep, Leprb, Insr and Srebp1c in adipose tissue. Gapdh was used
as the internal reference gene for liver, and Actb and Hprt were used as the references for
adipose tissue. PCR cycling was as follows: 50.0 °C for 2 min (1 rep), 95°C for 10 min (1
rep) and 95°C for 15 sec, followed by 60°C for 1 min (40 reps). Cd36 and Srebp1c
primers have previously been published [243] and Gck, Hprt, Hsd11b1, Igf1r, Gapdh,
Igfbp1and Insr primers were designed with Primer Express (Applied Biosystems) and
synthesized by Integrated DNA Technologies (Coralville, IA). Ghr and Lep primers were
designed and synthesized by Integrated DNA Technologies. All primers were tested for
efficiency relative to the internal control, by using serial dilutions of template. Internal
control genes were determined not to differ in expression across treatment groups. PCR
results are expressed as fold change relative to CD WT, by the ΔΔCt method [244].
Primer sequences are detailed in Table 1.

34
Pancreatic Morphology
Pancreatic tissue was assessed by immunohistochemistry as previously described [233].
Pancreas sections were incubated overnight with primary antibodies mouse anti-glucagon
(Abcam ab10988) to mark alpha cells and rabbit anti-insulin (Abcam ab63820) to mark
beta cells at 1:200 and 1:250 dilutions, correspondingly. Alexa Fluor 568 goat anti-mouse
and Alexa Fluor 488 goat anti-rabbit were used as secondary antibodies at 1:500
(Invitrogen Life Technologies, Carlsbad, CA). Six 5µm sections separated by 50µm
intervals were examined in each pancreas. At least 3 islets per section, up to 16 islets
total, were photographed from each pancreas, and then 12 of these images were selected
for analysis by using a random number generator. Alpha cells, beta cells and nuclei were
pseudo-colored and alpha and beta cell numbers were counted by an operator blinded to
treatment group using ImageJ software, and the average number of cells per islet per
section was calculated for each animal.
Magnetic Resonance Imaging
Body composition was measured in the offspring at 29 weeks of age. A Micro-MRI high
performance 7T MR Imaging and Spectroscopy system (Bruker Corp., Billerica, MA)
equipped with a 86 mm inner diameter volume coil was used to determine body
composition as described elsewhere [245]. Data were analyzed with Mnova7 Software
(Mestrelab Research, Santiago de Compostela, Spain).
Serum Leptin
At 31 weeks of age, upon sacrifice of mice with free access to food, offspring blood
samples were collected by cardiac puncture for serum analysis. Serum leptin

35
concentrations were measured using the Mouse Leptin ELISA kit (Millipore, St. Charles,
MO, intra-assay variation: 8.9% inter-assay variation: 10%) according to the
manufacturer's instructions, save that the primary antibody was incubated overnight.
Serum and Liver Triglycerides
Triglyceride and free glycerol concentrations were measured in the terminal serum
samples via the Serum Triglyceride Determination Kit (Sigma-Aldrich, St. Louis, MO).
We modified the manufacturer's protocol, by using 96-well plates instead of cuvets.
Triglyceride concentrations were measured in liver samples using a modified Folch
protocol [246]. Briefly, liver samples of ~100mg were homogenized in
chloroform/methanol (2:1) and washed with 0.9% saline solution, then centrifuged at
4000 RPM for 10 min, after which the organic phase was collected. The organic phase
was dried and resuspended in glycerol reagent, and triglycerides were measured
following the same protocol.
NAFLD Assessment
Liver histopathology was performed on offspring to evaluate non-alcoholic fatty liver
disease (NAFLD) as previously described [245]. In brief, slides with liver sections were
stained with Oil Red O (Sigma) as instructed in the Biological Stain Commission
guidelines [247], then counter-stained with Mayer's hematoxylin (Sigma-Aldrich, St.
Louis, MO). Liver sections were graded on a scale of 0-3 (0 = less than 33% of the
sample contains the defect, 1 = 33-50%, 2 = 50-66%, and 3 = 66-100%) for common
characteristics of NAFLD, namely hepatocellular ballooning, steatosis and portal

36
inflammation. The score for each sample is the sum of the scores for each of the three
features. Three 8µm sections separated by 50µm intervals were examined per animal.
Statistical Analysis
All data were analyzed using SAS(R) (SAS Institute, Cary, NC). In each test, the wildtype
offspring of hyperleptinemic models were compared to their respective controls (WT vs.
DB/+ and SAL vs. LEP). Glucose concentrations across the time points of the GTT were
analyzed by nested repeated measures three-way ANOVA, with offspring sex, diet, and
maternal treatment group as fixed effects, and with offspring nested in mother. All other
parameters (including GTT area-under-the-curve) were analyzed by nested three-way
ANOVAs with offspring sex, diet, and maternal treatment group as fixed effects and with
offspring nested in mother. Real-time RT-PCR data were analyzed by comparing ΔCt
values. In order to correct for unequal variance, insulin concentrations were log
transformed prior to analysis.
Results
Regulation of Glucose Tolerance in Offspring
Maternal hyperleptinemia significantly improved offspring insulin sensitivity and glucose
tolerance. At age 30 weeks, fasting blood glucose was not different among offspring from
any of the maternal treatment groups (Fig. 1A-D). In a glucose tolerance test, as
measured by the area under the curve, glucose tolerance was significantly improved in
offspring of DB/+ dams, independent of offspring sex or diet (Fig. 1 A,C, p<0.05). There
was no difference in glucose tolerance between the offspring of SAL and LEP dams on

37
either diet (Fig. 1, B,D). Glucose tolerance deteriorated in each offspring group following
high fat, high sucrose feeding.
Insulin was measured at sacrifice, in mice with ad libitum access to food. Offspring of
DB/+ dams had significantly lower insulin than offspring of WT dams (p= 0.007) (Fig.
1E), and offspring of LEP dams had significantly lower insulin than offspring of SAL
dams (p=0.002) regardless of sex or diet (Fig. 1F)
Alpha and beta cells were identified by immunostaining (Fig. 2 A-D) in a random sample
of islets to determine whether differences in insulin production were driven by
differences in beta cell number. There was no difference in the number of alpha or beta
cells per pancreatic islet between the male offspring of control and hyperleptinemic dams
whether the offspring were fed chow or HFD (Fig. 2 E,F). Consuming HFD increased
beta cell numbers and reduced alpha:beta cell ratios in male offspring (Fig. 2 E-H),
whereas it increased alpha cell numbers in SAL and LEP females (Fig. 2J). Female
offspring of DB/+ dams had a significantly higher alpha to beta cell ratio (p=0.013) than
controls when consuming the HFD (Fig. 2K). Female offspring of LEP dams on the chow
diet also had a significantly higher alpha to beta cell ratio (p=0.05) than controls (Fig.
2L).
Real-time RT-PCR was used to examine expression of key insulin-related genes in the
liver that were previously shown to be altered by concomitant maternal hyperleptinemia
and food restriction [233]. HFD-fed offspring of DB/+ dams had significantly lower
Igfbp1 mRNA (p=0.004) than HFD-fed offspring of WT controls in pairwise
comparisons (Fig. 3A,B). Male offspring of LEP dams had significantly reduced liver

38
Insr mRNA (p=0.02) compared to controls in pairwise comparisons, independent of diet
(Fig. 3B). Corresponding to an improved insulin response, transcript levels of Gck, a
hexokinase responsible for the initial step of glucose phosphorylation that precedes
glycogen synthesis or glycolysis, significantly higher in female offspring of DB/+ dams
independently of diet, and Insr transcript levels were higher on CD. (Fig. 3C)
Adipose Tissue and Lipid Metabolism in Offspring
We next investigated whether differences in insulin sensitivity among offspring were
associated with differences in adiposity and lipid accumulation that can reduce insulin
sensitivity. Despite previously observed differences in body weight [204], at 29 weeks of
age, neither the offspring of DB/+ or LEP dams differed in body fat percentage from the
offspring of WT and SAL dams respectively (Fig. 4A,B). Placement on HFD increased
the body fat percentage in all groups, and it was not further affected by maternal
treatment.
At 31 weeks of age, leptin concentrations in the offspring of DB/+ dams were
significantly lower than in offspring of WT controls on the chow diet (p=0.01). High fat,
high sucrose feeding significantly elevated serum leptin and abrogated the effect of
maternal leptin (Fig. 4C). Serum leptin concentrations exhibited the same trend within the
offspring of SAL and LEP, but were not significantly different (Fig 4D).
Total serum triglycerides were significantly higher in the offspring of DB/+ dams
compared to WT controls, but neither free glycerol nor true serum triglycerides were
different (Fig. 4E). In the offspring of LEP and SAL dams, HFD decreased total serum
triglycerides, free glycerol and true serum triglyceride content (Fig. 4F).

39
Real-time RT-PCR was used to investigate the source of differences in serum leptin.
High fat, high sucrose feeding increased Lep mRNA in both visceral and subcutaneous
fat, concomitant with the increase in serum leptin (Fig 5A-F). In contrast, Lep mRNA did
not differ between offspring of DB/+ and WT dams in visceral fat (Fig 5A) and female
offspring of DB/+ dams actually had significantly higher expression of Lep (p=0.02) than
offspring of WT controls in subcutaneous fat (Fig. 5E).
However, differences in expression in visceral fat of Leprb, the main signaling isoform of
the leptin receptor, and a determinant of leptin sensitivity, were inversely related to serum
leptin concentrations. In visceral fat, offspring of DB/+ dams expressed higher Leprb
mRNA than offspring of WT controls (p=0.03) on the chow diet (Fig. 5A). In all groups,
HFD feeding decreased the expression of Leprb by visceral fat (Fig. 5a, b). There were
no differences in Leprb expression in subcutaneous fat (Fig. 5C-F).
In parallel with increases in serum insulin (Fig. 1), adipose tissue Insr mRNA decreased
with HFD in visceral fat from all offspring groups, and in subcutaneous fat from
offspring of SAL and LEP dams (Fig. 5A-F). In subcutaneous fat, male offspring of LEP
dams had significantly higher Insr expression (p=0.047) compared to SAL controls (Fig.
5D), consistent with greater insulin sensitivity and lower serum insulin.
Expression of the genes encoding fatty acid transporters Srebp1c and CD-36 were
examined in adipose tissue and liver (Fig. 5-6). In offspring of LEP and SAL dams, HFD
decreased Srebp1c mRNA expression in both visceral and subcutaneous fat, though it
was not affected by diet in the offspring of WT and DB/+ dams. There was less mRNA

40
for fatty acid transporter Cd-36 (p=0.0002) in the liver of male offspring of LEP dams
than of SAL dams, independent of offspring diet (Fig. 6B).
To determine whether this reduction in Cd-36 expression resulted in less hepatic lipid
accumulation in the offspring of hyperleptinemic dams, hepatic triglycerides were
measured. Offspring of DB/+ dams had significantly reduced hepatic triglycerides when
compared to WT controls, and offspring of LEP dams also had reduced hepatic
triglycerides compared to SAL controls, though only on the HFD (Fig. 7A,B).
Accumulation of fat in the liver was also analyzed by histopathological scoring, as non-
alcoholic fatty liver disease (NAFLD) is associated with insulin resistance (Fig. 7C-F).
As expected, on the HFD, the mean score for NAFLD was significantly higher than it
was on the chow diet (p=0.001), where there was no indication of NAFLD, with scores of
zero for all but one animal. Males on the HFD displayed an increased severity of NAFLD
compared to females (p=.002). Compared to the male offspring of SAL dams, male
offspring of LEP dams had significantly less severe NAFLD (p=0.05) (Fig. 7D).
Discussion
We have previously shown that high maternal leptin reduces offspring weights from age
23 weeks through sacrifice at age 31 weeks, and increases spontaneous activity, pointing
to an anti-obesity effect of maternal hyperleptinemia on adult offspring [204]. Here we
sought to examine the role of maternal hyperleptinemia in programming of offspring
insulin sensitivity. Overall, we found that offspring born to hyperleptinemic dams had
improved insulin sensitivity at 30 weeks of age. Exposure to maternal hyperleptinemia
was also associated with lower serum leptin and reduced hepatic lipid accumulation in

41
adult offspring. There was no difference in overall body fat percentage, which, combined
with the reduction in body weights, indicates a proportional reduction in total fat and lean
mass. Thus, maternal leptin may have protected offspring by changing the distribution of
lipids, and reducing overall growth, but not by altering body composition. These benefits
may have been programmed directly, or may be secondary to the reduced body weight
and increased activity levels that we documented previously [204]. Together, these data
show that high maternal leptin promotes long-term metabolic health in offspring.
Improved Insulin Sensitivity
The mechanisms by which GDM predisposes the fetus to diabetes and obesity have not
been clearly outlined, but a number of studies have shown that exposure to GDM
decreases offspring insulin sensitivity [248, 249] and impairs glucose tolerance,
increasing risk of type 2 diabetes [213]. Here we found that prenatal exposure to maternal
hyperleptinemia improves offspring insulin sensitivity regardless of offspring diet.
Increased insulin sensitivity in male offspring of dams treated with leptin during late
gestation was seen in a previous study [205], consistent with this finding. Offspring of
both models of maternal hyperleptinemia had reduced insulin concentrations, with no
increase in blood glucose, suggesting an improved response to insulin [250]. There were
no changes in beta cell number associated with maternal hyperleptinemia, supporting the
conclusion that differences in insulin sensitivity, rather than insulin production, underlie
the serum differences. The reduction in insulin concentrations in offspring of
hyperleptinemic dams was maintained on the HFD, although the diet increased insulin
concentrations in all groups. Similarly, although HFD raised blood glucose
concentrations in the GTT, on HFD offspring of DB/+ dams still had significantly better

42
glucose tolerance than offspring of controls. These results parallel our initial
observations of offspring weights, [204] in that maternal hyperleptinemia does not
abolish the impact of high fat, high sucrose diet, but does significantly protect offspring
from its full consequences.
Differences in Insr and Gck gene expression in liver and subcutaneous fat among
offspring with differing developmental leptin exposures were closely related to changes
in insulin sensitivity, with the exception of Insr expression in the liver of male offspring
of LEP. Unfortunately, skeletal muscle, a major determinant of insulin sensitivity, was
not collected, and insulin signaling in this tissue should be examined in future studies in
order to develop a clear mechanism. There was also a pattern of improved lipid
metabolism that may underlie the improved insulin sensitivity in offspring of
hyperleptinemic dams.
Improved Lipid Metabolism
Infants born to mothers with GDM have elevated leptin levels [251] along with increased
weights [252] indicating greater adiposity, and potentially leptin resistance, which has
been implicated in the pathogenesis of type 2 diabetes [253, 254]. While body fat
percentage of adult offspring was not affected by maternal leptin, offspring of DB/+ dams
had lower serum leptin concentrations on the chow diet. In addition, maternal
hyperleptinemia resulted in increased visceral fat expression of Leprb in these offspring,
indicating improved leptin sensitivity. While female offspring of DB/+ dams expressed
more Lep mRNA than controls, this was not reflected by protein levels, suggesting
increased leptin clearance, or decreased translation or release. These differences were lost

43
on HFD; Lep transcript levels were significantly increased regardless of maternal
treatment group, and there were no differences in serum leptin concentrations among
treatment groups, showing that some of the effects of maternal hyperleptinemia are
dependent on offspring diet. Unexpectedly, serum leptin did not increase with the
increase in transcript levels.
Greater metabolic activity in fat was suggested by excess free glycerol in the offspring
DB/+ dams, which, although not statistically significant, contributed to the significant
increase in total serum triglycerides in these offspring of DB/+ dams. Higher serum
glycerol suggests increased lipolysis, a process stimulated by leptin to metabolize fat
tissue [255, 256]. In addition to lipolysis, leptin also promotes fatty acid oxidation
preventing tissue lipotoxicity [257]; thus improved leptin sensitivity in offspring of DB/+
dams may protect against lipid accumulation, reducing the risk of inflammation and
resultant type 2 diabetes [258, 259].
There was consistent evidence of reduced hepatic lipid accumulation in offspring of
hyperleptinemic dams. Hepatic triglyceride levels were reduced in the liver from
offspring of DB/+ under both diet conditions. Offspring of LEP exhibited decreased
hepatic triglyceride levels, reduced NAFLD in male offspring on HFD and reduced Cd-
36 expression under both diet conditions. Cd-36 is a free fatty acid transporter that
contributes to the pathogenesis of NAFLD [260] and the development of type 2 diabetes,
and thus, its reduced expression may protect offspring of hyperleptinemic dams [235].
Collectively, these data indicate that the programming of the insulin sensitive phenotype
in these offspring by maternal leptin likely involves decreasing fatty acid accumulation in
the liver.

44
Differences in hyperleptinemic models.
We used two models of hyperleptinemia (DB/+ dams and LEP dams) to determine if the
degree of maternal hyperleptinemia would determine the metabolic consequence in the
offspring, and to control for potential confounding factors specific to each model. LEP
dams had lower serum leptin than DB/+ dams, and we observed some dose-dependent
outcomes. For instance, the offspring of DB/+ dams had significantly lower serum leptin
compared to controls on the chow diet, while the offspring of LEP dams had numerically,
but not significantly, reduced leptin compared to controls. This was also true of glucose
tolerance curves on HFD, and a similar dose-dependency was seen in the offspring
weights [204].
However, not all of the observed changes can be credited to the concentration of leptin
exposure in utero. Particularly, NAFLD assessment, and some of the gene expression
differences we observed were only present in the offspring of LEP or offspring of DB/+
dams compared to their respective controls. HFD feeding resulted in decreased mRNA
expression of Srebp-1c in both fat depots in offspring of SAL and LEP dams, but not in
offspring of WT or DB/+ dams, independent of maternal leptin level. Some of these
differences may be due to differences in sample size, as the SAL/LEP arm was larger
[204]. There may also be differences in the two models. Unlike the wildtype LEP dams,
the DB/+ dams lack one copy of the gene for the leptin receptor, and the impact on leptin
sensitivity has not been characterized. These mice had extremely high serum leptin, yet
only moderate overweight, and normal or improved glucose tolerance, suggesting mild or
mixed resistance. Conversely, SAL and LEP dams underwent pump surgeries and
maintained the pumps throughout pregnancy, while WT and DB/+ dams were not

45
similarly stressed, which may contribute to differences between the hyperleptinemic
models.
While it increases the complexity of our results, using two models concurrently is
instructive in clarifying whether the outcomes observed are due to maternal
hyperleptinemia, or experimental manipulations. That both models resulted in improved
insulin sensitivity suggests that this is a specific effect of maternal hyperleptinemia, and
not an artifact of experimental design.
Comparisons with other models of maternal hyperleptinemia
We previously examined the effects of maternal hyperleptinemia during early pregnancy
only, with concomitant maternal food restriction [233], and found effects on offspring
essentially opposite to what is reported here, namely increased offspring weights, and
reduced insulin sensitivity. There, hepatic expression of Insr, Igfbp1, Gck, and Igf1r were
altered in HFD-fed offspring of restricted, leptin-treated dams relative to HFD-fed
offspring of either control or restricted dams [233, 243]. Here, only Igfbp1expression in
HFD-fed, male offspring of DB/+ dams was affected. While different from the study of
high leptin with food restriction, the results of the present study are consistent with
studies from other laboratories of maternal hyperleptinemia in well-fed mothers [231,
261]. Thus, the long term effects of maternal leptin on offspring are dependent on the
nutritional milieu of pregnancy. This may also explain why hyperleptinemic Leprdb/+
dams have an obesogenic effect on offspring metabolism when the dams are also diabetic
[112]. These differences in effects of maternal leptin, combined with the inability of
leptin to cross the placenta [229, 230], suggest that maternal leptin affects offspring by

46
acting in concert with the nutritional environment to change maternal and/or placental
metabolism. Finally, the effects of maternal hyperleptinemia are different than those of
direct fetal and neonatal leptin treatment. Offspring of rat dams treated with from the
latter half of pregnancy through lactation were protected from weight gain and insulin
resistance, similarly to the offspring in this study [261]. In contrast, acute leptin
treatment of neonates has been shown to both protect and predispose offspring to obesity,
depending on both timing and prior exposures of the offspring [206, 262-264], and
injection of leptin directly into the fetal brain inhibits adult glucose tolerance [265].
Conclusion
The focus of this study was to elucidate the effect of elevated leptin levels during
pregnancy on the programming of insulin response. Previous studies have shown that
leptin alone does not predispose offspring to obesity [231]. This study demonstrates that
maternal leptin improves insulin sensitivity and reduces hepatic fat accumulation in
offspring. These findings are potentially relevant to human pregnancies complicated by
hyperleptinemia and leptin resistance. Outside of pregnancy, obesity leads to
hyperleptinemia, and eventually to diminished transport of leptin to the brain and
inhibition of leptin signaling [266, 267]. It is difficult to assess directly whether leptin
resistance complicates some pregnancies, as some resistance to the appetite-suppressing
and weight-reducing effects of leptin is present even in normal pregnancies [192, 268].
Nonetheless, the combination of high serum leptin with lack of leptin-induced weight
loss is strongly suggestive of leptin resistance. Recent meta-analyses found that leptin
concentrations are elevated in early pregnancy in women who will go on to develop
GDM, even when controlling for BMI [269]. The leptin response to OGTT is also

47
dysregulated in women with prior GDM pregnancy [270] Likewise, pregnancies
complicated by obesity are associated with higher maternal leptin concentrations, and do
not show the normal association between weight gain and leptin concentrations[271,
272]. It has been proposed that this elevated maternal leptin may mediate negative
impacts of GDM or obesity on offspring metabolism [227]. The present study suggests
that it is instead a lack of maternal leptin action, i.e. leptin resistance that is responsible.
Whether the protective actions of leptin identified here are maintained in the presence of
other features of GDM or maternal obesity remains to be tested.

48
Gene of Interest Primer Sequence (5'-3’) Leprb Sense GAGCCCTGAACCCATTTCAGAAG Antisense ACCATAGCTGCTGGGACCAT Actb Sense GATGACCCAGATCATGTTTGAGACC Antisense AGATGGGCACAGTGTGGGTGA Cd36 Sense GGTCCTTACACTACAGAGTTCGTTA Antisense CATTGGGCTGTACAAAAGACACA Srebp1c Sense TGGTGGGCACTGAAGCAAA Antisense GCAAGAAGCGGATGTAGTCGAT Gck Sense ATGTGAGCTCGGCATGATTGT Antisense CCTTCCACCAGCTCCACATT Ghr Sense CTTCGCTGAACTCGCTGTA Antisense AGAAGTAAATGAATCAAAATGGAAAGTGHsd11b1 Sense GGCGGACTGGACATGCTT Antisense GAGTGGATGTCGTCATGGAAGAG Igf1r Sense GCATTTAGAGAAACGAACATTCC Antisense CAAGTCCAAATATGGTCCATGCT Igfbp1 Sense GGAGATTTCCTCATCGTCTCACA Antisense TATGGGACGCAGCTTTCCA Insr Sense CCACCAAGAACTCGTGAAAGG Antisense TGCACGCAGGAAAGAACCT Gapdh Sense TGCACCACCAACTGCTTAGC Antisense GGCATGGACTGTGGTCATGAG Hprt Sense TGACACTGGCAAAACAATGCA Antisense GGTCCTTTTCACCAGCAAGCT Lep Sense GTGAAATGTCATTGATCCTGGTG Antisense GTGGCTTTGGTCCTATCTGTC
Table 1. Primer Table

49
Figure 1: Insulin response in wildtype offspring. Glucose tolerance tests were performed at 30 weeks of age in offspring of (A,C) WT and DB/+ dams and in offspring of (B,D) SAL and LEP dams fed either (A, B) chow diet (CD) throughout or (C,D)switched to high fat, high sucrose diet (HFD) at age 23 weeks. Area under the curve is shown inset. Sample size (offspringdam): (A) Males: WT 77, DB/+ 55 Females: WT 66, DB/+ 33 (B) Males: SAL 44, LEP 55 Females: SAL 44, LEP 55 (C) Males: WT 66, DB/+ 55 Females: WT 44, DB/+ 66 (D) Males: SAL 99, LEP 88 Females: SAL 1010, LEP 77. Serum insulin concentrations at age 31 weeks in ad libitum fed offspring of (E) WT and DB/+ dams and (F) SAL and LEP dams. Male Sample size: (CD, HFD) WT 87,33 DB/+ 33,77 SAL 44,99 LEP 66,88. Female Sample size: (CD, HFD) WT 66,55 DB/+ 33,66 SAL 44,88 LEP 55,88. * indicates significantly different than control (p < 0.05). Data are represented as mean ± SEM.

50
Figure 2: Pancreatic endocrine cell counts. Representative images of an islet immunostained for nuclei (A), insulin (B), glucagon (C) and a merge of insulin-positive β-cells (blue) and glucagon-positive α-cells (red) counterstained with DAPI (pseudocolored green) (D). The number of alpha and beta cells per islet, per level in (E,F) male and(I,J) female wildtype offspring of (E, I) WT and DB/+ or (F,J) SAL and LEP dams. Alpha to beta cell ratio in male (G,H) and female (K, L) offspring. CD=chow diet; HFD=high fat, high sucrose diet. Male sample size (offspringdam): (CD,HFD) WT 65,65 DB/+ 53,55 SAL 43,65 LEP 54,66. Female sample size (offspringdam): (CD,HFD) WT 65,65 DB/+ 33,44 SAL 33,99 LEP 44,55 *indicates significant difference between diets(p < 0.05). K) # p<0.05 vs. WT HFD. L)# p<0.05 vs SAL CD. Data are represented as mean ± SEM.

51
Figure 3: Real-time PCR analysis of glucose metabolic gene expression in liver from male and female offspring of (A,C) WT and DB/+ dams and (B,D) SAL and LEP dams at 31 weeks of age. Data are represented as mean fold change relative to control group mean on chow diet. Error bars represent range of fold changes based on SEM of ΔΔCt.. # p<0.05 in pairwise comparisons between maternal groups within diet and sex. Male sample size (offspringdam): (CD,HFD) = WT 77,66 DB/+ 33,77 SAL 44,88 LEP 55,88. Female sample size (offspringdam): (CD,HFD) WT 55,44 DB/+ 42,55 SAL 44,1010 LEP 55,77. For Igf1r female offspring of DB/+ dams on CD n =22.

52
Figure 4: Magnetic Resonance Imaging and serum measurements in adult offspring. Body fat percentage in offspring of (A) WT and DB/+ dams and (B) SAL and LEP dams at 29 weeks of age. * indicates significant difference between diet groups (p<0.05). Male Sample size (offspringdam): (CD,HFD) WT 77,33 DB/+ 33,55 SAL 44,99 LEP 55,66. Female Sample size (offspringdam): (CD,HFD) WT 66,33 DB/+ 33,33 SAL 44,77 LEP 44,88. Serum leptin concentrations at 31 weeks in ad libitum fed offspring of (C) WT and DB/+ dams and (D) SAL and LEP dams. # Significantly different from WT CD in pairwise comparison (p < 0.05). Data are represented as mean ± SEM. Male Sample size (offspringdam): (CD,HFD) WT 77,44 DB/+ 33,66 SAL 44,22 LEP 55,44. Female Sample size (offspringdam): (CD,HFD) WT 66,22 DB/+ 33,33 SAL 44,88 LEP 55,77. Total serum triglyceride, free glycerol and true serum triglyceride concentrations in offspring of (E) WT and DB/+ dams and (F) SAL and LEP dams at 31 weeks. *significant difference (p < 0.05). Data are represented as mean ± SEM. Male Sample size (offspringdam): (CD,HFD) WT 116,33 DB/+ 63,77 SAL 84,1910 LEP 116,148. Female Sample size (offspringdam): (CD,HFD) WT 116,85 DB/+ 53,96 SAL 84,1810 LEP105,168.

53
Figure 5: Real-time PCR analysis of lipid metabolic gene expression in adipose tissue at 31 weeks. Relative gene expression levels in (A,B) visceral fat and (C-F) subcutaneous fat. Data from males and females are combined for visceral fat, as there were no differences by sex. Data are represented as mean fold change relative to CD WT mean. Error bars represent range of fold changes based on SEM of ΔΔCt. * significant difference between diets. # signficantly different from WT CD in pairwise comparison. Sample size (offspringdam): (CD,HFD) (A,B) Males: WT 44,75 DB/+ 33,44 SAL 44,33 LEP75,33 Females: WT 33,43 DB/+ 32,33 SAL 54,33 LEP44,33; (C,D) )= WT 33,32 DB/+ 54,55 SAL 54,33 LEP54,66; (E,F) WT33,43 DB/+53,54 SAL53,33 LEP33,33.

54
AFDDFFFFFFFFFFFFFFFFFFFDFDFDFB
CXXXXXXXXXXXXXXXXXXXXXXXXD
Figure 6: Real-time PCR analysis of lipid metabolic gene expression in liver tissue at 31 weeks. Relative gene expression levels liver (A-D). Data are represented as mean fold change relative to CD WT mean. Error bars represent range of fold changes based on SEM of ΔΔCt. * significant difference between diets. # signficantly different from WT CD in pairwise comparison. Sample size (offspringdam): (CD,HFD) (A,B) WT 77,66 DB/+ 33,77 SAL 44,88 LEP 55,88; and (C,D) WT 55,44 DB/+ 42,55 SAL 44,1010 LEP 55,77.
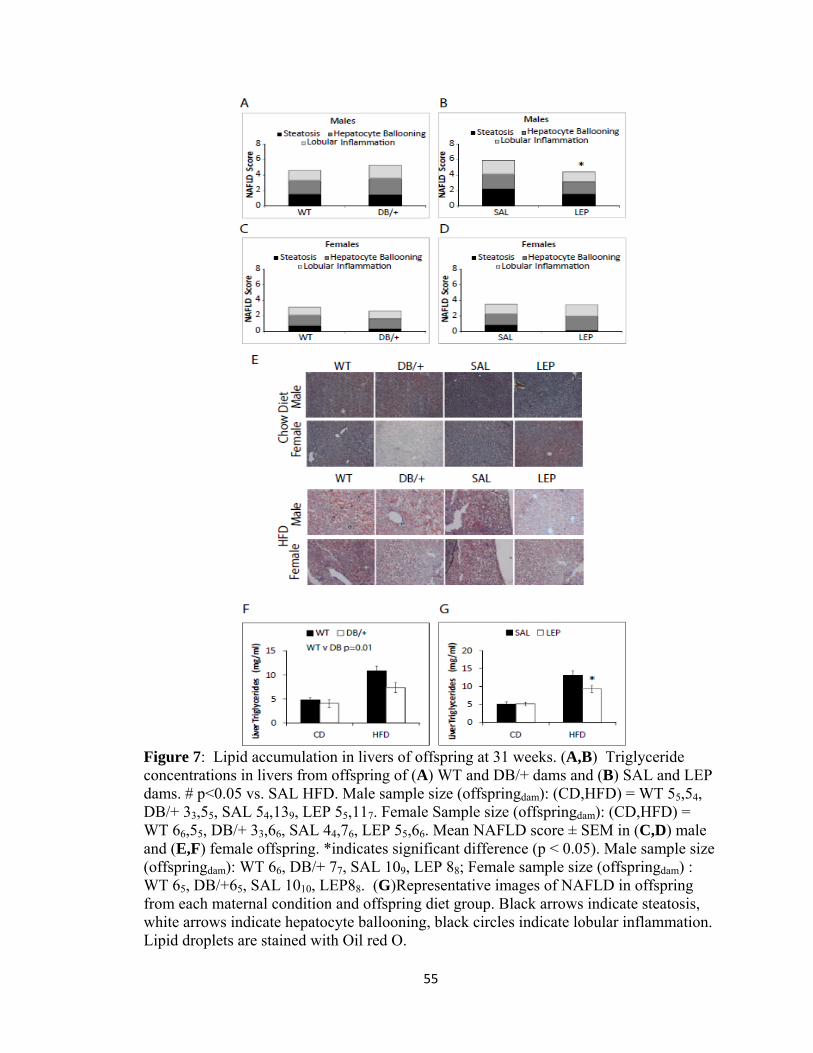
55
Figure 7: Lipid accumulation in livers of offspring at 31 weeks. (A,B) Triglyceride concentrations in livers from offspring of (A) WT and DB/+ dams and (B) SAL and LEP dams. # p<0.05 vs. SAL HFD. Male sample size (offspringdam): (CD,HFD) = WT 55,54, DB/+ 33,55, SAL 54,139, LEP 55,117. Female Sample size (offspringdam): (CD,HFD) = WT 66,55, DB/+ 33,66, SAL 44,76, LEP 55,66. Mean NAFLD score ± SEM in (C,D) male and (E,F) female offspring. *indicates significant difference (p < 0.05). Male sample size (offspringdam): WT 66, DB/+ 77, SAL 109, LEP 88; Female sample size (offspringdam) : WT 65, DB/+65, SAL 1010, LEP88. (G)Representative images of NAFLD in offspring from each maternal condition and offspring diet group. Black arrows indicate steatosis, white arrows indicate hepatocyte ballooning, black circles indicate lobular inflammation. Lipid droplets are stained with Oil red O.

56
CHAPTER III
LEAN MATERNAL GLUCOSE INTOLERANCE INCREASES OFFSPRING ADIPOSE MASS AND IMPROVES INSULIN SENSITIVITY IN MICE
This chapter is in preparation for submission to the journal Endocrinology
Talton OOa,b, Bates Ka,b, Hohensee Ka,b, Rojas Sc, Ji Tc, Schulz LCa,b,d
a Department of Obstetrics, Gynecology, and Women’s Health, University of Missouri, Columbia, MO, USA b Division of Biological Sciences, University of Missouri, Columbia, MO, USA c Department of Statistics, University of Missouri, Columbia, MO, USA d Division of Animal Sciences, University of Missouri, Columbia, MO, USA
Abbreviations: GDM (gestational diabetes mellitus), GTT (glucose tolerance test), CD (chow diet), HFHS (high fat, high sucrose diet)

57
Abstract
Gestational diabetes mellitus (GDM) increases the risks of metabolic syndrome in
offspring. We previously developed a lean model of GDM in which dams exhibit glucose
intolerance and reduced insulin response to glucose challenge. Here, we aimed to
determine effects on offspring metabolism.
One cohort of offspring was sacrificed at 19 weeks, and half of the offspring in the
second cohort were placed on a high fat high sucrose (HFHS) diet at 23 weeks, prior to
sacrifice at 31 weeks. We examined offspring weight, body composition, food
consumption, activity, glucose tolerance, adipose and liver gene expression, liver and
serum triglycerides, serum insulin and leptin.
Exposure to maternal glucose intolerance increased weights of HFHS-fed offspring, and
adiposity of offspring fed both diets. Increased adiposity in offspring of GDM dams was
accompanied by increased respiratory quotient (CO2 produced /O2 consumed) which is
suggestive of preferential utilization of glucose for energy over lipids. Increased mRNA
levels of Pparg, Adipoq Insr and Lpl in adult male offspring subcutaneous fat suggest
greater capacity for fatty acid uptake. Glucose control was unaffected by exposure to
maternal glucose intolerance, potentially due to increased mRNA levels of Insr in both
liver and subcutaneous fat.
Our findings show that GDM comprising glucose intolerance only during pregnancy in
lean dams programs increased adiposity in offspring, and increases the insulin sensitivity
of subcutaneous adipose tissue and liver.

58
Introduction
Gestational diabetes mellitus (GDM), defined as maternal hyperglycemia first diagnosed
during pregnancy, is an emerging global epidemic [273]. It affects up to 25% of
pregnancies [5], contingent on the diagnostic criteria and population studied, and is on
the rise worldwide. Diabetic pregnancies can increase the risk of serious complications
for the mother such as hypertensive disorders like preeclampsia [274], premature delivery
[275], stillbirth and cesarean delivery [35]. GDM also has consequences for the offspring,
both perinatally and long-term.
The incidence of fetal macrosomia is higher in offspring born to mothers with gestational
diabetes [61], and these offspring also have increased risks for diabetes [276-279] and
obesity [277, 280-282] in late childhood and early adulthood. Baptiste-Roberts et al
showed that offspring born to GDM mothers are 61% more likely to be overweight at the
age of 7 than their counterparts [283], while Clausen et al showed that offspring exposed
to GDM in utero are at an 8-fold higher risk of developing type 2 diabetes [215]. In 2011,
the International Diabetes Federation stated that type 2 diabetes is responsible for one
death every seven seconds, amounting to 4.6 million deaths per year[284]. The incidence
of metabolic syndrome in young people born to GDM mothers indicates that the global
rise of diabetes, obesity, and other metabolic diseases is partly due to the rise of GDM
[285], however the mechanisms by which maternal hyperglycemia programs offspring
metabolism remain unclear.
Among the challenges in understanding how GDM affects offspring is the variety of
clinical characteristics found among women with GDM. For example, obesity is a major

59
risk factor for GDM, and roughly half of women with GDM are also obese [162].
Maternal obesity is itself a risk factor for obesity and diabetes in offspring [286] and may
interact in complex ways with maternal diabetes to influence fetal growth [287]. One
study found that overweight in offspring was a consequence of GDM in obese, but not
lean mothers [288]. Secondly, preexisting type I and type II diabetes make up
approximately 26% of diabetes cases during pregnancy [289] and these can affect oocyte
and early embryonic development, which occur before onset of symptoms in other GDM
cases [290-292]. Researchers have modeled various aspects of GDM impacts on
offspring using rodent models. One such model is long-term feeding of a 40-60% fat,
high sugar diet for at least 4 weeks prior to mating [111, 144], which leads to obesity,
insulin resistance and glucose intolerance during gestation. Offspring weights vary, with
some studies reporting macrosomia [115, 116], others reporting no weight difference, or
growth restriction at birth [117, 120, 293]. Later in life, offspring of obese, insulin-
resistant rodents weigh more, and are at a higher risk of type 2 diabetes [119, 120, 294].
Streptozotocin (STZ)-treated rodents are models of non-obese, insulin-deficient diabetes,
with onset depending on the timing of administration [295, 296]. STZ permanently
destroys pancreatic beta cells, and can have toxic effects on other tissues as well [297].
Thus, the maternal phenotype most closely resembles type 1 diabetes [133].These
animals display mild or severe hyperglycemia, depending on the dosage of STZ [298]
with varying offspring outcomes. Mild maternal hyperglycemia results in macrosomic or
normal weight offspring [129, 130] while severely hyperglycemic dams have offspring
with low birth weights [129, 299], which also occurs at higher-than-normal frequency in

60
GDM pregnancies [131, 132]. Adult offspring are insulin-resistant regardless of the
severity of maternal hyperglycemia [121, 130].
Previously, we developed a mouse model of GDM [109] that resembles the 28% of
women with GDM who are not overweight or obese [162]. Among lean women with
GDM, there is subclinical insulin resistance pre gravidas, and impaired glucose-
stimulated insulin response during mid-late pregnancy compared to pregnant women with
normal glucose tolerance [300]. In our model, mice are fed a high fat, high sucrose diet a
week prior to, and through the three weeks of gestation, for a total of 4 weeks. These
mice have mild insulin resistance and normal glucose tolerance at the time of conception,
spontaneously develop glucose intolerance and reduced insulin response to glucose in the
latter half of pregnancy, and return to normal glycemia postpartum [109]. These dams do
not differ in weight to controls, allowing us to hone in on the effects of pregnancy-
specific hyperglycemia in lean dams. The goal of the present study is to use this model to
determine how moderate gestational glucose intolerance, in the absence of maternal
obesity affects offspring risk of metabolic dysfunction, particularly obesity and insulin
resistance.
Methods
Animals and tissue collection
Animal procedures were approved by the University of Missouri Institutional Animal
Care and Use Committee and animals were handled according to the National Institutes
of Health Guide for the Care and Use of Laboratory Animals.

61
Gestational diabetes was induced as previously described [109]. Briefly, 14 female
wildtype C57Bl6/J mice (JAX) were fed a high fat, high sucrose (HFHS) diet (D12451,
Research Diets Inc.) one week prior to mating to WT sires, and for the duration of
gestation, for a total of four weeks. Twenty control females were fed a chow breeder diet
(LabDiet 5008, Purina) throughout. The GDM dams produced 7 litters, for a total of 34
offspring (18 males, 16 females) and the CON dams produced 16 litters for a total of 82
offspring (52 males, 30 females).
Two male and two female offspring from each litter were maintained on the chow diet;
one of each was sacrificed at 19 weeks of age, and one at 31 weeks of age. An additional
male and female offspring from each litter was kept on the chow diet until 23 weeks of
age, and then fed HFHS diet until sacrifice at 31 weeks of age.
Beginning at 4 weeks of age, offspring were weighed weekly. A subset of the offspring
was sacrificed by CO2 inhalation followed by cervical dislocation at 19 or 31 weeks of
age after ad libitum food access. Another subset was anesthetized with isoflurane and
underwent blood pressure assessment for a cardiovascular study prior to cervical
dislocation at 19 (n=16) and 31 (n=47) weeks of age after ad libitum food access. Blood
was collected at the time of sacrifice by cardiac puncture, and centrifuged to acquire
serum, which was stored at −20°C. Samples of liver and subcutaneous fat were removed
and snap-frozen in liquid nitrogen before storage at −80°C.

62
Magnetic resonance imaging
At 4, 12, 20 and 28 weeks of age, body composition was measured in CD fed male and
female offspring via nuclear magnetic resonance imaging (Echo MRI mouse, Echo
Medical Systems). Body composition was also measured in HFHS-fed male and female
offspring from each treatment group at 30 weeks. Each conscious mouse was inserted
into the MRI chamber in a plastic cylinder, and lean mass, fat mass and water were
quantified.
Metabolic Cage Assessments
Male and female CD-fed offspring of CON and GDM dams at 4, 12, 20 and 28 weeks of
age, and HFHS-fed offspring of CON and GDM dams at 30 weeks of age were placed in
metabolic monitoring systems (PromethION; Sable Systems International). Animals
were singly housed with ad libitum access to food and water and metabolic parameters
were assessed for 3 days, consisting of three light and dark cycles of 12 hours each.
Animals were placed in the cages in the middle of the light cycle and data from the first
light and dark cycles were excluded from the analysis to account for acclimation; data
from the following 48 hours were assessed. The metabolic cages assess food intake,
energy expenditure, distance travelled and respiratory quotient using algorithms designed
by the manufacturer (Sable Systems International). Food mass is weighed by sensors
continuously, to determine food intake. Energy expenditure is calculated according to the
Weir equation, where kcal per hour = 60*(0.003941*Vol O2+0.001106*Vol CO2) and
where VO2 and VCO2 are in ml/min. Distance travelled is the sum of all distances
traveled within the beam break system in meters, including fine movement (such as

63
grooming and scratching) and direct locomotion. Respiratory quotient is calculated as
Vol CO2/Vol O2.
Glucose tolerance and Insulin Sensitivity
At 19 and 30 weeks of age, glucose tolerance tests (GTT) were performed on the
offspring according to the Animal Models of Diabetic Complications Consortium
protocol (https://www.diacomp.org/shared/showFile.aspx?doctypeid=3&docid=11).
Blood glucose was measured using dual ReliOn PRIME glucometers (Walmart)
according to the manufacturer’s instructions. Offspring were fasted for 6 hours, following
which blood was collected from the tail vein for assessment of fasting glucose and
insulin. Offspring were injected intraperitoneally with 1 mg of glucose per kg body
weight, and blood glucose was measured at 15, 30, 60, and 120 minutes post- injection.
GraphPad Prism (GraphPad Software) was used to calculate the area under the curve for
each animal.
The concentration of insulin was measured using the Rat/Mouse Insulin ELISA kit
(Millipore) (intraassay variation: 6.7%, interassay variation: 6.0%) according to the
manufacturer's protocol, with the exception that the primary antibody incubation was
performed overnight.
RNA isolation and quantitative RT-PCR
RNA was isolated from offspring liver and subcutaneous adipose tissue samples collected
at both 19 and 31 weeks of age by homogenization in TRI Reagent (Sigma-Aldrich),
using a General Laboratory homogenizer (OMNI International). Adipose tissue samples

64
were centrifuged to separate and remove the lipid layer. Following phase separation
according to TRI reagent instructions, RNA from both liver and adipose samples was
further purified using the Nucleospin RNA clean-up kit (Clontech; Mancherey-Nagel)
according to the manufacturer’s protocol. Genomic DNA was eliminated from RNA
samples using the Turbo DNA-free kit (ThermoFisher Scientific).
Reverse transcription was performed using the SuperScript First-Strand Synthesis System
(ThermoFisher Scientific) according to the manufacturer's protocol. Briefly, 1 µg of liver
RNA or 500 ng adipose RNA was reverse transcribed using random hexamer primers.
Relative mRNA levels were quantified by real-time PCR with SYBR Green Master Mix
(Qiagen) for the following genes in liver: Insr, Acaca, Cpt1a and Ppara; and in adipose
tissue: Insr, Srebp1c, Pparg, Pgc1a, Pck1, Il6, Adipoq, Lep, Lpl, Tnfa, and
Ucp1. Gapdh and Hprt were used as the internal reference genes for liver,
and Actb and Hprt were used as the internal reference genes for adipose tissue. PCR was
performed on a CFX Connect Real-Time PCR Detection System (Bio-Rad Laboratories)
with the following cycling conditions: 95°C for 10 minutes (1 rep), and 95°C for 15
seconds, followed by 60°C for 1 minute (40 reps).
Insr, Lep, Gapdh, Hprt and Srebp1c primer sequences have previously been published
[301],and Acaca, Pparg, Il6, Adipoq, Lpl, Tnfa, Ucp1, Cpt1a, Pgc1a, Pck1 and Ppara
primers were designed by Integrated DNA Technologies, which synthesized all primers
(Table 1). Primer efficiencies were validated by using serial dilutions of the respective
template. Reference genes did not differ in expression across the treatment groups. PCR
results are displayed as fold change relative to CON offspring, by the ΔΔcycle threshold
method [244].

65
Serum leptin
The concentration of leptin was measured in terminal serum samples by using the Mouse
Leptin ELISA kit (Millipore; intraassay variation: 8.9%; interassay variation: 10%)
according to the manufacturer's protocol, with the exception that the primary antibody
incubation was performed overnight.
Serum and liver triglycerides
Serum triglyceride concentrations were measured in the terminal serum samples by using
the Serum Triglyceride Determination kit (Sigma-Aldrich) according to the
manufacturer's protocol with the exception that 96-well plates, with a total reaction
volume of 250 uL were used instead of cuvettes. An adapted Folch protocol was used to
extract liver triglycerides as previously described [246, 301], and then measured by using
the serum triglyceride determination kit.
Statistical analysis
Data analysis was performed using SAS (SAS Institute).
Each of the metabolic cage response variables (food intake, energy expenditure and
respiratory quotient) were regressed on the maternal effect (GDM or control), age effect
(4th, 12th or 20th week since birth), cycle effect (day or night), offspring sex effect (male
or female), and interactions among these factors. The models were constructed by both
biological and statistical considerations. To model the correlations among the repeated
measurements that were obtained at different time points for each offspring, the

66
compound symmetry covariance structure was used. The mothers are considered a
random effect in the models to account for the correlations among offspring of the same
dam. Optimal models were selected by AIC, BIC, and AICC criteria. We used the
studentized residual plot and normal quantile plot for checking model fitting. For
pairwise comparisons, we used Tukey-Kramer method for multiple test adjustment.
The metabolic cage data corresponding to the 28th and 30th weeks were analyzed
separately. For average respiratory quotient, total food uptake and total distance of
locomotion a model was built including maternal effect (GDM or control), offspring diet
effect (high fat diet or control), cycle effect (day or night), offspring sex effect (male or
female), and interactions among these factors. The mothers are considered a random
effect in the models to account for the correlations among offspring of the same dam.
Optimal models were selected by AIC, BIC, and AICC criteria. We used the studentized
residual plot and normal quantile plot for checking model fitting. For the pairwise
comparisons, we used Tukey-Kramer method for multiple test adjustment. To comply
with the normality assumption, the total distance of locomotion was transformed to log
scale, and the square root transformation was used for the total food uptake.
Data from the glucose tolerance tests at 19 weeks were analyzed by nested, two-way
ANOVA, with maternal treatment (GDM or control) and offspring sex effect (male or
female) as fixed effects, with time as a repeated measure, and with dam considered a
random effect. Data from the glucose tolerance tests at 30 weeks were analyzed by
nested, three-way ANOVA, with maternal treatment (GDM or control), offspring diet
(high fat diet or control), and offspring sex effect (male or female) as fixed effects, with
time as a repeated measure, and with dam considered a random effect.

67
Weights from age 3-22 weeks were analyzed by nested, three-way ANOVA, with
maternal treatment, offspring sex and offspring age as fixed effects, with time as a
repeated measure, and with dam considered a random effect. Weights from age 23-31
weeks were analyzed by nested, four-way ANOVA, with maternal treatment, offspring
sex, age and diet as fixed effects, with time as a repeated measure, and with dam
considered a random effect.
For all additional analyses of samples collected at 19 weeks, data were analyzed by
nested, two-way ANOVA with maternal treatment and offspring sex as the fixed effects
and with dam considered a random effect. For samples collected at 31 weeks of age, data
were analyzed by nested, three-way ANOVA with maternal treatment, offspring diet, and
offspring sex as the fixed effects and with dam considered a random effect. The ΔΔcycle
threshold values were compared for the real-time RT-PCR data analysis. To comply with
the normality assumption, the Δcycle threshold values for liver Insr were transformed to
log scale, and the square root transformation was used for the Δcycle threshold values for
liver Ppara.
Results
Energy Balance in Mice Exposed to Gestational Diabetes in Utero
Prenatal GDM exposure increased offspring obesity risk. Offspring weights (Fig. 1) were
not different when they were maintained on the CD. However, when fed a HFHS diet, the
offspring of GDM dams weighed significantly more than offspring of CON (p=0.0002)
fed the HFHS diet, independent of offspring sex. Additionally, exposure to maternal
glucose intolerance resulted in increased adiposity on the CD in both male and female
68
offspring of GDM dams at 4, 12, and 20 weeks of age (p=0.001) (Fig. 2). Thirty week old
offspring fed the HFHS but not the CD also had higher body fat percentages than
offspring of CON (p=0.026).
To determine whether this energy imbalance resulted from increased energy intake or
reduced energy expenditure, food intake, locomotor activity, and total energy expenditure
were measured in metabolic cages over a three-day period each time at 4 (juvenile), 12
(post-pubertal), 20 (young adult) and 28 (middle adult) weeks of age. Offspring food
consumption was not different among treatment groups, although offspring of GDM, but
not CON, dams reduced their food consumption at 30 weeks when fed the HFHS diet
(p=0.0075) (Fig. 3a-d). Energy expenditure was not different among treatment groups
(Fig. 3e-h.), and there were no major differences observed in distance travelled
(Supplemental Figure 1).
Lipid Metabolism in Mice Exposed to Gestational Diabetes in Utero
Next, we explored the hypothesis that increased adiposity in offspring of GDM dams was
due not to overall energy imbalance, but rather to differences in the utilization and
storage of lipids. Metabolic cages were used to determine respiratory quotient (RQ), the
ratio of CO2 produced to O2 consumed, which reflects substrate utilization. An RQ close
to 1 reflects pure carbohydrate oxidation, while ratios close to 0.7 reflect pure fatty acid
oxidation. RQ were not different between the offspring of GDM and CON dams at 4 and
12 weeks, but in offspring of CON dams, RQ decreased after 4 weeks (p<0.0001) while
in offspring of GDM dams it did not (Fig. 4). In male offspring at 20 weeks RQ (p=0.01)
maternal glucose intolerance resulted in higher RQs (Fig 4a,c). At 28 weeks, offspring of

69
GDM dams also had higher RQs (p=0.004) on both diets independent of sex, but in
separate pairwise comparisons, the difference was only significant in males (p<0.0001).
Fatty acid oxidation in the liver involves the action of major transcriptional regulator
SREBP1C (Fig. 5). Steady-state mRNA levels of SREBPC1c and other genes related to
beta oxidation were not changed in the liver, suggesting that the increase in adiposity in
these animals attributed to decreased fatty acid oxidation is not mediated by these gene
transcripts in the liver.
The steady-state mRNA levels of genes that facilitate fatty acid uptake were elevated in
subcutaneous adipose tissue of adult male offspring (Fig. 6). The mRNA levels of Pparg
(p=0.013) and Adipoq (P=0.002) were elevated in 31 week old CD-fed male offspring of
GDM dams, while 31 week old male offspring of GDM dams had higher mRNA levels of
Lpl (p=0.047) on both diets. There was some indication of an increase in Pck1 mRNA
levels in male and female 31 week old CD-fed offspring of GDM dams compared to
controls, though it was not significant (p=0.058).
At 19 weeks, there were no differences in serum leptin or triglyceride concentrations
(Fig. 7a, c). At 31 weeks, leptin levels were elevated in female offspring of GDM dams
fed the HFHS diet (p=0.0005) (Fig. 7b). Liver triglycerides were not different (Fig. 7e, f),
and serum triglycerides were numerically lower in offspring of GDM dams at 31 weeks
on either diet, but not significantly different (p=0.052) (Fig 7d).

70
Glucose Tolerance, Insulin and its Receptor in Mice Exposed to Gestational Diabetes in
Utero
Thirty-one week old male offspring of GDM dams exhibited higher mRNA levels of Insr
on both diets in the liver (p=0.033) (Fig. 5a) and in subcutaneous fat (p=0.001) (Fig 6a).
There were no differences in offspring insulin concentrations as a result of maternal
GDM, and glucose tolerance was not different among the treatment groups. Males had
higher insulin than females at 19 weeks (p=0.0245) and at 30 weeks (p<0.0001) (Fig. 8a,
b). Males also had higher blood glucose over time when compared to females at every
time-point measured (p<0.0001) (Fig 8c-h). HFHS feeding also elevated blood glucose in
the offspring, regardless of maternal treatment or sex (p<0.0001).
Discussion
Epidemiological studies clearly demonstrate increased risks of obesity and insulin
resistance in the offspring of pregnancies complicated by maternal diabetes [65, 278, 279,
281]. In such studies, GDM is often accompanied by maternal obesity or preexisting
diabetes, which also impact offspring health [117, 302, 303]. By using an animal model,
we have been able to separately examine the impact of maternal glucose intolerance,
limited to gestation, without maternal obesity. While the prevalence of GDM is higher
among obese women [304], about a third of women diagnosed with GDM are lean. Due
to the absence of typical risk factors for GDM, this population is not widely studied
[305]. Studying this population is not only useful from a clinical perspective [306], but
also from a mechanistic perspective, particularly when combined with data from other
models. Taken together, our findings suggest that maternal glucose intolerance of mid-

71
late pregnancy alone increases offspring risk of obesity without impairing offspring
insulin sensitivity.
Prenatal GDM Exposure Increases Adiposity
The most striking finding of this study is that in utero exposure to maternal glucose
intolerance promotes fat accumulation in offspring. This fat accumulation does not seem
to result from an imbalance between energy intake and energy output, but rather from
alterations in lipid metabolism. First, changes in gene expression in subcutaneous fat are
suggestive of greater sensitivity to insulin stimulation of lipid storage. There were
increased levels of Insr, Lpl, Pparg and Adipoq mRNA in subcutaneous fat of adult male
offspring of GDM dams. Adipoq enhances whole body insulin action, and Lpl and Pparg
promote insulin action in the adipose tissue. PPARG increases the expression and
secretion of adiponectin [307], and also promotes adipogenesis, protecting against lipid
overload in other places [308, 309]. Adiponectin expression improves whole body insulin
sensitivity, partly decreasing triglyceride content in muscle and liver in obese mice [310,
311]. Insulin acts through its receptor to upregulate adipose lipoprotein lipase [312], and
adipose tissue takes up fatty acids via the action of LPL [313]. Thus, working in tandem,
Pparg, Adipoq, Insr, and Lpl, promote insulin action in adipose tissue, increasing adipose
tissue lipid accumulation and GLUT4 mediated glucose uptake, thereby preventing
ectopic fat storage and the resulting insulin resistance in other peripheral tissues [314].
Second, increased RQ measurements at 20 and 28 weeks suggest that the increase in
adiposity in the offspring of GDM dams is also due to a preference for carbohydrate
utilization for energy over fatty acids. However, genes related to fatty acid oxidation

72
were not decreased in the liver. Protein quantification or isotope-labelled analysis of fatty
acid oxidation might clarify the role of hepatic beta oxidation in mediating these
differences in RQ. Alternatively, beta oxidation elsewhere in the body might be reduced.
“Healthy Fat”?
There is a well-established relationship between obesity and insulin resistance [315-317].
Increased adiposity leads to inflammatory responses that interfere with insulin signaling,
promoting insulin resistance, and adipose tissue lipolysis, and lipid accumulation in other
tissues [318]. For example, feeding mice a high fat diet for 10 weeks promotes tissue
inflammation and insulin resistance [319]. Early animal studies have also shown that the
presence of inflammatory cytokines in adipose tissue disrupt insulin signaling [320].
Inhibition of insulin action in adipose tissue leads to uncontrolled lipolysis, increasing the
triglycerides in the bloodstream and in peripheral tissues, such as the liver [321, 322].
Ectopic deposition of lipids in the liver promotes the development of NAFLD and liver-
specific insulin resistance, which prevents gluconeogenesis inhibition, leading to high
blood glucose [153].
In the present study, we found no evidence of these further consequences of adiposity in
offspring of GDM dams. There was no evidence of inflammation, as inflammatory
markers Tnfa and Il6 in adipose tissue were not elevated. Neither serum nor liver
triglycerides were higher in offspring of GDM animals. Fasting insulin also wasn’t
higher, and the ability to clear glucose was unaffected in offspring of GDM dams, even
after they became more obese than offspring of CON dams following HFHS feeding. It
should be noted, however, that offspring were only followed through 31 weeks of age,

73
after just 8 weeks of HFHS challenge. It is possible that further aging or a more
prolonged HFHS feeding may have led to more of the negative consequences of obesity.
Several changes in transcript levels observed in the offspring of GDM mice may
contribute to protecting their insulin sensitivity, despite altered lipid metabolism. For
example, we observed an increase in insulin receptor mRNA in the liver and adipose
tissue of adult male offspring that persisted when the animals were placed on HFHS
feeding. In addition to insulin receptor, levels of mRNA encoding adiponectin, which has
been shown to prevent insulin resistance in the liver, [323] were elevated. Yamauchi et
al. showed that adiponectin ameliorates insulin resistance and hyperglycemia in ob/ob
mice, which display obesity, diabetes and other facets of metabolic syndrome [324].
Adipose overexpression of phosphoenolpyruvate carboxykinase (PEPCK) activity can
lead to obesity without insulin resistance [325], as it facilitates fatty acid re-esterification
and promotes fat storage [326]. We measured adipose levels of Pck1 transcript in our
animals to determine if this was a mechanism through which they maintained glucose
tolerance in spite of increased adiposity. While not quite statistically significant
(p=0.0579), there is some evidence that the levels of Pck1 in subcutaneous fat are
upregulated to protect the offspring against insulin resistance.
Collectively, these findings point to a "healthy fat" phenomenon [327, 328], with the
offspring of GDM dams having no excess insulin resistance despite high fat mass. The
gene expression data suggest that the adipose tissue exhibits hyperplastic rather than
hypertrophic propensities. Hypertrophy, or increase in adipocyte size, is accompanied by
increased expression inflammatory cytokines such as IL-6 in [329], which is not elevated
in the offspring of our GDM dams. In humans, adipocyte size has been positively

74
correlated with insulin resistance and decreased adiponectin gene expression [330, 331].
Hyperplasia, an increase in adipocyte number, or adipogenesis, is a mechanism by which
adipose tissue mass can increase without hypertrophy. Hyperplasia is facilitated by an
increase in adipogenic transcription factors such as PPARG [332] and prevents
inflammation and insulin resistance [318]. It has been shown that adipose tissue can adapt
protective mechanisms to maintain insulin sensitivity in spite of high adiposity and
obesity [333]. In humans, insulin sensitive obesity is associated with differential adipose
gene expression, including increased expression of adiponectin and a higher ratio of
subcutaneous to visceral fat [334, 335]. The storage of fats in the adipose tissue may
itself prevent ectopic fat storage and resultant lipotoxicity [336]. Adipose tissue accretion
has been previously shown to positively affect metabolism, with mouse models that lack
the capacity to promote adipogenesis developing hepatic steatosis and glucose intolerance
[337]. This suggests that offspring of lean vs obese GDM mothers may exhibit increased
adiposity while remaining metabolically healthy, without an increased risk for diabetes.
Potential Role of Leptin
One factor protecting offspring may have been in utero exposure to elevated
concentrations of maternal leptin. We and others have previously shown that in dams
with normal glucose tolerance, hyperleptinemia protects offspring from developing
insulin resistance [231, 301, 338]. The GDM model dams exhibit hyperleptinemia despite
normal pregnancy weights [109]. It is not clear whether this hyperleptinemia is a direct
result of the HFHS diet composition, or an indication of leptin resistance [339]. There is
also not yet a full understanding of the leptin resistance associated with obesity or with
normal pregnancy [267, 268]. Thus, additional study is needed to understand how

75
maternal leptin protects offspring insulin sensitivity, and whether this might differ in
obese and lean GDM.
Broader Relevance
Overall our results suggest that some of the well-documented impacts of GDM on
offspring may not occur in lean GDM. This underscores the importance of separately
studying the facets of GDM to determine how offspring outcomes are conferred.
The pathophysiology of lean GDM may be somewhat different from obese GDM, with
women displaying lower glucose-stimulated insulin secretion, similar to our mouse
model [23]. Our data suggest that maternal glucose intolerance in lean mothers does not
promote offspring insulin resistance and glucose intolerance, but does elevate adiposity.
Offspring insulin resistance may instead be a result of factors like glucose intolerance
prior to, or in early pregnancy, or of obesity in combination with GDM.
Mouse studies of maternal obesity with hyperglycemia support this. Nivoit et al showed
that diet induced obesity led to offspring with insulin resistance and increased adiposity
[340], and Jungheim et al fed dams a 35.8% fat g/g diet that resulted in offspring obesity
as well as alterations in offspring glucose tolerance [157]. Unfortunately, maternal
obesity studies do not always report maternal glucose tolerance [119] making it difficult
to determine whether offspring outcomes can be attributed to maternal obesity alone, or
to maternal hyperglycemia as well. One study showed that in humans, increased fat mass
is only present in offspring of mothers with both maternal obesity and GDM versus
maternal obesity alone [302], consistent with the present finding that increased offspring
adiposity is caused by maternal glucose intolerance.

76
Here, the effects of maternal glucose intolerance alone appear to be limited to adiposity,
and offspring may even be protected against the development of type 2 diabetes through
increased adipose storage of fat. This is mediated by a preferential utilization of
carbohydrates to lipids in the offspring of GDM dams. In adult male offspring the
increased expression of genes related to fat storage in subcutaneous adipose tissue
appears to contribute to the increased adiposity. The sex-specific gene expression
differences suggest that the programming of increased adiposity in the offspring is partly
modulated by offspring sex hormones.
Collectively, our data suggest that while maternal glucose intolerance alone does not alter
offspring glucose tolerance, GDM even in normal weight mothers affects offspring
adiposity, and promotes obesity on a western obesogenic diet.

77
Gene of Interest Primer Sequence (5'-3’) Actb Sense GATGACCCAGATCATGTTTGAGACC Antisense AGATGGGCACAGTGTGGGTGA Srebp1c Sense TGGTGGGCACTGAAGCAAA Antisense GCAAGAAGCGGATGTAGTCGAT Insr Sense CCACCAAGAACTCGTGAAAGG Antisense TGCACGCAGGAAAGAACCT Gapdh Sense TGCACCACCAACTGCTTAGC Antisense GGCATGGACTGTGGTCATGAG Hprt Sense TGACACTGGCAAAACAATGCA Antisense GGTCCTTTTCACCAGCAAGCT Lep Sense GTGAAATGTCATTGATCCTGGTG Antisense GTGGCTTTGGTCCTATCTGTC Pck1 Antisense GCGAGTCTGTCAGTTCAATACC Sense GGATGTCGGAAGAGGACTTTG Cpt1a Antisense AGTGTCCATCCTCTGAGTAGC Sense CAGCAAGATAGGCATAAACGC Acaca Antisense GTCCAACAGAACATCGCTGA Sense AACATCCCCACGCTAAACAG Ppara Antisense TGCAACTTCTCAATGTAGCCT Sense AATGCCTTAGAACTGGATGACA Pgc1a Antisense TCGCTCAATAGTCTTGTTCTCAA Sense AGAAGTCCCATACACAACCG Il6 Antisense TCCAGTTGCCTTCTTGGGAC Sense AGTCTCCTCTCCGGACTTGT Ucp1 Antisense ACTGCCACACCTCCAGTCATT Sense CTTTGCCTCACTCAGGATTGG Adipoq Antisense GCAGGATTAAGAGGAACAGGAG Sense TGTCTGTACGATTGTCAGTGG Tnfa Antisense TCTTTGAGATCCATGCCGTTG Antisense AGACCCTCACACTCAGATCA Pparg Sense TGCAGGTTCTACTTTGATCGC Antisense CTGCTCCACACTATGAAGACAT Lpl Sense CTTCTGCATACTCAAAGTTAGGC Antisense CTAGACAACGTCCACCTCTTAG
Table 1. Primer Table

78
Figure 1: Offspring weights. Male (a) and Female (b) offspring weights measured weekly from 3 – 31 weeks of age. Offspring were maintained on a CD except for a subset of offspring placed on HFHS feeding at 23 weeks of age. Sample size (offspringdam): Male CD (CON1121, GDM 613) Male HFHS (CON1111, GDM 55) Female CD (CON1217, GDM 710) Female HFHS (CON77, GDM 66). Data are represented as mean ± SEM.

79
Figure 2: Body fat percentage measured by Magnetic Resonance Imaging in offspring at 4, 12, 20 and 28 weeks of age on CD and at 30 weeks on HFHS. Sample size (offspringdam): Male CD (4wk CON99, GDM 55, 12wk CON1010, GDM 66, 20wk CON1010, GDM 66, 28wk CON1010, GDM 66) Male HFHS (CON1010, GDM 55) Female CD (4wk CON99, GDM 55, 12wk CON99, GDM 77, 20wk CON99, GDM 77, 28wk CON99, GDM 66) Female HFHS (CON77, GDM 66). Data are represented as mean ± SEM.

80
Figure 3: Food consumption (a-d) and energy expenditure (e-h) assessed in offspring at 4, 12, 20 and 28 weeks of age on CD and at 30 weeks on HFHS. Sample size (offspringdam): Male CD (4wk CON99, GDM 55, 12wk CON1010, GDM 66, 20wk CON1010, GDM 66, 28wk CON1010, GDM 66) Male HFHS (CON1010, GDM 55) Female CD (4wk CON99, GDM 55, 12wk CON99, GDM 77, 20wk CON99, GDM 77, 28wk CON99, GDM 66) Female HFHS (CON77, GDM 66). Data are represented as mean ± SEM.
30 HFHS30 HFHS
30 HFHS 30 HFHS

81
Figure 4: Respiratory quotient assessed in male (a, c) and female (b, d) offspring at 4, 12, 20 and 28 weeks of age on CD and at 30 weeks on HFHS. Sample size (offspringdam): Male CD (4wk CON99, GDM 55, 12wk CON1010, GDM 66, 20wk CON1010, GDM 66, 28wk CON1010, GDM 66) Male HFHS (CON1010, GDM 55) Female CD (4wk CON99, GDM 55, 12wk CON99, GDM 77, 20wk CON99, GDM 77, 28wk CON99, GDM 66) Female HFHS (CON88, GDM 66). * indicates significantly different than control (p < 0.05). Data are represented as mean ± SEM.
30 HFHS 30 HFHS
30 HFHS 30 HFHS

82
Figure 5: Steady state mRNA levels of genes related to beta oxidation in male (a) and female (b) offspring liver assessed at 31 weeks of age. Sample size (offspringdam): Male CD (19wk CON77, GDM 46, 31wk CON1010, GDM 66) Male HFHS (CON55, GDM 55) Female CD (19wk CON55, GDM 33, 31wk CON1212, GDM 66) Female HFHS (CON66, GDM 66). Data are represented as mean fold change relative to control group mean on chow diet. Error bars represent range of fold changes based on SEM of ΔΔCt. Columns with different superscripts are significantly different (p < 0.05). * indicates significantly different than control overall, but no difference in pairwise comparisons (p < 0.05).

83
Figure 6: Steady state mRNA levels of genes related to fatty acid synthesis in male (a) and female (b) offspring subcutaneous adipose tissue assessed at 31 weeks of age. Sample size (offspringdam): Male CD (19wk CON88, GDM 46, 31wk CON66, GDM 55) Male HFHS (CON55, GDM 56) Female CD (19wk CON55, GDM 33, 31wk CON66, GDM 66) Female HFHS (CON66, GDM 66). Data are represented as mean fold change relative to control group mean on chow diet. Error bars represent range of fold changes based on SEM of ΔΔCt. Columns with different superscripts are significantly different (p < 0.05). * indicates significantly different than control (p < 0.05). # (p<0.06).
Adipoq
Adipoq

84
Figure 7: Serum leptin (a,b) and triglycerides (c,d) and liver triglycerides (e,f) were measured in offspring at 19 (a,c,e) and 31 (b,d,f) weeks of age. Sample size (offspringdam) Serum leptin: Male CD (19wk CON66, GDM 47, 31wk CON1111, GDM 66) Male HFHS (CON1111, GDM 55) Female CD (19wk CON55, GDM 33, 31wk CON1111, GDM 77) Female HFHS (CON77, GDM 55). Serum triglycerides: Male CD (19wk CON1010, GDM 47, 31wk CON1111, GDM 66) Male HFHS (CON1111, GDM 55) Female CD (19wk CON55, GDM 33, 31wk CON1111, GDM 77) Female HFHS (CON77, GDM 66). Liver triglycerides: Male CD (19wk CON99, GDM 47, 31wk CON1111, GDM 66) Male HFHS (CON1111, GDM 55) Female CD (19wk CON55, GDM 33, 31wk CON1212, GDM 77) Female HFHS (CON77, GDM 66) * indicates significantly different than control (p < 0.05). Data are represented as mean ± SEM.

85
Figure 8: Glucose control in offspring. Serum fasting insulin measures at 19 (a) and 30 (b) weeks in offspring. Glucose tolerance tests in 19 week old male (c) and female (f) offspring, and in 30 week old male (d,e) and female (g,h) offspring on CD and HFHS. Sample size (offspringdam): Serum insulin: Male CD (19wk CON1010, GDM 47, 31wk CON1111, GDM 66) Male HFHS (CON1111, GDM 55) Female CD (19wk CON55, GDM 33, 31wk CON1212, GDM 77) Female HFHS (CON77, GDM 55).* indicates sex difference (p < 0.05). Data are represented as mean ± SEM.
*
*
*

86
BIBLIOGRAPHY
1. Metzger, B.E., et al., Summary and recommendations of the Fifth International
Workshop-Conference on Gestational Diabetes Mellitus. Diabetes Care, 2007. 30
Suppl 2: p. S251-60.
2. DeSisto, C.L., S.Y. Kim, and A.J. Sharma, Prevalence estimates of gestational
diabetes mellitus in the United States, Pregnancy Risk Assessment Monitoring
System (PRAMS), 2007-2010. Prev Chronic Dis, 2014. 11: p. E104.
3. DeSisto, C.L., S.Y. Kim, and A.J. Sharma, Prevalence Estimates of Gestational
Diabetes Mellitus in the United States, Pregnancy Risk Assessment Monitoring
System (PRAMS), 2007-2010. Preventing Chronic Disease, 2014. 11: p. E104.
4. Getahun, D., et al., Gestational diabetes in the United States: temporal trends
1989 through 2004. Am J Obstet Gynecol, 2008. 198(5): p. 525 e1-5.
5. Zhu, Y. and C. Zhang, Prevalence of Gestational Diabetes and Risk of
Progression to Type 2 Diabetes: a Global Perspective. Current Diabetes Reports,
2016. 16(1): p. 7.
6. Chu, S.Y., et al., Maternal Obesity and Risk of Gestational Diabetes Mellitus.
Diabetes Care, 2007. 30(8): p. 2070-2076.
7. Leddy, M.A., M.L. Power, and J. Schulkin, The Impact of Maternal Obesity on
Maternal and Fetal Health. Reviews in Obstetrics and Gynecology, 2008. 1(4): p.
170-178.
8. Hedderson, M.M., et al., Body Mass Index and weight gain prior to pregnancy
and risk of gestational diabetes mellitus. American journal of obstetrics and
gynecology, 2008. 198(4): p. 409.e1-409.e7.
87
9. Getahun, D., M.J. Fassett, and S.J. Jacobsen, Gestational diabetes: risk of
recurrence in subsequent pregnancies. Am J Obstet Gynecol, 2010. 203(5): p.
467.e1-6.
10. Solomon, C.G., et al., A prospective study of pregravid determinants of
gestational diabetes mellitus. Jama, 1997. 278(13): p. 1078-83.
11. Catalano, P.M., et al., Subclinical abnormalities of glucose metabolism in subjects
with previous gestational diabetes. American Journal of Obstetrics and
Gynecology, 1986. 155(6): p. 1255-1262.
12. Catalano, P.M., et al., Longitudinal changes in glucose metabolism during
pregnancy in obese women with normal glucose tolerance and gestational
diabetes mellitus. American Journal of Obstetrics and Gynecology, 1999. 180(4):
p. 903-916.
13. Herrera, E., Lipid metabolism in pregnancy and its consequences in the fetus and
newborn. Endocrine, 2002. 19(1): p. 43-55.
14. McLachlan, K.A., et al., Do adiponectin, TNFalpha, leptin and CRP relate to
insulin resistance in pregnancy? Studies in women with and without gestational
diabetes, during and after pregnancy. Diabetes Metab Res Rev, 2006. 22(2): p.
131-8.
15. Catalano, P.M., et al., Longitudinal changes in insulin release and insulin
resistance in nonobese pregnant women. Am J Obstet Gynecol, 1991. 165(6 Pt 1):
p. 1667-72.
16. Ryan, E.A. and L. Enns, Role of gestational hormones in the induction of insulin
resistance. J Clin Endocrinol Metab, 1988. 67(2): p. 341-7.
88
17. Friedman, J.E., et al., Impaired glucose transport and insulin receptor tyrosine
phosphorylation in skeletal muscle from obese women with gestational diabetes.
Diabetes, 1999. 48(9): p. 1807-1814.
18. Barbour, L.A., et al., Cellular Mechanisms for Insulin Resistance in Normal
Pregnancy and Gestational Diabetes. Diabetes Care, 2007. 30(Supplement 2): p.
S112-S119.
19. Sonagra, A.D., et al., Normal Pregnancy- A State of Insulin Resistance. Journal of
Clinical and Diagnostic Research : JCDR, 2014. 8(11): p. CC01-CC03.
20. Parsons, J.A., T.C. Brelje, and R.L. Sorenson, Adaptation of islets of Langerhans
to pregnancy: increased islet cell proliferation and insulin secretion correlates
with the onset of placental lactogen secretion. Endocrinology, 1992. 130(3): p.
1459-66.
21. Sorenson, R.L. and T.C. Brelje, Adaptation of islets of Langerhans to pregnancy:
beta-cell growth, enhanced insulin secretion and the role of lactogenic hormones.
Horm Metab Res, 1997. 29(6): p. 301-7.
22. Homko, C., et al., Insulin secretion during and after pregnancy in patients with
gestational diabetes mellitus. J Clin Endocrinol Metab, 2001. 86(2): p. 568-73.
23. Kautzky-Willer, A., et al., Pronounced insulin resistance and inadequate beta-
cell secretion characterize lean gestational diabetes during and after pregnancy.
Diabetes Care, 1997. 20(11): p. 1717-23.
24. Yen, S.S.C., C.C. Tsai, and P. Vela, Gestational diabetogenesis: Quantitative
analyses of glucose-insulin interrelationship between normal pregnancy and

89
pregnancy with gestational diabetes. American Journal of Obstetrics &
Gynecology. 111(6): p. 792-800.
25. Ryan, E.A., M.J. O'Sullivan, and J.S. Skyler, Insulin action during pregnancy.
Studies with the euglycemic clamp technique. Diabetes, 1985. 34(4): p. 380-9.
26. Catalano, P.M., Trying to understand gestational diabetes. Diabetic medicine : a
journal of the British Diabetic Association, 2014. 31(3): p. 273-281.
27. Zhang, H., et al., Gestational Diabetes Mellitus Resulting From Impaired β-Cell
Compensation in the Absence of FoxM1, a Novel Downstream Effector of
Placental Lactogen. Diabetes, 2010. 59(1): p. 143-152.
28. Tancredi, M., et al., Histopathology and ex vivo insulin secretion of pancreatic
islets in gestational diabetes: A case report. Islets, 2011. 3(5): p. 231-3.
29. Srichumchit, S., S. Luewan, and T. Tongsong, Outcomes of pregnancy with
gestational diabetes mellitus. Int J Gynaecol Obstet, 2015. 131(3): p. 251-4.
30. Jiang, S., et al., Comparison of adverse pregnancy outcomes based on the new
IADPSG 2010 gestational diabetes criteria and maternal body mass index. Aust
N Z J Obstet Gynaecol, 2017.
31. Mack, L.R. and P.G. Tomich, Gestational Diabetes: Diagnosis, Classification,
and Clinical Care. Obstet Gynecol Clin North Am, 2017. 44(2): p. 207-217.
32. Popova, P., et al., Fasting glycemia at the first prenatal visit and pregnancy
outcomes in Russian women. Minerva Endocrinol, 2016. 41(4): p. 477-85.
33. Bellamy, L., et al., Type 2 diabetes mellitus after gestational diabetes: a
systematic review and meta-analysis. Lancet, 2009. 373(9677): p. 1773-9.

90
34. Gasim, T., Gestational Diabetes Mellitus: Maternal and Perinatal Outcomes in
220 Saudi Women. Oman Medical Journal, 2012. 27(2): p. 140-144.
35. Kim, C., Gestational diabetes: risks, management, and treatment options.
International Journal of Women's Health, 2010. 2: p. 339-351.
36. Silverman, B.L., et al., Impaired Glucose Tolerance in Adolescent Offspring of
Diabetic Mothers: Relationship to fetal hyperinsulinism. Diabetes Care, 1995.
18(5): p. 611-617.
37. Dabelea, D., et al., Increasing prevalence of Type II diabetes in American Indian
children. Diabetologia, 1998. 41(8): p. 904-10.
38. Dabelea, D., et al., Intrauterine exposure to diabetes conveys risks for type 2
diabetes and obesity: a study of discordant sibships. Diabetes, 2000. 49(12): p.
2208-2211.
39. Pettitt, D.J., et al., Congenital susceptibility to NIDDM. Role of intrauterine
environment. Diabetes, 1988. 37(5): p. 622-8.
40. Malcolm, J.C., et al., Glucose tolerance of offspring of mother with gestational
diabetes mellitus in a low-risk population. Diabet Med, 2006. 23(5): p. 565-70.
41. Meigs, J.B., L.A. Cupples, and P.W. Wilson, Parental transmission of type 2
diabetes: the Framingham Offspring Study. Diabetes, 2000. 49(12): p. 2201-7.
42. Clausen, T.D., et al., High prevalence of type 2 diabetes and pre-diabetes in adult
offspring of women with gestational diabetes mellitus or type 1 diabetes: the role
of intrauterine hyperglycemia. Diabetes Care, 2008. 31(2): p. 340-6.
43. Pettitt, D.J., et al., Diabetes and obesity in the offspring of Pima Indian women
with diabetes during pregnancy. Diabetes Care, 1993. 16(1): p. 310-4.

91
44. Lawlor, D.A., P. Lichtenstein, and N. Langstrom, Association of maternal
diabetes mellitus in pregnancy with offspring adiposity into early adulthood:
sibling study in a prospective cohort of 280,866 men from 248,293 families.
Circulation, 2011. 123(3): p. 258-65.
45. Hummel, S., et al., Postpartum Outcomes in Women with Gestational Diabetes
and their Offspring: POGO Study Design and First-Year Results. The Review of
Diabetic Studies : RDS, 2013. 10(1): p. 49-57.
46. Pettitt, D.J., et al., Obesity in Offspring of Diabetic Pima Indian Women Despite
Normal Birth Weight. Diabetes Care, 1987. 10(1): p. 76-80.
47. Lee, H., et al., Early manifestation of cardiovascular disease risk factors in
offspring of mothers with previous history of gestational diabetes mellitus.
Diabetes Research and Clinical Practice, 2007. 78(2): p. 238-245.
48. Zhang, S., et al., Maternal Glucose during Pregnancy and after Delivery in
Women with Gestational Diabetes Mellitus on Overweight Status of Their
Children. BioMed Research International, 2015. 2015: p. 9.
49. Hillier, T.A., et al., Childhood obesity and metabolic imprinting: the ongoing
effects of maternal hyperglycemia. Diabetes Care, 2007. 30(9): p. 2287-92.
50. Simmons, D. and S. Robertson, Influence of maternal insulin treatment on the
infants of women with gestational diabetes. Diabet Med, 1997. 14(9): p. 762-5.
51. McLean, M., D. Chipps, and N.W. Cheung, Mother to child transmission of
diabetes mellitus: does gestational diabetes program Type 2 diabetes in the next
generation? Diabet Med, 2006. 23(11): p. 1213-5.

92
52. Herring, S.J. and E. Oken, Obesity and Diabetes in Mothers and Their Children:
Can We Stop the Intergenerational Cycle? Current diabetes reports, 2011. 11(1):
p. 20-27.
53. Mao, H., Q. Li, and S. Gao, Meta-analysis of the relationship between common
type 2 diabetes risk gene variants with gestational diabetes mellitus. PLoS One,
2012. 7(9): p. e45882.
54. Kwak, S.H., et al., A Genome-Wide Association Study of Gestational Diabetes
Mellitus in Korean Women. Diabetes, 2012. 61(2): p. 531-541.
55. Nael, S. and G. Leif, Genetics of Gestational Diabetes Mellitus. Current
Medicinal Chemistry, 2007. 14(5): p. 569-583.
56. Groop, L., et al., Metabolic Consequences of a Family History of NIDDM (The
Botnia Study): Evidence for Sex-Specific Parental Effects. Diabetes, 1996. 45(11):
p. 1585-1593.
57. Krishnaveni, G.V., et al., Anthropometry, glucose tolerance, and insulin
concentrations in Indian children: relationships to maternal glucose and insulin
concentrations during pregnancy. Diabetes Care, 2005. 28(12): p. 2919-25.
58. Mooy, J.M., et al., Prevalence and determinants of glucose intolerance in a Dutch
caucasian population. The Hoorn Study. Diabetes Care, 1995. 18(9): p. 1270-3.
59. Pettitt, D.J. and W.C. Knowler, Long-term effects of the intrauterine environment,
birth weight, and breast-feeding in Pima Indians. Diabetes Care, 1998. 21 Suppl
2: p. B138-41.

93
60. Dorner, G. and A. Mohnike, Further evidence for a predominantly maternal
transmission of maturity-onset type diabetes. Endokrinologie, 1976. 68(1): p. 121-
4.
61. Hyperglycaemia and Adverse Pregnancy Outcome (HAPO) Study: associations
with maternal body mass index. BJOG, 2010. 117(5): p. 575-84.
62. Macfarlane, C.M. and N. Tsakalakos, The extended Pedersen hypothesis. Clin
Physiol Biochem, 1988. 6(2): p. 68-73.
63. Gude, N.M., et al., Growth and function of the normal human placenta.
Thrombosis Research, 2004. 114(5): p. 397-407.
64. Pedersen, J., B. Bojsen-Moller, and H. Poulsen, Blood sugar in newborn infants
of diabetic mothers. Acta Endocrinol (Copenh), 1954. 15(1): p. 33-52.
65. Group, T.H.S.C.R., Hyperglycemia and Adverse Pregnancy Outcomes. New
England Journal of Medicine, 2008. 358(19): p. 1991-2002.
66. Schwartz, R., et al., Hyperinsulinemia and macrosomia in the fetus of the diabetic
mother. Diabetes Care, 1994. 17(7): p. 640-8.
67. Wollschlaeger, K., et al., A study of fetal macrosomia. Arch Gynecol Obstet,
1999. 263(1-2): p. 51-5.
68. Hou, R.-L., et al., Cord Blood C-peptide, Insulin, HbA1c, and Lipids Levels in
Small- and Large-for-Gestational-Age Newborns. Medical Science Monitor :
International Medical Journal of Experimental and Clinical Research, 2014. 20: p.
2097-2105.
69. Dimasuay, K.G., et al., Placental Responses to Changes in the Maternal
Environment Determine Fetal Growth. Frontiers in Physiology, 2016. 7: p. 12.

94
70. Desoye, G., et al., Insulin receptors in syncytiotrophoblast and fetal endothelium
of human placenta. Immunohistochemical evidence for developmental changes in
distribution pattern. Histochemistry, 1994. 101(4): p. 277-85.
71. Jones, C.J., et al., Ultrastructural localization of insulin receptors in human
placenta. Am J Reprod Immunol, 1993. 30(2-3): p. 136-45.
72. Jansson, N., et al., Leptin stimulates the activity of the system A amino acid
transporter in human placental villous fragments. J Clin Endocrinol Metab, 2003.
88(3): p. 1205-11.
73. Karl, P.I., K.L. Alpy, and S.E. Fisher, Amino acid transport by the cultured
human placental trophoblast: effect of insulin on AIB transport. Am J Physiol,
1992. 262(4 Pt 1): p. C834-9.
74. Ruiz-Palacios, M., et al., Role of Insulin in Placental Transport of Nutrients in
Gestational Diabetes Mellitus. Ann Nutr Metab, 2017. 70(1): p. 16-25.
75. Wang, Y., et al., Fetal macrosomia and adolescence obesity: results from a
longitudinal cohort study. Int J Obes (Lond), 2009. 33(8): p. 923-8.
76. Yu, Z., et al., Macrosomia is associated with high weight-for-height in children
aged 1-3 years in Shanghai, China. Int J Obes (Lond), 2008. 32(1): p. 55-60.
77. Kodama, S., et al., Comparisons of the strength of associations with future type 2
diabetes risk among anthropometric obesity indicators, including waist-to-height
ratio: a meta-analysis. Am J Epidemiol, 2012. 176.
78. Ganz, M.L., et al., The association of body mass index with the risk of type 2
diabetes: a case–control study nested in an electronic health records system in the
United States. Diabetology & Metabolic Syndrome, 2014. 6(1): p. 50.

95
79. Boney, C.M., et al., Metabolic Syndrome in Childhood: Association With Birth
Weight, Maternal Obesity, and Gestational Diabetes Mellitus. Pediatrics, 2005.
115(3): p. e290-e296.
80. Barker, D.J., Maternal nutrition, fetal nutrition, and disease in later life.
Nutrition, 1997. 13(9): p. 807-13.
81. Gluckman, P.D. and M.A. Hanson, The developmental origins of the metabolic
syndrome. Trends in Endocrinology & Metabolism, 2004. 15(4): p. 183-187.
82. Godfrey, K.M. and D.J. Barker, Fetal programming and adult health. Public
Health Nutr, 2001. 4(2b): p. 611-24.
83. Schulz, L.C., The Dutch Hunger Winter and the developmental origins of health
and disease. Proceedings of the National Academy of Sciences, 2010. 107(39): p.
16757-16758.
84. Jackson, A.A., S.C. Langley-Evans, and H.D. McCarthy, Nutritional influences in
early life upon obesity and body proportions. Ciba Found Symp, 1996. 201: p.
118-29; discussion 129-37, 188-93.
85. Ravelli, A.C., et al., Glucose tolerance in adults after prenatal exposure to
famine. Lancet, 1998. 351(9097): p. 173-7.
86. Santos, S., et al., The role of prenatal exposures on body fat patterns at 7 years:
Intrauterine programming or birthweight effects? Nutrition, Metabolism and
Cardiovascular Diseases, 2016. 26(11): p. 1004-1010.
87. Simeoni, U. and D.J. Barker, Offspring of diabetic pregnancy: Long-term
outcomes. Seminars in Fetal and Neonatal Medicine, 2009. 14(2): p. 119-124.

96
88. Heard, E. and R.A. Martienssen, Transgenerational Epigenetic Inheritance:
myths and mechanisms. Cell, 2014. 157(1): p. 95-109.
89. Faulk, C. and D.C. Dolinoy, Timing is everything: the when and how of
environmentally induced changes in the epigenome of animals. Epigenetics, 2011.
6(7): p. 791-7.
90. Feil, R. and M.F. Fraga, Epigenetics and the environment: emerging patterns and
implications. Nat Rev Genet, 2011. 13(2): p. 97-109.
91. Chiang, E.P., et al., Effects of insulin and glucose on cellular metabolic fluxes in
homocysteine transsulfuration, remethylation, S-adenosylmethionine synthesis,
and global deoxyribonucleic acid methylation. J Clin Endocrinol Metab, 2009.
94(3): p. 1017-25.
92. Volkmar, M., et al., DNA methylation profiling identifies epigenetic dysregulation
in pancreatic islets from type 2 diabetic patients. The EMBO Journal, 2012.
31(6): p. 1405-1426.
93. Ishikawa, K., et al., Long-Term Pancreatic Beta Cell Exposure to High Levels of
Glucose but Not Palmitate Induces DNA Methylation within the Insulin Gene
Promoter and Represses Transcriptional Activity. PLOS ONE, 2015. 10(2): p.
e0115350.
94. Jirtle, R.L. and M.K. Skinner, Environmental epigenomics and disease
susceptibility. Nat Rev Genet, 2007. 8(4): p. 253-262.
95. Haertle, L., et al., Epigenetic signatures of gestational diabetes mellitus on cord
blood methylation. Clin Epigenetics, 2017. 9: p. 28.

97
96. Xie, X., et al., Placental DNA methylation of peroxisome-proliferator-activated
receptor-gamma co-activator-1alpha promoter is associated with maternal
gestational glucose level. Clin Sci (Lond), 2015. 129(4): p. 385-94.
97. Finer, S., et al., Maternal gestational diabetes is associated with genome-wide
DNA methylation variation in placenta and cord blood of exposed offspring.
Human Molecular Genetics, 2015. 24(11): p. 3021-3029.
98. Ruchat, S.M., et al., Gestational diabetes mellitus epigenetically affects genes
predominantly involved in metabolic diseases. Epigenetics, 2013. 8(9): p. 935-43.
99. Dickinson, J.E., et al., Streptozocin-induced diabetes mellitus in the pregnant ewe.
Am J Obstet Gynecol, 1991. 165(6 Pt 1): p. 1673-7.
100. Miodovnik, M., et al., Alloxan-induced diabetes mellitus in the pregnant ewe:
metabolic and cardiovascular effects on the mother and her fetus. Am J Obstet
Gynecol, 1989. 160(5 Pt 1): p. 1239-44.
101. Kemnitz, J.W., et al., Changes in food intake during menstrual cycles and
pregnancy of normal and diabetic rhesus monkeys. Diabetologia, 1984. 26(1): p.
60-4.
102. Ezekwe, M.O., et al., Effects of maternal streptozotocin-diabetes on fetal growth,
energy reserves and body composition of newborn pigs. J Anim Sci, 1984. 59(4):
p. 974-80.
103. Ezekwe, M.O., Effect of streptozotocin-induced diabetes in primiparous swine on
subsequent reproductive performance. J Anim Sci, 1986. 62(4): p. 1005-11.

98
104. Pasek, R.C. and M. Gannon, Advancements and challenges in generating
accurate animal models of gestational diabetes mellitus. American Journal of
Physiology - Endocrinology and Metabolism, 2013. 305(11): p. E1327-E1338.
105. Schmidt, A., et al., Only humans have human placentas: molecular differences
between mice and humans. J Reprod Immunol, 2015. 108: p. 65-71.
106. Enders, A.C. and T.N. Blankenship, Comparative placental structure. Advanced
Drug Delivery Reviews, 1999. 38(1): p. 3-15.
107. Georgiades, P., A.C. Ferguson-Smith, and G.J. Burton, Comparative
Developmental Anatomy of the Murine and Human Definitive Placentae.
Placenta, 2002. 23(1): p. 3-19.
108. Cox, B., et al., Comparative systems biology of human and mouse as a tool to
guide the modeling of human placental pathology. Molecular Systems Biology,
2009. 5(1).
109. Pennington, K.A., et al., Effects of acute exposure to a high-fat, high-sucrose diet
on gestational glucose tolerance and subsequent maternal health in mice. Biol
Reprod, 2017. 96(2): p. 435-445.
110. Blue, E.K., et al., Fetal hyperglycemia and a high fat diet contribute to aberrant
glucose tolerance and hematopoiesis in adulthood. Pediatric research, 2015.
77(2): p. 316-325.
111. Liang, C., K. DeCourcy, and M.R. Prater, High-saturated-fat diet induces
gestational diabetes and placental vasculopathy in C57BL/6 mice. Metabolism,
2010. 59(7): p. 943-50.

99
112. Yamashita, H., et al., Effect of spontaneous gestational diabetes on fetal and
postnatal hepatic insulin resistance in Lepr(db/+) mice. Pediatr Res, 2003. 53(3):
p. 411-8.
113. Huang, C., F. Snider, and J.C. Cross, Prolactin receptor is required for normal
glucose homeostasis and modulation of beta-cell mass during pregnancy.
Endocrinology, 2009. 150(4): p. 1618-26.
114. Kim, H., et al., Serotonin regulates pancreatic beta cell mass during pregnancy.
Nat Med, 2010. 16(7): p. 804-8.
115. Pereira, T.J., et al., Maternal obesity characterized by gestational diabetes
increases the susceptibility of rat offspring to hepatic steatosis via a disrupted
liver metabolome. J Physiol, 2015. 593(14): p. 3181-97.
116. Rosario, F.J., et al., Increased placental nutrient transport in a novel mouse model
of maternal obesity with fetal overgrowth. Obesity (Silver Spring, Md.), 2015.
23(8): p. 1663-1670.
117. Sasson, I.E., et al., Pre-gestational vs gestational exposure to maternal obesity
differentially programs the offspring in mice. Diabetologia, 2015. 58(3): p. 615-
624.
118. Oh, W., N.L. Gelardi, and C.J. Cha, Maternal hyperglycemia in pregnant rats: its
effect on growth and carbohydrate metabolism in the offspring. Metabolism:
clinical and experimental, 1988. 37(12): p. 1146-1151.
119. Ainge, H., et al., A systematic review on animal models of maternal high fat
feeding and offspring glycaemic control. Int J Obes, 2011. 35(3): p. 325-335.

100
120. Guo, F. and K.L. Jen, High-fat feeding during pregnancy and lactation affects
offspring metabolism in rats. Physiol Behav, 1995. 57(4): p. 681-6.
121. Song, Y., et al., Severe Maternal Hyperglycemia Exacerbates the Development of
Insulin Resistance and Fatty Liver in the Offspring on High Fat Diet.
Experimental Diabetes Research, 2012. 2012: p. 8.
122. Baeyens, L., et al., β-Cell Adaptation in Pregnancy. Diabetes, obesity &
metabolism, 2016. 18(Suppl 1): p. 63-70.
123. Marynissen, G., L. Aerts, and F.A. Van Assche, The endocrine pancreas during
pregnancy and lactation in the rat. J Dev Physiol, 1983. 5(6): p. 373-81.
124. Jawerbaum, A., et al., Eicosanoid production by uterine strips and by embryos
obtained from diabetic pregnant rats. Prostaglandins, 1993. 45(5): p. 487-95.
125. Foglia, V.G., et al., [Fetal and placental characteristics of pregnancy in
pancreatectomized rats]. Rev Soc Argent Biol, 1967. 43(5): p. 187-98.
126. Foglia, V.G., Fetuses and newborns of 95 per cent pancreatectomized female rats.
Adv Metab Disord, 1970. 1: p. Suppl 1:221+.
127. Slack, J.M., Developmental biology of the pancreas. Development, 1995. 121(6):
p. 1569-1580.
128. Deeds, M.C., et al., Single Dose Streptozotocin Induced Diabetes: Considerations
for Study Design in Islet Transplantation Models. Laboratory animals, 2011.
45(3): p. 131-140.
129. Lopez-Soldado, I. and E. Herrera, Different diabetogenic response to moderate
doses of streptozotocin in pregnant rats, and its long-term consequences in the
offspring. Exp Diabesity Res, 2003. 4(2): p. 107-18.

101
130. Oh, W., N.L. Gelardi, and C.J. Cha, Maternal hyperglycemia in pregnant rats: its
effect on growth and carbohydrate metabolism in the offspring. Metabolism,
1988. 37(12): p. 1146-51.
131. Vambergue, A. and I. Fajardy, Consequences of gestational and pregestational
diabetes on placental function and birth weight. World Journal of Diabetes, 2011.
2(11): p. 196-203.
132. Glinianaia, S.V., et al., HbA1c and birthweight in women with pre-conception
type 1 and type 2 diabetes: a population-based cohort study. Diabetologia, 2012.
55(12): p. 3193-3203.
133. Tsuji, K., et al., Characteristic features of insulin secretion in the streptozotocin-
induced NIDDM rat model. Metabolism, 1988. 37(11): p. 1040-4.
134. Phelan, S.A., M. Ito, and M.R. Loeken, Neural Tube Defects in Embryos of
Diabetic Mice: Role of the <em>Pax-3</em> Gene and Apoptosis. Diabetes,
1997. 46(7): p. 1189-1197.
135. Salbaum, J.M. and C. Kappen, Neural Tube Defect Genes and Maternal Diabetes
during Pregnancy. Birth defects research. Part A, Clinical and molecular
teratology, 2010. 88(8): p. 601-611.
136. Kappen, C., et al., Maternal diet modulates the risk for neural tube defects in a
mouse model of diabetic pregnancy. Reproductive toxicology (Elmsford, N.Y.),
2011. 31(1): p. 41-49.
137. Eleazu, C.O., et al., Review of the mechanism of cell death resulting from
streptozotocin challenge in experimental animals, its practical use and potential
risk to humans. Journal of Diabetes and Metabolic Disorders, 2013. 12: p. 60-60.

102
138. Tesch, G.H. and T.J. Allen, Rodent models of streptozotocin-induced diabetic
nephropathy. Nephrology (Carlton), 2007. 12(3): p. 261-6.
139. Valentovic, M.A., et al., Streptozotocin (STZ) diabetes enhances
benzo(alpha)pyrene induced renal injury in Sprague Dawley rats. Toxicol Lett,
2006. 164(3): p. 214-20.
140. Agarwal, M.K., Streptozotocin: mechanisms of action. FEBS Letters, 1980.
120(1): p. 1-3.
141. Reynolds, W.A., et al., Placental Transfer of Streptozotocin in the Rhesus
Monkey. Diabetes, 1974. 23(9): p. 777-782.
142. Prager, R., et al., Histopathological changes in the placenta of streptozotocin
induced diabetic rats. Diabetologia, 1974. 10(1): p. 89-91.
143. Padmanabhan, R., A.G.H. Al-Zuhair, and A.H. Ali, Histopathological Changes of
the Placenta in Diabetes Induced by Maternal Administration of Streptozotocin
during Pregnancy in the Rat. Congenital Anomalies, 1988. 28(1): p. 1-15.
144. Holemans, K., et al., Diet-induced obesity in the rat: a model for gestational
diabetes mellitus. Am J Obstet Gynecol, 2004. 190(3): p. 858-65.
145. Vuong, B., et al., Exposure to gestational diabetes mellitus induces
neuroinflammation, derangement of hippocampal neurons, and cognitive changes
in rat offspring. Journal of Neuroinflammation, 2017. 14(1): p. 80.
146. Magliano, D.A.C., et al., Peroxisome Proliferator-Activated Receptors-Alpha and
Gamma Are Targets to Treat Offspring from Maternal Diet-Induced Obesity in
Mice. PLoS ONE, 2013. 8(5): p. e64258.

103
147. Lapolla, A., et al., Prepregnancy BMI influences maternal and fetal outcomes in
women with isolated gestational hyperglycaemia: A multicentre study. Diabetes &
Metabolism. 36(4): p. 265-270.
148. Samuelsson, A.-M., et al., Diet-Induced Obesity in Female Mice Leads to
Offspring Hyperphagia, Adiposity, Hypertension, and Insulin Resistance. A Novel
Murine Model of Developmental Programming, 2008. 51(2): p. 383-392.
149. Yang, Z.H., et al., Diet high in fat and sucrose induces rapid onset of obesity-
related metabolic syndrome partly through rapid response of genes involved in
lipogenesis, insulin signalling and inflammation in mice. Diabetol Metab Syndr,
2012. 4(1): p. 32.
150. Segura, M.T., et al., Maternal BMI and gestational diabetes alter placental lipid
transporters and fatty acid composition. Placenta, 2017. 57: p. 144-151.
151. Tuersunjiang, N., et al., Maternal obesity programs reduced leptin signaling in
the pituitary and altered GH/IGF1 axis function leading to increased adiposity in
adult sheep offspring. PLoS One, 2017. 12(8): p. e0181795.
152. Krasnow, S.M., M.L. Nguyen, and D.L. Marks, Increased maternal fat
consumption during pregnancy alters body composition in neonatal mice. Am J
Physiol Endocrinol Metab, 2011. 301(6): p. E1243-53.
153. Brumbaugh, D.E. and J.E. Friedman, Developmental origins of nonalcoholic fatty
liver disease. Pediatr Res, 2014. 75(1-2): p. 140-7.
154. Boudoures, A.L., et al., The effects of voluntary exercise on oocyte quality in a
diet-induced obese murine model. Reproduction, 2016. 151(3): p. 261-70.
104
155. Zhang, L., et al., Sirt3 prevents maternal obesity-associated oxidative stress and
meiotic defects in mouse oocytes. Cell Cycle, 2015. 14(18): p. 2959-68.
156. Reynolds, K.A., et al., Adverse effects of obesity and/or high-fat diet on oocyte
quality and metabolism are not reversible with resumption of regular diet in mice.
Reprod Fertil Dev, 2015. 27(4): p. 716-24.
157. Jungheim, E.S., et al., Diet-Induced Obesity Model: Abnormal Oocytes and
Persistent Growth Abnormalities in the Offspring. Endocrinology, 2010. 151(8):
p. 4039-4046.
158. Kim, S.Y., et al., Percentage of gestational diabetes mellitus attributable to
overweight and obesity. Am J Public Health, 2010. 100(6): p. 1047-52.
159. Hinkle, S.N., et al., Prepregnancy obesity trends among low-income women,
United States, 1999-2008. Matern Child Health J, 2012. 16(7): p. 1339-48.
160. Catalano, P.M., et al., Longitudinal changes in glucose metabolism during
pregnancy in obese women with normal glucose tolerance and gestational
diabetes mellitus. Am J Obstet Gynecol, 1999. 180(4): p. 903-16.
161. Buhary, B., et al., Glycemic control and pregnancy outcomes in patients with
diabetes in pregnancy: A retrospective study. Indian Journal of Endocrinology
and Metabolism, 2016. 20(4): p. 481-490.
162. Kim, S.Y., et al., Percentage of Gestational Diabetes Mellitus Attributable to
Overweight and Obesity. American Journal of Public Health, 2010. 100(6): p.
1047-1052.

105
163. Simões, T., et al., Concurrence of gestational diabetes and pre-gravid obesity
(“diabesity”) in twin gestations. The Journal of Maternal-Fetal & Neonatal
Medicine, 2017. 30(15): p. 1813-1815.
164. Musial, B., et al., A Western‐style obesogenic diet alters maternal metabolic
physiology with consequences for fetal nutrient acquisition in mice. The Journal
of Physiology, 2017. 595(14): p. 4875-4892.
165. Soares, M.J., T. Konno, and S.M.K. Alam, The prolactin family: effectors of
pregnancy-dependent adaptations. Trends in Endocrinology & Metabolism, 2007.
18(3): p. 114-121.
166. Banerjee, R.R., et al., Gestational Diabetes Mellitus From Inactivation of
Prolactin Receptor and MafB in Islet beta-Cells. Diabetes, 2016. 65(8): p. 2331-
41.
167. Freemark, M., et al., Targeted deletion of the PRL receptor: effects on islet
development, insulin production, and glucose tolerance. Endocrinology, 2002.
143(4): p. 1378-85.
168. Rawn, S.M., et al., Pregnancy Hyperglycemia in Prolactin Receptor Mutant, but
Not Prolactin Mutant, Mice and Feeding-Responsive Regulation of Placental
Lactogen Genes Implies Placental Control of Maternal Glucose Homeostasis.
Biology of Reproduction, 2015. 93(3): p. 75.
169. Kelly, P.A., et al., Implications of Multiple Phenotypes Observed in Prolactin
Receptor Knockout Mice. Frontiers in Neuroendocrinology, 2001. 22(2): p. 140-
145.

106
170. Huang, C., Wild-type offspring of heterozygous prolactin receptor-null female
mice have maladaptive β-cell responses during pregnancy. The Journal of
Physiology, 2013. 591(Pt 5): p. 1325-1338.
171. Huang, C., F. Snider, and J.C. Cross, Prolactin Receptor Is Required for Normal
Glucose Homeostasis and Modulation of β-Cell Mass during Pregnancy.
Endocrinology, 2009. 150(4): p. 1618-1626.
172. Damm, P., et al., Gestational diabetes mellitus and long-term consequences for
mother and offspring: a view from Denmark. Diabetologia, 2016. 59(7): p. 1396-
9.
173. Zhang, Y., et al., Positional cloning of the mouse obese gene and its human
homologue. Nature, 1994. 372(6505): p. 425-32.
174. Halaas, J.L., et al., Weight-reducing effects of the plasma protein encoded by the
obese gene. Science, 1995. 269(5223): p. 543-6.
175. Boozer, C.N., et al., Synergy of sibutramine and low-dose leptin in treatment of
diet-induced obesity in rats. Metabolism, 2001. 50(8): p. 889-93.
176. Ravussin, Y., et al., Effects of chronic leptin infusion on subsequent body weight
and composition in mice: Can body weight set point be reset? Mol Metab, 2014.
3(4): p. 432-40.
177. Barash, I.A., et al., Leptin is a metabolic signal to the reproductive system.
Endocrinology, 1996. 137(7): p. 3144-7.
178. Mounzih, K., R. Lu, and F.F. Chehab, Leptin treatment rescues the sterility of
genetically obese ob/ob males. Endocrinology, 1997. 138(3): p. 1190-3.

107
179. Chehab, F.F., M.E. Lim, and R. Lu, Correction of the sterility defect in
homozygous obese female mice by treatment with the human recombinant leptin.
Nat Genet, 1996. 12(3): p. 318-20.
180. Gorska, E., et al., Leptin receptors. European Journal of Medical Research, 2010.
15(Suppl 2): p. 50-54.
181. Wada, N., et al., Leptin and its receptors. J Chem Neuroanat, 2014. 61-62: p. 191-
9.
182. Lopez-Luna, P., I. Maier, and E. Herrera, Carcass and tissue fat content in the
pregnant rat. Biol Neonate, 1991. 60(1): p. 29-38.
183. Sattar, N., et al., Leptin levels in pregnancy: marker for fat accumulation and
mobilization? Acta Obstet Gynecol Scand, 1998. 77(3): p. 278-83.
184. Highman, T.J., et al., Longitudinal changes in maternal serum leptin
concentrations, body composition, and resting metabolic rate in pregnancy. Am J
Obstet Gynecol, 1998. 178(5): p. 1010-5.
185. Ashworth, C.J., et al., Placental leptin. Rev Reprod, 2000. 5(1): p. 18-24.
186. Hoggard, N., et al., Leptin secretion to both the maternal and fetal circulation in
the ex vivo perfused human term placenta. Placenta, 2001. 22(4): p. 347-52.
187. Page-Wilson, G., et al., Cerebrospinal Fluid Levels of Leptin,
Proopiomelanocortin, and Agouti-Related Protein in Human Pregnancy:
Evidence for Leptin Resistance. The Journal of Clinical Endocrinology and
Metabolism, 2013. 98(1): p. 264-271.
188. Mistry, A.M. and D. Romsos, Intracerebroventricular leptin administration
reduces food intake in pregnant and lactating mice. Vol. 227. 2002. 616-619.

108
189. Gavrilova, O., et al., Hyperleptinemia of pregnancy associated with the
appearance of a circulating form of the leptin receptor. J Biol Chem, 1997.
272(48): p. 30546-51.
190. Seeber, R.M., J.T. Smith, and B.J. Waddell, Plasma leptin-binding activity and
hypothalamic leptin receptor expression during pregnancy and lactation in the
rat. Biol Reprod, 2002. 66(6): p. 1762-7.
191. Ladyman, S.R. and D.R. Grattan, Region-specific reduction in leptin-induced
phosphorylation of signal transducer and activator of transcription-3 (STAT3) in
the rat hypothalamus is associated with leptin resistance during pregnancy.
Endocrinology, 2004. 145(8): p. 3704-11.
192. Ladyman, S.R., D.M. Fieldwick, and D.R. Grattan, Suppression of leptin-induced
hypothalamic JAK/STAT signalling and feeding response during pregnancy in the
mouse. Reproduction, 2012. 144(1): p. 83-90.
193. Fusch, C., et al., Fetal and maternal leptin production in the dually in vitro
perfused human placenta. Pediatr Res, 1999. 45(6): p. 898-898.
194. Yamashita, H., et al., Leptin Administration Prevents Spontaneous Gestational
Diabetes in Heterozygous Leprdb/+ Mice: Effects on Placental Leptin and Fetal
Growth*. Endocrinology, 2001. 142(7): p. 2888-2897.
195. Henson, M.C., K.F. Swan, and J.S. O'Neil, Expression of placental leptin and
leptin receptor transcripts in early pregnancy and at term. Obstet Gynecol, 1998.
92(6): p. 1020-8.
196. Hoggard, N., et al., Ontogeny of the expression of leptin and its receptor in the
murine fetus and placenta. Br J Nutr, 2000. 83(3): p. 317-26.

109
197. Ategbo, J.M., et al., Modulation of adipokines and cytokines in gestational
diabetes and macrosomia. J Clin Endocrinol Metab, 2006. 91(10): p. 4137-43.
198. Soheilykhah, S., et al., Maternal serum leptin concentration in gestational
diabetes. Taiwan J Obstet Gynecol, 2011. 50(2): p. 149-53.
199. de Luca, C., et al., Complete rescue of obesity, diabetes, and infertility in db/db
mice by neuron-specific LEPR-B transgenes. The Journal of Clinical
Investigation, 2005. 115(12): p. 3484-3493.
200. Ishizuka, T., et al., Effects of overexpression of human GLUT4 gene on maternal
diabetes and fetal growth in spontaneous gestational diabetic C57BLKS/J
Lepr(db/+) mice. Diabetes, 1999. 48(5): p. 1061-1069.
201. Plows, J.F., et al., Absence of a gestational diabetes phenotype in the LepRdb/+
mouse is independent of control strain, diet, misty allele, or parity. Sci Rep, 2017.
7: p. 45130.
202. Soheilykhah, S., et al., Maternal serum leptin concentration in gestational
diabetes. Taiwanese Journal of Obstetrics and Gynecology, 2011. 50(2): p. 149-
153.
203. Makarova, E.N., et al., Influence of abnormally high leptin levels during
pregnancy on metabolic phenotypes in progeny mice. American Journal of
Physiology - Regulatory, Integrative and Comparative Physiology, 2013. 305(11):
p. R1268-R1280.
204. Pollock, K.E., et al., Hyperleptinemia during pregnancy decreases adult weight of
offspring and is associated with increased offspring locomotor activity in mice.
Endocrinology, 2015: p. en20151247.

110
205. Stocker, C., et al., Modulation of susceptibility to weight gain and insulin
resistance in low birthweight rats by treatment of their mothers with leptin during
pregnancy and lactation. Int J Obes Relat Metab Disord, 2004. 28(1): p. 129-36.
206. Stocker, C.J. and M.A. Cawthorne, The influence of leptin on early life
programming of obesity. Trends Biotechnol, 2008. 26(10): p. 545-51.
207. Diagnosis and classification of diabetes mellitus. Diabetes Care, 2006. 29 Suppl
1: p. S43-8.
208. England, L., et al., Estimating the Recurrence Rate of Gestational Diabetes
Mellitus (GDM) in Massachusetts 1998-2007: Methods and Findings. Matern
Child Health J, 2015.
209. Wielandt, H.B., et al., High risk of neonatal complications in children of mothers
with gestational diabetes mellitus in their first pregnancy. Dan Med J, 2015.
62(6).
210. Folic, N., et al., Risk factors for the development of metabolic syndrome in obese
children and adolescents. Srp Arh Celok Lek, 2015. 143(3-4): p. 146-52.
211. Silverman, B.L., et al., Long-term prospective evaluation of offspring of diabetic
mothers. Diabetes, 1991. 40 Suppl 2: p. 121-5.
212. Pettitt, D.J., et al., Diabetes and Obesity in the Offspring of Pima Indian Women
With Diabetes During Pregnancy. Diabetes Care, 1993. 16(1): p. 310-314.
213. Silverman, B.L., et al., Impaired glucose tolerance in adolescent offspring of
diabetic mothers. Relationship to fetal hyperinsulinism. Diabetes Care, 1995.
18(5): p. 611-7.

111
214. Dabelea, D. and D.J. Pettitt, Intrauterine diabetic environment confers risks for
type 2 diabetes mellitus and obesity in the offspring, in addition to genetic
susceptibility. J Pediatr Endocrinol Metab, 2001. 14(8): p. 1085-91.
215. Clausen, T.D., et al., High Prevalence of Type 2 Diabetes and Pre-Diabetes in
Adult Offspring of Women With Gestational Diabetes Mellitus or Type 1
Diabetes: The role of intrauterine hyperglycemia. Diabetes Care, 2008. 31(2): p.
340-346.
216. Dabelea, D., et al., Association of Intrauterine Exposure to Maternal Diabetes
and Obesity With Type 2 Diabetes in Youth: The SEARCH Case-Control Study.
Diabetes Care, 2008. 31(7): p. 1422-1426.
217. Keely, E. and L.A. Barbour, Management of Diabetes in Pregnancy, in Endotext,
L.J. De Groot, et al., Editors. 2000, MDText.com, Inc.: South Dartmouth (MA).
218. Liu, Z.J., et al., [Maternal plasma leptin levels and their relationship to insulin
and glucose in pregnant women with gestational diabetes mellitus and gestational
impaired glucose tolerance]. Zhonghua Fu Chan Ke Za Zhi, 2003. 38(5): p. 261-
3.
219. Al Maskari, M.Y. and A.A. Alnaqdy, Correlation between Serum Leptin Levels,
Body Mass Index and Obesity in Omanis. Sultan Qaboos University Medical
Journal, 2006. 6(2): p. 27-31.
220. Brito, N., et al., Metabolic factors in obesity. J Pediatr Endocrinol Metab, 2010.
23(1-2): p. 97-100.

112
221. Lee, J.H., D.R. Reed, and R.A. Price, Leptin resistance is associated with extreme
obesity and aggregates in families. Int J Obes Relat Metab Disord, 2001. 25(10):
p. 1471-3.
222. Sivitz, W.I., et al., Effects of leptin on insulin sensitivity in normal rats.
Endocrinology, 1997. 138(8): p. 3395-401.
223. Muzzin, P., et al., Correction of obesity and diabetes in genetically obese mice by
leptin gene therapy. Proc Natl Acad Sci U S A, 1996. 93(25): p. 14804-8.
224. Considine, R.V., et al., Serum immunoreactive-leptin concentrations in normal-
weight and obese humans. N Engl J Med, 1996. 334(5): p. 292-5.
225. MUZUMDAR, R., et al., Physiologic effect of leptin on insulin secretion is
mediated mainly through central mechanisms. The FASEB Journal, 2003. 17(9):
p. 1130-1132.
226. McMillen, I.C. and J.S. Robinson, Developmental origins of the metabolic
syndrome: prediction, plasticity, and programming. Physiol Rev, 2005. 85(2): p.
571-633.
227. Briffa, J.F., et al., Leptin in pregnancy and development: a contributor to
adulthood disease? Am J Physiol Endocrinol Metab, 2015. 308(5): p. E335-50.
228. Makarova, E.N., M.S. Syracheva, and N.M. Bazhan, [The influence of
hyperleptinemia during pregnancy on fetal weight and obesity development in
progeny mice with agouti yellow mutation]. Ross Fiziol Zh Im I M Sechenova,
2014. 100(3): p. 370-9.
229. Udagawa, J., et al., The role of leptin in the development of the cerebral cortex in
mouse embryos. Endocrinology, 2006. 147(2): p. 647-58.

113
230. Linnemann, K., et al., Leptin production and release in the dually in vitro
perfused human placenta. J Clin Endocrinol Metab, 2000. 85(11): p. 4298-301.
231. Makarova, E.N., et al., Influence of abnormally high leptin levels during
pregnancy on metabolic phenotypes in progeny mice. Am J Physiol Regul Integr
Comp Physiol, 2013. 305(11): p. R1268-80.
232. Gregorio, B.M., et al., Maternal high-fat intake predisposes nonalcoholic fatty
liver disease in C57BL/6 offspring. Am J Obstet Gynecol, 2010. 203(5): p. 495
e1-8.
233. Pennington, K.A., et al., Effect of food restriction and leptin supplementation on
fetal programming in mice. Endocrinology, 2012. 153(9): p. 4556-67.
234. Shimomura, I., Y. Bashmakov, and J.D. Horton, Increased levels of nuclear
SREBP-1c associated with fatty livers in two mouse models of diabetes mellitus. J
Biol Chem, 1999. 274(42): p. 30028-32.
235. Koonen, D.P., et al., Increased hepatic CD36 expression contributes to
dyslipidemia associated with diet-induced obesity. Diabetes, 2007. 56(12): p.
2863-71.
236. Lemoine, M., et al., Altered hepatic expression of SREBP-1 and PPARgamma is
associated with liver injury in insulin-resistant lipodystrophic HIV-infected
patients. AIDS, 2006. 20(3): p. 387-95.
237. Anderson, N. and J. Borlak, Molecular mechanisms and therapeutic targets in
steatosis and steatohepatitis. Pharmacol Rev, 2008. 60(3): p. 311-57.
238. Greco, D., et al., Gene expression in human NAFLD. Am J Physiol Gastrointest
Liver Physiol, 2008. 294(5): p. G1281-7.

114
239. Zhang, J., et al., High-unsaturated-fat, high-protein, and low-carbohydrate diet
during pregnancy and lactation modulates hepatic lipid metabolism in female
adult offspring. Am J Physiol Regul Integr Comp Physiol, 2005. 288(1): p. R112-
8.
240. Bruce, K.D., et al., Maternal high-fat feeding primes steatohepatitis in adult mice
offspring, involving mitochondrial dysfunction and altered lipogenesis gene
expression. Hepatology, 2009. 50(6): p. 1796-808.
241. Hyatt, M.A., et al., Suboptimal maternal nutrition, during early fetal liver
development, promotes lipid accumulation in the liver of obese offspring.
Reproduction, 2011. 141(1): p. 119-26.
242. Chen, H., et al., Evidence that the diabetes gene encodes the leptin receptor:
identification of a mutation in the leptin receptor gene in db/db mice. Cell, 1996.
84(3): p. 491-5.
243. Harper, J.L., et al., Placental changes caused by food restriction during early
pregnancy in mice are reversible. Reproduction, 2015.
244. Livak, K.J. and T.D. Schmittgen, Analysis of relative gene expression data using
real-time quantitative PCR and the 2(-Delta Delta C(T)) Method. Methods, 2001.
25(4): p. 402-8.
245. Pennington, K.A., et al., Effect of Food Restriction and Leptin Supplementation
on Fetal Programming in Mice. Endocrinology, 2012. 153(9): p. 4556-4567.
246. Folch, J., M. Lees, and G.H.S. Stanley, A SIMPLE METHOD FOR THE
ISOLATION AND PURIFICATION OF TOTAL LIPIDES FROM ANIMAL
TISSUES. Journal of Biological Chemistry, 1957. 226(1): p. 497-509.

115
247. Penney, D.P., et al., Analysis and testing of biological stains--the Biological Stain
Commission Procedures. Biotech Histochem, 2002. 77(5-6): p. 237-75.
248. Bush, N.C., et al., Higher Maternal Gestational Glucose Concentration Is
Associated with Lower Offspring Insulin Sensitivity and Altered β-Cell Function.
The Journal of Clinical Endocrinology and Metabolism, 2011. 96(5): p. E803-
E809.
249. Kelstrup, L., et al., Insulin Resistance and Impaired Pancreatic β-Cell Function in
Adult Offspring of Women With Diabetes in Pregnancy. The Journal of Clinical
Endocrinology & Metabolism, 2013. 98(9): p. 3793-3801.
250. Fischer, S., et al., Insulin-resistant patients with type 2 diabetes mellitus have
higher serum leptin levels independently of body fat mass. Acta Diabetol, 2002.
39(3): p. 105-10.
251. Persson, B., et al., Leptin concentrations in cord blood in normal newborn infants
and offspring of diabetic mothers. Horm Metab Res, 1999. 31(8): p. 467-71.
252. Leng, J., et al., GDM Women's Pre-Pregnancy Overweight/Obesity and
Gestational Weight Gain on Offspring Overweight Status. PLoS One, 2015.
10(6): p. e0129536.
253. Rial, E., et al., Lipotoxicity, fatty acid uncoupling and mitochondrial carrier
function. Biochim Biophys Acta, 2010. 1797(6-7): p. 800-6.
254. Martin, S.S., A. Qasim, and M.P. Reilly, Leptin Resistance: A Possible Interface
of Inflammation and Metabolism in Obesity-Related Cardiovascular Disease.
Journal of the American College of Cardiology, 2008. 52(15): p. 1201-1210.

116
255. Fruhbeck, G., et al., Lipolytic effect of in vivo leptin administration on adipocytes
of lean and ob/ob mice, but not db/db mice. Biochem Biophys Res Commun,
1998. 250(1): p. 99-102.
256. Shen, J., et al., In vivo effects of leptin on autonomic nerve activity and lipolysis in
rats. Neuroscience Letters, 2007. 416(2): p. 193-197.
257. Minokoshi, Y., et al., Leptin stimulates fatty-acid oxidation by activating AMP-
activated protein kinase. Nature, 2002. 415(6869): p. 339-43.
258. McMorrow, A.M., et al., Adipose tissue dysregulation and metabolic
consequences in childhood and adolescent obesity: potential impact of dietary fat
quality. Proceedings of the Nutrition Society, 2015. 74(01): p. 67-82.
259. Grant, R.W. and J.M. Stephens, Fat in flames: influence of cytokines and pattern
recognition receptors on adipocyte lipolysis. Am J Physiol Endocrinol Metab,
2015. 309(3): p. E205-13.
260. Miquilena-Colina, M.E., et al., Hepatic fatty acid translocase CD36 upregulation
is associated with insulin resistance, hyperinsulinaemia and increased steatosis in
non-alcoholic steatohepatitis and chronic hepatitis C. Gut, 2011. 60(10): p. 1394-
402.
261. Stocker, C.J., et al., Prevention of diet-induced obesity and impaired glucose
tolerance in rats following administration of leptin to their mothers. Am J Physiol
Regul Integr Comp Physiol, 2007. 292(5): p. R1810-8.
262. Vickers, M.H., Developmental programming of the metabolic syndrome - critical
windows for intervention. World J Diabetes, 2011. 2(9): p. 137-48.

117
263. Ellis, P.J., et al., Thrifty metabolic programming in rats is induced by both
maternal undernutrition and postnatal leptin treatment, but masked in the
presence of both: implications for models of developmental programming. BMC
Genomics, 2014. 15: p. 49.
264. Bouret, S.G., et al., Distinct roles for specific leptin receptor signals in the
development of hypothalamic feeding circuits. J Neurosci, 2012. 32(4): p. 1244-
52.
265. Croizier, S., V. Prevot, and Sebastien G. Bouret, Leptin Controls Parasympathetic
Wiring of the Pancreas during Embryonic Life. Cell Reports.
266. Zhang, Y. and P.J. Scarpace, The role of leptin in leptin resistance and obesity.
Physiol Behav, 2006. 88(3): p. 249-56.
267. Balland, E. and M.A. Cowley, New insights in leptin resistance mechanisms in
mice. Front Neuroendocrinol, 2015. 39: p. 59-65.
268. Ladyman, S.R., Leptin resistance during pregnancy in the rat. J Neuroendocrinol,
2008. 20(2): p. 269-77.
269. Bao, W., et al., Adipokine levels during the first or early second trimester of
pregnancy and subsequent risk of gestational diabetes mellitus: A systematic
review. Metabolism, 2015. 64(6): p. 756-64.
270. Madarasz, E., et al., Abnormal glucose tolerance is associated with diminished
postload change in leptin levels in women. Diabetes Metab Res Rev, 2009. 25(7):
p. 632-8.

118
271. Tsai, P.J., J. Davis, and G. Bryant-Greenwood, Systemic and placental leptin and
its receptors in pregnancies associated with obesity. Reprod Sci, 2015. 22(2): p.
189-97.
272. Franco-Sena, A.B., et al., The effect of leptin concentrations and other maternal
characteristics on gestational weight gain is different according to pre-
gestational BMI: results from a prospective cohort. BJOG, 2015.
273. Guariguata, L., et al., Global estimates of the prevalence of hyperglycaemia in
pregnancy. Diabetes Research and Clinical Practice, 2014. 103(2): p. 176-185.
274. Innes, K.E. and J.H. Wimsatt, Pregnancy-induced hypertension and insulin
resistance: evidence for a connection. Acta Obstet Gynecol Scand, 1999. 78(4): p.
263-84.
275. Kock, K., et al., Diabetes mellitus and the risk of preterm birth with regard to the
risk of spontaneous preterm birth. J Matern Fetal Neonatal Med, 2010. 23(9): p.
1004-8.
276. Boerschmann, H., et al., Prevalence and Predictors of Overweight and Insulin
Resistance in Offspring of Mothers With Gestational Diabetes Mellitus. Diabetes
Care, 2010. 33(8): p. 1845-1849.
277. Clausen, T.D., et al., Overweight and the Metabolic Syndrome in Adult Offspring
of Women with Diet-Treated Gestational Diabetes Mellitus or Type 1 Diabetes.
The Journal of Clinical Endocrinology & Metabolism, 2009. 94(7): p. 2464-2470.
278. Franks, P.W., et al., Gestational glucose tolerance and risk of type 2 diabetes in
young Pima Indian offspring. Diabetes, 2006. 55(2): p. 460-5.

119
279. Dabelea, D., et al., Intrauterine exposure to diabetes conveys risks for type 2
diabetes and obesity: a study of discordant sibships. Diabetes, 2000. 49(12): p.
2208-11.
280. Pettitt , D.J., et al., Excessive Obesity in Offspring of Pima Indian Women with
Diabetes during Pregnancy. New England Journal of Medicine, 1983. 308(5): p.
242-245.
281. Crume, T.L., et al., The impact of in utero exposure to diabetes on childhood body
mass index growth trajectories: the EPOCH study. J Pediatr, 2011. 158(6): p.
941-6.
282. Gillman, M.W., et al., Maternal gestational diabetes, birth weight, and adolescent
obesity. Pediatrics, 2003. 111(3): p. e221-6.
283. Baptiste-Roberts, K., et al., Gestational Diabetes and Subsequent Growth
Patterns of Offspring: The National Collaborative Perinatal Project. Maternal
and child health journal, 2012. 16(1): p. 125-132.
284. Ashcroft, Frances M. and P. Rorsman, Diabetes Mellitus and the β Cell: The Last
Ten Years. Cell, 2012. 148(6): p. 1160-1171.
285. Catalano, P.M., Obesity and pregnancy--the propagation of a viscous cycle? J
Clin Endocrinol Metab, 2003. 88(8): p. 3505-6.
286. de Boo, H.A. and J.E. Harding, The developmental origins of adult disease
(Barker) hypothesis. Aust N Z J Obstet Gynaecol, 2006. 46(1): p. 4-14.
287. Aris, I.M., et al., Associations of gestational glycemia and prepregnancy adiposity
with offspring growth and adiposity in an Asian population. The American
Journal of Clinical Nutrition, 2015. 102(5): p. 1104-1112.

120
288. Schaefer-Graf, U.M., et al., Association of breast-feeding and early childhood
overweight in children from mothers with gestational diabetes mellitus. Diabetes
Care, 2006. 29(5): p. 1105-7.
289. Lawrence, J.M., et al., Trends in the Prevalence of Preexisting Diabetes and
Gestational Diabetes Mellitus Among a Racially/Ethnically Diverse Population of
Pregnant Women, 1999–2005. Diabetes Care, 2008. 31(5): p. 899-904.
290. Qiu, X.H., et al., Maternal diabetes impairs the initiation of meiosis in murine
female germ cells. Mol Med Rep, 2017.
291. Moley, K.H., et al., Hyperglycemia induces apoptosis in pre-implantation
embryos through cell death effector pathways. Nat Med, 1998. 4(12): p. 1421-4.
292. Salbaum, J.M. and C. Kappen, Neural tube defect genes and maternal diabetes
during pregnancy. Birth Defects Res A Clin Mol Teratol, 2010. 88(8): p. 601-11.
293. Buckley, A.J., et al., Altered body composition and metabolism in the male
offspring of high fat–fed rats. Metabolism, 2005. 54(4): p. 500-507.
294. Silverman, B.L., et al., Long-term effects of the intrauterine environment. The
Northwestern University Diabetes in Pregnancy Center. Diabetes Care, 1998. 21
Suppl 2: p. B142-9.
295. Portha, B., et al., Diabetogenic effect of streptozotocin in the rat during the
perinatal period. Diabetes, 1974. 23(11): p. 889-95.
296. Caluwaerts, S., et al., Is low-dose streptozotocin in rats an adequate model for
gestational diabetes mellitus? J Soc Gynecol Investig, 2003. 10(4): p. 216-21.
297. Kume, E., et al., Hepatic changes in the acute phase of streptozotocin (SZ)-
induced diabetes in mice. Exp Toxicol Pathol, 2004. 55(6): p. 467-80.

121
298. Aerts, L., K. Holemans, and F.A. Van Assche, Maternal diabetes during
pregnancy: Consequences for the offspring. Diabetes/Metabolism Reviews, 1990.
6(3): p. 147-167.
299. Heinze, E. and U. Vetter, Skeletal growth of fetuses from streptozotocin diabetic
rat mothers: in vivo and in vitro studies. Diabetologia, 1987. 30(2): p. 100-3.
300. Catalano, P.M., Trying to understand gestational diabetes. Diabet Med, 2014.
31(3): p. 273-81.
301. Talton, O.O., et al., Maternal Hyperleptinemia Improves Offspring Insulin
Sensitivity in Mice. Endocrinology, 2016. 157(7): p. 2636-48.
302. Uebel, K., et al., Effect of maternal obesity with and without gestational diabetes
on offspring subcutaneous and preperitoneal adipose tissue development from
birth up to year-1. BMC Pregnancy Childbirth, 2014. 14: p. 138.
303. el-Hashimy, M., et al., Factors modifying the risk of IDDM in offspring of an
IDDM parent. Diabetes, 1995. 44(3): p. 295-9.
304. Egan, A.M., et al., Epidemiology of gestational diabetes mellitus according to
IADPSG/WHO 2013 criteria among obese pregnant women in Europe.
Diabetologia, 2017.
305. Standards of Medical Care in Diabetes—2007. Diabetes Care, 2007. 30(suppl 1):
p. S4-S41.
306. Moses, R.G., J. Moses, and W.S. Davis, Gestational diabetes: do lean young
caucasian women need to be tested? Diabetes Care, 1998. 21(11): p. 1803-6.

122
307. Maeda, N., et al., PPARgamma ligands increase expression and plasma
concentrations of adiponectin, an adipose-derived protein. Diabetes, 2001. 50(9):
p. 2094-9.
308. Farmer, S.R., Regulation of PPAR[gamma] activity during adipogenesis. Int J
Obes Relat Metab Disord, 2005. 29(S1): p. S13-S16.
309. Abella, A., et al., Cdk4 promotes adipogenesis through PPARgamma activation.
Cell Metab, 2005. 2(4): p. 239-49.
310. Maeda, N., et al., Diet-induced insulin resistance in mice lacking
adiponectin/ACRP30. Nat Med, 2002. 8(7): p. 731-7.
311. Yamauchi, T., et al., Adiponectin stimulates glucose utilization and fatty-acid
oxidation by activating AMP-activated protein kinase. Nat Med, 2002. 8(11): p.
1288-95.
312. Panarotto, D., et al., Insulin resistance affects the regulation of lipoprotein lipase
in the postprandial period and in an adipose tissue-specific manner. Eur J Clin
Invest, 2002. 32(2): p. 84-92.
313. Maggio, C.A. and M.R. Greenwood, Adipose tissue lipoprotein lipase (LPL) and
triglyceride uptake in zucker rats. Physiol Behav, 1982. 29(6): p. 1147-52.
314. Kahn, B.B. and S.W. Cushman, Subcellular translocation of glucose
transporters: Role in insulin action and its perturbation in altered metabolic
states. Diabetes/Metabolism Reviews, 1985. 1(3): p. 203-227.
315. Kahn, B.B. and J.S. Flier, Obesity and insulin resistance. Journal of Clinical
Investigation, 2000. 106(4): p. 473-481.
123
316. Hardy, O.T., M.P. Czech, and S. Corvera, What causes the insulin resistance
underlying obesity? Current opinion in endocrinology, diabetes, and obesity,
2012. 19(2): p. 81-87.
317. Qatanani, M. and M.A. Lazar, Mechanisms of obesity-associated insulin
resistance: many choices on the menu. Genes & Development, 2007. 21(12): p.
1443-1455.
318. Choe, S.S., et al., Adipose Tissue Remodeling: Its Role in Energy Metabolism and
Metabolic Disorders. Frontiers in Endocrinology, 2016. 7(30).
319. Lee, Y.S., et al., Inflammation is necessary for long-term but not short-term high-
fat diet-induced insulin resistance. Diabetes, 2011. 60(10): p. 2474-83.
320. Stephens, J.M., J. Lee, and P.F. Pilch, Tumor necrosis factor-alpha-induced
insulin resistance in 3T3-L1 adipocytes is accompanied by a loss of insulin
receptor substrate-1 and GLUT4 expression without a loss of insulin receptor-
mediated signal transduction. J Biol Chem, 1997. 272(2): p. 971-6.
321. Hennes, M.M.I., et al., Insulin-Resistant Lipolysis in Abdominally Obese
Hypertensive Individuals. Role of the Renin-Angiotensin System, 1996. 28(1): p.
120-126.
322. Chakrabarti, P., et al., Insulin inhibits lipolysis in adipocytes via the evolutionarily
conserved mTORC1-Egr1-ATGL-mediated pathway. Mol Cell Biol, 2013. 33(18):
p. 3659-66.
323. Berg, A.H., et al., The adipocyte-secreted protein Acrp30 enhances hepatic
insulin action. Nat Med, 2001. 7(8): p. 947-53.
124
324. Yamauchi, T., et al., Globular adiponectin protected ob/ob mice from diabetes
and ApoE-deficient mice from atherosclerosis. J Biol Chem, 2003. 278(4): p.
2461-8.
325. Franckhauser, S., et al., Adipose overexpression of phosphoenolpyruvate
carboxykinase leads to high susceptibility to diet-induced insulin resistance and
obesity. Diabetes, 2006. 55(2): p. 273-80.
326. Ballard, F.J., R.W. Hanson, and G.A. Leveille, Phosphoenolpyruvate
carboxykinase and the synthesis of glyceride-glycerol from pyruvate in adipose
tissue. J Biol Chem, 1967. 242(11): p. 2746-50.
327. Sims, E.A., Are there persons who are obese, but metabolically healthy?
Metabolism, 2001. 50(12): p. 1499-504.
328. Kloting, N., et al., Insulin-sensitive obesity. Am J Physiol Endocrinol Metab,
2010. 299(3): p. E506-15.
329. Sopasakis, V.R., et al., High local concentrations and effects on differentiation
implicate interleukin-6 as a paracrine regulator. Obes Res, 2004. 12(3): p. 454-
60.
330. Bambace, C., et al., Adiponectin gene expression and adipocyte diameter: a
comparison between epicardial and subcutaneous adipose tissue in men.
Cardiovasc Pathol, 2011. 20(5): p. e153-6.
331. Salans, L.B., J.L. Knittle, and J. Hirsch, The role of adipose cell size and adipose
tissue insulin sensitivity in the carbohydrate intolerance of human obesity. J Clin
Invest, 1968. 47(1): p. 153-65.

125
332. Spiegelman, B.M., et al., PPAR gamma and the control of adipogenesis.
Biochimie, 1997. 79(2-3): p. 111-2.
333. Kusminski, C.M., et al., MitoNEET-driven alterations in adipocyte mitochondrial
activity reveal a crucial adaptive process that preserves insulin sensitivity in
obesity. Nat Med, 2012. 18(10): p. 1539-1549.
334. Klöting, N., et al., Insulin-sensitive obesity. American Journal of Physiology -
Endocrinology And Metabolism, 2010. 299(3): p. E506-E515.
335. Gonçalves, C.G., M.J. Glade, and M.M. Meguid, Metabolically healthy obese
individuals: Key protective factors. Nutrition, 2016. 32(1): p. 14-20.
336. Konige, M., H. Wang, and C. Sztalryd, Role of adipose specific lipid droplet
proteins in maintaining whole body energy homeostasis. Biochimica et
Biophysica Acta (BBA) - Molecular Basis of Disease, 2014. 1842(3): p. 393-401.
337. Wernstedt Asterholm, I., et al., Adipocyte Inflammation Is Essential for Healthy
Adipose Tissue Expansion and Remodeling. Cell Metabolism. 20(1): p. 103-118.
338. de Luca, C., et al., Complete rescue of obesity, diabetes, and infertility in db/db
mice by neuron-specific LEPR-B transgenes. J Clin Invest, 2005. 115(12): p.
3484-93.
339. Vasselli, J.R., et al., Dietary Components in the Development of Leptin
Resistance. Advances in Nutrition, 2013. 4(2): p. 164-175.
340. Nivoit, P., et al., Established diet-induced obesity in female rats leads to offspring
hyperphagia, adiposity and insulin resistance. Diabetologia, 2009. 52(6): p. 1133-
42.

126

127
VITA
Omonseigho Owomare Talton is a Nigerian-Gambian, born on November 13th, 1990 in
Hull, U.K to Dr. Alfred and Dr. Pamela Esangbedo. She is married to Clay Dewayne
Talton Jr. of Monroe City, MO, with whom she has a daughter, Noelle Ayodele Talton.
Omonse attended Plateau Private School in Jos Nigeria, before moving to the Gambia,
where she attended Marina International School (MIS). She graduated from MIS with a
distinction in the IGSCE, and moved to the United States for University. She attended
Truman State University in Kirksville, MO, and graduated cum laude with a Bachelor of
Arts degree in Biology. Omonse's interest in research began in the summer of 2011, in
the laboratory of Dr. James Cox at A.T. Still University in Kirksville, MO. In August of
2012, Omonse began her graduate education in the Division of Biological Sciences at the
University of Missouri in Columbia, in the laboratory of Dr. Laura Schulz. Her graduate
research was on the effects of gestational diabetes on offspring metabolism. Following
graduate school, Omonse will begin a research post-doc and teach Cell Biology at the
University of Missouri.


