
V
PREDICTION OF PRESSURE DROP
OF SLUG FLOW IN VERTICAL PIPES USING MECHANISTIC MODEL
MOHAMAD FAKHROL RADZI B.ZULKELI
Thesis submitted in partial fulfilment of the requirements
for the award of the degree of
Bachelor of Chemical Engineering (Gas Technology)

VI
Faculty of Chemical & Natural Resources Engineering
UNIVERSITI MALAYSIA PAHANG
JANUARY 2014
©MOHAMAD FAKHROL RADZI B.ZULKEFLI (2014)

X
ABSTRACT
Due to the variability of flow pattern of gas liquid two-phase flow and complexity of flow
mechanism,it is very difficult to seek a single model which is able to predict pressure drop
and fit for any flow condition. when the existing model of two-phase flow pressure drop is
used to predict the pressure of the conditions of producing gas well,a large error
occurs.Therefore, it is necessary,based on the experimental data of gas-water two phase
flow,to research the flow mechanism and discover the regular existing in the process of fluid
property changing .On the basis of the current two-phase flow pressure drop model, it is
important to explore modified pressure loss model applicable for producing gas well with
water,to improve predictability of the pressure drop of gas wells,and to provide the theory and
technology guidence for development of gas reservoir with water.
Underbalanced drilling (UBD) has increased in recent years because of the many advantages
associated with it. These include increase in the rate of penetration and reduction of lost
circulation and formation damage. Drilling of deviated and horizontal wells also increased
since recovery can be improved from a horizontal or a deviated well. The drilling of deviated
wells using UBD method will reduce several drilling related problems such as hole cleaning
and formation damage. Prediction of flow and pressure profiles while drilling underbalanced
in such wells will help in designing and planning of the well. The aim of this research is to
predict the pressure drop of slug flow in the certain pressure in vertical pipes using
mechanistic model and to study the behavior of the flow profile in the drillstring and the
annulus under UBD conditions through the use of mechanistic two phase flow models.
Mechanistic two phase flow models is been used In this research to predict the liquid hold
up for phase gas- liquid slug flow which is important for the accurate calculations of the
pressure drop.In particular, its evaluation is important for the vertical pipes since the liquid
hold up in the slug body is the main contributor to the hydrostatic pressure drop which quite
significant for the verticals flows. Further development of mechanistic models has allowed
accurate prediction of wellbore pressure. Many Underbalanced Drilling operations require
the use of nitrified diesel as the drilling fluid.Thus two phase flow will exist both in the drill
pipe and the annulus.

XI
ABSTRAK
Oleh kerana kepelbagaian dalam corak aliran gas-cecair aliran dua fasa dan kerumitan
mekanisme aliran, ia adalah amat sukar untuk mendapatkan model tunggal yang mampu
meramalkan kejatuhan tekanan dan sesuai untuk sebarang keadaan aliran. apabila model yang
sedia ada dua fasa kejatuhan tekanan aliran digunakan untuk meramalkan tekanan dengan
syarat-syarat dan keadaan untuk mengeluarkan gas dengan baik, kesilapan yang besar
berlaku. Oleh itu, adalah perlu berdasarkan data eksperimen gas-cecair aliran dua fasa, dengan
penyelidikan mekanisme aliran dan penemuan yang sedia ada dalam proses perubahan sifat
bendalir. Berdasarkan dua fasa mod kejatuhan tekanan aliran semasa, ia adalah penting untuk
pengubahsuaian model kehilangan tekanan yang diguna pakai untuk telaga gas yang
mengandungi air, untuk meningkatkan ketepatan ramalan penurunan tekanan telaga gas, dan
untuk menyediakan teori dan teknologi untuk pembangunan takungan telaga gas yang
mengandungi air.
Penggerudian Underbalanced (UBD) telah meningkat sejak kebelakangan ini kerana banyak
kelebihan yang berkaitan. Ini termasuk peningkatan dalam kadar penembusan dan
pengurangan kehilangan edaran dan kerosakan formasi. Penggerudian telaga terpesong dan
mendatar juga meningkat kerana proses pemulihan juga boleh diperbaiki dari melintang atau
menyimpang. Penggerudian telaga lencongan menggunakan kaedah UBD akan
mengurangkan beberapa masalah penggerudian yang berkaitan seperti pembersihan lubang
dan kerosakan formasi. Ramalan aliran dan tekanan profil semasa penggerudian
underbalanced dalam telaga seumpama itu akan membantu dalam mereka bentuk dan
perancangan telaga. Tujuan kajian ini adalah untuk meramalkan kejatuhan tekanan aliran
lumpur dalam tekanan tertentu di dalam paip yang menegak menggunakan model mekanistik
dan untuk mengkaji kelakuan profil aliran di drillstring dan anulus dalam keadaan UBD
melalui penggunaan mekanistik aliran dua fasa model.
Mekanistik dua model aliran fasa telah digunakan dalam kajian ini untuk meramalkan cecair
tahan untuk fasa gas-cecair di dalam aliran lumpur yang penting untuk pengiraan penurunan
tekanan yang tepat. Secara khususnya, penilaian ini adalah penting bagi paip yang menegak
kerana cecair tahan di dalam aliran lumpur adalah penyumbang utama kepada kejatuhan
tekanan hidrostatik yang agak ketara untuk aliran menegak. Pembangunan model mekanistik
telah membenarkan ramalan yang tepat tekanan lubang telaga. Banyak operasi Penggerudian
Underbalanced memerlukan penggunaan diesel nitrified sebagai cecair penggerudian. maka
dua aliran fasa akan wujud kedua-dua di dalam paip gerudi dan anulus.

XII
TABLE OF CONTENTS
SUPERVISOR’S DECLARATION................................................................................ VII
STUDENT’S DECLARATION........................................................................................
VIII
ACKNOWLEDGEMENT..................................................................................................VI
ABSTRACT..................................................................................................................... VII
ABSTRAK.......................................................................................................................VIII
Table of Content...............................................................................................................IX
List of Figures.....................................................................................................................X
List of Table......................................................................................................................XI
List of Abbrevations........................................................................................................XII
1.0 INTRODUCTION
1.0 Introduction.............................................................................................................1
1.1 Underbalanced Drilling.............................................................................................2
1.2 Research Objective and Scope of Study.................................................................3
2.0 LITERATURE REVIEW
2.1 Introduction ..............................................................................................................4
2.2 Multiphase Flow Concept..........................................................................................5
2.3 Flow Pattern Prediction Models...............................................................................10
2.4 Bit Model..................................................................................................................21
3.0 METHODOLOGY
3.1 Computer Program Description................................................................................22
3.2 Algorithm Step.........................................................................................................24
4.0 RESULTS AND DISCUSSION
4.1 Results......................................................................................................................27
4.2 Discussion.................................................................................................................28
5.0 CONCLUSION ...........................................................................................................32
REFERENCES.................................................................................................................33
APPENDICES...................................................................................................................34

XIII
LIST OF FIGURES
Figure 2-1: Different flow patterns in Two Phase flow………………………................ 7
Figure 2.2: Flow Pattern Map for Downward Two Phase Flow in Pipes
(After Taitel et al.)…………………………………………………………..
9
Figure 2.3: Flow Patter Map for Upward Two Phase Flow in Annulus
(AfterCaetano.et al.).......................................................................................
9
Figure 3.1 Incrimental wellbore calculations path in a deviated wellbore...................... 23
Figure 3.2 Discretized wellbore and calculation path...................................................... 24
Figure 3.3 Flowchart for the Computer Algorithm used in the Mechanistic
Steady State Model.......................................................................................
26
Figure 4.1 Comparison between Field Measurements and Simulators
Output at Both Runs.......................................................................................
28
Figure 4.2 Simulation Results (HL, ΔP/ΔL) vs Depth.................................................... 28

XIV
LIST OF TABLES
Table 2.1: Flow Coefficients for Different Inclination Angle Ranges (After Alves)..............10
Table 4.2 : Drillstring and Annular Geometries at the Two Simulated Depths.......................27
Table 4.2 : Computer Program Input.......................................................................................28
Table 4.3 : Comparison of Absolute Average Error for the Two Simulation Runs................28
A.1:Constants Used in Drunchak and Abu-Kassem Correlation.............................................30

XV
LIST OF ABBREVIATIONS
(
)
Acceleration pressure gradient, (psi/ft)
(
)
Elevation pressure gradient, (psi/ft)
(
)
Frictional pressure gradient, (psi/ft)
(
)
Total pressure gradient, (psi/ft)
Liquid area in pipe element (m2,in2)
Bit nozzle area (m2,in2)
Pipe element area, (m2,in2)
Velocity profile coefficient for slug flow
Velocity profile coefficient for bubbly flow
De Equivalent pipe diameter, (m/in)
Equi-periphery diameter, (m/in)
Hydraulic diameter, (m/in)
Absolute average relative error
Fanning friction factor
Interfacial shear friction factor for annular flow
Mixture friction factor
, , Geometry parameters in calculating fanning friction factor for bubbly
flow
Superficial core friction factor
Liquid holdup
Liquid holdup with swarm effect
Liquid Holdup in liquid slug zone
Liquid Holdup in a slug unit

XVI
Liquid Holdup in Taylor bubble in a slug flow
ID Inner diameter (m,in)
Liquid length in liquid slug zone
Length of slug unit
Slug length in Taylor bubble in a slug
Mg Gas molecular weight
Reynolds Number
Mixture Reynolds number
Superficial gas Reynolds number
Superficial liquid Reynolds number
OD Outer diameter (m,in)
Bottom hole pressure (Pa,psi)
Calculated Pressure (Pa,psi)
Measured Pressure (Pa,psi)
Upstream pessure (Pa,psi)
Gas flow rate (scf/m)
Liquid flow rate, (m3/s, gpm)
R Universal Gas constant = 10.731 psia.ft3/lbm.mol.°R
T Temperature (°K,°R)
Gas weighing factor
Z Gas compressibility factor
β Relative bubble length parameter in a slug flow
δ Liquid film thickness in flow model(m,ft)
No slip liquid holdup
Gas viscosity, (Pa.s, cp)
Liquid viscosity, (Pa.s, cp)

XVII
Mixture viscosity, (Pa.s, cp)
θ Inclination angle from horizontal
Gas density, (kg/m3,ppg)
Liquid density (kg/m3,ppg)
Mixture density, (kg/m3,ppg)
Mixture density in liquid slug, (kg/m3,ppg)
Mixture density in Taylor bubble in a slug, (kg/m3,ppg)
Discrete gas bubble rise velocity, (m/s,ft/s)
Gas velocity, (m/s,ft/s)
Liquid velocity, (m/s,ft/s)
Liquid velocity in liquid slug zone, (m/s,ft/s)
Taylor bubble velocity in a slug, (m/s,ft/s)
Nozzle velocity, (m/s,ft/s)
Superficial gas velocity (m/s,ft/s)
Superficial liquid velocity (m/s,ft/s)
Taylor bubble rise velocity, (m/s,ft/s)

XVIII
Acknowledgement
Praise is to God for His help and guidance that finally I’ll able to complete this
Undergreduated Research Project 2 (URP 2) as one of my requirement to complete my study.
First and foremost I would like to extend my deepest gratitude to all the parties involved in
this research. First of all, a special thank to my supervisor Mr. Mohamad Noor Ariffin and Dr.
Sunarti for his willingness in overseeing the progress of my research work from its initial
phases till the completion of it. I do believe that all his advices and comments are for the
benefit of producing the best research work.
To all my friends especially my best friend and all my course mates, thank you for believing
in me and helping me to go through the difficult time. The experiences and knowledge I
gained throughout the process of completing this final project would prove invaluable to
better equip me for the challenges which lie ahead. Last but definitely not least to my family
members, I can never thank you enough for your love, and for supporting me throughout my
studies in University Malaysia Pahang.

1
Chapter 1
Introduction
The Simultaneous flow of oil, gas and water in vertical pipe is encountered in many
engineering installations.In petroleum,chemical process,nuclear engineering and many other
chemical industries especially in tubing systems,heat exchange equipments and chemical
reactor. The problems associated with simultaneous flow of two or more phases through
vertical pipe have been of concern for a long time, (Olufemi et al.,2008).
Over the years,accurate prediction of pressure drop has been of vital importances in vertical
multiphase flowing oil wells in order to design an effective production string and optimum
production strategy selection.various scienctist and reserachers heve proposed correlations
and mechanistic models for this purpose since 1950, most of which widely used in the
industry.But even with recent improvements in pressure prediction techniques,most of the
models fail to provide the desired accuracy of pressure drop,and further improvement is still
needed.
Multiphase flow characteristics such as liquid hold up, mixture density, and flow patterns are
predict by using Mechanistic models,where the modelling are know as semi-empirical
models.These mechanistic models were generated based on sound theoritical approach,to
outperform the existing empirical correlations.The most of these mechanistic models are
those of (Ansari et al.,1994)
Slug flow is one of the basic flow patterns that characterize the gas–liquid flow in vertical
pipes. It occurs over a wide range of gas and liquid flow rates. The most important
characteristic of slug flow is its intermittent nature, which is due to a unique phase
distribution. In view of the above phase distribution, the pressure and liquid holdup vary
periodically at any given pipe cross-section. In vertical flow, the liquid hold up in the slug for
prediction and accurate calculation of the pressure drop, the prediction of the liquid hold body
is the main factor which contributes to the pressure drop in the piping system.

2
1.2 Underbalanced Drilling
Underbalanced Drilling (UBD) is the drilling process in which the circulating fluid
bottomhole pressure is maintained below the formation flowing pressure. UBD can be
achieved by injecting lightened drilling fluid such as gas, mist, foam, and diesel, which will
create such low pressure in order not to overcome the formation pressure Many benefits are
gained from using UBD operations, such as:
• Increase rate of penetration and bit life
• Minimization or elimination of differential sticking
• Minimization of lost circulation
• Reduced formation damage
• Increased well productivity
In addition, UBD operations have increased in recent years due to the following:
• Depleted reservoirs
• Awareness of skin damage
• Elimination of lost circulation
• Cost of differential sticking
• Environmental benefits
UBD techniques can be categorized into two major categories based on the fluid used, which
are:
• Gaseous drilling fluid
• Gasified liquid and liquid drilling fluids
During UBD operations, a complex fluid system occurs both inside the drillstring
and the annulus. Two phase flow prediction techniques are used to predict several parameters
such as pressure drops (both inside the drillstring and through the annulus), flow patterns,
velocities, liquid holdup, and other parameters. In order to achieve this, mechanistic two
phase flow models are used.

3
1.3 Research Objective
The objective of this research are :
To predict the pressure drop of slug flow vertical pipes using mechanistic model.
To predict the behavior of the flow in the certain pressure in the vertical pipes.
1.4 Research scope
The research scope that will comply to achieve the research objectives are divided into
two stages :
Study of mechanistic steady state model using Excel Visual Basic Application (VBA)
and FORTRAN 95 computer program.
To study and predict the pressure drop in vertical pipes and the behaviour of the flow.

4
CHAPTER 2
LITERATURE REVIEW
2.1 Introduction
In recent years, mechanistic models were developed based on phenomenological
approach which mass and energy conservation is been takes account. The early mechanistic
model for the vertical flows, Fernandes et al.(1983) developed the semi mechanistic model to
predict the liquid hold up in the slug flow body. Sylvester et. al. (1987) modified semi
mechanistic for slug flow model by Fernandes, where the new correlation for the liquid
holdup is been introduced.
Hasan and Kabir et al.(1992) developed a model for predicting the two phase flow in annuli
upward simultaneous two phase flow In UBD operations, pressure along the wellbore length
is affected by the gas and liquid injection flow rate, the flow pattern distribution and the back
pressure at the wellhead. With the larger well depth, temperature and pressure in annulus
increases constantly which results in the varying gas and liquid superficial velocity and gas
void fraction which determines flow pattern distribution and pressure.
Ansari et al.(1994) presented the model for upward vertical two phase flow in pipes. Ansari’s
model improved prediction accuracy of slug flow by considering two possible conditions of
slug flow, the fully developed Taylor bubble slug flow and the developing Taylor bubble slug
flow.
Bijleveld et al.(1996) developed the first steady state computer program by using the
mechanisitic approach,by using trial and errors to calculate the bottom hole pressure and two
phase flow parameters. pattern of flow is being assumed, for the purposed of get an
accurately prediction of the differences in flow parameters such as rise velocity of gas
bubbles in liquid columns, flow pattern and liquid holdup.

5
Gomez et al.(1999) developed a comprehensive mechanistic model for predicting the flow
parameters in deviated wells. Lage et al.(2000) developed a mechanistic model for predicting
upward two phase flow in concentric annulus.
2.2 Multiphase Flow Concept
Multiphase flow is a generalisation modelling used in two phase flow where the two
phase are not chemically related or where two or more phase are present. The most
distinguished aspect of such flow during the simultaneous flow of gas and liquid, is the
inconsistency of the distribution of both phases in the vertical pipes.the term flow pattern is
used to distinguish such distribution,which depends on the relative magnitude of forces acting
on the fluids, Brown et al. (1986).The following terms are defined in order to assist in the
multiphase flow calculations.
2.2.1 Liquid Holdup
Liquid holdup ( HL) is defined as the fraction of a pipe cross-section or volume that is
occupied by the liquid phase,Beggs et al. (1991).The value of HL ranges from 0(total gas) to
1(total liquid).The prediction of liquid Holdup in the slug flow body for two phase gas-liquid
slug flow is important for the accurate calculations of the pressure drop.The liquid holdup is
defined by
HL = AL/AP 2.1
AL = pipe area of the liquid occupied by the liquid phase
AP = Pipe cross-sectional area
The term void fraction or gas holdup is defined as the volume fraction occupied by the gas
where
α =1− HL 2.2
α = gas void fraction

6
When two fluids travel at different velocities then the flow is referred to as a slip flow. No slip
flow occurs when the fluids travels at the same velocity, Hence the term no slip liquid holdup
can be defined as the ratio of the volume of liquid in a pipe element that would exist if the gas
and liquid traveled at the same velocity divided by the volume of the pipe element,Beggs et
al.(1991).
The no-slip liquid Holdup,λL is defined as follows:
2.3
L = No slip liquid holdup
qL = Liquid flow rate
qG = Gas flow rate
2.2.2 Superficial Velocity
Superficial velocity is the velocity that a phase would travel at if it flowed through the
total cross sectional area available for flow Beggs et al.(1991) Thus, the liquid and gas
superficial velocities are defined by :
VSL = QL /Ap 2.4
VSL = Superficial liquid velocity (m/s,ft/s)
Ap = Pipe element area, (m2,in2)
and
Vsg =QG / AP 2.5
Vsg = Superficial gas velocity (m/s,ft/s)
The mixture velocity can be defined as the velocity of the two phases together, as follow :
VM = (QL + QG ) / AP
= VSL + Vsg 2.6
The in-situ velocity is the actual velocity of the phase when the two phases travel together.
They can be defined as follows :

7
VL = VSL / HL 2.7
and
VG = Vsg / HG = Vsg / (1- HL ) 2.8
Weighting factor is introduced when water is exist because of the addition to the liquid
and gas,this factor is being used to take care of the slippage that could occur between different
liquid phases that exists during drilling(drilling fluid, produced oil and produced water). This
factor is defined as follows:
f ԛDF / ԛDF + ԛ + qw 2.9
where
ԛDF = is the drilling fluid flow rate,
ԛ = inflow oil flow rate, and
qw = is inflow water flowrate.
2.2.3 Two Phase flow pattern
Multiphase flow patterns highly depend on flow rates, pipes geometry, and the fluid
properties of the phases. The physical distribution of the phase that varies in the flow medium
creates several flow patterns. Furthermore, because of the various pressure and temperature in
the pipes it also can contribute to the change of the flow pattern. The major flow pattern that
exist in multiphase flow are dispersed bubble,bubble,slug,churn and annular as shown in
Figure 2.1.
Figure 2.1 Different flow patterns in Two Phase flow
Dispersed bubble flow Bubble flow Slug flow Churn flow Annular Flow

8
Dispersed bubble flow : This flow is characterized by gas being distributed in small
spherically shaped bubbles in continuous liquid phase.dispersed bubble occurs at low
gas flow rates and high liquid rates.in dispersed bubble flow,both phases flow at
nearly the same velocity.no slip is seen between the phases and the flow is essentially
homogenous.
Bubble flow : This flow characterized by a discontinuous gas phase which is
distributed at discrete bubble inside a continuos liquid phase.The discrete gas bubbles
tend to slightly deviate from spherical shape and exhibit slippage through the liquid
phase due to buoyancy forces.This patern occurs at low to medium superficial
velocites.
Slug flow : This flow is characterized by a series of slug units.each unit is composed
of Taylor Bubble and plugs of liquid called slugs. Charateristic bullet-shaped bubbles
often contains a dispersion of smaller bubbles.A film of liquid exist around the pocket
flowing downward relative to the gas bubble.The liquid slug carrying distributed small
gas bubbles, bridges the conduit and separates two consecutive gas bubbles.
Churn flow : This flow pattern exist in upward flow only.the shape of the Taylor
bubble and the liquid slugs are irregular and random.churn flow can be considered to
be a transition between bubbly flow and fully developed slug flow.its characteristics
oscillations is an important pattern which covering fairly wide range of gas flow rate,it
rgarded as a breaking uf of slug flow with occasional bridging across the tube by the
liquid phase at the lower end of the range.While at the higher range of gas flow rates it
may be considered a degenerate form of annular flow with the direction of the film
flow.
Annular flow : This flow of pattern is characterized by the axial continuity of gas
phase in the liquid flowing upward, both as a thin film along the pipe wall and as
dispersed droplets in the core. A small amount of liquid is entrained in the light
velocity core region. Annular flow occurs at high gas superficial velocities with
relatively little liquid present.
9
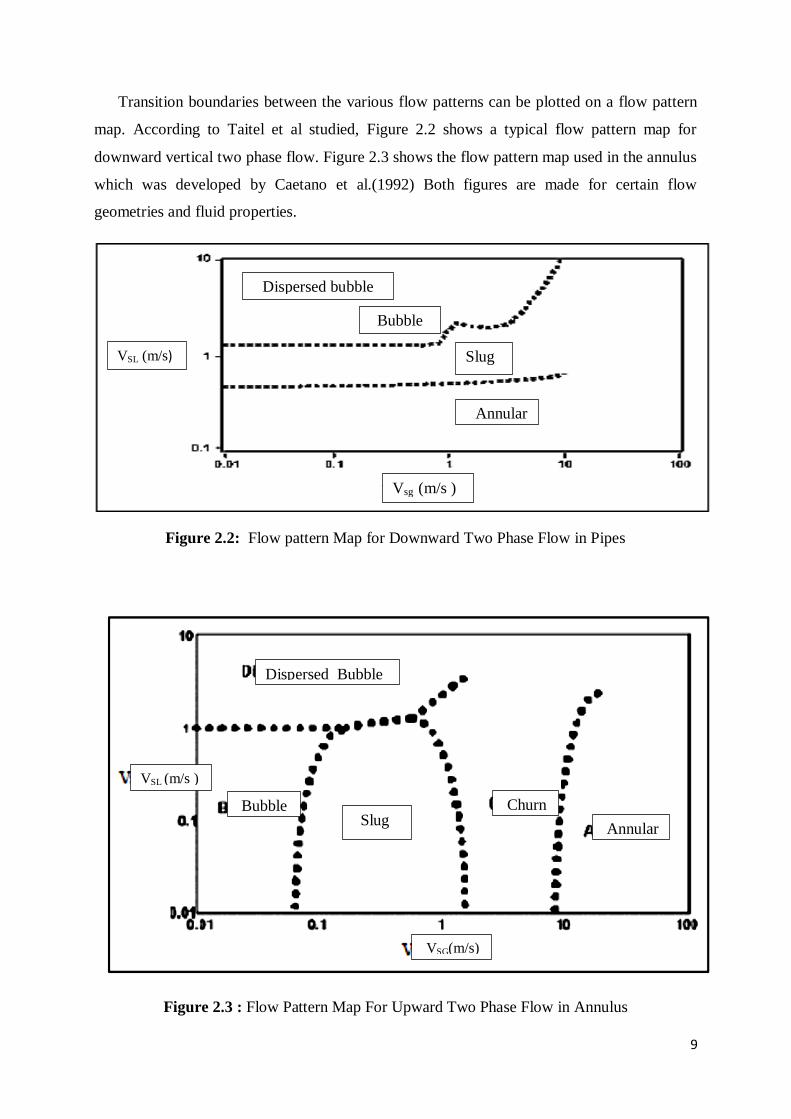
Transition boundaries between the various flow patterns can be plotted on a flow pattern
map. According to Taitel et al studied, Figure 2.2 shows a typical flow pattern map for
downward vertical two phase flow. Figure 2.3 shows the flow pattern map used in the annulus
which was developed by Caetano et al.(1992) Both figures are made for certain flow
geometries and fluid properties.
Figure 2.2: Flow pattern Map for Downward Two Phase Flow in Pipes
Figure 2.3 : Flow Pattern Map For Upward Two Phase Flow in Annulus
VSL (m/s)
Dispersed bubble
Bubble
Slug
Annular
Vsg (m/s )
Dispersed Bubble
Bubble Slug
Churn
Annular
VSG(m/s)
VSL (m/s )

10
2.3 Flow Pattern Prediction Models
2.3.1 Downward Flow through the Drillstring
2.3.1.1 Bubble to Slug Transition
The transition from bubbly to slug flow occurs because of the bubble resulting from
increased collision between bubbles at higher void fraction. In addition, Hasan stated that the
same void fraction used for upward flow could be used for the case of downward flow. Hasan
observed that this transition occurred at a void fraction of 0.25. Also, the rise velocity is
unaffected by pipe inclination angle and in deviated wells, the bubbles 14 prefer to flow near
the upper wall of the pipe, causing a higher local void fraction compared with the cross-
sectional average value. Hasan and Kabir derived an equation for bubble to slug transition
flow for upward flow in deviated wells. Hasan proposes the same equation for a downward
flow using a negative terminal rise velocity. Hasan proposed the following expression for
transition boundary between bubble and slug flow:
( ⁄ ) 2.10
Harmathy correlation is used to calculate the terminal rise velocity for upward flow in vertical
channels as follows:
[( )
]
2.11
The velocity profile coefficient (CO) has been defined by Zuber and Findlay due to the
effect of non-uniform flow and concentration distribution across the pipe and the effect of
local relative velocity between the two phases. Table 2.1 shows the values for the velocity
profile coefficientsfor different inclination angles as given by Alves

11
Table 2.1: Flow Coefficients for Different Inclination Angle Ranges (After Alves)
Inclination Angle (Degrees) Co
10-50 1.05
50-60 1.15
60-90 1.25
In addition, Wallis Wallis, G.B. (1969). has proposed that the effect of single bubble
rising in a swarm of bubblescan be introduced by defining a bubble swarm effect (n), thus HLn
will be taken into consideration. Finally, Perez-Tellez et al proposed the use of the combined
effect of the bubble swarm effect (n) and the velocity profile coefficient (CO) and introduced
the following expression for the bubble slug transition.
2.12
Applying Equation 2.11 to Hasan approach in order to find the criteria from bubble to slug
yields the following equation
( ⁄ )
2.13
with a gas void fraction α = 0.25.
2.3.1.2 Bubble or Slug to Dispersed Bubble Transition
The model which was created by Taitel et al where based on the maximum bubble
diameter under highly turbulent conditions could be used to find the relationship between
phase velocities, pipe diameters, and fluid properties which applicable for flow through
vertical flow. The equation 2.14 which developed by Caetano as shown below was
recomended by Perez-Tellez in order to calculate the homogenous fanning friction factor, and
since the rise velocity for the dispersed bubble flow is very small compared to the local
velocities, the no-slip holdup (λL) could be used to calculate ƒF. Where ID is the inner pipe
diameter.
(
) [
( ) ]0.5
(ρL/σ)0.6
= 0.725 + 4.1(VSG /VM )0.5 2.14

12
2.3.2 Upward Flow through the Annuli
Taitel et al.(1980) proposed the method for predicting flow pattern, in addition to
his model and coupling it with the bubble swarm effect and the velocity swarm coefficient.
The flow patterns used were shown in Figure 2.3 where the transition boundaries will be
calculated based on different flow geometry and properties.
2.3.2.1 Bubble to Slug Transition
During bubble flow, discrete bubbles rise with the occasional appearance of a Taylor
bubble. The discrete bubble rise velocity was defined in Equation 2.11. The presence of an
inner tube tends to make the Taylor bubble sharper, causing an increase in the Taylor bubble
rise velocity. As a result, Equation 2.15 was developed where the outer tube diameter should
be used with the diameter ratio (OD/ID) to get the following expression for the Taylor bubble
rise velocity in inclined annulus.
vTB = (0.345+0.1*(OD/ID)) √ ( )
1.2√
2.15
where
OD : Outside pipe diameter
ID : Inner casing diameter
g : Gravity acceleration
ρL: Liquid density
ρG: Gas density
Hasan and Kabir stated that the presence of an inner tube does not appear to influence
the bubble concentration profile (CO) and thus the following expression could be used :
vSL =( (4 - CO) v
SG)/ ) - v 2.16
where
CO = Velocity profile coefficient for bubbly flow
Inclination angle from horizontal
v = Discrete gas bubble rise velocity, (m/s,ft/s)

13
2.3.2.2 Bubble or Slug to dispersed bubble transition
The flow transition from bubble or slug to dispersed bubble been defined by Equation
2.14. The hydraulic diameter (Dh) is substituted for the pipe inside diameter (ID). The
hydraulic diameter of the casing-tubing annulus is given by:
Dh = ID – OD 2.17
where
ID = internal casing diameter
OD = is the outside pipe diameter.
2.3.2.3 Dispersed bubble to slug flow transition
Taitel et al. determined that the maximum allowable gas void fraction under bubble flow
condition is 0.52. Higher values will convert the flow to slug, hence the transition boundary
could be equated as follows
v SL = 0.923 vSG 2.18
2.3.2.4 Slug to churn transition
Tengesdal et al. has developed a transition from slug to churn flow in an annulus. They
stated that the slug structure will be completely destroyed and churn flow will occur if the gas
void fraction equals 0.78. Thus churn flow will occur. The transition from slug flow to churn
flow can thus be represented by :
v SL = 0.0684 vSG – √ 2.19
where Dep is the equi-periphery diameter defined as follow
Dep = ID + OD 2.20
where
ID = is the inner casing diameter
OD = is the outer pipe diameter.


