OLECULAR STUDIES OF GENE EXPRESSION IN DEVELOPMENT OF THE SEA
STAR PISASTER OCHRACEUS(BRANDT)
Imre ~ovesdi
B.A.Sc. (~lectrical Eng.), University of British Columbia, 1975
THESIS SUBMITTED IN PARTIAL FULFILLMENT OF
THE REQUIREMENTS FOR THE DEGREE OF
DOCTOR OF PHILOSOPHY
in the Department
of
Biological Sciences
@ ImreKovesdi 1984
SIMON FRASER UNIVERSITY
December, 1984
All rights reserved. This work may not be reproduced in whole or in part, by photocopy
or other means, without permission of the author.

APPROVAL
NAME :
DEGREE:
TITLE O F THESIS:
Imre K o v e s d i
D o c t o r of P h i l o s o p h y
M o l e c u l a r S t u d i e s of Gene E x p r e s s i o n i n D e v e l o p m e n t of t h e S e a S t a r p i s a s t e r o c h r a c e u s ( ~ r a n d t )
EXAMINING COMMITTEE:
C h a i r m a n : Dr. J . E . -he
- Dr. M. J. S m i t h
D r . 6.L. B a i l l i e
- Dr . A.T. ~ e c k e n b a c h
-- I
D r . B. Honda Y p u b l i c E x a m i n e r
D r . K.C. E a s t w e l l , P u b l i c E x a m i n e r
- D r . B. P. B r , a n d h o r s t , M c G i l l U n i v e r s i t y , E x t e r n a l E x a m i n e r
D a t e A p p r o v e d 4. / 3 -/9f/

*' . - , I hereby g r a n t to Simon Fraser U n i v e r s i t y the r i g h t t o lend
my t h e s i s , p roJec t o r extended essay ( the t i t l e of which i s shown below)
t o users of the Simon Fraser U n i v e r s i t y L ib rary , and t o make p a r t i a l o r
s i n g l e cop ies o n l y f o r such users o r i n response t o , a request from the
l i brary of any o the r u n i v e r s i t y , o r o the r educat ional I n s t i t u t i o n , on
i t s own behalf or f o r one of Its users. I f u r t h e r agree t h a t permission
t o r m u l t i p l e copying o f thls work fo r s c h o l a r i y purposes may be granted
by me o r t h e Dean o f Graduate Studies, It I s understood t h a t cdpying
o r p u b l i c a t i o n o f t h i s work f o r f l n a n c l a l gain s h a l l not be al lowed .
w i t hou t my w r i t t e n permission.
Author:
(date)

ABSTRACT
The objectives of this study were to assess the
informational content in the egg RNA from Pisaster ochraceus and
to determine the gene type and abundance of actin transcripts
during embryonic development.
The sequence complexity of egg RNA was measured by RNA
excess hybridization to single-copy 125~-DNA. 5.9% of the
reactable single-copy DNA mass is present in DNA-RNA hybrids.
~ssuming asymmetric transcription, this represents 11.8% of the
genomic single-copy complexity, or about 4.3 x lo7 nucleotides
of diverse sequence. The hybridization reaction is driven by
2-3% of the maternal RNA mass. Each single-copy transcript is
represented approximately 1.7 x lo4 times per egg.
Genomic and cDNA recombinant libraries were prepared and
screened for actin specific sequences. Three major classes of
genomic actin clones have been identified by restriction enzyme
mapping and localization of actin coding regions. There are at
most five non-allelic actin genes in the sea star genome.
Southern blots of restriction enzyme digested genomic DNA from
individual sea stars probed with actin sequences indicate
extensive polymorphism in actin gene regions. a is tinct actin
clones were isolated from cDNA libraries. The genes from which
actin transcripts originate have been identified by
hybridization with 3' untranslated regions from each of the cDNA
plasmids. 3' untranslated regions hybridized with genomic DNA
indicate three putative alleles of each actin gene.

Coding and 3' non-coding sequences of actin subclones were
used to measure actin transcript abundance in development using
RNA transfer and dot-blot analyses. Hybridization of
single-stranded probes with total and poly(A)+ RNA determined
the average number of actin transcripts per embryo as 3 .1 x 1 0 5
per egg, 1 . 6 x l o 5 per 21 h blastula, 1 . 3 x l o 5 per 48 h
gastrula and 1 . 8 x l o 5 per 72 h gastrula. These experiments show
differential actin gene expression.

Purple, yellow, s t a r s
Found you i n the deep blue sea
Reveal your s e c r e t s

ACKNOWLEDGMENT -
First of all I wish to thank my supervisor Dr. M.J. Smith for
his help and critical guidance throughout this research. I am
also grateful to my supervisory committee, Dr. D.L. Baillie,
Dr. C.L. Kemp and Dr. A.T. Beckenbach for their suggestions and
encouragement; Dr. E.H. Davidson for allowing me the opportunity
to work and learn in his laboratory; M. Stuerzl and
F. Preugschat for mapping the X genomic clones; D.R. Wilson for
his help with the computer; M. Stuerzl and B.J. Ydenberg for
their excellent technical assistance; professors, technicians,
and fellow students for their helpful discussions over the past
five years. I should like to conclude by thanking my wife,
Cyndy, for interpreting my English, and for her patience and
support during the time of this work.

TABLE OF CONTENTS
Abstract ....................................................iii
Haiku ...........................................................v
List of Tables ............................. ;.................xi ~ i s t of Figures ............................................. x ii A, GENERAL INTRODUCTION ....................................... 1
B. CHAPTER I Sequence Complexity in the Maternal RNA of the Starfish Pisaster ochraceus(~randt) ............................... 12
I. INTRODUCTION .......................................... 13
11. MATERIALS AND METHODS ................................ 15
RNA isolation ........................................ 15
Measurement of - P. ochraceus egg RNA content .......... 16
Preparation of polyadenylated RNA .................... 17
DNA isolation and preparation of single-copy 125~-labeled DNA ................................. 17
Hybridization of single-copy 1 2 5 ~ - ~ ~ ~ with egg RNA ... 19
Recovery of hybridized 1 2 5 ~ - ~ ~ ~ ...................... 20
111. RESULTS ............................................. 21
RNA content of sea star eggs ......................... 21 Characteristics of single-copy 1 2 5 ~ - ~ ~ ~ .............. 21
Single-copy sequence content of Pisaster egg RNA ..... 2 4
Sequence complexity and transcript prevalence in P. ochraceus egg RNA ............................. 27 -
IV. DISCUSSION ........................................... 33
C. CHAPTER I I - Number of Actin Genes and Actin Gene Expression in Sea
Stars ..................................................... 37
vii

.......................................... I . INTRODUCTION 38
................................ I1 . MATERIALS AND-METHODS 40
Construction and screening of . P . ochraceus genomic .......................................... library 40
Construction and screening of tube foot cDNA plasmid library .......................................... 41
Construction and screening of XgtlO cDNA libraries ... 42 Restriction endonuclease mapping ..................... 43
........................... DNA dot-blot hybridization 44
........................................... Subcloning 44
Subcloning into MI3 single-stranded DNA phage ......... 46 .......... Preparation of single-stranded DNA Template 47
................................ DNA sequence analysis 49
Labeling of DNA probes ............................... 50 ........................... DNA reassociation kinetics 51
I11 . RESULTS ............................................. 52 ............. Genomic clones containing actin sequence 52
............................... Tube foot cDNA Library 54
XgtlO cDNA libraries ................................. 56 ................................ DNA sequence analysis 58
Dot-blot hybridization ............................... 60 ............ Polymorphism and gene number in sea stars 64
Identification of the genomic origins of the 3' ............... non-coding gene specific sequences 67
Kinetic determination of the number of actin genes . in sea stars ..................................... 71
DISCUSSION
D . CHAPTER I11 Actin Transcript Concentration in Pisaster ochraceus .......................... Early Development and Tube Foot 83
.......................................... I .. INTRODUCTION 84

I1 . MATERIALS AND METHODS ................................ 86 RNA dot-blots ........................................ 86
RNA transfers ........................................ 86 Densitometry ......................................... 87 MI3 single-stranded probes ........................... 87 RNA driven hybridization kinetics .................... 88 Sakuration hybridization ............................. 89
............................................. I11 . RESULTS 91
........................... Actin gene specific probes 91
Expression of actin genes in tube foot tissue ......... 91 Embryo specific expression of an actin gene .......... 96 Expression of actin genes in the eggs of different ............................. species of sea stars 98
RNA driven hybridization and saturation hybridization to determine the number of actin homologous sequences in different RNA populations ...................................... 98
Number of actin sequences in different developmental stages and in tube foot ......................... 101
Number of XPoA145 specific sequences in different developmental stages and in tube foot ........... 1 1 1
Number of XPoA16O specific sequences in different developmental stages and in tube foot ........... 118
.......................................... IV . DISCUSSION 123
Expression of actin transcripts in sea star early development ................................... J 2 3
Actin gene expression in . P . ochraceus tube foot ..... 126 Expression and function of 3' non-coding actin
sequences ....................................... 128 E* SUMMARY . . . . . . . . . . . . . . . . . . . . . . . . . . . . . . . . . . . . . . . . . . . . . . . . . . 135
Appendix A .................................................. 138 Appendix B .................................................. 140
ix


LIST OF TABLES
TABLE PAGE . .
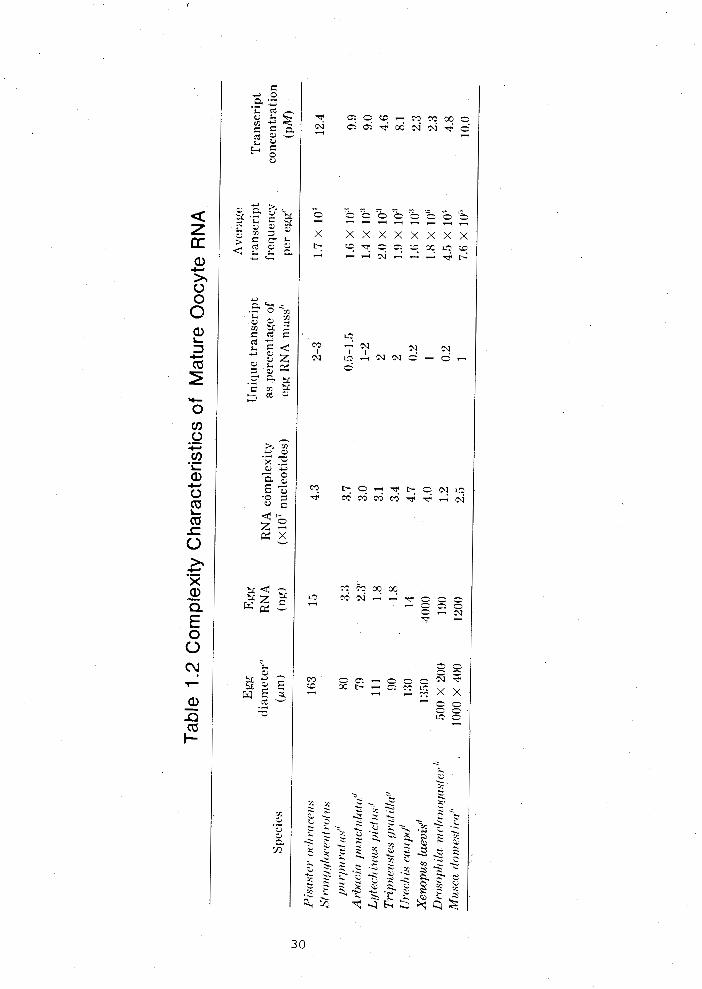
1 . 1 Sequence complexity of P i s a s t e r ochraceus mature oocyte RNA ....................................... 26
1 .2 Complexity c h a r a c t e r i s t i c s of mature oocyte RNA ....................................... 30
2.1 Kinet ic determination of the number of a c t i n genes i n sea s t a r s ..................................... 73
3.1 Determination of the number of a c t i n coding sequences i n P i s a s t e r ochraceus RNA ............. 103
3.2 ~ e t e r m i n a t i o n o f t h e n u m b e r o f p ~ o T A 5 / 4 6 0 3' sequences i n P i s a s t e r ochraceus RNA ............. 116
3.3 D e t e r m i n a t i o n o f t h e n u m b e r o f p ~ o T A 1 3 / 2 1 0 3' ............. sequences i n P i s a s t e r ochraceus RNA 121

LIST OF FIGURES
F I GURE
- PAGE
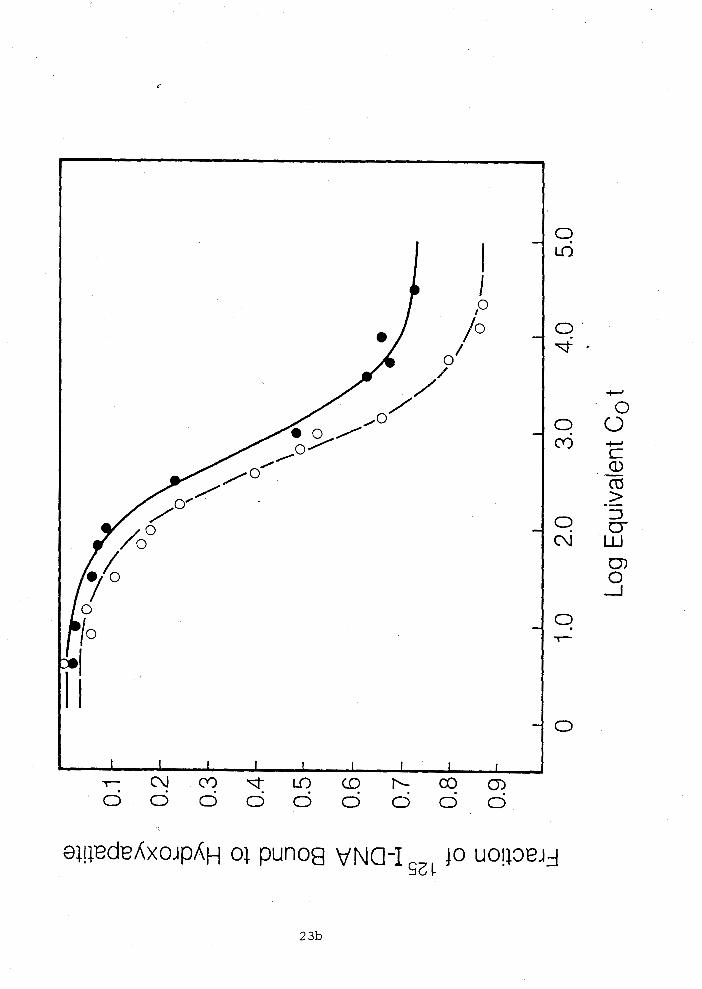
1.1 Reaction of single-copy 1 2 5 1 - ~ ~ ~ with excess genomic DNA ...................................... 23
1.2 Hybridization of oocyte RNA to single-copy 1 2 5 ~ - ~ ~ ~ ......................................... 25
2.1 Preparation of single-stranded probes using MI3 phage ............................................ 48
2.2 Restriction enzyme maps of sea star tube foot actin cDNA clones ................................. 55
2.3 Restriction enzyme maps of sea star actin cDNA clones from tube foot, egg and gastrula .......... 57
2.4 Nucleokide sequence comparision of sea urchin and sea star actin clones ............................. 59
2.5 Restriction enzyme map of sea star genomic actin subclone p~o~137/1100 ............................ 61
2.6 Dot-blot hybridization of actin coding and gene specific probes with genomic DNA ................. 62
2.7 Southern blot hybridization of EcoRI-digested genomic DNA from individual sea stars ...,........ 65
2.8 Blot hybridization of genomic clones ................. 68 2.9 Hybridization of actin coding sequence probe with
excess genomic DNA from three sea stars .......... 72 3.1 Dot-blot hybridization of actin coding and gene
specific probes with total RNA ................... 92 3.2 Expression of actin genes in sea star development
and tube foot .................................... 94 3.3 Relative abundance of actin transcripts in sea
star development and tube foot ................... 95 3.4 Expression of actin genes in the eggs of two
different sea star species ....................... 99 3.5 RNA driven hybridization to single-stranded actin
coding probe .................................... 102
xii

3.6 Titration of transcripts in embryo RNA .............. 107 3.7 Titration of coding and 3' non-coding actin
transcripts in tube foot RNA .................... 108 3.8 Number of actin transcripts in sea star
development and tube foot ....................... 110 3.9 Change in the number of actin transcripts per cell
during early sea star development ............... 112 3.10 Specific activity determination of the
single-stranded 3' probe p ~ o ~ ~ 5 / 4 6 0 ............. 114 3.11 RNA driven hybridization to the single-stranded
p~oT~5/460 3' non-coding probe .................. 115 3.12 RNA driven hybridization to the single-stranded
p~oTA13/210 3' non-coding probe .................. 120

A. GENERAL INTRODUCTION
The requirements for control of gene expression in early
embryonic development are quite different from that of a
terminally differentiated system. The development of a
multicellular organism from an apparently simple looking egg
involves the coordination of a large number of variables. To
understand the developmental phenomena, it is necessary to know
how the coordinate utilization of information occurs in a
developmental system. In this study the mechanism of storage and
stage specific utilization of informational macromolecules are
investigated in sea star early development.
Investigations of echinoderm embryos established that there
is a maternal program in the egg which determines the early
pattern of development (reviewed by Davidson, 1976; Raff, 1980;
Davidson et G . , 1982a; Jeffery and Raff, 1983). Interspecies
hybrid experiments conducted since the beginning of this century
have shown that development follows the'maternal pattern until
the blastula stage. These observations were confirmed by
analysing the patterns of embryonic protein synthesis (Tufaro
and Brandhorst, 1982). The spermatozoon's contribution to the
zygote is only the paternal haploid genome, therefore without
the preformed maternal transcription and translation machinery
the initiation of embryonic development would not be possible.
Eggs are similar to storage houses with large quantities of

materials ready to begin development. Both protein and RNA are
stored during oogenesis.
initial evidence for the existence of maternal RNA came
from experiments with chemically treated embryos. Inhibition of
transcription with actinomyocin D established that there is a
sufficient amount of RNA stored in the sea urchin egg to provide
the templates required until the time of hatching (reviewed by
Raff, 1980) .
At fertilization the rate of protein synthesis increases
dramatically which was shown to be due to utilization of the
maternal RNA (Epel, 1967; Humphreys, 1969; 1971) .
There are indications that a large fraction of the maternal
RNA is mRNA, which is readily usable by the embryo. RNA
extracted from sea urchin and Xenopus eggs were template active
in translation systems (reviewed by Davidson, 1976) . This RNA
also shows typical messenger RNA size with a mean length of
about 2000 nucleotides, primarily single-copy sequence and
extensive poly(A) tails.
Alternatively, a considerable part of the maternal RNA has
approximately 1000 nucleotides longer length, as well as being
translated very poorly in a reticulocyte cell free system
(reviewed by Thomas - et 3., 1981) . The discovery of a large
number of repetitive sequences on-maternal RNA (~onstantini
et a1 1978; 1980) indicated that this RNA is still Z - 1
unprocessed, or has functions other than protein synthesis. It
was also observed that maternal RNA contains unusual multiple

oligo(A) (Duncan and Humphreys, 1981) and oligo(~) sequences
(Duncan and Humphreys, 1983). The role of these unique sequences
are implied to have some regulatory or processing function
(Thomas et e., 1981; Davidson, 1982b). Alternatively, Raff (1983) suggests, that these peculiar transcripts might represent
incomplete processing and solely relics of oogenetic events.
Transcripts synthesized during oogenesis exist as masked
RNP particles in eggs (reviewed by Raff, 1980; Jeffery and Raff,
1983). Fertilization in sea urchins begins a cascade of events
(Epel, 1980) which includes a dramatic increase in protein
synthesis (Humphreys, 1971) and polyadenylation of RNA (wilt,
1973; 1977; Nemer, 1975; Dolecki - et -. a1 I 1977). The controlled
unmasking of the large amounts of maternal RNA provides the
primary control over early development until the embryonic
genome can supply sufficient quantities of transcripts (reviewed
by Raff, 1980).
Transcription from the embryonic genome begins very early
in development. Radioactive labeling of RNA proved that both new
heterogeneous nuclear RNA and mRNA are synthesized in Xenopus as
well as in sea urchin embryos (reviewed by avids son, 1976).
Kinetic determinations on newly synthesized RNA showed a very
high rate of turnover.-Paradoxically the embryonic transcripts
appear to code for the same proteins as the maternal RNA and the
embryonic transcription seems to make little qualitative change
in the prevalent messenger RNA population (reviewed by
Brandhorst - et g . , 1983).

Recent studies using specific cloned sequences confirmed
that the dominant pattern in sea urchin embryogenesis is the
replacement of maternal transcripts with embryonic transcripts
around the time of gastrulation (~lytzanis - et -= a1 1 1982).
However, Cabrera -- et al. (1984) found that individual transcripts
are replaced at different times and the parameters that
determine the level of each transcript vary widely. The most
important factors that control the transcript abundance are the
amount and stability of the maternal RNA as well as the
cytoplasmic entry rate and stability of the newly synthesized
transcripts.
In the sea urchin embryo all the complex events associated
with the reorganization of maternal components and new
transcripts occur within a closed system. The turnbver of
proteins and specific RNA transcripts are high but the mass of
the protein and RNA in the embryo remains essentially constant
prior to feeding (reviewed by Davidson et al., 1982a).
Although the control of maternal RNA translation is not
understood, it was demonstrated for specific sequences in
mollusc (~osenthal et e., 1980), sea star (Rosenthal -- et al.,
1982) and in sea urchin (~abrera et g . , 1984). The role of
maternal RNA in the determination of embryonic cell fates
through its association with specific cytoskeletal domains was
shown in ascidian development (~effery, 1983).
Maternal RNA plays a major part in early development,
therefore its study is of fundamental interest. The complexity

of this stored RNA could indicate an initial transcript
requirement at the beginning of development. The informational
content was shown to be sufficient to encode approximately 20000
proteins (reviewed by Davidson, 1976). This complexity is
surprisingly similar for a wide variety of species and bears no
- close correlation with genome size (~ough- vans - et * a1 I 1980) or
total egg RNA mass (Thomas & &., 1981). Conversely the
concentration of transcripts per unit volume of egg cytoplasm is
fairly constant (~ovesdi and Smith, 1982). There is clear .
evidence that a large fraction of maternal RNA is mature mRNA
(Wilt, 1977; Brandhorst, 1976). The complexity of RNA decreases
during development (Galau - et g . , 1976) but at the 16-cell cleavage stage approximately 73% of the maternal RNA complexity
is still represented in polysomes (Hough- vans - et -* a1 I 1977). It
is important to realize that about 90% of the polysomal RNA in
Stronqylocentrotus purpuratus gastrula is represented by
prevalent messages that contain only 10% of the complexity
(~alau et &., 1974; Lasky & &., 1980). The abundance of these
transcipts suggests a central functional importance in early
ontogeny. Therefore their study might lead to a greater
understanding of the relationships between the expression of
genes and developmental morphology.
The study of specific genes may ascertain the fate of
maternal coding sequences and determine the onset of embryonic
gene expression. Some of the most studied genes are present as
multiple copies in the genome. These copies are related either

structurally or functionally to each other forming a gene
family. The study of these families offer unique insights into
gene structure, gene regulation and evolution.
The actin gene families have been very extensively examined
in several organisms including echinoderms. To study gene
expression during sea star development actin was chosen for
several reasons: It is ubiquitous in eukaryotes and is highly
conserved across phylogenetic lines. In addition to its role in
muscle contraction, actin has been implicated in various .
cellular activities including cytokinesis, cytoskeletal
structure and cell motility. The actin genes are members of a
multigene family whose protein products and RNA intermediates
are readily identifiable. It is therefore possible to determine
the abundance and location of the gene products and to assess
the possibility of differential gene expression during embryonic
development.
A prerequisite for greater insight into the expression of
specific sequences in development is a knowledge of their
genomic organization. The structure of actin gene families has
been reported from yeast ( ~ g and Abelson, 1980), ~ictyostelium
(Kindel and Firtel, 1978; McKeown et e . , 1978; McKeown and
Firtel, 1981), - C. elegans (~iles - et -* a1 1 19831, ~rosophila
!Fyrberg - et G . , 1980; 1981; ~ o b i n - et e . , 1980; Sanchez et e., -
19831, S.purpuratus (~urica - et - 1 a1 1980; Overbeek et e., - 1981; Schuler and Keller, 1981; Scheller - et * a1 I 1981; Cooper
and Crain, 1982; Schuler et e . , 1983; Lee e.. 1984). -
p. ochraceus (~ovesdi et g . , 1984), chicken (~ornwald et al., - -- 1982)~ rat (Nude1 et g . , 1982; 1983), human (~ngel et @.,
1981; Khalili et e . , 1983), and soybean (Shah et e . , 1982).
The number of actin genes in these species vary between the two
extremes of 1 for yeast and 17 for Dictyostelium. Most of these
genes appear to be dispersed in the genomes, although there are
a few linked genes which have been reported for - C. eleqans
(Files et e . , 1983) and S. purpuratus (Scheller et &., 1981;
Schuler et &., 1983). Some actin genes have introns, but d.o not
show the striking conservation observed in other gene families
like the globins (Efstraditis et &., 1980).
Amino acid sequence studies have shown that actin is a
highly conserved protein in evolution (Vanderkerchkov and Weber,
1978a; 1978b). Vertebrates exhibit characteristic amino acid
sequence differences which allow for distinction between
cytoplasmic and muscle actins (Vanderkerckhov and Weber, 1978b).
All invertebrate actins analysed to date resemble vertebrate
cytoplasmic actins (Vanderkerckhov and Weber, 1980; Fyrberg
et a1 1981; Files et c., 1983), even though some of these are - ' I - specifically expressed in muscle tissue (~yrberg et a., 1983; Shott - et e., 1984). Differential expression of identical actins in Dictyostelium ( ~ c ~ e o w n and Firtel, 1981) and the stage as
well as tissue-specific expression of very similar actins in
Drosophila (~ulauf et &., 1981; Sanchez - et e . , 1983; Fyrberg
g . , 1983) incited speculations on actin gene evolution. Davidson -- et al. (1982a) hypothesized that in these animals

certain genes are probably producing specific actins as "they
belong to muscle ontogenic regulatory module, rather than
because the gene coding sequence specifies a muscle and not a
cytoskeletal protein."
Actin gene expression has been extensively analysed in sea
urchins (Crain - et -* a1 I 1981; 1982; Merlino et al., 1981; Durica
and Crain, 1982; Flytzanis & a,, 1982; Crain and Bushman, 1983; Bushman and Crain, 1983; Garcia et &., 1984; Shott
et e., 1984). The main conclusion of these studies is that.most 7
sea urchin eggs contain very little actin specific maternal RNA,
and the transcript prevalence appears to increase approximately
50-fold from egg to gastrula. Therefore it is by no means
insignificant that this study found the expression of actin
genes to be very different in sea stars.
Echinoderm early development has been one of the most
extensively studied systems at both the cellular and molecular
levels (reviewed by Hinegardner, 1967; Davidson, 1976). For this
study sea stars (~chinodermata: ~steroidea) were chosen as the
experimental organisms. They present several distinct advantages
for molecular investigations of early development. For example,
they have small genome sizes (Hinegardner 1974; Smith and Boal,
1978), conservative early embryogeny, provide large quantities
of eggs that develop synchronously and can be easily maintained
(Fraser - et e., 1981 1.
Oocyte maturation in sea stars can be readily studied, as
oocytes are stored in the ovary arrested at the neiotic

prophase. Meiosis is reinitiated by a hormone produced in the
follicle cells, which was identified as I-methyladenine
(1-~e~de) (Kanatani, 1969; 1975). Hormonal treatment causes the
oocytes to mature and become fertilizable. The maturation
process is correlated with extensive morphological changes
involving actin polymerization (Schroeder and Stricker, 19831,
derepression of protein synthesis (~ouk and Epel, 1974)~ changes
in RNA synthesis (Boylan et e., 1973) and in polyadenylation
those observed with sea urchins at the time of fertilization
(reviewed by Epel, 1980). In sea stars, fertilization does not
cause further change in the pattern of protein synthesis
(Rosenthal et c., 1982). The change in protein synthesis during oocyte maturation was shown to be the result of translational
control over the cytoplasmic population of maternal RNA
(Martindale and Brandhorst, 1984).
Molecular studies of development are enhanced by the
availability of a very large number of sea star species. The
range of phylogenetically related organisms with conservative
macroscopic development allows us to look for correlations at
the molecular level. It is assumed that if specific structures
appear and behave similarly in closely related species, their
control might also be conserved. By looking for the
similarities, a pattern perhaps will be elucidated. Furthermore,
comparisons of sea star and sea urchin systems could reveal
evolutionarily important functions.
The overall objective of this thesis was to study the
storage and developmental expression of RNA transcripts in sea
stars.
The experimental approach followed was:
1. Assessment of the transcript informational content of
p. ochraceus egg RNA and establishing basic data for this novel - developmental system.
2. Application of a specific gene as a model in determining
the fate of its transcripts in early sea star development. .
The specific experimental goals were:
1. To ascertain the informational RNA content of
P. ochraceus eggs using RNA driven hybridization kinetics. - 2. To characterize the organization of actin genes in the
P. ochraceus genome through the use of recombinant genomic and - cDNA libraries.
3. To determine the number and type of actin genes through
the use of gene specific probes in DNA transfer, dot-blot and
hybridization kinetic experiments.
4. To evaluate the type and relative amounts of actin
transcripts in various RNA populations through the use of gene
specific cDNA probes.
5. To determine the actin transcript concentration in
different RNA populations using both saturation and RNA driven
hybridization, allowing for two independent estimates.
The format of this thesis follows the general outline of
the experimental objectives described above. The first chapter

is concerned
general. The
with the maternal RNA population of - P. ochraceus
remaining part of the thesis deals specifically
with the actin multigene family. The second chapter focuses on
the organization of actin genes, and the third chapter assesses
the actin transcript concentration in early development and tube
foot.
B. CHAPTER I
Sequence Complexity in the Maternal RNA of the Starfish
Pisaster ochraceus (Brandt )

I. INTRODUCTION
The mature eggs of all eukaryotes contain a store of
informational transcripts which are utilized in early
development. The general significance of maternal RNA in a wide
range of organisms has been reviewed avidso son 1976). The
- complexity of the maternal RNA stored in eukaryote eggs is on
the order of 10 million nucleotides and this value varies little
among diverse eukaryotes (Hough-Evans et Q., 1980). The most
completely.studied system in respect to the nature and fate of
maternal transcripts is the sea urchin. For example, in
Stronqylocentrotus purpuratus, the mature egg contains 3.6 x lo7
nucleotides of unique DNA transcript (~ough- vans - et a1 I 1977).
The different RNA transcripts are found in a range of abundances
(~asky et e., 1980) and most of the sequence diversity is represented on RNA molecules which also contain a restricted
range of repetitive sequences (~onstantini - et -* a1 I 1980).
Sequences homologous to approximately 73% of maternal sequences
are found in polysomal mRNA in early development, while as much
as 56% of maternal sequence homologs are found in gastrula mRNA
(~alau - et e., 1976; Hough-Evans - et g . , 1977). Studies using cloned sea urchin maternal cDNA sequences indicate that the
relative abundance of most maternal messages do not change
radically during early development (~asky et G. , 1980). However there are notable exceptions which demonstrate a clear cut

transcriptional regulation, for example, actin gene transcripts
(Crain et e., 1981; Scheller - et -a a1 I 1981). It is apparent that
the major event at fertilization is an increased utilization of
stored maternal RNA rather than qualitative changes in RNA
synthesis (~randhorst, 1976; 1980).
There have been a number of molecular studies utilizing sea
star eggs and embryos, but there has been no investigation to
date of the sequence complexity and maternal RNA abundance in
oocytes. The sequence organization in genomic DNA as well as the
degree of sequence homology in the unique DNA of representative
sea stars have been ascertained as a preliminary study to
measures of transcriptional homology (Smith and Boal, 1978;
Smith - et &., 1980; Smith - et -* a1 I 1982). The experiments in this
section deal with the measurement of the amount and complexity
of maternal RNA in the mature oocyte of Pisaster ochraceus
(Brandt) .

11. MATERIALS AND METHODS
pisaster ochraceus (~randt) were collected from the Indian Arm
of Burrard Inlet, British Columbia, between February and June,
1980. This period encompasses the documented reproductive season
of P. ochraceus (~raser et g . , 1981).
RNA isolation -
Mature oocytes were collected by injecting individual
starfish with one to two mls per arm of 0.13 mM 1-methyladenine
(I-~e~de). his compound induces both oocyte maturation and
spawning in the starfish..The mature eggs were collected, passed
through a triple layer of cheese cloth, and washed twice with
millipore filtered seawater. The eggs were pelleted by
centrifugation. Total egg RNA was isolated with guanidine-HC1
according to Deeley - et g . , (1977) and Chirgwin - et g . , (1979).
The size and integrity of extracted RNA was routinely analysed
by isokinetic sucrose gradient sedimentation (Noll, 1967) or
acid urea-agarose gel electrophoresis. RNA was sedimented in 15
to 30% sucrose gradients containing 10 mM Na-acetate, pH 5.0, 1
mM EDTA, and 10 pg ml-' polyvinylsulfate for 20 h at 36,000 rpm
in a Beckman SW40 rotor at 4OC. Parallel gradients containing E.
coli ribosomal RNA were run as size standards. Alternatively, - RNA samples were electrophoresed on 1.5% agarose slab gels
containing 6 M urea and 0.025 M citric acid, pH 3.5 (Woo et e., 1980 ) . RNA samples were dissolved in urea-citrate loading buffer
which also contained 20% sucrose and 0.005% Bromophenol Blue.
The running buffer was 0.025 M citric acid, pH 3.5.
Electrophoresis was for 4 hours at 100 V and 4OC with rapid
recirculation of reservoir buffer. Gels were stained for 15 min
in 1% Methylene Blue, 15% acetic acid solution, destained
overnight in water and scanned at 600 nm using a Gilford 250
spectrophotometer.
Measurement ochraceus egg RNA - content
The RNA content of eggs was determined by three independent
methods; by isotopic dilution, by direct spectrophotometric
analysis of alkaline digests, and by orcinol colorimetric
estimates of RNA content in egg homogenates and alkaline
digests. In the isotope dilution method, a known amount of
"-uridine labeled E. -- coli RNA was mixed with the egg homogenate
which was then extracted by the guanidine-HC1 method. Based on
recovered E. -- coli RNA cpms the extraction efficiency was 60%.
Spectrophotometric estimates of egg RNA content were made on
alkaline digestion extracts of measured numbers of eggs (~unro
and Fleck, 1966) . Between 97% and 100% of the RNA was extracted
by 0.3 N KOH in 1 h at 37OC. This value was verified with
E. coli 'H-RNA extractions. Comparison of the UV absorption -- spectra of alkaline egg extracts with UV spectra of purified

Pisaster ochraceus-RNA showed minimal contamination with d
proteins for which corrections were made by the method of Fleck
and Begg (1965). Both homogenates and alkaline digests were
assayed by the orcinol colorimetric test (Drury, 1948; Dische,
1955). Polysaccharides in the egg interfere with the orcinol RNA
determination, therefore Drury's method of correction for
glucose equivalent was used (~rury, 1948).
Preparation of polyadenylated - RNA
Polyadenylated RNA was separated from rRNA by two cycles of
binding to oligo(dT1-cellulose (Type T-2, Collaborative
Research, Waltham, MA). The procedure of Aviv and Leder (1972)
was followed as modified by Chirgwin et e., (1979). The binding - buffer contained 0.5 M lithium chloride 0.2% SDS, and 10 mM
triethanolamine hydrochloride, pH 7.4. Bound polyadenylated RNA
was eluted with 10 mM triethanolamine hydrochloride, pH 7.4. RNA
content of the eluate fractions was determined
spectrophotometrically.
DNA isolation and preparation of single-copy 125~-labeled DNA - - - -
DNA was isolated from ripe testes as described (Smith and
Boal, 1978). The extracted DNA was sheared for 30 min in a
Virtis 60K homogenizer (~ritten - et -* a1 I 1974). Single-copy DNA
was isolated from total sheared DNA by initial denaturation and

reassociation to a Cot (M sec; moles of nucleotides per liter 6
times seconds) greater than 10,000. The double-strand DNA (95%)
was collected by hydroxyapatite chromatography, denatured, and
reassociated a second time to Cot 1,000. The unreassociated
single-copy DNA was collected by hydroxyapatite chromatography,
dialyzed, precipitated with ethanol, and subsequently iodinated
with lZ51 (~mersham Corp., carrier-free, 557 mCi ml-'1 by a
modified Commerford reaction (Commerford, 1971). Single-copy DNA
was prepared from genomic DNA that had been randomly she,ared to
either 800 bp or 400 bp. The 400 bp single-copy DNA was
iodinated on two separate occasions. The average fragment length
of the resulting 1 2 5 ~ - ~ ~ ~ preparations were 130 bp and 150 bp
with specific activities of 4 x lo7 cpm pg-' and 1.4 x lo7 cpm pg-I respectively. The single-copy DNA isolated from randomly
sheared 800 bp genomic DNA fragments was iodinated to give a
1 2 5 ~ - ~ ~ ~ with a fragment length of 300 bp and a specific
activity of 1.6 x lo7 cpm pg-'. DNA fragment length was determined by isokinetic alkaline sucrose sedimentation
(Studier, 1965; Noll, 1967). These fragment length values are
minimum estimates since alkaline treatment of iodinated DNAs can
result in some strand scission (Chan - et e., 1976). lZ5I-DNA
activity was determined in a Nuclear Chicago Gamma counter at
68% efficiency.

~ybridization - of sinqle-copy '25~-DNA with egg - RNA 6
1 2 5 ~ - ~ ~ ~ was reacted with a mass excess ( >2x10⁴:1) of
unlabeled oocyte RNA in 0.41 M PB (equimolor mono- and disodium
phosphate buffer), 0.16% SDS, at 67OC, after denaturation for 1
to 2 min at 105OC. All RNA Cot (Rot) values were corrected for
acceleration in reaction rate relative to the rate in 0.12 M PB
at 60•‹C due to higher Na' concentration (~ritten - et e., 1974). A comparison of 0.12 M PB reaction rates with the 0.41 M PB.
rates (data not shown) justifies a rate correction factor of 5
for 0.41 M PB instead of the recently published 2.5 determined
by Van Ness et -- al. (1979). A rate correction value 2.5 would
double the observed hybridization rate constant and the amount
of RNA driving the reaction.
The above contradicts results found in Chapter 111, where a
rate correction factor of 2.5 was applied. ~imilarily to Van
Ness - et e. (1979)~ Chapter I11 deals with homogeneous cloned DNA fragment probes. This chapter used a heterogeneous
population of randomly sheared DNA as probes. Theoretically it
is not clear as to how this difference could account for the
discrepancy. Only further experimentation may resolve the exact
nature of the problem.
Hybridization reactions were analysed by procedures
described earlier (Galau et e., 1974). In short, the reaction
mixture was divided, and half was used to measure the fraction
of lZ51-DNA bound to hydroxyapatite as DNA-DNA duplex subsequent

to degradation of RNA-DNA hybrids by RNase treatment under low
salt conditions. ~h'e second half was used to measure the total
1251-D~A bound in DNA-DNA plus RNA-DNA duplex. The RNA-DNA
hybrid content was calculated by subtracting the DNA-DNA duplex
content from the total. Data were analysed by a least-squares
fitting proced-ure (Pearson, - et &., 1977) .
Recovery - of hybridized 1 2 5 ~ - D ~ ~
1 2 5 ~ - ~ ~ ~ was recovered from egg RNA-DNA hybrids as
described previously (Galau et al., 1974; Hough-Evans et e., 1980) . Single-copy ' 2 5 ~ - ~ ~ ~ was incubated with excess egg RNA to
Rot 11,000. The hybridization mixture was treated with 10 pg
ml-' Ribonuclease A in 0.24 M PB for 1 h at 4OC to hydrolyze
unhybridized RNA, and extracted with chloroform:isoamyl alcohol
(24 : 1 1, before chromatography on hydroxyapatite. The hybridized
tracer was eluted with 0.5 M PB, 0.16% SDS, dialyzed into 0.3 M
Na acetate, and co-precipitated with a mass excess of randomly
sheared genomic DNA with which it was then reassociated.

6
I I I . RESULTS
RNA content of sea star eggs - ---
The mature P. ochraceus egg contains 15 ng of RNA. - Spectrophotometric and orcinol colorometric assays gave values
of 15.1 ng (S.D. = 0.5; n = 5 ) and 14.9 ng (S.D. = 0.9; n = 7 )
respectively. These values were verified by an isotope dilution
experiment which gave a value of 15 ng. The greatest proportion
of the egg RNA is ribosomal.
Characteristics - of single-copy ' 2 5 ~ - ~ ~ ~
The haploid genome size of Pisaster ochraceus is 0.65 pg or
about 6.0 x 10' bp (smith and Boal, 1978) . - P. ochraceus DNA is
organized in a short period or 'Xenopusl interspersion pattern
(Smith and Boal, 1978) . Reassociation kinetic analyses reveal
that about 50% of the 300 nucleotide DNA fragments contain only
single-copy sequences. S1 nuclease estimates indicate that at
most one-third of the nucleotides are found in repetitive
sequences. Kinetic estimates of genomic, unique DNA content,
based on hydroxyapatite chromatography of randomly sheared DNA
fragments, can result in an underestimate of the true
single-copy sequence content. In this study 60% was used as a

conservative esti'mate for the single-copy sequence content of
P. ochraceus geaomic DNA. This is equivalent to about 3.6 x 10' - bp
To assay the kinetic homogeneity of the single-copy
1 2 5 ~ - ~ ~ ~ preparations, each was reassociated with an excess of
total Pisaster DNA (Figure 1.1) . The least squares solution for
the reassociation of the single-copy DNA with total DNA give
rate constants of 1.54 x M - l s-I, 1.59 x M-' s-I and
1.76 x M - I s-l, with 74%, 61%, and 65% of the 1 2 5 ~ - ~ ~ ~
reacting respectively. In Figure 1.1 the reassociation of 130 bp
1 2 5 1 - ~ ~ A with excess sheared genomic DNA is shown. There is no
obvious repetitive DNA component in this reaction, nor that of
the other two tracer preparations. The observed tracer
reassociation rates are in good agr-eement with that expected for
a 0.65 pg genome size (Smith and Boal, 1978) . Although the two
shorter tracer preparations react somewhat slower than the third
preparation, the difference is not significant. This result
indicates that in this case a length correction which is
linearly proportional to the tracer length (Chamberlin et e., 1978) is not necessary. The reactibility of each tracer was
determined at the beginning and the end of the hybridization
experiments. There was no detectable loss of tracer reactivity
. over that period.
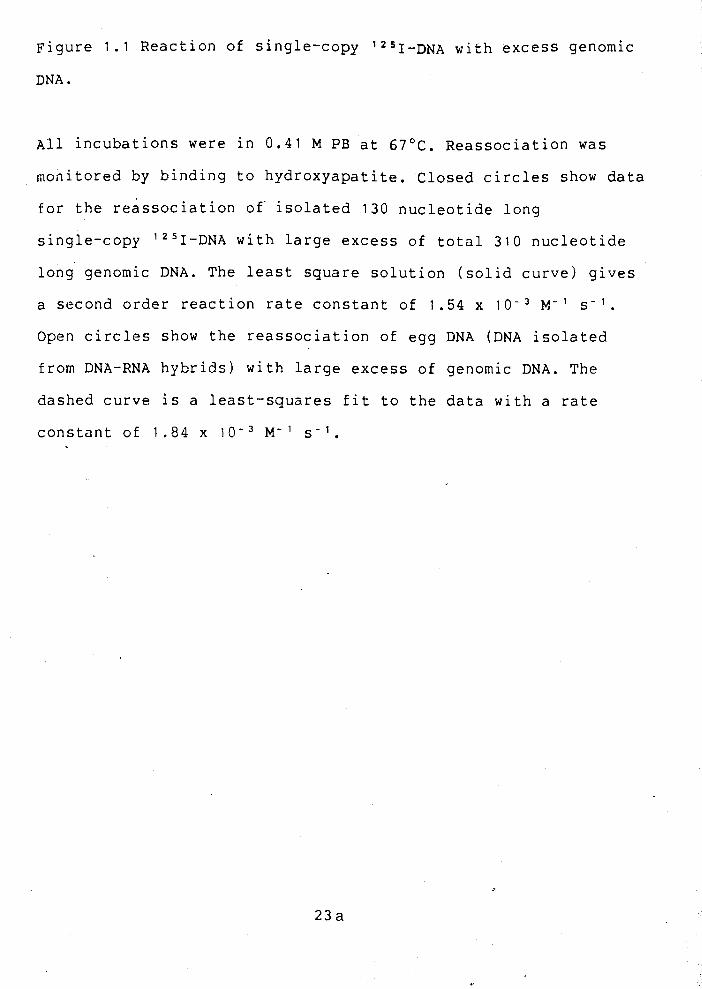
~igure 1 . 1 Reaction of single-copy 1 2 5 ~ - ~ ~ p , with excess genomic
DNA.
~ l l incubations were in 0.41 M PB at 67OC. Reassociation was
monitored by binding to hydroxyapatite. Closed circles show data
for the reassociation of isolated 130 nucleotide long
single-copy ' 2 5 ~ - ~ ~ ~ with large excess of total 310 nucleotide
long genomic DNA. The least square solution (solid curve) gives
a second order reaction rate constant of 1.54 x M-I s-l.
Open circles show the reassociation of egg DNA (DNA isolated
from DNA-RNA hybrids) with large excess of genomic DNA. The
dashed curve is a Least-squares fit to the data with a rate
constant of 1.84 x M-' s - l .
a~!Pd-ehxo~p& 01 punog y ~ a - I 40 u o ! p e ~ j SZ C
sequence content Pisaster egg RNA
Hybridization of the single-copy DNA with excess Pisaster
egg RNA is shown in Figure 1.2. ~xperiments were carried out
with at least 2 x lo4 RNA mass excess as described in Materials and Methods. The hybridization data have been normalized at each
point to the reactivity of the tracer. Data were fit with a
single pseudo-first order hybridization function by a least
squares fitting program (pearson - et g . , 1977). The results are
listed in Table 1.1. The pooled hybridization data were best fit
with a rate constant of 3.64 x M-' s-' . At kinetic termination, 5.9% of the Pisaster single-copy tracer is
hybridized by Pisaster egg RNA.
In these types of experiments there is always the
possibility that a small amount of repetitive sequence might be
present in the single-copy DNA tracer. A small amount of
repetitilve DNA transcript in the RNA population could introduce
large errors in estimation of the hybridization saturation
value. To determine whether the sequences reacting with the egg
RNA are actually single-copy, oocyte RNA was incubated with
single-copy 125~-DNA to an RNA Cot of 11,000 and the DNA which
was in an RNA-DNA hybrid was isolated. This tracer was
reassociated with an excess of randomly sheared 310 bp genomic
DNA fragments and the second-order reassociation rate constant
for the tracer DNA was determined. This reaction is shown for
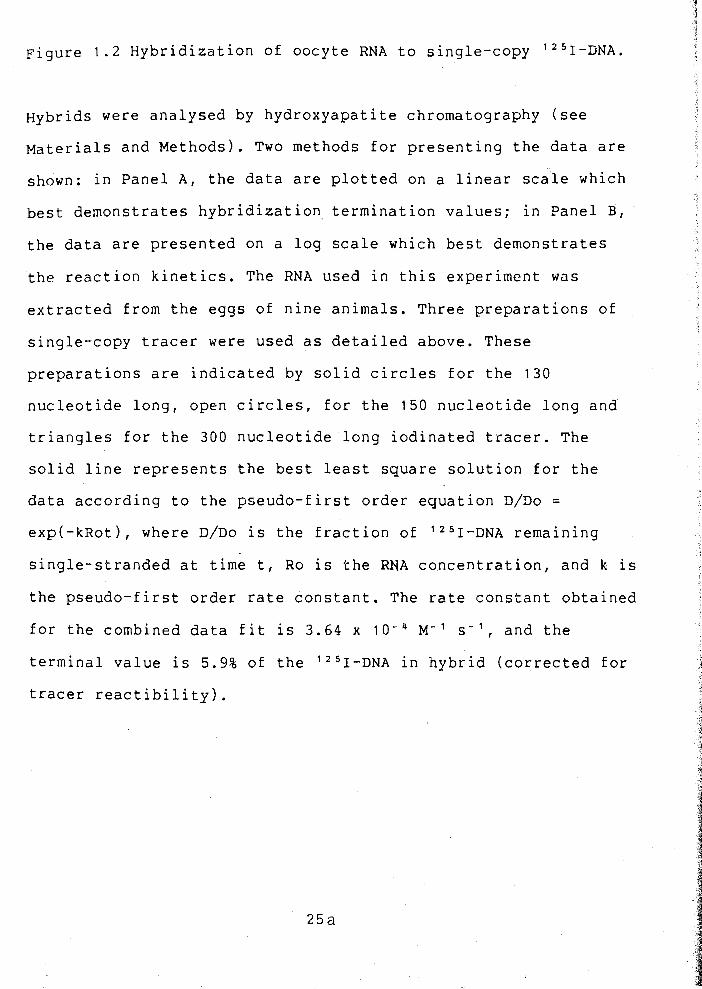
Figure 1.2 Hybridization of oocyte RNA to single-copy lZ51-D~A.
Hybrids were analysed by hydroxyapatite chromatography (see
Materials and ~ethods). Two methods for presenting the data are
shown: in Panel A, the data are plotted on a linear scale which
best demonstrates hybridization termination values; in Panel B,
the data are presented on a log scale which best demonstrates
the reaction kinetics. The RNA used in this experiment was
extracted from the eggs of nine animals. Three preparations of
single-copy tracer were used as detailed above. These
preparations are indicated by solid circles for the 130
nucleotide long, open circles, for the 15Q nucleotide long and
triangles for the 300 nucleotide long iodinated tracer. The
solid line represents the best least square solution for the
data according to the pseudo-first order equation D/Do =
expl-k~ot), where D/DO is the fraction of '"I-DNA remaining
single-stranded at time t, Ro is the RNA concentration, and k is
the pseudo-first order rate constant. The rate constant obtained
for the combined data fit is 3.64 x l o - ' M-' s-' , and the
terminal value is 5.9% of the ' 2 5 ~ - ~ ~ ~ in hybrid (corrected for
tracer reactibility).

0 10,000 20,000 30,000 40,000 50,000
Equivalent R 0 t
.O 2.0 3.0 4.0 5.0
Log Equivalent Rot

P) & 0) C 3
rl
CO
0, X
5,
m V
x h N
x a al N .d a .rl k P h C aJ U
3 1 IT aJ cn
h a 0 U I aJ i-i M d ri '3
w 0
C 0 d U u E ra w
II n 4 Z d U w
h U .I4 X al 4
0 U
n P

the 130 bp 1 2 5 ~ - D ~ ~ in Figure 1.1 (open circles). Least squares
analyses give a second-order rate constant of 1.84 x M-l
s-I for this reaction, a value which is close to the expected
rate constant for the single-copy sequence in the
Pisaster ochraceus genome. Figure 1.1 shows that 88% of the
hybrid recovered 12'1-D~~ tracer reassociated with total genomic
DNA.
These data were submitted to a second least squares
analysis to determine if the 1 2 5 ~ - ~ ~ ~ could have also contained
a small fraction of slow repetitive sequences. The maximum
fraction of the 12'1-D~~ which could be assigned to repetitive
frequencies is 10%. The data indicate therefore that a minimum
of 90% of the hybridized DNA is single-copy sequence.
Sequence complexity - and transcript prevalence 5 ochraceus
egg RNA -
At hybridization saturation (~ot>10,000), 5.9% of the
single-copy 1 2 ' 1 - ~ ~ ~ hybridized to the oocyte RNA (Figure 1.2).
Assuming asymmetric transcription this means that 11.8% of the
single-copy DNA in - P. ochraceus is represented in the egg RNA
which corresponds to 4.3 x lo7 nucleotides of RNA coding
sequences or 2.2 x lo4 diverse RNA molecules of average length
of 2,000 nucleotides able 1.1). The minimum estimate of
complexity is calculated at 3.8 x lo7 nucleotides if 10% of the
hybridized tracer is repetitive sequence.

As noted, the greatest proportion of the egg RNA mass is
ribosomal RNA. The contribution of ribosomal RNA to the total
complexity of egg RNA is very low. The fraction of the RNA mass
driving the RNA excess hybridization can be calculated from the
measured RNA complexity and the rate constant of hybridization
(reviewed in Davidson, 1976).l In our calculations no tracer
length correction was used for the two short preparations as
discussed above. The driver RNA length was estimated by assuming
that the average length of polyadenylated RNA is a
representative of the entire hybridizing RNA population.
Polyadenlyated RNA was isolated from an aliquot of egg RNA by
passage over oligo(d~)-cellulose. The average fragment length of
poly(~)+ RNA was determined by denaturing 1.5% urea-agarose gel
electrophoresis to be 1250 nucleotides. The pseudo-first-order
hybridization constant expected at a final complexity of 4.3 x
lo7 nucleotides with a driver RNA length of 1250 nt is 1.36 x 10-= M - ~ S - l . The ratio of the observed rate (K obs) to the
expected hybridization rate (K exp) demonstrates that the
I A pseudo-first order rate constant can be predicted for a RNA population of a known complexity by the relationship (Galau et al., 1977): K exp = (5374 x 200)/C RNA x (~~/300) x n60/~~)O-~ where 5374 is the complexity of 9x1 74 RNA (Sanger et e . , 1977a), 200 M - I s-I is the pseudo-first order rate - constant for an RNA excess hybridization between 360 nucleotide ( + ) strand a 1 7 4 RNA and 300 nucleotide.tracer RF DNA (Galau et al., 1977). The correction for the tracer length difference - is z~/300), and the correction for the driver length difference is (360/L~)O*~ (Chamberlin et e . , 1978). LD is the average length of the P. ochraceusdriver RNA (1250 nt) and LT is the tracer DNA length used in the calculation (300 nt). The fraction of the RNA that is driving the reaction (the most complex RNA in the population) is calculated from the ratio of K obs to K exp.

fraction of the egg RNA mass driving the reaction is 2.7%. The
above calculation, using -- E. coli rather than 9x174 as a rate and
complexity standard (Galau - et e . , 1974; Hough - et G . , 1975)
indicates that a lower fraction, 2%, of the egg RNA mass is
driving the hybridization. In conclusion, the most complex RNA
in the population comprises approximately 2-3% of the oocyte RNA
or about 14,000-20,000 copies (average = 17,000) of each unique
sequence per egg able 1.2).
It can be observed from the data presented in ~igure 1..2
that the reaction proceeds somewhat faster at low Rot values
than would be expected for this type of hybridization. This
effect could be due to a minor slow repetitive contamination of
the tracer which was discussed above. It should be pointed out
that the driving RNA is neither homogeneous in its length nor in
individual sequence abundance. In the sea urchin the prevalent
RNA class contains approximately 10% of the total complexity of
the maternal RNA (~asky - eta1 -- I 1980), but comprises probably
50-60% of the mass of RNA which is capable of reacting with
single-copy DNA sequences. The effect of this prevalent RNA
class on the overall hybridization reaction would be two-fold.
The reaction will begin faster and later proceed somewhat slower
than would be expected for complex RNA sequences which-are
homogeneous in abundance. A two component least-square fit
analysis to the data shows that 0.6% of the 5.9% saturation
value could be assigned to a prevalent class of sequences (data
not shown). This means that this class would have approximately -

Footnotes Table 1.2
Table reproduced from Kovesdi and Smith (1982).
a) Data from Czihak (1975) and Wilt and Wessells (1967). For the
purpose of volume calculations - D. melanoqaster and & domestica
eggs were considered to be simple cylinders of the lengths and
diameters given.
b) The fraction of the RNA that is driving the hybridization
reaction is discussed in the text.
c) The average number of copies of each single-copy sequence in
the egg is calculated from the measured mass of unique
transcript and the complexity of that RNA.
d) Data from Davidson (1976).
e) Calculated from Whitely (1949).
f) Data are derived from the poly(A)+ RNA sequence analysis of
Wilt (1977). 2% of egg RNA mass was assumed to be unique
' transcript. If the amount of RNA per egg is 3.9 ng (~randhorst,
1980) the average transcript frequency per egg would be 4.3 x
lo3 and the transcript concentration would be 10.0 pM.
g) Cited in Hough-Evans -- et al. (1980).
h) Data from Hough-Evans et g&. (1980).

4.3 x 10⁶ nucleotide complexity compared with the 3.82 x 10⁷
nucleotide complexity of the complex class. The other effect of
the abundant RNA on the complex class is a reduction of the
observed rate constant to 3.24 x lo-' M - l s-' indicating that
2.1% of the complex class drives the reaction. As this reduced
number is still within the precision of the one component
analysis, the presence of a prevalent class of RNA will not
change the basic conclusions.

IV. DISCUSSION
The oocytes of sea stars undergo meiotic maturation
preceding fertilization in response to 1-MeAde stimulation
(~anatani, 1969). Houk and Epel (1974) showed that the hormonal
stimulation results in a partial synthetic derepression of the
egg. The resulting marked increase in protein synthesis is not
affected by subsequent fertilization. At the same time, the
number of poly(~)+ RNA present in the egg increase threefold
(Jeffery, 1977). Jeffery (1977) argues that during 1-MeAde
induced meiosis polyadenylation of newly-synthesized mRNA,
rather than maternal mRNA, is observed. If this is the case, our
complexity measures would include this newly synthesized RNA as
well as maternal RNA transcripts since the spawning induction
method used here was 1-MeAde stimulation.
Kiper ( 1979) suggested that single-copy DNA prepared from
randomly sheared fragments by hydroxyapatite chromatography
could be preferentially enriched for coding sequences and
therefore produce excessive saturation values in RNA-DNA
hybridization experiments. He proposed that calculations of
single-copy sequence content should be based on the fraction of
unique DNA resolvable in reassociation kinetics rather than the
amount which is estimated in interspersion analysis.
Accordingly, our 300 bp unique 1 2 5 ~ - ~ ~ ~ which was prepared from
a 800 bp single-copy fraction, should contain a significantly

greater proportion of expressed single-copy complexity than our
shorter tracer DNA preparations. However, the termination of the
RNA excess hybridization reactions for each of the tracer
preparations was not significantly different (Figure 1.2;Table
1.1) indicating that the single-copy tracers were neither
enriched for coding sequences nor had lost complexity.
The complexity of the - P. ochraceus oocyte RNA is
approximately 4.3 x lo7 nucleotides, which is very similar to values found in a large variety of species able 1.2). This
complexity represents a vast amount of information (about 10
times the genome size of -- E. coli) and if it functions as stored
maternal message, it could code for 22,000 diverse proteins of .
average size. At gastrula stage in sea urchin embryos about half
of the complexity of maternal sequences is represented as
polysomal mRNA and at the 16-cell cleavage stage about 73% of
the maternal RNA complexity in sea urchin egg RNA can be
recovered from polysomes (~ough- vans - et e . , 1977). It is
possible that not all the single-copy sequence complexity stored
in eggs serves as future mRNAs, but in seas urchins, at least
70-80% represent sequences which are in active translation
during early development.
The number of genes in Drosophila are estimated as
approximately 5000 (reviewed by Watson, 1977) from a variety of
cytological and biochemical data. The maternal RNA complexity
could account for 6000 diverse proteins (~ough- vans et e . ,
1980)~ indicating that most of the transcripts which the genome

could code for are probably represented in the egg. If this is a
general phenomenon, then it would indicate that the number of
protein coding genes in metazoans are between 5000 to 20000
genes regardless of genome size. Furthermore, all or most of the
transcripts from these genes are present in the egg.
Listed in Table 1.2 are the maternal RNA egg complexities
which have been determined for a number of species. These
animals have egg RNA mass and egg volumes which differ more than
1,000 fold, but the amount of complexity stored in the maternal
RNAs is essentially ori the same order of magnitude. The major
uncertainty in these values is caused by the determination of
the amount of single-copy DNA in the genomes. Hough-Evans
et a1.(1980) pointed out that the egg RNA complexity is -- essentially independent of genome size. The amount of
single-copy egg RNA transcript, that is, the fraction of the RNA
that drives the reaction appears to range from 1 to 3%.
Exceptions are Urechis caupo and Drosophila melanoqaster which
have significantly lower values. Besides the inherent
uncertainty in the observed hybridization rate constants, other
factors which make the comparison more difficult are the
different experimental conditions and kinetic rate corrections
used by various researchers. Despite these limitations it is
still clear that the average number of copies of each sequence
per egg varies greatly between species although the number of
copies per microgram of total RNA fluctuates less. What is
striking is that the concentration of transcripts per unit -

volume of egg cytoplasm is fairly constant; the range between
organisms for sequence concentration is only about five-fold
(Table 1.2). Within this context it should be remembered that
for example the S. purpuratus gastrula at 36 hours has about 600
cells, whereas P. ochraceus at 36 hours has about 2,000 cells
per gastrula (~raser et e., 1981). The number of transcripts of each sequence per cell, assuming that 50% of maternal RNA is
functional at gastrula and that each cell has equal transcript
representation, would be 1-2 for sea urchin and about 4 for sea
star. It is more likely that, as in sea urchin micromeres
(~odgers and Gross, 1978; Ernst et &., 1980), the distribution
of maternal transcripts among embryonic cells will not be
uniform. In that case, the concentration of particular sequences
in a given cell could be considerably higher or lower than the
average values. These facts argue strongly for a functional
significance for the rare complex class of maternal RNAs. The
requirement for the vast diversity of relatively rare
transcripts in early embryos is still unexplained.

C. CHAPTER I 1
Number of Actin Genes and Actin Gene Expression in Sea Stars
I . INTRODUCTION
The actin multigene family offers a unique opportunity for
the study of gene regulation and evolution. The presence of
multiple genes which are differentially expressed facilitates
the intraspecific study of gene regulation at the DNA level.
Multigene families also lend themselves to investigations of the
mechanisms that control the duplication and persistence of
multiple gene copies. The actin genes represent a highly
conserved family of functional DNA sequences. The genomic
organization, genomic frequency, intron number and position, and
the 3' sequences adjacent to and transcribed with coding regions
are certainly less well conserved between eukaryotes of remote
phylogenetic relationship (~irtel, 1981;Davidson et &., 1982b)
The study of the origin and evolution of multiple genes can
be enhanced by using animal systems which display a diversity of
species of increasing phyletic divergence. The sea stars
(Phylum, Echinodermata; Class, Asteroidea) are widely
distributed and are represented by a large number of species.
The total single-copy DNA homology between a number of Pacific
sea star species was described and relative divergence times
were proposed (Smith et &., 1982). The sequence complexity and
maternal RNA abundance in oocytes of P. ochraceus was also
determined (~ovesdi and Smith, 1982).

A study involving the structure and organization of actin
genes has been undertaken in order to achieve a clearer
understanding of the mechanisms which control multigene family
evolution and transcriptional regulation. The experiments in
this section deal with the number of actin genes in sea stars
and the type of actin genes in Pisaster ochraceus. With this
information on hand a detailed study of actin gene expression in
development is possible.

11. MATERIALS AND METHODS
Construction - and screeninq -- of P. ochraceus genomic library
Pisaster ochraceus genomic DNA was prepared from sperm as
described by Blin and Stafford (1976). Total genomic DNA from
several individual sea stars was partially digested with EcoRI
restriction endonuclease, size selected from linear sucrose
gradients, and cloned in the X vector Charon 4 (~lattner et g . , - 1977) essentially as described by Maniatis et al. (1978). The -- Charon 4 library was initially screened ch en ton and Davis, 1977)
with a j2P-labeled nick translated Hind11 excised fragment of
the plasmid pSpG2. This plasmid contains 188 bp of 3' terminal
coding region of the actin gene expressed in sea urchin
gastrulae (gift of Dr. E.H. Davidson) (Scheller et a1 1981) - - I Positive plaques were selected and screened a second and third
time with a "P-labeled 1.8 kb Hind111 fragment of plasmid
pDMA2, a Drosophila genomic subclone (gift of Dr. N. avids son)
(Fyrberg et e., 1980) which contains all but 70 bp of the entire Drosophila actin coding region. Ten genomic equivalents
of - P. ochraceus DNA, calculated as described by Clark and Carbon
(1976)~ were screened and gave 164 positive plaques. Actin
positive phage clones were grown in the host -- E. coli K802. After
lysis phage were isolated by polyethylene glycol precipitation
40

followed by isopycnic CsCl sedimentation in vertical gradients.
DNA was isolated from phage by sodium dodecylsulfate phenol
extraction and ethanol precipitation, or directly from CsCl
using the formamide method of Davis -- et al. (1980).
Construction - and screeninq of ---- tube foot cDNA plasmid library
Tube feet were removed from adult P. ochraceus and total - RNA was extracted by the guanidine-HC~ method (Deeley - et e.., 1977). The ethanol precipitated RNA was twice passed over
oligo(dT)-cellulose columns and bound poly(~)+ RNA was collected
(~viv and Leder, 1972). Complementary DNA, cDNA, was synthesized
with AMV reverse transcriptase (gift of J. Beard, Life Sciences
Inc.) using oligo(d~) as primer. The resultant cDNA was treated
with alkali to destroy the RNA, neutralized, and the second DNA
strand was synthesized with -- E. co'li polymerase I (~iguchi
et a., 1976). The double-strand cDNA, dscDNA, was treated with - S1 nuclease to clip hair-pin loops and passed over Biogel
A-150m. The fractions containing dscDNA longer than 500 bp were
collected. The dscDNA was tailed with dCTP and inserted into the
PstI site of pBR322 (~olivar - et g . , 1977) which had been extended with dGTP (C. Flytzanis, personal communication;
Roychoudhury and Wu, 1980). -- E. coli MC1061 (Casadaban and Cohen,
1980) transformants were selected for tetracycline resistance
and ampicillin sensitivity. The 627 transformants were screened
with the actin coding sequence from the plasmid pDMA2. Five

recombinants containing actin coding sequence were obtained;
i.e. slightly less than 1% of the transformants.
Construction and - screeninq - of XqtlO cDNA libraries
P. ochraceus embryos were grown as described by Fraser - - et al. (1980). Total RNA was extracted from eggs and gastrula(48 -- hr) by the CsCl centrifugation method (Glisin et al., 1974). RNA
from tube foot, egg and gastrula was passed over
oligo(d~)-cellulose columns and bound poly(~)+ RNA was collected
(Aviv and Leder, 1972). Complimentary DNA, cDNA, was synthesized
with AMV reverse transcriptase (gift of J. Beard, Life Sciences
1nc.1 using oligo(d~) as primer. The resultant cDNA was heated
.to 95OC to separate it from the RNA, and the second DNA strand
was synthesized with 5 coli polymerase I (Higuchi et e., 1976). The double-strand cDNA, dscDNA, was treated wtih S1
nuclease to clip hair-pin loops. After methylation with EcoRI
methylase the fragment ends were filled in with Klenow fragment
and dNTPs. The dscDNA was ligated with kinased EcoRI linkers and
extensively digested with EcoRI endonuclease. Short linker
fragments were eliminated by repeated isopropanol precipitation
at room temperature and the dscDNA was ligated with EcoRI cut
XgtlO DNA (B. Wold personal communication). The packaged phage
was plated on E. coli C600AHfl. 2000 phage from the tube
foot,3000 from the egg and 6000 from the gastrula libraries were
screened with the actin coding sequence from p ~ o ~ ~ 9 / 6 5 0 (see -

Subcloninq below), yielding 5, 9 and -16 positive recombinants
respectively; i.e. about 0.3% of the recombinant phage. Selected
XgtlO clones, three from tube foot, three from egg, five from
gastrula, were subcloned into the EcoRI site of pUC9 (~essing
and Vieira, 1982).
Restriction endonuclease mapping
Genomic and plasmid DNA samples were restriction
endonuclease mapped by a series of total and partial digestions
using single or multiple combinations of enzymes. The
restriction enzyme digestion conditions were those recommended
by the suppliers. Restriction endonuclease digested clone DNAs
were electrophoresed on agarose gels (~c~onell et d., 1977) and transferred to nitrocellulose membranes by the method of
Southern (1975) or by the method of Smith and Summers (1980).
Filters were hybridized at 68'~ in 4X SET (1X SET is 0.15 M
NaC1, 30 mM Tris, pH 8.0, 2 mM EDTA), 0.1% sodium pyrophosphate,
0.1% sodium dodecylsulfate (SDS), 25 mM Na phosphate, pH 6.8, 5X
Denhardt's solution (1X Denhardt's solution is 0.02% BSA, 0.02%
Ficoll, 0.02% ~olyvinylpyrrolidone) (~enhardt, 1966) and 50 pg
ml-' sheared denatured calf thymus DNA or in 5X SSPE ( 1 ~ SSPE is
0.18 M NaC1, 10 mM Na phosphate, 1 mM EDTA, pH 7.41, 0.3% SDS,
5X Denhardt's solution. After hybridization the filters were
washed, dried, and exposed to preflashed Kodak XAR-5 or BBI film
with intensifying screens at -70•‹C. Essentially the same method

was used for genome blots. Washing of the filters was done at
moderate stringency (down to 1X SET 0.2% SDS at 68'C) or at high
stringency (0.2X SET 0.2% SDS at 68'~). Restriction mapping of
pPoTA5 and pPoTA9 clones with four nucleotide recognizing
enzymes were done by the method of Smith and Birnstiel (1976).
DNA dot-blot hybridization -
The number of actin genes in genomic DNA was assayed by
dot-blot hybridization (~afatos - et e., 1979). DNA was serially
diluted and denatured for 10 min at room temperature by adding 1
M NaOH to 0.33 M. The samples were neutralized by adding 2 M
ammonium acetate to 1 M before application to nitrocellulose
membranes. Nitrocellulose membranes were presoaked in 1 M
ammonium acetate, and samples were applied using a BRL dot-blot
manifold. Hybridization was done, as described for Southern
transfers.
Subcloninq
DNA fragments were subcloned into the plasmid vector pUC9
and grown in -- E. coli JM83 as described by Crouse et al. (1983). -- Eleven XgtlO actin specific clones were subcloned into the EcoRI
site of pUC9 and restriction mapped (see Figure 2.3 below). Tube
foot, egg and gastrula clones were named as pPoTA, pPoEA and
pPoGA respectively.

Construction of actin coding region subclone pPoTA9/650:
The tube foot cDNA clone pPoTA9 (Figure 2.2) was cut with H i n f ~
and the 650 bp coding region fragment isolated. After
blunt-ending with Klenow fragment and dNTPs it was ligated to
EcoRI linkers and digested with EcoRI. DNA was precipitated with
spermine (Hoopes and McClure, 1981) and ligated to EcoRI
digested pUC9.
Construction of the 3' non-coding region subclone
pPo~~5/460: F. Preugschat constructed this subclone by ligating
the 460 bp HincII/PstI fragment of the pPoTA5 clone (~igure 2.2)
with Hinc~I/~stI cut pUC9.
Construction of the 3' non-coding region subclone
p~o~~13/210: Digestion of pPoTA13 (Figure 2.3) with KpnI and
BamHI left the 3' end of this clone attached to the pUC9 vector.
Using Klenow fragment and dNTPs the fragments were blunt-ended,
and religated recreating a BamHI site. This clone was called
p~o~~13/440. The 440 bp insert was excised by ECORI/B~~HI
digestion and partially digested with HinfI. The 260 bp
ECORI/H~~•’I fragment was isolated and the EcoRI ends. were
ligated to an EcoR1/~incI1 digested pUC9. The HinfI end was
blunt-ended with Klenow fragment and this linear construct was
circularized by blunt-end ligation. This clone (p~o~~13/260) was
initially used as a gene specific probe. However it was
suspected to contain about 40 bp coding sequence which caused
some cross reaction at moderate stringency washing conditions.
To eliminate this problem a sequencing search was done for a

suitable restriction site outside the coding region where an
MspI site was found. The 260 bp fragment was isolated from
pPo~A13/260 by ECORI/H~~~III digestion and redigested with MspI.
The 210 bp ECORI/MS~I fragment was ligated to ECORI/ACCI
digested pUC9 producing the pPo~~13/210 clone.
Construction of the 3' gene-specific region subclone
pPoA137/630: The 3.9 Kb SalI/HindIII actin specific region of
the XPoA137 genomic clone (Appendix A) was subcloned into pUC9
(by B. denb berg) and named pPoA137. The coding and 3' non-coding
junction was further localized to the 1100 bp SstI/SalI
fragment. The region was subcloned by cutting pPoA137 with
HindIII/SstI and religating after blunt-ending with Klenow
fragment and dNTPs. The 630 bp 3' Sal1/Pst1 fragment of this
clone (p~oA137/1100)(Figure 2.5) did not show any reaction with
actin coding probes and was cloned into the SalI and PstI sites
of pUC9, producing the subclone pPoA137/630 (Figure 2.5).
Subcloninq -- into MI3 sinqle-stranded DNA phage
Cloning with the MI3 phages M13mp9 and M13mp8 was
essentially as described by Messing (1983) using -- E. coli JM103
as the host. The pPo~A9/650 actin coding and pPo~A13/210 3'
non-coding fragments were cloned into M13mp9 and the p ~ o ~ ~ 5 / 4 6 0
3' non-coding fragment was cloned into M13mp8. Fragments were
simply excised from the pUC9 vector and recloned in the same
restriction sites into M13. The orientation of the inserts was

chosen so that the recombinant phages produced the template DNA
strand that would serve as a probe complementary to RNA
transcripts.
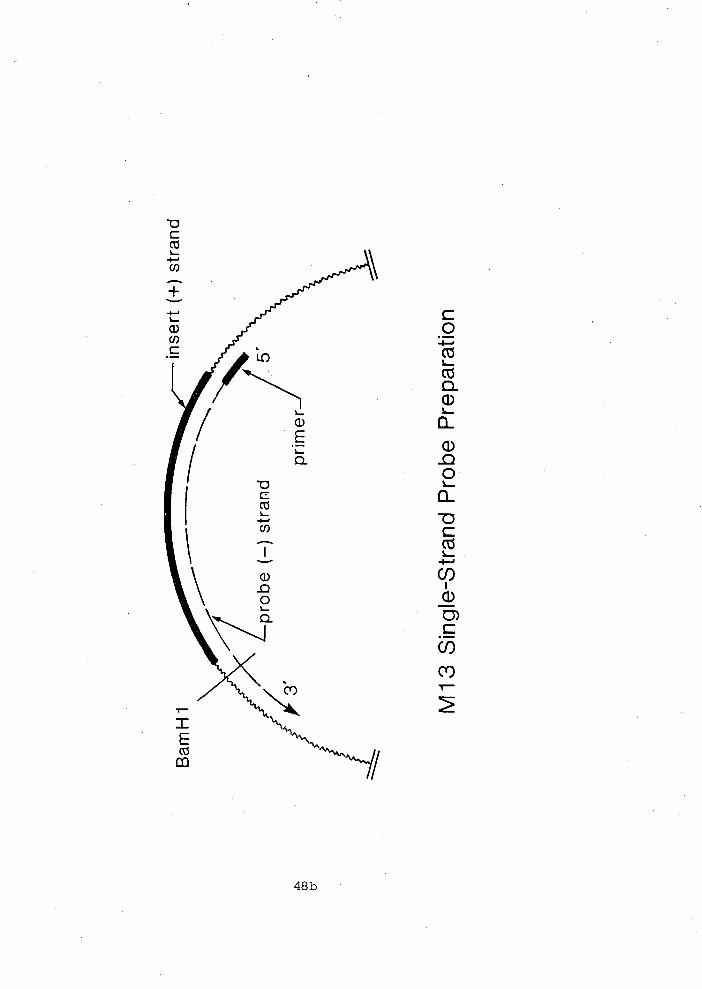
Preparation - of sinqle-stranded - DNA Template
Preparation of the single-stranded probes were as described
by Murre -- et al. (1984) and H. Jacobs (personal
communication)(~igure 2.1). A universal 17 base long primer.was
annealed with 0.5 pg of the single-stranded MI3 recombinant. The
primer was extended by Klenow fragment using [ u - ~ ~ P I ~ A T P (800 Ci
mmol-', Amersham) and unlabeled dTTP, dCTP and dGTP. synthesis
of the second strand completed a unique BamHI site downstream
from the insert. After synthesis of the second strand, digestion
with BamHI (PstI for p~o~~13/210; Chapter 111) released a
"P-labeled single-stranded copy of the insert. This labeled
fragment was very different in size from the linear unlabeled
template. The single-stranded labeled probe was purified on 3.5%
denaturing acrylamide gel and recovered by the diffusion method
of Maxam and Gilbert (1980). It was further purified from low
molecular weight contaminants on a G-100 Sephadex column.
Specific activity of the probes ranged from 1.2 x 10⁸ to 2.5 x
lo9 cpm ~ g - l .


DNA sequence analysis -
The coding strand of the M13mp9 clone of pPoTA9/650 was
sequenced from the conserved HinfI site (middle HinfI site in
pPoTA9, Figure -2.2) by the dideoxy nucleotide sequencing method
of Sanger -- et al. (1977b). The single-stranded template was
annealed to a 17 nt universal primer and extended with Klenow
fragment in the presence of [ U - ~ ~ P ~ ~ A T P and dideoxy nucleotide
mixtures from P-L biochemicals. The reactions were analysed on a
8% denaturing urea gel.
The subclone pPo~A13/440 (described above) was sequenced by
the method of Guo and Wu (1983). The plasmid first was cut with
BamHI and then digested with exonuclease I11 (25 u, 1 h). The
reaction was stopped by phenol and Sevag extraction. The DNA was
filled back with Klenow fragment in the presence of [ u - ~ ~ P I ~ A T P
and dideoxy mixtures from P-L biochemicals. The second
restriction enzyme cut was done with HincII (5 u, 10 min. at
37OC), and the products analysed on a 8% denaturing urea gel.
Therefore the coding strand, starting from the HincII site
(~igure 2.3) was sequenced towards the 5' end of the clone.

~abilinq -- of DNA probes
Nick translation: Large DNA probes were nick-translated
(~aniatis - et e., 1975) using [U-~~P]~NTPS to a specific
activity of 5 x lo7 to 2 x 10B cpm pg-l. The reaction was
stopped as described for exonuclease I 1 1 labeling below.
End labeling: Small probes with 5' protruding ends were
end-labeled by filling in with [Q-~~P]~NTPS and Klenow fragment
(Wartell and Resnikoff, 1980) to a specific activity of 5 x lo7
to 1 x 10⁸ cpm pg-'. The reaction was stopped as described for
exonuclease I 1 1 labeling below.
Exonuclease I 1 1 labeling: Most of the probes were labeled
by this method (Guo and Wu, 1983). Approximately 0.1 pg insert
DNA with 5' protruding ends were incubated at room temperature
for 10 minutes with 5-10 u of exonuclease 111. The reaction was
stopped by heating the sample at 80•‹c for 10 minutes.
Nucleotides were filled back with Klenow fragment, 30 pCi
[u-~~P]~ATP (800 Ci mmole-', Amersham) and each of the three
cold dNTPs at room temperature for 20 minutes followed by a cold
dATP chase for 5 minutes. The reaction was stopped by the
addition of 5 p1 0.5 M EDTA, 5 p1 1 M Tris pH 8.0, 50 p1 H20 and
85 ~1 of phenol : Sevag (1:l) (saturated with 1 M Tris pH 8.0).
Unincorporated nucleotides were removed by passage of the
aqueous fraction through a 1.5 ml Sephadex G-25 column. The
specific activity was 1 x 10⁸ to 3 x 10⁸ cpm fig-'.

DNA reassociation kinetics -
DNA was isolated from ripe testes as described by Smith and
Boa1 (1978). The extracted DNA was sheared for 30 min in a
Virtis 60K homogenizer (~ritten et e., 1974). The average
fragment length was determined on denaturing alkaline agarose
gels (~cDonell - et g . , 1977). "P-labeled single-stranded actin
coding probe (pPo~~9/650) was reacted with a mass excess (>4 x
106 : 1; this is a greater than 20 fold actin sequence excess)
of unlabeled genomic DNA in 0.41 M PB (equimolor mono- and
disodium phosphate buffer) at 67OC. All Cot values were
corrected for acceleration in reaction rate relative to the rate
in 0.12 M PB at 60'~ due to higher Na' concentration (Britten
The fraction of the DNA in duplex bearing fragments was
determined by hydroxyapatite chromatography at each Cot value as
described in Chapter I. Reassociation kinetic data were analysed
by a least-squares fitting procedure (Pearson, -- et al., 1977).

I I I . RESULTS
Genomic clones containinq actin sequence
The primary screening of 10 genome equivalents of the
P. ochraceus lambda library with 32~-labeled pSpG2 insert gave - 164 positive recombinants. Of these 34 gave particularly strong
autoradiographic signals and were subjected to secondary and
tertiary screening with "P-labeled pDMA2 insert. Eighteen
clones were amplified finally and subjected to either EcoRI or
EcoRI plus BamHI digestion. 'Five distinctive restriction
patterns were identified -and representative clones were
restriction enzyme mapped by M. Stuerzl and F. Preugschat
(~ppendix A). Actin coding regions were demonstrated by blotting
and hybridizing with 32~-labeled actin coding sequence from
pDMA2. It was further verified that these five lambda clones
represented distinct genomic regions by Southern blotting EcoRI
digests of the clones and hybridizing with 32P-labeled
P. ochraceus actin coding region from the tube foot cDNA clone - pPoTA9. After restriction enzyme cleavage within the actin
coding regions of the five genomic clones, the transcriptional
directionality in the DNA segment was determined by Southern
blot analysis using the 3' coding fragment from the sea urchin
gastrula cDNA clone pSpG2 (Scheller - et g . , 1981). The following
restriction enzymes were used in these analyses: EcoRI for
XPoA145; EcoRI and SstI for XPoA128, XPoA68, and hPoA137; KpnI
for XPoA16O. The five genomic actin clones from P. ochraceus
fall into three classes or categories. The first of these is
exemplified by the clones XPoA145 and XPoA128. These two clones
have a striking homology of EcoRI, KpnI, BamHI, and SstI sites
(Appendix A). XPoA145 has an additional EcoRI site within the
actin coding fragment bounded by KpnI and SstI sites. A second
category of actin genomic clones is represented by hPoA68 and
hPoA137. Here again there is a conservation of EcoRI and SstI
sites. In addition there is a conserved HindIII site at the 5'
limit of the actin positive region. Both of the above categories
of actin gene regions contain a SstI site which appears to lie
within the actin coding region. A third category or class of
genomic clones is typified by XPoA16O. This class of actin
bearing recombinant is distinctive from both of the above
classes in its distribution of restriction enzyme sites. It does
not have internal EcoRI, BamHI, nor SstI sites (~ppendix A).
Each of the five clones represents a distinct DNA region.
Within the XPoA145,128 category, the restriction map 3' to the
3' SstI is unique in the individual clones. XPoA128 has a pair
of KpnI sites and a HindIII site whereas XPoA145 is terminated
by an EcoRI site. Also the hPoA145 recombinant has an EcoRI site
which lies within the actin-containing fragment bounded by SstI
and KpnI. XPoA68 and XPoA137, although closely related, also
represent distinctive DNA regions. XPoA68 has a BamHI site 3' to
its coding region as shown in Appendix A, XPoA137 lacks this
site but has a SalI site. As stated, 18 genomic clones were
selected for examination. Of these, six, including XPoA128, are
related as judged by restriction digestion with EcoRI, BamHI, or
a combination of the two enzymes with subsequent Southern blot
hybridization to actin coding sequence probes. All of these
clones contain an 8.8 kb BamHI/EcoRI fragment which hybridizes
with 32~-labeled actin probes. Each of these genomic clones is
12.7 kb long except XPoA36 which is homologous to XPoA128 but
has an additional 4.9 kb EcoRI fragment (not shown in Appendix
A). In this category, XPoA145 is unique with its internal EcoRI
site. There are 4 recombinants in the XPoA137 group based upon
ECORI/B~~HI digestion and Southern blot hybridization. The
related genomic clone XPoA68 is distinct and has no homologous
members among the 18 isolates. The XPoA16O group has the largest
representation among the screened recombinants. The seven
members of this group are characterized by a lack of internal
BamHI sites and are limited at 17.1 kb by EcoRI sites.
Tube foot cDNA Library ---
Tube foot actin cDNA clones were amplified and restriction
endonuclease mapped with several enzymes (~igure 2.2). The 5' to
3' orientation of the inserted cDNA was determined by blotting
restriction digested recombinants and hybridizing the filters
with the 3' coding segment of the sea urchin actin cDNA clone
Figure 2.-2 ~estriction enzyme maps of sea star tube foot actin
cDNA clones.
The five cDNA clone inserts are aligned where possible on common
restriction enzyme sites. The solid bars at the bottom of the
Figure indicate fragments resulting from AvaI plus HincII
digestion which hybridize with the 3' actin sea urchin probe
pSpG2 and the Drosophila total actin coding sequence probe pDMA2
respectively. Restriction fragments 3' to the HincII site of
pPoTA5 do not contain actin coding sequence. The distance
between the SstI sites of pPoTA5, 930 bp, is the same as that
found in the genomic clones XPoA145 and hPoA128. The 460 bp 3'
non-coding HincII/~stl fragment of pPoTA5 extends 3' from the
HinclI site to the internal PstI site. pPoTA5 and pPoTA9 are
more extensively mapped to demonstrate their homology. Note that
the SstI hexamer recognition site contains the AluI tetramer
site. The following enzymes do not cut the inserts from pPoTA5
and pPoTA9: BamHI, BglI, BglII, EcoRI, HindIII, KpnI, PvuI, and
SalI. Preliminary DNA sequence analysis of the 5' ~ s t I / ~ i n f ~
fragment of pPoTA9 indicates, in addition to 80 dC linker
residues, amino acid codon homology with sea urchin actin from
amino acid 114 (Cooper and Crain, 1982). The second Hinf~ site
cuts the sequence at amino acid 363 which places the presumptive
stop codon in the 3' direction from this site by 38 bp;


pSpG2. All five of the sea star actin cDNA clones hybridized
with the sea urchin 3' actin clone. Three of the cDNA clones,
pPoTA5, 6, and 7, contain 3' sequences that do not react with
the sea urchin 3' pSpG2 probe. Two of the actin cDNA clones,
pPoTA5 and pPoTA9, contain 5' regions that react with the actin
coding sequence of pDMA2 but not with the 3' coding segment of
the sea urchin pSpG2 clone. In addition both pPoTA5 and pPoTA9
contain a SstI site 50-60 bp 5' to an AvaI site. The plasmid
pPoTA5 has a second SstI site in the region 3' to actin coding
sequence. The distance between the SstI sites in this cDNA clone
is 930 bp which corresponds to the length of the fragment
limited by SstI sites in the genomic clones XPoA145 and XPoA128.
To verify that the cDNA plasmids pPoTA5 and pPoTA9 were derived
from transcripts of the same gene region, each was mapped with a
large number of restriction enzymes. All of the enzyme sites in
the overlapping regions of these plasmids are coincident (Figure
2.2). There are no sites unique to either plasmid from the
common 3' Sau3A site to the 5' TaqI site of pPoTA5.
XqtlO cDNA libraries -
The eleven subclones derived from the three XgtlO libraries
were amplified and restriction endonuclease mapped with several
enzymes (~igure 2.3). The tube foot clone pPoTA12 is not shown
in this figure, as it is identical to pPoTAf3, except that it is
in the opposite ~r-ientation with regard to the pUC9 vector.

Figure 2.3 Restriction enzyme maps of sea star actin cDNA clones
from tube foot, egg and gastrula.
Tube foot clones(p~o~~),egg clones(p~o~~) and gastrula(48 hr)
clones(p~o~~) were aligned, where possible on the conserved
HinfI site 38 bp 5' from the stop codon. A11 clones with the
exception of pPoTA13 are similar to pPoTA5 and pPoTA9. The
pPoTA13 is the only clone which contains a KpnI site in the
coding region. The 210 bp 3' non-coding fragment of pPoTA13
extends from the MspI site to the 3' end of the clone. The MspI
site was deduced from sequencing data. The 3' actin sea urchin
probe pSpG2, the Drosophila total actin coding sequence probe
pDMA2 and the 650 bp ~ i n f ~ / ~ i n f ~ coding region sequence from
pPoTA9 (pPo~~9/650) were used to determine the 5'-3'
orientation. The wavy lines denote pUC9 sequences with the
~indI11 site indicating the orientation of the vector. The
length of inserts in bp is given in parentheses.

pPoGA14 - (1050 bp)
pPoEA7 (580 bp) - pPoGA5
(630 bp) -

.The 5 ' to 3' orientation of the inserted cDNA was determined by
blotting restriction digested recombinants and hybridizing the
filters with the 3' coding segment of the sea urchin actin cDNA
clone pSpG2. All eleven of the sea star actin cDNA clones
hybridized with the sea urchin 3' actin clone. Three of the cDNA
clones, pPoGA4, 5 and pPoEA7 appeared to contain only coding
sequences and their 5' to 3' direction was not determined.
Clones pPoTAll, pPoEA7, 8, pPoGA4, 5, were not mapped with AvaI
and SstI. A11 clones with the exception of pPoTA12 and 13 are
similar to pPoTA5 and pPoTA9. The only two restriction sites
which seem to be conserved between the two types of actin cDNA
clones are one of the HinfI sites and possibly the AvaI site
(Figure 2.3). The partial nucleotide sequence of pPoTA13 and
pPoTA9 (~igure 2.4) demonstrates that these HinfI sites are
indeed the same. Clones pPoTA12 and 13 also contain a BglII and
a KpnI site. The only genomic clone which has a KpnI site in its
coding region is XPoAl6O (~ppendix A).
DNA sequence analysis -
The two tube foot cDNA clones pPoTA9 and pPoTA13 were
partially sequenced (~igure 2 .4 ) , and compared with pSpG17 a sea
urchin genomic clone (Cooper and Crain, 1982). The 40
nucleotides sequenced from the coding region of pPoTA9 show only
1 nucleotide change compared to pSpG17 and 2 compared to
pPoTA 1 3.
Figure 2.4 Nucleotide sequence comparision of sea urchin and sea
star actin clones.
partial sequence of the tube foot cDNA clones pPoTAl3 and pPoTA9
is compared to the sea urchin genomic clone pSpG17 (Cooper and
rain, 1982). The 650 bp Hinfl/Hinf1 fragment from pPoTA9 was
cloned into M13mp9 and analysed by the dideoxy sequencing method
of Sanger -- et a1.(1977b). The dideoxy sequencing method of Guo
and Wu (1983) was used on pPoTA13 as described in the Materials
and Methods. Homogenity between the sequences is indicated by
stars(*). The restriction enzyme sites refer to the pPoTA13
sequence.

k * u h* 4 u * E-c
h u h :: El* H
The 123 nucleotides sequenced from the coding region of pPoTA13
show 7 nucheotide changes compared to pSpG17. None of these
changes caused any amino acid replacements. The 65 nucleotide 3'
non-coding sequence of pPoTA13 is 48% thymine and indicates no
homology to the pSpG17 sequence in the region assessed.
hybridization
The number of genomic sequences homologous to the pPoTA9
actin coding sequence and to the non-coding 3' fragments was
determined by dot-blot hybridization. Denatured genomic DNA was
serially diluted and applied to a nitrocellulose filter.
Denatured unlabeled pPoTA9 insert or 3' fragments from
p ~ o ~ ~ 5 / 4 6 0 (Figure 2.21, p~oTA13/210 (~igure 2.3) and
p~o~137/630 (~igure 2.5) were serially diluted and each applied
to the nitrocellulose filter in separate lanes. The filters were
hybridized with 32~-labeled inserts from the appropriate clones
and exposed to preflashed X-ray film. The results of the
experiment are shown in Figure 2.6. Visual inspection and
densitometric scanning of the autoradiographs demonstrates that
the actin sequences homologous to pPoTA9 insert are present
approximately 5 times per haploid genome. Autoradiographs of
filters probed with the 460 bp and 210 bp fragments indicate
that these sequences are present approximately once per haploid
genome. Filters probed with the 630 bp fragment indicate
approximately two copies for this sequence.
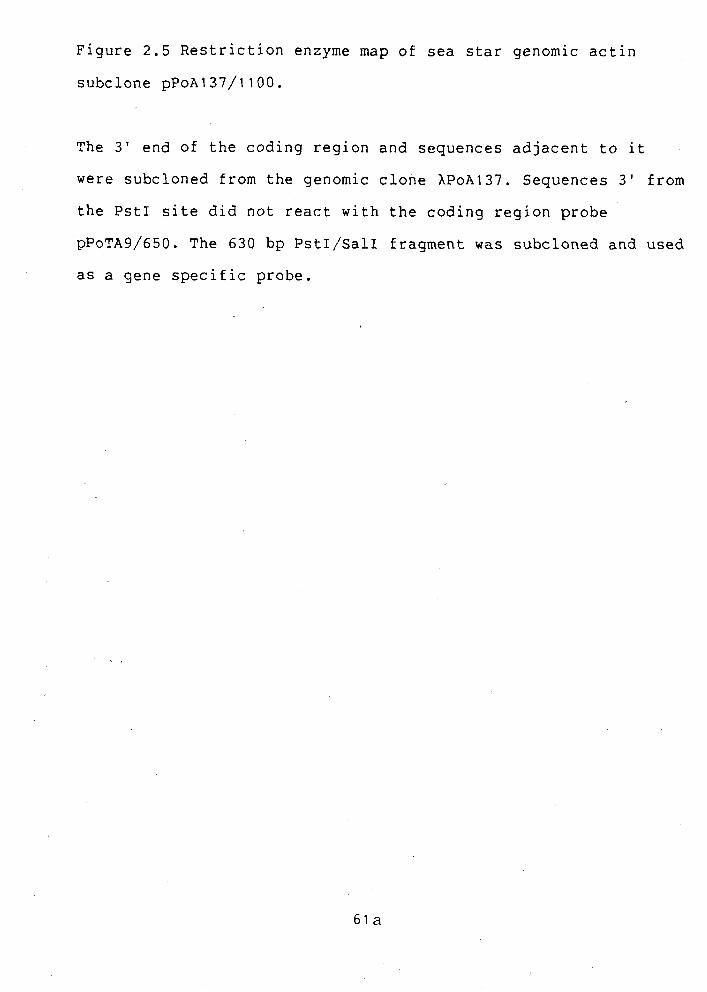
Figure 2.5 Restriction enzyme map of sea star genomic actin
subclone p~o~137/1 100.
The 3' end of the coding region and sequences adjacent to it
were subcloned from the genomic clone XPoA137. Sequences 3' from
the PstI site did not react with the coding region probe
pPo~~9/650. The 630 bp PstI/sal1 fragment was subcloned and used
as a gene specific probe.


Figure 2.6 Dot-blot hybridization of actin coding and gene
specific probes with genomic DNA.
Actin coding sequence probe was prepared from pPoTA9 insert
which had been excised from the vector with PstI and restricted
with AvaII. The AvaII fragments were end-filled with "P-~NTPS
using Klenow fragment. The preparation of the gene specific
clones are described in Materials and Methods. The fragments
were isolated and end-filled with 3 2 ~ - d ~ ~ ~ s and Klenow fragment.
The probe specific activities were approximately 1 x 10⁸
cpm p g - l . DNA extracted from the sperm of a single individual
was serially diluted to mass amounts equivalent to approximately
5 x lo5 to 16 x 106 haploid genomes, upper row of panels. The 1050 bp actin coding insert from pPoTA9 was excised by PstI
digestion. Mass amounts of the insert equivalent to 2.7 x 10⁶ to
87 x 106 copies of the actin sequence were dot-blotted, lower
row of first panel. The 460 bp non-coding region of the tube
foot cDNA pPoTA5 was prepared by digestion with HincII and PstI.
Mass amounts of the 460 bp insert equivalent to 3.1 x lo6 to 100 x l o h e r e dot-blotted on nitrocellulose filters, lower row of
second panel. The 210 bp non-coding region of the tube foot cDNA
pPoTA13 was prepared by digestion. with EcoRI and HindIII. The
630 bp non-coding region of the genomic clone XPoA137 was
prepared by digestion with BamHI and HindIII. Both of these
fragments were isolated from agarose gels and mass amounts of
insert equivalent to 5 x lo5-16 x 106 were dot-blotted on

nitrocellulose filters, lower row of third and fourth panels 1
respectively. ?'he filters were hybridized with the appropriate
32~-labeled probe, dried, and exposed to preflashed Kodak XAR-5
or BB1 film. The intensity of the autoradiographic signal
indicates that there are approximately five actin genes, one 460
bp, one 210 bp and two 630 bp homologous sequences per haploid
genome.

1 2 4 8 16 NO. GENOMES x106
& i f @ @
5.5 11 22 44 87 NO. ACTlN SEQUENCES x l o 6
1 2 4 8 16 NO. GENOMES x106
12.5 25 50 100 NO. 460 bp FRAGMENTS x106
2 4 8 16 NO. GENOMES x106
2 4 8 16 NO. 210 bp FRAGMENTS x106
2 4 8 16 NO. GENOMES x106
2 4 8 16 NO.630bp FRAGMENTS x1o6

Polymorphism and gene number jr~ sea stars -
In order to assess actin gene number and polymorphism in
actin gene regions, genomic DNA was isolated from individual sea
stars. The DNA from each of these individuals was digested with
EcoRI and electrophoresed in separate lanes of a 0.8% agarose
gel in duplicate. Bidirectional blots of the gel were hybridized
with 32P-labeled actin coding segment from the tube foot cDNA
clone pPoT~9/650 and with the three 3' probes p ~ o ~ ~ 5 / 4 6 0 ,
p~oTA13/210 and pPo~137/630. The results of this experiment are
shown in Figure 2.7.
Between the four individuals there are 9 actin-containing
EcoRI bands. Genomic DNA from an individual sea star has five or
six actin sequence-containing EcoRI segments reacting with the
pPoTA9/650 probe. Similar experiments done previously with
complete insert of pPoTA9 (Kovesdi et aJ., 1984) showed 1 1 actin
sequence-containing EcoRI segments (~ppendix B) at high
stringency washing conditions. Moreover, when EcoRI digested DNA
pooled from six individuals was probed with the actin coding
region of pPoTA9 or pDMA2 at moderate stringency washing
conditions, an additional strong band at 2.2 kb was observed.
The total of these genomic digests demonstrate that there are at
least 12 actin-containing EcoRI fragments in 5 ochraceus
genomes with fragment length of 17.1, 13.5, 12.7, 9.9, 7.6, 6.7,
6.2, 5.2, 4.6, 4.2, 3.7 and 2.2 kb.

Figure 2.7 Southern blot hybridization of ECORI-digested genomic
DNA from individual sea stars.
Genomic DNA from four individual sea stars was digested with
EcoRI. Each DNA sample was incubated with a four-fold unit
excess of EcoRI per pg-l of DNA for four hours. The completeness
of reaction was judged by.the appearance of characteristic EcoRI
bands visible in ethidium bromide stained agarose gels.(Although
all samples appeared to be totally digested judging by this
criteria, individual A did produce some smear on the gel.) The
digested DNA (10 ~g/lane) was electrophoresed in 0.8% agarose
gel in duplicate and transferred bidirectionally to two pieces
of nitrocellulose paper (Smith and Summers, 1980). The duplicate
filters were cut and the four filters were hybridized with the
indicated probes at 68'~ in 5X SSPE for 24 hours. The probes
were isolated fragments of p ~ o ~ ~ 9 / 6 5 0 , p ~ o ~ ~ 5 / 4 6 O , p~oT~13/210
and p~o~137/630 prepared as described in Materials and Methods,
and in Figure 2.6. The isolated fragments were labeled with
3 2 ~ - d ~ ~ ~ s using Exonuclease I11 and Klenow fragment to specific
activ2ties: 9 x lo7 cpm pg-', 1.7 x 1 0 8 cpm fig-', 3.2 x 10⁸
cprn pg-' and 1.8 x lo8 cpm pg-' respectively. After
hybridization, the filters were washed sequentially in 4X SET
0.2% SDS, 2X SET 0.2% SDS, 1X SET 0.2% SDS at 68'C with two 30
minute changes per salt condition. The filters were washed
finally for 20 minutes with 0.2X SET 0.2% SDS at 68'~.
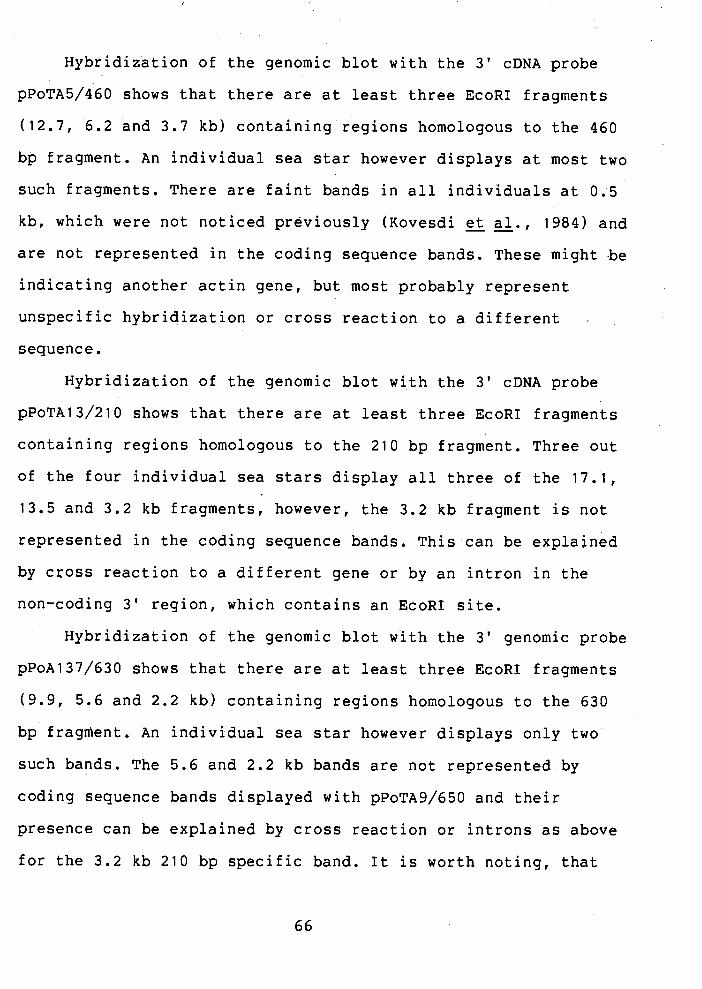
Hybridization of the genomic blot with the 3' cDNA probe
pPoTA5/460 shows that there are at least three EcoRI fragments
(12.7, 6.2 and 3.7 kb) containing regions homologous to the 460
bp fragment. An individual sea star however displays at most two
such fragments. There are faint bands in all individuals at 0.5
kb, which were not noticed previously (~ovesdi et e., 1984) and are not represented in the coding sequence bands. These might -be
indicating another actin gene, but most probably represent
unspecific hybridization or cross reaction to a different .
sequence.
~ybridization of the genomic blot with the 3' cDNA probe
p~oT~13/210 shows that there are at least three EcoRI fragments
containing regions homologous to the 210 bp fragment. Three out
of the four individual sea stars display all three of the 17.1,
13.5 and 3.2 kb fragments, however, the 3.2 kb fragment is not
represented in the coding sequence bands. This can be explained
by cross reaction to a different gene or by an intron in the
non-coding 3' region, which contains an EcoRI site.
Hybridization of the genomic blot with the 3' genomic probe
pPoA137/630 shows that there are at least three EcoRI fragments
(9.9, 5.6 and 2.2 kb) containing regions homologous to the 630
bp fragment. An individual sea star however displays only two
such bands. The 5.6 and 2.2 kb bands are not represented by
coding sequence bands displayed with pPoT~9/650 and their
presence can be explained by cross reaction or introns as above
for the 3.2 kb 210 bp specific band. It is worth noting, that
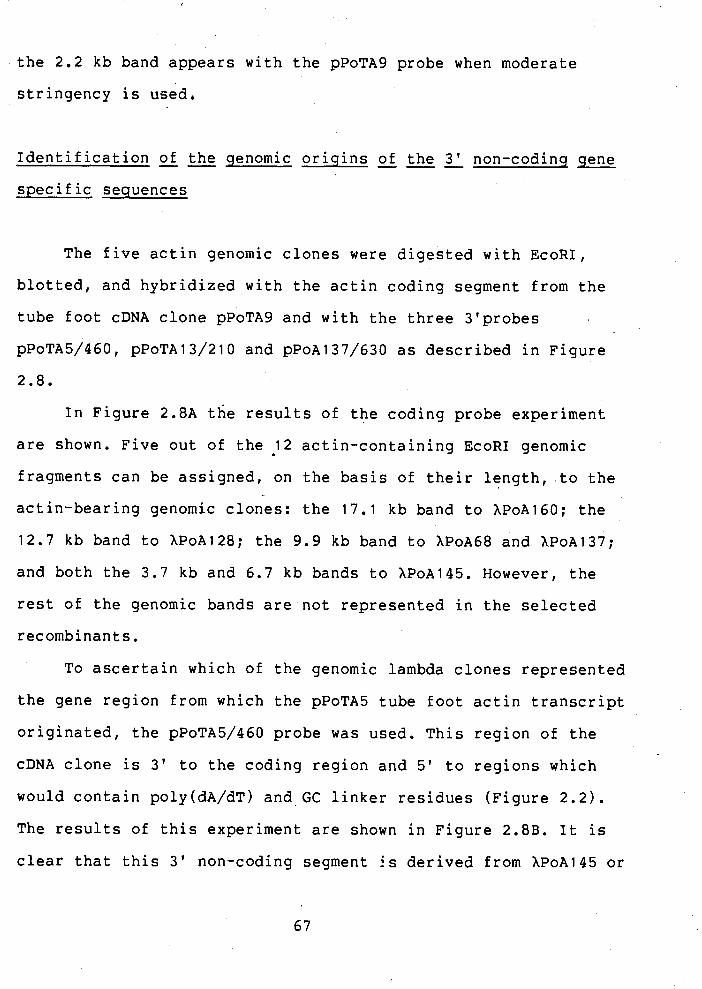
the 2.2 kb band appears with the pPoTA9 probe when moderate
stringency is used.
Identification -- of the qenomic oriqins of the 3' non-coding gene --- specific sequences
The five actin genomic clones were digested with EcoRI,
blotted, and hybridized with the actin coding segment from the
tube foot cDNA clone pPoTA9 and with the three 3'probes
p ~ o ~ ~ 5 / 4 6 0 , p~oT~13/210 and p~o~137/630 as described in Figure
2.8.
In Figure 2.8A the results of the coding probe experiment
are shown. Five out of the 12 actin-containing EcoRI genomic
fragments can be assigned, on the basis of their length, to the
actin-bearing genomic clones: the 17.1 kb band to XPoA160; the
12.7 kb band to XPoA128; the 9.9 kb band to XPoA68 and XPoA137;
and both the 3.7 kb and 6.7 kb bands to XPoA145. However, the
rest of the genomic bands are not represented in the selected
recombinants.
To ascertain which of the genomic lambda clones represented
the gene region from which the pPoTA5 tube foot actin transcript
originated, the p~oTA5/460 probe was used. This region of the
cDNA clone is 3' to the coding region and 5' to regions which
would contain poly(dA/dT) and GC linker residues (Figure 2.2).
The results of this experiment are shown in Figure 2.8B. It is
clear that this 3' non-coding segment Is derived from XPoA145 or

~igure 2.8 Blot hybridization of genomic clones.
A/ Blot hybridization of genomic clones with actin coding
sequence from pPoTA9,
Five genomic lambda clones were digested with EcoRI,
electrophoresed in a 0.8% agarose gel, and transferred to a
nitrocellulose filter. The filter was hybridized with
32~-labeled insert from the actin cDNA pPoTA9. The genomic
clones XPoA128, XPoA145, and XPoA160 have distinctive blot
patterns. XPoA68 and XPoA137 each contain a 9.9 kb actin
positive fragment but differ in their restriction maps (~ppendix
A) The left panel is a photograph of the ethidium bromide
stained gel of the EcoRI digests prior to Southern transfer. The
right panel is the auto-radiograph of the hybridized
nitrocellulose filter.
B/ Southern blot hybridization of sea star genomic clones with
pPoTA5/460 3' non-coding region.
Intense hybridization occurs with the 3.7 kb 3' terminal
fragment from XPoA145 and with the 12.7 kb EcoRI fragment from
XPoA128; When blots are given a final wash in 0.2X SET 0.2%SDS
at 68OC the faint hybridization with the 9.9 kb fragment of
XPoA68 and XPoA137 and with the 17.1 kb XPoA160 insert is no
longer evident.
C/ Southern blot hybridization of sea star genomic clones with
p~o~137/630 3' non-coding region.
Intense hybridization occurs only with the 9.9 kb fragment from -

APoA137 and XPoA68.
D/ Southern blot hybridization of sea star genomic clones with
p ~ o ~ 1 3 / 2 1 0 3' non-coding region.
Intense hybridization occurs only with the 17.1 kb fragment from
APoAl6O.
All the blots were hybridized at 68OC in 5X SSPE and washed
sequentially with decreasing salt concentration to 1 X SET 0.2%
SDS at 6 8 O C .


XPoA128 gene regions. The intensity of the autoradiographic
signal is highest in the 3.7 kb EcoRI fragment derived from
XPoA145. The reaction with the 12.7 kb EcoRI fragment from
XPoA128 is only slightly less intense. The 460 bp 3' fragment of
pPoTA5 retains some homology to the clones XPoA68 and XPoA137 as
well as just detectable hybridization with the 17.1 kb APoA160
recombinant. The blots of the X clones with the 460 bp 3'
fragment were washed with 1X SET 0.2% SDS at 68OC for two hours.
When blots are washed with 0.2X SET 0.2% SDS at 68OC for two
hours, the homology of the 460 bp fragment with XPoA68, 137, and
160 is not apparent. The above analyses indicated that at least
two gene regions represented in the X clones could be the
origins of this expressed 'tube foot actin.
To verify the specificity of the p~o~137/630 probe,. the 630
bp fragment originating from XPoA137 was hybridized to the five
X genomic clones (~igure 2.8C). Intense hybridization occurred
only with the 9.9 kb fragment from XPoA137 and hPoA68, although
washing of the fi1ter.s was done at moderate stringency.
To verify the genomic origin of the tube foot expressed
actin transcript from which the pPoTA13 cDNA clone was derived,
the five X genomic clones were hybridized with the p~o~A13/210
probe (F'igure 2.8~) It is clear that this 3' non-coding segment
is derived from XPoA160 gene region as intense hybridization
occurred only with the 17.1 kb fragment. There is no.cross
reaction between the other clones even at moderate stringency
wash.
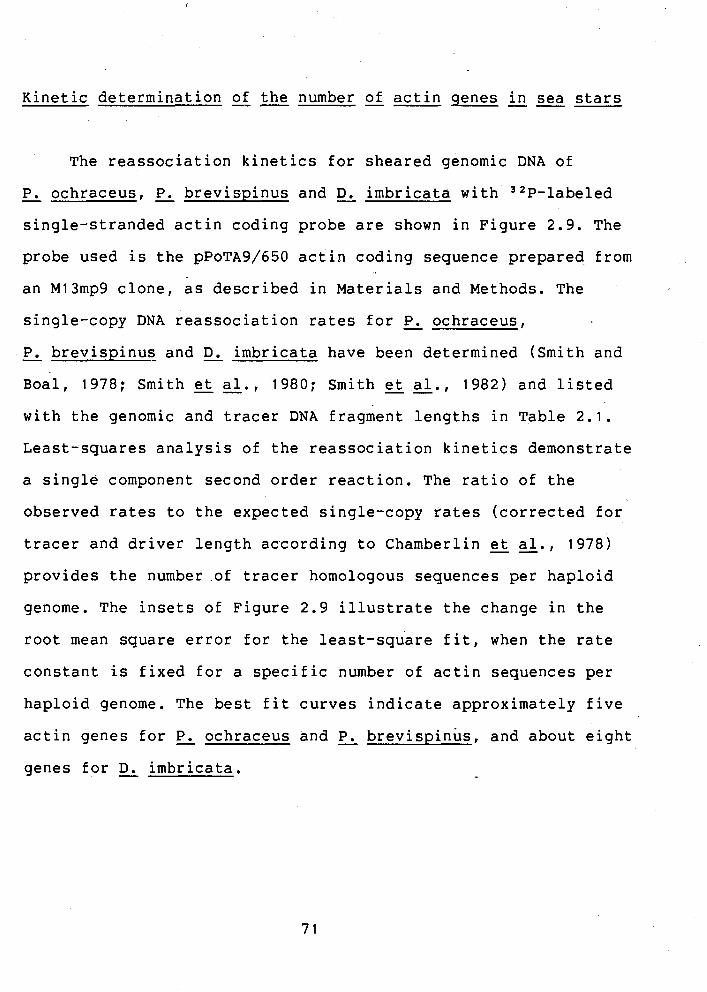
Kinetic determination of the -- number genes in sea -- stars
The reassociation kinetics for sheared genomic DNA of
P. ochraceus, 5 brevispinus and imbricata with j2p-labeled - single-stranded actin coding probe are shown in ~igure 2.9. The
probe used is the pPoT~9/650 actin coding sequence prepared from
an M13mp9 clone, as described in Materials and Methods. The
single-copy DNA reassociation rates for - P. ochraceus,
P. brevispinus and D. imbricata have been determined (Smith and - -
Boal, 1978; Smith et e . , 1980; Smith et e . , 1982) and listed
with the genomic and tracer DNA fragment lengths in Table 2.1.
Least-squares analysis of the reassociation kinetics demonstrate
a single component second order reaction. The ratio of the
observed rates to the expected single-copy rates (corrected for
tracer and driver length according to Chamberlin - et g . , 1978) provides the number of tracer homologous sequences per haploid
genome. The insets of Figure 2.9 illustrate the change in the
root mean square error for the least-square fit, when the rate
constant is fixed for a specific number of actin sequences per
haploid genome. The best fit curves indicate approximately five
actin genes for - P. ochraceus and - P. brevispinus, and about eight
genes for - D. imbricata.

Figure 2.9 Hybridization of actin coding sequence probe with
excess genomic DNA from three sea stars.
Large excess of sheared genomic DNA was used from three
different species of sea stars to drive the 3ZP-Labeled
single-stranded actin coding sequence probe in hybridization
kinetic experiments. The probe was the p ~ o ~ ~ 9 / 6 5 0 actin coding
sequence prepared from an M13mp9 clone, as described in
Materials and Methods. The specific activity of the probe was
approximately 1 x l o 9 cpm jig-'. (see Table 2.1 for the second
order rate values and the fragment length of the tracer and
driver DNAs.) The solid lines are computer least-square best
fits to the data. The insets illustrate the change in the root
mean square error for the least-square fit, when the rate
constant is fixed for various numbers of actin sequences per
haploid genome.

\ ACTlN SEQUENCE NC
brevispinus
ACTlN SEQUENCE NO
-
-
t ACTlN SEQUENCE NO
-
Log Equivalent C o t
72b

IV. DISCUSSION
Analyses of the genomic DNA blots (~igure 2.7) indicate
that there are at most five distinct non-allelic actin genes in
P. ochraceus. For an individual sea star the greatest number of - actin positive bands in EcoRI digested genomic DNA is six. If
two of these are due to the actin alleles represented by the
h145,128 clones, and all other positive genomic bands represent
distinct genes, the total is five genes. For example, individual
B in Figure 2.7 displays six EcoRI bands two of which can be
assigned to specific actin coding fragments (3.7 and 6.7 kb
bands) in the genomic clone XPoA145. If the other 4 bands
represent 3 genes there are only 4 genes in sea stars. This
argues,for four or a maximum of five actin genes per haploid
genome.
Based on genomic and dot-blot analyses with complete insert
of the pPoTA9 probe, the maximum number of non-allelic actin
genes in - P. ochraceus was estimated to be six (Kovesdi et e., 1984). Hybridization with the pPoTA9 probe showed a maximum of
eight actin positive bands in EcoRI digested genomic DNA from an
individual sea star (Appendix B).
The different results with the two probes indicate that the
4.6 and 4.2 kb bands which are not seen in genomic blots
hybridized with the pPoT~9/650 probe are probably specific. for
sequences 5' to the 650 bp fragment. The pPoTA9 insert does not
contain the nucleotides coding for the 113 5' amino acids of
actin. Intervening sequences occur in most echinoid actin genes
at codon locations 121 and 203 and in some cases at codon 41.
(Scheller - et c., 1981; Cooper and Crain, 1982; Schuler and Keller, 1981). If there has been a conservation of the intron
121 location in sea stars, the pPOTA9 probe terminates about 20
nucleotides 5' of the intron junction. Therefore, polymorphic
EcoRI sites present within introns could account for the extra
two bands observed when this probe was used.
The disparity in signal strength between autoradiographic
bands within individual genomic blots may indicate multiple
copies of actin genes. However, a comparison of Figure 2.7 and
Appendix B shows that the p~o~A9/650 probe produces much less
signal strength difference than the complete pPoTA9 insert,
indicating that most of the disparity is probably due to an
artifact resulting from the nature of the probe. c is parity in
blot signal strength is certainly not evident for a given band
between individuals when the DNA is digested with PstI and other
restriction enzymes recognizing hexamers, e.g. BamHI and Hind111
(Kovesdi - et s., 1984).
In Figure 2.7 every band hybridizing to the p ~ o ~ ~ 9 / 6 5 0
coding probe can be assi-gned as well to a 3' specific band on
the basis of their length with the exception of the 6.7 kb and
5.2 kb bands. The 6.7 kb band is probably the actin coding
fragment from XPoA145 (see above). This genomic clone also
contains the 3.7 kb 3' fragment reacting with the pPo~A5/460

probe. The-5.2 kb band-is present in individual B when probed
with the coding region probe pPoTA9/650. When probed with the 3'
non-coding region of pPoA137/630 a band appears at 5.6 kb. It
can be assumed then that the 5.2 kb fragment represents a coding
region which has an EcoRI site near or adjacent to its 3' end.
This fragment could originate from the XPoA137,68 family as the
coding portion of the 5.6 kb 3' specific fragment. The 5.2 -kb
band is not represented in the selected recombinant X clones.
The 3.2 kb p~o~A13/210 and the 2.2 kb pPoA137/630 speci.fic
bands are missing in the blots hybridized with the ppo~A9/650
coding probe. Therefore these fragments probably contain the 3'
non-coding region of an actin gene. The coding portions of these
sequences may be represented by the 9.9 kb and 6.7 kb bands
respectively. Therefore, it can be concluded that the three gene
families (Appendix A) could account for all the genes in
P. ochraceus. -
Dot-blot and kinetic hybridization of genomic DNA with
actin coding sequence probe demonstrate that the number of actin
genes is on the order of five. Also, dot-blot hybridization with
the gene specific probes indicates (Figure 2.6), that there are
one pPo~A5/460, one pPo~A13/210 and two pPoA137/630 homologous
sequences per haploid genome. These results agree with the
.genomic blot data (Figure 2.7) regarding the pPo~A5/460 and
pPoA137/630 specific probes (minimum of one homologous gene
each), but contrary to the minimum of two genes expected for the
pPoTA13/210 probe.
P. ochraceus shows an overall polymorphism of single-copy - DNA between individuals on the order of 5% (Smith et g . , 1982). As a result we would expect that approximately one in four
hexamer recognition sites could contain a single base change.
There would not be any phenotypic selection for such changes if
they occurred in non-functional regions between and within
genes. The genomic blot data were used to estimate polymorphism
in actin gene regions by comparing the restriction fragment
distribution between pairs of individuals by the method of .
Engels (1981). All unique pair combinations were estimated, e.g.
estimates were made for A vs. B through F individuals, as well
as estimates of B vs E, F etc., resulting in a range of
estimates from 1.3% to 3.8%. Previous estimates by Kovesdi
et al. (1984) were 1.0% to 3.6% for EcoRI digestions and 1.6% to -- 2.8% for PstI digestions. All of the estimated values were lower
than estimates of total single-copy DNA polymorphism observed
for - P. ochraceus (Smith -- et al., 1982).
The five actin clones characterized (~ppendix A) represent
three classes or categories of genes. There are 13 other
recombinants whose preliminary restriction maps and Southern
blot hybridization patterns relate them to these five clones.
The three classes of genes are distinguished by homology in
restriction enzyme sites particularly in the regions 5' to the
coding fragments. This homology of restriction site location is
most striking in the gene class represented by XPoA145,128 where
there is only one site difference in the 8 kb fragment bound on

the 3' end by an SstI site and at the 5' end by an EcoRI site
(Appendix A). In the gene class represented by clones XPoA68 and
XPoA137, there is homogeneity in the location of EcoRI, SstI,
and some KpnI, HindIII, and SalI sites. However there is
considerably more divergence than that found in the XPoA145,128
category. Kovesdi -- et al. (1984) estimated the sequence
divergence between the different gene families, assuming that
there has been no major insertion or deletion of sequences
within the fragments under consideration. The distribution of
restriction sites between fragments was used to estimate genetic
divergence by the method of Engels (1981) and Jefferys (1981).
It was estimated that there is on the order of 1% divergence
between the 8 kb regions of clones XPoA145 and XPoA128 indicated
by the heavy arrows in Appendix A. In these segments there are
eight sites common to both clones and one divergent. The
divergence between XPoA137 and XPoA68 was calculated for the 13
kb region indicated by the heavy arrows in Appendix A. The
sequence divergence in that region is on the order of 10%. This
analysis suggests that XPoA145,128 are alleles and XPoA137,68
are related and probably represent a fairly recent duplication
event.
The conclusion of the above analysis is that-in
P. ochraceus there are probably four or five genes per haploid - genome, one from the XPoA145,128 two from the XPoA137,68 and one
or two from the APoA160 families (Appendix A).

The classes of genes found in the sea star genome are
reminiscent of the four categories of actin genes found in sea
urchin (Scheller - et g . , 1981; Lee et e . , 1984). The sea star - clones described here do not display linked genes reported for
Dictyostelium ( ~ c ~ e o w n - et e., 19781, & purpuratus (Scheller
et e., 1981; Schuler and Keller, 1981)' and C. elegans (~iles - - et e . , 1983). The data do not, however, exclude the possibility - of actin gene linkage in P. ochraceus.
Lee -- et al. (1984) defined an actin gene subtype in the sea
urchin system as those actin genes which react at a 55OC, 0.75 M
Na' ( 5 ~ SET), 1X SET wash at the same temperature condition with
a specific 3' terminal probe. In - P. ochraceus the pPoTA5/460
probe cross reacts with the XPoA137,68 and XPoA16O gene families
at a 13OC higher temperature (Figure 2.8~). It is best to be
cautious when inferring nucleotide homologies from hybridization
results (discussed by patient, 1984). However, due to lack of
sequencing dat.a, it could be assumed that there are 3'
non-coding regions which are conserved through large
evolutionary distances. The same 460 nt sequence also appears to
be highly conserved between - P. ochraceus and 5 brevispinus (C.
Cuddeford and M.J. Smith unpublished observations). This is a
situation very siinilar to that described for the CyI cytoplasmic
S. purpuratus actin gene (Lee et e . , 1984). The untranslated 3' - region of this gene has been specifically conserved during a
minimum of 150 million years of sea urchin evolution. Ordahl and
Cooper (1983) showed that rat and chicken skeletal muscle

a-actin genes has conserved blocks of homologous sequences in
the 3' terminal regions. They concluded similarly to Lee et al. -- (1984)~ that the localized conservation is probably functional
and maintained by selection pressure.
DNA hybridization kinetic experiments determined the number
of actin genes per haploid genome as five for - P. ochraceus and
P. brevispinus. The sequence homology of single-copy DNA was - used to establish phylogenetic relatedness between different sea
stars (Smith et e . , 1982). The divergence time was estimated
for these two closely related species to be between 4 and 1 1
Myr, therefore the similarity in the number of actin genes is
not suprising. The fossil record as well as sequence divergence
of 5s RNA indicate a divergence time for sea urchins from sea
stars of at least 500 Myr (Paul, 1977; Ohama et e., 1983). The divergence times between - P. ochraceus and - D. imbricata are also
in this time range (Spencer and Wright, 1966; Smith - et e., 1982). Although - D. imbricata has a smaller genome size, the
number of actin genes appear to be about eight. This is the same
number that was determined for Strongylocentrotus purpuratus
(Lee et e . , 1984).
It has been reported (Kabat-Zinn and Singer, 1981) based
upon in vitro translation and RNA-driven hybridization of cDNA,
that as much as 60% of the sea urchin tube foot mRNA is actin
transcript. Tube foot is a contractile tissue and as such should
be enriched in actin mRNA, however these results indicate that
the tube foot plasmid cDNA library described here contains about
0.8% and the XgtlO library about 0.3% actin sequence clones.
These values are higher than the more accurate estimates
presented in Chapter 111, and may reflect an efficiency of
cloning or reverse transcription of actin-mRNA. The XgtlO egg
and gastrula cDNA libraries contain approximately 0.3% actin
sequence clones. This value agrees with the proportion of actin
transcripts found in sea urchin gastrula or pluteus RNA
populations. In these embryonic systems the fraction of
transcripts or cDNA clones which contain actin sequence is in
the range 0.1 to 0.3% (Lasky et g . , 1980; Crain -- et-al., 1981;
Flytzanis et g. , 1982; Shott et e., 1984). The amino acid sequence of actin from evolutionarily
diverged organisms is highly conserved (Vandekerckhove and
Weber, 1978a; 1978b) and therefore most of the base
substitutions are expected in the third position of a codon. The
partial comparision of the two expressed actin sequences from
tube foot, pPoTA9 and pPoTA13 with the sequence of pSpG17, a
genomic sea urchin actin clone (Cooper and Crain, 1982) shows no
amino acid replacements (~igure 2.4). Coding region differences
between the three sequences are: 7 out of 123 between pSpG17 and
pPoTA13, 2 out of 40 between pPoTA9 and pPoTA13 and 1 out of 40
between pPoTA9 and pSpG17. Earlier reports have documented the
uniqueness of 3' non-coding regions of actin genes in several
organisms (reviewed in Davidson et G . , 1982b). As expected,the 3' region of pPoTA13 is highly diverged from the pSpG17
sequence. There are 47 nucleotides which differ out of 65, -

indicating complete randomness in the region assessed.
Three different 3' fragments were used in this study to
identify the specific genes in a Charon 4 library from which
these sequences originated. Hybridization of these 3' non-coding
region probes with genomic DNA from several individuals under
stringent criteria has demonstrated that there are at least
three restriction fragment polymorphs for each of the three
actin gene families in the sea star population. The band
intensity of positive EcoRI fragments in genomic blots as well
as the dot-blots probed with these sequences show that the
p~o~A5/460 specific gene is single-copy in the genome, and the
other two gene families are represented probably by two copies
each. This study also shows that in P. ochraceus there are - approximately five non-allelic actin genes. This finding is in
agreement with reports for other eukaryotes (reviewed in Firtel,
1981) . At least two of the actin genes have been shown here to
be present in tube foot transcript populations and one of them
also prevalent in egg and gastrula. The restriction fragment
length polymorphism in the vicinity of actin genes reflects the
total polymorphism observed for single-copy DNA found in earlier
studies (smith - et - a1 P 1982) .

D. CHAPTER 111
Actin Transcript Concentration in Pisaster ochraceus Early
Development and Tube Foot

I. INTRODUCTION
Early embryonic development is dependent on the large store
of maternal RNA accumulated in the egg through oogenesis
(reviewed by Davidson, 1976; Brandhorst - et e., 1983). The complexity of this RNA could be sufficient to code for
approximately 20000 diverse proteins (Kovesdi and Smith, 1982).
However, early cleavage stage polysomal RNA in sea urchins can
account for only approximately 70% of the sequence set found in
eggs (~ough- vans et e., 1977). Also, many of. the stored molecules contain multiple tracts of oligo(~) (~uncan and
Humphreys, 1981) and at least 65% of the mass of egg poly(A)+
RNA consists of covalently-linked single-copy and repeat
sequence transcripts in both sea urchin and Xenopus eggs
(Constantini - et -* a1 I 1978; 1980). These transcripts might be
processed during embryogenesis and in this way may provide the
necessary mRNA concentration until the embryo's own
transcriptional system takes over.
Studies on prevalent cytoplasmic poly(A)+ RNAs from sea
urchins show that the abundance of most of these transcripts are
similar in eggs and plutei but have an intervening stage when
they decline (~lytzanis -- et al., 1982; Lasky - et gl-. , 1980)
indicating prcbably a switch from the maternal supply to new
transcripts.

Cabrera -- et al. (1984) showed recently that the parameters
which determine the level of expression of any given-gene in the
embryo are the amount and stability of the maternal RNA and the
cytoplasmic entry rate and stability of the newly synthesized
embryo transcripts. It appears that these parameters vary for
each transcript. In sea urchins the maternal store of histone
transcripts comprise 5 to 10 percent of the total quantity of
mRNA (reviewed in Davidson, 1976; Raff, 1983). On the other end
of the scale is actin, which is not represented significantly in
the maternal RNA of sea urchins (Crain - et - a1 1981; Merlino
et e . , 1981; Shott et e . , 1984). The patterns of expression of - these highly conserved structural genes are maintained through
large evolutionary distances (Bushman and Crain, 1983) and a
change in their regulation might indicate major modification in
a developmental pathway (~aff et al., 1984).
In order to investigate the storage and stage-specific
utilization of RNA transcripts, the expression of actin genes
was studied. The experiments in this chapter deal with the
measurement of relative abundance and absolute number of actin
transcripts in - P. ochraceus early development and in the adult
tube foot tissue.
11. MATERIALS AND METHODS
RNA dot-blots -
RNA from tube foot, egg, 21 h post-fertilization blastula,
48 h early gastrula and 72 h late gastrula was denatured with
glyoxal (~homas, 1983), serially diluted and blotted onto a 20X
SSPE soaked nitrocellulose paper with a BRL dot-blot manifold.
The filters were hybridized with the appropriate 32~-labeled
probe at 4 2 O ~ in 5X SSPE, 0.3% SDS, 5X Denhardt's solution, 50%
formamide and washed sequentially with decreasing salt
concentration to 0.2X SSPE 0.2% SDS at 68OC and exposed to
preflashed Kodak XAR-5 or BBI film.
RNA transfers -
RNA from tube foot, egg, 21 h blastula, 48 h early gastrula
and 72 h late gastrula was electrophoresed in 1.0 or 1.5%
formaldehyde agarose gel (~aniatis - et - a1 I 1982) or RNA was
glyoxalated and electrophoresed according to the method of
Thomas (1980). The RNA was transferred to nitrocellulose paper
or to Pall Biodyne A nylon membrane. The filters were hybridized
with the appropriate 32~-labeled probe at 42OC in 5X SSPE, 0.3%
SDS, 5X Denhardt's solution, 50% formamide, washed sequentially
with decreasing salt concentration to 0.2X SSPE 0.2% SDS at 68'~
and exposed to Kodak XAR-5 or BBI film.
When rehybridization was planned, the filters were exposed
damp in saran wrap. After visualization of the autoradiograph
bands the filters were washed in 99% formamide 1OmM PB at 70'~
for one hour or heated to 100•‹c in H,O, rinsed in 1X SSPE at
room temperature and rehybridized with the next probe.
P. ochraceus and E. coli ribosomal RNA was used for size 7
markers.
Densitometry
Autoradiograms of RNA dot-blots were scanned by an ACD-18
Automatic computing densitometer, Gelman Scientific Inc.;
autoradiograms of RNA transfers were scanned by a Jarrell-Ash
Recording ~icrophotometer.
MI3 - single-stranded probes
The construction and preparation of the single-stranded
probes were described in Chapter 11.

RNA driven hybridization kinetics -
RNA driven hybridization with single-stranded DNA was
performed as described in Chapter I. The only deviation from the
original protocol was the omission of the RNase treatment, as
parallel reactions without RNA indicated negligible amount of
contaminating RF DNA from the MI3 clones.
32P-labeled DNA was reacted with a mass excess (>I x 10' :
1 ) of total or (>3 x lo4 : 1 ) poly(~)+ RNA.
Reactions were performed in 0.12 M PB (equimolar mono- and
disodium phosphate buffer) at 60•‹C and in 0.41 M PB or 0.38 M PB
at 67OC. All Rot values were corrected for acceleration in
reaction rate relative to the rate in 0.12 M PB at 60•‹C due to
higher Na+ concentration (Van Ness et &., 1979). A comparison
of 0.12 M PB reaction rates with the 0.41 M PB rates for the
actin coding sequence indicated that the rate correction factor
of 2.5 (van Ness - et &., 1979) should be used for 0.41 M PB
instead of the previously published 5 determined by ~ritten
et al. (1974) for randomly sheared DNA. 7 -
The above contradicts results found in Chapter I, where a
rate correction factor of 5 was applied. Experiments in Chapter
I used a heterogeneous population- of randomly sheared DNA as
probes. Similarily to Van Ness -- et al. (1979), this chapter deals
with homogeneous DNA fragment probes. Theoretically it is not
clear as to how this difference could account for the
discrepancy. Only further experimentation may resolve the exact

nature of the problem.
Hybridization reactions were analysed by procedures
described earlier in Chapter I. Data were analysed by a
least-squares fitting procedure (Pearson, - et e., 1977).
Saturation hybridization
Hybridization, hydroxyapatite chromatography and the
quantitative treatment of data were done essentially as .
described by Scheller -- et al. (1978).
The specific activities of the 3' specific probes were
calculated by standard curves obtained by titrating the probe
against increasing quantities of unlabeled cold DNA inserts.
This procedure is explained in detail by Mauron et e. (1981). The reactable sequence in the mixture is the strand of the
insert which is of messenger polarity and its mass fraction is
therefore 1/a = 0.5. The proportion of the probe in hybrid form,
T/TO, was assayed by hydroxyapat i te chromatography. The
titration is expresed as T/TO vs R', where R' is the ratio of
unlabeled DNA mass to labeled probe cpm. The titration data were
fitted by a least-squares program (provided by D. ~ilson) to the
equation T/TO = ( 1 + (a'/~'))-' (Scheller - eta1 -* I 1978; Mauron
et e . , 1.982) which has a linear initial slope, l/al, for low R' - values. Therefore, the specific activity of the probe can be
calculated as S = (l/al)/(l/a)

Using RNA, the initial titration curve can be described by
the equation T/TO = ~ / a = (R' x S)/a = R'/aV. Knowing the
specific activity (S), the fraction of total RNA mass present as
probe specific RNA can be calculated as 1/a = (l/aV)/s and the
transcript as fraction of RNA mass becomes ((l/af)/S x (LR/LP),
where LR- is the RNA transcript length and LP is the length of
the probe.
All RNA samples used in the experiments were tested for
contaminating DNA by subjecting an aliquot of the hybridization
reaction corresponding to the highest RNA/DNA ratio to RNase A
digestion in 0.02 M PB (50 pg ml-'1 at 37OC for 1 h. The samples
were adjusted to 0.12 M PB before chromatography. RNase
treatment reduced hybridization values to background levels,
demonstrating that there was no detectable DNA contamination.
The specific activity of the actin coding probe was
determined as follows: The maximum possible specific activity
was calculated to be 1.27 x lo9 cpm pg-' by using the sea urchin
pSpG17 actin sequence. Probes were sized on denaturing agarose
gels just after extension with the Klenow fragment (see
Materials and Methods, Chapter 11). The change in length of the
probe was evaluated periodically on denaturing agarose gels.
This length was compared with the expected theoretical decay of
a probe with different calculated specific activities. The
theoretical and experimental values agreed with an initial
specific activity of 1 x lo9 cpm fig-' ( 5 0.2 x lo9 cpm pg-'1.

I I I . RESULTS
Actin gene specific probes
The expression of actin genes during early devlopment and
in tube foot were analysed by the gene specific probes-described
in Chapter 11. The coding region probe p ~ o ~ ~ 9 / 6 5 0 was used to
assess the total actin sequence concentrations. The presence of
gene products originating from the XPoA145,128 family, the
XPoA137,68 family and the XPoA16O family was investigated by
probes pPo~A5/460, p~o~137/630 and p ~ o ~ ~ 1 3 / 2 1 0 respectively (see
~ppendix A for description of gene families).
Expression of actin genes in tube foot tissue -- ---
To investigate the expression of the different actin genes
in tube foot, glyoxalated RNA was serially diluted, dotted onto
nitrocellulose and reacted with 32~-labeled gene specific probes
(~igure 3.1).
Both XPoA160 and the XPoA145 gene families are expressed in
tube foot, as was expected. Unexpectedly the relative amount of
reaction with the p ~ o ~ ~ 5 / 4 6 0 probe was much lower than with the
p~oT~13/210 fragment, indicating that most of the transcripts
originate from XPoA16O. The tube foot cDNA libraries from which

Figure 3.1 Dot-blot hybridization of actin coding and gene
specific probes with total RNA.
The probes p~o~A9/650, pPo~A5/460, p~o~A13/210 and pPo~137/630
were described in Chapter 11 and in Figure 2.7. Total RNA from
tube foot(^), egg(E), 21 h blastula(^), 48 h early gastrula(^)
and 72 h late gastrula(l) was denatured with glyoxal (~homas,
1983), serially diluted and blotted onto a 20X SSPE soaked
nitrocellulose paper with a BRL dot-blot manifold. The filters
were hybridized with the appropriate 32P-labeled probe at 42'~
in 5X SSPE, 0.3% SDS, 5X Denhardt's solution, 50% formamide and
washed sequentially with decreasing salt concentration to 0.2X
SSPE 6.2% SDS at 6 8 ' ~ and exposed to preflashed Kodak XAR-5 or
BB1 film. Results of the p~oA137/630 hybridization are not
shown, because this probe did not react with any of the RNA
samples.

0.16 0.31 0.63 1.3 2.5 5.0
RNA / spot (pg)

these sequences originate from showed a large excess of Xpo~145
class over XPoA160 class of specific clones. These results
indicate a preferential selectivity on oligo(dT) columns or in
cloning for the XPoA145 product. The p~oA137/630 probe did not
show any reaction to total or poly(A)+ tube foot RNA even at two
weeks of exposure. This indicates that if XPoA137 transcripts
are present, they must be less than 0.3% of the actin transcript
population. It also must be kept in mind, that this is a genomic
DNA probe, and there is always the possibility that this gene
has a very short 3' end or has a large 3' intron not transcribed
into RNA.
The size of the transcripts were assayed by RNA transfers
(E'igure 3.2) of 1.5% denaturing agarose gels. E. coli (Brosius .- - et e., 1978; 1980) and P. ochraceus ribosomal RNA was used as - - size markers. Glyoxalated 5 ochraceus RNA was previously
measured against X Hind111 and EcoRI digests (Mc~aster and
Carmichael, 1977). The ribosomal peaks were determined to be
approximately 3850 nt and 1800 nt respectively.
Two bands, a 2300 nt and a 2200 nt were homologous to the
actin coding probe. The 2300 nt band, which is specific to the
XPoA145 gene family, is observable only on long autoradiographic
exposures. The 2200 nt band is specific to tube foot, and
probably accounts for most of the actin transcripts present in
this tissue. Comparison of the relative abundance of the coding
and XPoA145 specific transcripts (~igure 3.3) would indicate
that this gene could be responsible for as much as 30% of the

Figure 3.2 Expression of actin genes in sea star development and
tube foot.
The probes pPoT~9/650, pPoT~5/460, pPoTA13/2 10 and pPoA 137/630
were as described in Chapter I 1 and in the legend to Figure 2.7.
Total RNA from tube foot(^), egg(^), 21 h blastula(^), 48 h
early gastrula(G) and 72 h late gastrula(l) was electrophoresed
in 1.5% formaldehyde agarose gel for seven hours at 90V,
transferred to Pall ~iodyne A nylon membrane. The filter was
hybridized with the first 32~-labeled probe at 42OC in 5X SSPE,
0.3% SDS, 5X Denhardt's solution, 50% formamide, washed
sequentially with decreasing salt concentration to 0.2X SSPE
0.2% SDS at 68'~ and exposed to Kodak BBI film. After
visualization of the bands the filter was washed in 99%
formamide lOmM PB at 70•‹c for one hour, rinsed in IX SSPE at
room temperature and rehybridized with the next probe. Results
of the pPo~137/630 hybridization are not shown, because this
P ochraceus probe did not react with any of the RNA samples.
and E. coli ribosomal RNA was used for size markers. --

TE
BG
L
TE
BG
4
BG
L
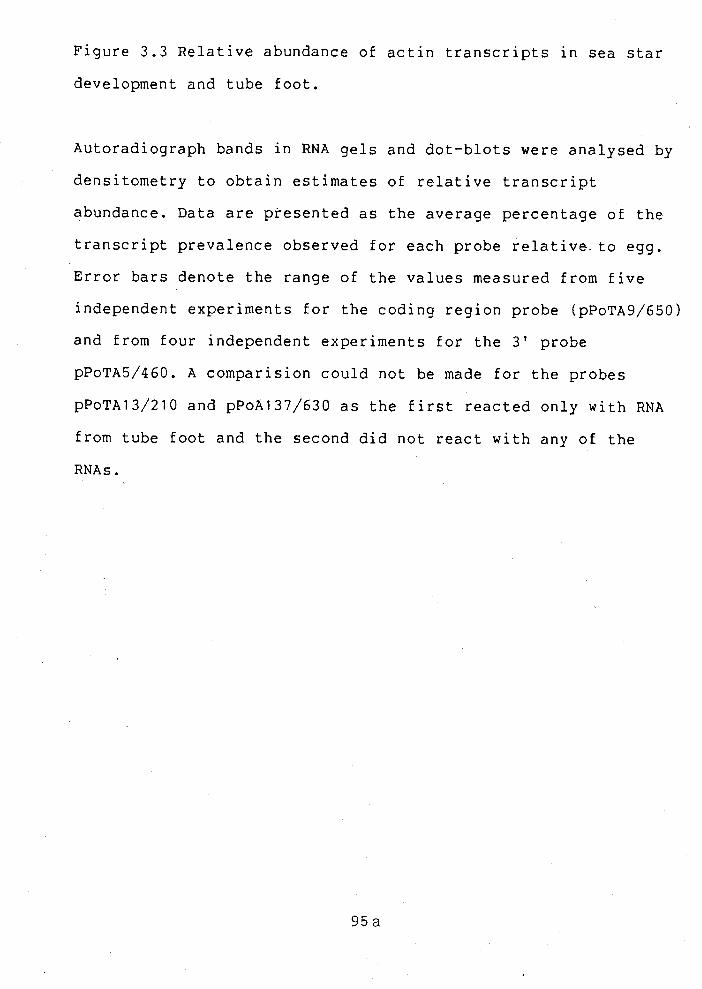
Figure 3.3 Relative abundance of actin transcripts in sea star
development and tube foot.
Autoradiograph bands in RNA gels and dot-blots were analysed by
densitometry to obtain estimates of relative transcript
abundance. Data are presented as the average percentage of the
transcript prevalence observed for each probe relative.to egg.
Error bars denote the range of the values measured from five
independent experiments for the coding region probe (pPo~~9/650)
and from four independent experiments for the 3' probe
pPo~~5/460. A comparision could not be made for the probes
p ~ o ~ ~ 1 3 / 2 1 0 and p~o~137/630 as the first reacted only with RNA
from tube foot and the second did not react with any of the

RELATIVE ABUNDANCE OF ACTlN TRANSCRIPTS AS PERCENT OF EGG VALUE

transcripts in tube foot. The data, however, were derived from
densitometric scans of a large number of dot-blots and RNA
transfers, some of which were done at moderate stringencies.
It was previously indicated that the p~oT~5/460 probe shows
some cross reaction with the XPoA160 gene at these conditions
(Figure 2.8~). Using only high stringency data, the XPoA145 gene
family could account for a maximum of 10% of the transcripts.
Embryo specific expression of an actin gene ---
In order to study the expression of the actin gene family
during early development, RNA was prepared from eggs, blastula
(21 h), early gastrula (48 h) and late gastrula (72 h). RNA
samples were serially diluted and dotted onto nitrocellulose
(Figure 3.1) or electrophoresed in denaturing gels (Figure 3.2)
as previously described. Hybridization with "P-labeled probes
shows that - P. ochraceus eggs contain large amounts of actin
transcripts. The intensity of reaction indicates that the level
of actin specific RNA decreases in blast'ula but increases again
in early and late gastrula. The only transcript detectable in
any of the embryonic stages tested was originating from the
hPoA145 gene family with a transcript length of 2300 nt. Very
long autoradiographic exposures with total and poly(~)+ RNA
failed to detect the XPoA137 or XPoA16O specific transcripts.
The relative abundance of the total and XPoA145 specific
actin transcripts were assessed by densitometry (~igure 3.3).

Data from five independent experiments were pooled for the total
amount of actin transcripts and from four experiments for the
hPoA145 specific probe. The change in the relative transcript
prevalance for the two different probes are indistinguishable
from each other indicating that all actin transcripts in the
embryo might originate from this gene. The transcript prevalence
drops to approximately 50% of the egg value at blastula stage
and rises back to nearly egg level in the late gastula.
To ensure equal loading of RNA and transfer, the filters
were subsequently hybridized with a nick translated ribosomal X
clone (XPORI) or with - P. ochraceus mitochondria1 DNA (gift of A.
Beckenbach). hPoR1 was derived from a - P. ochraceus h EMBL3
genomic library which was screened with a ribosomal clone of
Heterorhabitis heliothidis (gift of J. ~urren). Mitochondria1
transcripts are represented as highly prevalent transcripts in
egg and embryo poly(~)+ RNA of sea urchin (Cabrera - et e., 1983). Densitometric scans of the autoradiographs showed that
the amount of RNA available for hybridization varied less than
10% between applications.
To confirm the accuracy of the densitometric scans,
dot-blots were hybridized with ribosomal DNA. After
autoradiography the dots were cut out from the nitrocellulose
filters and counted in scintillation fluid. The relative
densitometric measurements were found to be within 10% of those
obtained by scintillation counting.

~xpression of actin genes in the eggs of different species of - - sea stars - -
The relative amount and size of maternal actin specific
transcripts were evaluated in four widely diverged species of
sea stars: Pisaster ochraceus, Evasterias troschelii,
Pycnopodia helianthoides, Dermasterias imbricata.
Total RNA was extracted from eggs and 20 pg of each was
electrophoresed on 1.5% denaturing agarose gels (~aniatis .
et al., 1982). After transferring the RNA to solid support, it -- was hybridized with 32~-labeled actin coding probe. The result
of - P. ochraceus and D. - imbricata experiment is shown on Figure 3.4. Densitometric scans of the actin specific bands indicate
that - D. imbricata egg RNA contains approximately six times more
of these sequences by mass than - P. ochraceus. - D. imbricata also
shows only a single positive band, but the transcript length is
significantly shorter (2000 nt) than that of the P. ochraceus. E. troschelii and P. helianthoides have the same size - - transcripts as - P. ochraceus (data not shown).
RNA driven hybridization and saturation hybridization to - - - determine - the-number -- of actin homoloqous sequences - in different
RNA populations -
Two methods were used to determine the average number of
actin and 3' non-coding homologous sequences in different
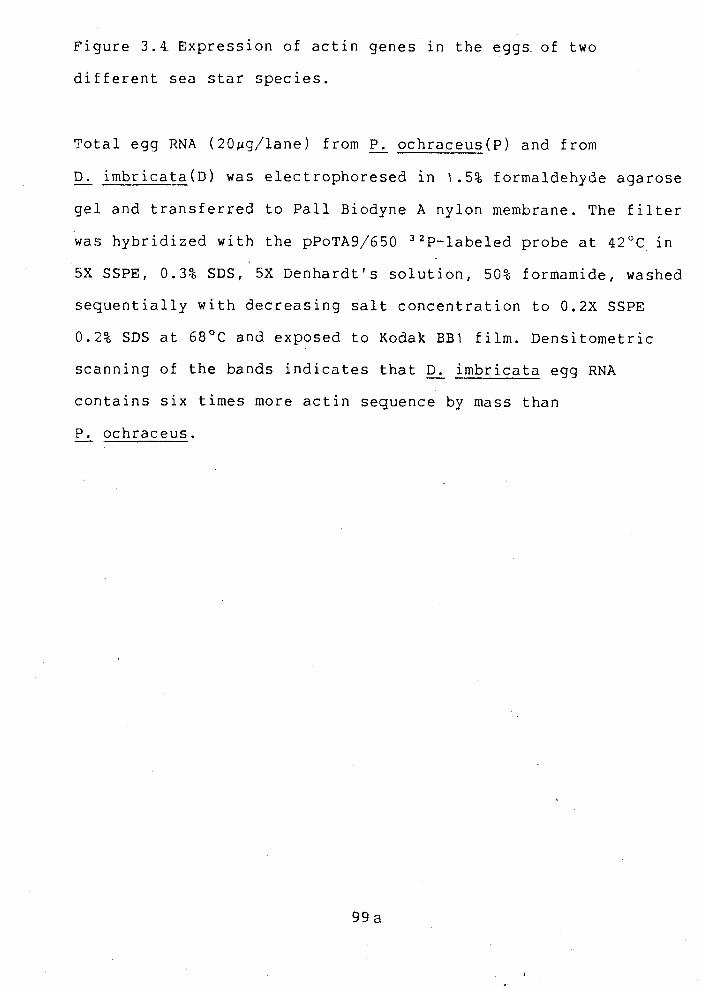
Figure 3.4. Expression of actin genes in the eggs. of two
different sea star species.
Total egg RNA (20pg/lane) from - P. ochraceus(~) and from
D. imbricata(~) was electrophoresed in 1.5% formaldehyde agarose -- gel and transferred to Pall Biodyne A nylon membrane. The filter
was hybridized with the p ~ o ~ ~ 9 / 6 5 0 32~-labeled probe at 42'~ in
5X SSPE, 0.3% SDS, 5X Denhardt's solution, 50% formarnide, washed
sequentially with decreasing salt concentration to 0.2X SSPE
0.2% SDS at 6 8 O ~ and exposed to Kodak BE1 film. Densitometric
scanning of the bands indicates that D. imbricata egg RNA - contains six times more actin sequence by mass than
P . ochraceus. -


embryonic cells and in tube foot.
In RNA driven hybridization (described in Chapter I;
ater rials and ~ethods), the expected rate of hybridization for
the specific probe length and complexity is compared to the
observed rate. Therefore, this method is sensitive to parameters
which influence the rate of reassociation; that is length of
probe and driver, salt concentration, RNA concentration and some
other variables which are discussed in more detail by Wetmur
(1976). However, it is not important to know the exact specific
activity of the tracer as long as the mass of the driver is in
large excess.
Satur.ation hybridization is based on titration of excess
single-stranded "P-labeled DNA probe with increasing amounts of
RNA (Scheller - et g . , 1978; Mauron et e., 1981). As the amount of RNA increases a greater amount of the 3 2 P - ~ ~ A is hybridized
and can be bound to hydroxyapatite as described in Materials and
Methods. Calculations of transcript prevalence carried out by
this method are not subject to the particular uncertainties
which affect the kinetic estimates, as long as the reactions are
carried out to completion, that is 210 x Cot(l/2). The length of
the reacting strands has no effect on the final results, if
St-nuclease digestion is used. However evaluation by
hydroxyapatite could cause significant overestimates if the RNA
transcripts are broken within sequences tested by the 3 " - ~ ~ A
probe. The accuracy of titration measurements are most dependent
on the specific activity determination of the radioactive probe.

Number -- of actin sequences - in different developmental stages and - in tube foot 7--
Single-stranded MI3 coding region probe was driven by a
large excess of total or poly(~)'+ RNA and the amount. of hybrids
were analysed by hydroxyapatite chromatography (~igure 3.5).
Data were fit with a single pseudo-first-order hybridization
function by a least-squares fitting program (pearson et &.,
1977). Data from repeat experiments were combined by correcting
for probe reactivities and rate of reassociation in different
salt conditions. Probe reactivities ranged between 70 and 90%.
The rate constants extracted from these data, and the calculated
values of the number of transcripts per embryo or cell are
listed in Table 3.1. The specific parameters and the calculation
methods used are described in the footnotes.
There are no accurate estimates of the amount of total RNA
content of a tube foot cell, therefore the number of transcripts
were calculated in 15 ng RNA, in order to allow some comparison
with the embryonic stages.
For example, the observed rate of hybridization (K obs) for
total egg RNA is 0.00668 M - ~ s - ' (~igure 3.5). The expected rate
(K exp) for the p ~ o ~ ~ 9 / 6 5 0 probe corrected for tracer and driver
length is 937 M-ls-l (See Chapter I for details of this
calculation). The ratio (K obs/~ exp) = 7.1 x and provides
the estimate of the fraction of RNA mass which is homologous -

Figure 3.5 RNA driven hybridization to single-stranded actin
coding probe.
Total and poly(~)+ RNA from different developmental stages and
from tube'foot was used to drive a 32~-labeled single stranded
probe (~13mp9/p~o~~9/650) in reassociation kinetics. Hybrids
were analysed by hydroxyapatite chromatography (see Materials
and Methods, Chapter I). The solid line represents the best
least-square solution for the data assuming pseudo-first-order
reaction (see figure legend, Figure 1.2). Different symbols
indicate independent experiments. The rate constants obtained
from these data fits are listed in Table 3.1.
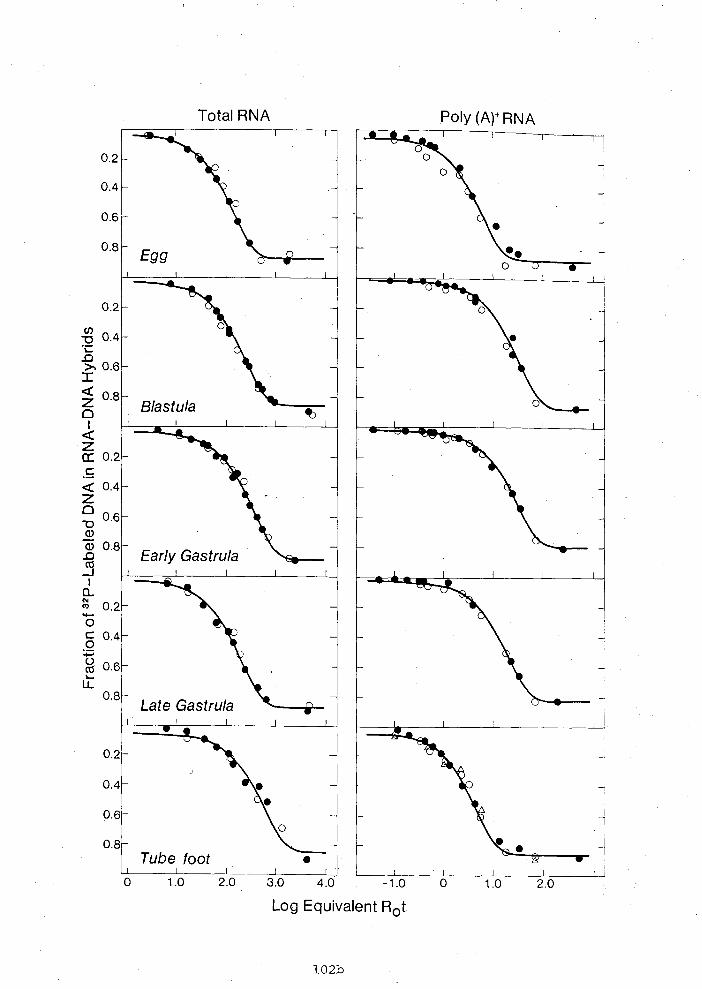

Ta
ble
3.1
De
term
ina
tio
n o
f th
e
nu
mb
er
of
ac
tin
co
din
g s
eq
ue
nc
es
in P
isa
ste
r o
ch
rac
eu
s RNA.
a
b
c S
tag
e/o
r H
yb
rid
iza
tio
n r
ate
S
lop
e (
l/a
')
Tra
ns
cri
pts
as
N
o. t
ran
sc
rip
ts
No
.tra
ns
cri
pts
T
issi
le
K
ob
s (R
MS)
f
ra
cti
on
of RNA
pe
r em
bry
o
pe
r c
ell
RNA
dri
ve
n h
yb
rid
iza
tio
n
.-
To
tal RNA
--
Egg
0.00668(3.7)
Bla
stu
la
0.00446(3.4)
E.G
ast
rul
a 0.00272(3.0)
L.G
ast
rula
0.00492(3.1)
Tu
be
foo
t-
O.OOlBO(4.6)
Po
l y (A+) -
RNA
Egg
0.164
(5.0)
Bla
stu
la
0.0358 (2.7)
E.G
ast
rula
0,0365 (1.0)
L.G
ast
rula
0.0530 (1.5)
Tu
be
foo
t 0.211
(3.3)
Sa
tura
tio
n
hy
bri
diz
ati
on
To
tal
RN
A
--
Egg
B
las
tula
E
.Ga
stru
la
Tu
be
foo
t
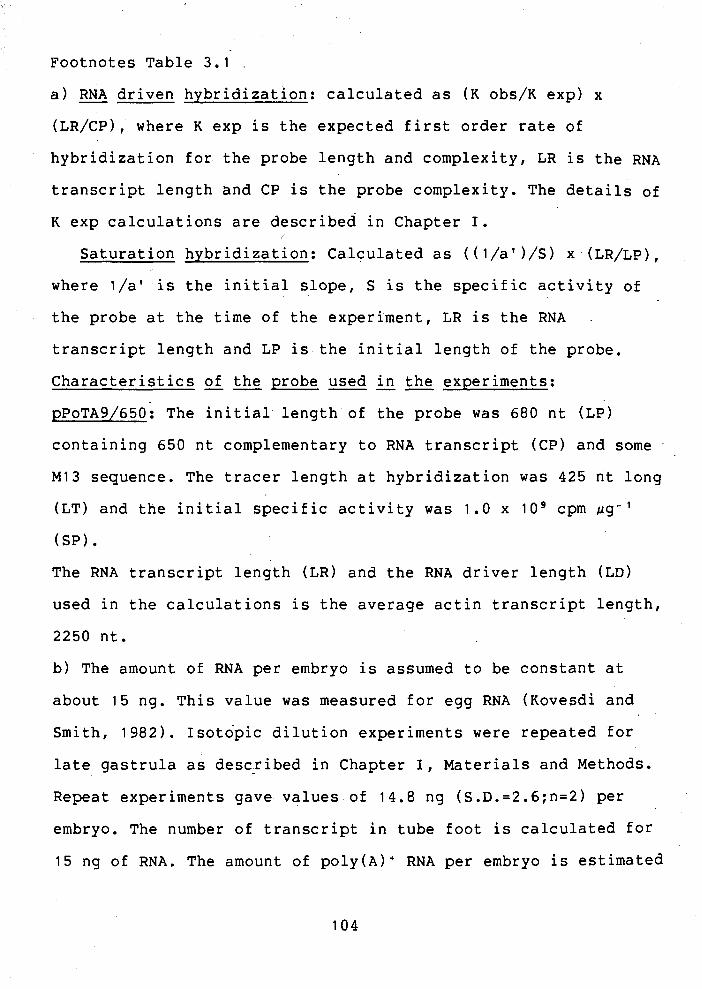
Footnotes Table 3.1 .
a) - RNA driven hybridization: calculated as (K obs/~ exp) x
(LR/CP), where K exp is the expected first order rate of
hybridization for the probe length and complexity, LR is the RNA
transcript length and CP is the probe complexity. The details of
K exp calculations are described in Chapter I.
Saturation hybridization: Calculated as ((l/al)/s) x (LR/LP),
where l / a ' is the initial slope, S is the specific activity of
the probe at the time of the experiment, LR is the RNA
transcript length and LP is the initial length of the probe.
Characteristics -- of the probe --- used in the experiments:
pPoTA9/650: The initial length of the probe was 680 nt (LP)
containing 650 nt complementary to RNA transcript (CP) and some
MI3 sequence. The tracer length at hybridization was 425 nt long
(LT) and the initial specific activity was 1.0 x l o 9 cpm kg-'
(SP).
The RNA transcript length (LR) and the RNA driver length (LD)
used in the calculations is the average actin transcript length,
2250 nt.
b) The amount of RNA per embryo is assumed to be constant at
about 15 ng. This value was measured for egg RNA (~ovesdi and
Smith, 1982). so topic dilution experiments were repeated for
late gastrula as described in Chapter I, Materials and Methods.
Repeat experiments gave values of 14.8 ng (S.D.=2.6;n=2) per
embryo. The number of transcript in tube foot is calculated for
15 ng of RNA. The amount of poly(~)+ RNA per embryo is estimated
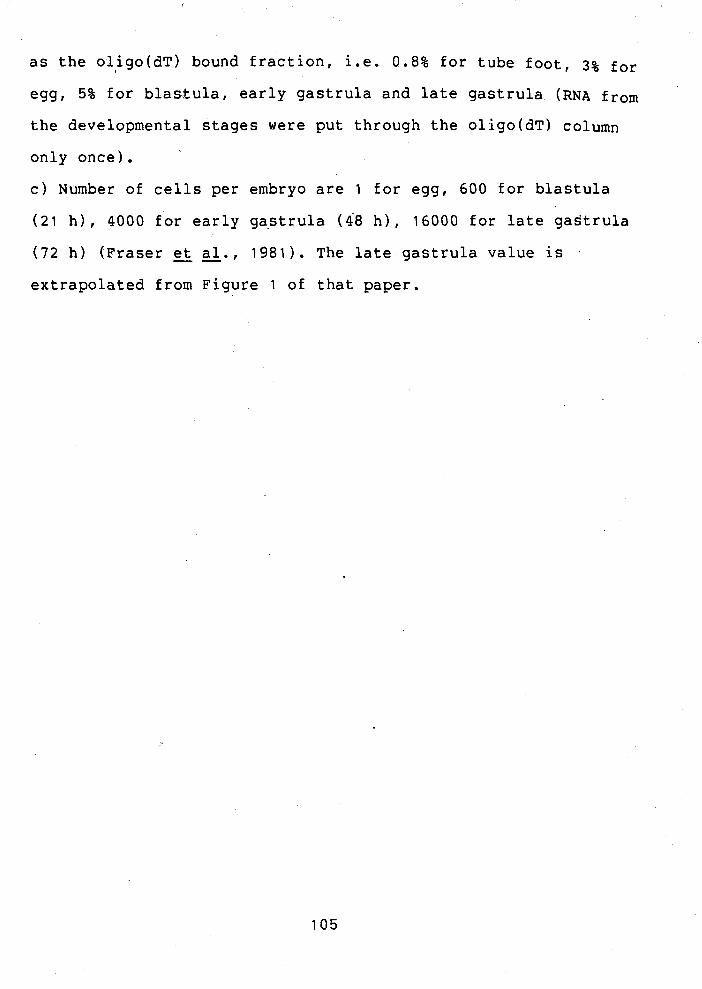
a s t h e o l igo(dT) bound f r a c t i o n , i . e . 0.8% f o r tube foo t , 3% fo r
egg, 5% fo r b l a s t u l a , e a r l y g a s t r u l a and l a t e g a s t r u l a (RNA f rom
the developmental s tages were put through the ol igo(dT) column
only once).
c ) Number of c e l l s per embryo a r e 1 f o r egg, 600 f o r b l a s t u l a
( 2 1 h), 4000 fo r e a r l y ga-strula (48 h ) , 16000 fo r l a t e g a s t r u l a
(72 h ) (Fraser -- e t a l . , 1981). The l a t e g a s t r u l a value is
ext rapola ted from Figure 1 of t h a t paper.

to the probe. Since the length of an average actin transcript is
2250 nt and the probe complexity is 650 nt the true fraction of
actin transcript in the egg is 7.1 x x (2250/650) = 2.5 x
Each egg contains 15 ng of total RNA (Chapter I),
therefore the mass of actin transcripts per egg is 0.37 pg. This
corresponds to 2.9 x lo5 molecules per egg. Note that K obs is
actually underestimating the rate, as a portion of the probe is
MI3 sequence and therefore could never react. The rate for a
pure 650 nt sequence (K pure) would be higher by the fraction
(680/650). However, in that case the true fraction of actin
transcript in the RNA would have to be calculated by the
equation (K pure/K exp) x (2250/680), in other words using the
original 680 nt length. The final result in both cases is the
same.
Results of the saturation titration experiments are also
listed in Table 3.1. The specific activity of the probe at the
time of labeling (SP) was estimated to be 1 x lo9 cpm pg-' (k0.2 x lo9) from comparisons of the experimental and theoretical decay of probe length and initial 3 2 ~ nucleotide incorporation.
The specific activity at the time of the experiment ( S ) was
calculated from this value using the theoretical 3 2 P decay
constant. he coding sequence probe was used to titrate
increasing amounts of total RNA as described in ater rials and
Methods. The proportion of probe taken into hybrid form (T/TO)
was plotted against the probe cpm) ratio (R') (~igure 3.6
and Figure 3.7).

Figure 3.6 Titration of transcripts in embryo RNA.
Increasing amounts of total RNA from four stages of early
development were hybridized with the 3Z~-labeled single-stranded
actin coding probe p ~ o ~ ~ 9 / 6 5 0 and with the 3' non-coding probe
pPo~~5/460. The portion of 3 2 ~ - ~ ~ ~ in hybrid form (T/TO) was
determined by hydroxyapatite chromatography. R' is the RNA to
3 2 ~ - ~ ~ ~ mass ratio in units of pg cpm-'. The values shown are
corrected for unspecific binding and self-annealing of probe in
the absence of RNA and for the extent of probe reactivity.
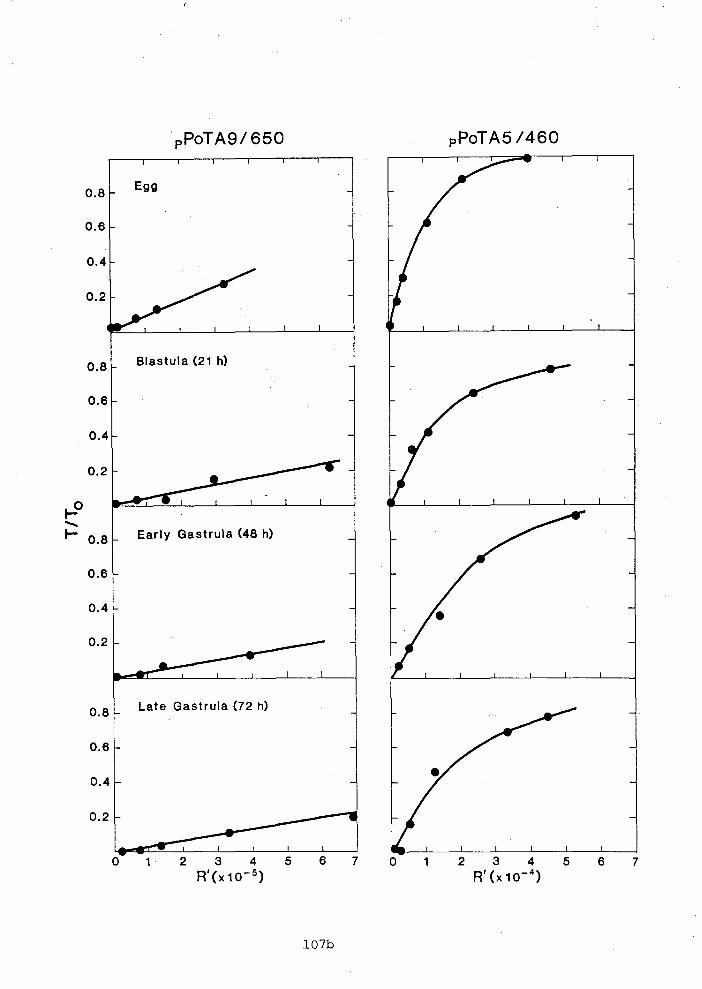
Blastula (21 h)
Early Gastrula (48 h)
Late Gastrula (72 h)

Figure 3.7 Titration of coding and 3' non-coding actin
transcripts in tube foot RNA.
Total tube foot RNA was hybridized to single-stranded actin
coding ( p ~ o T ~ 9 / 6 5 0 ) and 3'non-coding ( p P o ~ ~ 5 / 4 6 0 and
p ~ o ~ ~ 1 3 / 2 1 0 ) probes. The hybridization reactions were processed
as described in the legend to ~ i g u r e 3.6 and the same
definitions apply.

TUBE FOOT RNA

The initial slopes (l/a') derived from these plotes are used to
calculate the number of transcripts per embryo.
For example, the slope (1/aV) for egg RNA is 8.3 x lo3 cpm
pg-' from Figure 3.6. Since the specific activity of the probe
was 7.5 x 10⁸ cpm pg-I at the time of the experiment the
fraction of total egg RNA mass present as probe-specific RNA is
(l/a) = 8.3 x 10³/7.5 x 10' = 1.1 x The length of an
average actin transcript is 2250 nt and the initial length of
the probe is 680 nt. Therefore the true fraction of actin .
transcript in the egg is 1.1 x 10-5nx (2250/680) = 3.7 x
Note that in this case the initial probe length instead of the
650 nt complexity was used, as otherwise the transcript fraction
would be overestimated by hydroxyapatite chromatography. The
number of actin transcripts can be calculated the same way as
was described for the RNA driven hybridization. The mass of
actin transcripts per egg is 0.56 pg that corresponds to a
maternal actin transcript pool of 4.3 x 10⁵ molecules.'
he time course in the change of actin transcript numbers
per embryo is illustrated in Figure 3.8. The data is taken from
Table 3.1. The shape of the curve is in very close agreement
with that expected from the relative sequence prevalence (~igure
3.3). The absolute number of transcripts vary by a factor of two
for the three different experiments, however the deviation
between the RNA driven and saturation hybridization measurements
with total RNA are much less than that. The average number of
transcript estimates are 3.1 x lo5 per egg,

Figure 3.8 Number of actin transcripts in sea star development
and tube foot.
The time course in the change of actin transcript numbers in
P. ochraceus early development is illustrated. The number of -
actin transcripts per 15 ng of tube foot RNA are shown for
comparison. Data are taken from Table 3.1.
Symbols :
(.),total RNA driven hybridization;
(~),poly(~)+ RNA driven hybridization;
(o),Saturation hybridization with total RNA.
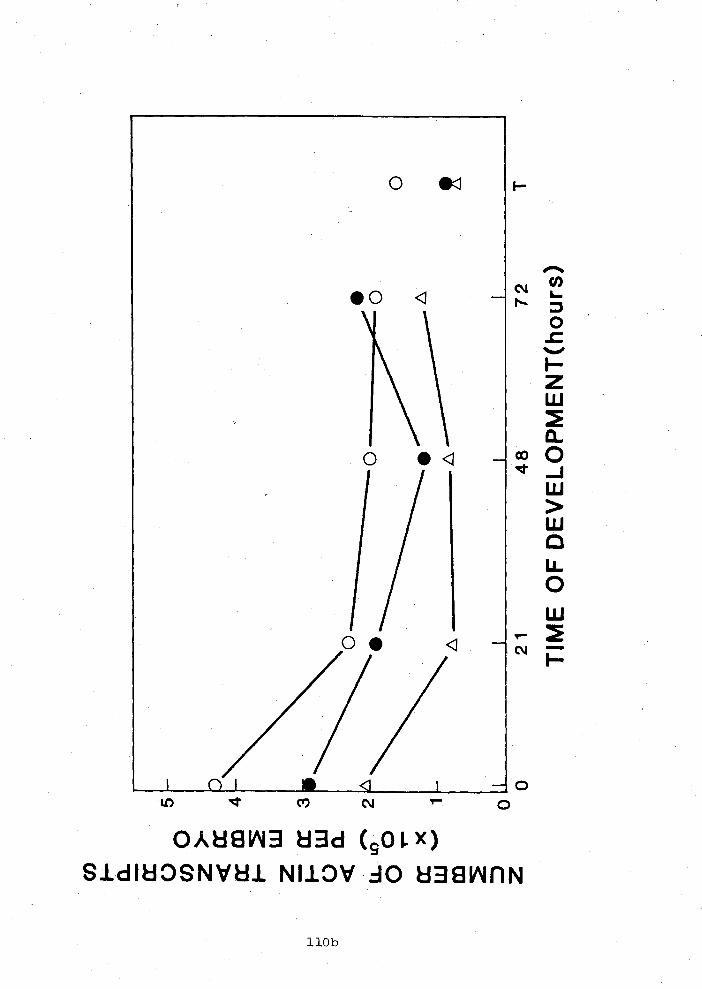
[I:
W
m
Z 3
z
2 1
4
8
7 2
TIM
E O
F D
EV
EL
OP
ME
NT
(ho
urs
)

1.6 x lo5 per blastula, 1.3 x lo5 per early gastrula and 1.8 x
i05 per late gastrula. In tube foot there are approximately 1 x
lo5 transcripts per 15 ng of total RNA. Change in the number of actin transcripts per cell during
early sea star development is illustrated in ~igure 3.9. Data
for this figure was taken from the last column of Table 3.1. The
average number of transcripts per cell calculated from the three
different experiments fit on a straight line up to early gastula
stage when plotted on a log-log scale against the number of.
cells in an embryo.
The total amount of RNA per embryo is assumed to be
constant at about 15 ng. This value was measured for egg RNA
(chapter I). Isotopic dilution experiments were repeated for
late gastrula as described in Chapter I, Materials and Methods.
Repeat experiments gave values of 14.8 ng (S.~,=2.6;n=2) per
late gastrula embryo.
Number - of XPoA145 specific sequences in different developmental - stages and in tube foot ----
Single-stranded MI3 probe, containing the 460 nt 3'
non-coding region specific to the XPoA145 gene family was used
in RNA driven and saturation hybridization reactions in order to
estimate the number of homologous transcripts in total and
poly(~)+ RNA.
Figure 3.9 Change in the number of actin transcripts per cell
during early sea star development.
Data are taken from Table 3.1. The symbol ( @ ) indicates the
average of three values, RNA driven hybridization with total and
poly(A)+ RNA and saturation hybridization with total RNA. Error
bars denote the range of the values. Average values from egg to
early gastrula fit on a straight line.

NO. OF CELLS

The specific activity was determined by a standard curve
(Figure 3.10) titrating the ti labeled probe against increasing
quantities of unlabeled cold DNA insert as is described in
Materials and Methods and Mauron et e. (1981). The initial slope of the curve is 5.3 x lo7 cpm jig-' which indicates a specific activity of 1.05 x 10⁸'cpm jig-'. Therefore, the initial
specific activity (SP) at the time of labeling could be
calculated as 1.2 x 10⁸ cpm pg-l.
All other aspects of the experiments were done as .
previously described for the coding sequence probe.
An example of RNA driven hybridization experiment with
total and poly(~)+ egg RNA is shown in Figure 3.11. The rate
constants extracted from these data and the calculated values of
the number of transcripts per embryo are listed in Table 3.2.
There is very good agreement between values calculated from
experiments with total and poly(~)+ RNA. The relative change in
transcript abundance is nearly identical with that observed
previously (~igure 3.31, but the absolute numerical values are
three times higher than expected from the results with the
coding probe experiments able 3.1 and Figure 3.8). The last
column in Table 3.2 shows the ratios between the number of
transcripts calculated from these experiments and the maximum
expected from the coding probe data of Table 3.1. The expected
position of the hybridization curve is also indicated with
dashed lines on Figure 3.11, assuming that all the actin
transcripts originate from the XPoA145 gene family and,
Figure 3.10 Specific activity determination of the
single-stranded 3' probe p ~ o ~ ~ 5 / 4 6 0 .
The specific activity of the 3' non-coding probe was determined
by titration of unlabeled p~o~A5/460 fragment with
single-stranded 32~-labeled DNA, as explained in Materials and
Methods. The initial slope of the curve is 5.3 x lo7 cpm pg-'
and the specific activity is 1.05 x 10⁸ cpm p g - ' .


Figure 3.11 RNA driven hybridization to the single-stranded
pPo~A5/460 3' non-coding probe.
Total and poly(~)+ RNA from egg was used to drive a 32~-labeled
single stranded probe (~13mp8/p~o~~5/460) in reassociation
kinetics. Hybrids were analysed by hydroxyapatite chromatography
(see Materials and Methods, Chapter I), The solid line
represents the best least-square solution for the data assuming
pseudo-first-order reaction (see figure legend, Figure 1.2).
Dashed line indicates the curve expected if this probe was at.
the same concentration as actin transcripts. The rate constants
obtained from these data fits are listed in Table 3.1.

FR
AC
TIO
N O
F 3
2P-L
AB
EL
ED
D
NA
IN
RN
A-D
NA
HY
BR
IDS

a
Ta
ble
3
.2
De
term
ina
tio
n
of
the
num
ber
of
pPoT
A5/
460
3'
seq
ue
nc
es
in P
isa
ste
r o
ch
rac
eu
s R
NA
. -
Sta
ge
/or
Hy
bri
diz
ati
on
ra
te
Slo
pe
(l/a
')
No
.tra
nsc
rip
ts
No
.tra
nsc
rip
ts
Tis
sue
K
O~
S(R
MS
) p
er
emb
ryo
N
o.t
ran
scri
pts
e
xp
ec
ted
RNA
dri
ve
n h
yb
rid
iza
tio
n
-
To
tal
KN
A
--
Egg
0
.02
14
(3
.5)
Bla
stu
la
0.0
15
6
(2.6
) E
.Gas
tru
la
0.01
17
(1.8
) L
.Ga
stru
la
0.0
14
8
(3.5
) Tube
foo
t 0
.00
45
0(1
.7)
Po
ly (A
+) -
RN
A
Egg
0
.87
8
(2.3
) B
last
ula
0.
246
(1.8
) E
.Ga
stru
la
0.2
10
(1
.3)
L.G
ast
rula
0
.32
6
(3.7
) T
ube
foo
t 0
.23
4
(1.5
)
Sa
tura
tio
n h
yb
rid
iza
tio
n
To
tal
RN
A
--
Egg
6
.7~
10
3
Bla
stu
la
3.7
~1
0
3
E.G
ast
rula
3
.1~
10
3
L.G
ast
rula
3
.4
~1
0~
T
ube
foo
t 1
.1~
10
3

Footnotes Table 3.2
a) Details of the calculations are described in footnotes to
Table 3.1.
Characteristics of -- the probe used in the experiments:
pPoTA5/460: The initial length of the probe was 500 nt (LP)
containing 460 nt complementary to RNA transcript (CP) and some
MI3 sequence. The tracer length at hybridization was 475 nt long
(LT) and the initial specific activity was 1.2 x 10⁸ cpm ~ g - 1
(SP).
b) Assuming full length actin transcripts (2250 nt).
c) The number of transcripts expected are from Table 3.1.
most importantly, that all the transcripts are 2250 nt long. The
pPo~A5/460 probe showed ssme cross reaction with the XPoA160
clone at moderate stringency (~igure 2.8~). However the amount
of cross reaction between the two tube foot transcripts was
unexpectedly high at the conditions used in these experiments.
Therefore no estimates could be made of the number of specific
transcripts in tube foot RNA.
Results of the titration experiments for the developmental
stages are illustrated in Figure 3.6 and for tube foot in Figure
3.7. The initial slopes and the probe specific activity at the
time of the experiments were used to calculate the transcript
values listed in Table 3.2. The relative change in transcript
abundance shows again the expected developmental time course
(Figure 3.31, however the number of transcripts per embryo
indicates on the average nine times higher values than the
maximum expected from the results with the coding probe
experiments a able 3.1 and Figure 3.8).
Number - of XPoA160 specific sequences - in'different developmental
stages and in tube foot ----
RNA driven and saturation hybridization experiments were
repeated with the single-stranded MI3 probe containing the 210
nt 3' non-coding region specific to the hPoA16O gene family. RNA
driven hybridization experiments indicated that this probe did
not react with RNA from any of the developmental stages.
Reactions were carried out which exceeded 100 x ~0t(1/2) of that
expected for an actin coding probe. These experiments would have
detected as few as 0.1% of the total actin transcript
population.
Results of the RNA driven hybridization with total and
poly(~)+ tube foot RNA are shown in Figure 3.12 and the rate
-.constants listed in Table 3.3. The number of transcripts
calculated from this data is 14.3 and 7.5 times higher for total
and poly(~)+ RNA respectively than expected from the experiments
with the coding sequence probe.
The specific activity of the j2p-labeled probe was
determined by a standard curve, as was described previously: The
initial slope of the curve is 1 x lo9 cpm pg-I (data not shown)
from which the specific activity at time of the experiment was
calculated as 2 x lo9 cpm ~ g - I with 2.5 x lo9 cpm ~ g - I at
labeling. The saturation hybridization with total tube foot RNA
is shown in Figure 3.7. Calculations from this slope indicate
2.6 x lo5 transcript per 15 ng RNA which correlate fairly well
with that expected from the coding sequence probe. This is in
sharp contrast to the above described results with the RNA
driven experiments.

Figure 3.12 RNA driven hybridization to the single-stranded
p ~ o ~ ~ 1 3 / 2 1 0 3' non-coding probe.
Total and poly(~)+ RNA from tube foot was used to drive a
32P-labeled single stranded probe (~13mp9/p~o~~13/210) in
reassociation kin.etics. Hybrids were analysed by hydroxyapatite
chromatography (see Materials and Methods, Chapter I). The solid
line represents the best least-square solution for the data
assuming pseudo-first-order reaction (see figure legend, Figure
1.2). Different symbols indicate independent experiments. Dashed
line indicates the curve expected if this probe was at the same
concentration as actin transcripts. The rate constants obtained
from these data fits are listed in Table 3.1.

FR
AC
TIO
N O
F 3
2P-L
AB
EL
ED
D
NA
IN
RN
A-D
NA
H
YB
RID
S
a
Ta
ble
3
.3
De
term
ina
tio
n o
f th
e
num
ber
of
pP
oT
k1
3/2
10
3
' se
qu
en
ce
s in
Pis
as
ter
oc
hra
ce
us
RN
A.
b
c S
tag
e /o
r H
yb
rid
iza
tio
n
ra
te
Slo
pe
(l/
a ')
N
o.t
ran
sc
rip
ts
No
.tra
ns
cri
pts
T
issu
e
K
obs(
RM
S)
pe
r em
bry
o
No.
tra
ns
cr
ipt s
e
xp
ec
ted
RN
A d
riv
en
hy
bri
diz
ati
on
To
tal
RN
A
--
Egg
B
las
tula
E
.Ga
stru
la
L.G
astr
u3
.a
Tu
be
foo
t
Po
l y (A
+)
RNA -
Egg
B
las
tula
E
-Ga
stru
la
L.G
ast
rula
Tube
foo
t
Sa
tura
tio
n h
yb
rid
iza
tio
n
To
tal
RN
A
--
Tub
e fo
ot
No
hy
bri
diz
ati
on
N
o h
yb
rid
iza
tio
n
No
hy
bri
diz
ati
on
N
o h
yb
rid
iza
tio
n
0.0
09
34
(3.0
)
No
hy
bri
diz
ati
on
N
o h
yb
rid
iza
tio
n
No
hy
bri
diz
ati
on
N
o h
yb
rid
iza
tio
n
0.58
6 (3
.9)
d

~ootnotes Table 3.3
a) Details of the calculations are described in footnotes to
Table 3.1 . Characteristics of -- the probe used in the experiments: p~o~~13/210: The initial length of the probe was 230 nt (LP)
containing 210 nt complementary to RNA transcript (CP) and some
MI3 sequence. The tracer length at hybridization was 155 nt long
(LT) and the initial specific activity was 2.5 x lo9 cpm kg-'
(SP).
Assuming full length transcripts
c) The number of transcripts expected are from Table 3.1.
d) Saturation hybridization was not done with the embryonic
RNAs .
IV. DISCUSSION
Expression -- of actin transcripts in sea star early development ---
It was demonstrated in this study that the expression of
actin genes in sea stars follows the pattern described for most
of the prevalent polyadenylated cytoplasmic RNAs in the sea
urchin system (Lasky - et e . , 1980; Flytzanis et e . , 1982). All
sea stars examined have a large store of maternal actin
transcripts. The number of transcripts in - P. ochraceus declines
from approximately 3 x lo5 per egg to half of this value at blastula - early gastrula before it begins to increase again.
P. ochraceus embryos start to hatch at 29 h after fertilization - and more than 65% of them hatched at 32 h (~raser et g. , 1981). The lowest transcript abundance can be found close to this time
period. The apparent lowest transcript concentration at blastula
in reality might mean the complete degradation of the maternal
RNA between the two stages as was described for - S. drbbachiensis
(Bushman and Crain, 1983).
The total number of actin transcripts increases after
embryo hatching, indicating newly synthesized RNA production.
All or most of these new actin sequences criginate from the same
XPoA145,128 gene family as the maternal RNA transcripts.

The pattern of actin transcript accumulation in
P. ochraceus is strikingly different from that observed for sea - urchins and a sand dollar (Echinarachnius parma) (Bushman and
Crain, 1983). In these systems the abundance of actin-coding RNA
is relatively low in early embryos and dramatically increases
during development.
The sea urchin studied most extensively is S. purpuratus
(Crain - et g . , 1982; Merlino et e., 1 9 8 1 ) ~ where a picture of a very complex actin gene expression pattern is emerging..Shott
et al. (1984) demonstrated that at least six of the eight actin -- genes of this animal are expressed at some stage of development,
and each of these genes is regulated differentially. A 2.2 and
1.8 kb transcript of two genes is also expressed in the maternal
RNA (Garcia - et G . , 19841, but the total number of maternal
actin transcripts is estimated as less than 3000 (Shott et g . , 1984). The presence of the larger transcript in every tissue
tested indicates that it is generally expressed and encodes a
cytoplasmic or cytoskeletal actin.
The equivalent of this in - P. ochraceus system appears to be
the 2.3 kb transcript from the XPoA145,128 gene family which is
present in all the developmental stages as well as tube foot. It
is transcribed from a gene present only once per haploid genome
similarily to the CyI gene in - S. purpuratus ( ~ e e et c., 1984). This single gene product apparently could account for all the
actin transcripts in early embryos. The size of this transcript
is very close to that of its equivalent in sea urchins.

Furthermore, the transcript size does not change through
development, indicating that the mature sea star egg probably
contains fully processed actin transcripts.
The time course of actin transcript accumulation could be
explained in more than one way. Due to lack of data for
transcript turnover rates, the simplest explanation is that
actin transcripts in - P. ochraceus embryos are not transcribed at
all until hatching stage, or transcribed at a very low rate. ~n
both cases the observed pattern is dominated by the slow
degradation of the maternal RNA. In sea urchins most of the
prevalent transcripts are very stable (Cabrera et g . , 1984) .
Furthermore the large increase in the number of actin mRNA in
S. purpuratus early development was explained by a constant rate 7
of synthesis per cell and very low rate of transcript
degradation (peters and Kleinsmith, 1984) .
The decline of the number of actin transcripts.in an
. average cell appears to be correlated with the total number of
cells in the embryo until early gastrula stage (Figure 3.9) .
Following this, the number of transcripts stabilizes at
approximately 10 per cell. There is considerable localization
occurring during cell differentiation (reviewed by Angerer and
'Angerer, 1983) . Therefore there may be an unequal distribution
of transcripts.
Actin gene expression has been extensively analysed in sea
urchins (Crain -- et al., 1981; 1982; Merlino - et &., 1981; Durica
and Crain, 1982; Flytzanis et g . , 1982; Crain and Bushman,

1983; Bushman and Crain, 1983; Garcia - et e., 1984; Shott
et &., 1984) . The main conclusion of these studies is that most - sea urchin eggs contain very little actin specific maternal RNA,
and the transcript prevalence appears to increase approximately
50-fold from egg to gastrula. The results presented in this
chapter demonstrate that the maternal expression of actin genes
in sea stars are completely different from that observed in sea
urchins.
Actin gene expression -- in P. ochraceus tube foot --
Sea star tube feet are short tubular external projections
of the body wall used as sensory, locomotive and anchoring
appendages (Fretter and Graham, 1976) . Earlier histological
studies indicated that at least 50% of the cellular volume of
the tube foot is made up of tissue that can be classified as
smooth muscle (Nichols, 1961; Kabat-Zinn and Singer, 1981) .
However a recent ultrastructural examination showed that the
retractor muscle of sea star podium is a collection of
myoepithelial cells (wood and Cavey, 1981; Cavey and Wood,
1981) . The major abundant protein component of these highly
differentiated cells appears to be actin (~abat-Zinn and Singer,
1981) .
The most prevalent actin transcript in - P. ochraceus tube
foot is 2.2 kb and originates from the hPoA16O gene family. his
gene is not expressed in any of the embryonic stages and it

could be analogous to muscle-specific actin. Sea urchins (shott
et e., 1984) and vertebrates (Nude1 et &., 1982) appear to - - contain a single-copy muscle-specific gene. On the other hand in
D. melanoqaster four out of six actin genes exhibit - muscle-specific expression (~yrberg - et * I a1 1983; Sanchez
et &., 1983). Analysis in Chapter I1 indicated that there might - be two genes per haploid genome for the hPoA16O family in
P. ochraceus. - The amount of muscle-specific transcripts in tube toot
poly(A)+ RNA of - S. purpuratus was shown to be considerably lower
than the major cytoplasmic gene product (Shott et &., 1984). In - P. ochraceus the XPoA160 gene product appears to account for as - much as 90% of the actin sequences in total RNA. However when
poly(A)+ RNA was used in RNA dot-blots and transfers, the
relative amount of reaction with the p~o~A5/460 probe was
greatly increased compared to the reaction with the p~oT~13/210
probe (results not shown). This indicates that the ratio of the
number of two different tube foot actin transcripts dramatically
changes in favor of the XPoA145 gene product in poly(~)+ RNA.
The concentration of cytoplasmic transcripts in poly(~)+ RNA is
also substantiated by the unexpectedly large number of XPoA145
specific clones in the tube foot cDNA libraries (Chapter 11):
Hunter and Garrels (1977) comparing vertebrate 0- and a-actin
transcripts found that the former had considerably shorter
poly(A) tails. Because of this, a substantial portion of the
0-actins failed in binding to oligo(d~)-cellulose. If echinoderm -
muscle-specific actin transcripts have shorter ply(^) tails
than cytoplasmic transcripts, experiments using poly(~)+ RNA
could have biased results.
Expression - and function of 3 ' non-codinq actin sequences -- The size of the P. ochraceus actin transcripts is very
close to that found in sea urchins, indicating that they might
have more than 1000 nt of non-coding sequence. Bushman and Crain
(1983) argue for strong selective pressure in the maintenance of
these sequences, which could imply some physiological function.
The 3' non-coding probe derived from the XPoA137 gene did
not react with any of the RNAs tested. From these negative
results it is not possible to determine that these are
pseudogenes, or genes which are not transcribed in these
specific RNAs. The possibility also exists that the probe was
from a non-transcribed or processed region of the gene.
Experiments with the two 3' specific cDNA probes showed
surprising results. Most of the numeric values for the number of
transcripts far exceeded the maximum expected from the coding
probe experiments. Furthermore the wide range of differences
between the RNA driven and saturation hybridization results
seems to eliminate any simple explanation.
The most obvious explanation would be DNA contamination of
the RNA samples. However that should have affected the coding
probe experiments and would not be expected to influence the
poly(~)+ RNA results. Further, RNase digestion controls did not

show any DNA contamination.
Unspecific hybridization to ribosomal RNA or some other
abundant RNA transcripts could have been overlooked as most of
the RNA transfers were hybridized at high stringencies. However,
when the stringency of hybridization was lowered, there were no
obvious unspecific bands. All probes'showed some ribosomal
background which were in general similar.
The first clue regarding the type of RNA which could cause
these discrepencies came from comparisons of saturation and RNA
driven hybridization results with the p~o~A13/210 probe (Table
3.3). There are no obvious experimental errors which could
account for deviation in an order of magnitude, as the two
different experiments gave similar results for the coding
sequence probe able 3.1). The probe length was approximately
150 nt, which would probably not cause overestimation even with
short RNA species in saturation hybridization. Alternatively,
RNA driven hybridization results would change substantially if
the RNA driver was short. Saturation hybridization indicates
1.63 times more transcripts than the maximum expected from the
results with the coding probe experiments able 3.3). This
would indicate that approximately 60% more sequences react with
the 3' non-coding than the actin coding probe. How would these
excess sequences affect the RNA driven hybridization results? If
somewhat simplistically it is assumed that the extra 60% is
derived from homologous fragments in the size range of the probe
that is 100-200 nt, then the rate of the- RNA driven

hybridization would be determined by th.e smallest fragments.
Substituting this size range for RNA driver length, the number
of transcripts can be calculated as 2.3 x lo5. This figure is
very similar to the results found with saturation hybridization,
Therefore, a small highly prevalent transcript (or transcript
fragment) homologous to the actin 3' non-coding probes could
account for the observed results.
~~bridization with abundant transcripts from repetitive DNA
sequences, similar to those of Drosophila transposable elements
(~innegan et e . , 1977), would satisfy this criterion.
Another possibilitiy would be reaction with small nuclear
RNAs ( ~ ~ R N A ) which have a size range of 90 to 220 nt and present
lo5-106 copies per HeLa or Novikoff hepatoma cell (Choi and
Ro-Choi, 1980). snRNAs are highly conserved and ubiquitous in
eukaryotes (reviewed by Busch et e . , 1982). These sequences
were also shown to be present in comparably high numbers during
early Xenopus development (~orbes - et g . , 1984). In both cases above, specific fragments would be expected
to react with the 3' probe. However, high percent RNA gel
transfers hybridized at moderate stringencies failed to turn up
any discrete bands which would be expected for the amount of RNA
involved.
To test the amount of sequence homology involved in the
reactions, RNA driven and saturation hybridizations were carried
out using stringent criteria. Increasing the stringency would be
expected to reduce the fraction of hybrids significantly if the

sequences are not well matched. However, the results were again
negative. Neither RNA driven or saturation hybridization
reactions evaluated at 68OC or 70•‹c showed significant
differences from that observed at 60•‹C for the coding or 3 '
non-coding probes.
The conclusion from the above analysis-is that the reaction
must occur with a diverse size range of small RNAs which are
homologous to the probes, and probably degradation products of
the original transcripts. Since the RNA contains substantially
more 3 ' non-coding fragments than coding sequences the
degradation of transcripts appears to be non-random. It is
therefore unlikely that the RNA degradation is the result of the
RNA extraction procedure.
In a differentiated adult tissue such as tube foot, steady
rate of synthesis and degradation of transcripts could be
expected. Therefore the steady state quantity of each transcript
will be determined by the ratio of synthesis rate agd decay
constant (reviewed by Davidson, 1976). The synthesis rate is
identical for different parts of a transcript. Therefore
different steady state levels of the coding and 3 ' non-coding
sequences could be reached if there are differential rates of
degradation.
Results of the experiments with the embryonic system using
the pPo~~5/460 probe are more difficult to interpret, becouse
the saturation hybridization experiments are subject to two
technical problems. Firstly, the probe used was close to 500 nt

long which could have caused great overestimation of sequence
numbers as explained previously. Using S1-nuclease instead of
hydroxyapatite in the evaluation of hybrid formation would
resolve this question. Secondly, a systematic error which would
cause an underestimate in the specific activity determination
could have compounded the the errors. There is a biological
problem a-s well. Early development is a complex dynamic system
which contains various amounts of maternal and embryonic
transcripts depending on the stage of development (reviewed by
Raff, 1980). As it is not a steady state system assumptions
cannot be made as to rates of synthesis and degradation of the
actin coding and 3' non-coding sequences. Even considering the
above difficulties, the high numeric values in RNA driven
hybridization indicate the presence of 3 ' sequences independent
of the coding region.
RNA in cells are associated with different proteins to form
RNP particles (reviewed by Raff, 1980). The associated proteins
can have many different functions, including protection of RNA
from nucleases. The most vulnerable place for a transcript might
be the 3 ' non-coding region, as these sequences are neither
protected by capping nor shielded by the translational
machinery. Peters and Jeffery (1978) reported that there are two
high molecular weight proteins bound to the poly(~) tails of sea
urchin egg RNAs. Therefore it is possible that the 3 ' end of
mRNAs are protected and degraded slower than the coding
sequence.

It is possible that the excess of these 3' sequences in the
cell are only a vestige of differential degradation, but on the
other hand it could indicate a biological role for the . .
untranslated regions.
Modiano and Pepe (1983) recently demonstrated that the
quantitative expression of human' globin genes is controlled by
both 5' and 3' untranslated regions. The latter was previously
shown to be highly conserved in the globin mRNA of primates
(Martin - et * I a1 1981). The pPoTA5/460 sequence also appeaxs to
be highly conserved between P. ochraceus and - P. brevispinus (c.
Cuddeford and M.J. Smith unpublished observations). The
conservation of specific 3' non-coding sequences in sea urchin
actins (Lee -- et al., 1984), rat and human cardiac actin mRNAs
(~ayer et g . , 1984), rat and human cytoplasmic 0-actin genes .
(Nude1 et g . , 1983) and also between chick and rat a-actin
genes (0rdahl and Cooper, 1983) argues for some common function.
The protection of the 3' end in itself might significantly
extend the stability of these prevalent transcripts, allowing
for their accumulation without increasing transcription rates
(Cabrera - et e., 1984; Peters and Kleinsmith, 1984). Cytoplasmic gene control was demonstrated for casein
(Guyett - et e., 1979) and vitellogenin (Goldberger, 1981) showing different half lives for the same mRNA in the same cell
under diverse circumstances. Evidence exists for a wide range of
half lives involving different mRNAs in the same cells (Harpold
et e., 1981) and in sea urchin embryos (Cabrera et e., 1984). - -

Davidson -- et al. (1982b) also suggested that distinct 5' and/or
3' non-coding sequences might be responsible for the turnover
rate difference measured between two embryonically expressed
actin transcripts in - S. purpuratus.
It is also possible that the 3' non-coding sequences are
involved in regulatory functions as observed for procaryotes
(reviewed by Gottesman - et e., 1982). Feedback control through
these 3' sequences or control factors associated with them could
influence transcription rates and/or the release rate of st~red
maternal mRNA.
Apparently not all non-coding sequences are essential, as
the - D. imbricata has a 300 nt shorter maternal actin transcript
than - P. ochraceus. This is the case as well in some of the sea
urchin species.
There has been no direct demonstration up to the present
that the 3 ' non-coding sequences are involved in any
physiological processes. However increasing evidence implies
that they have some type of role in regulatory functions.

E. SUMMARY
The objectives of this study were to assess the transcript
informational content of the egg RNA of Pisaster ochraceus and
to determine the abundance and representation of the different
actin gene transcripts at various stages of embryonic
development. The following information was gained from this
research:
1. Sequence complexity of the mature - P. ochraceus oocyte
RNA was determined as 4.3 x l o 7 nucleotides.
2. The percent of RNA mass representing the single-copy
informational content of the - P. ochraceus maternal RNA was
determined as 2-38.
3. The total RNA content in - P. ochraceus early development
was established as approximately 1 5 ng. This RNA content remains
constant from egg to late gastrula stage.
4. Actin specific genomic X clones were isolated and
characterized.
5. cDNA libraries were established from P. ochraceus tube foot, egg end late gastrula.
6. Actin specific cDNA clones were isolated and
characterized.
7. The number of actin genes in - P. ochraceus were
estimated to be 5 from dot-blot and Southern transfer analyses.

8. The genomic origin of the two tube foot expressed
transcripts were determined using 3' non-coding probes.
9. Restriction fragment polymorphism was demonstrated in
all three actin gene families.
10. Three sea star species, - P. ochraceus, 5 brevispinus,
and imbricata were kinetically determined to contain 5,5 and
8 actin genes respectively.
1 1 . - P. ochraceus tube foot tissue expressed actin
transcripts of 2.3 and 2.2 kb with the latter representing as
much as 90% of the total amount.
12. 15 ng tube foot total RNA was determined to contain
approximately 1 x lo5 actin transcripts. 13. The eggs of - P. ochraceus, - P. helianthoides, and
E. troschelii expressed a 2.3 kb actin transcript, while the -
eggs of - D. imbricata expressed a 2.0 kb actin transcript.
14. - D. imbricata egg RNA was determined to contain
approximately 6 times more actin transcripts by mass than
P. ochraceus. - 15. The relative amount of actin gene expression was
assessed in - P. ochraceus early development, showing that the
amount of transcripts declined by approximately 50% at the
blastula stage and increased again in late gastrula.
16. The absolute number of actin transcripts per
P. ochraceus egg, 21 h blastula, 48 h early gastrula and 72 h - late gastrula were determined as approximately 3.1 x lo5, 1.6 x
lo5, 1.3 x lo5 and 1.8 x lo5 respectively.
17. Indirect evidence was shown for differential
degradation of coding and 3' non-coding regions of actin
transcripts in embryonic and tube foot cells.

APPENDIX A
Restriction Enzyme Maps of the Sea Star Actin Genomic Clones
( ~ r o m Kovesdi et d., 1984)

The four Charon 4 clones XPoA145, APoA128, XPoA68, XPoA137 are
aligned with the SstI site which is found within their actin
coding fragments. XPoA145 and XPoA128 are aligned on coincident
EcoRI, BamHI, and KpnI sites. XPoA68 and XPoA137 are aligned on
coincident ,EcoRI, KpnI, SstI, and HindIII sites. The solid bars
indicate fragments which contain actin coding sequences. The 3'
and 5' ends of the actin coding sequence containing fragments
were determined by independent hybridization of restriction
digests with the 3' 'actin coding sequence probe pSpG2 from sea
urchin and the total actin coding sequence probe pDMA2 from
Drosophila melanogaster. Regions common to two clones for which
estimates of sequence divergence.were made are indicated by
heavy vertical arrows. The restriction fragments which contain
repetitive sequences are indicated below the restriction maps by
horizontal bars with jagged inserts; e.-g. the 1.9 kb BamHI
limited fragment common to both XPoA145 and XPoA128. To detect
repeat sequences sheared genomic DNA, 380 bp long, was labeled
with 3 2 ~ to a specific activity of 7 x 10⁶ cpm pg-' and
hybridized to restriction digests of the lambda recombinants.
One pg of each of the five clones was totally digested with the
following enzyme combinatins: XPoA145 and XPoA128 with EcoRI
plus BamHI, or EcoRI plus KpnI; XPoA68 and XPoA137 with EcoRI;
and XPoA160 with EcoRI HindIII. The Southern transfers of
each of these digestions was hybridized with 1 x 10⁶ cpm of the
"P-labeled genomic DNA for 20 h at 68OC in 4X SET. The
following notation was used where necessary for restriction
enzymes: B, BamHI; H, HindIII; and S, SalI.

APPENDIX B
Southern Blot ~ybridization of EcoRI-Digested Genomic DNA from
Individual Sea Stars with an ~ c t i n cDNA Probe
(From Kovesdi et e., 1984)

Genomic DNA from five individual sea stars was totally digested
with EcoRI. Each DNA sample was incubated with a two-fold unit
excess of EcoRI pg-' of DNA for two hours at 3 7 ' ~ in 50 mM NaCl,
100 mM Tris pH 7.4, and 6 mM magnesium chloride. The
completeness of reaction was judged by the appearance of
characteristic EcoRI bands visible in ethidium bromide stained
agarose gels under U.V. transillumination and by parallel
digestions of lambda DNA. The digested DNA was electrophoresed
in 0.7% agarose gels and transferred to nitrocellulose paper.
The filters were hybridized simultaneously with 32~-labeled
insert fragment from the tube foot plasmid pPoTA9 at 68OC in 5X
SET overnight. The pPoTA9 insert fragment (1050 bp) was removed
from the vector by PstI digestion and preparative gel
electrophoresis. The isolated fragment was digested with AvaI
and the two resulting fragments (590 bp and 460 bp) were
end-filled with the Klenow fragment and 3 2 ~ - d ~ ~ ~ s . The probe
specific activity was 1.2 x lo8 cpm pg-'. After hybridization,
the filters were washed sequentially in 4X SET 0.2% SDS, 2X SET
0.2% SDS, 1X SET 0.2% SDS at 68OC with two one hour changes per
salt condition. The filters were washed finally for 4 h with
0.2X SET 0.2% SDS at 6 8 O ~ , dried and exposed to x-ray film with
intensifying screens. The following amounts of EcoRI digested
genomic DNA were applied to the original electrophoretic gel: A,
4.8 pg; B, 2.9 pg; C, 5.4 pg; D, 3.1 p g ; El 5.2 pg.


REFERENCES
Angerer, R.C. and Angerer, L.M. (1983). RNA localization in sea urchin embryos. In "Time, space, and pattern in embryonic development." (~effery, W.R. and Raf f, R.A., eds.) pp.lG1-129. Alan R. Lis, Inc., New York.
Aviv, H., and Leder, P. (1972). Purification of biologically active globin messenger RNA by chromatography on oligothymidylic acid-cellulose. Proc. Nat. Acad. Sci. U.S.A. 69:1408-1412.
Benton, W.D. and ~avis, R.W. (1977). Screening Xgt recombinant clones by hybridization to single plaques in situ. Science 196:180-182.
Blattner, F.R., Williams, B.G., Blechl, A.E., Denniston-Thompson, K., Faber, H.E., Furlong, L.A., Grunwald, D.J., Kiefer, D.O., Moore, D.D., Sheldon, E.L., Smithies, 0. (1977). Charon phages: Safer derivatives of bacteriophage lambda for DNA cloning. Science 196:161-169.
Blin, N. and Stafford, D.W. (1976). A general method for isolation of high molecular weight DNA from eukaryotes. Nucleic Acids Res. 3:2303-2308.
Bolivar, F., Rodrigues, R.L., Greene, P.J., Betlach, M.C. Heyneker, H.L:, Boyer, H.W. (1977). Contruction and characterization of new cloning vehicles. Gene 2:95-113.
Boylan, E.S., LaMarca, M.J., Schuetz, A.W. (1973). RNA synthesis in the ovary and oocytes of the starfish. Dev. ~iol. 31:136-146.
Brandhorst, B.P. (1976). TWO-dimensional gel patterns of protein synthesis before and after fertilization of sea urchin eggs. Dev. Biol. 52:310-317.
Brandhorst, B.P., (1980). Simultaneous synthesis, translation, and storage of mRNA including histone mRNA in sea urchin eggs. Dev. Biol. 79:139-148.
Brandhorst, B.P., Bedard, P., Tufaro, F. (1983). Patterns of - protein metabolism and the role of maternal RNA in sea urchin embryos. In "Time, space, and pattern in embryonic development." (~effery, W.R. and Raff, R.A., eds.) pp.29-47. Alan R. Lis, Inc., New York.
Britten, R.J., Graham, D.E., and Neufeld, B.R. (1974). ~nalysis of repeating DNA sequences by reassociation. In "Methods in enzymolology." (~rossman, L. and Moldave, K., eds.) Vol. 29E:363-418. Academic Press, New York.

~rosius, J., Palmer, M.L., Poindexter, J.K., Noller, H.F. (1978). Complete nucleotide sequence of a 16s ribosomal RNA gene from ~scherichia coli. Proc. Natl. Acad. Sci. - U.S.A. 75:4801-4805.
Brosius, J., Dull, T.J., Noller, H.F. (1980). Complete nucleotide sequence of a 23s ribosomal RNA gene from Escherichia coli. Proc. Natl. Acad. Sci. U.S.A. 77:201-204.
Busch, H., Reddy, R., Rothblum, L., Choi, Y.C: (1982). SnRNAs, SnRNPs, and RNA processing. Ann. Rev. ~iochem. 51:617-654.
Bushman, F.D. and Crain, W.R. Jr. (1983). Conserved pattern of embryonic actin gene expression in several sea urchins and a sand dollar.. Dev. Biol. 98:429-436.
Cabrera, C.V., Jacobs, H.T., Posakony, J.W., Grula, J.W. Roberts, J.W., Britten, R.J., Davidson, E.H. (1983). . Transcripts of three mitochondria1 genes in the RNA of sea urchin eggs and embryos. Dev. Biol. 97:500-505.
Cabrera, C.V., Lee, J.J., Ellison, J.W., Britten, R.J,, Davidson, E.H. (1984). Regulation of cytoplasmic mRNA prevalence in sea urchin embryos. J. Mol. Biol. 174:85-111.
Casadaban, M.J. and Cohen, S.N. (1980). Analysis of gene control signals by DNA fusion and cloning in ~scherichia coli. J. Mol. Biol. 138:179-207.
Cavey, M.J. and Wood, R.L. (1981). Specializations for excitation-contraction coupling in the podia1 retractor cells of the starfish Stylasterias forreri. Cell Tissue Res, 218:475-485.
Chamberlin, M.E., Galau, G.A., Britten, R.J., and avids son, E.H. (1978). Studies on nucleic acid reassociation kinetics: V. Effects of disparity in tracer and driver fragment lengths. ~ucleic Acids Res. 5:2073-1094.
Chan, H., Ruyechan, W.T., and Wetmur, J.R. (1976). In vitro iodination of low complexity nucleic acids without chain scission. Biochem. 15:5487-5490.
Chirgwin, J.M., Przybyla, A.E., MacDonald, R.J., Rutter, W.J. (1979). sol at ion of biologically active ribonucleic acid from sources enriched in ribonuclease. ~iochem. 18:5294-5299.
Choi, Y.C. and Ro-Choi, T. (1980). Basic characteristics of different classes of cellular RNA1s: A directory. In "Cell biology a comprehensive treatise." Vol. 3:609-667. Academic Press, New York.

Clarke, L. and Carbon, J. (1976) A colony bank containing synthetic ColEI hybrid plasmids representative of the entire E. coli genome. Cell 9:91-99. --
Conmerford, S.L. (1971). Iodination of nuclei~ acids in vitro, ~iochem. 10:1993-1999.
Constantini, F.D., Scheller, R.H., Britten, R.J. and Davidson, E.H. (1978). Repetitive sequence transcripts in the mature sea urchin oocyte. Cell 15:173-187.
Constantini, F.D., Britten, R.J.,and avids son, E.H. (1.980). Message sequences and short repetitive sequence-s are interspersed in sea urchin egg poly(~)+ RNAs. Nature 287:111-117.
Cooper, A.D. and Crain, W.R.! Jr. (1982). Complete nucleotide sequence of a sea urchin actin gene. Nucleic Acids Res. 13:4081-1092.
Crain, W.R. Jr., Durica, D.S., Van Doren, K. (1981). Actin gene expression in developing sea urchin embryos. Mol. Cell. Biol. 1:711-720.
Crain, W.R. Jr., Durica, D.S., Cooper, A.D., Van Doren, K., Bushman, F.D. (1982). Structure and developmental expression of actin genes in the sea urchin. In "Muscle development: Molecular and cellular control." pp.97-105. Cold Spring Harbour Laboratory, New York.
Crain, W.R. Jr. and Bushman, F.D. (1983). Transcripts of paternal and maternal actin gene alleles are present in interspecific sea urchin embryo hybrids, Dev. Biol. 100:190-196.
Crouse, G,F., Frischauf, A., Lehrach, H. (1983). An integrated and simplified approach to cloning into plasmids and single-stranded phages. In "Methods in ~nzymology." (WU, R., Grossman, L., Moldave, K., eds.) Part C, Vol. 101:78-89.
Czihak, G:, ed. (1975). "The sea urchin embryo." Springer-Verlag, Berlin.
Davidson, E.H. (1976). "Gene activity in early development." 2nd Ed. Academic Press, New York.
Davidson, E.H., Hough-Evans, B.R., Britten, R.J. (1982a). Molecular biology of the sea urchin embryo. Science. 217:17-26.
avids son, E.H., Thomas, T.L:, Scheller, R.H., and ~ritten, R.J. (1982b). The sea urchln actin genes and a speculation on the evolutionary significance of.smal1 gene families. In "Genome evolution." (Dover, G. A. and Flavell R. B., eds.)

pp.177-191, Academic Press, New York.
Davis, R.W.! Botstein, D., Roth, J.R. (1980). "A manual for genetlc engineering: Advanced bacterial genetics." cold Spring Harbor Laboratory, New ~ork.
Deeley, R.G., Gordon, J.I., Burns, A.T.H., Mullinix, K.P., ~inastein, M., and Goldberger, R.F. (1977). Primary activation of the vitellogenin gene in the rooster. J. Biol. Chem. 252:8310-8319.
Denhardt, D.T. (1966). A membrane-filter technique for the detection of complementary DNA. Biochem. Biophys. Res. Commun. 23:641-646.
Dische, Z. (1955). Color reactions of nucleic acid components. In "The nucleic acids." (chargaff, E., and d avid son, J.N., eds.) Vol. 1:285-306. Academic Press, New York.
Dolecki, G.J., Duncan, R.F. and Humphreys, T. (1977). complete turnover of poly(~) on maternal mRNA of sea urchin embryos. Cell, 11:339-344.
Drury, M.F. (1948). Identification and estimation of pentoses in the presence of glucose. Arch. Biochem. 19:450-466.
Duncan, R. and Humphreys, T. (1981). Multiple oligo(~) tracts associated with inactive sea urchin maternal mRNA sequences. Dev. ~iol. 88:211-219.
Duncan, R. and Humphreys, T. (1983). ~ligo(~) sequences present in sea urchin maternal RNA decrease following fertilization. Dev. Biol. 96:258-262.
Durica, D.S:, Schloss, J.A., Crain, Jr., W.R. (1980). Organization of actin gene sequences in the sea urchin: Molecular cloning of an intron-containing DNA sequence coding for a cytoplasmic actin. Proc. Natl. Acad. Sci. U.S.A. 77:5683-5687.
Durica, D.S. and Crain, W.R. Jr. (1982). ~nalysis of actin synthesis in early sea urchin development. Dev. ~iol. 92:428-439.
~fstratiadis, A., Posakony, J.W., Maniatis, T., Lawn, R.M., O'Connell, C., Spritz, R.A., DeRiell, J.K., Forget, B.G., Weissman, S.M., Slightom, J.L., Blechl, A.E., Smithies, O., Baralle, F.E., Shoulders, C.C., Proudfoot, N.J. (1980) The structure and evolution of the human 0-globin gene family. Cell 21:653-668.
Engel, J.N., Gunning, P.W., Kedes, L. (1981). sola at ion and characterization of human actin genes. Proc. Natl. Acad. Sci. U.S.A. 78:4674-4678.

Engels, w. R. (1981). ~stimating genetic divergence and genetic variability with restriction endonucleases. Proc. Natl. Acad. Sci. U.S.A. 78:6329-6333.
Epel, D. (1967). Protein synthesis in sea urchin eggs: A "late" response to fertilization. Proc. Natl. Acad. ~ c i . U.S.A. 57:899-906.
Epel, D. (1980). Experimental analysis of the role of intracellular calcium in the activation of sea urchin egg at fertilization. In "The cell surface: Mediator of developmental processes." (Subtelny, S. and Wessells, N.K., eds.) pp.169-185. Academic Press, New York.
Ernst, S.G., Hough-Evans, B.R., Britten, R.J., and Davidson, E.H. (1980). Limited complexity of the RNA in micromeres of 16-cell sea urchin embryos. Dev. Biol. 79:119-127.
Files, J.G., Carr, S., Hirsh, D. (1983). Actin gene family .of Caenorhabditis elegans. J. Mol. Biol. 164:355-375.
Finnegan, D.J., Rubin, G.M., Young, M.W., Hogness, D.S. (1977). Repeated gene families in Drosophila melanogaster. Cold Spring Harbor Symp. Quant. Biol. 42:1053-1063.
Firtel, R. A. (1981). Multigene families encoding actin and tubulin. Cell 24:6-7.
Fleck, A:, and Begg, D. (1965). The estimation of ribonucleic acld using ultraviolet absorption measurements. Biochem. Biophys. Acta 108:333-339.
Flytzanis, C.N., Brandhorst, B.P., Britten, R.J. and Davidson, E.H. (1982). Developmental patterns of cytoplasmic transcript prevalence in sea urchin embryos. Dev. Biol. 91 :27-35.
Forbes, D.J., Kirschner, M.W., Caput, D., Dahlberg, J.E., Lund, E. (19849. Differential expression of multiple U1 small nuclear RNAs in oocytes and embryos of eno opus laevis. Cell 38:681-689.
Fornwald, J.A., Kuncio, G., Peng, I., Ordahl, C.P. (1982). The complete nucleotide sequence of the chick a-actin gene and its evolutionary relationship to the actin gene family. Nucleic Acids Res. 10:3861-3876.
Fraser, A., Gomez, J., Hartwick, E.B;, and Smith, M.J. (1981). Observations on the reproduction and development of Pisaster ochraceus (~randt). Canad. J. Zool. 59:1700-1707.
Fretter, V. and Graham, A. (1976). "A functional anatomy of' invertebrates." pp.403. Academic Press, New York.
Fyrberg, E.A., ~indle, K.L., avids son, N. and ~odja, A. (1980).

The actin genes of Drosophila: a dispersed multigene family. Cell 19:365-378.
Fyrberg, E.A., Bond, B.J., Hershey, N=D., Mixter, K.S., Davidson, N. (1981). The actin genes of Drosophila: protein coding regions are highly conserved but intron positions are not. Cell 24:107-116.
Fyrberg, E.A., Mahaffey, J.W., Bond, B.J., Davidson, N. (1983). Transcripts of the six ~rosophila actin genes accumulate in a stage- and tissue-specific manner. Cell 33:115-123,
Galau, G.A., Britten, R.J., and ~av'idson, E.H. (1974). A measurement of the sequence complexity of polysomal messenger RNA in sea urchin embryos. Cell 2:9-11.
Galau, G.A., Klein, W.H., Davis, M.M., Wold, B.J., Britten, R.J1, and avid son, E.H. (1976). Structural gene sets active in embryos and adult tissues of the sea urchin. Cell 7:487-505.
Garcia, R., Paz-Aliaga, B.! Ernst, S.G., rain, W.R. Jr. (1984). Three sea urchin actin genes show different patterns of expression: Muscle specific, embryo specific, and constitutive. Mol. Cell. Biol. 4:840-845.
Glisin, V., Crkvejaov, R., Byus,C. (1974). Ribonucleic acid isolated by cesium chloride centrifugation. Biochemistry 13:2633-2637.
Goldberger, R. (1981). Regulation of gene expression in avian liver. In "The role of RNA in development and reproduction." (~iu, M. and Chuang, H.H., eds.) p.215-231. Science Press, Beijing.
Gottesman, M., Oppenheim, A., Court, D. (1982). Retroregulation: Control of gene expression from sites distal to the gene. Cell 29:727-728.
Guo, L. and Wu, R. (1983). Exonuclease 111: Use for DNA sequence analysis and in specific deletions of nucleotides. In "Methods in Enzymology." (WU, R., Grossman, L., Moldave, K., eds.) Part B, Vol. 100:60-96.
Guyette, W.A.! ~atusik, RiJ., Rosen, J.M. (1979). Prolactin-mediated transcriptional and post-transcriptional control of casein gene expression. Cell 17:1013-1023.
~arpold, M.M., Wilson, M.C., Darnell, J.E. Jr. (1981). ~hinese hamster polyadenylated messenger ribonucleic acid: Relationship to non-polyadenylated sequences and relative conservation during messenger ribonucleic acid processing. Mol. Cell. Biol. 1:188-198.

Higuchi, R., Paddoc, G.V., Wall, R. and Salser, W. (1976). A general method for-cloning eukaryotic structural gene sequences. Proc. Natl. Acad. Sci. U.S.A. 73:3146-3150.
Hinegardner, R.T. (1967). Echinoderms. In "Methods in developmental biology." (Trinkaus, J.P. ed.) pp.136-155. Thomas, Y. Crowele Co., New York.
Hinegardner, R. (1974). Cellular DNA content of the ~chinodermata. Comp. Biochem. Physiol. 49B:219-126.
Hoopes, B.C. and McClure, W.R. (1981). Studies on the selectivity of DNA precipitation by spermine. Nucleic Acids Res, 9:5493-5504.
Hough, B.R., Smith, M.J., Britten, R.J., and Davidson, E.H. (1975). Sequence complexity of heterogeneous nuclear RNA in sea urchin embryos. Cell 5:291-199.
~ough-~vans, B.R., wold, B.J., Ernst, S.G., Britten, R.J., and Davidson, E.H. (1977). Appearance and persitance of maternal RNA sequences in sea urchin development. Dev. Biol. 60:258-177.
Hough-Evans, B.R., Jacobs-Lorena, M., Cummings, M.R., Britten, R.J., and Davidson, E.H. (1980). Complexity of RNA in eggs of Drosophila melanogaster and Musca domestica. ~enetics 95:81-94.
Houk, M.S., and Epe1,- D. (1974) Protein synthesis during hormonally induced meiotic maturation and fertilization in starfish oocytes. Dev. Biol. 40:298-310.
Humphreys, T. (1969). Efficiency of translation of messenger RNA before and after fertilization of sea urchin eggs. Dev. Biol. 20:435-458.
Humphreys, T. (1971). Measurements of messenger RNA entering polysomes upon fertilization of sea urchin eggs. Dev. Biol. 26:201-208.
Hunter, T. and Garrels, J.I. (1977). Characterization of the mRNAs for a-, P - , r-actin. Cell 12:767-781.
Jeffery, W.R. (1977). Polyadenylation of maternal and newly- synthesized RNA during starfish oocyte maturation. ~ e v . Biol. 57:98-108.
Jeffery, W.R. (1983). Messenger RNA localization and cytoskeletal domains in ascidian embryos. In "Time, space, and pattern in embryonic development." (~effery, W.R. and Raff, R.A., eds.) pp.241-259. Alan R. Lis, Inc., New York.
Jeffery, W.R. and Raff, R.A., ed. (1983). "Time, space and pattern in embryonic development." Alan R. Liss, Inc., New

York.
Jefferys, A.J. (1981). Recent studies of gene evolution using . recombinant DNA. In "Genetic Engineering." (Williamson, R., ed.) Vol. 2:l-48. ~cademic Press, New York.
Kabat-Zinn, R. and Singer, R. H. (1981). Sea urchin tube feet: Unique structures that allow a cytological and molecular approach to the study of actin and its gene expression. J. Cell. Biol. 89:109-114.
Kafatos, F.C:, Jones, C.W., ~fstratiadis, A. (1979). Determination of nucleic acid sequence homologies and relative concentrations by a dot hybridization procedure. Nucleic Acids Res. 7:1541-1552.
Kanatani, H. (1969). Induction of spawning and oocyte maturation by L-methyl adenine in starfishes. Exp. Cell Res. 57:333-337.
Kanatani, H. (1975). Maturation-inducing substances in asteroid and echinoid oocytes. Amer. 2001. 15:493-505.
Khalili, K., Salas, C., Weinmann, R. (1983). Isolation and characterization of human actin genes cloned in phage lambda vectors. Gene 21:9-17.
Kindle, K.L. and Firtel, R.A. (1978). ~dentification and analysis of ~ictyostelium actin genes, a family of moderately repeated genes. Cell 15:763-778.
Kiper, M. (1979). Gene numbers as measured by single-copy saturation with mRNA are routinely overestimates. Nature 278:279-180.
~ovesdi; I., and Smith, M.J. (1982). Sequence complexity in the maternal RNA of the starfish Pisaster ochraceus (~randt). Dev. Biol. 89,56-63.
Kovesdi, I., Preugschat, F., Sturzel, M., and smith, M.J. (1984). Actin genes from the sea star pisaster ochraceus. Biochim. Biophys. Acta 782,76-86.
Lasky, L.A., Lev, Z., Xin, J., Britten, R.J., and Davidson, E.H. (1980). Messenger RNA prevalence in sea urchin embryos measured with cloned cDNAs. Proc. Nat. Acad. Sci. U.S.A. 77:5317-5321.
Lee, J.J.., Shott, R.J., Rose 111, S.J., Thomas, T.L., Britten, R.J., Davidson, E.H. (1984). Sea urchin actin gene subtypes. J. Mol. ~iol. 172:149-176.
Maniatis, T., Jeffrey, A., Kleid, D.G. (1975). ~ucleotide sequence of the rightward operator of phage X Proc. Natl. Acad. Sci. U.S.A. 72:1184-1188.

Maniatis, T., Hardison, R.C., Lacy, E:, Lauer, J., O'Connel, C., Quon, D., Kim, G.K. and Efstratladis, A. (1978). The
. isolation of structural genes from libraries eukaryotic DNA. Cell 15:687-701.
Maniatis, T., Fritsch, E.F., Sambrook, J. (1982). Molecular cloning, a laboratory manual. Cold Spring Harbor Laboratory, New York.
Martin, S.L., Zimmer, E.A.! Davidson, W.S., ~ilson, A.C. (1981). The untranslated reglons of 0-Globin mRNA evolve at a functional rate in higher primates, Cell 25:737-741.
Martindale, M.Q. and Brandhorst, B.P. (1984). Translational changes induced by 1-methyladenine in anucleate starfish oocytes. Dev. Biol. 101:512-515.
Mauron, A., Levy, S., Childs, G., Kedes, L. (1981). Monocistronic transcription is the physiological mechanism of sea urchin embryonic histone gene expression. Mol. Cell. Biol. 1:661-671.
Mauron, A., Kedes, L., Hough-Evans, B.R., Davidson, E.H. (1982). ~ccumulation of individual histone mRNAs during Embryogenesis of the sea urchin Strongylocentrotus purpuratus. Dev. Biol. 94:425-434.
Maxam, A.M. and Gilbert, W. (1980). Sequencing end-labeled DNA with base-specific chemical cleavages. In "Methods in Enzymology." (Colowick, S.P., and Kaplan, N.O., eds.) Vol. 65:499-560.
Mayer, Y., Czosnek, H., Zeelon, P.E., Yaffe, D., Nudel, U. (1984). Expression of the genes coding for the skeletal muscle and cardiac actins in the heart. Nucleic Acids Res. 12:1087-1100.
Merlino, G.T., Water, R.D., Moore, G.P., Kleinsmith, L.J. (1981). Change in expression of the actin gene family during early sea urchin development. Dev. Biol. 85:505-508.
Messing, J. and Vieira, J. (1982). A new pair of MI3 vectors for selecting either strand of double-digest restriction fragments. Gene 19:269-276.
Messing, J. (1983). New MI3 vectors for cloning. In "~ethods in - Enzymology." (Wu, R., Grossman, L., Moldave, K., eds.)
Part C, Vol. 101:20-77.
Modiano, G. and Pepe, G. (1983). The quantitative expression of 6 and p human globin genes is controlled by both 5' and 3' untranslated regions. Mol. Biol. Med. 1:157-159.
Munro, H.N., and Fleck, A. (1966). The determination of nucleic

acids. In "Methods of biochemical analysis." (Glick, D., ed.). Vol. 14:113-176. Interscience, New York.
Murre, C., Reiss, C.S., Bernabeu, C., Chen, L.B., Burakoff, - S.J., Seidman, J.G. (1984). Construction, expression and
recognition of an H-2 molecule lacking its carboxyl terminus. Nature 307:432-436.
McDonnell, M.W:, Simon, M.N., Studier, F.W. (1977). Analysis of restriction fragments of T7 DNA and determination of molecular weights by electrophoresis in neutral and alkaline gels. J. Mol. Biol. 110:119-146.
~ c ~ e o w n ; M., Taylor, W.C., Kindle, K., Firtel, R.A., Bender, W. and Davidson, N. (1978). Multiple, heterogeneous actin genes in ~ictyostelium. Cell 15:789-800.
McKeown, M. and Firtel, R.A. (1981). Differential expression and 5' end mapping of actin genes in Dictyostelium. Cell . 24:799-807.
McMaster, G.K. and Carmichael, G.G. (1977). Analysis of single- and double-stranded nucleic acids on polyacrylamide and agarose gels by using glyoxal and acridine orange. Proc. Natl. Acad. Sci. U.S.A. 74:4835-4838.
Nemer, M. (1975). Developmental changes in the synthesis of sea urchin embryo messenger RNA containing and lacking polyadenylic acid. Cell 6:559-570.
Ng, R. and Abelson, J. (1980). Isolation and sequence of the - gene for actin in Sacchromyces cerevisiae. Proc. Natl. Acad. Sci. U.S.A. 77:3912-3916.
Nichols, D. (1961). A comparative histological study of the tube feet of two regular echinoids. Q.J. Microsc. Sci. 102:157-180.
Noll, H. (1967). Characterization of macromolecules by constant velocity sedimentation. Nature 215:360-363.
Nudel, U., Katcoff, D., Zakut, R., Shani, M., Carmon, Y., Finer, M., Czosnek, H., Ginsburg, I., Yaffe, D. (1982). sola at ion and characterization of rat skeletal muscle and cytoplasmic actin genes. Proc. Natl. Acad. S C ~ . U.S.A. 79:2763-2767.
Nudel, U., Zakut, R., Shani, M., Neuman, S., Levy, Z. ~ a f f e , D. (1983). The nucleotide sequence of the rat cytoplasmic 0-actin gene. ~ucleic ~cids Research 11:1759-1771.
Ohama, T., Hori, H., Osawa, S. (1983). The nucleotide sequences of 5s rRNAs from a sea-cucumber, a starfish end a sea-urchin. Nucleic Acids Research 11:5181-5184.

Ordahl, C.P. and Cooper, T.A. (1983). Strong homology in promotor and 3l-untranslated regions of chick and rat a-actin genes. Nature 303:348-349.
Overbeek, P.A., ~erlino, G.T.1 Peters, N.K., Cohn, V.H., Moore, G.P., Kleinsmith, L.3. (1981). Characterization of five members of the actin gene family in the sea urchin. Biochim. Biophys. Acta. 656:195-205.
Patient, R. (1984). DNA hybridization - beware. Nature 308:15-16.
Paul, C.R.C. (1977). Evolution of primitive echinoderms. In "Patterns of evolution." pp.123-158. allam am, A.,ed.) Elsevier, Amsterdam.
Pearson, W., Davidson, E.H., and ~ritten, R.J. (1977). Program for least squares analyses of reassociation hybridization data. Nucleic Acids Res. 4:1727-1737.
Peters, C. and Jeffery, W.R. (1978). Postfertilization poly(~) protein complex formation on sea urchin maternal messenger RNA. ~ifferentiation 12:91-97.
Peters, N.K. and Kleinsmith, L.J.. (1984). Kinetic model for the study of gene expression in the developing sea urchin. Dev. Biol. 102:133-137.
Raff, R.A. (1980). Masked messenger RNA and the regulation of protein synthesis in eggs and embryos. In "Cell biology'a comprehensive treatise." (~rescott, D.M. and old stein, L. eds.) Vol. 4:107-136. Academic Press, New York.
Raff, R.A. (1983). Localization and temporal control of expression of maternal histone mRNA in sea urchin embryos. In "Time, space, and pattern in embryonic development." (~effery, W.R. and Raff, R.A., eds.) pp.65-86. Alan R. Lis, Inc., New York.
Raff, R.A., Anstrom, J.A., Huffman, C.J., ~ e a f , D.S., Loo, J., Showman, R.M. (1984). Origin of a gene regulatory mechanism in the evolution of echinoderms. Nature 310:312-314.
Rodgers, W.H., and Gross, P.R. (1978). Inhomogeneous distribution of egg RNA sequences in early embryos. Cell 14:279-188.
Rosenthal, E.T:, Hunt T., Ruderman, J.V. (1980). Selective translation of mRNA controls the pattern of protein synthesis during early development of the surf clam, Spisula solidissima. Cell 20:487-494.
~osenthal, E.T:, Brandhorst, B.P., Ruderman, J.V. (1982). Translatlonally mediated changes in patterns of protein

synthesis during maturation of starfish oocytes. Dev. Biol. 91:215-220.
Roychoudhury, R. and Wu, R. (1980). Terminal transferase-catalyzed addition of nucleotides to the 3' termini of DNA. In "Methods in enzymology." (~olowick, S.P. and Kaplan, N.O. eds.) Val. 65:43-62. Academic Press, New - Yor k .
Sanchez, F., Tobin, S.L., Rdest, U., Zulauf, E., McCarthy, B.J. (1983). Two Drosophila actin genes in detail. J. Mol. ~iol. 163:533-551.
Sanger, F., Air, G.M., Barrell, B.G., Brown, N.L., Coulson, A.R., Fiddes, J.C., ~utchison 111, C.A., Slocomber, P.M., Smith, M. (1977a). ~ucleotide sequence of bacteriophage $XI74 DNA. Nature 265:687-695.
Sanger, F., Nicklen, S., Coulson, A.R. (1977b). DNA sequencing with chain-terminating inhibitors. Proc. Natl. Acad. Sci. U.S.A. 74:5463-5467.
Scheller, R.H., Costantini, F.D., Kozlowski, M.R., Britten, R.J., Davidson, E.H, (1978). Specific representation of cloned repetitive DNA sequences in sea urchin RNAs. Cell. 15:189-203.
Scheller, R.H., McAllister, L.B., Crain, W.R:, Durica, D.S., Posakony, J.W., Britten, R,J., and Davidson, E.H. (1981). Organization and expression of multiple actin genes in sea urchin. Mol. Cell. Biol. 1:609-628.
Schroeder, T.E. and Stricker, S.A. (1983). Morphological changes during maturation of starfish oocytes: Surface ultrastructure and cortical actin. Dev. Biol. 98:373-384.
Schuler, M.A. and Keller, E.B. (1981). The chromosomal arrangement of two linked actin genes in the sea urchin S. purpuratus. Nucleic Acids Res, 9:591-604. -
Schuler, M.A., McOsker, P., Keller, E.B. (1983). DNA sequence of two linked actin genes of sea urchin. Mol. Cell. Biol. 3:448-456.
Schwartz, R.J. and Rothblum, K. (1980). Regulation of muscle differentiation: Isolation and purification of chick actin messenger ribonucleic acid and quantitation with complementary deoxyribonucleic acid probes. Biochem, 19:2506-2514.
Shah, D.M., Hightower, R.C., Meagher, R.B. (1982). Complete nucleotide sequence of a soybean actin gene. Proc. Natl. Acad. Sci. U.S.A. 79:1022-1026.
- Shott, R.J., Lee, J.J., Britten, R.J., Davidson, E.H. (1984).
Differential expression of the actin gene family of Strongylocentrotus purpuratus. Dev. Biol. 101:295-306.
Smith, G.E., and Summers, M.D. (1980). The bidirectional transfer of DNA and RNA to nitrocellulose or diazobenzyloxymethyl-paper. Anal. Biochem. 109:123-129.
Smith, M.J., and Boal, R. (1978). DNA sequence organization in the common pacific starfish Pisaster ochraceus. Canad. J. Biochem. 56:1048-1054.
Smith, M.J., Lui, A., Gibson. K.K.. and ~tzkorn. J.K. (1980). . ~
'DNA sequence oiganization in' the starfish'~ermasterias imbricata. Canad. J. Biochem. 58:352-360.
Smith, M.J., Nicholson, R., Stuerzl, M., and Lui, A. (1982). Single copy DNA homology in sea stars. J. Molec. Evol. 18:92-101.
Southern, E. M., (1975). Detection of specific sequences among DNA fragments separated by gel electrophoresis. J. Mol. Biol. 98:503-517.
Spencer, W.K., Wright, C.W. (1966). Asterozoans. In "Treatise on invertebrate paleontology." (~oore, R.C.,ed.) Part U. Echinodermata 3. Vol. 1:4-103. The Geological Society of America Inc. and the University of Kansas Press.
Studier, F.W. (1965). Sedimentation studies of the size and shape of DNA. J. Mol. Biol. 11:373-390.
/
Thomas, P.S. (1980). Hybridization of denatured RNA and small DNA fragments transferred to nitrocellulose. Proc. Natl. Acad. ~ c i . U.S.A. 77:5201-5205.
Thomas, P.S. (1983). Hybridization of denatured RNA transferred or dotted to nitrocellulose paper. In "Methods in Enzymology." (WU, R., Grossman, L., Modave, K., eds.) Part B, Vol. 100:255-266.
Thomas, T.L., Posakony, J.W., Anderson, D.M., Britten, R.J. and Davidson, E.H. (1981). Molecular structure of maternal RNA. Chromosoma 84:319-335.
Tobin, S.L., Zulauf, E.! Sanchez, F., Craig, E.A., McCarthy, B.J. (1980). Multlple actin-related sequences in the Drosophila melanoqaster genome. Cell 19:121-131. .
Tufaro, F. and Brandhorst, B.P., (1982). Restricted expression of paternal genes in sea urchin interspecies hybrids. Dev. Biol. 92:209-220.
Vanderkerckhove, J. and Weber, K. (1978a). At least six different actins are expressed in a higher mammal: an analysis based on the amino acid sequence of.the

amino-terminal tryptic peptide. J. Mol. Biol. 126:783-802,
Vanderkerckhove, J. and Weber, K. (1978b). Actin amino-acid sequences. Comparison of actins from calf thymus, bovine brain, and S~40-transformed mouse 3TC cells with rabbit skeletal muscle actin. Eur. J. ~iochem. 90:451-462.
Vandekerckhove, J.and Weber, K. (1980). Vegetative Dictyostelium cells containing 17 actin genes express a single major actin. Nature 284: 475-4771
- - -
Vanderkerckhove, J., Franke, W.W., Weber, K. (1981). Diversity of expression of non-muscle actin in amphibia. J.'~ol. Biol. 152:413-426.
Van Ness, J., Maxwell, I .H., and Hahn, W.E. (1979). Complex population of nonpolyadenylated messenger RNA in mouse brain. Cell 18:1341-1349.
Wartell, R.M. and Reznikoff, W.S. (1980). Cloning DNA restriction endonuclease fragments with protruding, single-stranded ends. Gene 9:307-319.
Watson, J.D. (1977). "Molecular biology of the gene." 3rd Ed. W.A. Benjamin, Inc., California.
Wetmur, J.G. (1976). ~ybridization and renaturation kinetics of nucleic acids. In "Methods. in Enzymology." (Grossman, L., and Moldave, K., eds.) Vol. 293:337-361
Whitely, A.H. (1949). The phosphorous compounds of sea urchin eggs and the uptake of radio-phosphate upon fertilization. Amer. Nat. 83:249-167.
Wilt, F.H., and Wessells, N.K. eds. (1967). "Methods in developmental biology." Thomas Y. Crowell, New York.
Wilt, F.H. (1973). ~ol~adenlylat'ion of maternal RNA of sea urchin eggs after fertilization. Proc. Nat. Acad. ~ c i . U.S.A. 70:2345-1349.
Wilt, F.H. (1977). The dynamics of maternal polyA-containing mRNA in fertilized sea urchin eggs. Cell 11:673-681.
WOO, S.L.C., Rosen, J.M., Llarakos, C.D., Choi, C., Busch, H., Means, A-.R., O1MalleyI B.W. (1975). Physical and chemical characterization of purified ovalbumin messenger RNA. J. Biol. Chem. 250:7027-7039.

gene encoding actin I. Nature 292:556-558.


![[II] Molecular Techniques for Studying Gene Expression](https://cdn.vdocument.in/doc/165x107/56814c3a550346895db94095/ii-molecular-techniques-for-studying-gene-expression.jpg)
