
Monetary Policy CommitteePrice, Monetary and Balance of Payments Developments
V. Punchoo
Head - Statistics Division
14 July 2014

© Bank of Mauritius
Inflation Highlights -I Between March & June 2014, CPI fell by 0.9 index
points from 107.7 to 106.8, bringing the y-o-y inflation rate in June 2014 to 3.3 per cent from 4.5 per cent in March 2014. Headline inflation stood at 4.0 per cent for the third month-running
The initial assumption that the impact on the CPI of the supply shock to food on account of adverse climatic conditions in January and February 2014 would gradually fade and market conditions returning back to normal around September has turned out to be incorrect.

© Bank of Mauritius
Inflation Highlights -II In fact supply conditions have normalized much faster
and by June 2014, the impact of the temporary shock had died out
On the basis of current trends and barring any other shocks, it has become less likely that inflation would reach levels forecast in February and April 2014
The falling inflation in recent months is likely to be explained by tame global commodity prices, stable rupee exchange rates and weak domestic demand conditions mirrored by downward revisions in the growth forecasts
© Bank of Mauritius
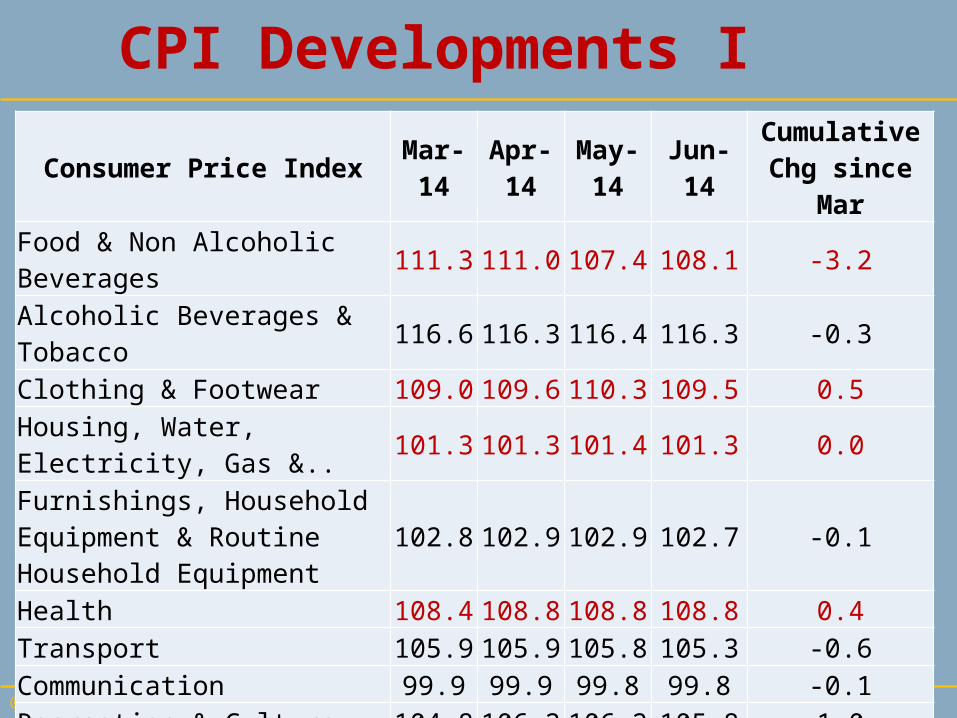
CPI Developments I
Consumer Price Index Mar-14 Apr-14 May-14 Jun-14 Cumulative Chg since Mar
Food & Non Alcoholic Beverages 111.3 111.0 107.4 108.1 -3.2Alcoholic Beverages & Tobacco 116.6 116.3 116.4 116.3 -0.3Clothing & Footwear 109.0 109.6 110.3 109.5 0.5Housing, Water, Electricity, Gas &.. 101.3 101.3 101.4 101.3 0.0
Furnishings, Household Equipment & Routine Household Equipment
102.8 102.9 102.9 102.7 -0.1
Health 108.4 108.8 108.8 108.8 0.4Transport 105.9 105.9 105.8 105.3 -0.6Communication 99.9 99.9 99.8 99.8 -0.1Recreation & Culture 104.8 106.2 106.2 105.8 1.0Education 103.3 103.3 103.3 103.3 0.0Restaurants & Hotels 111.3 111.0 111.2 111.6 0.3Misc. Goods & Services 104.7 105.0 104.9 105.3 0.6Overall 107.7 107.7 106.8 106.8

© Bank of Mauritius
CPI Developments IIConsumer Price Index
Weighted Contribution to
inflation %
DIVISIONS Weights Jun-13 Mar-14Jun-14Mar-14
to Jun-14
Jun-13 to
Jun-14 Food & Non Alcoholic Beverages 273 103.9 111.3 108.1 -0.8 1.1 Fresh Vegetables 39 109.3 147.3 115.0 -0.9 0.2Alcoholic Beverages & Tobacco 96 109.9 116.6 116.3 0.0 0.6Clothing & Footwear 45 102.7 109.0 109.5 0.0 0.3Housing, Water, Electricity, Gas & 120 100.3 101.3 101.3 0.0 0.1Furnishings, Household Equipment 61 102.6 102.8 102.7 0.0 0.0Health 40 103.9 108.4 108.8 0.0 0.2Transport 151 103.1 105.9 105.3 -0.1 0.3Communication 39 100.1 99.9 99.8 0.0 0.0Recreation & Culture 44 99.2 104.8 105.8 0.0 0.3Education 45 101.7 103.3 103.3 0.0 0.1Restaurants & Hotels 45 106.4 111.3 111.6 0.0 0.2Misc. Goods & Services 41 102.4 104.7 105.3 0.0 0.1Overall 1000 103.4 107.7 106.8 -0.8 3.3

© Bank of Mauritius
CPI Developments IIIRecomputing CPI without the temporary shock
Consumer Price Index Mar-14 Apr-14 May-14 June-14
Food & Non Alcoholic Beverages 105.3 106.3 106.4 106.9Alcoholic Beverages & Tobacco 116.6 116.3 116.4 116.3Clothing & Footwear 109.0 109.6 110.3 109.5Housing, Water, Electricity, Gas &.. 101.3 101.3 101.4 101.3Furnishings, Household Equipment & Routine Household Equipment 102.8 102.9 102.9 102.7
Health 108.4 108.8 108.8 108.8Transport 105.9 105.9 105.8 105.3Communication 99.9 99.9 99.8 99.8Recreation & Culture 104.8 106.2 106.2 105.8Education 103.3 103.3 103.3 103.3Restaurants & Hotels 111.3 111.0 111.2 111.6Misc. Goods & Services 104.7 105.0 104.9 105.3Overall 106.1 106.4 106.5 106.5

© Bank of Mauritius
Inflation Indicators
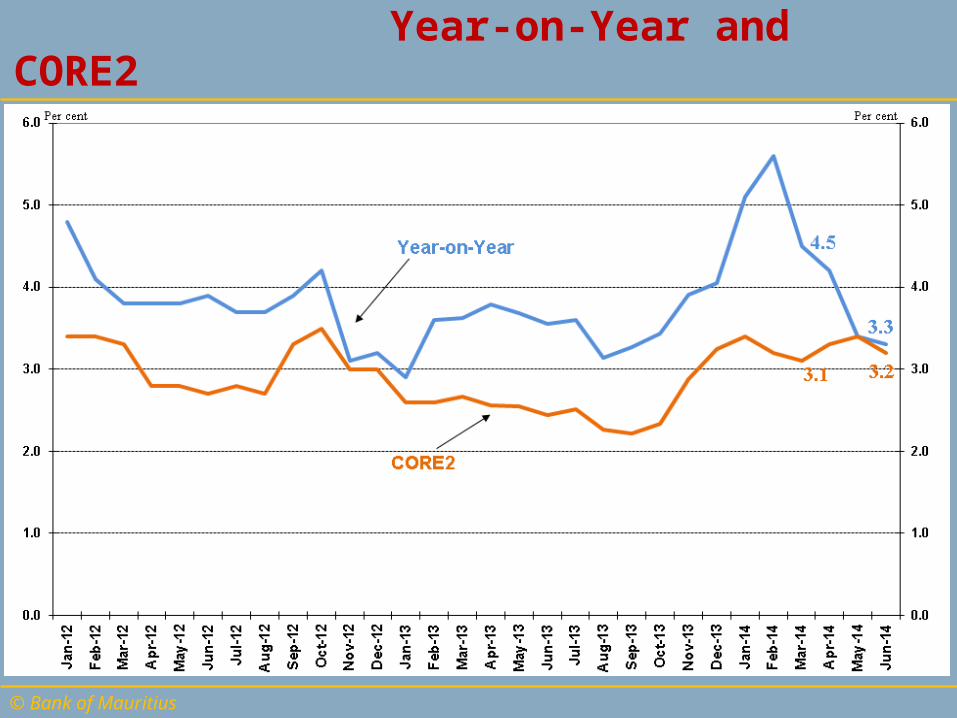
Moderate underlying inflationary pressures - Y-o-y CORE1 stood unchanged at 2.7% in June 2014, compared to March 2014 while CORE2 inflation edged up from 3.1% in March 2014 to 3.2% in June 2014
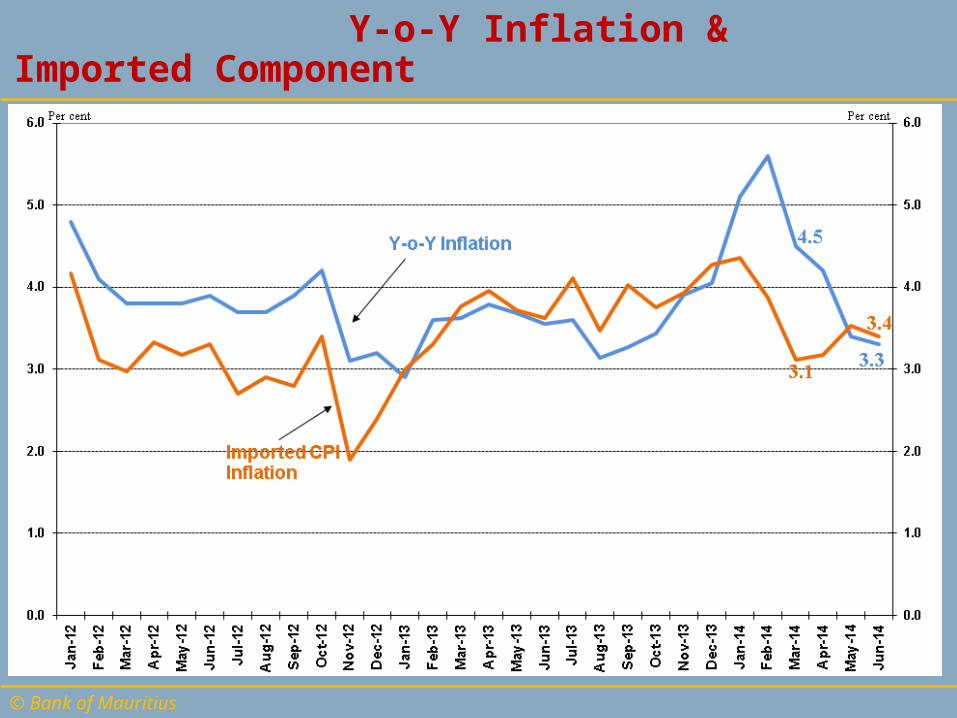
Y-o-Y imported CPI inflation rose from 3.1% in March 2014 to 3.5% in May 2014 before easing to 3.4% in June 2014.
Y-o-Y goods inflation went down from 5.2% in Mar 2014 to 3.3% in Jun 2014 while services inflation remained unchanged at 3.2% in June 2014.
© Bank of Mauritius
Year-on-Year and CORE2
© Bank of Mauritius
Y-o-Y Inflation & Imported Component

© Bank of Mauritius
Price Expectations a year ahead
© Bank of Mauritius
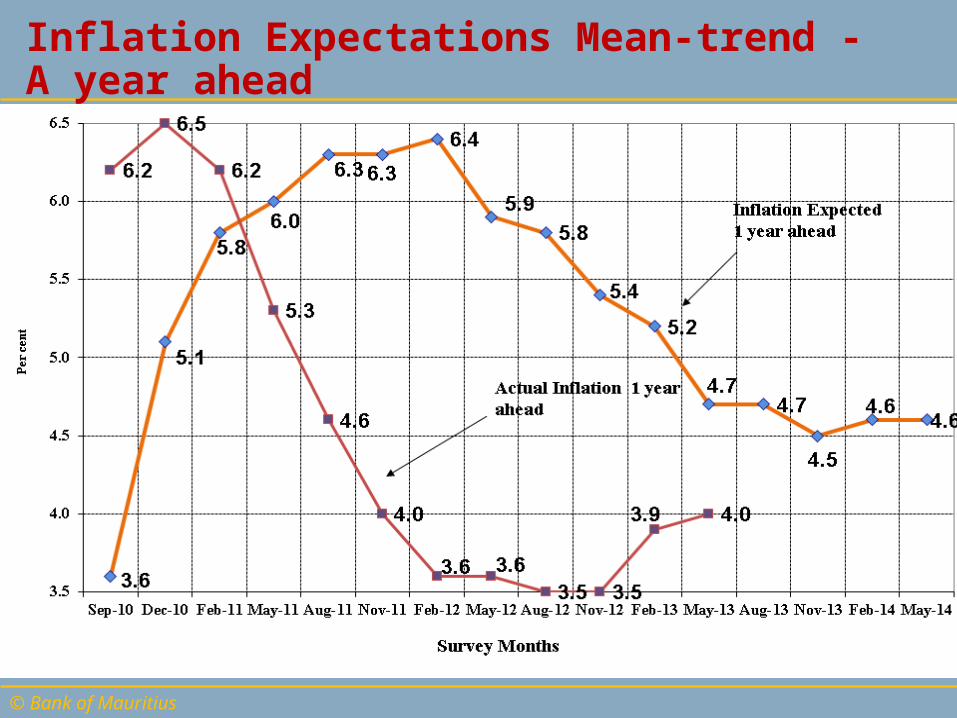
Inflation Expectations Mean-trend - A year ahead

© Bank of Mauritius
Mean Expectations – Time Horizons
IES – May 2014 IES – February 2014

© Bank of Mauritius
MONETARY DEVELOPMENTS

© Bank of Mauritius
Monetary Developments – I

© Bank of Mauritius
Monetary Developments - III

© Bank of Mauritius
Interest Rate Developments
Real interest rate is based on weighted savings deposit rates and does not take into account the drop in savings interest rates by some banks.

© Bank of Mauritius
BALANCE OF PAYMENTS DEVELOPMENTS

© Bank of Mauritius
Merchandise Trade & Current Account Deficits Ratio
-15.6 bn
-21.0 bn
-12.7 bn-8.6
-13.2
-9.3
-6.1
-18
-16
-14
-12
-10
-8
-6
-4
-2
0
-25
-20
-15
-10
-5
0Q12011 Q22011 Q32011 Q42011 Q12012 Q22012 Q32012 Q42012 Q12013 Q22013 Q32013 Q42013 Q12014
Rs billion Per cent
Current Account deficit (% GDP)
Merchandise Trade deficit

© Bank of Mauritius
Summary BOP I Rs Million Q1-2011 Q1-2012 Q1-2013 Q1-2014
Current Account (Including GBC1s) -5,706 -2,988 -7,301 -5,379
Current Account (Excluding GBC1s) -4,301 -5,897 -8,165 -5,702
Exports (f.o.b) 16,986 17,997 20,361 21,385
Imports (f.ob) -32,932 -35,631 -36,000 -34,038
Trade balance -15,953 -17,634 -15,639 -12,653
Services, net 8,247 9,631 6,130 4,587
o.w travel, net 9,137 11,193 8,852 7,914
Income, net (Including GBC1s) 748 3,438 2,115 2,217
Income, net (Excluding GBC1s) 2,086 394 1,168 1,839
Current transfers, net 1,252 1,577 93 470
Current A/c (Incl. GBC1s) as a % of GDPmp -7.6 -3.8 -8.6 -6.1
Current A/c (Excl. GBC1s) as a % of GDPmp -5.7 -7.4 -9.7 -6.5

© Bank of Mauritius
Summary BOP II
Rs millionQ1-2011 Q1-2012 Q1-2013 Q1-2014
Capital & Financial Account 4,472 -9,827 8,233 7,646Direct investment, net (Including GBC1s) 1,282 53,795 15,194 6,508Direct investment, net (Excluding GBC1s) 1,799 1,787 1,586 1,508 Abroad (Excluding GBC1s) -1,069 -1,346 -612 -75 In Mauritius (Excluding GBC1s) 2,868 3,133 2,198 1,583Portfolio investment, net (Including GBC1s) 52,303 9,549 18,573 10,561Portfolio investment, net (Excluding GBC1s) -1,244 -547 1,813 1,061 Equity (Excluding GBC1s) -1,226 -607 1,988 882 Debt (Excluding GBC1s) -18 60 -175 179Other investment, net (Including GBC1s) -47,307 -74,744 -20,523 -3,313Other investment, net (Excluding GBC1s) -6,841 -33,879 14,022 34,887 General Government 3,723 76 922 1,767 Monetary Authorities 0 0 0 0 Banks -12,221 -33,729 11,521 30,933 Other Sectors: Long-term (Excluding GBC1s) 390 -1,187 -613 -732 Other Sectors: Short-term 1,267 961 2,192 2,919
Balance of payments Surplus (-)/ Deficit (+) -1,797 1,614 -5,004 -6,090
© Bank of Mauritius
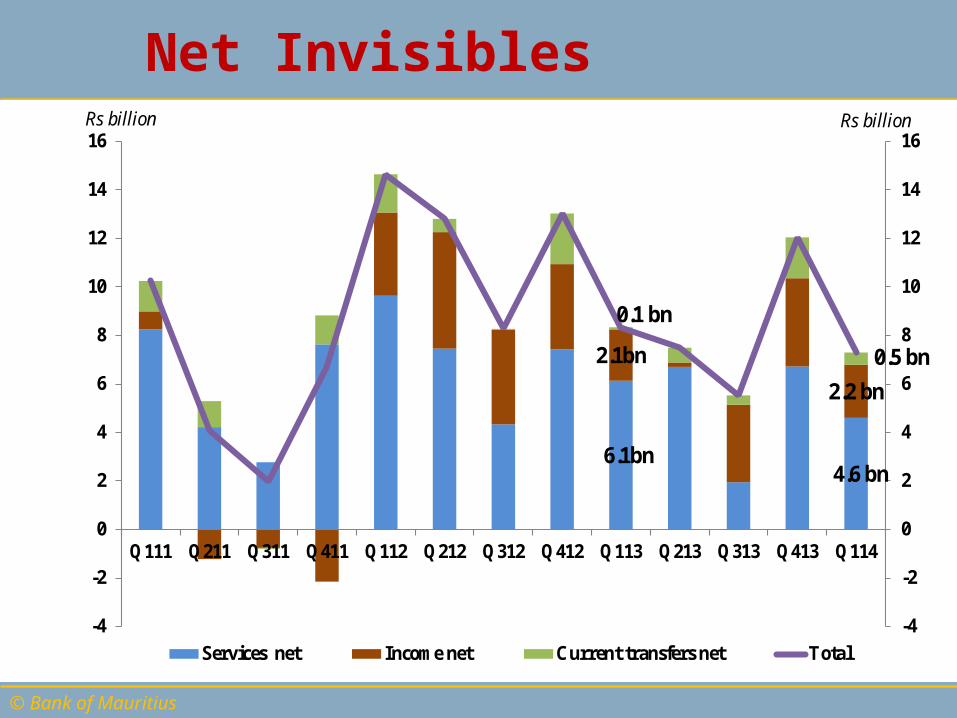
Net Invisibles
6.1bn4.6 bn
2.1bn
2.2 bn
0.1 bn
0.5 bn
-4
-2
0
2
4
6
8
10
12
14
16
-4
-2
0
2
4
6
8
10
12
14
16
Q111 Q211 Q311 Q411 Q112 Q212 Q312 Q412 Q113 Q213 Q313 Q413 Q114
Rs billion
Services net Income net Current transfers net Total
Rs billion

© Bank of Mauritius
Reserves Adequacy
105.0 bn112.0 bn
121.4 bn5.2 mths5.6 mths
6.0 mths
0
1
2
3
4
5
6
7
0
20
40
60
80
100
120
140
Q1 11 Q2 11 Q3 11 Q4 11 Q1-12 Q2-12 Q3-12 Q4-12 Q1-13 Q2-13 Q3-13 Q4-13 Q1-14 Q2-14
Rs billion Month
Months of Imports
GOIR

© Bank of Mauritius
Thank you


