
Public Health Performance Management
Centers for Excellence
Funded by CDC’s National Public Health Improvement Initiative
Welcome!
Monitoring Quality Improvements:
Introduction to Variation Theory
will begin shortly
1

Public Health Performance Management
Centers for Excellence
Funded by CDC’s National Public Health Improvement Initiative
Monitoring Quality Improvements:
Introduction to Variation Theory
May 8, 2013
2
Stacy Wenzl,
Spokane Regional Health District
Megan Davis,
Washington State Dept. of Health
Public Health Performance Management Centers for Excellence 5-8-2013
Adams
Benton-Franklin
Chelan-Douglas
Clallam
Clark
Columbia
Cowlitz
Garfield
Grant
Island
Jefferson
Kitsap
Kittitas
Klickitat
Lewis
Lincoln
Northeast Tri-County Okanogan
Pacific
King
San Juan
Skagit
Skamania
Snohomish
Spokane
Pierce
Thurston
Wahkiakum Walla Walla
Whatcom
Whitman
Yakima
Grays
Harbor
Asotin
Chelan
Douglas
Ferry Stevens
Pend
Oreille
Benton
Franklin
Mason
Noosack Tribe
Lummi Tribe
Upper Skagit Tribe
Sauk-Suiattle Tribe
Samish Tribe Swinomish Tribe
Stillaguamish Tribe
Snoqualmie Tribe
Muckleshoot Tribe
Puyallup Tribe
Suquamish Tribe
Makah Tribe
Lower Elwha Klallam Tribe Jamestown
S’Klallam Tribe Quileute Tribe
Hoh Tribe
Port Gamble S’Klallam
Tribe
Skokomish Tribe Quinault Tribe
Shoalwater Bay Tribe
Nisqually Tribe
Chehalis Confederated
Tribes
Confederated Tribes and Bands
Yakima Nation WA State Dept. of Health
Center for Excellence
Tacoma-Pierce County Center for Excellence
Colville Confederated
Tribes
Kalispel Tribe
Spokane Regional Health Center for Excellence
Tulalip Tribe
Tacoma-Pierce
Seattle-King County
Tacoma-Pierce Co Health Dept.
WA State Dept. of Health
Spokane Regional Health
District
County Boundaries
Washington’s Federally Recognized Tribes
Squaxin Tribe
Spokane Tribe
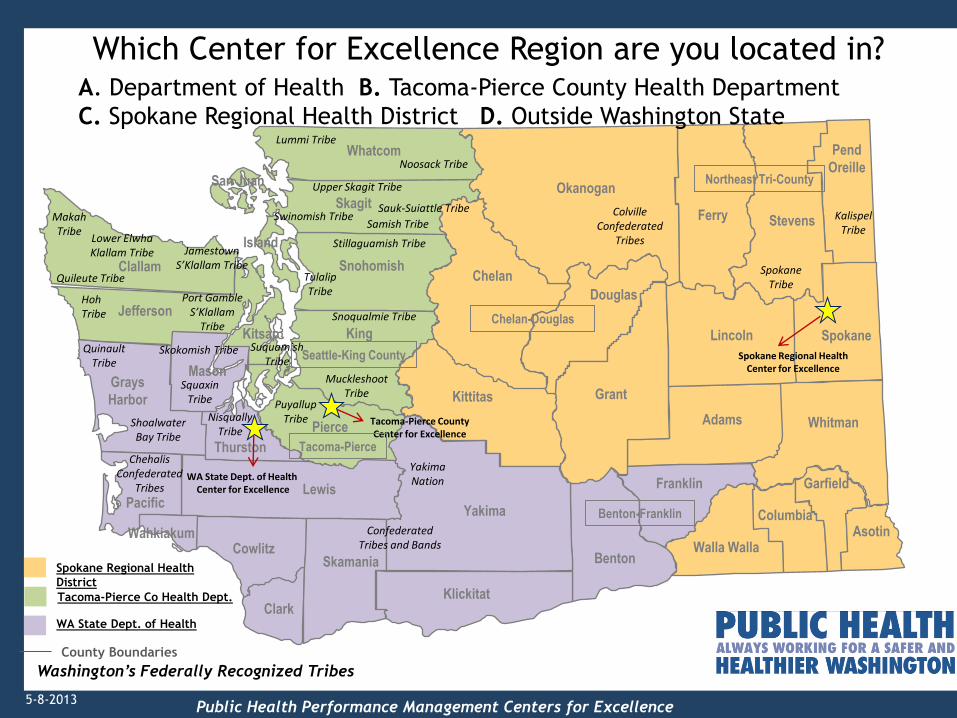
Which Center for Excellence Region are you located in? A. Department of Health B. Tacoma-Pierce County Health Department
C. Spokane Regional Health District D. Outside Washington State

Public Health Performance Management
Centers for Excellence
Funded by CDC’s National Public Health Improvement Initiative
Learning Objectives • Upon completion participants should be
able to: – Explain why understanding variation is so
important to controlling for quality and
improving processes
– Describe how variation is demonstrated in work
processes and the impact on QI efforts
– Describe trend lines, run charts, and control
charts and their uses
– Identify examples of each chart type
– Analyze data displayed in each chart type
4

Public Health Performance Management Centers for Excellence 5-8-2013
Why is variation important?
• All activities and services are comprised of
work process- a series of steps to produce
an outcome
• All work processes have variation
• The underlying process determines
performance
• Improving work processes requires
understanding and reducing variation
5

Public Health Performance Management Centers for Excellence 5-8-2013
Process Variation
6
0
10
20
30
40
50
60
Jan Feb Mar Apr May Jun Jul Aug Sep Oct Nov Dec Jan
Incidences per Month
Hmmm. Why does it vary so much?

Public Health Performance Management Centers for Excellence 5-8-2013
Sources of variation
• Methods
• Materials
• Environment
• Staff
• Measurements
• Customers
7
Which
among
these are
variable?
Which among
these are
controllable?
Public Health Performance Management Centers for Excellence 5-8-2013
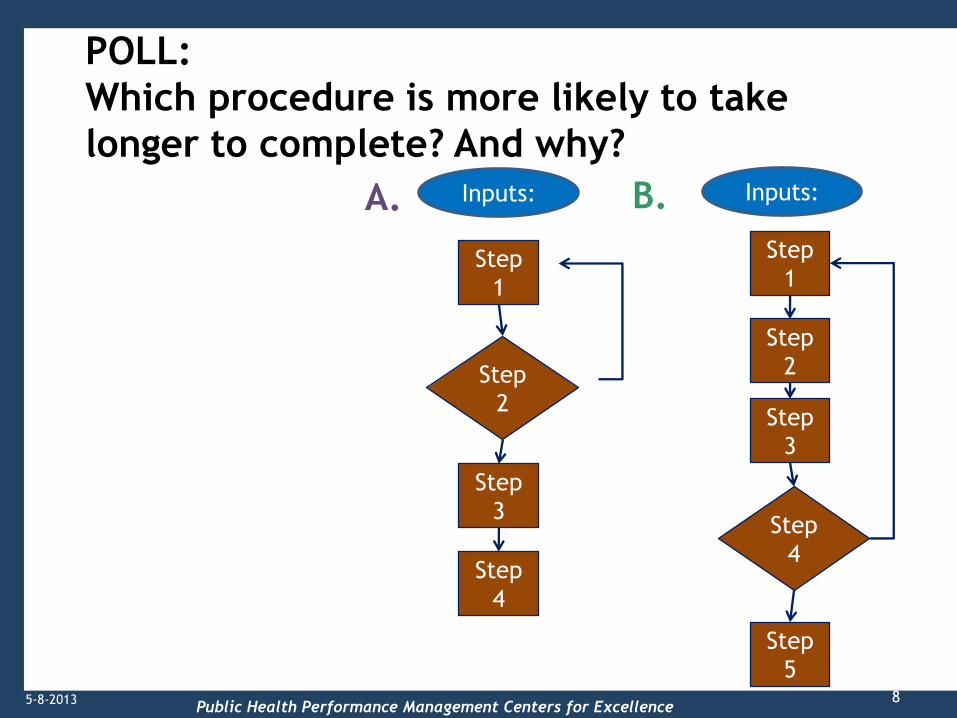
POLL:
Which procedure is more likely to take
longer to complete? And why?
8
Step
1
Step
3
Step
4
Step
2
Step
1
Step
3
Step
5
Step
4
Step
2
Inputs: Inputs: A. B.

Public Health Performance Management Centers for Excellence 5-8-2013
The Quality Management Trilogy
9
Quality Planning (QP)
Quality Control (QC)
Quality Improvement
(QI)
Joseph Juran, 1950’s
Juran on Leadership for Quality, Free Press, 1989

Public Health Performance Management Centers for Excellence 5-8-2013
The Quality Management Trilogy
10
Quality Planning (QP)
Quality Control (QC)
Quality Improvement
(QI)
Joseph Juran, 1950’s
Juran on Leadership for Quality, Free Press, 1989
Process Design

Public Health Performance Management Centers for Excellence 5-8-2013
The Quality Management Trilogy
11
Quality Planning (QP)
Quality Control (QC)
Quality Improvement
(QI)
Joseph Juran, 1950’s
Juran on Leadership for Quality, Free Press, 1989
Process Control

Public Health Performance Management Centers for Excellence 5-8-2013
The Quality Management Trilogy
12
Quality Planning (QP)
Quality Control (QC)
Quality Improvement
(QI)
Joseph Juran, 1950’s
Juran on Leadership for Quality, Free Press, 1989
Process Improvement

Public Health Performance Management Centers for Excellence 5-8-2013
The Quality Trilogy (adapted from Juran Trilogy)
13
Define Opportunit
y & Stakeholde
r Needs
Design & Pilot Service or Process
Monitor Impact / Results of Service
Take Action
Sporadic
Spike
Original Zone
of Quality Control
QualityImprovement
Time
Op
eart
ion
s
Beg
in
Quality Planning
New Zone
of Quality Control
Process not Achieving
Desired Results
(An Opportunity
for Improvement)
Quality Control & Improvement (During Operations)
Model for Improvement
What are we trying
to accomplish?
How will we know that a
change is an improvement?
Act Plan
DoStudy

Public Health Performance Management Centers for Excellence 5-8-2013
The Quality Management Trilogy
14
Quality Planning (QP)
Quality Control (QC)
Quality Improvement
(QI)
Joseph Juran, 1950’s
Juran on Leadership for Quality, Free Press, 1989
Our focus today

Public Health Performance Management
Centers for Excellence
Funded by CDC’s National Public Health Improvement Initiative
Process Capability and Stability
• Process Capability
– The performance level is capable of meeting customer needs and expectations within a stable process.
• Process Stability
– Whether process is in control and produces predictable results.
– Must understand variation in process.
15

Public Health Performance Management
Centers for Excellence
Funded by CDC’s National Public Health Improvement Initiative
Process Capability and Stability
• Process Capability
– The performance level is capable of meeting customer needs and expectations within a stable process.
• Process Stability
– Whether process is in control and produces predictable results.
– Must understand variation in process.
16

Public Health Performance Management
Centers for Excellence
Funded by CDC’s National Public Health Improvement Initiative
Process Capability • Does the process meet or exceed the
customer’s specification? (aka, expectation,
requirement, etc.)
– All the time?
– Some of the time?
– None of the time?
• If the process is not capable, controlling
existing variation will not be your first
priority
17

Public Health Performance Management
Centers for Excellence
Funded by CDC’s National Public Health Improvement Initiative
Process Specifications
• May have an upper specification
– Data point less than x is good
• May have a lower specification
– Data point greater than y is good
• May have both
– Data point between x and y is good
18

Public Health Performance Management
Centers for Excellence
Funded by CDC’s National Public Health Improvement Initiative
Process Capability
0
10
20
30
40
50
60
Jan Feb Mar Apr May Jun Jul Aug Sep Oct Nov Dec Jan
Days to Complete Request
19
Customer
Requirement

Public Health Performance Management
Centers for Excellence
Funded by CDC’s National Public Health Improvement Initiative
Process Capability
0
10
20
30
40
50
60
Jan Feb Mar Apr May Jun Jul Aug Sep Oct Nov Dec Jan
Days to Complete Request
20
Customer
Requirement
No ―lower‖
specification
because no
wait is a
good thing!
Public Health Performance Management
Centers for Excellence
Funded by CDC’s National Public Health Improvement Initiative
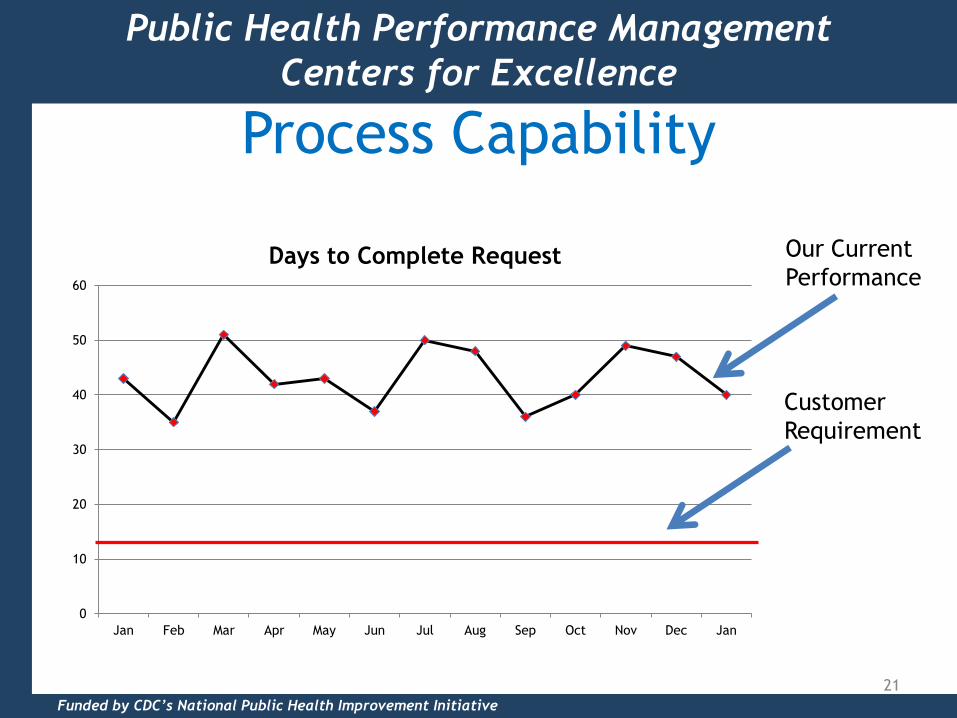
Process Capability
0
10
20
30
40
50
60
Jan Feb Mar Apr May Jun Jul Aug Sep Oct Nov Dec Jan
Days to Complete Request
21
Customer
Requirement
Our Current
Performance
Public Health Performance Management
Centers for Excellence
Funded by CDC’s National Public Health Improvement Initiative
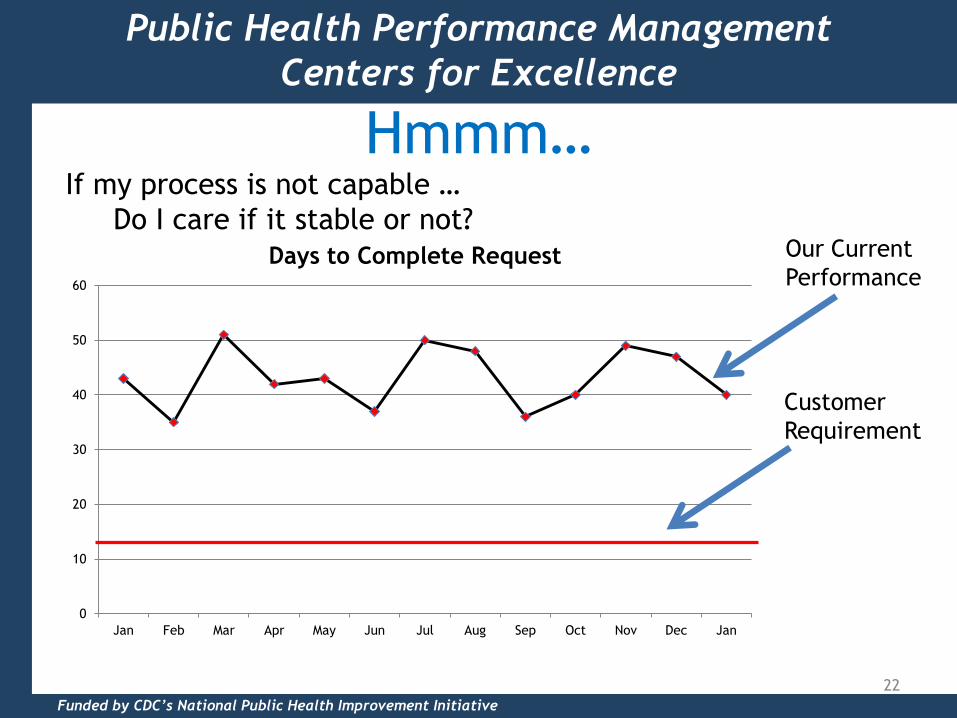
Hmmm…
0
10
20
30
40
50
60
Jan Feb Mar Apr May Jun Jul Aug Sep Oct Nov Dec Jan
Days to Complete Request
22
Customer
Requirement
Our Current
Performance
If my process is not capable …
Do I care if it stable or not?

Public Health Performance Management
Centers for Excellence
Funded by CDC’s National Public Health Improvement Initiative
0
10
20
30
40
50
60
Jan Feb Mar Apr May Jun Jul Aug Sep Oct Nov Dec Jan
Days to Complete Request
23
Need to
shift to a
level of
performance
that is
capable
It doesn’t matter that my process isn’t stable, it’s
not even capable!

Public Health Performance Management
Centers for Excellence
Funded by CDC’s National Public Health Improvement Initiative
Process Capability and Stability
• Process Capability
– The performance level is capable of meeting customer needs and expectations within a stable process.
• Process Stability
– Whether process is in control and produces predictable results.
– Must understand variation in process.
24

Public Health Performance Management
Centers for Excellence
Funded by CDC’s National Public Health Improvement Initiative
Process Capability and Stability
• Process Capability
– The performance level is capable of meeting customer needs and expectations within a stable process.
• Process Stability
– Whether process is in control and produces predictable results.
– Must understand variation in process.
25

Public Health Performance Management
Centers for Excellence
Funded by CDC’s National Public Health Improvement Initiative
Why Understand Variation?
A major principle underlying quality improvement
is that any substantial improvement must come
from a change in the work process (data driven),
rather than focusing on an individual occurrence
or event (anecdotal).
• Common Causes (94%) belong to the work
process
• Special Causes (6%) are the result of fleeting or
unusual occurrences
26

Public Health Performance Management
Centers for Excellence
Funded by CDC’s National Public Health Improvement Initiative
• Sources of variation include: technology, materials, methods, culture, people, environment
• Common cause variation occurs if the process is stable— variation in data points will be random and obey a mathematical law—it is said to be in statistical control, with a large number of small sources of variation
• Reacting to random variation in a process that is stable/in statistical control, it is called tampering and leads to further complexity, increasing variation and mistakes
Stability - Understand Variation
27

Public Health Performance Management
Centers for Excellence
Funded by CDC’s National Public Health Improvement Initiative
• Special cause variation arises because of specific circumstances which are not part of the process all the time and may or may not ever recur—if the recurrence is periodic, clues to the root cause may emerge
• If variation is special, then process not stable
• Special causes should be investigated
Stability - Understand Variation
28

Public Health Performance Management
Centers for Excellence
Funded by CDC’s National Public Health Improvement Initiative
Two Types of Variation
• Common Cause – Built into every
process
– Reflects a stable process because variation is predictable
– Also called random variation
– Requires changing the process to improve results
29
• Special Cause
– Not part of ―daily‖ or
―regular‖ process
– A single data point
outside control limits
OR a noticeable shift in
data points over time
– Can be improved or
avoided by addressing
this cause alone

Public Health Performance Management
Centers for Excellence
Funded by CDC’s National Public Health Improvement Initiative
Stability- Understand Variation
• Failure to distinguish between common and special cause variation can be hazardous to organizational performance
• Addressing a single occurrence of common cause variation is called TAMPERING with your process
30

Public Health Performance Management
Centers for Excellence
Funded by CDC’s National Public Health Improvement Initiative
Tampering If process is capable and stable …
– Want to avoid confusing expected/common cause variation
with un-expected/special cause variation
―Wait …What?‖
– Beware over interpreting a few data points (or worse one data
point) as indicating your process is deteriorating when it really
isn’t
– Managing to ―last month’s number‖ … is a ticket to tampering
– Managing to a target without a picture of process variation is a
ticket to tampering
―So?...‖
Identify the expected range of variation and limit reaction to
unexpected variation
31

Public Health Performance Management
Centers for Excellence
Funded by CDC’s National Public Health Improvement Initiative
The dangers of tampering
• At best … you waste time
and effort
• Likely introduce more
variation
• Perhaps … make things
worse
32

Public Health Performance Management Centers for Excellence 5-8-2013
Control Chart

Public Health Performance Management Centers for Excellence 5-8-2013
Acting on Variation to Ensure Stability
34
Expected or
unexpected
variation?
Unexpected
and special?
Expected or
common?
Is overall
performance
acceptable?
Search for and
eliminate
special causes
associated
with a few
data points
Yes
No
Do nothing!
Search for and
eliminate
common
causes
associated
with all data
points (i.e.
change
process/QI
Project)
(assuming process is capable)
Adapted from NDP on QI in Health Care, 1991

Public Health Performance Management
Centers for Excellence
Funded by CDC’s National Public Health Improvement Initiative
When to Improve the Process Cause of
Variation :
Common Causes Special Causes
Action Required : To change the
process (QI)
Fix or mitigate
the issue (not a QI
project)
Frequency: 94% (Deming) 6%
Who: QI team/project Managers or staff
35

Public Health Performance Management
Centers for Excellence
Funded by CDC’s National Public Health Improvement Initiative
Please unmute phone or use chat window
What experiences have you encountered with variation in a work process?
Examples might be inconsistently meeting regulatory deadlines or responding to requests.
Let’s Discuss
36

Public Health Performance Management
Centers for Excellence
RUN CHARTS, TREND CHARTS
AND CONTROL CHARTS
Charts:
37

Public Health Performance Management Centers for Excellence 5-8-2013
Run Chart Elements
38
0
10
20
30
40
50
60
70
80
90
100
M1 M2 T1 T3 W1 W2 TH1 TH2 F1 F2 S1 S2 M1 M2 T1 T2 W1 W2
Samples by time unit, run, etc.
Count of individuals or average of the sample
Calculated mean from initial series of samples … at LEAST 8

Public Health Performance Management Centers for Excellence 5-8-2013
Line/Run/Trend Charts
• Indicates pattern of variation over time
• Helps avoid over-interpreting a particular
result/sample
• Can indicate expected range of random
variation (aka common cause)
• Can indicate patterns of unexpected and
attributable variation (aka special cause)
39

Public Health Performance Management Centers for Excellence 5-8-2013
Key Points for Analyzing Data
• The average by itself is not a good summary of data; use a variety of numerical summaries
• Measures of center include: Average/Mean: the total data values divided by the total number of observations Median: the middle value in the data set, half of the data value lie above, half lie below the median Mode: the most frequently occurring values in the set of data
• Use histograms to look at overall variation patterns
• Use line graphs to look at patterns over time

Public Health Performance Management Centers for Excellence 5-8-2013
0
2
4
6
8
10
12
trial 1
trial 2
trial 3
trial 4
trial 5
trial 6
trial 7
trial 8
trial 9
trial 10
trial 11
trial 12
trial 13
trial 14
trial 15
trial 16
trial 17
trial 18
trial 19
trial 20
Random and Expected: # Times Heads in 10 chance Trial
# heads
Avg
41

Public Health Performance Management Centers for Excellence 5-8-2013
Line Chart Indicators of
Unexpected/Attributable Variation
• Trends (7 points in a row in same direction)
• Shifts (7 continuous points above/below the
mean)
• Data Collection Problems/Manipulation (5
identical points in a row)
• Personal variation (alternating pattern)
42

Public Health Performance Management Centers for Excellence 5-8-2013
0
2
4
6
8
10
12
trial 1
trial 2
trial 3
trial 4
trial 5
trial 6
trial 7
trial 8
trial 9
trial 10
trial 11
trial 12
trial 13
trial 14
trial 15
trial 16
trial 17
trial 18
trial 19
trial 20
Trend
# heads
Avg
43
POLL At what trial number does the trend start?
A. Trial 3 B. Trial 10 C. Trial 13

Public Health Performance Management Centers for Excellence 5-8-2013
0
2
4
6
8
10
12
trial 1
trial 2
trial 3
trial 4
trial 5
trial 6
trial 7
trial 8
trial 9
trial 10
trial 11
trial 12
trial 13
trial 14
trial 15
trial 16
trial 17
trial 18
trial 19
trial 20
Trend
# heads
Avg
44

Public Health Performance Management Centers for Excellence 5-8-2013
0
1
2
3
4
5
6
7
8
9
10
trial 1 trial 2 trial 3 trial 4 trial 5 trial 6 trial 7 trial 8 trial 9 trial 10
trial 11
trial 12
trial 13
trial 14
trial 15
trial 16
trial 17
trial 18
trial 19
trial 20
Shift
# heads
Avg
45
POLL:
What trial number does the shift start?
A. Trial 3 B. Trial 11

Public Health Performance Management Centers for Excellence 5-8-2013
0
1
2
3
4
5
6
7
8
9
10
trial 1 trial 2 trial 3 trial 4 trial 5 trial 6 trial 7 trial 8 trial 9 trial 10
trial 11
trial 12
trial 13
trial 14
trial 15
trial 16
trial 17
trial 18
trial 19
trial 20
Shift
# heads
Avg
46
POLL:
What trial number does the shift start?
A. Trial 3 B. Trial 11

Public Health Performance Management Centers for Excellence 5-8-2013
0
2
4
6
8
10
12
trial 1 trial 2 trial 3 trial 4 trial 5 trial 6 trial 7 trial 8 trial 9 trial 10
trial 11
trial 12
trial 13
trial 14
trial 15
trial 16
trial 17
trial 18
trial 19
trial 20
# heads
Avg
47
CHAT BOX:
What conclusions might you draw from this data?

Public Health Performance Management Centers for Excellence 5-8-2013
0
2
4
6
8
10
12
trial 1 trial 2 trial 3 trial 4 trial 5 trial 6 trial 7 trial 8 trial 9 trial 10
trial 11
trial 12
trial 13
trial 14
trial 15
trial 16
trial 17
trial 18
trial 19
trial 20
# heads
Avg
48
Data Collection Problems – repeat results
(data fudged?)
? ?

Public Health Performance Management Centers for Excellence 5-8-2013
0
2
4
6
8
10
12
trial 1
trial 2
trial 3
trial 4
trial 5
trial 6
trial 7
trial 8
trial 9
trial 10
trial 11
trial 12
trial 13
trial 14
trial 15
trial 16
trial 17
trial 18
trial 19
trial 20
# heads
Avg
49
CHAT BOX:
What conclusions might you draw from this data?

Public Health Performance Management Centers for Excellence 5-8-2013
0
2
4
6
8
10
12
trial 1
trial 2
trial 3
trial 4
trial 5
trial 6
trial 7
trial 8
trial 9
trial 10
trial 11
trial 12
trial 13
trial 14
trial 15
trial 16
trial 17
trial 18
trial 19
trial 20
# heads
Avg
50
Data Collection/Sampling Problems – Alternating Pattern
(Differences between staff? between shifts?
More than one process?)

Public Health Performance Management Centers for Excellence 5-8-2013
0
2
4
6
8
10
12
trial 1 trial 2 trial 3 trial 4 trial 5 trial 6 trial 7 trial 8 trial 9 trial 10
trial 11
trial 12
trial 13
trial 14
trial 15
trial 16
trial 17
trial 18
trial 19
trial 20
Capable, Random and Expected: # Days to Complete an Environmental Health Permit
A Good QI Project Candidate
51

Public Health Performance Management Centers for Excellence 5-8-2013
0
200
400
600
800
1000
1200
Nu
mb
er
of
Clin
ic V
isit
s
Month
Port Gamble S'Klallam Tribe Run Chart: Number of Clinic Visits Per Month
June 2008 - May 2010
Number of Clinic Visits
Xbar (Median)
Median = 637 visits per month
Start of Intervention
1st Staff Training 2nd Staff
Training

Public Health Performance Management Centers for Excellence 5-8-2013
0
200
400
600
800
1000
1200
Jun-0
8
Jul
Aug
Sep
Oct
Nov
Dec
Jan-0
9
Feb
Mar
Apr
May
Jun
July
Aug
Sept
Oct
Nov
Dec
Jan-1
0
Feb
Mar
Apr
May-1
0
Port Gamble S'Klallam Tribe
Control Chart with Process Shift
Number of Clinic Visits Per Month
June 2008 - May 2010 POLL:
Did the Port
Gamble
S’Klallam
intervention
aimed at
increasing
visits work?
A. Yes
B. No

Public Health Performance Management
Centers for Excellence
Funded by CDC’s National Public Health Improvement Initiative
Control Charts
Same elements as a run chart plus:
• Upper/lower control limits placed a certain number of standard deviations (or practical equivalent) from the mean
• Like the mean, limits are based on initial series of samples
• Typical choice is 3 standard deviations (captures 99% of the variation from a normally distributed population)
54

Public Health Performance Management
Centers for Excellence
Funded by CDC’s National Public Health Improvement Initiative
Control Chart

Public Health Performance Management Centers for Excellence 5-8-2013
Data point outside control limits
85
87.5
90
92.5
95
97.5
100
102.5
A B C D E F G H I J K L M N O
Value
Mean
UCL
LCL


Public Health Performance Management
Centers for Excellence
Funded by CDC’s National Public Health Improvement Initiative
Standard Deviation
• Represented by the lowercase form of the Greek letter sigma, is a statistic that tells you how tightly the data points are clustered around the mean for a given process.
• This tells you how much variation exists. – When data points are tightly clustered around the
mean and the bell-shaped curve is steep, the standard deviation and the range of variation is small.
– When the data points are spread apart and the bell-shaped curve is flat, the standard deviation and range of the variation is great.

Public Health Performance Management
Centers for Excellence
Funded by CDC’s National Public Health Improvement Initiative
Standard Deviation
• Analysts generally talk about the number of
standard deviations from the mean.
• One standard deviation in either direction of
the mean accounts for 68 percent of the data in
the group.
• Two standard deviations account for 95 percent
of it.
• Three standard deviations account for 99
percent of the data.
Public Health Performance Management
Centers for Excellence
Funded by CDC’s National Public Health Improvement Initiative
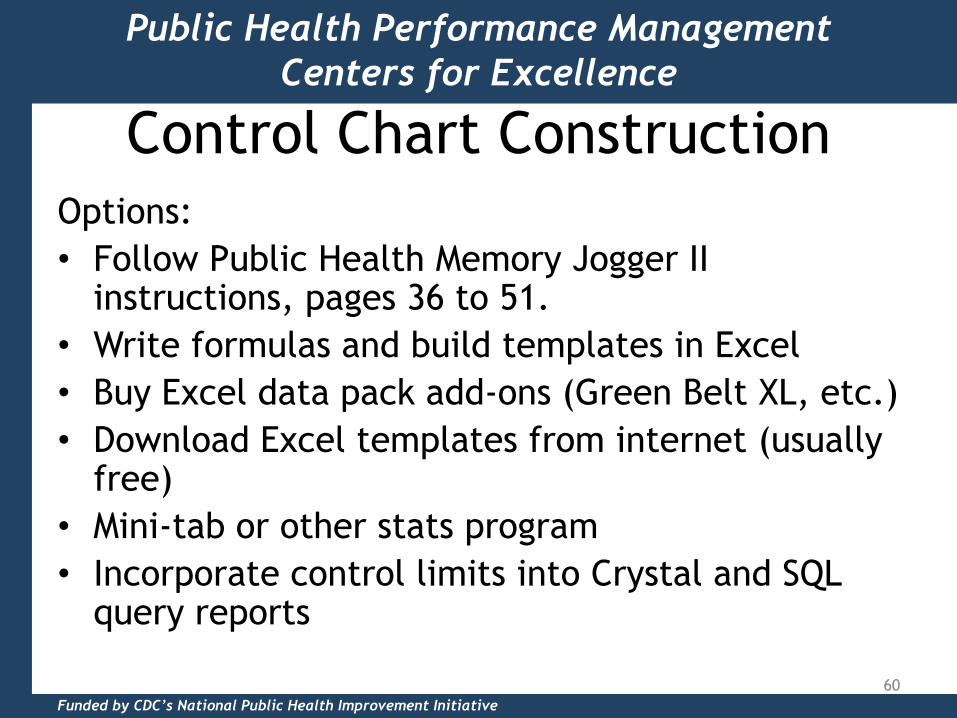
Control Chart Construction
Options:
• Follow Public Health Memory Jogger II instructions, pages 36 to 51.
• Write formulas and build templates in Excel
• Buy Excel data pack add-ons (Green Belt XL, etc.)
• Download Excel templates from internet (usually free)
• Mini-tab or other stats program
• Incorporate control limits into Crystal and SQL query reports
60

Public Health Performance Management
Centers for Excellence
Funded by CDC’s National Public Health Improvement Initiative
Specifications and Control Limits
• Don’t confuse them!!!
– A specification tells you how well you need
the process to perform
– A control limit is a statistical reference that
helps you distinguish between expected
results and unexpected results
– A process can be ―in control‖ but not quality
– A process can be meeting the specification
but be ―out of control‖
61

Public Health Performance Management
Centers for Excellence
Funded by CDC’s National Public Health Improvement Initiative
0
10
20
30
40
50
60
Jan Feb Mar Apr May Jun Jul Aug Sep Oct Nov Dec Jan
Days to Complete Request
62
Need to
shift to a
level of
performance
that is
capable
Need to
shift to a
level of
performance
that is
capable

Public Health Performance Management
Centers for Excellence
Funded by CDC’s National Public Health Improvement Initiative
Control Charts
• Pitfalls
– Non-normal distribution such as data
collection problems, shift in data, or
alternating pattern in run chart
– Not adjusting control limits periodically
– Over Rounding
– Sampling variation
63

Public Health Performance Management
Centers for Excellence
Funded by CDC’s National Public Health Improvement Initiative
Discussion
• What are situations where control charts
might be helpful in public health?
– Why?
– What would be concerns?
64

Public Health Performance Management
Centers for Excellence
Funded by CDC’s National Public Health Improvement Initiative
In Summary
• Understanding variation is crucial to
selecting appropriate work processes for
QI projects
• Responding correctly to the type of
variation, and not tampering, makes our
management and QI efforts more
effective
65

Public Health Performance Management
Centers for Excellence
Funded by CDC’s National Public Health Improvement Initiative
Review Learning Objectives • Upon completion participants should be
able to:
– Explain why understanding variation is so
important to improving processes
– Describe how variation is demonstrated in
work processes and the impact on QI efforts
– Describe trend lines, run charts, and control
charts and their uses
– Identify examples of each chart type
– Analyze data displayed in each chart type 66

Public Health Performance Management Centers for Excellence 5-8-2013
67
Additional Resources • Performance Management Centers for Excellence Web site:
www.doh.wa.gov/PHIP/perfmgmtcenters
• Public Health Memory Jogger, GOAL/QPC, 2007, www.goalqpc.com, pages 36 through 51
• Creating Control Charts in Excel instructions: http://www.ehow.com/how_5928553_create-control-charts-excel.html
• Bialek R, Duffy DL, Moran JW. The Public Health Quality Improvement Handbook. Milwaukee, WI: ASQ Quality Press; 2009
• The Improvement Guide, Langley et al. Jossey-Bass, 1996.
• Juran, J.; Juran on Leadership for Quality, Free Press, 1989
• Juran, J.; Juran on Planning for Quality, Free Press, 1988
• Mason M, Moran J, Understanding and Controlling Variation in Public Health. Journal of Public Health Management and Practice. Jan/Feb 2012; 18(1), 74–78
67

Public Health Performance Management Centers for Excellence 5-8-2013
THANKS FOR YOUR PARTICIPATION! Please complete the evaluation you
receive via email.
Join us Next Time:
July 17, 2013
“Quality Tools Training”
The contents of this presentation were selected by the author
and do not necessarily represent the official position of or
endorsement by the Centers for Disease Control and Prevention.
68
Public Health Performance Management
Centers for Excellence
Funded by CDC’s National Public Health Improvement Initiative
What questions do
you have?
69


