
1
1Progress Through Research
Motor Cycle Emission Control in India
ByMr. M. K. ChaudhariSr. Deputy Director
The Automotive Research Association of [email protected]
Tel: +91-20-4003858Fax: +91-20-25434190
Asian Vehicle Emission Control Conference 2004
April 27-29, 2004
2Progress Through Research
Introduction about ARAI

2
3Progress Through Research
Role of ARAIFirst ISO-9001 R&D and Testing & Evaluation Institute in India. ♦ Nodal agency :
- Certification- Regulations- Formulation of Standards- Implementation of R&D Programs at National level
- Central Motor Vehicle Rule (CMVR) Technical Committee
4Progress Through Research
Role of ARAI
♦ Nodal agency :- Automotive Industry Standard
Committee (AISC)- Member Secretary – Standing Committee
on Implementation of Emission Legislations.
- High level committees representation -for policy decision.
- Technical support to Ministry – Govt. of India.

3
5Progress Through Research
Role of ARAIR&D and Certification :♦ Research & Development of engines,
vehicles and its aggregates.♦ Certification♦ Formulation of Standards♦ Consultancy♦ Specific assignments in R&D and
certification- Evolution of Inspection & Maintenance
Programme for India.- Development of Emission factors.
continued ...
6Progress Through Research
Role of ARAI
Specific assignments in R&D and certification
- Gasoline vehicle particulate measurement.
- Life cycle prediction. - Noise and Vibration.- Gasoline / Diesel Engine design and
development.- Alternate fuels – CNG, LPG, Methanol,
Electric Vehicle etc.- Study of Adulteration of fuel.

4
7Progress Through Research
Motor Vehicle Population in India-Fleet Composition
Two wheelers Three wheelersCars,Jeeps & Taxies BusesGoods Vehicles Others (Tractors,Trailors & miscellaneous)
Three Wheelers4%
(2.37 million)
Cars, Jeeps and Taxies13%
(7.69 million)
Buses 1%
(0.59 million)
Goods Vehicles5%
(2.96 million)
Others(Tractors, Trailors
and miscellaneous)6%
(3.55 million)
Two Wheelers71%
(42 million)
8Progress Through Research
Indian Two Wheeler Industry
Second largest manufacturer in the world – next to ChinaHas grown over 3 times during past 10 yearsDuring Year 2002-2003 domestic sales was 5.1 millionCurrent year 2003-2004 expect to cross 5.6 – 5.8 million

5
9Progress Through Research
Two wheeler fleet composition in India
75 - 125 cc73.7%
<75 cc11%
>250 cc0.5%125 - 250 cc
14.9%<75 cc
75 - 125 cc
125 - 250 cc>250 cc
In India,85% of vehicles are having engine capacity less than 125 cc, whereas in Europe (35%), Japan (31%) and US (7%).
10Progress Through Research
Categorywise Two-Wheeler Industry sales trend
0.4 0.5 0.5 0.6 0.7 0.6 0.6 0.6 0.60.40.3 0.4 0.5
0.70.8 0.9
1.2
3.8
0.1 0.1 0.1 0.1 0.2 0.2 0.2 0.2 0.2 0.1
1.1 1
0.6
0.1 0.1 0.1 0.2 0.2 0.2 0.20.4 0.4
1.6
2
2.9
0.10.3
0.5
1.11.11.10.9
0.80.6
0.50.4
0.0
1.0
2.0
3.0
4.0
92-93 93-94 94-95 95-96 96-97 97-98 98-99 99-00 00-01 01-02 02-03Year
Ann
ual S
ales
in m
illio
ns
MopedsMotorcyclesBus.bikesGeared ScootersUngeared Scooters

6
11Progress Through Research
Two-Wheeler industry category share trend
27.5 25.9 22.5 22.7 22.1 20 18.3 16.1 15.19.8 7.2
20.2 21.523.9 24.9 27 30.1 34.6
74.3
32.9 2616.1
12.36.7
5.4 4.1 5.4 6.3 6.5 7.2 7 9.8 10.6 9.5 10.4
66.354
42.7
41.8 43.3 42.6 40.5 38.4 35.3
0.00
0.25
0.50
0.75
1.00
92-93 93-94 94-95 95-96 96-97 97-98 98-99 99-00 00-01 01-02 02-03Year
Cat
egor
y sh
are
%
Mopeds Motorcycles Bus.bikes Geared Scooters Ungeared Scooters
12Progress Through Research
Product Segments (2002-03 Sales)
Motorcycle 76%
Scooter 17%
Moped 7%

7
13Progress Through Research
Usage Pattern in IndiaQuite different from many other countries
more a utility and family oriented vehiclesmall business people and farmers conduct their business carrying materials and loadslimited usage for leisure and sport
Initial cost and fuel economy are highest priority.Should be rugged and robust.Engine displacement, mostly around 100 cc.During last 12 – 18 months, higher
displacement engines upto 175cc being introduced.
14Progress Through Research
MARKET TRENDSMARKET TRENDS
Customer preference to 4 stroke engines as against 2 strokes (higher fuel efficiency)Currently, percentage of 4 strokes to 2
strokes 75 : 25By year 2005, expect only small
percentage 2 strokes to continue in production

8
15Progress Through Research
Motor Vehicle Emission Control Programmes in India
Formulation of Standards for new and in-use vehicles.Ensure appropriate emission control technologies through vehicle design –type approval.Compliance at production level quality –Conformity of Production (COP)
16Progress Through Research
Motor Vehicle Emission Control Programmes in India……
In-use vehicles emission control.I&M programmeOn road checksRetrofitment – CNG / LPG
Framing the specifications of fuel quality in line with emission legislation.Traffic Management.

9
17Progress Through Research
EMISSION REGULATIONS
Two wheelers constitute 70-75% of vehicle population on Indian roadsHence,considered a major contributor to atmospheric pollutionSince year 1991, emission regulations for 2 wheelers been made more and more stringent over the years
18Progress Through Research
Indian Emission Norms for 2 Wheelers
-For Ref. Mass 170 kg ; * Only for HC ** As per Mashelkar Committee Report
CO HC+Nox
14.25
8.5*
4.5 3.62.0 2.0 1.5 1.5
1.0 1.0
02468
10121416
Year 1991- 1996 2000 2005** 2008**
Emis
sion
s g/
km)

10
19Progress Through Research
Indian Emission Norms for 3 Wheelers - Petrol
30
12*
6.75 5.4 42 2.25 2.25
1.25 1.25
0
5
10
15
20
25
30Em
issio
ns, g
/km
1991- 1996 2000 2005** 2008**
CO HC+Nox-
For Ref. Mass 170 kg ; * Only for HC; ** As per Mashelkar Committee Report
20Progress Through Research
Indian Emission Norms for 3 Wheeler - Diesel
0.5412.72
5
30
0.70.85
0.972
12*
0.14
0.1
0.05
0
5
10
15
20
25
30
35
1991- 1996 2000 2005** 2008**
Emis
sion
s, g
/km
0
0.02
0.04
0.06
0.08
0.1
0.12
0.14
0.16
PM
, g/k
m
CO HC+Nox PM- For RM of 350 kg * Only for HC , ** As per Mashelkar Committee Report

11
21Progress Through Research
Progressive Reduction of Indian Emission Norms : 2 Wheelers (Both 2 and 4 stroke)
0
20
40
60
80
100
120
1991 1996 2000 2005
Year
%
COHC + NOx
22Progress Through Research
EMISSION REGULATION APRIL 2005 ( BS II )
Conformance of Production (COP) allowance of 20% available so far is withdrawnDurability of 30,000kms or D.F. of 1.2 is enforcedPractically, this means tightening regulation of year 2000 by 50%
IDC
Test Cycle
1.5 gm/Km
HC + Nox
1.5 gm/Km
CO

12
23Progress Through Research
Emission Regulation April 2008/2010 (BS III-Proposed)
IDC
Test Cycle
1.0 gm/Km
HC + Nox
1.0 gm/Km
CO
Very sophisticated lean-burn engines need to be developedNew technologies like Variable intake systems,Electronic engine management, 3-way catalyst systems, Electronic fuel injection etc may need to be introduced
24Progress Through Research
Deterioration Factors in India
1.20---PM
1.01.2HC+NOx
1.101.2CO
DieselGasolineCategory of Vehicles
Deterioration factors became applicable for gasoline and diesel vehicles (fitted with catalytic converter) from 1st December 2002.or30,000 km Durability for 2-W and 3-W

13
25Progress Through Research
Indian Driving Cycle
0
10
20
30
40
50
0 20 40 60 80 100TIME(sec)
SP
EE
D(k
m/h
r)
Time Distance Avg. Speed Max. Speed Max.
accel. Max Decel Idle time ratio
Accel. Time ratio
Decel time ratio
Cruise time ratio
sec km km/h km/h m/s2 m/s3 % % % %IDC
(6 Cycles) 648 3.948 21.93 42 0.65 0.63 14.81 38.89 34.26 12.04
26Progress Through Research
Indian Driving Cycle (Continued…)
FEATURES :Based on the heterogeneous traffic pattern in major cities in India.Derived from the real world operating condition. All category of the vehicles, even mopeds are capable of following cycle.

14
27Progress Through Research
Comparison of IDC and ECE 40 CycleECE 40 Driving Cycle
0
10
20
30
40
50
60
0 20 40 60 80 100 120 140 160 180 200Time (sec)
Sp
eed
(km
/hr)
One Cycle = 195sec Total Cycle (4 nos) = 780 sec
Indian Driving Cycle
0
10
20
30
40
50
0 20 40 60 80 100 120
Time (sec)
Sp
eed
(km
/hr)
One Cycle = 108 sec , Total Cycles ( 6 nos) = 648 sec
28Progress Through Research
Comparison of emissions from a 2-Wheeler on ECE40 and IDC cycles
2-Wheeler -4-stroke vehicleEngine Capacity : 125 ccECE 40 IDC
CO, g/km 2.7 4 1.34HC, g/km 0.49 0.86Nox, g/km 0.31 0.39HC+Nox, g/km 0.8 1.25CO2,g/km 43.44 32.52Cal. FC, km/l 48.29 63.7 4
2-Wheeler -4-stroke vehicleEngine Capacity : 133ccECE 40 IDC
CO, g/km 1.36 0.99HC, g/km 1.15 0.83Nox, g/km 0.32 0.23HC+Nox, g/km 1.47 1.06CO2,g/km 40.7 9 30.6Cal. FC, km/l 51 .12 68.44
2-Wheeler -4-stroke vehicleEngine Capacity : 115ccECE 40 IDC
CO, g/km 1.51 0.9HC, g/km 0.69 1.03Nox, g/km 0.25 0.26HC+Nox, g/km 0.94 1.29CO2,g/km 41.69 25.7 4Cal. FC, km/l 51.48 7 8.26
2-Wheeler -2-stroke v ehicleEngine Capacity : 64ccECE 40 IDC
CO, g/km 0.7 9 0.92HC, g/km 3.07 2.13Nox, g/km 0.15 0.04HC+Nox, g/k 3.22 2.17CO2,g/km 33.9 25.95Cal. FC, km/l 53.06 69.7

15
29Progress Through Research
Comparison of emissions from a 3-Wheeler (Diesel) on ECE40 and IDC cycles
3-Wheeler -Diesel vehicleEngine Capacity : 416ccECE 40 IDC
CO, g/km 0.26 0.2HC, g/km 0.07 0.05Nox, g/km 0.42 0.42HC+Nox, g/km 0.49 0.47CO2,g/km 94.24 7 0.17Cal. FC, km/l 28.53 37 .7 5PM, g/km 0.1 0.05
30Progress Through Research
GLOBAL HARMONISATIONOF STANDARDS
Indian automotive industry identified 76 ECE standards for adoption , out of which, 24 relate to 2 wheeler industry By year 2005, expect good progress to align with many ECE standards

16
31Progress Through Research
Alternative Fuel Policy
Introduction of 5% ethanol mix in Gasoline
– effective early 2003 –notified by Govt.
Trend to encourage use of gaseous fuels - CNG( Compressed Natural Gas) - LPG ( Liquefied Petroleum Gas )
CNG/LPG regulations (safety/emissions) firmly in place
32Progress Through Research
Alternative Fuels - ARAI ContributionFormulation of safety code of practice and standards.Testing and evaluation of AFV.Design and development of AFV conversion kits for
CNG/LPG for 3-wheelersLPG for 2-wheelers and gensets
Innovative design of pumpless lubrication system for 2-stroke enginesConversion of 2-stroke 3-wheeler on M-85.

17
33Progress Through Research
NOISE NORMS NOISE NORMS • The current method for measurement of Pass-by
Noise is in line with Directive 97/24/EC. (in force from 28th September 2001.)
• The Next Stage Noise Norms have been notified for implementation from 1st January 2003.
8080
7780
82(petrol)85(diesel)
Three Wheelers<175 cc>175cc
80(petrol)82(diesel)
80
Current Norms
Noise Limits dB(A)
757780
Next Stage (w.e.f. Jan 2003)
757780
ECE Norms
Two Wheelers
< 80 cc80 – 175 cc> 175 cc
Type of Vehicle
34Progress Through Research
In-use Vehicle Emission Study conducted by ARAI

18
35Progress Through Research
In-use Vehicle Emission Study conducted by ARAI
36Progress Through Research
In-use Vehicle Emission Study conducted by ARAI
19
37Progress Through Research
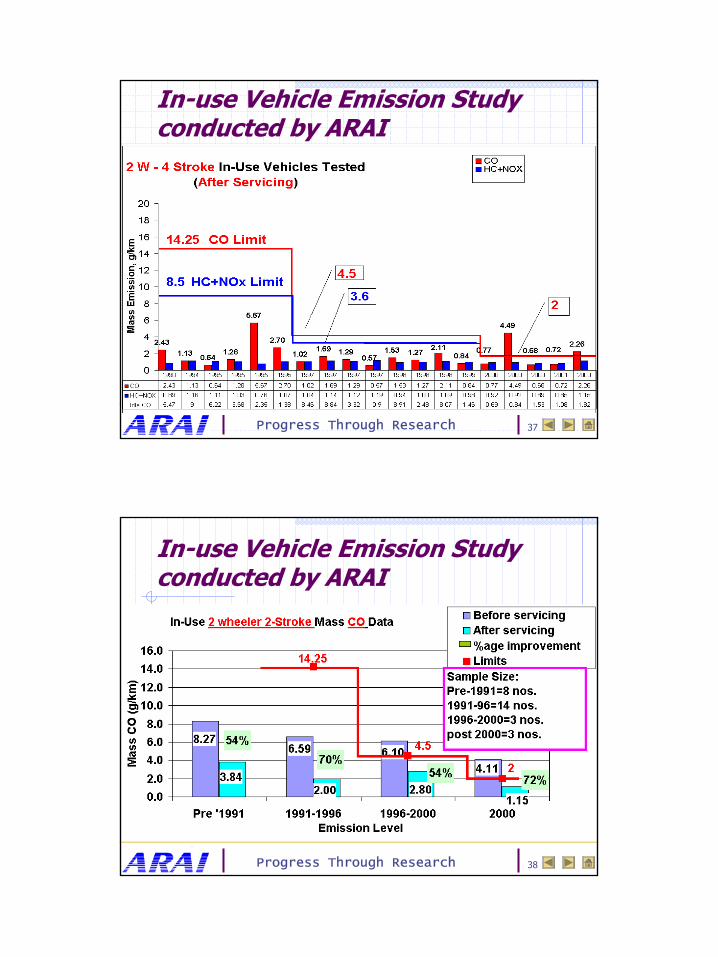
In-use Vehicle Emission Study conducted by ARAI
38Progress Through Research
In-use Vehicle Emission Study conducted by ARAI

20
39Progress Through Research
In-use Vehicle Emission Study conducted by ARAI
40Progress Through Research
In-use Vehicle Emission Study conducted by ARAI

21
41Progress Through Research
…In-use Vehicle Emission Studies conducted by ARAI
42Progress Through Research
Before v/s After Maintenance Idle CO Emission for in-use 2-& 4-Stroke 2W Vehicles- ARAI In-House Study
Max. 9Max. 10.2
Max. 6.9Max. 6.5
Min. 0.7Min. 0.2Min. 0.1Min. 0.1
Avg. 4Avg. 4.8Avg. 2.6
Avg. 4.1
0
2
4
6
8
10
12
before maint after maint before maint after maint
Idlin
g C
O E
mis
sion
s, %
Vol
2 Stroke Vehicles 4 Stroke Vehicles
4.5% limt , pre-2000)3.5% limt , post-2000)
Sample Size 28 Sample Size 19
Note: The limits shown are as per the revised PUC norms
54% above 4.5% Limit
17% above 4.5% Limit
47% above 4.5% Limit
37% above 4.5% Limit

22
43Progress Through Research
Before v/s After Maintenance Idle HC Emission for in-use 2- & 4-Stroke 2W Vehicles- ARAI In-House Study
51803610
Max. 17430Max. 17940
336386
Min. 3760Min. 2341 14631947
Avg. 7215
Avg. 9299
0
5000
10000
15000
20000
before maint after maint before maint after maint
Idlin
g H
C E
mis
sion
s, p
pm2 Stroke Vehicles 4 Stroke Vehicles
9000ppm limit, pre-2000
6000ppm limit, post-20004500ppm limit, post-2000
Note: The limits shown are as per the revised PUC norms
Sample Size =28 Sample Size =19
43% above 9000ppm limit
18% above 9000ppm limit 11% above
4500ppm limit0% above 4500ppm limit
44Progress Through Research
ARAI Study on In use vehicle emissions - Conclusions derived
There is definite improvement In mass emission due to maintenanceFuel consumption improvement is a complimentary benefitHigher in-use vehicle emissions are mainly contributed due to improper tuning of carburetor and spark plug settingsEven older vehicles if properly maintainedproduce lower emissionsNew technology vehicles if not maintainedproperly could give higher emissions

23
45Progress Through Research
Retrofitment of Catalytic Converter
In-use vehicle emissions can be significantly reduced by retrofitment of catalytic converters especially for 2-and 3-wheelers which form the majority of vehicle population in IndiaIssues
Who will carry out the retrofitment?Design of catalytic converterAssessment of efficiency of catalytic converters on in-use vehiclesModel based/ engine capacity based/year of manufacture basedNon-OEM catalytic converter evaluation procedureEconomic incentives for fitment of catalytic converters
46Progress Through Research
Pollution Under Control (PUC) System in India
Pollution Under ControlIdle CO Emission Test for gasoline vehiclesFree Acceleration Smoke test for Diesel vehicles
No Safety related checking on Private in use vehicles

24
47Progress Through Research
The Present PUC system - IssuesTest procedures and norms have not changed since introductionPUC Center operators are not trainedEquipment not maintained / calibratedProper test procedure not followed No well defined criteria for authorizing /registering PUC CenterNo auditing of PUC CenterLack of centralized agency for co-ordinationThe number of vehicles undergoing PUC test is very small due to absence of control mechanism to identify vehicles escaping PUCNo analysis of the data collectedExisting system is prone to tampering
48Progress Through Research
PUC Idle CO Test Procedure - IssuesIdle CO check : • Proper extension pipes especially for 2&3 wheeler vehicles
are not used• Chances of leakages in the system leading to low readings

25
49Progress Through Research
PUC Free Acceleration Smoke Test -Issues
Smoke readings differ with warming up of the vehicle. It is very difficult to achieve the specified 10 km warming up in the field to get the consistent readings.
The free acceleration test is a transient test. (raising the speed from idling to max rpm). The smoke readings may vary depending on the way the accelerator pedal is pressed by various operators.
There is a complaint in the field that the smoke readings at different PUC centers do not match.
50Progress Through Research
Free Acceleration Smoke Vs Oil temp & Warm up distance
012345678
0 0 2 2 4 4 6 6 6 8 8 10 10 10 10Distance (Km)
Sm
oke
valu
e(1/
m)
01020304050607080
Oil
Tem
pera
ture
, Deg
. C
Free acc. Smokeoil temp.

26
51Progress Through Research
Free Acceleration Smoke Vs Oil Temperature
0
0.5
1
1.5
2
2.5
48 49 51 52 53 54 56 57 58 59 60 62 64 65 70 72 73 74Oil Temperature, deg C
Smok
e in
K (/
m)
Engine 1 Engine 2Engine 3 Engine 4
52Progress Through Research
Proposed Revisions in Smoke Meter Specifications
Oil temperature and engine rpm measurement built into the smoke meter.- oil temperature above 60°C will be used as an indication of engine warm-up. - engine rpm will be measured to ensure consistency of operation
Smoke meter to identify the initial 6 flushing cycles based on the rpm measurement
Software will ensure the repeatability of the maximum rpm achieved for each acceleration within + 300 rpm for 4 Wheelers and + 500 rpm for 3 wheelers.
The smoke meter will provide the indications to assist the user for operation of the accelerator pedal.
27
53Progress Through Research
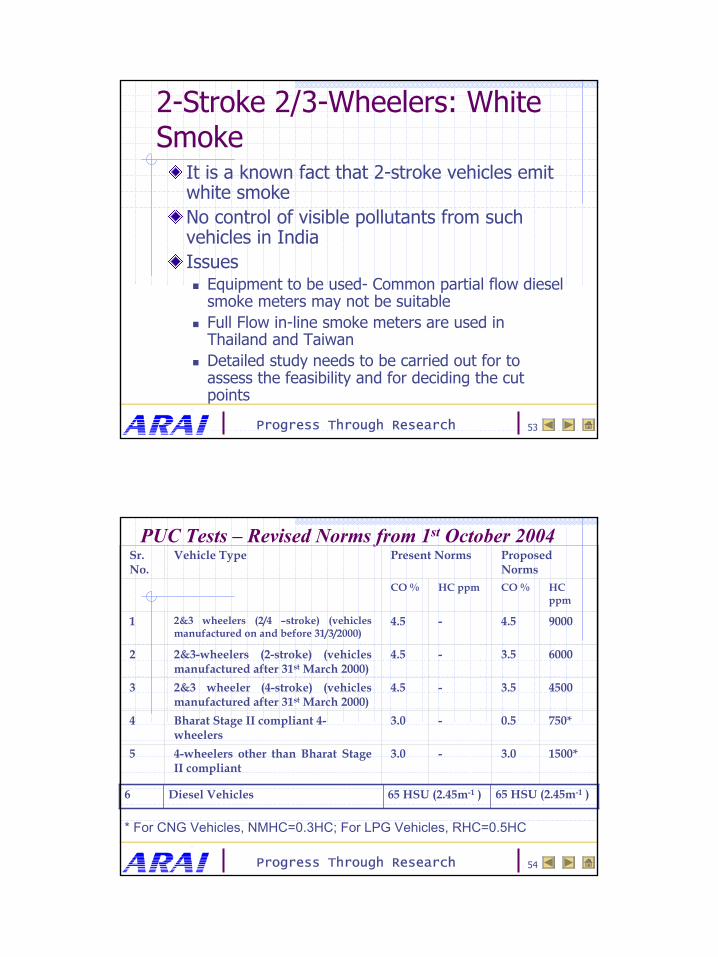
2-Stroke 2/3-Wheelers: White Smoke
It is a known fact that 2-stroke vehicles emit white smokeNo control of visible pollutants from such vehicles in IndiaIssues
Equipment to be used- Common partial flow diesel smoke meters may not be suitableFull Flow in-line smoke meters are used in Thailand and TaiwanDetailed study needs to be carried out for to assess the feasibility and for deciding the cut points
54Progress Through Research
PUC Tests – Revised Norms from 1st October 2004Sr. No.
Vehicle Type Present Norms Proposed Norms
CO % HC ppm CO % HC ppm
1 2&3 wheelers (2/4 –stroke) (vehicles manufactured on and before 31/3/2000)
4.5 - 4.5 9000
2 2&3-wheelers (2-stroke) (vehicles manufactured after 31st March 2000)
4.5 - 3.5 6000
3 2&3 wheeler (4-stroke) (vehicles manufactured after 31st March 2000)
4.5 - 3.5 4500
4 Bharat Stage II compliant 4-wheelers
3.0 - 0.5 750*
5 4-wheelers other than Bharat Stage II compliant
3.0 - 3.0 1500*
* For CNG Vehicles, NMHC=0.3HC; For LPG Vehicles, RHC=0.5HC
65 HSU (2.45m-1 )65 HSU (2.45m-1 )Diesel Vehicles6

28
55Progress Through Research
Enhanced PUC system
Revision Idle emission norms based on the year of vehicle manufacture.Introduction of idle HC emission standardsIntroduction of idle CO and HC emission norms for CNG / LPG vehiclesWill have improved test methods for gasoline and diesel vehiclesFour gas analyzer to check any exhaust gas dilutionMeasurement of Engine oil temperature and engine rpm for repeatable and consistent smoke readings
56Progress Through Research
Enhanced PUC system
Improved equipment operating conditions• Compulsory AMC for min 5 yrs.• Annual renewal based on AMC
verification• Training of PUC center operators by
equipment suppliers and institutionalize the complete system
• Calibration of equipment three times per year
• Communication capability with computer for data transfer and storage

29
57Progress Through Research
Dynamometer (simple rollers with flywheels)
PC and software to
estimate mass emissions
4 gas analyser for raw exhaust
Driving cycle
display
ARAI Developed loaded test for 2 Wheelers
58Progress Through Research
ARAI Developed Loaded test

30
59Progress Through Research
Comparison of Certification results with Proposed System for CO – 2 Wheelers
Comparision - Certification vs Estimated Mass Emission (CO g/km)
y = 1.0928x + 0.0245R2 = 0.9529
0
2
4
6
8
10
12
0 2 4 6 8 10 12Certification CO (g/km)
Estim
ated C
O (g/
km)
60Progress Through Research
Comparison of Certification results with Proposed System for HC – 2 Wheelers
Comparision - Certification vs Estimated Mass Emission (HC g/km)
y = 0.5813x - 0.0087R2 = 0.9812
0
1
2
3
4
5
0 1 2 3 4 5Certification HC (g/km)
Estim
ated H
C (g
/km)

31
61Progress Through Research
Comparison of Certification results with Proposed System for HC – 2 Wheelers
Comparision - Certification vs Estimated Mass Emission (NOx g/km)
y = 0.991x + 0.0043R2 = 0.9772
0.0
0.1
0.2
0.3
0.4
0.5
0.6
0.0 0.2 0.4 0.6
Certification Mass Emission (g/km)
Estim
ated M
ass E
miss
ion
(g/km
)
62Progress Through Research
ARAI Developed Loaded test for 2 Wheelers
After extensive trials on limited no of 2 W vehicle models, a speed based signature for each vehicle model is developed to estimate mass emissions from raw continuous emission data.The library of signature needs to be created for all types of vehicle modelsThe data Correlation with the certification test is highThis test method is recommended in the Auto fuel policy report ARAI can develop short test for other category of vehicles like 3 and 4 Wheelers

32
63Progress Through Research
ProposedInspection and Certification
System for India
64Progress Through Research
Tests required to be doneSafety Parameters evaluated
Visual inspection of upper bodyBrake performanceSpeedometerSide-slipHead-lightNoiseUnderbody visual inspections
Emissions testing4 gas analyzer for petrol driven vehicles (Idle Test)Smoke meter for diesel driven vehicles (FAS)

33
65Progress Through Research
Requirement from equipment suppliers
The equipment suppliers will be required to provide 5 years of warranty for all the equipment
This is basically to avoid ‘fly by night’ suppliers
90% system up-time should be guaranteed by the operators for each of the test lanes
66Progress Through Research
Present Status of I&C in India
Two committees on I&C were formedAdministrative committee: to look into the administrative aspects of the I&C implementation in IndiaTechnical Committee: to look into the technical aspects related to I&CBoth the committees have submitted draft reports Both the committees will shortly be submitting final reports

34
67Progress Through Research
Conclusions
Indian two wheelers are unique with optimum blend of
utility and performancefuel efficiencyand complying with stringent emission regulations
Continuing to Grow at a healthy pace
68Progress Through Research
Conclusions
Future challenges to mobility in India would be: To introduce new technologiesTo meet stringent emission regulationsTo be recognized as ECO-friendly (re- cyclability) and safe mode of transport by society at large
and all this at affordable and competitive price to the customer

35
69Progress Through Research
ConclusionsStrategy to reduce pollution from vehicles should focus on
Vehicle technology upgradations along with tightening of emission normsFuel Quality improvementControl of in-use vehicle emission by effective I/M programmeRetrofitment of catalytic converters especially on 2- and 3-wheelersUse of Alternative FuelsIntroduction of pre-mixed 2-Stroke lubrication oil for 2-Stroke vehiclesPhasing out and replacement of old vehicles
70Progress Through Research
ConclusionsThe existing PUC system would be enhanced by
Revision of PUC norms based on the year of vehicle manufactureIntroduction of HC norms for all types of vehiclesImproved test method for diesel vehicles with engine rpm and oil temperature measurementThe existing 2 gas analyzer in the field to be phased out and the 4 gas analyzer to be introduced in the PUC centersNew PUC centers would be approved with 4 gas analyzers onlyThe test data to be uploaded to a central agency for monitoring and analysis of the data

36
71Progress Through Research
Conclusions (Contd…)
The inspection and certification lanes to be established for emission and safety inspectionsIdentify high polluting vehicles by Remote sensing device or any other gross polluter identification method Subject the High polluting vehicles to loaded test at I&C lanesHave a centralized test only centers and separate the Repair / Maintenance and certificationSynergize the PUC system with the I & C at a later stage
72Progress Through Research
Conclusions (Contd…)
A loaded transient emission test is required for Indian conditions to accurately identify Gross polluters and represent realistic emissions from in-use vehicles.A suitable I / M program covering the emission and safety aspects have to be designed for Indian conditions i.e. low cost, easy to maintain, easy to operate and suitable for all vehicles including 2-wheelers.

37
73Progress Through Research
Conclusions (Contd…)
The ARAI developed short test for Two wheelers which has a very good correlation with certification test can be considered for immediate implementationSimilar loaded test can be developed for other categories of vehicles (3W, 4W gasoline and diesel vehicles)The existing PUC centers may be upgraded in phased manner to advanced vehicle inspection lanes for safety and emissions checks.Public awareness campaigns are to be strengthened
74Progress Through Research


![Winners List - Motor Cycle [AHZ]](https://cdn.vdocument.in/doc/165x107/61c2b9ebada8a96c981ec553/winners-list-motor-cycle-ahz.jpg)
