10/16/2012
1
Department of Industrial and Management Engineering
Indian Institute of Technology Kanpur
5th Capacity Building Programme for Officers of Electricity Regulatory Commissions
18 – 23 Oct., 2012
Forum of Regulators
Mr. A.N. SrivastavaDirector, MNRE
Background
Launched by Hon’blePrime Minister on 11January 2010 as a part of
Large scale utilization rapid diffusion and deployment at a
January 2010 as a part ofNAPCCMission aims to achievegrid tariff parity by 2022through
Large scale utilization, rapid diffusion and deployment at ascale which leads to cost reduction
R&D, Pilot Projects and Technology Demonstration
Local manufacturing and support infrastructure
10/16/2012
2
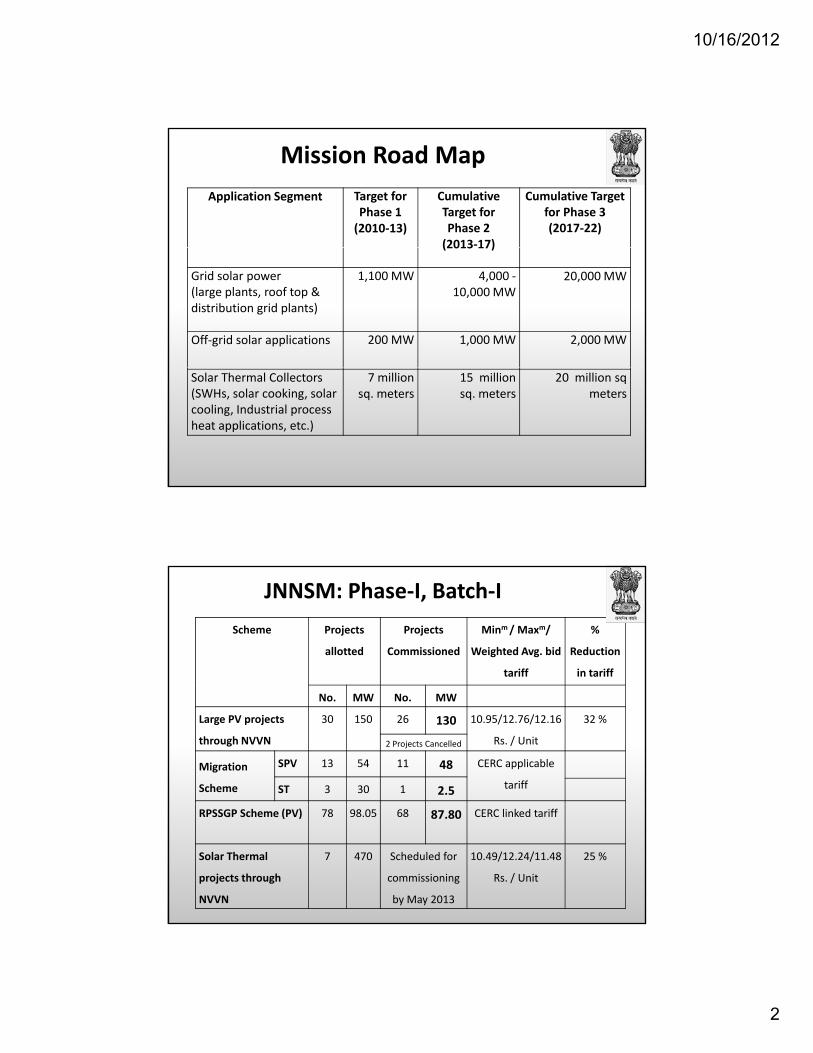
Mission Road Map
Application Segment Target for Phase 1 (2010‐13)
Cumulative Target for Phase 2 (2013‐17)
Cumulative Target for Phase 3 (2017‐22)
(2013 17)
Grid solar power (large plants, roof top & distribution grid plants)
1,100 MW 4,000 ‐10,000 MW
20,000 MW
Off‐grid solar applications 200 MW 1,000 MW 2,000 MW
Solar Thermal Collectors (SWHs, solar cooking, solar cooling, Industrial process heat applications, etc.)
7 million sq. meters
15 million sq. meters
20 million sq meters
JNNSM: Phase‐I, Batch‐I
Scheme Projects
allotted
Projects
Commissioned
Minm/ Maxm/
Weighted Avg. bid
tariff
%
Reduction
in tariff
No. MW No. MW
Large PV projects
through NVVN
30 150 26 130 10.95/12.76/12.16
Rs. / Unit
32 %
2 Projects Cancelled
Migration
Scheme
SPV 13 54 11 48 CERC applicable
tariffST 3 30 1 2.5
RPSSGP Scheme (PV) 78 98.05 68 87.80 CERC linked tariff
Solar Thermal
projects through
NVVN
7 470 Scheduled for
commissioning
by May 2013
10.49/12.24/11.48
Rs. / Unit
25 %

10/16/2012
3
S. no
State Solar PV capacity
to be
Solar PV capacity
actually
Capacity not commissioned
Commissioning Status of Solar PV Projects under Batch – I, Phase ‐I of JNNSM
A) Rooftop PV and Small Solar Power Generation Programme (RPSSGP)
State Wise:
to be
commissioned as
per PPA (MW)
actually
commissioned
(MW)
(MW)
1 Andhra Pradesh 10.5 9.75 0.75
2 Chhattisgarh 4 4 0
3 Haryana 8.8 7.8 1
4 Maharashtra 5 5 0
5 Odisha 8 7 16 Punjab 8.5 6 2.57 Rajasthan 12 10 28 Tamil Nadu 7 5 2
9 Uttrakhand 5 5 0
10 Uttar Pradesh 8 7 1
11 Jharkhand 16 16 012 Madhya
Pradesh
5.25 5.25 0
Total 98.05 87.80 10.25
S. No. Nameof project commissioned State Solar PV capacity allocated as per PPA (MW)
Solar PV capacity actually commissioned (MW)
1 Clover Solar Pvt. Ltd., Mumbai Maharashtra 2 2
B) i. Grid Solar PV Projects under Migration Scheme
2 Maharashtra State Power Generation Co.
Limited, Mumbai
Maharashtra 4 4
3 Videocon Industries Ltd, Mumbai Maharashtra 5 5
4 Azure Power (Punjab) Pvt. Ltd., Amritsar Pvt. Ltd., Gurgaon, Haryana
Punjab 2 2
5 AES Solar Energy Rajasthan 5 5
6 Aston Field Solar (Rajasthan) Pvt. Ltd. Rajasthan 5 5
7 Comet Power Pvt. Ltd., Mumbai Rajasthan 5 5
8 Moser Baer Photo Voltaic Ltd New Delhi Rajasthan 5 58 Moser Baer Photo Voltaic Ltd., New Delhi Rajasthan 5 5
9 OPG Energy Pvt. Ltd., Chennai, Tamil Nadu Rajasthan 5 5
10 Refex Refrigerants Limited, Chennai Rajasthan 5 5
11 Swiss Park Vanijya Pvt. Ltd. Rajasthan 5 5
12 Enterprise Business Solutions Rajasthan 5 ‐
13 Entegra Ltd Rajasthan 1 ‐
Total 54 48

10/16/2012
4
S. No. Nameof project commissioned
State Solar PV capacity allocated
Solar PV capacity actually
B) ii. Grid Solar Thermal Projects under Migration Scheme
as per PPA (MW)
actually commissioned
(MW)
1. Acme Tele PowerLimited, Gurgaon
Rajasthan 10 2.5
2. Dalmia Solar Power
Limited
Rajasthan 10 ‐
3. Entegra Ltd. Rajasthan 10 ‐
Total 30 2.5
The commissioning target is May, 2013.
S. No. Nameof project
commissioned
State Solar PV
capacity
allocated
as per PPA
(MW)
Solar PV
capacity
actually
commissioned
(MW)
Date of commissioning
1 Aftaab Solar Pvt Odisha 5 5 07/02/2012
B) iii. Grid Solar PV Projects under Phase‐I, Batch‐I.
1. Aftaab Solar Pvt.Limited
Odisha 5 5 07/02/2012
2. Alex SpectrumRadiationPrivate Limited
Rajasthan 5 5 21/02/2012
3. Amrit Energy Pvt.Limited
Rajasthan 5 5 02/02/2012
4. Azure Power(Rajasthan) Pvt Ltd
Rajasthan 5 5 01/01/2012
5. CCCL Infrastructure Tamil 5 5 29/03/2012Limited Nadu
6. DDE RenewableEnergyPrivate Limited
Rajasthan 5 5 14/02/2012
7. ElectromechMaritech Pvt Ltd
Rajasthan 5 5 01/02/2012
8. EMC Limited UttarPradesh
5 5 04/03/2012

10/16/2012
5
9. Finehope AlliedEngineering PrivateLimited
Rajasthan 5 5 07/02/2012
10. Greentech PowerPrivate Limited
Rajasthan 5 5 08/02/2012Private Limited
11 Indian OilCorporation Limited
Rajasthan 5 5 02/02/2012
12 Karnataka PowerCorporation Limited
Karnataka 5 5 25/06/2012
13. Khaya Solar ProjectsPrivate Limited
Rajasthan 5 5 28/01/2012
14. MaharashtraSeamless Limited
Rajasthan 5 5 07/01/2012
15. Mahindra Solar OnePrivate Limited
Rajasthan 5 5 03/01/2012
16. Newton Solar PrivateLimited
Rajasthan 5 5 09/02/2012
17. Northwest EnergyPrivate Limited
Rajasthan 5 5 07/01/2012
18. Oswal Woollen MillsLimited
Rajasthan 5 5 10/01/2012Limited
19. Precision TechnikPrivate Limited
Rajasthan 5 5 22/03/2012
20. Punjlloyd SolarPowerLimited
Rajasthan 5 5 08/01/2012
21. Saidham OverseasPrivate Limited
Rajasthan 5 5 30/01/2012
/ /22. Saisudhir EnergyLimited
AndhraPradesh
5 5 05/01/2012
23. SEI Solar EnergyPrivate Limited
Rajasthan 5 5 01/01/2012
24. Vasavi Solar PowerPvt. Limited
Rajasthan 5 5 02/02/2012

10/16/2012
6
25. VirajRenewablesEnergy Private
Rajasthan 5 5 05/01/2012
Energy PrivateLimited
26. Welspun SolarAPPrivate limited
AndhraPradesh
5 5 01/01/2012
27. RithwikProjects PrivateLimited
AndhraPredesh
5 ‐ ‐
h h28. FireStoneTrading PrivateLimited
Maharashtra 5 ‐ ‐
Total 140 130 ‐
Grid Connected Projects under Batch‐I, Phase‐I
State
Solar PV capacity to be
commissioned as per PPA (MW)
Solar PV capacity actually
commissioned (MW)
Balance capacity to be commissioned
(MW)
Rajasthan 100 100 0
Maharashtra 5 ‐ 5
Andhra Pradesh 15 10 5
Karnataka 5 5 0
Orissa 5 5 0
Tamil Nadu 5 5 0
Uttar Pradesh 5 5 0
Total 140 130 10

10/16/2012
7
JNNSM: Phase‐I, Batch‐II
Scheme Projects
allotted
Projects
Commissioned
Minimu
m bid
Maximum
bid tariff
Weighted
Average
%
Reducti
tariff bid tariff on in
tariff
No. MW No. MW
Large PV
projects
28 350 Scheduled for
commissioning
7.49
Rs /
9.44
Rs / Unit
8.77
Rs / Unit
43 %
projects
through
NVVN
commissioning
by Feb. 2013
Rs. /
Unit
Rs. / Unit Rs. / Unit
Financial Arrangement Total No. of Projects ‐ 27
5
6
2
3
4
5
Series 1
Series 2
Series 3
0
1
Category 1 Category 2 Category 3 Category 4
10/16/2012
8
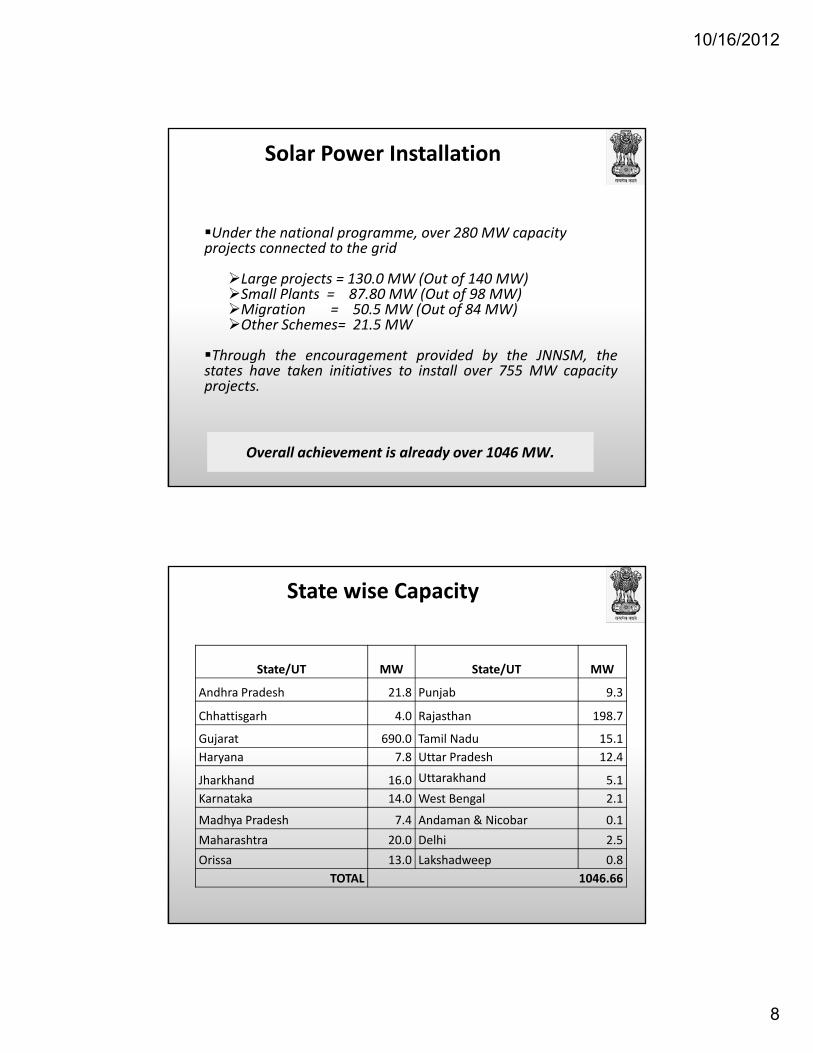
Solar Power Installation
Under the national programme, over 280 MW capacity projects connected to the gridprojects connected to the grid
Large projects = 130.0 MW (Out of 140 MW)Small Plants = 87.80 MW (Out of 98 MW)Migration = 50.5 MW (Out of 84 MW)Other Schemes= 21.5 MW
Through the encouragement provided by the JNNSM, thet t h t k i iti ti t i t ll 755 MW itstates have taken initiatives to install over 755 MW capacityprojects.
Overall achievement is already over 1046 MW.
State wise Capacity
State/UT MW State/UT MW
Andhra Pradesh 21.8 Punjab 9.3
Chhattisgarh 4.0 Rajasthan 198.7
Gujarat 690.0 Tamil Nadu 15.1
Haryana 7.8 Uttar Pradesh 12.4
Jharkhand 16.0 Uttarakhand 5.1
Karnataka 14.0 West Bengal 2.1g
Madhya Pradesh 7.4 Andaman & Nicobar 0.1
Maharashtra 20.0 Delhi 2.5
Orissa 13.0 Lakshadweep 0.8
TOTAL 1046.66
10/16/2012
9
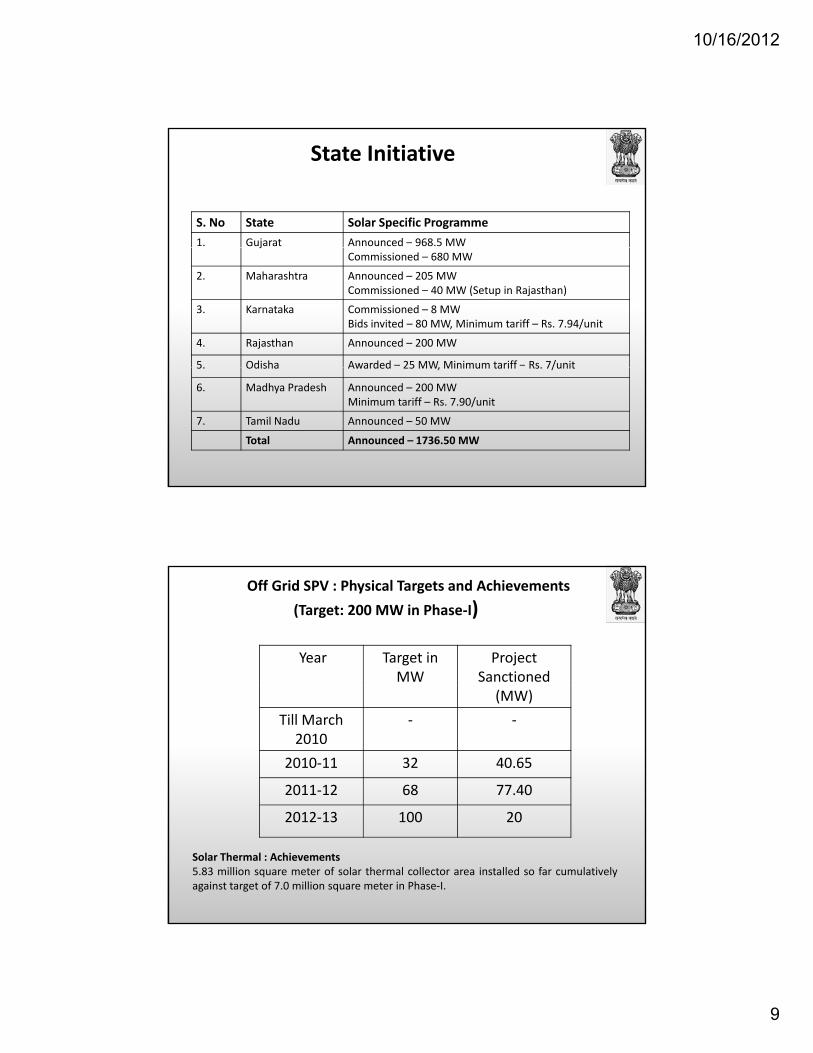
State Initiative
S. No State Solar Specific Programme
1. Gujarat Announced – 968.5 MWjCommissioned – 680 MW
2. Maharashtra Announced – 205 MWCommissioned – 40 MW (Setup in Rajasthan)
3. Karnataka Commissioned – 8 MWBids invited – 80 MW, Minimum tariff – Rs. 7.94/unit
4. Rajasthan Announced – 200 MW
5. Odisha Awarded – 25 MW, Minimum tariff – Rs. 7/unit5. Odisha Awarded 25 MW, Minimum tariff Rs. 7/unit
6. Madhya Pradesh Announced – 200 MWMinimum tariff – Rs. 7.90/unit
7. Tamil Nadu Announced – 50 MW
Total Announced – 1736.50 MW
Off Grid SPV : Physical Targets and Achievements
(Target: 200 MW in Phase‐I)
Year Target in MW
ProjectSanctioned
(MW)
Till March 2010
‐ ‐
2010‐11 32 40.65
2011‐12 68 77.40
2012‐13 100 20
Solar Thermal : Achievements5.83 million square meter of solar thermal collector area installed so far cumulativelyagainst target of 7.0 million square meter in Phase‐I.

10/16/2012
10
JNNSM – Phase 2 : Goals
3000 MW capacity to be supported by the Government ofIndiaAdditional 6000 MW is envisaged through Solar RPOrequirementRequirement of solar power capacity by 2017 is estimatedto be about 10000 MW.
A demand of about 10 GW of solar power is expected to begenerated by 2017 assuming an yearly increase of solar RPOby 0 25 % and increase in conventional power capacity byby 0.25 % and increase in conventional power capacity by3%1000 MW off grid solar applications by 201715 million square meters solar thermal collector area by2017
JNNSM : Phase 2Strategy (Grid Connected)
Options
Bundling with Thermal PowerBundling in the ratio of 1.6 MW of solar power with 1 MW capacityof thermal power1900 MW thermal power would be required to achieve 3000 MWcapacity
Generation Based IncentiveIn view of the declining cost of generation of solar PV power, GBI ofaround Rs 2.5 per unit may be required.
Viability Gap Funding MechanismVGF through open tender on deferred payment basis is one of thealternatives

10/16/2012
11
Proposals for Supporting 3000 MW Capacity
1500 MW capacity of PV Power in two lots of 750 MWeach through VGF mechanismeach through VGF mechanism
500 MW Capacity of Solar Thermal Power with VGFFunding mechanism
250 MW capacity through a Special Project in Ladakhthrough VGF
750 MW capacity through bundling with thermal powerthrough NVVN; 500 MW of thermal power may berequired for this purpose.
S.No State
Solar RPO
Year wise
Installed
Capacity*
(MW)
Solar Power Required (MW)
2011‐12as on
31.05.11
2011‐
12
2012‐
13
2013‐
14
2014‐
15
2015‐
16
2016‐
17
Estimated requirement of Solar Power Capacities to meet Solar RPOs
1 Andhra Pradesh 0.25% 14268 143 294 454 622 799 984
2 Arunachal Pradesh 0.25% 135 1 3 4 6 8 9
3 Assam 0.25% 951 10 20 30 41 53 66
4 Bihar 0.25% 1854 19 38 59 81 104 128
5 Chhattisgarh 0.25% 4632 46 95 147 202 259 320
6 Delhi 0.25% 5800 58 119 184 253 325 400
7 Goa & UT 0.25% 822 8 17 26 36 46 57
8 Gujarat 0.25% 13722 137 283 436 598 768 947
9 Haryana 0.25% 5880 59 121 187 256 329 406
10 Himachal Pradesh 0.25% 2201 22 45 70 96 123 152
11 Jammu & Kashmir 0.25% 2167 22 45 69 94 121 150
12 Jharkhand 0.25% 1979 20 41 63 86 111 137
13 Karnataka 0.25% 9530 95 196 303 416 534 658
14 Kerala 0.25% 3573 36 74 114 156 200 247
15 Madhya Pradesh 0.25% 8114 81 167 258 354 454 560

10/16/2012
12
16 Maharashtra 0.25% 20271 203 418 645 884 1135 1399
17 Manipur 0.25% 152 2 3 5 7 9 10
18 Meghalaya 0.25% 258 3 5 8 11 14 18
19 Mizoram 0.25% 102 1 2 3 4 6 7
20 Nagaland 0.25% 75 1 2 2 3 4 5
21 Orissa 0.25% 5299 53 109 169 231 297 366
22 Punjab 0.25% 6690 67 138 213 292 375 462
23 Rajasthan 0.25% 7508 75 155 239 327 420 518
24 Sikkim 0.25% 154 2 3 5 7 9 11
25 Tamil Nadu 0.25% 9803 98 202 312 427 549 676
26 Tripura 0.25% 249 2 5 8 11 14 17
27 Uttar Pradesh 0.25% 9848 98 203 313 429 551 680
28 Uttarakhand 0.25% 2309 23 48 73 101 129 159
29 West Bengal 0.25% 8155 82 168 259 356 457 563
Total 146501 1465 3018 4659 6387 8204 10109
Off Grid SPV : For 12th Plan (1)
Off‐grid Solar Power Application:
Target – 800 MWAt current rate of subsidy, the requirement of funds wouldbe roughly 6,000 Crore i.e. annually 1200 Crore.
Solar Thermal Heating:
Target – 8 million sq. meters of collector areaThe requirement of subsidy shall be Rs. 1075 Crore.
10/16/2012
13
New Schemes
Mini / micro grid for energy access
S l kSolar parks
Small capacity grid connected solar PV plants for left over States
Making available low cost solar lantern
Roof top systems – grid tied
Focus on industrial process heat systems

10/16/2012
14

10/16/2012
15
Technology used by Project Developers (Batch‐II, Phase‐I, 350 MW)(By No. of Project Developers)
Thin Film
Crystalline
66.67 %
29.63 %
Both 3.70 %
Total number of Projects ‐ 27
Technology used by Project Developers (Batch‐II, Phase‐I, 350 MW)(By Capacity (MW) of Project)
Thin Film
Crystalline
262 MW
78 MW (22.94%)
262 MW(77.06%)

10/16/2012
16
Major Tech Providers Thin Film based Projects
moser Baer4%
Schott48%
Tianwei4%
Wipro12%
Dupont8%
Abound4%
Sharp20%
* Distribution of total capacity of ~ 25 MW
Major Tech Providers Crystalline tech based Projects
microsol1
Vikram solar
Tata BP1134%
Moser Baer39%
Emvee Solar13%
XL energy13%
13%
13% solar
semicond2.759%
BHEL6
18%
Lanco26%
Photon4
12%
* Distribution of total capacity of ~ 33 MW
10/16/2012
17
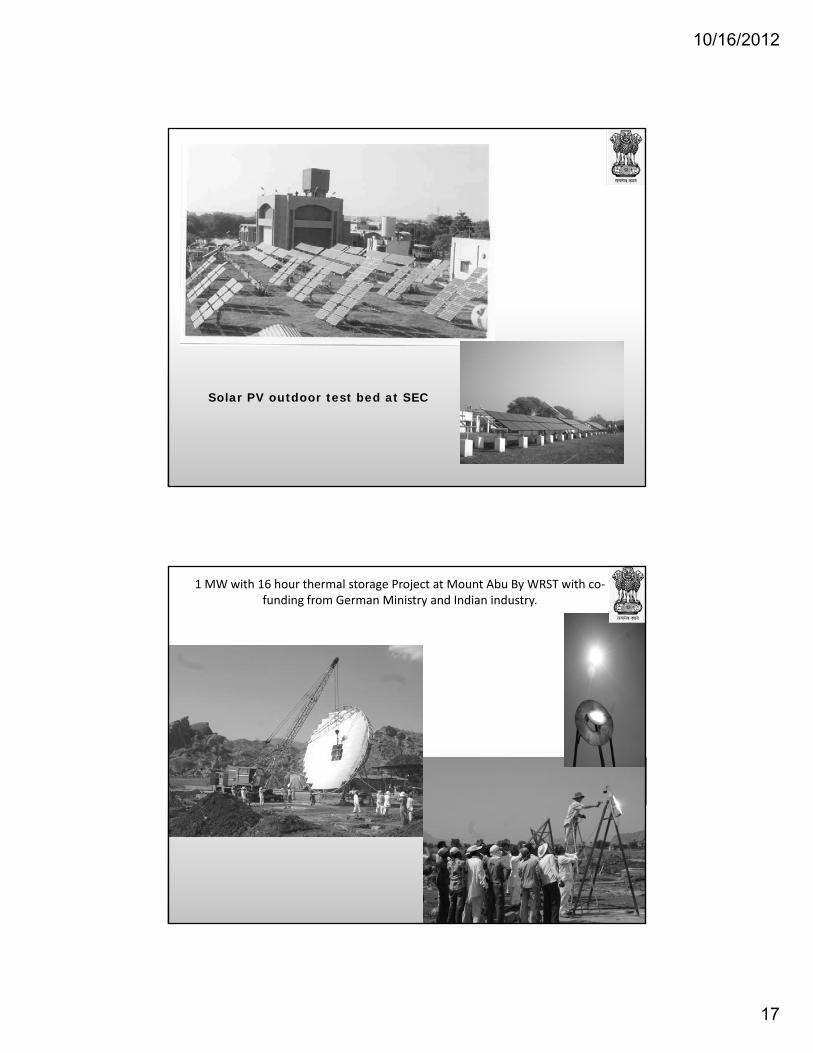
Solar PV outdoor test bed at SEC
1 MW with 16 hour thermal storage Project at Mount Abu By WRST with co‐funding from German Ministry and Indian industry.

10/16/2012
18
National Solar Thermal Power Testing, Simulation and Research
Facility• 1MWe Solar Thermal Power Plant
- Research and Demonstration plant- Combination of different collector fields
(Di d I di S G i )(Direct and Indirect Steam Generation)
Parabolic Trough Field -8700 sq. m-3.3 MWth (Design)
Linear Fresnel Field- 7200 sq. m- 2.2 MWth (Design)
Turbine operating conditions:saturated steam at 350 deg. C and 40 bar
( 1 MW capacity PV Plant at Hissar in Haryana

10/16/2012
19
2.5 MW
Solar Thermal Tower
Grid Power Plant at Bikaner, Rajasthan (Migration)
1 MW PV (Crystalline Silicon) Grid Power Plant at New Delhi (Solar RPO arrangement)

10/16/2012
20
Indian PV Industry
More than 60 companies, with installed capacity of over 1.7 GW, make PVmodules
‐ 15 companies manufacture solar cells (> 700 MW installed capacity)
Manufacturing of various raw materials, components, devices and systems iscoming up/expanding (Poly silicon, wafers, glass, EVA, back sheet, gridinverters etc.)
Turn over of Indian solar industry in 2010‐11 estimated around Rs. 10,000y ,crore
One of the Mission objectives is to take a global leadership role in solarmanufacturing (across the value chain) of leading edge solar technologiesand target a 4‐5 GW equivalent of installed capacity by 2020
39
What are the constraining factors to developers?
• Land acquisition
• Multiple clearances
• T i i t t id /• Transmission to nearest grid s/s
• High cost of Indian debt with short tenures
• Radiation data uncertainty
• With recourse debt. Non‐availability of Project Finance.
• Human resources

10/16/2012
21
Land acquisition issues
● Due to aggressive bidding, projects opt for inexpensive land/ Govt. land
At times, it get significantly expensive to bring the land to a state suitable for
installation and requires levelling, terracing etc.
● MW scale PV plants require considerable land area. Usually not available with
a single owner
Consolidation of contiguous land from multiple owners and families, title search,
legal due diligence, negotiations takes considerable time and expense. In turn
leading to cost/ time overruns.
Multiple Clearances
● Under JNNSM, Acquisition of clearances for water, construction power,pollution provided at the state level
Adds a layer of process which lead to delays & poses risk to timely completion ofprojects
Pollution related clearances should be done away with for solar PV projects
Water required for construction as well as panel cleaning during O&M phase,domestic purposes for staff.
In far flung areas with no access of piped water, borewell is the only viable option.
It typically takes considerably long to get requisite approvals for this permit
Inability of the state governments to provide a single‐window clearance
10/16/2012
22
Evacuation Infrastructure
● Under JNNSM, the developer responsible for laying evacuation infrastructure
upto the interconnection point/ GSS
As per state solar policies of Gujarat and Rajasthan, state transmission utilities are
responsible for building the power evacuation infrastructure
● Considerable challenges for developer in power evacuation infrastructure:
Cheaper and suitable land available mostly in remote areas at a considerable
distance from grid substations. Involves substantial transmission infrastructure
building costs
Right of Way (ROW) issue is more often under‐estimated in time and cost by
/developers. Takes considerable time/ expense in negotiating individually with each
land owner.
State support essential in resolving the ROW issues
State providing connectivity to project would considerably de‐risk timely
evacuation challenge
Solar Park development
● Problems in Land acquisition/ Consolidation/ clearances/ evacuation may be
resolved by:
Developing the solar park on lines of Gujarat whereby land could be leasedp g p j y
out to solar developers
Solar Park may provide necessary evacuation infrastructure, water and
clearances
Sharing of cost of infrastructure lowers project cost. Win-win for State as
well as developers.
Also serves as a showcase site for State to encourage developers/
iinvestors
● Development of State specific database on waste-lands suitable for solar project
development would also be helpful
10/16/2012
23
Project Financing
● Most lenders in India still uncomfortable in financing solar PV projects on a
non‐recourse basis. Perceives high levels of projects construction and
operating risks:p g
Payment security considering financial health of SEBs and Discoms
Not enough operating history for the technologies proposed by developer
Uncertainty surrounding the generation potential at site. Different solar radiation
database yield varying estimates.
Lack of adequate ground‐mounted monitoring stations to validate satellite based
estimates
Radiation variability could significantly affect projected cash flows
Low confidence on developers to deliver projects at costs to sustain cash‐flows
within the very competitive tariffs quoted under reverse bidding mechanism of
JNNSM
Cost of financing
● Prohibitive cost of financing in India in terms of prevailing interest rates.
● Not amenable to funding infrastructure projects.g p j
● Long‐tenure loans not available (15 years and more) with Indian banks.
Stretches cash‐flows during debt service period.
● ECBs not readily available to small developers
10/16/2012
24
Reliable radiation measurement
● Project developers have to rely on satellite information from sources like
NASA, NREL, etc.
● Uncertainty surrounding the generation potential at site. Different solar
radiation database yield varying estimates.
● Lack of adequate ground‐mounted monitoring stations to validate satellite
based estimates.
R di i i bili ld i ifi l ff j d h fl● Radiation variability could significantly affect projected cash flows
Some of the Other Experiences
● Net-worth of Rs. 3 Crores/MW as qualification criteria and Solar PVProject capacity being fixed at 5 MW, any newly born company with anet-worth of Rs. 15 Crores has become eligible to bid for a Solar PVProject without past experience in developing any project. This hasresulted in huge competition and resulting in 300 companies vying forresulted in huge competition and resulting in 300 companies vying for30 projects. Though competition is good for any industry, just openingthe doors for everyone resulted in a mad rush from developers withoutproper due diligence. Out of the selected bidders, some of them werediamond traders and some were pure chartered accountant companieshaving no knowledge of any project whatsoever.
● The guidelines for Batch-1 also mandate that the promoter infuse anequity of Rs. 15 Crores (Rs. 3 Cr/MW) upfront in to the company, whichq y ( ) p p y,isn’t a financially prudent practice. Once the PPA is signed it would atleast take 6 to 7 months for the Project construction to start when theequity is actually required to be spent on the Projects, but due to thestipulation in the guidelines the Companies had to block the amountfrom Day One in their accounts.
10/16/2012
25
● As per the guidelines the Transmission system for these 5 MW SolarProjects have to be arranged by the Developers themselves at their owncost. However confusion reigned in many states because the StateTransmission Utilities were never exposed anything related to Solar. Sinceth P j t t b t d t STU id b t ti ith ltthe Projects were to be connected to STU grid sub-station with voltagelevel of 33 kV or above, the Developers had to connect it at 33 kVinvariably as grid connection higher voltage levels would have beenuneconomical. This has complicated the issue because 33 kV is dealt byDISCOMs and not STUs in all the states.
● Solar Projects can avail certain benefits through Customs Duty and ExciseDuty exemption. The Process for availing such benefits is very complexand resulted in too much running around for the Developers to get theand resulted in too much running around for the Developers to get thesignatures of manufacturers, EPC contractors, nodal agencies, charteredengineers and MNRE. First time many state government agencies had noclue of the process and initially in took too much time for issuing thedocuments.
● JNNSM guidelines also require the developers to have modules taggedwith RFID Tags, containing information like Name of the manufacturer ofcell and module, month and year of manufacture, country of origin, i-v, y , y g ,curve wattage, serial no. etc. While the purpose of this was supposedhave a track of the source and type of modules it became a practicalhead ache for developers and module vendors. None of the modulemanufacturers were having such facility in their assembly lines to fix RFIDtags directly on to the modules. Further the quantum of business wassmall compared to their overall portfolio, thus making it unattractive toalter their business lines for attaching a RFID Tag.
10/16/2012
26


