
JANUARY 2018
INDEX METHODOLOGY
MSCI INDEX CALCULATION METHODOLOGY
Index Calculation Methodology for the MSCI Equity Indexes
Esquivel, Carlos
January 2018

MSCI.COM | PAGE 2 OF 123 © 2018 MSCI Inc. All rights reserved. Please refer to the disclaimer at the end of this document.
MSCI INDEX CALCULATION METHODOLOGY | JANUARY 2018
Introduction ....................................................................................... 4
MSCI Equity Indexes........................................................................... 5
1 MSCI Price Index Methodology ................................................... 6
1.1 Price Index Level ....................................................................................... 6
1.2 Price Index Level (Alternative Calculation Formula – Contribution
Method) ............................................................................................................ 10
1.3 Next Day Initial Security Weight ............................................................ 15
1.4 Closing Index Market Capitalization Today USD (Unadjusted Market Cap
Today USD) ........................................................................................................ 16
1.5 Security Index Of Price In Local .............................................................. 17
1.6 Note on Index Calculation In Local Currency ......................................... 19
1.7 Conversion of Indexes Into Another Currency ....................................... 19
2 MSCI Daily Total Return (DTR) Index Methodology ................... 21
2.1 Calculation Methodology ....................................................................... 21
2.2 Reinvestment Methodology................................................................... 28
2.3 Processing Rules ..................................................................................... 33
Appendix I: Sunday Index Calculation .............................................. 43
Appendix II: Annualized Traded Value Ratio (ATVR) and Annual
Traded Value .................................................................................... 46
Appendix III: Exchange Rates ........................................................... 49
Appendix IV: Singapore & Malaysia – A History of Inclusion in the
Emerging and Developed Markets Indexes ...................................... 50
Appendix V: Singapore and Singapore Free ..................................... 54
Appendix VI: Withholding Tax Rates ................................................ 55
CONTENTS

MSCI.COM | PAGE 3 OF 123 © 2018 MSCI Inc. All rights reserved. Please refer to the disclaimer at the end of this document.
MSCI INDEX CALCULATION METHODOLOGY | JANUARY 2018
Appendix VII: Closing Prices Policy ................................................... 58
Appendix VIII: Country Composition of MSCI Selected Regional
Indexes ............................................................................................ 72
Appendix IX: MSCI Real Time Indexes .............................................. 79
Appendix X: Index Calculation Methodology Using Index Divisors ... 82
Introduction ...................................................................................................... 82
Definitions ......................................................................................................... 82
Calculating the Index......................................................................................... 85
Calculating Index Unit Changes Due to Corporate Events and Index
Rebalancings ..................................................................................................... 86
Interim Constituents ......................................................................................... 87
Appendix XI: Index Correction Policy ............................................... 97
MSCI Index Calculation Methodology Book Tracked Changes .......... 98

MSCI.COM | PAGE 4 OF 123 © 2018 MSCI Inc. All rights reserved. Please refer to the disclaimer at the end of this document.
MSCI INDEX CALCULATION METHODOLOGY | JANUARY 2018
INTRODUCTION
This methodology book describes MSCI’s general Index calculation methodology for the
MSCI Equity Indexes.
MSCI provides two ways of calculating MSCI Equity Indexes, either by using the Price
Adjustment Factor (PAF) or the Index Divisors (Index Divisors methodology available as an
appendix).
These policies and guidelines affect all securities across the MSCI Equity Indexes and
products. Unless otherwise stated the policies and guidelines apply therefore to all securities
in the MSCI Equity universe.
Please note that the index construction methodology and other guiding principles for MSCI
Indexes can be found at www.msci.com.
MSCI.COM | PAGE 5 OF 123 © 2018 MSCI Inc. All rights reserved. Please refer to the disclaimer at the end of this document.
MSCI INDEX CALCULATION METHODOLOGY | JANUARY 2018
MSCI EQUITY INDEXES
The MSCI Equity Indexes measure the performance of a set of equity securities over time.
The MSCI Equity Indexes are calculated using the Laspeyres’ concept of a weighted
arithmetic average together with the concept of chain-linking.
MSCI country and regional equity Indexes are calculated in “local currency” as well as in
USD, with price, gross and net returns.
Index levels are also available in several other currencies such as AUD, BRL, CAD, CHF, CNY,
EUR, GBP, HKD, INR, JPY, KRW, RUB and SGD.
While the local currency series of regional indexes cannot be replicated in the real world, it
represents the theoretical performance of an index without any impact from foreign
exchange fluctuations — a continuously hedged portfolio.
Indexes are calculated 5 days a week, from Monday to Friday with the exception of a
selection of indexes that have Sunday calculations available.
In certain cases, where there are no qualifying securities, it is possible for MSCI Indexes to be
empty following a security deletion or GICS change. If an index becomes empty it would be
dynamically discontinued or ‘ruptured’. It is then possible for the index to be re-started once
a new security qualifies for the index, and this index level would be rebased to an
appropriate level at that time.

MSCI.COM | PAGE 6 OF 123 © 2018 MSCI Inc. All rights reserved. Please refer to the disclaimer at the end of this document.
MSCI INDEX CALCULATION METHODOLOGY | JANUARY 2018
1 MSCI PRICE INDEX METHODOLOGY
Price indexes measure the market prices performance for a selection of securities. They are
calculated daily and, for some of them, on a real time basis. Each index captures the market
capitalization weighted return of all constituents included in the index.
1.1 PRICE INDEX LEVEL
As a general principle, today’s index level is obtained by applying the change in the market
performance to the previous period index level.
𝑃𝑟𝑖𝑐𝑒𝐼𝑛𝑑𝑒𝑥𝐿𝑒𝑣𝑒𝑙𝑈𝑆𝐷𝑡 = 𝑃𝑟𝑖𝑐𝑒𝐼𝑛𝑑𝑒𝑥𝐿𝑒𝑣𝑒𝑙𝑈𝑆𝐷𝑡−1 ∗𝐼𝑛𝑑𝑒𝑥𝐴𝑑𝑗𝑢𝑠𝑡𝑒𝑑𝑀𝑎𝑟𝑘𝑒𝑡𝐶𝑎𝑝𝑈𝑆𝐷𝑡𝐼𝑛𝑑𝑒𝑥𝐼𝑛𝑖𝑡𝑖𝑎𝑙𝑀𝑎𝑟𝑘𝑒𝑡𝐶𝑎𝑝𝑈𝑆𝐷𝑡
𝑃𝑟𝑖𝑐𝑒𝐼𝑛𝑑𝑒𝑥𝐿𝑒𝑣𝑒𝑙𝐿𝑜𝑐𝑎𝑙𝑡 = 𝑃𝑟𝑖𝑐𝑒𝐼𝑛𝑑𝑒𝑥𝐿𝑒𝑣𝑒𝑙𝐿𝑜𝑐𝑎𝑙𝑡−1 ∗𝐼𝑛𝑑𝑒𝑥𝐴𝑑𝑗𝑢𝑠𝑡𝑒𝑑𝑀𝑎𝑟𝑘𝑒𝑡𝐶𝑎𝑝𝐹𝑜𝑟𝐿𝑜𝑐𝑎𝑙𝑡
𝐼𝑛𝑑𝑒𝑥𝐼𝑛𝑖𝑡𝑖𝑎𝑙𝑀𝑎𝑟𝑘𝑒𝑡𝐶𝑎𝑝𝑈𝑆𝐷𝑡
Where:
𝑃𝑟𝑖𝑐𝑒𝐼𝑛𝑑𝑒𝑥𝐿𝑒𝑣𝑒𝑙𝑈𝑆𝐷𝑡−1 is the Price Index level in USD at time t-1
𝐼𝑛𝑑𝑒𝑥𝐴𝑑𝑗𝑢𝑠𝑡𝑒𝑑𝑀𝑎𝑟𝑘𝑒𝑡𝐶𝑎𝑝𝑈𝑆𝐷𝑡 is the Adjusted Market Capitalization of the index in
USD at time t
𝐼𝑛𝑑𝑒𝑥𝐼𝑛𝑖𝑡𝑖𝑎𝑙𝑀𝑎𝑟𝑘𝑒𝑡𝐶𝑎𝑝𝑈𝑆𝐷𝑡 is the Initial Market Capitalization of the index in USD at
time t
𝑃𝑟𝑖𝑐𝑒𝐼𝑛𝑑𝑒𝑥𝐿𝑒𝑣𝑒𝑙𝐿𝑜𝑐𝑎𝑙𝑡−1 is the Price Index level in local currency at time t-1
𝐼𝑛𝑑𝑒𝑥𝐴𝑑𝑗𝑢𝑠𝑡𝑒𝑑𝑀𝑎𝑟𝑘𝑒𝑡𝐶𝑎𝑝𝐹𝑜𝑟𝐿𝑜𝑐𝑎𝑙𝑡 is the Adjusted Market Capitalization of the
index in USD converted using FX rate as of t-1 and used for local currency index at time t
Note: 𝐼𝑛𝑑𝑒𝑥𝐼𝑛𝑖𝑡𝑖𝑎𝑙𝑀𝑎𝑟𝑘𝑒𝑡𝐶𝑎𝑝𝑈𝑆𝐷 was previously called
𝐼𝑛𝑑𝑒𝑥𝑈𝑛𝑎𝑑𝑗𝑢𝑠𝑡𝑒𝑑𝑀𝑎𝑟𝑘𝑒𝑡𝐶𝑎𝑝𝑃𝑟𝑒𝑣𝑖𝑜𝑢𝑠𝑈𝑆𝐷
1.1.1 INDEX MARKET CAPITALIZATION
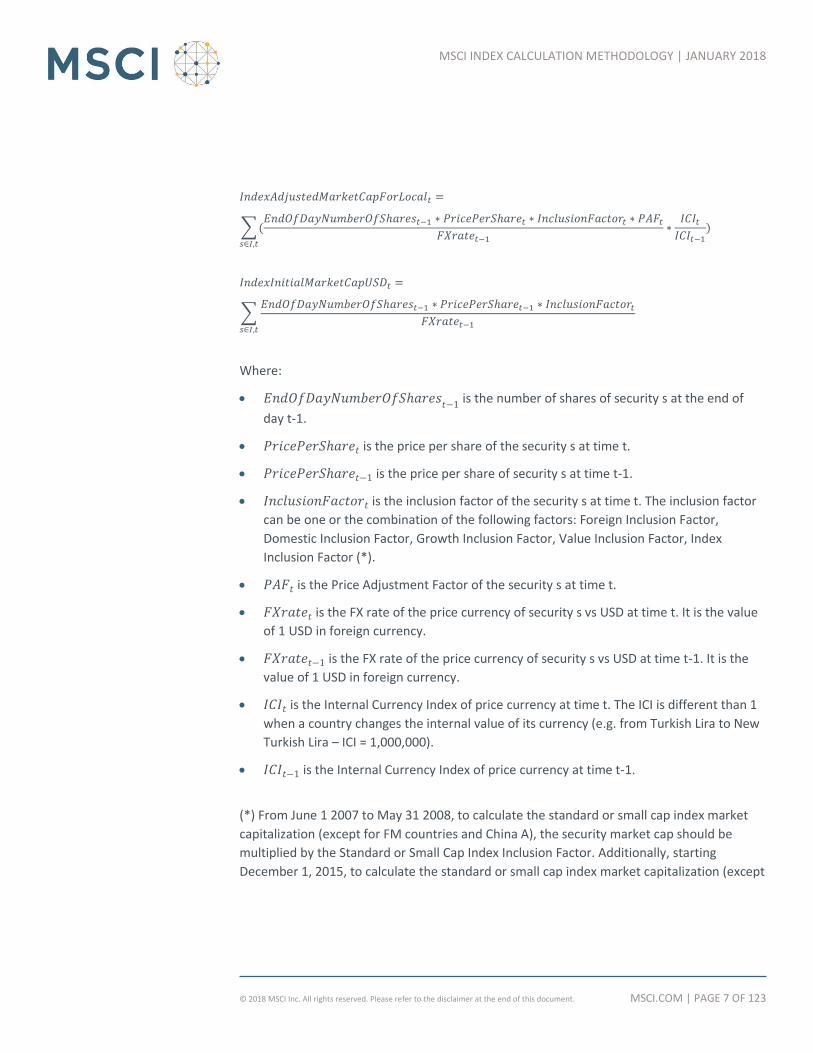
𝐼𝑛𝑑𝑒𝑥𝐴𝑑𝑗𝑢𝑠𝑡𝑒𝑑𝑀𝑎𝑟𝑘𝑒𝑡𝐶𝑎𝑝𝑈𝑆𝐷𝑡 =
∑𝐸𝑛𝑑𝑂𝑓𝐷𝑎𝑦𝑁𝑢𝑚𝑏𝑒𝑟𝑂𝑓𝑆ℎ𝑎𝑟𝑒𝑠𝑡−1 ∗ 𝑃𝑟𝑖𝑐𝑒𝑃𝑒𝑟𝑆ℎ𝑎𝑟𝑒𝑡 ∗ 𝐼𝑛𝑐𝑙𝑢𝑠𝑖𝑜𝑛𝐹𝑎𝑐𝑡𝑜𝑟𝑡 ∗ 𝑃𝐴𝐹𝑡
𝐹𝑋𝑟𝑎𝑡𝑒𝑡𝑠∈𝐼,𝑡
MSCI.COM | PAGE 7 OF 123 © 2018 MSCI Inc. All rights reserved. Please refer to the disclaimer at the end of this document.
MSCI INDEX CALCULATION METHODOLOGY | JANUARY 2018
𝐼𝑛𝑑𝑒𝑥𝐴𝑑𝑗𝑢𝑠𝑡𝑒𝑑𝑀𝑎𝑟𝑘𝑒𝑡𝐶𝑎𝑝𝐹𝑜𝑟𝐿𝑜𝑐𝑎𝑙𝑡 =
∑(𝐸𝑛𝑑𝑂𝑓𝐷𝑎𝑦𝑁𝑢𝑚𝑏𝑒𝑟𝑂𝑓𝑆ℎ𝑎𝑟𝑒𝑠𝑡−1 ∗ 𝑃𝑟𝑖𝑐𝑒𝑃𝑒𝑟𝑆ℎ𝑎𝑟𝑒𝑡 ∗ 𝐼𝑛𝑐𝑙𝑢𝑠𝑖𝑜𝑛𝐹𝑎𝑐𝑡𝑜𝑟𝑡 ∗ 𝑃𝐴𝐹𝑡
𝐹𝑋𝑟𝑎𝑡𝑒𝑡−1𝑠∈𝐼,𝑡
∗𝐼𝐶𝐼𝑡𝐼𝐶𝐼𝑡−1
)
𝐼𝑛𝑑𝑒𝑥𝐼𝑛𝑖𝑡𝑖𝑎𝑙𝑀𝑎𝑟𝑘𝑒𝑡𝐶𝑎𝑝𝑈𝑆𝐷𝑡 =
∑𝐸𝑛𝑑𝑂𝑓𝐷𝑎𝑦𝑁𝑢𝑚𝑏𝑒𝑟𝑂𝑓𝑆ℎ𝑎𝑟𝑒𝑠𝑡−1 ∗ 𝑃𝑟𝑖𝑐𝑒𝑃𝑒𝑟𝑆ℎ𝑎𝑟𝑒𝑡−1 ∗ 𝐼𝑛𝑐𝑙𝑢𝑠𝑖𝑜𝑛𝐹𝑎𝑐𝑡𝑜𝑟𝑡
𝐹𝑋𝑟𝑎𝑡𝑒𝑡−1𝑠∈𝐼,𝑡
Where:
𝐸𝑛𝑑𝑂𝑓𝐷𝑎𝑦𝑁𝑢𝑚𝑏𝑒𝑟𝑂𝑓𝑆ℎ𝑎𝑟𝑒𝑠𝑡−1
is the number of shares of security s at the end of
day t-1.
𝑃𝑟𝑖𝑐𝑒𝑃𝑒𝑟𝑆ℎ𝑎𝑟𝑒𝑡 is the price per share of the security s at time t.
𝑃𝑟𝑖𝑐𝑒𝑃𝑒𝑟𝑆ℎ𝑎𝑟𝑒𝑡−1 is the price per share of security s at time t-1.
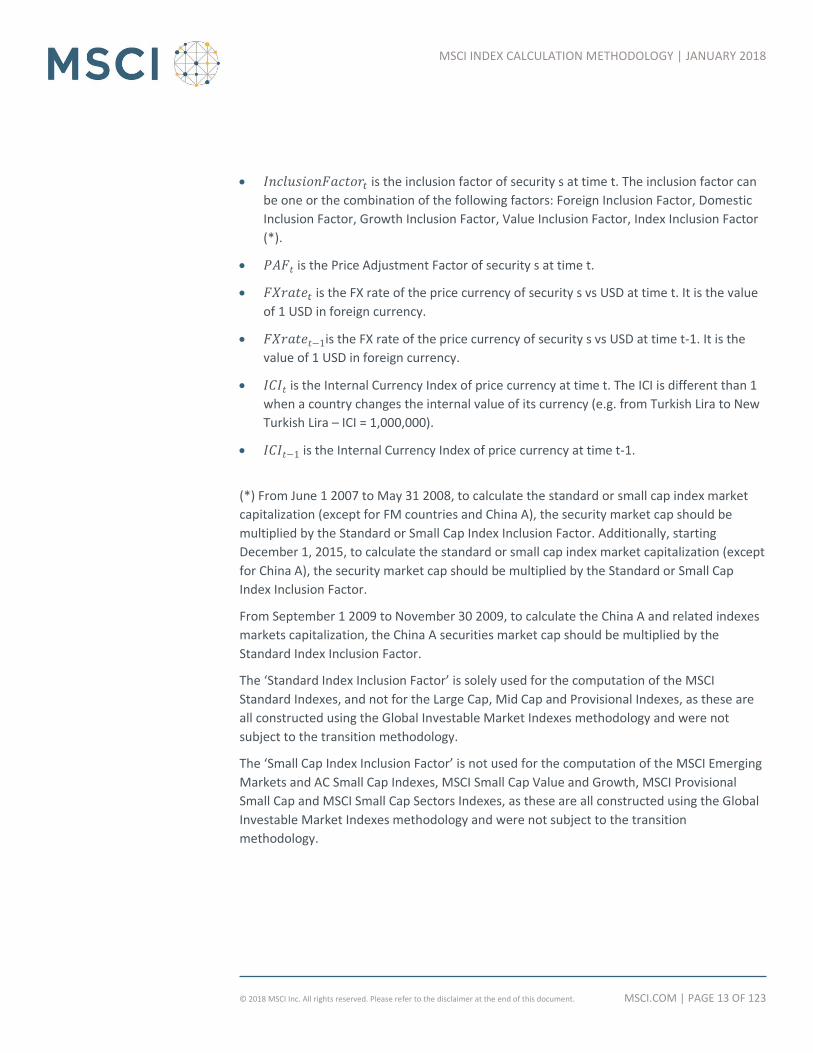
𝐼𝑛𝑐𝑙𝑢𝑠𝑖𝑜𝑛𝐹𝑎𝑐𝑡𝑜𝑟𝑡 is the inclusion factor of the security s at time t. The inclusion factor
can be one or the combination of the following factors: Foreign Inclusion Factor,
Domestic Inclusion Factor, Growth Inclusion Factor, Value Inclusion Factor, Index
Inclusion Factor (*).
𝑃𝐴𝐹𝑡 is the Price Adjustment Factor of the security s at time t.
𝐹𝑋𝑟𝑎𝑡𝑒𝑡 is the FX rate of the price currency of security s vs USD at time t. It is the value
of 1 USD in foreign currency.
𝐹𝑋𝑟𝑎𝑡𝑒𝑡−1 is the FX rate of the price currency of security s vs USD at time t-1. It is the
value of 1 USD in foreign currency.
𝐼𝐶𝐼𝑡 is the Internal Currency Index of price currency at time t. The ICI is different than 1
when a country changes the internal value of its currency (e.g. from Turkish Lira to New
Turkish Lira – ICI = 1,000,000).
𝐼𝐶𝐼𝑡−1 is the Internal Currency Index of price currency at time t-1.
(*) From June 1 2007 to May 31 2008, to calculate the standard or small cap index market
capitalization (except for FM countries and China A), the security market cap should be
multiplied by the Standard or Small Cap Index Inclusion Factor. Additionally, starting
December 1, 2015, to calculate the standard or small cap index market capitalization (except

MSCI.COM | PAGE 8 OF 123 © 2018 MSCI Inc. All rights reserved. Please refer to the disclaimer at the end of this document.
MSCI INDEX CALCULATION METHODOLOGY | JANUARY 2018
for China A), the security market cap should be multiplied by the Standard or Small Cap
Index Inclusion Factor.
From September 1 2009 to November 30 2009, to calculate the China A and related indexes
markets capitalization, the China A securities market cap should be multiplied by the
Standard Index Inclusion Factor.
The ‘Standard Index Inclusion Factor’ is solely used for the computation of the MSCI
Standard Indexes, and not for the Large Cap, Mid Cap and Provisional Indexes, as these are
all constructed using the Global Investable Market Indexes methodology and were not
subject to the transition methodology.
The ‘Small Cap Index Inclusion Factor’ is not used for the computation of the MSCI Emerging
Markets and AC Small Cap Indexes, MSCI Small Cap Value and Growth, MSCI Provisional
Small Cap and MSCI Small Cap Sectors Indexes, as these are all constructed using the Global
Investable Market Indexes methodology and were not subject to the transition
methodology.
Note:
The only difference in the formulas between USD and local currency indexes calculation is
that the same exchange rate is used in the numerator and denominator for local currency,
which means that there is no impact of currency change in the performance. Time variant
exchange rates are used for the USD calculation.

MSCI.COM | PAGE 9 OF 123 © 2018 MSCI Inc. All rights reserved. Please refer to the disclaimer at the end of this document.
MSCI INDEX CALCULATION METHODOLOGY | JANUARY 2018
1.1.2 EXAMPLE OF CALCULATION
Example of index calculation.
Day 1
NumberOf
Shares t-
1
PricePer
Share t
PricePer
Share t-1
Inclusion
Factor t PAF t
FXrate
t
FXrate
t-1
IndexAdjusted
MarketCapUSD
t (see 1.1.1)
IndexInitialMar
ketCapUSD t
(see 1.1.1)
IndexAdjusted
MarketCapFor
Local t (see
1.1.1)
Security A 150000 152.60 154.00 0.75 1 1.50 1.49 11,445,000 11,627,517 11,521,812
Security B 26000 98.40 105.00 1.00 1 1.15 1.14 2,224,696 2,394,737 2,244,211
Security C 290000 1592.60 1603.50 0.60 1 125.00 125.50 2,216,899 2,223,179 2,208,067
Security D 360000 268.00 265.30 0.85 1 1.50 1.50 54,672,000 54,121,200 54,672,000
Total Index 70,558,595 70,366,633 70,646,090
t t-1 daily perf
PriceIndexLevelUSD (see 1.1) 100.273 100.000 0.27%
PriceIndexLevelLocal (see 1.1) 100.397 100.000 0.40%
Day 2
Security C is ex Right issue 1 : 1 @ 1300
NumberOf
Shares t-
1
PricePer
Share t
PricePer
Share t-1
Inclusion
Factor t PAF t
FXrate
t
FXrate
t-1
IndexAdjusted
MarketCapUSD
t (see 1.1.1)
IndexInitialMar
ketCapUSD t
(see 1.1.1)
IndexAdjusted
MarketCapFor
Local t (see
1.1.1)
Security A 150000 160.00 152.60 0.75 1 1.51 1.50 11,920,530 11,445,000 12,000,000
Security B 26000 95.00 98.40 1.00 1 1.16 1.15 2,129,310 2,224,696 2,147,826
Security C 290000 1450.00 1592.60 0.60 1.1034 124.50 125.00 2,236,145 2,216,899 2,227,200
Security D 360000 265.00 268.00 0.85 1 1.51 1.50 53,701,987 54,672,000 54,060,000
Total Index 69,987,971 70,558,595 70,435,026
t t-1 daily perf
PriceIndexLevelUSD (see 1.1) 99.462 100.273 -0.81%
PriceIndexLevelLocal (see 1.1) 100.221 100.397 -0.18%
Day 3
Security C has an increase of number of shares follow ing the right issue ex on Day 2
NumberOf
Shares t-
1
PricePer
Share t
PricePer
Share t-1
Inclusion
Factor t PAF t
FXrate
t
FXrate
t-1
IndexAdjusted
MarketCapUSD
t (see 1.1.1)
IndexInitialMar
ketCapUSD t
(see 1.1.1)
IndexAdjusted
MarketCapFor
Local t (see
1.1.1)
Security A 150000 165.00 160.00 0.75 1 1.50 1.51 12,375,000 11,920,530 12,293,046
Security B 26000 102.00 95.00 1.00 1 1.17 1.16 2,266,667 2,129,310 2,286,207
Security C 580000 1545.00 1450.00 0.60 1 124.45 124.50 4,320,289 4,053,012 4,318,554
Security D 360000 266.00 265.00 0.85 1 1.50 1.51 54,264,000 53,701,987 53,904,636
Total Index 73,225,956 71,804,839 72,802,443
t t-1 daily perf
PriceIndexLevelUSD (see 1.1) 101.430 99.462 1.98%
PriceIndexLevelLocal (see 1.1) 101.614 100.221 1.39%

MSCI.COM | PAGE 10 OF 123 © 2018 MSCI Inc. All rights reserved. Please refer to the disclaimer at the end of this document.
MSCI INDEX CALCULATION METHODOLOGY | JANUARY 2018
1.2 PRICE INDEX LEVEL (ALTERNATIVE CALCULATION FORMULA – CONTRIBUTION
METHOD)
Another way to calculate the index level would be to use the initial weight and price return
of the individual securities included in the index:
𝑃𝑟𝑖𝑐𝑒𝐼𝑛𝑑𝑒𝑥𝐿𝑒𝑣𝑒𝑙𝑈𝑆𝐷𝑡 = 𝑃𝑟𝑖𝑐𝑒𝐼𝑛𝑑𝑒𝑥𝐿𝑒𝑣𝑒𝑙𝑈𝑆𝐷𝑡−1 ∗ (1 + ∑ 𝑆𝑒𝑐𝑢𝑟𝑖𝑡𝑦𝑃𝑟𝑖𝑐𝑒𝐶𝑜𝑛𝑡𝑟𝑖𝑏𝑢𝑡𝑖𝑜𝑛𝑇𝑜𝐼𝑛𝑑𝑒𝑥𝑈𝑆𝐷𝑡)
𝑠∈𝐼,𝑡
𝑃𝑟𝑖𝑐𝑒𝐼𝑛𝑑𝑒𝑥𝐿𝑒𝑣𝑒𝑙𝐿𝑜𝑐𝑎𝑙𝑡 = 𝑃𝑟𝑖𝑐𝑒𝐼𝑛𝑑𝑒𝑥𝐿𝑒𝑣𝑒𝑙𝐿𝑜𝑐𝑎𝑙𝑡−1 ∗ (1 + ∑ 𝑆𝑒𝑐𝑢𝑟𝑖𝑡𝑦𝑃𝑟𝑖𝑐𝑒𝐶𝑜𝑛𝑡𝑟𝑖𝑏𝑢𝑡𝑖𝑜𝑛𝑇𝑜𝐼𝑛𝑑𝑒𝑥𝐿𝑜𝑐𝑎𝑙𝑡)
𝑠∈𝐼,𝑡
1.2.1 SECURITY CONTRIBUTION TO THE INDEX
𝑆𝑒𝑐𝑢𝑟𝑖𝑡𝑦𝑃𝑟𝑖𝑐𝑒𝐶𝑜𝑛𝑡𝑟𝑖𝑏𝑢𝑡𝑖𝑜𝑛𝑇𝑜𝐼𝑛𝑑𝑒𝑥𝑈𝑆𝐷𝑡 = 𝐼𝑛𝑖𝑡𝑖𝑎𝑙𝑆𝑒𝑐𝑢𝑟𝑖𝑡𝑦𝑊𝑒𝑖𝑔ℎ𝑡𝑡 ∗ 𝑆𝑒𝑐𝑢𝑟𝑖𝑡𝑦𝐷𝑎𝑖𝑙𝑦𝑃𝑟𝑖𝑐𝑒𝑅𝑒𝑡𝑢𝑟𝑛𝑈𝑆𝐷𝑡
𝑆𝑒𝑐𝑢𝑟𝑖𝑡𝑦𝑃𝑟𝑖𝑐𝑒𝐶𝑜𝑛𝑡𝑟𝑖𝑏𝑢𝑡𝑖𝑜𝑛𝑇𝑜𝐼𝑛𝑑𝑒𝑥𝐿𝑜𝑐𝑎𝑙𝑡 = 𝐼𝑛𝑖𝑡𝑖𝑎𝑙𝑆𝑒𝑐𝑢𝑟𝑖𝑡𝑦𝑊𝑒𝑖𝑔ℎ𝑡𝑡 ∗ 𝑆𝑒𝑐𝑢𝑟𝑖𝑡𝑦𝐷𝑎𝑖𝑙𝑦𝑃𝑟𝑖𝑐𝑒𝑅𝑒𝑡𝑢𝑟𝑛𝐿𝑜𝑐𝑎𝑙𝑡
Where:
𝑆𝑒𝑐𝑢𝑟𝑖𝑡𝑦𝐷𝑎𝑖𝑙𝑦𝑃𝑟𝑖𝑐𝑒𝑅𝑒𝑡𝑢𝑟𝑛𝑈𝑆𝐷𝑡 is the price return in USD of security s at time t.
𝑆𝑒𝑐𝑢𝑟𝑖𝑡𝑦𝐷𝑎𝑖𝑙𝑦𝑃𝑟𝑖𝑐𝑒𝑅𝑒𝑡𝑢𝑟𝑛𝐿𝑜𝑐𝑎𝑙𝑡 is the price return of security s at time t converted
using FX rate as of t-1 and used for local currency calculation at time t.
1.2.2 TODAY’S INITIAL SECURITY WEIGHT
𝐼𝑛𝑖𝑡𝑖𝑎𝑙𝑆𝑒𝑐𝑢𝑟𝑖𝑡𝑦𝑊𝑒𝑖𝑔ℎ𝑡𝑡 =
𝐸𝑛𝑑𝑂𝑓𝐷𝑎𝑦𝑁𝑢𝑚𝑏𝑒𝑟𝑂𝑓𝑆ℎ𝑎𝑟𝑒𝑠𝑡−1 ∗ 𝑃𝑟𝑖𝑐𝑒𝑃𝑒𝑟𝑆ℎ𝑎𝑟𝑒𝑡−1𝐹𝑋𝑟𝑎𝑡𝑒𝑡−1
∗ 𝐼𝑛𝑐𝑙𝑢𝑠𝑖𝑜𝑛𝐹𝑎𝑐𝑡𝑜𝑟𝑡
∑ (𝐸𝑛𝑑𝑂𝑓𝐷𝑎𝑦𝑁𝑢𝑚𝑏𝑒𝑟𝑂𝑓𝑆ℎ𝑎𝑟𝑒𝑠𝑡−1 ∗ 𝑃𝑟𝑖𝑐𝑒𝑃𝑒𝑟𝑆ℎ𝑎𝑟𝑒𝑡−1
𝐹𝑋𝑟𝑎𝑡𝑒𝑡−1∗ 𝐼𝑛𝑐𝑙𝑢𝑠𝑖𝑜𝑛𝐹𝑎𝑐𝑡𝑜𝑟𝑡)𝑠∈𝐼,𝑡
∗ 100 =
𝑆𝑒𝑐𝑢𝑟𝑖𝑡𝑦𝐼𝑛𝑖𝑡𝑖𝑎𝑙𝐹𝑢𝑙𝑙𝑀𝑎𝑟𝑘𝑒𝑡𝐶𝑎𝑝𝑈𝑆𝐷𝑡 ∗ 𝐼𝑛𝑐𝑙𝑢𝑠𝑖𝑜𝑛𝐹𝑎𝑐𝑡𝑜𝑟𝑡
∑ (𝑆𝑒𝑐𝑢𝑟𝑖𝑡𝑦𝐼𝑛𝑖𝑡𝑖𝑎𝑙𝐹𝑢𝑙𝑙𝑀𝑎𝑟𝑘𝑒𝑡𝐶𝑎𝑝𝑈𝑆𝐷𝑡 ∗ 𝐼𝑛𝑐𝑙𝑢𝑠𝑖𝑜𝑛𝐹𝑎𝑐𝑡𝑜𝑟𝑡)𝑠∈𝐼,𝑡
∗ 100 =
𝑆𝑒𝑐𝑢𝑟𝑖𝑡𝑦𝐼𝑛𝑖𝑡𝑖𝑎𝑙𝑀𝑎𝑟𝑘𝑒𝑡𝐶𝑎𝑝𝑈𝑆𝐷𝑡𝐼𝑛𝑑𝑒𝑥𝐼𝑛𝑖𝑡𝑖𝑎𝑙𝑀𝑎𝑟𝑘𝑒𝑡𝐶𝑎𝑝𝑈𝑆𝐷𝑡
∗ 100

MSCI.COM | PAGE 11 OF 123 © 2018 MSCI Inc. All rights reserved. Please refer to the disclaimer at the end of this document.
MSCI INDEX CALCULATION METHODOLOGY | JANUARY 2018
Where:
𝐸𝑛𝑑𝑂𝑓𝐷𝑎𝑦𝑁𝑢𝑚𝑏𝑒𝑟𝑂𝑓𝑆ℎ𝑎𝑟𝑒𝑠𝑡−1
is the number of shares of security s at the end of
day t-1.
𝑃𝑟𝑖𝑐𝑒𝑃𝑒𝑟𝑆ℎ𝑎𝑟𝑒𝑡−1 is the price per share of security s at time t-1.
𝐼𝑛𝑐𝑙𝑢𝑠𝑖𝑜𝑛𝐹𝑎𝑐𝑡𝑜𝑟𝑡 is the inclusion factor of security s at time t. The inclusion factor can
be one or the combination of the following factors: Foreign Inclusion Factor, Domestic
Inclusion Factor, Growth Inclusion Factor, Value Inclusion Factor, Index Inclusion Factor
(*).
𝐹𝑋𝑟𝑎𝑡𝑒𝑡−1 is the FX rate of the price currency of security s vs USD at time t-1. It is the
value of 1 USD in foreign currency.
(*) From June 1 2007 to May 31 2008, to calculate the standard or small cap index market
capitalization (except for FM countries and China A), the security market cap should be
multiplied by the Standard or Small Cap Index Inclusion Factor. Additionally, starting
December 1, 2015, to calculate the standard or small cap index market capitalization (except
for China A), the security market cap should be multiplied by the Standard or Small Cap
Index Inclusion Factor.
From September 1 2009 to November 30 2009, to calculate the China A and related indexes
markets capitalization, the China A securities market cap should be multiplied by the
Standard Index Inclusion Factor.
The ‘Standard Index Inclusion Factor’ is solely used for the computation of the MSCI
Standard Indexes, and not for the Large Cap, Mid Cap and Provisional Indexes, as these are
all constructed using the Global Investable Market Indexes methodology and were not
subject to the transition methodology.
The ‘Small Cap Index Inclusion Factor’ is not used for the computation of the MSCI Emerging
Markets and AC Small Cap Indexes, MSCI Small Cap Value and Growth, MSCI Provisional
Small Cap and MSCI Small Cap Sectors Indexes, as these are all constructed using the Global
Investable Market Indexes methodology and were not subject to the transition
methodology.
Note: The 𝑆𝑒𝑐𝑢𝑟𝑖𝑡𝑦𝐼𝑛𝑖𝑡𝑖𝑎𝑙𝐹𝑢𝑙𝑙𝑀𝑎𝑟𝑘𝑒𝑡𝐶𝑎𝑝𝐼𝑛𝑆𝑒𝑐𝑢𝑟𝑖𝑡𝑦𝑃𝑟𝑖𝑐𝑒𝐶𝑢𝑟𝑟𝑒𝑛𝑐𝑦𝑡 is also available in
the security files and corresponds to the 𝑆𝑒𝑐𝑢𝑟𝑖𝑡𝑦𝐼𝑛𝑖𝑡𝑖𝑎𝑙𝐹𝑢𝑙𝑙𝑀𝑎𝑟𝑘𝑒𝑡𝐶𝑎𝑝𝑈𝑆𝐷𝑡 multiplied
by the 𝐹𝑋𝑟𝑎𝑡𝑒𝑡−1

MSCI.COM | PAGE 12 OF 123 © 2018 MSCI Inc. All rights reserved. Please refer to the disclaimer at the end of this document.
MSCI INDEX CALCULATION METHODOLOGY | JANUARY 2018
The 𝐸𝑛𝑑𝑂𝑓𝐷𝑎𝑦𝑁𝑢𝑚𝑏𝑒𝑟𝑂𝑓𝑆ℎ𝑎𝑟𝑒𝑠𝑡−1 used to calculate today’s initial weight, available in
the MSCI products dated day𝑡, is shown as “Number of Shares (Today Index)”.
1.2.3 SECURITY DAILY PRICE RETURN
𝑆𝑒𝑐𝑢𝑟𝑖𝑡𝑦𝐷𝑎𝑖𝑙𝑦𝑃𝑟𝑖𝑐𝑒𝑅𝑒𝑡𝑢𝑟𝑛𝑈𝑆𝐷𝑡 = [𝑆𝑒𝑐𝑢𝑟𝑖𝑡𝑦𝐴𝑑𝑗𝑢𝑠𝑡𝑒𝑑𝑀𝑎𝑟𝑘𝑒𝑡𝐶𝑎𝑝𝑈𝑆𝐷𝑡
𝑆𝑒𝑐𝑢𝑟𝑖𝑡𝑦𝐼𝑛𝑖𝑡𝑖𝑎𝑙𝑀𝑎𝑟𝑘𝑒𝑡𝐶𝑎𝑝𝑈𝑆𝐷𝑡− 1] ∗ 100
𝑆𝑒𝑐𝑢𝑟𝑖𝑡𝑦𝐷𝑎𝑖𝑙𝑦𝑃𝑟𝑖𝑐𝑒𝑅𝑒𝑡𝑢𝑟𝑛𝐿𝑜𝑐𝑎𝑙𝑡 = [𝑆𝑒𝑐𝑢𝑟𝑖𝑡𝑦𝐴𝑑𝑗𝑢𝑠𝑡𝑒𝑑𝑀𝑎𝑟𝑘𝑒𝑡𝐶𝑎𝑝𝐹𝑜𝑟𝐿𝑜𝑐𝑎𝑙𝑡
𝑆𝑒𝑐𝑢𝑟𝑖𝑡𝑦𝐼𝑛𝑖𝑡𝑖𝑎𝑙𝑀𝑎𝑟𝑘𝑒𝑡𝐶𝑎𝑝𝑈𝑆𝐷𝑡− 1] ∗ 100
𝑆𝑒𝑐𝑢𝑟𝑖𝑡𝑦𝐴𝑑𝑗𝑢𝑠𝑡𝑒𝑑𝑀𝑎𝑟𝑘𝑒𝑡𝐶𝑎𝑝𝐹𝑜𝑟𝐿𝑜𝑐𝑎𝑙𝑡 =𝐸𝑛𝑑𝑂𝑓𝐷𝑎𝑦𝑁𝑢𝑚𝑏𝑒𝑟𝑂𝑓𝑆ℎ𝑎𝑟𝑒𝑠𝑡−1 ∗ 𝑃𝑟𝑖𝑐𝑒𝑃𝑒𝑟𝑆ℎ𝑎𝑟𝑒𝑡 ∗ 𝐼𝑛𝑐𝑙𝑢𝑠𝑖𝑜𝑛𝐹𝑎𝑐𝑡𝑜𝑟𝑡 ∗ 𝑃𝐴𝐹𝑡
𝐹𝑋𝑟𝑎𝑡𝑒𝑡−1∗
𝐼𝐶𝐼𝑡𝐼𝐶𝐼𝑡−1
𝑆𝑒𝑐𝑢𝑟𝑖𝑡𝑦𝐴𝑑𝑗𝑢𝑠𝑡𝑒𝑑𝑀𝑎𝑟𝑘𝑒𝑡𝐶𝑎𝑝𝑈𝑆𝐷𝑡 =𝐸𝑛𝑑𝑂𝑓𝐷𝑎𝑦𝑁𝑢𝑚𝑏𝑒𝑟𝑂𝑓𝑆ℎ𝑎𝑟𝑒𝑠𝑡−1 ∗ 𝑃𝑟𝑖𝑐𝑒𝑃𝑒𝑟𝑆ℎ𝑎𝑟𝑒𝑡 ∗ 𝐼𝑛𝑐𝑙𝑢𝑠𝑖𝑜𝑛𝐹𝑎𝑐𝑡𝑜𝑟𝑡 ∗ 𝑃𝐴𝐹𝑡
𝐹𝑋𝑟𝑎𝑡𝑒𝑡
𝑆𝑒𝑐𝑢𝑟𝑖𝑡𝑦𝐼𝑛𝑖𝑡𝑖𝑎𝑙𝑀𝑎𝑟𝑘𝑒𝑡𝐶𝑎𝑝𝑈𝑆𝐷𝑡 =𝐸𝑛𝑑𝑂𝑓𝐷𝑎𝑦𝑁𝑢𝑚𝑏𝑒𝑟𝑂𝑓𝑆ℎ𝑎𝑟𝑒𝑠𝑡−1 ∗ 𝑃𝑟𝑖𝑐𝑒𝑃𝑒𝑟𝑆ℎ𝑎𝑟𝑒𝑡−1 ∗ 𝐼𝑛𝑐𝑙𝑢𝑠𝑖𝑜𝑛𝐹𝑎𝑐𝑡𝑜𝑟𝑡
𝐹𝑋𝑟𝑎𝑡𝑒𝑡−1
Where:
𝑆𝑒𝑐𝑢𝑟𝑖𝑡𝑦𝐴𝑑𝑗𝑢𝑠𝑡𝑒𝑑𝑀𝑎𝑟𝑘𝑒𝑡𝐶𝑎𝑝𝐹𝑜𝑟𝐿𝑜𝑐𝑎𝑙𝑡 is the Adjusted Market Capitalization of
security s in USD converted using FX rate as of t-1
𝑆𝑒𝑐𝑢𝑟𝑖𝑡𝑦𝐴𝑑𝑗𝑢𝑠𝑡𝑒𝑑𝑀𝑎𝑟𝑘𝑒𝑡𝐶𝑎𝑝𝑈𝑆𝐷𝑡 is the Adjusted Market Capitalization of security s
in USD converted using FX rate as of t
𝑆𝑒𝑐𝑢𝑟𝑖𝑡𝑦𝐼𝑛𝑖𝑡𝑖𝑎𝑙𝑀𝑎𝑟𝑘𝑒𝑡𝐶𝑎𝑝𝑈𝑆𝐷𝑡 is the Initial Market Capitalization of security s in USD
at time t
𝐸𝑛𝑑𝑂𝑓𝐷𝑎𝑦𝑁𝑢𝑚𝑏𝑒𝑟𝑂𝑓𝑆ℎ𝑎𝑟𝑒𝑠𝑡−1
is the number of shares of security s at the end of
day t-1.
𝑃𝑟𝑖𝑐𝑒𝑃𝑒𝑟𝑆ℎ𝑎𝑟𝑒𝑡 is the price per share of security s at time t.
𝑃𝑟𝑖𝑐𝑒𝑃𝑒𝑟𝑆ℎ𝑎𝑟𝑒𝑡−1 is the price per share of security s at time t-1.
MSCI.COM | PAGE 13 OF 123 © 2018 MSCI Inc. All rights reserved. Please refer to the disclaimer at the end of this document.
MSCI INDEX CALCULATION METHODOLOGY | JANUARY 2018
𝐼𝑛𝑐𝑙𝑢𝑠𝑖𝑜𝑛𝐹𝑎𝑐𝑡𝑜𝑟𝑡 is the inclusion factor of security s at time t. The inclusion factor can
be one or the combination of the following factors: Foreign Inclusion Factor, Domestic
Inclusion Factor, Growth Inclusion Factor, Value Inclusion Factor, Index Inclusion Factor
(*).
𝑃𝐴𝐹𝑡 is the Price Adjustment Factor of security s at time t.
𝐹𝑋𝑟𝑎𝑡𝑒𝑡 is the FX rate of the price currency of security s vs USD at time t. It is the value
of 1 USD in foreign currency.
𝐹𝑋𝑟𝑎𝑡𝑒𝑡−1is the FX rate of the price currency of security s vs USD at time t-1. It is the
value of 1 USD in foreign currency.
𝐼𝐶𝐼𝑡 is the Internal Currency Index of price currency at time t. The ICI is different than 1
when a country changes the internal value of its currency (e.g. from Turkish Lira to New
Turkish Lira – ICI = 1,000,000).
𝐼𝐶𝐼𝑡−1 is the Internal Currency Index of price currency at time t-1.
(*) From June 1 2007 to May 31 2008, to calculate the standard or small cap index market
capitalization (except for FM countries and China A), the security market cap should be
multiplied by the Standard or Small Cap Index Inclusion Factor. Additionally, starting
December 1, 2015, to calculate the standard or small cap index market capitalization (except
for China A), the security market cap should be multiplied by the Standard or Small Cap
Index Inclusion Factor.
From September 1 2009 to November 30 2009, to calculate the China A and related indexes
markets capitalization, the China A securities market cap should be multiplied by the
Standard Index Inclusion Factor.
The ‘Standard Index Inclusion Factor’ is solely used for the computation of the MSCI
Standard Indexes, and not for the Large Cap, Mid Cap and Provisional Indexes, as these are
all constructed using the Global Investable Market Indexes methodology and were not
subject to the transition methodology.
The ‘Small Cap Index Inclusion Factor’ is not used for the computation of the MSCI Emerging
Markets and AC Small Cap Indexes, MSCI Small Cap Value and Growth, MSCI Provisional
Small Cap and MSCI Small Cap Sectors Indexes, as these are all constructed using the Global
Investable Market Indexes methodology and were not subject to the transition
methodology.

MSCI.COM | PAGE 14 OF 123 © 2018 MSCI Inc. All rights reserved. Please refer to the disclaimer at the end of this document.
MSCI INDEX CALCULATION METHODOLOGY | JANUARY 2018
1.2.4 EXAMPLE OF CALCULATION USING CONTRIBUTION
Day 1
NumberOf
Shares t-
1
PricePer
Share t
PricePer
Share t-1
Inclusion
Factor t PAF t
FXrate
t
FXrate
t-1
InitialSecuri
tyWeight t
(see 1.2.2)
SecurityDaily
Price_Return
USD t (see
1.2.3)
SecurityPrice
contributionTo
IndexUSD
(see 1.2.1)
SecurityDaily
Price_Return
Local t (see
1.2.3)
SecurityPrice
contributionTo
IndexLocal
(see 1.2.1)
Security A 150000 152.60 154.00 0.75 1 1.50 1.49 16.52% -1.57% -0.26% -0.91% -0.15%
Security B 26000 98.40 105.00 1.00 1 1.15 1.14 3.40% -7.10% -0.24% -6.29% -0.21%
Security C 290000 1592.60 1603.50 0.60 1 125.00 125.50 3.16% -0.28% -0.01% -0.68% -0.02%
Security D 360000 268.00 265.30 0.85 1 1.50 1.50 76.91% 1.02% 0.78% 1.02% 0.78%
Total Index 100.00% 0.27% 0.40%
t t-1 daily perf
PriceIndexLevelUSD (see 1.2) 100.273 100.000 0.27%
PriceIndexLevelLocal (see 1.2) 100.397 100.000 0.40%
Day 2
Security C is ex Right issue 1 : 1 @ 1300
NumberOf
Shares t-
1
PricePer
Share t
PricePer
Share t-1
Inclusion
Factor t PAF t
FXrate
t
FXrate
t-1
InitialSecuri
tyWeight t
(see 1.2.2)
SecurityDaily
Price_Return
USD t (see
1.2.3)
SecurityPrice
contributionTo
IndexUSD
(see 1.2.1)
SecurityDaily
Price_Return
Local t (see
1.2.3)
SecurityPrice
contributionTo
IndexLocal
(see 1.2.1)
Security A 150000 160.00 152.60 0.75 1 1.51 1.50 16.22% 4.15% 0.67% 4.85% 0.79%
Security B 26000 95.00 98.40 1.00 1 1.16 1.15 3.15% -4.29% -0.14% -3.46% -0.11%
Security C 290000 1450.00 1592.60 0.60 1.1034 124.50 125.00 3.14% 0.87% 0.03% 0.46% 0.01%
Security D 360000 265.00 268.00 0.85 1 1.51 1.50 77.48% -1.77% -1.37% -1.12% -0.87%
Total Index 100.00% -0.81% -0.18%
t t-1 daily perf
PriceIndexLevelUSD (see 1.2) 99.462 100.273 -0.81%
PriceIndexLevelLocal (see 1.2) 100.221 100.397 -0.18%
Day 3
Security C has an increase of number of shares follow ing the right issue ex on Day 2
NumberOf
Shares t-
1
PricePer
Share t
PricePer
Share t-1
Inclusion
Factor t PAF t
FXrate
t
FXrate
t-1
InitialSecuri
tyWeight t
(see 1.2.2)
SecurityDaily
Price_Return
USD t (see
1.2.3)
SecurityPrice
contributionTo
IndexUSD
(see 1.2.1)
SecurityDaily
Price_Return
Local t (see
1.2.3)
SecurityPrice
contributionTo
IndexLocal
(see 1.2.1)
Security A 150000 165.00 160.00 0.75 1 1.50 1.51 16.60% 3.81% 0.63% 3.13% 0.52%
Security B 26000 102.00 95.00 1.00 1 1.17 1.16 2.97% 6.45% 0.19% 7.37% 0.22%
Security C 580000 1545.00 1450.00 0.60 1 124.45 124.50 5.64% 6.59% 0.37% 6.55% 0.37%
Security D 360000 266.00 265.00 0.85 1 1.50 1.51 74.79% 1.05% 0.78% 0.38% 0.28%
Total Index 100.00% 1.98% 1.39%
t t-1 daily perf
PriceIndexLevelUSD (see 1.2) 101.430 99.462 1.98%
PriceIndexLevelLocal (see 1.2) 101.614 100.221 1.39%

MSCI.COM | PAGE 15 OF 123 © 2018 MSCI Inc. All rights reserved. Please refer to the disclaimer at the end of this document.
MSCI INDEX CALCULATION METHODOLOGY | JANUARY 2018
1.3 NEXT DAY INITIAL SECURITY WEIGHT
𝐼𝑛𝑖𝑡𝑖𝑎𝑙𝑆𝑒𝑐𝑢𝑟𝑖𝑡𝑦𝑊𝑒𝑖𝑔ℎ𝑡𝑡+1 =
𝐸𝑛𝑑𝑂𝑓𝐷𝑎𝑦𝑁𝑢𝑚𝑏𝑒𝑟𝑂𝑓𝑆ℎ𝑎𝑟𝑒𝑠𝑡 ∗ 𝑃𝑟𝑖𝑐𝑒𝑃𝑒𝑟𝑆ℎ𝑎𝑟𝑒𝑡𝐹𝑋𝑟𝑎𝑡𝑒𝑡
∗ 𝐼𝑛𝑐𝑙𝑢𝑠𝑖𝑜𝑛𝐹𝑎𝑐𝑡𝑜𝑟𝑡+1
∑ (𝐸𝑛𝑑𝑂𝑓𝐷𝑎𝑦𝑁𝑢𝑚𝑏𝑒𝑟𝑂𝑓𝑆ℎ𝑎𝑟𝑒𝑠𝑡 ∗ 𝑃𝑟𝑖𝑐𝑒𝑃𝑒𝑟𝑆ℎ𝑎𝑟𝑒𝑡
𝐹𝑋𝑟𝑎𝑡𝑒𝑡∗ 𝐼𝑛𝑐𝑙𝑢𝑠𝑖𝑜𝑛𝐹𝑎𝑐𝑡𝑜𝑟𝑡+1)𝑠∈𝐼,𝑡+1
∗ 100 =
𝑆𝑒𝑐𝑢𝑟𝑖𝑡𝑦𝐼𝑛𝑖𝑡𝑖𝑎𝑙𝐹𝑢𝑙𝑙𝑀𝑎𝑟𝑘𝑒𝑡𝐶𝑎𝑝𝑈𝑆𝐷𝑡+1 ∗ 𝐼𝑛𝑐𝑙𝑢𝑠𝑖𝑜𝑛𝐹𝑎𝑐𝑡𝑜𝑟𝑡+1
∑ (𝑆𝑒𝑐𝑢𝑟𝑖𝑡𝑦𝐼𝑛𝑖𝑡𝑖𝑎𝑙𝐹𝑢𝑙𝑙𝑀𝑎𝑟𝑘𝑒𝑡𝐶𝑎𝑝𝑈𝑆𝐷𝑡+1 ∗ 𝐼𝑛𝑐𝑙𝑢𝑠𝑖𝑜𝑛𝐹𝑎𝑐𝑡𝑜𝑟𝑡+1)𝑠∈𝐼,𝑡+1
∗ 100 =
𝑆𝑒𝑐𝑢𝑟𝑖𝑡𝑦𝐼𝑛𝑖𝑡𝑖𝑎𝑙𝑀𝑎𝑟𝑘𝑒𝑡𝐶𝑎𝑝𝑈𝑆𝐷𝑡+1𝐼𝑛𝑑𝑒𝑥𝐼𝑛𝑖𝑡𝑖𝑎𝑙𝑀𝑎𝑟𝑘𝑒𝑡𝐶𝑎𝑝𝑈𝑆𝐷𝑡+1
∗ 100
Where:
𝐸𝑛𝑑𝑂𝑓𝐷𝑎𝑦𝑁𝑢𝑚𝑏𝑒𝑟𝑂𝑓𝑆ℎ𝑎𝑟𝑒𝑠𝑡 is the number of shares of security s at the end of day t.
𝑃𝑟𝑖𝑐𝑒𝑃𝑒𝑟𝑆ℎ𝑎𝑟𝑒𝑡 is the price per share of the security s at time t.
𝐼𝑛𝑐𝑙𝑢𝑠𝑖𝑜𝑛𝐹𝑎𝑐𝑡𝑜𝑟𝑡+1 is the inclusion factor of the security s at time t+1. The inclusion
factor can be one or the combination of the following factors: Foreign Inclusion Factor,
Domestic Inclusion Factor, Growth Inclusion Factor, Value Inclusion Factor, Index
Inclusion Factor (*).
𝐹𝑋𝑟𝑎𝑡𝑒𝑡 is the FX rate of the price currency of security s vs USD at time t. It is the value
of 1 USD in foreign currency.
(*) From June 1 2007 to May 31 2008, to calculate the standard or small cap index market
capitalization (except for FM countries and China A), the security market cap should be
multiplied by the Standard or Small Cap Index Inclusion Factor. Additionally, starting
December 1, 2015, to calculate the standard or small cap index market capitalization (except
for China A), the security market cap should be multiplied by the Standard or Small Cap
Index Inclusion Factor.
From September 1 2009 to November 30 2009, to calculate the China A and related indexes
markets capitalization, the China A securities market cap should be multiplied by the
Standard Index Inclusion Factor.
The ‘Standard Index Inclusion Factor’ is solely used for the computation of the MSCI
Standard Indexes, and not for the Large Cap, Mid Cap and Provisional Indexes, as these are
MSCI.COM | PAGE 16 OF 123 © 2018 MSCI Inc. All rights reserved. Please refer to the disclaimer at the end of this document.
MSCI INDEX CALCULATION METHODOLOGY | JANUARY 2018
all constructed using the Global Investable Market Indexes methodology and were not
subject to the transition methodology.
The ‘Small Cap Index Inclusion Factor’ is not used for the computation of the MSCI Emerging
Markets and AC Small Cap Indexes, MSCI Small Cap Value and Growth, MSCI Provisional
Small Cap and MSCI Small Cap Sectors Indexes, as these are all constructed using the Global
Investable Market Indexes methodology and were not subject to the transition
methodology.
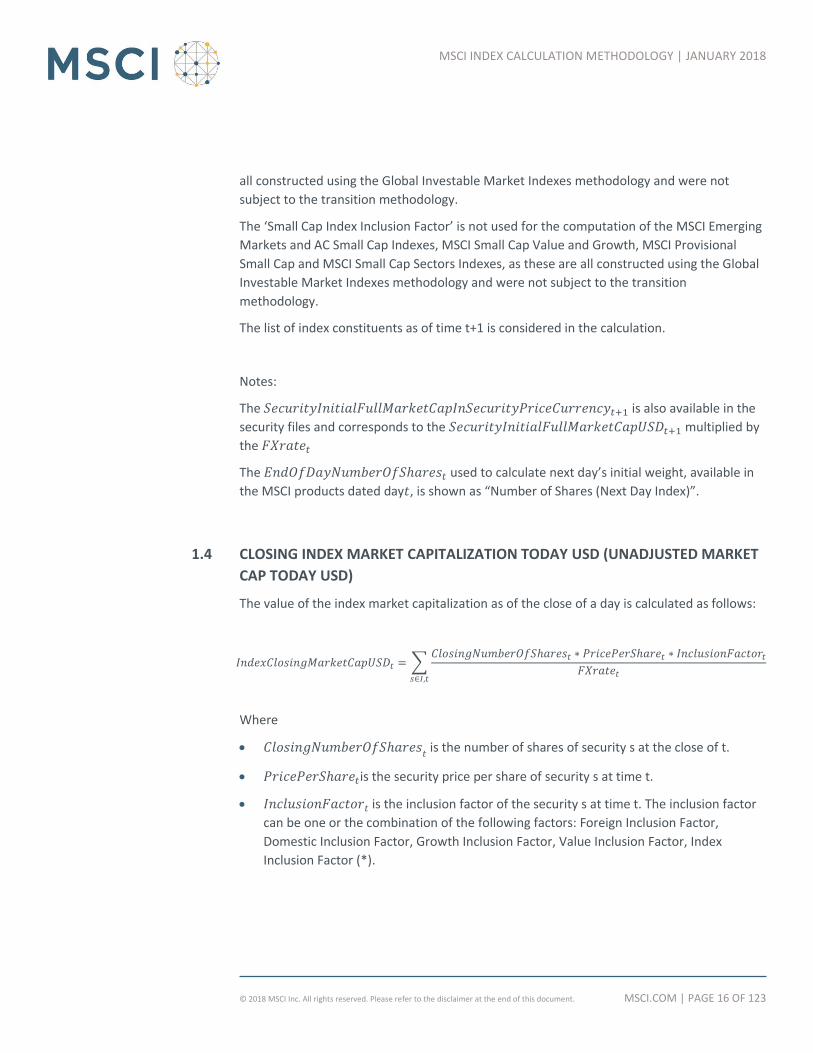
The list of index constituents as of time t+1 is considered in the calculation.
Notes:
The 𝑆𝑒𝑐𝑢𝑟𝑖𝑡𝑦𝐼𝑛𝑖𝑡𝑖𝑎𝑙𝐹𝑢𝑙𝑙𝑀𝑎𝑟𝑘𝑒𝑡𝐶𝑎𝑝𝐼𝑛𝑆𝑒𝑐𝑢𝑟𝑖𝑡𝑦𝑃𝑟𝑖𝑐𝑒𝐶𝑢𝑟𝑟𝑒𝑛𝑐𝑦𝑡+1 is also available in the
security files and corresponds to the 𝑆𝑒𝑐𝑢𝑟𝑖𝑡𝑦𝐼𝑛𝑖𝑡𝑖𝑎𝑙𝐹𝑢𝑙𝑙𝑀𝑎𝑟𝑘𝑒𝑡𝐶𝑎𝑝𝑈𝑆𝐷𝑡+1 multiplied by
the 𝐹𝑋𝑟𝑎𝑡𝑒𝑡
The 𝐸𝑛𝑑𝑂𝑓𝐷𝑎𝑦𝑁𝑢𝑚𝑏𝑒𝑟𝑂𝑓𝑆ℎ𝑎𝑟𝑒𝑠𝑡 used to calculate next day’s initial weight, available in
the MSCI products dated day𝑡, is shown as “Number of Shares (Next Day Index)”.
1.4 CLOSING INDEX MARKET CAPITALIZATION TODAY USD (UNADJUSTED MARKET
CAP TODAY USD)
The value of the index market capitalization as of the close of a day is calculated as follows:
𝐼𝑛𝑑𝑒𝑥𝐶𝑙𝑜𝑠𝑖𝑛𝑔𝑀𝑎𝑟𝑘𝑒𝑡𝐶𝑎𝑝𝑈𝑆𝐷𝑡 = ∑𝐶𝑙𝑜𝑠𝑖𝑛𝑔𝑁𝑢𝑚𝑏𝑒𝑟𝑂𝑓𝑆ℎ𝑎𝑟𝑒𝑠𝑡 ∗ 𝑃𝑟𝑖𝑐𝑒𝑃𝑒𝑟𝑆ℎ𝑎𝑟𝑒𝑡 ∗ 𝐼𝑛𝑐𝑙𝑢𝑠𝑖𝑜𝑛𝐹𝑎𝑐𝑡𝑜𝑟𝑡
𝐹𝑋𝑟𝑎𝑡𝑒𝑡𝑠∈𝐼,𝑡
Where
𝐶𝑙𝑜𝑠𝑖𝑛𝑔𝑁𝑢𝑚𝑏𝑒𝑟𝑂𝑓𝑆ℎ𝑎𝑟𝑒𝑠𝑡 is the number of shares of security s at the close of t.
𝑃𝑟𝑖𝑐𝑒𝑃𝑒𝑟𝑆ℎ𝑎𝑟𝑒𝑡is the security price per share of security s at time t.
𝐼𝑛𝑐𝑙𝑢𝑠𝑖𝑜𝑛𝐹𝑎𝑐𝑡𝑜𝑟𝑡 is the inclusion factor of the security s at time t. The inclusion factor
can be one or the combination of the following factors: Foreign Inclusion Factor,
Domestic Inclusion Factor, Growth Inclusion Factor, Value Inclusion Factor, Index
Inclusion Factor (*).

MSCI.COM | PAGE 17 OF 123 © 2018 MSCI Inc. All rights reserved. Please refer to the disclaimer at the end of this document.
MSCI INDEX CALCULATION METHODOLOGY | JANUARY 2018
𝐹𝑋𝑟𝑎𝑡𝑒𝑡 is the FX rate of the price currency of security s vs USD at time t. It is the value
of 1 USD in foreign currency.
(*) From June 1 2007 to May 31 2008, to calculate the standard or small cap index market
capitalization (except for FM countries and China A), the security market cap should be
multiplied by the Standard or Small Cap Index Inclusion Factor. Additionally, starting
December 1, 2015, to calculate the standard or small cap index market capitalization (except
for China A), the security market cap should be multiplied by the Standard or Small Cap
Index Inclusion Factor.
From September 1 2009 to November 30 2009, to calculate the China A and related indexes
markets capitalization, the China A securities market cap should be multiplied by the
Standard Index Inclusion Factor.
The ‘Standard Index Inclusion Factor’ is solely used for the computation of the MSCI
Standard Indexes, and not for the Large Cap, Mid Cap and Provisional Indexes, as these are
all constructed using the Global Investable Market Indexes methodology and were not
subject to the transition methodology.
The ‘Small Cap Index Inclusion Factor’ is not used for the computation of the MSCI Emerging
Markets and AC Small Cap Indexes, MSCI Small Cap Value and Growth, MSCI Provisional
Small Cap and MSCI Small Cap Sectors Indexes, as these are all constructed using the Global
Investable Market Indexes methodology and were not subject to the transition
methodology.
The list of index constituents as of time t should be considered in the calculation.
Effectively this figure represents the shares at the close on t, and does not include any of the
effects of corporate actions due at the open of the market the next day.
The closing market capitalization uses today’s price, t, as it represents the market
capitalization at the close of the calculation day t.
1.5 SECURITY INDEX OF PRICE IN LOCAL
The security Index of Price is distributed in MSCI daily and monthly security products [It
represents the price return from period to period by utilizing the concept of an index of
performance with an arbitrary base value. The index of price is fully adjusted for capital
changes and is expressed in local currency.
𝑆𝑒𝑐𝑢𝑟𝑖𝑡𝑦𝑃𝑟𝑖𝑐𝑒𝐼𝑛𝑑𝑒𝑥𝐿𝑒𝑣𝑒𝑙𝑡 = 𝑆𝑒𝑐𝑢𝑟𝑖𝑡𝑦𝑃𝑟𝑖𝑐𝑒𝐼𝑛𝑑𝑒𝑥𝐿𝑒𝑣𝑒𝑙𝑡−1 ∗𝑆𝑒𝑐𝑢𝑟𝑖𝑡𝑦𝐴𝑑𝑗𝑢𝑠𝑡𝑒𝑑𝑀𝑎𝑟𝑘𝑒𝑡𝐶𝑎𝑝𝐹𝑜𝑟𝐿𝑜𝑐𝑎𝑙𝑡
𝑆𝑒𝑐𝑢𝑟𝑖𝑡𝑦𝐼𝑛𝑖𝑡𝑖𝑎𝑙𝑀𝑎𝑟𝑘𝑒𝑡𝐶𝑎𝑝𝑈𝑆𝐷𝑡

MSCI.COM | PAGE 18 OF 123 © 2018 MSCI Inc. All rights reserved. Please refer to the disclaimer at the end of this document.
MSCI INDEX CALCULATION METHODOLOGY | JANUARY 2018
𝑆𝑒𝑐𝑢𝑟𝑖𝑡𝑦𝐴𝑑𝑗𝑢𝑠𝑡𝑒𝑑𝑀𝑎𝑟𝑘𝑒𝑡𝐶𝑎𝑝𝐹𝑜𝑟𝐿𝑜𝑐𝑎𝑙𝑡 =𝐸𝑛𝑑𝑂𝑓𝐷𝑎𝑦𝑁𝑢𝑚𝑏𝑒𝑟𝑂𝑓𝑆ℎ𝑎𝑟𝑒𝑠𝑡−1 ∗ 𝑃𝑟𝑖𝑐𝑒𝑃𝑒𝑟𝑆ℎ𝑎𝑟𝑒𝑡 ∗ 𝐼𝑛𝑐𝑙𝑢𝑠𝑖𝑜𝑛𝐹𝑎𝑐𝑡𝑜𝑟𝑡 ∗ 𝑃𝐴𝐹𝑡
𝐹𝑋𝑟𝑎𝑡𝑒𝑡−1∗
𝐼𝐶𝐼𝑡𝐼𝐶𝐼𝑡−1
𝑆𝑒𝑐𝑢𝑟𝑖𝑡𝑦𝐼𝑛𝑖𝑡𝑖𝑎𝑙𝑀𝑎𝑟𝑘𝑒𝑡𝐶𝑎𝑝𝑈𝑆𝐷𝑡 =𝐸𝑛𝑑𝑂𝑓𝐷𝑎𝑦𝑁𝑢𝑚𝑏𝑒𝑟𝑂𝑓𝑆ℎ𝑎𝑟𝑒𝑠𝑡−1 ∗ 𝑃𝑟𝑖𝑐𝑒𝑃𝑒𝑟𝑆ℎ𝑎𝑟𝑒𝑡−1 ∗ 𝐼𝑛𝑐𝑙𝑢𝑠𝑖𝑜𝑛𝐹𝑎𝑐𝑡𝑜𝑟𝑡
𝐹𝑋𝑟𝑎𝑡𝑒𝑡−1
Where:
𝑆𝑒𝑐𝑢𝑟𝑖𝑡𝑦𝑃𝑟𝑖𝑐𝑒𝐼𝑛𝑑𝑒𝑥𝐿𝑒𝑣𝑒𝑙𝑡−1
is Security Price Index level at time t-1
𝑆𝑒𝑐𝑢𝑟𝑖𝑡𝑦𝐴𝑑𝑗𝑢𝑠𝑡𝑒𝑑𝑀𝑎𝑟𝑘𝑒𝑡𝐶𝑎𝑝𝐹𝑜𝑟𝐿𝑜𝑐𝑎𝑙𝑡 is the Adjusted Market Capitalization of
security s in USD converted using FX rate as of t-1
𝑆𝑒𝑐𝑢𝑟𝑖𝑡𝑦𝐼𝑛𝑖𝑡𝑖𝑎𝑙𝑀𝑎𝑟𝑘𝑒𝑡𝐶𝑎𝑝𝑈𝑆𝐷𝑡 is the Initial Market Capitalization of security s in USD
at time t
𝐸𝑛𝑑𝑂𝑓𝐷𝑎𝑦𝑁𝑢𝑚𝑏𝑒𝑟𝑂𝑓𝑆ℎ𝑎𝑟𝑒𝑠𝑡−1
is the number of shares of security s at the end of
day t-1.
𝑃𝑟𝑖𝑐𝑒𝑃𝑒𝑟𝑆ℎ𝑎𝑟𝑒𝑡 is the price per share of security s at time t.
𝑃𝑟𝑖𝑐𝑒𝑃𝑒𝑟𝑆ℎ𝑎𝑟𝑒𝑡−1 is the price per share of security s at time t-1.
𝐼𝑛𝑐𝑙𝑢𝑠𝑖𝑜𝑛𝐹𝑎𝑐𝑡𝑜𝑟𝑡 is the inclusion factor of security s at time t. The inclusion factor can
be one or the combination of the following factors: Foreign Inclusion Factor, Domestic
Inclusion Factor Growth Inclusion Factor, Value Inclusion Factor, Index Inclusion Factor
(*).
𝑃𝐴𝐹𝑡 is the Price Adjustment Factor of security s at time t.
𝐹𝑋𝑟𝑎𝑡𝑒𝑡−1 is the FX rate of the price currency of security s vs USD at time t-1. It is the
value of 1 USD in foreign currency.
𝐼𝐶𝐼𝑡 is the Internal Currency Index of price currency at time t. The ICI is different than 1
when a country changes the internal value of its currency (e.g. from Turkish Lira to New
Turkish Lira – ICI = 1,000,000).
𝐼𝐶𝐼𝑡−1 is the Internal Currency Index of price currency at time t-1.
(*) From June 1 2007 to May 31 2008, to calculate the standard or small cap index market
capitalization (except for FM countries and China A), the security market cap should be
multiplied by the Standard or Small Cap Index Inclusion Factor. Additionally, starting
December 1, 2015, to calculate the standard or small cap index market capitalization (except
MSCI.COM | PAGE 19 OF 123 © 2018 MSCI Inc. All rights reserved. Please refer to the disclaimer at the end of this document.
MSCI INDEX CALCULATION METHODOLOGY | JANUARY 2018
for China A), the security market cap should be multiplied by the Standard or Small Cap
Index Inclusion Factor.
From September 1 2009 to November 30 2009, to calculate the China A and related indexes
markets capitalization, the China A securities market cap should be multiplied by the
Standard Index Inclusion Factor.
The ‘Standard Index Inclusion Factor’ is solely used for the computation of the MSCI
Standard Indexes, and not for the Large Cap, Mid Cap and Provisional Indexes, as these are
all constructed using the Global Investable Market Indexes methodology and were not
subject to the transition methodology.
The ‘Small Cap Index Inclusion Factor’ is not used for the computation of the MSCI Emerging
Markets and AC Small Cap Indexes, MSCI Small Cap Value and Growth, MSCI Provisional
Small Cap and MSCI Small Cap Sectors Indexes, as these are all constructed using the Global
Investable Market Indexes methodology and were not subject to the transition
methodology.
1.6 NOTE ON INDEX CALCULATION IN LOCAL CURRENCY
The MSCI Country and Regional Indexes are calculated in local currency as well as in USD.
The concept of a “local currency” calculation excludes the impact of currency fluctuations.
Note that for a country index, the local currency index will not be the same as an index
calculated with the official currency of that country, if there is more than one currency of
listing.
All currencies of listing are considered in the index calculation in local currency where
current pricest and previous day pricest-1 are converted into USD using the same exchange
rate (exchange ratet-1) in the numerator and denominator. As a consequence, the FX factor
drops out of the equation.
The USD calculation includes exchange rates at t and t-1. Therefore, the local currency
calculation only represents the price appreciation or depreciation of the securities, whereas
the USD calculation also accounts for the performance of the currency (or currencies)
relative to the USD.
1.7 CONVERSION OF INDEXES INTO ANOTHER CURRENCY
An index can be calculated into any currency by converting the index in USD into the
selected currency using the formula below.
If the base date of the index is prior to the start date of the currency, the indexes should be
rebased and converted using the following formula:

MSCI.COM | PAGE 20 OF 123 © 2018 MSCI Inc. All rights reserved. Please refer to the disclaimer at the end of this document.
MSCI INDEX CALCULATION METHODOLOGY | JANUARY 2018
𝐼𝑛𝑑𝑒𝑥𝐿𝑒𝑣𝑒𝑙𝑖𝑛𝐶𝑢𝑟𝑟𝑒𝑛𝑐𝑦𝑡 = 100 ∗𝐼𝑛𝑑𝑒𝑥𝐿𝑒𝑣𝑒𝑙𝑖𝑛𝑈𝑆𝐷𝑡
𝐼𝑛𝑑𝑒𝑥𝐿𝑒𝑣𝑒𝑙𝑖𝑛𝑈𝑆𝐷𝑐𝑢𝑟𝑟𝑒𝑛𝑐𝑦_𝑏𝑎𝑠𝑒_𝑑𝑎𝑡𝑒∗
𝐹𝑋𝑟𝑎𝑡𝑒𝑡𝐹𝑋𝑟𝑎𝑡𝑒𝑐𝑢𝑟𝑟𝑒𝑛𝑐𝑦_𝑏𝑎𝑠𝑒_𝑑𝑎𝑡𝑒
Note that 100 in the formula is the base value. This base value can be different than 100
(e.g. 1000 depending on the indexes).
If the base date of the index is equal or posterior to the start date of the currency, the
indexes should be converted only, using the following formula:
𝐼𝑛𝑑𝑒𝑥𝐿𝑒𝑣𝑒𝑙𝑖𝑛𝐶𝑢𝑟𝑟𝑒𝑛𝑐𝑦𝑡 = 𝐼𝑛𝑑𝑒𝑥𝐿𝑒𝑣𝑒𝑙𝑖𝑛𝑈𝑆𝐷𝑡 ∗𝐹𝑋𝑟𝑎𝑡𝑒𝑡
𝐹𝑋𝑟𝑎𝑡𝑒𝑖𝑛𝑑𝑒𝑥_𝑏𝑎𝑠𝑒_𝑑𝑎𝑡𝑒
Example:
Calculation of the The World Index in EUR as of October 20, 1999:
Note that the start date of EUR is 31-Dec-1998
The World Index in USD as of 31-Dec-98 = 1,149.951577
The World Index as of 20- Oct- 99 = 1,224.048387
FxRate EUR vs USD as of 31-Dec- 98 = 0.8516074
FxRate EUR vs USD as of 20-Oct-99 = 0.9279451
𝑊𝑜𝑟𝑙𝑑𝐼𝑛𝑑𝑒𝑥𝑖𝑛𝐸𝑈𝑅10/20/99 = 100 ∗𝑊𝑜𝑟𝑙𝑑𝐼𝑛𝑑𝑒𝑥𝑖𝑛𝑈𝑆𝐷10/20/99
𝑊𝑜𝑟𝑙𝑑𝐼𝑛𝑑𝑒𝑥𝑖𝑛𝑈𝑆𝐷31/12/98∗𝐸𝑈𝑅𝑣𝑠𝑈𝑆𝐷𝑅𝑎𝑡𝑒10/20/99
𝐸𝑈𝑅𝑣𝑠𝑈𝑆𝐷𝑅𝑎𝑡𝑒12/31/98=
100 ∗1224.048387
1149.951577∗0.9279451
0.8516074= 115.985

MSCI.COM | PAGE 21 OF 123 © 2018 MSCI Inc. All rights reserved. Please refer to the disclaimer at the end of this document.
MSCI INDEX CALCULATION METHODOLOGY | JANUARY 2018
2 MSCI DAILY TOTAL RETURN (DTR) INDEX METHODOLOGY
Total return indexes measure the market performance, including price performance and
income from regular cash distributions (cash dividend payments or capital repayments).
Regular cash distributions paid out of share capital or capital contribution reserves are
treated in the same manner as regular cash dividends paid out of retained earnings. This
income is reinvested in the index and thus makes up part of the total index performance.
MSCI’s Daily Total Return (DTR) methodology reinvests regular cash distributions in indexes
on the ex-date of such distributions. Regular cash distributions are not considered in price
indexes, except for special dividends and capital repayments deemed extraordinary in
certain circumstances described below.
The standard Daily Total Return (DTR) Indexes are calculated and distributed on a daily basis.
The indexes are available in USD and local currency (no currency impact), with gross and net
total return.
2.1 CALCULATION METHODOLOGY
𝐷𝑇𝑅𝐼𝑛𝑑𝑒𝑥𝐿𝑒𝑣𝑒𝑙𝑈𝑆𝐷𝑡 =
𝐷𝑇𝑅𝐼𝑛𝑑𝑒𝑥𝐿𝑒𝑣𝑒𝑙𝑈𝑆𝐷𝑡−1 ∗(𝐼𝑛𝑑𝑒𝑥𝐴𝑑𝑗𝑢𝑠𝑡𝑒𝑑𝑀𝑎𝑟𝑘𝑒𝑡𝐶𝑎𝑝𝑈𝑆𝐷𝑡 + 𝐼𝑛𝑑𝑒𝑥𝐷𝑖𝑣𝑖𝑑𝑒𝑛𝑑𝐼𝑚𝑝𝑎𝑐𝑡𝑈𝑆𝐷𝑡)
𝐼𝑛𝑑𝑒𝑥𝐼𝑛𝑖𝑡𝑖𝑎𝑙𝑀𝑎𝑟𝑘𝑒𝑡𝐶𝑎𝑝𝑈𝑆𝐷𝑡
𝐷𝑇𝑅𝐼𝑛𝑑𝑒𝑥𝐿𝑒𝑣𝑒𝑙𝐿𝑜𝑐𝑎𝑙𝑡 =
𝐷𝑇𝑅𝐼𝑛𝑑𝑒𝑥𝐿𝑒𝑣𝑒𝑙𝐿𝑜𝑐𝑎𝑙𝑡−1 ∗(𝐼𝑛𝑑𝑒𝑥𝐴𝑑𝑗𝑢𝑠𝑡𝑒𝑑𝑀𝑎𝑟𝑘𝑒𝑡𝐶𝑎𝑝𝐹𝑜𝑟𝐿𝑜𝑐𝑎𝑙𝑡 + 𝐼𝑛𝑑𝑒𝑥𝐷𝑖𝑣𝑖𝑑𝑒𝑛𝑑𝐼𝑚𝑝𝑎𝑐𝑡𝐹𝑜𝑟𝐿𝑜𝑐𝑎𝑙𝑡)
𝐼𝑛𝑑𝑒𝑥𝐼𝑛𝑖𝑡𝑖𝑎𝑙𝑀𝑎𝑟𝑘𝑒𝑡𝐶𝑎𝑝𝑈𝑆𝐷𝑡
Where:
𝐷𝑇𝑅𝐼𝑛𝑑𝑒𝑥𝐿𝑒𝑣𝑒𝑙𝑈𝑆𝐷𝑡−1 is the Daily Total Return index level in USD at time t-1
𝐼𝑛𝑑𝑒𝑥𝐷𝑖𝑣𝑖𝑑𝑒𝑛𝑑𝐼𝑚𝑝𝑎𝑐𝑡𝑈𝑆𝐷𝑡 is the gross or net amount of dividends in USD to be
reinvested in the index in USD at time t
𝐼𝑛𝑑𝑒𝑥𝐷𝑖𝑣𝑖𝑑𝑒𝑛𝑑𝐼𝑚𝑝𝑎𝑐𝑡𝐹𝑜𝑟𝐿𝑜𝑐𝑎𝑙𝑡 is the gross or net amount of dividend in USD
converted using FX rate as of t-1 to be reinvested in the local currency index at time t
𝐷𝑇𝑅𝐼𝑛𝑑𝑒𝑥𝐿𝑒𝑣𝑒𝑙𝐿𝑜𝑐𝑎𝑙𝑡−1 the Daily Total Return index level in local currency at time t-1

MSCI.COM | PAGE 22 OF 123 © 2018 MSCI Inc. All rights reserved. Please refer to the disclaimer at the end of this document.
MSCI INDEX CALCULATION METHODOLOGY | JANUARY 2018
2.1.1 DIVIDEND IMPACT
𝐼𝑛𝑑𝑒𝑥𝐷𝑖𝑣𝑖𝑑𝑒𝑛𝑑𝐼𝑚𝑝𝑎𝑐𝑡𝑈𝑆𝐷𝑡 =
∑𝐸𝑛𝑑𝑂𝑓𝐷𝑎𝑦𝑁𝑢𝑚𝑏𝑒𝑟𝑂𝑓𝑆ℎ𝑎𝑟𝑒𝑠𝑒𝑥−𝑑𝑎𝑡𝑒−1 ∗ 𝐷𝑖𝑣𝑖𝑑𝑒𝑛𝑑𝑃𝑒𝑟𝑆ℎ𝑎𝑟𝑒𝑡 ∗ 𝐼𝑛𝑐𝑙𝑢𝑠𝑖𝑜𝑛𝐹𝑎𝑐𝑡𝑜𝑟𝑡
𝐹𝑋𝑟𝑎𝑡𝑒𝑡𝑠∈𝐼,𝑡
𝐼𝑛𝑑𝑒𝑥𝐷𝑖𝑣𝑖𝑑𝑒𝑛𝑑𝐼𝑚𝑝𝑎𝑐𝑡𝐹𝑜𝑟𝐿𝑜𝑐𝑎𝑙𝑡 =
∑(𝐸𝑛𝑑𝑂𝑓𝐷𝑎𝑦𝑁𝑢𝑚𝑏𝑒𝑟𝑂𝑓𝑆ℎ𝑎𝑟𝑒𝑠𝑒𝑥−𝑑𝑎𝑡𝑒−1 ∗ 𝐷𝑖𝑣𝑖𝑑𝑒𝑛𝑑𝑃𝑒𝑟𝑆ℎ𝑎𝑟𝑒𝑡 ∗ 𝐼𝑛𝑐𝑙𝑢𝑠𝑖𝑜𝑛𝐹𝑎𝑐𝑡𝑜𝑟𝑡
𝐹𝑥𝑟𝑎𝑡𝑒𝑡−1𝑠∈𝐼,𝑡
∗𝐼𝐶𝐼𝑡𝐼𝐶𝐼𝑡−1
)
Where:
𝐸𝑛𝑑𝑂𝑓𝐷𝑎𝑦𝑁𝑢𝑚𝑏𝑒𝑟𝑂𝑓𝑆ℎ𝑎𝑟𝑒𝑠𝑒𝑥−𝑑𝑎𝑡𝑒−1
is the number of shares of the security s at the
end of the dividend ex-date-1.
𝐷𝑖𝑣𝑖𝑑𝑒𝑛𝑑𝑃𝑒𝑟𝑆ℎ𝑎𝑟𝑒𝑡 is the gross or net dividend per share expressed in the same
currency unit as the price per share of the security s to be reinvested at time t.
2.1.2 DTR INDEX LEVEL FROM SECURITY INFORMATION (SECURITY DTR)
Another way to calculate a DTR index would be to use the security initial weight and security
total return:
𝐷𝑇𝑅𝐼𝑛𝑑𝑒𝑥𝐿𝑒𝑣𝑒𝑙𝑈𝑆𝐷𝑡 = 𝐷𝑇𝑅𝐼𝑛𝑑𝑒𝑥𝐿𝑒𝑣𝑒𝑙𝑈𝑆𝐷𝑡−1 ∗ (1 + ∑ 𝑆𝑒𝑐𝑢𝑟𝑖𝑡𝑦𝑇𝑜𝑡𝑎𝑙𝑅𝑒𝑡𝑢𝑟𝑛𝐶𝑜𝑛𝑡𝑟𝑖𝑏𝑢𝑡𝑖𝑜𝑛𝑇𝑜𝐼𝑛𝑑𝑒𝑥𝑈𝑆𝐷𝑡)
𝑠∈𝐼,𝑡
𝐷𝑇𝑅𝐼𝑛𝑑𝑒𝑥𝐿𝑒𝑣𝑒𝑙𝐿𝑜𝑐𝑎𝑙𝑡 = 𝐷𝑇𝑅𝐼𝑛𝑑𝑒𝑥𝐿𝑒𝑣𝑒𝑙𝐿𝑜𝑐𝑎𝑙𝑡−1 ∗ (1 + ∑ 𝑆𝑒𝑐𝑢𝑟𝑖𝑡𝑦𝑇𝑜𝑡𝑎𝑙𝑅𝑒𝑡𝑢𝑟𝑛𝐶𝑜𝑛𝑡𝑟𝑖𝑏𝑢𝑡𝑖𝑜𝑛𝑇𝑜𝐼𝑛𝑑𝑒𝑥𝐿𝑜𝑐𝑎𝑙𝑡)
𝑠∈𝐼,𝑡
MSCI.COM | PAGE 23 OF 123 © 2018 MSCI Inc. All rights reserved. Please refer to the disclaimer at the end of this document.
MSCI INDEX CALCULATION METHODOLOGY | JANUARY 2018
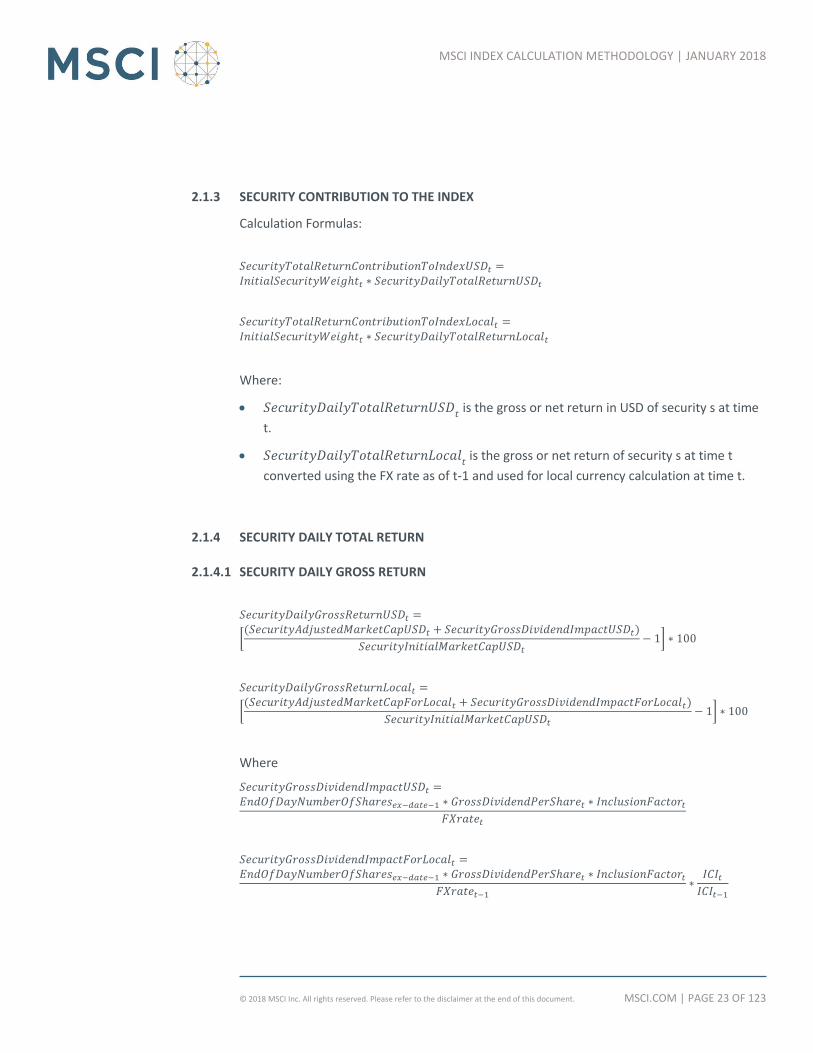
2.1.3 SECURITY CONTRIBUTION TO THE INDEX
Calculation Formulas:
𝑆𝑒𝑐𝑢𝑟𝑖𝑡𝑦𝑇𝑜𝑡𝑎𝑙𝑅𝑒𝑡𝑢𝑟𝑛𝐶𝑜𝑛𝑡𝑟𝑖𝑏𝑢𝑡𝑖𝑜𝑛𝑇𝑜𝐼𝑛𝑑𝑒𝑥𝑈𝑆𝐷𝑡 =𝐼𝑛𝑖𝑡𝑖𝑎𝑙𝑆𝑒𝑐𝑢𝑟𝑖𝑡𝑦𝑊𝑒𝑖𝑔ℎ𝑡𝑡 ∗ 𝑆𝑒𝑐𝑢𝑟𝑖𝑡𝑦𝐷𝑎𝑖𝑙𝑦𝑇𝑜𝑡𝑎𝑙𝑅𝑒𝑡𝑢𝑟𝑛𝑈𝑆𝐷𝑡
𝑆𝑒𝑐𝑢𝑟𝑖𝑡𝑦𝑇𝑜𝑡𝑎𝑙𝑅𝑒𝑡𝑢𝑟𝑛𝐶𝑜𝑛𝑡𝑟𝑖𝑏𝑢𝑡𝑖𝑜𝑛𝑇𝑜𝐼𝑛𝑑𝑒𝑥𝐿𝑜𝑐𝑎𝑙𝑡 =𝐼𝑛𝑖𝑡𝑖𝑎𝑙𝑆𝑒𝑐𝑢𝑟𝑖𝑡𝑦𝑊𝑒𝑖𝑔ℎ𝑡𝑡 ∗ 𝑆𝑒𝑐𝑢𝑟𝑖𝑡𝑦𝐷𝑎𝑖𝑙𝑦𝑇𝑜𝑡𝑎𝑙𝑅𝑒𝑡𝑢𝑟𝑛𝐿𝑜𝑐𝑎𝑙𝑡
Where:
𝑆𝑒𝑐𝑢𝑟𝑖𝑡𝑦𝐷𝑎𝑖𝑙𝑦𝑇𝑜𝑡𝑎𝑙𝑅𝑒𝑡𝑢𝑟𝑛𝑈𝑆𝐷𝑡 is the gross or net return in USD of security s at time
t.
𝑆𝑒𝑐𝑢𝑟𝑖𝑡𝑦𝐷𝑎𝑖𝑙𝑦𝑇𝑜𝑡𝑎𝑙𝑅𝑒𝑡𝑢𝑟𝑛𝐿𝑜𝑐𝑎𝑙𝑡 is the gross or net return of security s at time t
converted using the FX rate as of t-1 and used for local currency calculation at time t.
2.1.4 SECURITY DAILY TOTAL RETURN
2.1.4.1 SECURITY DAILY GROSS RETURN
𝑆𝑒𝑐𝑢𝑟𝑖𝑡𝑦𝐷𝑎𝑖𝑙𝑦𝐺𝑟𝑜𝑠𝑠𝑅𝑒𝑡𝑢𝑟𝑛𝑈𝑆𝐷𝑡 =
[(𝑆𝑒𝑐𝑢𝑟𝑖𝑡𝑦𝐴𝑑𝑗𝑢𝑠𝑡𝑒𝑑𝑀𝑎𝑟𝑘𝑒𝑡𝐶𝑎𝑝𝑈𝑆𝐷𝑡 + 𝑆𝑒𝑐𝑢𝑟𝑖𝑡𝑦𝐺𝑟𝑜𝑠𝑠𝐷𝑖𝑣𝑖𝑑𝑒𝑛𝑑𝐼𝑚𝑝𝑎𝑐𝑡𝑈𝑆𝐷𝑡)
𝑆𝑒𝑐𝑢𝑟𝑖𝑡𝑦𝐼𝑛𝑖𝑡𝑖𝑎𝑙𝑀𝑎𝑟𝑘𝑒𝑡𝐶𝑎𝑝𝑈𝑆𝐷𝑡− 1] ∗ 100
𝑆𝑒𝑐𝑢𝑟𝑖𝑡𝑦𝐷𝑎𝑖𝑙𝑦𝐺𝑟𝑜𝑠𝑠𝑅𝑒𝑡𝑢𝑟𝑛𝐿𝑜𝑐𝑎𝑙𝑡 =
[(𝑆𝑒𝑐𝑢𝑟𝑖𝑡𝑦𝐴𝑑𝑗𝑢𝑠𝑡𝑒𝑑𝑀𝑎𝑟𝑘𝑒𝑡𝐶𝑎𝑝𝐹𝑜𝑟𝐿𝑜𝑐𝑎𝑙𝑡 + 𝑆𝑒𝑐𝑢𝑟𝑖𝑡𝑦𝐺𝑟𝑜𝑠𝑠𝐷𝑖𝑣𝑖𝑑𝑒𝑛𝑑𝐼𝑚𝑝𝑎𝑐𝑡𝐹𝑜𝑟𝐿𝑜𝑐𝑎𝑙𝑡)
𝑆𝑒𝑐𝑢𝑟𝑖𝑡𝑦𝐼𝑛𝑖𝑡𝑖𝑎𝑙𝑀𝑎𝑟𝑘𝑒𝑡𝐶𝑎𝑝𝑈𝑆𝐷𝑡− 1] ∗ 100
Where
𝑆𝑒𝑐𝑢𝑟𝑖𝑡𝑦𝐺𝑟𝑜𝑠𝑠𝐷𝑖𝑣𝑖𝑑𝑒𝑛𝑑𝐼𝑚𝑝𝑎𝑐𝑡𝑈𝑆𝐷𝑡 =𝐸𝑛𝑑𝑂𝑓𝐷𝑎𝑦𝑁𝑢𝑚𝑏𝑒𝑟𝑂𝑓𝑆ℎ𝑎𝑟𝑒𝑠𝑒𝑥−𝑑𝑎𝑡𝑒−1 ∗ 𝐺𝑟𝑜𝑠𝑠𝐷𝑖𝑣𝑖𝑑𝑒𝑛𝑑𝑃𝑒𝑟𝑆ℎ𝑎𝑟𝑒𝑡 ∗ 𝐼𝑛𝑐𝑙𝑢𝑠𝑖𝑜𝑛𝐹𝑎𝑐𝑡𝑜𝑟𝑡
𝐹𝑋𝑟𝑎𝑡𝑒𝑡
𝑆𝑒𝑐𝑢𝑟𝑖𝑡𝑦𝐺𝑟𝑜𝑠𝑠𝐷𝑖𝑣𝑖𝑑𝑒𝑛𝑑𝐼𝑚𝑝𝑎𝑐𝑡𝐹𝑜𝑟𝐿𝑜𝑐𝑎𝑙𝑡 =𝐸𝑛𝑑𝑂𝑓𝐷𝑎𝑦𝑁𝑢𝑚𝑏𝑒𝑟𝑂𝑓𝑆ℎ𝑎𝑟𝑒𝑠𝑒𝑥−𝑑𝑎𝑡𝑒−1 ∗ 𝐺𝑟𝑜𝑠𝑠𝐷𝑖𝑣𝑖𝑑𝑒𝑛𝑑𝑃𝑒𝑟𝑆ℎ𝑎𝑟𝑒𝑡 ∗ 𝐼𝑛𝑐𝑙𝑢𝑠𝑖𝑜𝑛𝐹𝑎𝑐𝑡𝑜𝑟𝑡
𝐹𝑋𝑟𝑎𝑡𝑒𝑡−1∗
𝐼𝐶𝐼𝑡𝐼𝐶𝐼𝑡−1

MSCI.COM | PAGE 24 OF 123 © 2018 MSCI Inc. All rights reserved. Please refer to the disclaimer at the end of this document.
MSCI INDEX CALCULATION METHODOLOGY | JANUARY 2018
Where
𝑆𝑒𝑐𝑢𝑟𝑖𝑡𝑦𝐴𝑑𝑗𝑢𝑠𝑡𝑒𝑑𝑀𝑎𝑟𝑘𝑒𝑡𝐶𝑎𝑝𝐹𝑜𝑟𝐿𝑜𝑐𝑎𝑙𝑡 is the Adjusted Market Capitalization of
security s in USD converted using FX rate as of t-1
𝑆𝑒𝑐𝑢𝑟𝑖𝑡𝑦𝐴𝑑𝑗𝑢𝑠𝑡𝑒𝑑𝑀𝑎𝑟𝑘𝑒𝑡𝐶𝑎𝑝𝑈𝑆𝐷𝑡 is the Adjusted Market Capitalization of security s
in USD converted using FX rate as of t
𝑆𝑒𝑐𝑢𝑟𝑖𝑡𝑦𝐼𝑛𝑖𝑡𝑖𝑎𝑙𝑀𝑎𝑟𝑘𝑒𝑡𝐶𝑎𝑝𝑈𝑆𝐷𝑡 is the Initial Market Capitalization of security s in USD
at time t
𝐼𝑛𝑐𝑙𝑢𝑠𝑖𝑜𝑛𝐹𝑎𝑐𝑡𝑜𝑟𝑡 is the inclusion factor of the security s at time t. The inclusion factor
can be one or the combination of the following factors: Foreign Inclusion Factor,
Domestic Inclusion Factor, Growth Inclusion Factor, Value Inclusion Factor, Index
Inclusion Factor (*).
𝐹𝑋𝑟𝑎𝑡𝑒𝑡 is the FX rate of the price currency of security s vs USD at time t. It is the value
of 1 USD in foreign currency.
𝐹𝑋𝑟𝑎𝑡𝑒𝑡−1 is the FX rate of the price currency of security s vs USD at time t-1. It is the
value of 1 USD in foreign currency.
𝐸𝑛𝑑𝑂𝑓𝐷𝑎𝑦𝑁𝑢𝑚𝑏𝑒𝑟𝑂𝑓𝑆ℎ𝑎𝑟𝑒𝑠𝑒𝑥−𝑑𝑎𝑡𝑒−1
is the number of shares of security s at the end
of the dividend ex-date-1.
𝐺𝑟𝑜𝑠𝑠𝐷𝑖𝑣𝑖𝑑𝑒𝑛𝑑𝑃𝑒𝑟𝑆ℎ𝑎𝑟𝑒𝑡 is the gross dividend per share expressed in the same
currency unit as the price per share of the security s to be reinvested at time t.
𝐼𝐶𝐼𝑡 is the Internal Currency Index of price currency at time t. The ICI is different than 1
when a country changes the internal value of its currency (e.g. from Turkish Lira to New
Turkish Lira – ICI = 1,000,000).
𝐼𝐶𝐼𝑡−1 is the Internal Currency Index of price currency at time t-1.
(*) From June 1 2007 to May 31 2008, to calculate the standard or small cap index market
capitalization (except for FM countries and China A), the security market cap should be
multiplied by the Standard or Small Cap Index Inclusion Factor. Additionally, starting
December 1, 2015, to calculate the standard or small cap index market capitalization (except
for China A), the security market cap should be multiplied by the Standard or Small Cap
Index Inclusion Factor.
From September 1 2009 to November 30 2009, to calculate the China A and related indexes
markets capitalization, the China A securities market cap should be multiplied by the
Standard Index Inclusion Factor.

MSCI.COM | PAGE 25 OF 123 © 2018 MSCI Inc. All rights reserved. Please refer to the disclaimer at the end of this document.
MSCI INDEX CALCULATION METHODOLOGY | JANUARY 2018
The ‘Standard Index Inclusion Factor’ is solely used for the computation of the MSCI
Standard Indexes, and not for the Large Cap, Mid Cap and Provisional Indexes, as these are
all constructed using the Global Investable Market Indexes methodology and were not
subject to the transition methodology.
The ‘Small Cap Index Inclusion Factor’ is not used for the computation of the MSCI Emerging
Markets and AC Small Cap Indexes, MSCI Small Cap Value and Growth, MSCI Provisional
Small Cap and MSCI Small Cap Sectors Indexes, as these are all constructed using the Global
Investable Market Indexes methodology and were not subject to the transition
methodology.
2.1.4.2 SECURITY DAILY NET RETURN
𝑆𝑒𝑐𝑢𝑟𝑖𝑡𝑦𝐷𝑎𝑖𝑙𝑦𝑁𝑒𝑡𝑅𝑒𝑡𝑢𝑟𝑛𝑈𝑆𝐷𝑡 =
[(𝑆𝑒𝑐𝑢𝑟𝑖𝑡𝑦𝐴𝑑𝑗𝑢𝑠𝑡𝑒𝑑𝑀𝑎𝑟𝑘𝑒𝑡𝐶𝑎𝑝𝑈𝑆𝐷𝑡 + 𝑆𝑒𝑐𝑢𝑟𝑖𝑡𝑦𝑁𝑒𝑡𝐷𝑖𝑣𝑖𝑑𝑒𝑛𝑑𝐼𝑚𝑝𝑎𝑐𝑡𝑈𝑆𝐷𝑡)
𝑆𝑒𝑐𝑢𝑟𝑖𝑡𝑦𝐼𝑛𝑖𝑡𝑖𝑎𝑙𝑀𝑎𝑟𝑘𝑒𝑡𝐶𝑎𝑝𝑈𝑆𝐷𝑡− 1] ∗ 100
𝑆𝑒𝑐𝑢𝑟𝑖𝑡𝑦𝐷𝑎𝑖𝑙𝑦𝑁𝑒𝑡𝑅𝑒𝑡𝑢𝑟𝑛𝐿𝑜𝑐𝑎𝑙𝑡 =
[(𝑆𝑒𝑐𝑢𝑟𝑖𝑡𝑦𝐴𝑑𝑗𝑢𝑠𝑡𝑒𝑑𝑀𝑎𝑟𝑘𝑒𝑡𝐶𝑎𝑝𝐹𝑜𝑟𝐿𝑜𝑐𝑎𝑙𝑡 + 𝑆𝑒𝑐𝑢𝑟𝑖𝑡𝑦𝑁𝑒𝑡𝐷𝑖𝑣𝑖𝑑𝑒𝑛𝑑𝐼𝑚𝑝𝑎𝑐𝑡𝐹𝑜𝑟𝐿𝑜𝑐𝑎𝑙𝑡)
𝑆𝑒𝑐𝑢𝑟𝑖𝑡𝑦𝐼𝑛𝑖𝑡𝑖𝑎𝑙𝑀𝑎𝑟𝑘𝑒𝑡𝐶𝑎𝑝𝑈𝑆𝐷𝑡− 1] ∗ 100
Where
𝑆𝑒𝑐𝑢𝑟𝑖𝑡𝑦𝑁𝑒𝑡𝐷𝑖𝑣𝑖𝑑𝑒𝑛𝑑𝐼𝑚𝑝𝑎𝑐𝑡𝑈𝑆𝐷𝑡 =𝐸𝑛𝑑𝑂𝑓𝐷𝑎𝑦𝑁𝑢𝑚𝑏𝑒𝑟𝑂𝑓𝑆ℎ𝑎𝑟𝑒𝑠𝑒𝑥−𝑑𝑎𝑡𝑒−1 ∗ 𝑁𝑒𝑡𝐷𝑖𝑣𝑖𝑑𝑒𝑛𝑑𝑃𝑒𝑟𝑆ℎ𝑎𝑟𝑒𝑡 ∗ 𝐼𝑛𝑐𝑙𝑢𝑠𝑖𝑜𝑛𝐹𝑎𝑐𝑡𝑜𝑟𝑡
𝐹𝑋𝑟𝑎𝑡𝑒𝑡
𝑆𝑒𝑐𝑢𝑟𝑖𝑡𝑦𝑁𝑒𝑡𝐷𝑖𝑣𝑖𝑑𝑒𝑛𝑑𝐼𝑚𝑝𝑎𝑐𝑡𝐹𝑜𝑟𝐿𝑜𝑐𝑎𝑙𝑡 =𝐸𝑛𝑑𝑂𝑓𝐷𝑎𝑦𝑁𝑢𝑚𝑏𝑒𝑟𝑂𝑓𝑆ℎ𝑎𝑟𝑒𝑠𝑒𝑥−𝑑𝑎𝑡𝑒−1 ∗ 𝑁𝑒𝑡𝐷𝑖𝑣𝑖𝑑𝑒𝑛𝑑𝑃𝑒𝑟𝑆ℎ𝑎𝑟𝑒𝑡 ∗ 𝐼𝑛𝑐𝑙𝑢𝑠𝑖𝑜𝑛𝐹𝑎𝑐𝑡𝑜𝑟𝑡
𝐹𝑋𝑟𝑎𝑡𝑒𝑡−1∗
𝐼𝐶𝐼𝑡𝐼𝐶𝐼𝑡−1
Where
𝑆𝑒𝑐𝑢𝑟𝑖𝑡𝑦𝐴𝑑𝑗𝑢𝑠𝑡𝑒𝑑𝑀𝑎𝑟𝑘𝑒𝑡𝐶𝑎𝑝𝐹𝑜𝑟𝐿𝑜𝑐𝑎𝑙𝑡 is the Adjusted Market Capitalization of
security s in USD converted using FX rate as of t-1
𝑆𝑒𝑐𝑢𝑟𝑖𝑡𝑦𝐴𝑑𝑗𝑢𝑠𝑡𝑒𝑑𝑀𝑎𝑟𝑘𝑒𝑡𝐶𝑎𝑝𝑈𝑆𝐷𝑡 is the Adjusted Market Capitalization of security s
in USD converted using FX rate as of t
𝑆𝑒𝑐𝑢𝑟𝑖𝑡𝑦𝐼𝑛𝑖𝑡𝑖𝑎𝑙𝑀𝑎𝑟𝑘𝑒𝑡𝐶𝑎𝑝𝑈𝑆𝐷𝑡 is the Initial Market Capitalization of security s in USD
at time t

MSCI.COM | PAGE 26 OF 123 © 2018 MSCI Inc. All rights reserved. Please refer to the disclaimer at the end of this document.
MSCI INDEX CALCULATION METHODOLOGY | JANUARY 2018
𝐼𝑛𝑐𝑙𝑢𝑠𝑖𝑜𝑛𝐹𝑎𝑐𝑡𝑜𝑟𝑡 is the inclusion factor of the security s at time t. The inclusion factor
can be one or the combination of the following factors: Foreign Inclusion Factor,
Domestic Inclusion Factor, Growth Inclusion Factor, Value Inclusion Factor, Index
Inclusion Factor (*).
𝐹𝑋𝑟𝑎𝑡𝑒𝑡 is the FX rate of the price currency of security s vs USD at time t. It is the value
of 1 USD in foreign currency.
𝐹𝑋𝑟𝑎𝑡𝑒𝑡−1 is the FX rate of the price currency of security s vs USD at time t-1. It is the
value of 1 USD in foreign currency.
𝐸𝑛𝑑𝑂𝑓𝐷𝑎𝑦𝑁𝑢𝑚𝑏𝑒𝑟𝑂𝑓𝑆ℎ𝑎𝑟𝑒𝑠𝑒𝑥−𝑑𝑎𝑡𝑒−1
is the number of shares of the security s at the
end of dividend ex-date-1.
𝑁𝑒𝑡𝐷𝑖𝑣𝑖𝑑𝑒𝑛𝑑𝑃𝑒𝑟𝑆ℎ𝑎𝑟𝑒𝑡 is the net dividend per share expressed in the same currency
unit as the price per share of the security s to be reinvested at time t.
𝐼𝐶𝐼𝑡 is the Internal Currency Index of price currency at time t. The ICI is different than 1
when a country changes the internal value of its currency (e.g. from Turkish Lira to New
Turkish Lira – ICI = 1,000,000).
𝐼𝐶𝐼𝑡−1 is the Internal Currency Index of price currency at time t-1.
(*) From June 1 2007 to May 31 2008, to calculate the standard or small cap index market
capitalization (except for FM countries and China A), the security market cap should be
multiplied by the Standard or Small Cap Index Inclusion Factor. Additionally, starting
December 1, 2015, to calculate the standard or small cap index market capitalization (except
for China A), the security market cap should be multiplied by the Standard or Small Cap
Index Inclusion Factor.
From September 1 2009 to November 30 2009, to calculate the China A and related indexes
markets capitalization, the China A securities market cap should be multiplied by the
Standard Index Inclusion Factor.
The ‘Standard Index Inclusion Factor’ is solely used for the computation of the MSCI
Standard Indexes, and not for the Large Cap, Mid Cap and Provisional Indexes, as these are
all constructed using the Global Investable Market Indexes methodology and were not
subject to the transition methodology.
The ‘Small Cap Index Inclusion Factor’ is not used for the computation of the MSCI Emerging
Markets and AC Small Cap Indexes, MSCI Small Cap Value and Growth, MSCI Provisional
Small Cap and MSCI Small Cap Sectors Indexes, as these are all constructed using the Global

MSCI.COM | PAGE 27 OF 123 © 2018 MSCI Inc. All rights reserved. Please refer to the disclaimer at the end of this document.
MSCI INDEX CALCULATION METHODOLOGY | JANUARY 2018
Investable Market Indexes methodology and were not subject to the transition
methodology.
2.1.5 INITIAL SECURITY WEIGHT
𝐼𝑛𝑖𝑡𝑖𝑎𝑙𝑆𝑒𝑐𝑢𝑟𝑖𝑡𝑦𝑊𝑒𝑖𝑔ℎ𝑡𝑡 =
𝐸𝑛𝑑𝑂𝑓𝐷𝑎𝑦𝑁𝑢𝑚𝑏𝑒𝑟𝑂𝑓𝑆ℎ𝑎𝑟𝑒𝑠𝑡−1 ∗ 𝑃𝑟𝑖𝑐𝑒𝑃𝑒𝑟𝑆ℎ𝑎𝑟𝑒𝑡−1𝐹𝑋𝑟𝑎𝑡𝑒𝑡−1
∗ 𝐼𝑛𝑐𝑙𝑢𝑠𝑖𝑜𝑛𝐹𝑎𝑐𝑡𝑜𝑟𝑡
∑ (𝐸𝑛𝑑𝑂𝑓𝐷𝑎𝑦𝑁𝑢𝑚𝑏𝑒𝑟𝑂𝑓𝑆ℎ𝑎𝑟𝑒𝑠𝑡−1 ∗ 𝑃𝑟𝑖𝑐𝑒𝑃𝑒𝑟𝑆ℎ𝑎𝑟𝑒𝑡−1
𝐹𝑋𝑟𝑎𝑡𝑒𝑡−1∗ 𝐼𝑛𝑐𝑙𝑢𝑠𝑖𝑜𝑛𝐹𝑎𝑐𝑡𝑜𝑟𝑡)𝑠∈𝐼,𝑡
∗ 100 =
𝑆𝑒𝑐𝑢𝑟𝑖𝑡𝑦𝐼𝑛𝑖𝑡𝑖𝑎𝑙𝐹𝑢𝑙𝑙𝑀𝑎𝑟𝑘𝑒𝑡𝐶𝑎𝑝𝑈𝑆𝐷𝑡 ∗ 𝐼𝑛𝑐𝑙𝑢𝑠𝑖𝑜𝑛𝐹𝑎𝑐𝑡𝑜𝑟𝑡
∑ (𝑆𝑒𝑐𝑢𝑟𝑖𝑡𝑦𝐼𝑛𝑖𝑡𝑖𝑎𝑙𝐹𝑢𝑙𝑙𝑀𝑎𝑟𝑘𝑒𝑡𝐶𝑎𝑝𝑈𝑆𝐷𝑡 ∗ 𝐼𝑛𝑐𝑙𝑢𝑠𝑖𝑜𝑛𝐹𝑎𝑐𝑡𝑜𝑟𝑡)𝑠∈𝐼,𝑡
∗ 100 =
𝑆𝑒𝑐𝑢𝑟𝑖𝑡𝑦𝐼𝑛𝑖𝑡𝑖𝑎𝑙𝑀𝑎𝑟𝑘𝑒𝑡𝐶𝑎𝑝𝑈𝑆𝐷𝑡𝐼𝑛𝑑𝑒𝑥𝐼𝑛𝑖𝑡𝑖𝑎𝑙𝑀𝑎𝑟𝑘𝑒𝑡𝐶𝑎𝑝𝑈𝑆𝐷𝑡
∗ 100
Where:
𝐸𝑛𝑑𝑂𝑓𝐷𝑎𝑦𝑁𝑢𝑚𝑏𝑒𝑟𝑂𝑓𝑆ℎ𝑎𝑟𝑒𝑠𝑡−1 is the number of shares of security s at the end of
day t-1.
𝑃𝑟𝑖𝑐𝑒𝑃𝑒𝑟𝑆ℎ𝑎𝑟𝑒𝑡−1 is the price per share of security s at time t-1.
𝐼𝑛𝑐𝑙𝑢𝑠𝑖𝑜𝑛𝐹𝑎𝑐𝑡𝑜𝑟𝑡 is the inclusion factor of security s at time t. The inclusion factor can
be one or the combination of the following factors: Foreign Inclusion Factor, Domestic
Inclusion Factor, Growth Inclusion Factor, Value Inclusion Factor, Index Inclusion Factor
(*).
𝐹𝑋𝑟𝑎𝑡𝑒𝑡−1 is the FX rate of the price currency of security s vs USD at time t-1. It is the
value of 1 USD in foreign currency.
(*) From June 1 2007 to May 31 2008, to calculate the standard or small cap index market
capitalization (except for FM countries and China A), the security market cap should be
multiplied by the Standard or Small Cap Index Inclusion Factor. Additionally, starting
December 1, 2015, to calculate the standard or small cap index market capitalization (except
for China A), the security market cap should be multiplied by the Standard or Small Cap
Index Inclusion Factor.

MSCI.COM | PAGE 28 OF 123 © 2018 MSCI Inc. All rights reserved. Please refer to the disclaimer at the end of this document.
MSCI INDEX CALCULATION METHODOLOGY | JANUARY 2018
From September 1 2009 to November 30 2009, to calculate the China A and related indexes
markets capitalization, the China A securities market cap should be multiplied by the
Standard Index Inclusion Factor.
The ‘Standard Index Inclusion Factor’ is solely used for the computation of the MSCI
Standard Indexes, and not for the Large Cap, Mid Cap and Provisional Indexes, as these are
all constructed using the Global Investable Market Indexes methodology and were not
subject to the transition methodology.
The ‘Small Cap Index Inclusion Factor’ is not used for the computation of the MSCI Emerging
Markets and AC Small Cap Indexes, MSCI Small Cap Value and Growth, MSCI Provisional
Small Cap and MSCI Small Cap Sectors Indexes, as these are all constructed using the Global
Investable Market Indexes methodology and were not subject to the transition
methodology.
2.1.6 CURRENCY
For index calculations, all dividends are converted into USD at the spot rate of the ex date.
2.1.7 NUMBER OF SHARES AND INDEX WEIGHTING FACTOR
A dividend amount is expressed per share entitled to the dividend. Since the day before the
ex-date is the last day on which the share is entitled to the dividend, the total dividend per
security reinvested into an index is equal to the number of shares at the close of the ex-
date-1 multiplied by the dividend per share.
In addition, a weighting factor of a security in the index is applied to the total dividend
amount to be reinvested. This can be the Domestic Inclusion Factor (DIF), the Foreign
Inclusion Factor (FIF), the Value Inclusion Factor (VIF), the Growth Inclusion Factor (GIF) or
any inclusion factor considered in the price index calculation.
2.2 REINVESTMENT METHODOLOGY
Gross Daily Total Return
This series approximates the maximum possible reinvestment of regular cash distributions
(cash dividends or capital repayments). The amount reinvested is the cash distributed to
individuals resident in the country of the company, but does not include tax credits.
Net Daily Total Return
This series approximates the minimum possible reinvestment of regular cash
distributions. Provided that the regular capital repayment is not subject to withholding tax,
the reinvestment in the Net Daily Total Return is free of withholding tax. Effective December

MSCI.COM | PAGE 29 OF 123 © 2018 MSCI Inc. All rights reserved. Please refer to the disclaimer at the end of this document.
MSCI INDEX CALCULATION METHODOLOGY | JANUARY 2018
1, 2009, the regular cash dividend is reinvested after deduction of withholding tax by
applying the maximum rate of the company’s country of incorporation applicable to
institutional investors. MSCI uses different withholding taxes depending if the indexes are
international or domestic:
International indexes: the maximum rate applicable to non-resident institutional
investors who do not benefit from double taxation treaties.
Domestic indexes: the maximum rate applicable to resident institutional investors
For more information on how taxes are applicable to dividends, please refer to the Appendix
for details about the withholding tax rates for the various countries.
2.2.1 TIMING OF REINVESTMENT
The amount of an announced regular cash distribution is reinvested on the ex-date of such
distribution on its principal exchange. For securities trading on more than one exchange,
MSCI uses the ex-date at the exchange from which MSCI sources the security’s price.
If a security does not trade on the ex-date or on the scheduled reinvestment date of the
regular cash distribution, the reinvestment is postponed to the day when the security
resumes trading. The scheduled reinvestment date of a dividend can be a date later than the
dividend ex-date in cases including, but not limited to a late dividend or a dividend
correction.
2.2.2 REINVESTMENT RULES
Distribution
Type
Size of
security’s cum
price
Recurrence
Price
Adjustment
Factor
Included in
the security’s
yield
More
details in
section
Regular Cash
Dividend - - No Yes 2.2.3
Special Cash
Dividend
<5% Less than 3 consecutive
years No No
2.2.4
<5% 3 consecutive years or
more No Yes
≥5% Less than 3 consecutive
years Yes No
≥5% 3 consecutive years or
more Yes Yes

MSCI.COM | PAGE 30 OF 123 © 2018 MSCI Inc. All rights reserved. Please refer to the disclaimer at the end of this document.
MSCI INDEX CALCULATION METHODOLOGY | JANUARY 2018
Distribution
Type
Regular
i.e. in lieu of regular dividend
Price
Adjustment
Factor
Included in
the security’s
yield
More
details in
section
Capital
Repayment
Yes No Yes 2.2.3
No Yes No 2.2.5
There are two principal guidelines in regards to cash distributions reinvestments:
A cash distribution – in the form of regular cash dividend or regular capital repayment -
is reinvested among all the constituents in an index. It is not considered in the MSCI
Price indexes. Note that these distributions are taken into account in the underlying
security’s yield calculation.
A special cash dividend that is unusually large, i.e. greater than or equal to 5% of the
security cum price, or a capital repayment deemed to be extraordinary i.e. unlikely to
recur on a regular basis, is reinvested by applying a PAF and is hence taken into account
in MSCI Price indexes as well as in the MSCI DTR Indexes.
These guidelines are discussed in greater detail below.
2.2.3 DIVIDENDS RESULTING IN A REINVESTMENT ONLY
The following cash distributions are reinvested in the MSCI DTR Index:
Regular Cash Dividend
A regular cash dividend is a distribution of cash made by a company to its shareholders and
is paid out of operating profits or retained earnings. Regular cash dividends, regardless of
their size, are reinvested on the ex-date in the MSCI DTR Indexes.
Regular Capital Repayment
A capital repayment or return of capital is characterized by a cash distribution from the
company’s share capital or capital surplus to its shareholders. A capital repayment,
regardless of its size, is considered as regular, if the cash distribution is in lieu of a regular
cash dividend, or is in line with the dividend policy of the company or with the historical cash
distributions. Provided that the capital repayment is not subject to withholding tax, the
reinvestment in the MSCI DTR Indexes is free of withholding tax.
In Taiwan, a cash distribution paid out of capital surplus is considered as regular unless
specified by the company that the distribution is deemed to be extraordinary. The cash

MSCI.COM | PAGE 31 OF 123 © 2018 MSCI Inc. All rights reserved. Please refer to the disclaimer at the end of this document.
MSCI INDEX CALCULATION METHODOLOGY | JANUARY 2018
distribution is reinvested in the MSCI DTR Indexes. Regarding the withholding tax treatment,
please refer to sub-section 2.3.7.2.1 below.
Optional Dividend
In the case of an optional dividend, the company offers shareholders the choice of receiving
the dividend either in cash or in shares. However, shareholders electing the cash option may
receive the dividend consideration in cash or shares, or some combination of cash and
shares.
MSCI assumes that shareholders receive the default distribution. If no default distribution is
available, MSCI assumes that shareholders elect the cash option. MSCI therefore reinvests
the dividend amount on the ex-date in the MSCI DTR Indexes. Please refer to the section 4.3
of the MSCI Corporate Events Methodology book for more information regarding optional
dividends treatment.
Interest on Capital
The ‘interest on capital’ dividend is a cash payment to shareholders accounted for as a pre-
tax interest expense by the company. The balance sheet and the book value do not change.
Interests on capital are common in Brazil.
2.2.4 DIVIDENDS RESULTING IN A REINVESTMENT OR IN A PRICE ADJUSTMENT
The dividends below are reinvested in the MSCI DTR Index if the dividend impact on the cum
price is less than 5%.
However, if the impact is greater than or equal to 5%, the dividend will be reflected in the
MSCI Index through a price adjustment.
Special/Extraordinary Cash Dividend
The company declares the dividend as special or extraordinary. It is funded by a special
event or from extraordinary profits. MSCI may consider irregular and unusually large
dividends as special even if they are not declared as such by the company.
Special cash dividends that are smaller than 5% of the cum price of the underlying security
are reinvested in the MSCI DTR Indexes, but are not included in the yield calculation, unless
they are paid for at least three consecutive years.
Special cash dividends that are greater than or equal to 5% of the cum price of the
underlying security are reflected in the MSCI Indexes through an adjustment on their ex-
date. A Price Adjustment Factor (PAF) using the gross dividend amount is applied to the
MSCI Price Indexes, the MSCI Gross DTR Indexes and the MSCI Net DTR Indexes on the ex-
date of the special cash dividend.

MSCI.COM | PAGE 32 OF 123 © 2018 MSCI Inc. All rights reserved. Please refer to the disclaimer at the end of this document.
MSCI INDEX CALCULATION METHODOLOGY | JANUARY 2018
For special cash dividends that are greater than or equal to 5% of the cum price of the
underlying security and subject to a withholding tax, as defined in Section 2.3.7.2, MSCI
reinvests a negative amount corresponding to the withholding tax in the MSCI Net DTR
Indexes only. This negative reinvestment is reflected simultaneously with the PAF on the ex-
date of the special cash dividend.
Any special cash dividend, distributed for at least three consecutive years, is taken into
account in the yield calculation of the underlying security, regardless of its size.
Commemorative Dividend (memorial)
A company declares a dividend as commemorative/memorial. The funds come from
extraordinary profit or cash generated by a special event.
Retroactive/Arrears Dividend
Retroactive dividends are paid in Italy when a company has to pay a dividend to revenue-
guaranteed (RISP) shares to make up for previous years’ non-payments.
Special Dividend to Non-Domestic Shareholders
A company pays its non-domestic shareholders a bonus dividend to compensate for the tax
credit distributed to domestic shareholders. This is a common practice in New Zealand.
2.2.5 DIVIDENDS RESULTING IN A PRICE ADJUSTMENT ONLY
A PAF is applied to the security in the MSCI Price Indexes, the MSCI Gross DTR Indexes and
the MSCI Net DTR Indexes, in the following cases:
Stock Dividend (stock bonus/gratis issue)
The company issues shares at no direct cost to the shareholders. The funds are taken out
from the current year’s earnings. In the case of a stock bonus/gratis issue, the company
distributes a part of the reserves (retained earnings from previous years) to its shareholders.
For Taiwanese stock dividends subject to withholding taxes as defined in Section 2.3.7.2,
MSCI reinvests a negative amount corresponding to the withholding tax in the MSCI Net DTR
Indexes only. This negative reinvestment is reflected simultaneously with the PAF on the ex-
date of the stock dividend.
Extraordinary Capital Repayment
For the capital repayments that are deemed to be extraordinary compared to the dividend
policy of the company or to the historical cash distributions, the price of the security is
adjusted on the ex-date of the extraordinary capital repayment, regardless of its size.
Dividend Paid in Shares of another Company

MSCI.COM | PAGE 33 OF 123 © 2018 MSCI Inc. All rights reserved. Please refer to the disclaimer at the end of this document.
MSCI INDEX CALCULATION METHODOLOGY | JANUARY 2018
The company distributes stock of another company as a dividend. The number of shares
held remains the same, but the price will decrease by the value of the distributed security.
MSCI considers other cash payments related to Corporate Events, such as mergers,
acquisitions, liquidations, etc. on a case-by-case basis.
2.3 PROCESSING RULES
2.3.1 DIVIDEND DATA
Raw dividend data is provided by multiple electronic data feeds and is checked for
completeness and correctness. MSCI’s Daily Total Return process requires that dividends be
confirmed by at least two distinct data sources. Most dividends are received and validated
through electronic feeds, but some dividends may require confirmation from other sources,
such as stock exchanges or the company. In addition, MSCI monitors securities for which a
dividend is expected based on previous dividend announcement frequency, but which has
not yet been received through the regular data sources.
2.3.2 CORPORATE ACTIONS
A corporate action, which changes the number of shares outstanding for a company, may
take place between the dividend’s announcement date and its ex-date. As the number of
shares on the day preceding the ex-date is used to calculate the dividend amount to be
reinvested, MSCI adjusts the dividend to reflect the number of shares on that day.
Following certain corporate events, the number of shares used in MSCI Index calculations on
the cum date may include shares that are not issued yet or that are not entitled to the
dividend. In those cases, MSCI reinvests the dividend on the ex-date as if all shares included
in MSCI Index calculations were entitled to the dividend.
2.3.3 LATE DIVIDENDS
A late dividend is a dividend that is only known after its ex-date. It is processed under the
correction policy as described in sub-section 2.3.4 above.
2.3.4 CORRECTIONS
A dividend that has been reinvested may need to be amended, due to an error in its ex-date,
in the dividend amount, or in the dividend currency. MSCI will give advance notification for
dividend corrections that are received after their ex-date. Consequently, the correction in
the index will be postponed to the next business day following the reception and
announcement of the information.
The following rules apply:

MSCI.COM | PAGE 34 OF 123 © 2018 MSCI Inc. All rights reserved. Please refer to the disclaimer at the end of this document.
MSCI INDEX CALCULATION METHODOLOGY | JANUARY 2018
Action is taken only if the error is discovered within 12 months of the ex date.
In the case of a correction, MSCI uses the number of shares at the close of the cum date.
The spot rate of the reinvestment date is used for currency conversion.
A historical correction is applied to all indexes impacted by more than 50 basis points1 if
the impact on a country or World / EM industry group index is over 50 basis points.
Starting December 1, 2010, for the MSCI Frontier Markets Indexes (including MSCI GCC
Countries Indexes), there will be a historical correction only if the impact on the MSCI
Frontier Markets region is over 50 basis points.
The security that needs a dividend correction may have changed its status for index
inclusion between the ex-date and the correction date. For example, this may be due to
the security’s subsequent exclusion from the index, or a change in its industry or
country classification. Applying the correction with the current status may reinvest
dividends into the wrong index. If there is a change in the security’s index inclusion
status between the ex-date and the correction date, no correction amount will be
reinvested.
2.3.5 PAYMENT DEFAULT
A correction is applied when a dividend is declared unpaid (payment default). This may
result in a negative reinvestment. Past index levels are not corrected.
The following rules apply:
Action is taken only if the payment default is discovered within 12 months of the ex-
date and is in line with the price index correction policy, where MSCI applies a 12 month
correction period.
MSCI uses the number of shares effective at the close of the original cum date. The
default amount is reinvested on the next business day following the reception and
confirmation of at least two distinct data sources. . The spot rate of the reinvestment
date is used for currency conversion.
2.3.6 COUNTRY EXCEPTIONS
Japan:
Many Japanese companies declare their dividends after the ex-date. As estimated dividends
are available before the ex-date and are broadly used, an estimation of the dividend is
1 The 50 basis point limit is linked to the price index correction policy and will be revised accordingly to reflect any
changes in this policy.

MSCI.COM | PAGE 35 OF 123 © 2018 MSCI Inc. All rights reserved. Please refer to the disclaimer at the end of this document.
MSCI INDEX CALCULATION METHODOLOGY | JANUARY 2018
reinvested on the ex-date. When a company does not declare an estimated dividend, MSCI
uses the previous year’s dividend amount from the same period as the estimation. Should
the difference between the estimated and ratified dividend amount warrant correction, it
will be processed as a payment default (reinvestment without correcting past index levels)
on the next business day following the reception date from the data sources.
Korea:
Many Korean companies declare their dividends after their ex-date. As no estimated
dividends provided by the companies are available before the ex-date, the dividends are
reinvested on the next business day following the reception and confirmation of at least two
distinct data sources (in accordance with the section 2.3.1).
These reinvestments after the ex-date do not trigger any correction of the index levels.
MSCI uses the number of shares effective on the day prior to the ex-date to reinvest the
dividend.
In the rare case of Korean companies declaring their dividends prior to their ex-date, MSCI
reinvests dividends into the MSCI DTR Indexes on the day the security is quoted ex-dividend
on its principal exchange (in accordance with the section 2.2.1).
Should the dividend amount for Korean companies change following approval by the
shareholders at the general meeting, MSCI will reinvest the difference between the amount
initially announced by the company and the final amount approved by the shareholders.
This does not trigger any correction of past index levels.
Starting December 2014, for dividends with an ex date from December 2014 onwards, MSCI
will transition to the enhanced methodology for Korean dividends, as per the following:
Under the enhanced methodology, MSCI will reinvest an estimated dividend amount for
Korean securities on the ex-date of the dividend.
The estimate will be calculated as the previous year’s dividend amount from the same
period, adjusted by any capital changes if necessary. If no dividend was paid from the same
period in the previous year or an estimated dividend amount is not available, MSCI will
reinvest the dividend amount of zero.
Once a Korean company announces the actual dividend amount, MSCI will reinvest on the
next business day following reception of data from MSCI’s sources, all differences between
the estimated and ratified dividend amount, if any, in the MSCI DTR Indexes without
correcting index levels.
These estimates will be used for the calculation of the dividend yield as if the amounts were
not estimates.

MSCI.COM | PAGE 36 OF 123 © 2018 MSCI Inc. All rights reserved. Please refer to the disclaimer at the end of this document.
MSCI INDEX CALCULATION METHODOLOGY | JANUARY 2018
Russia:
For depositary receipts (DRs) of Russian companies, only an estimated dividend amount per
share in USD is available prior to the ex-date. Therefore, on the ex date of the DR security,
MSCI reinvests the estimated dividend amount in USD in the MSCI DTR Indexes. Once the
actual dividend amount is announced by the depositary bank, MSCI reinvests the difference,
if any, between the USD dividend amount per share already reinvested on the ex date and
the USD dividend amount per share publicly announced by the depositary bank. When
possible, MSCI reinvests this difference on the dividend pay date.
The reinvestment of the difference in the MSCI DTR Indexes does not trigger any correction
of past index levels.
In addition, when MSCI reinvests the difference on or around the pay date, fees withheld by
the depositary bank, if any, are taken into in the MSCI Net DTR Indexes.
In the case the dividend amount and ex date are known or captured by MSCI only on the
security’s ex date itself, MSCI uses a threshold based on the dividend size to determine the
reinvestment timing:
If a total dividend amount is below USD 1 billion2 and is announced or captured on the
ex date, then MSCI reinvests the dividend amount intraday in the MSCI DTR Indexes. In
addition, MSCI sends an intraday announcement to its clients.
If a total dividend distribution is above USD 1 billion and is announced or captured on
the ex date, then MSCI postpones the dividend reinvestment to the second business day
after its ex date. In addition, MSCI sends an intraday announcement to its clients.
Note that MSCI uses the number of shares effective on the day prior to the ex-date to
reinvest the dividend.
Should the dividend amount for Russian companies change following approval by the
shareholders at the general meeting, MSCI will reinvest the difference between the amount
initially announced by the company and the final amount approved by the shareholders.
This reinvestment does not trigger any correction of past index levels.
Singapore:
Some companies in Singapore, for example Real Estate Investment Trusts (REITs), pay
advanced cash distributions at the time of placement of new shares, in order to ensure
fairness to the existing shareholders. This distribution is a part of the regular quarterly cash
dividends announced by the companies. If an estimated amount or range of dividend
2 The size of the total dividend amount is calculated as follows: dividend per share amount in Ruble * FX Rate (USD/RUB)
on the ex date * Number of Shares * Foreign Inclusion Factor

MSCI.COM | PAGE 37 OF 123 © 2018 MSCI Inc. All rights reserved. Please refer to the disclaimer at the end of this document.
MSCI INDEX CALCULATION METHODOLOGY | JANUARY 2018
amount is declared by the company before the ex-date, MSCI reinvests the estimated
amount or lower range of the dividend amount in MSCI DTR Indexes on the day the security
is quoted ex-dividend on its principal exchange (in accordance with the section 2.2.1).
Should the dividend amount change after the ex-date following company announcement,
MSCI will reinvest the difference between the amount initially announced by the company
and the final amount on the next business day following the reception and confirmation of
at least two distinct data sources. These reinvestments after the ex-date do not trigger any
correction of past index levels.
USA: Redemption Right
When a company redeems shares distributed to shareholders due to a poison pill rights
issue (applies mainly in USA), there may be a change in the company’s capital structure. In
this case MSCI will apply a price adjustment.
2.3.7 TAXES ON DIVIDENDS
Shareholders may be taxed on dividend payments. Tax rates vary depending on the
company’s and shareholder’s country of domicile. Tax data is monitored on a regular basis
and is updated when necessary.
2.3.7.1 TAX CREDIT
A tax credit related to a dividend can be considered as a reimbursement of tax already
received by the fiscal administration. In countries operating under an imputation tax system,
a company’s annual earnings are taxed before distribution to the shareholders, and then the
shareholders pay taxes on the dividend. Some countries operating under an imputation tax
system provide shareholders with a tax credit to offset the amount of the tax they would
otherwise owe in respect of the dividend.3 MSCI does not take into account the amount of a
tax credit in calculating either gross or net dividends.
2.3.7.2 WITHHOLDING TAX
A withholding tax related to a dividend is a tax on the income of the shareholder withheld by
the company when the dividend is paid to a shareholder. The withholding tax rate depends
on the tax status of the shareholder. MSCI uses the maximum withholding tax rate
applicable to institutional investors in calculating MSCI net dividends. A non-resident
shareholder must also pay taxes on dividends in his/her domestic country as part of his/her
3 Singapore and Malaysia completely migrated to a one-tier tax system from imputation system effective January 1, 2008
and January 1, 2014 respectively. Under a one-tier or single-tier tax system, a company pays a tax on its taxable income
and shareholders are not charged with a tax on dividends paid to them by the company.

MSCI.COM | PAGE 38 OF 123 © 2018 MSCI Inc. All rights reserved. Please refer to the disclaimer at the end of this document.
MSCI INDEX CALCULATION METHODOLOGY | JANUARY 2018
income taxes. Countries may eliminate this double taxation by signing ‘bi-lateral’ double
taxation treaties.
MSCI uses companies’ country of incorporation to determine the relevant dividend
withholding tax rates in calculating the net dividends and the MSCI Net DTR Indexes. In cases
where the withholding tax rate in the company’s country of incorporation is higher than the
MSCI company’s country of classification as determined in accordance to Appendix III of the
MSCI Global Investable Markets Indexes Methodology, MSCI will make a specific analysis to
determine the actual withholding tax rate applied to non-resident institutional investors.
Companies’ country of incorporations are reviewed on a semi-annual basis and changes to
companies’ withholding tax rates, if any, are made with the May and November Semi-
Annual Index Reviews.
In the calculation of the MSCI Net DTR International Indexes, MSCI uses the withholding tax
rate applicable to non-resident institutional investors that do not benefit from double
taxation treaties.
In the calculation of the MSCI Net DTR Domestic Indexes, MSCI uses the withholding tax rate
applicable to domestic institutional investors.
Provided that the regular capital repayment is not subject to withholding tax, the
reinvestment in the MSCI Net DTR is free of withholding tax.
NOTE: MSCI applies a weighted average withholding tax rate to the total cash amount
distributed by a company when:
- a portion of the cash dividend amount is subject to a different withholding tax rate.
Refer to the Appendix 6 for more details on withholding tax applicable to dividends
paid by REITs.
- two or more cash distributions paid by the same company are ex on the same day
but subject to different withholding tax rates.
2.3.7.2.1 COUNTRY EXCEPTIONS
Australian Dividends
Some Australian companies pay their dividends with franking credits attached in order to
pass on to investors the value of any tax that the company has already paid on its profits.
Dividends can be fully franked, partially franked or unfranked. Foreign non-resident
investors are subject to the Australian dividend withholding tax on the unfranked portion of
a dividend. However, foreign non-resident investors are not subject to the Australian
dividend withholding tax on the unfranked portion of the dividend to the extent that it is

MSCI.COM | PAGE 39 OF 123 © 2018 MSCI Inc. All rights reserved. Please refer to the disclaimer at the end of this document.
MSCI INDEX CALCULATION METHODOLOGY | JANUARY 2018
declared as conduit foreign income4 by Australian companies, or on the franked portion of
the dividend.
In the calculation of the MSCI Net DTR International Indexes for Australian dividends, MSCI
uses the withholding tax rate5 applicable to foreign non-resident institutional investors on
the unfranked portion of the dividend that is not designated as conduit foreign income.
MSCI does not apply withholding tax rate on the franked portion of the dividend or the
unfranked portion of the dividend declared to be conduit foreign income.
In the case that the franking percentage and/or the conduit foreign income not publicly
available prior to the ex-date, the franking percentage and/or the conduit foreign income
will be assumed zero correspondingly.
The effective withholding tax rate being applied to the Australian dividends in the MSCI Net
DTR International Indexes is as follows.
Effective withholding tax rate = Australia default withholding tax rate x (100% - franking % -
conduit foreign income %)
Examples of Calculation
Franking
Percentage
Conduit
Foreign
Income
Percentage
Default
Withholding
Tax Rate
Effective
Withholding
Tax Rate
Gross
Amount
Net
Amount
Security A 100% 0% 30% 0% AUD 2.56 AUD 2.56
Security B 75% 25% 30% 0% AUD 1.47 AUD 1.47
Security C 50% 0% 30% 15% AUD 1.00 AUD 0.85
Security D 0% 50% 30% 15% AUD 2.00 AUD 1.70
Taiwanese Stock Dividends
In Taiwan, stock dividends can be paid out from capital surplus or retained earnings. The
portion of stock dividends paid out of retained earnings is subject to the default withholding
4 Conduit foreign income is foreign income received by a foreign resident via an Australian corporate tax entity, and is
that income which would ordinarily not be taxed under the relevant Australian tax laws (source: Australian Government,
The Treasury).
5 Please refer to the Appendix for the latest withholding tax rate for Australia.

MSCI.COM | PAGE 40 OF 123 © 2018 MSCI Inc. All rights reserved. Please refer to the disclaimer at the end of this document.
MSCI INDEX CALCULATION METHODOLOGY | JANUARY 2018
tax rate against the par value of each new share. The portion of stock dividends paid out of
capital surplus is not subject to a withholding tax.
To take into account this withholding tax in the MSCI Indexes, MSCI reinvests a negative
amount corresponding to the withholding tax in the MSCI Net DTR Indexes only.
This negative amount of the withholding tax is calculated using the following formula.
Withholding tax of Taiwanese stock dividend = Number of shares received which are subject
to the withholding tax x par value of each share x Taiwanese default withholding tax rate6.
This negative reinvestment is reflected simultaneously with the PAF on the ex-date of the
stock dividend.
Taiwanese Capital Repayments
In Taiwan, the cash distributions paid out from the types of capital surplus which are
originally contributed by shareholders are not subject to any withholding tax. Otherwise, the
cash distributions paid out from the types of capital surplus not originally contributed by
shareholders are subject to a withholding tax. The cash distribution paying out of the capital
surplus originally contributed by shareholders is therefore reinvested in the MSCI DTR
Indexes free of withholding tax. Otherwise, the cash distribution paying out from the equity
capital not originally contributed by shareholders is reinvested with the default withholding
tax rate. In the case that a Taiwanese company does not clarify the source of capital surplus,
the cash distribution is reinvested in the MSCI DTR Indexes free of withholding tax.
Thailand Cash Dividends
In Thailand, the Board of Investment (“BOI”) provides tax exemptions to certain companies
that generate profit from promoting investment activity in Thailand. These companies can
be classified as BOI promoted companies and are referred to as operating “under BOI
privilege.” When a company under BOI privilege distributes dividends, the dividends derived
from business profit generated by BOI related business can be exempted from withholding
tax. However, Non-Voting Depositary Receipt (NVDR) holders are not entitled to the
withholding tax exemption.
MSCI does not take into account such tax exemption in calculating net dividends. That is,
MSCI does not differentiate dividends derived from business profit under BOI privilege and
non-BOI privilege. MSCI will therefore reinvest the full cash dividend amount with the
default withholding tax rate in the MSCI DTR Indexes.
6 Please refer to the Appendix for the latest withholding tax rate for Taiwan

MSCI.COM | PAGE 41 OF 123 © 2018 MSCI Inc. All rights reserved. Please refer to the disclaimer at the end of this document.
MSCI INDEX CALCULATION METHODOLOGY | JANUARY 2018
2.3.8 DEFINITIONS
Announcement date - the date on which the company announces its next dividend
payment.
Reception date - the date on which the information about the dividend is received by
MSCI from its data sources.
Record date - the date on which an individual must own shares (be the holder of record)
in order to receive a declared dividend or capital gains distribution.
Ex-date - the first day on which, if an investor buys the security, the security no longer
carries the right to the declared dividend.

MSCI.COM | PAGE 42 OF 123 © 2018 MSCI Inc. All rights reserved. Please refer to the disclaimer at the end of this document.
MSCI INDEX CALCULATION METHODOLOGY | JANUARY 2018
APPENDICES

MSCI.COM | PAGE 43 OF 123 © 2018 MSCI Inc. All rights reserved. Please refer to the disclaimer at the end of this document.
MSCI INDEX CALCULATION METHODOLOGY | JANUARY 2018
APPENDIX I: SUNDAY INDEX CALCULATION
Calculation Methodology
A selected list of MSCI Indexes is calculated on Sunday to reflect the performance of the
markets open on this day7.
In order to preserve compatibility with the other MSCI International Indexes, which are
calculated from Monday to Friday, MSCI uses the concept of a Monday pre-opening
(intermediate) calculation for the Sunday calculation. The Sunday index performances
capture the price changes and reflect corporate events effective on this day.
In case of corporate events occurring on Sundays and where a Price Adjustment Factor (PAF)
is needed, the PAF is applied to the market price of the security on Sunday and Monday. If
the security does not trade on Monday, the Sunday closing market price is carried forward
to Monday, including the PAF.
Changes in the security’s number of shares, FIFs and/or DIFs due to corporate events
occurring on Sunday are implemented as of the close of Monday, regardless of whether the
corporate event requires the application of a PAF on Sunday or not.
The index constituent list is the same as the one to be used for the Monday calculation.
WM/Reuters spot FX rates as of the previous Friday is carried forward to the Sunday in order
to perform the index calculation in USD.
No dividends are reinvested on Sundays. Consequently, the Daily Total Return (DTR) index
performances for Sunday will be equal to the ones of the price index.
The chain-linking for these indexes can be summarized as follows:
Sunday’s daily index performance is computed by comparing Sunday’s adjusted prices
and the previous Friday’s unadjusted prices
Monday’s daily index performance is computed, as currently, by comparing Monday’s
adjusted prices and the previous Friday’s unadjusted prices
7 Effective July 13, 2013, MSCI has discontinued the calculations and distribution of the Saturday files.

MSCI.COM | PAGE 44 OF 123 © 2018 MSCI Inc. All rights reserved. Please refer to the disclaimer at the end of this document.
MSCI INDEX CALCULATION METHODOLOGY | JANUARY 2018
Sunday calculation
Initial Weights Constituents
Monday
Friday calculation
Thursday Friday Saturday Sunday
Monday calculation
Index Calculation Formulas
𝐼𝑛𝑑𝑒𝑥𝐿𝑒𝑣𝑒𝑙𝐿𝑜𝑐𝑎𝑙𝑆𝑢𝑛𝑑𝑎𝑦 = 𝐼𝑛𝑑𝑒𝑥𝐿𝑒𝑣𝑒𝑙𝐿𝑜𝑐𝑎𝑙𝐹𝑟𝑖𝑑𝑎𝑦 ∗
∑ (𝑆𝑒𝑐𝑢𝑟𝑖𝑡𝑦𝐴𝑑𝑗𝑢𝑠𝑡𝑒𝑑𝐹𝑢𝑙𝑙𝑀𝑎𝑟𝑘𝑒𝑡𝐶𝑎𝑝𝐹𝑜𝑟𝐿𝑜𝑐𝑎𝑙𝑆𝑢𝑛𝑑𝑎𝑦 ∗ 𝐼𝑛𝑐𝑙𝑢𝑠𝑖𝑜𝑛𝐹𝑎𝑐𝑡𝑜𝑟𝑀𝑜𝑛𝑑𝑎𝑦)𝑠∈𝐼,𝑀𝑜𝑛𝑑𝑎𝑦
∑ (𝑆𝑒𝑐𝑢𝑟𝑖𝑡𝑦𝐼𝑛𝑖𝑡𝑖𝑎𝑙𝐹𝑢𝑙𝑙𝑀𝑎𝑟𝑘𝑒𝑡𝐶𝑎𝑝𝑈𝑆𝐷𝑆𝑢𝑛𝑑𝑎𝑦 ∗ 𝐼𝑛𝑐𝑙𝑢𝑠𝑖𝑜𝑛𝐹𝑎𝑐𝑡𝑜𝑟𝑀𝑜𝑛𝑑𝑎𝑦)𝑠∈𝐼,𝑀𝑜𝑛𝑑𝑎𝑦
𝐼𝑛𝑑𝑒𝑥𝐿𝑒𝑣𝑒𝑙𝑈𝑆𝐷𝑆𝑢𝑛𝑑𝑎𝑦 =
𝐼𝑛𝑑𝑒𝑥𝐿𝑒𝑣𝑒𝑙𝑈𝑆𝐷𝐹𝑟𝑖𝑑𝑎𝑦 ∗∑ (𝑆𝑒𝑐𝑢𝑟𝑖𝑡𝑦𝐴𝑑𝑗𝑢𝑠𝑡𝑒𝑑𝐹𝑢𝑙𝑙𝑀𝑎𝑟𝑘𝑒𝑡𝐶𝑎𝑝𝑈𝑆𝐷𝑆𝑢𝑛𝑑𝑎𝑦 ∗ 𝐼𝑛𝑐𝑙𝑢𝑠𝑖𝑜𝑛𝐹𝑎𝑐𝑡𝑜𝑟𝑀𝑜𝑛𝑑𝑎𝑦)𝑠∈𝐼,𝑀𝑜𝑛𝑑𝑎𝑦
∑ (𝑆𝑒𝑐𝑢𝑟𝑖𝑡𝑦𝐼𝑛𝑖𝑡𝑖𝑎𝑙𝐹𝑢𝑙𝑙𝑀𝑎𝑟𝑘𝑒𝑡𝐶𝑎𝑝𝑈𝑆𝐷𝑆𝑢𝑛𝑑𝑎𝑦 ∗ 𝐼𝑛𝑐𝑙𝑢𝑠𝑖𝑜𝑛𝐹𝑎𝑐𝑡𝑜𝑟𝑀𝑜𝑛𝑑𝑎𝑦)𝑠∈𝐼,𝑀𝑜𝑛𝑑𝑎𝑦
Where:
𝐼𝑛𝑐𝑙𝑢𝑠𝑖𝑜𝑛𝐹𝑎𝑐𝑡𝑜𝑟𝑀𝑜𝑛𝑑𝑎𝑦 is the inclusion factor of the security as of the following
Monday. The inclusion factor can be one or the combination of the following factors:
Foreign Inclusion Factor, Domestic Inclusion Factor, Growth Inclusion Factor, Value
Inclusion Factor, Index Inclusion Factor (*).
The Security Full Market Caps are calculated as follows:
𝑆𝑒𝑐𝑢𝑟𝑖𝑡𝑦𝐴𝑑𝑗𝑢𝑠𝑡𝑒𝑑𝐹𝑢𝑙𝑙𝑀𝑎𝑟𝑘𝑒𝑡𝐶𝑎𝑝𝐹𝑜𝑟𝐿𝑜𝑐𝑎𝑙𝑆𝑢𝑛𝑑𝑎𝑦 =
𝐸𝑛𝑑𝑂𝑓𝐷𝑎𝑦𝑁𝑢𝑚𝑏𝑒𝑟𝑂𝑓𝑆ℎ𝑎𝑟𝑒𝑠𝐹𝑟𝑖𝑑𝑎𝑦 ∗ 𝑃𝑟𝑖𝑐𝑒𝑃𝑒𝑟𝑆ℎ𝑎𝑟𝑒𝑆𝑢𝑛𝑑𝑎𝑦 ∗ 𝑃𝐴𝐹𝑆𝑢𝑛𝑑𝑎𝑦 ∗𝐼𝐶𝐼𝑀𝑜𝑛𝑑𝑎𝑦
𝐼𝐶𝐼𝐹𝑟𝑖𝑑𝑎𝑦
𝐹𝑋𝑟𝑎𝑡𝑒𝐹𝑟𝑖𝑑𝑎𝑦
𝑆𝑒𝑐𝑢𝑟𝑖𝑡𝑦𝐴𝑑𝑗𝑢𝑠𝑡𝑒𝑑𝐹𝑢𝑙𝑙𝑀𝑎𝑟𝑘𝑒𝑡𝐶𝑎𝑝𝑈𝑆𝐷𝑆𝑢𝑛𝑑𝑎𝑦 =
𝐸𝑛𝑑𝑂𝑓𝐷𝑎𝑦𝑁𝑢𝑚𝑏𝑒𝑟𝑂𝑓𝑆ℎ𝑎𝑟𝑒𝑠𝐹𝑟𝑖𝑑𝑎𝑦 ∗ 𝑃𝑟𝑖𝑐𝑒𝑃𝑒𝑟𝑆ℎ𝑎𝑟𝑒𝑆𝑢𝑛𝑑𝑎𝑦 ∗ 𝑃𝐴𝐹𝑆𝑢𝑛𝑑𝑎𝑦
𝐹𝑋𝑟𝑎𝑡𝑒𝑆𝑢𝑛𝑑𝑎𝑦

MSCI.COM | PAGE 45 OF 123 © 2018 MSCI Inc. All rights reserved. Please refer to the disclaimer at the end of this document.
MSCI INDEX CALCULATION METHODOLOGY | JANUARY 2018
𝑆𝑒𝑐𝑢𝑟𝑖𝑡𝑦𝐼𝑛𝑖𝑡𝑖𝑎𝑙𝐹𝑢𝑙𝑙𝑀𝑎𝑟𝑘𝑒𝑡𝐶𝑎𝑝𝑈𝑆𝐷𝑆𝑢𝑛𝑑𝑎𝑦 =
𝐸𝑛𝑑𝑂𝑓𝐷𝑎𝑦𝑁𝑢𝑚𝑏𝑒𝑟𝑂𝑓𝑆ℎ𝑎𝑟𝑒𝑠𝐹𝑟𝑖𝑑𝑎𝑦 ∗ 𝑃𝑟𝑖𝑐𝑒𝑃𝑒𝑟𝑆ℎ𝑎𝑟𝑒𝐹𝑟𝑖𝑑𝑎𝑦
𝐹𝑋𝑟𝑎𝑡𝑒𝐹𝑟𝑖𝑑𝑎𝑦
Where:
𝐸𝑛𝑑𝑂𝑓𝐷𝑎𝑦𝑁𝑢𝑚𝑏𝑒𝑟𝑂𝑓𝑆ℎ𝑎𝑟𝑒𝑠𝐹𝑟𝑖𝑑𝑎𝑦
is the number of shares of security s as of the end
of the previous Friday.
𝑃𝑟𝑖𝑐𝑒𝑃𝑒𝑟𝑆ℎ𝑎𝑟𝑒𝑆𝑢𝑛𝑑𝑎𝑦 is the price per share of the security s as of Sunday.
𝑃𝑟𝑖𝑐𝑒𝑃𝑒𝑟𝑆ℎ𝑎𝑟𝑒𝐹𝑟𝑖𝑑𝑎𝑦 is the price per share of security s as of the previous Friday.
𝑃𝐴𝐹𝑆𝑢𝑛𝑑𝑎𝑦 is the Price Adjustment Factor of the security s as of Sunday.
𝐹𝑋𝑟𝑎𝑡𝑒𝑆𝑢𝑛𝑑𝑎𝑦 is the FX rate of the price currency of security s vs USD as of Sunday. It is
the value of 1 USD in foreign currency.
𝐹𝑋𝑟𝑎𝑡𝑒𝐹𝑟𝑖𝑑𝑎𝑦 is the FX rate of the price currency of security s vs USD as of the previous
Friday. It is the value of 1 USD in foreign currency.
𝐼𝐶𝐼𝑀𝑜𝑛𝑑𝑎𝑦 is the Internal Currency Index of price currency as of Monday. The ICI is
different than 1 when a country changes the internal value of its currency (e.g. from
Turkish Lira to New Turkish Lira – ICI = 1,000,000).
𝐼𝐶𝐼𝐹𝑟𝑖𝑑𝑎𝑦 is the Internal Currency Index of price currency as of previous Friday.
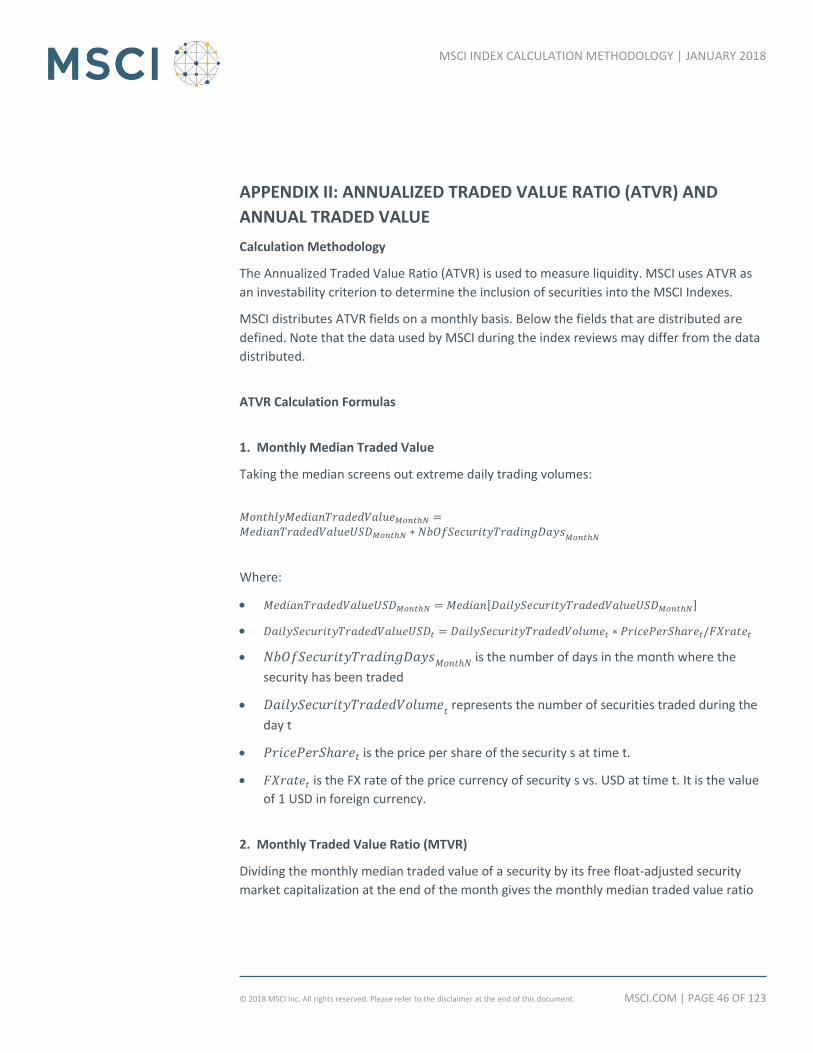
MSCI.COM | PAGE 46 OF 123 © 2018 MSCI Inc. All rights reserved. Please refer to the disclaimer at the end of this document.
MSCI INDEX CALCULATION METHODOLOGY | JANUARY 2018
APPENDIX II: ANNUALIZED TRADED VALUE RATIO (ATVR) AND
ANNUAL TRADED VALUE
Calculation Methodology
The Annualized Traded Value Ratio (ATVR) is used to measure liquidity. MSCI uses ATVR as
an investability criterion to determine the inclusion of securities into the MSCI Indexes.
MSCI distributes ATVR fields on a monthly basis. Below the fields that are distributed are
defined. Note that the data used by MSCI during the index reviews may differ from the data
distributed.
ATVR Calculation Formulas
1. Monthly Median Traded Value
Taking the median screens out extreme daily trading volumes:
𝑀𝑜𝑛𝑡ℎ𝑙𝑦𝑀𝑒𝑑𝑖𝑎𝑛𝑇𝑟𝑎𝑑𝑒𝑑𝑉𝑎𝑙𝑢𝑒𝑀𝑜𝑛𝑡ℎ𝑁 =𝑀𝑒𝑑𝑖𝑎𝑛𝑇𝑟𝑎𝑑𝑒𝑑𝑉𝑎𝑙𝑢𝑒𝑈𝑆𝐷𝑀𝑜𝑛𝑡ℎ𝑁 ∗ 𝑁𝑏𝑂𝑓𝑆𝑒𝑐𝑢𝑟𝑖𝑡𝑦𝑇𝑟𝑎𝑑𝑖𝑛𝑔𝐷𝑎𝑦𝑠
𝑀𝑜𝑛𝑡ℎ𝑁
Where:
𝑀𝑒𝑑𝑖𝑎𝑛𝑇𝑟𝑎𝑑𝑒𝑑𝑉𝑎𝑙𝑢𝑒𝑈𝑆𝐷𝑀𝑜𝑛𝑡ℎ𝑁 = 𝑀𝑒𝑑𝑖𝑎𝑛[𝐷𝑎𝑖𝑙𝑦𝑆𝑒𝑐𝑢𝑟𝑖𝑡𝑦𝑇𝑟𝑎𝑑𝑒𝑑𝑉𝑎𝑙𝑢𝑒𝑈𝑆𝐷𝑀𝑜𝑛𝑡ℎ𝑁]
𝐷𝑎𝑖𝑙𝑦𝑆𝑒𝑐𝑢𝑟𝑖𝑡𝑦𝑇𝑟𝑎𝑑𝑒𝑑𝑉𝑎𝑙𝑢𝑒𝑈𝑆𝐷𝑡 = 𝐷𝑎𝑖𝑙𝑦𝑆𝑒𝑐𝑢𝑟𝑖𝑡𝑦𝑇𝑟𝑎𝑑𝑒𝑑𝑉𝑜𝑙𝑢𝑚𝑒𝑡 ∗ 𝑃𝑟𝑖𝑐𝑒𝑃𝑒𝑟𝑆ℎ𝑎𝑟𝑒𝑡/𝐹𝑋𝑟𝑎𝑡𝑒𝑡
𝑁𝑏𝑂𝑓𝑆𝑒𝑐𝑢𝑟𝑖𝑡𝑦𝑇𝑟𝑎𝑑𝑖𝑛𝑔𝐷𝑎𝑦𝑠𝑀𝑜𝑛𝑡ℎ𝑁
is the number of days in the month where the
security has been traded
𝐷𝑎𝑖𝑙𝑦𝑆𝑒𝑐𝑢𝑟𝑖𝑡𝑦𝑇𝑟𝑎𝑑𝑒𝑑𝑉𝑜𝑙𝑢𝑚𝑒𝑡 represents the number of securities traded during the
day t
𝑃𝑟𝑖𝑐𝑒𝑃𝑒𝑟𝑆ℎ𝑎𝑟𝑒𝑡 is the price per share of the security s at time t.
𝐹𝑋𝑟𝑎𝑡𝑒𝑡 is the FX rate of the price currency of security s vs. USD at time t. It is the value
of 1 USD in foreign currency.
2. Monthly Traded Value Ratio (MTVR)
Dividing the monthly median traded value of a security by its free float-adjusted security
market capitalization at the end of the month gives the monthly median traded value ratio

MSCI.COM | PAGE 47 OF 123 © 2018 MSCI Inc. All rights reserved. Please refer to the disclaimer at the end of this document.
MSCI INDEX CALCULATION METHODOLOGY | JANUARY 2018
𝑀𝑇𝑉𝑅_𝐹𝐼𝐹𝐴𝑑𝑗𝑀𝑜𝑛𝑡ℎ𝑁 =𝑀𝑜𝑛𝑡ℎ𝑙𝑦𝑀𝑒𝑑𝑖𝑎𝑛𝑇𝑟𝑎𝑑𝑒𝑑𝑉𝑎𝑙𝑢𝑒𝑀𝑜𝑛𝑡ℎ𝑁
𝑆𝑒𝑐𝑢𝑟𝑖𝑡𝑦𝐹𝐼𝐹𝐴𝑑𝑗𝑢𝑠𝑡𝑒𝑑𝑀𝑎𝑟𝑘𝑒𝑡𝐶𝑎𝑝𝑈𝑆𝐷𝑀𝑜𝑛𝑡ℎ𝑁_𝑒𝑛𝑑𝑑𝑎𝑦
𝑀𝑇𝑉𝑅_𝐷𝐼𝐹𝐴𝑑𝑗𝑀𝑜𝑛𝑡ℎ𝑁 =𝑀𝑜𝑛𝑡ℎ𝑙𝑦𝑀𝑒𝑑𝑖𝑎𝑛𝑇𝑟𝑎𝑑𝑒𝑑𝑉𝑎𝑙𝑢𝑒𝑀𝑜𝑛𝑡ℎ𝑁
𝑆𝑒𝑐𝑢𝑟𝑖𝑡𝑦𝐷𝐼𝐹𝐴𝑑𝑗𝑢𝑠𝑡𝑒𝑑𝑀𝑎𝑟𝑘𝑒𝑡𝐶𝑎𝑝𝑈𝑆𝐷𝑀𝑜𝑛𝑡ℎ𝑁_𝑒𝑛𝑑𝑑𝑎𝑦
Where:
𝑆𝑒𝑐𝑢𝑟𝑖𝑡𝑦𝐹𝐼𝐹𝐴𝑑𝑗𝑢𝑠𝑡𝑒𝑑𝑀𝑎𝑟𝑘𝑒𝑡𝐶𝑎𝑝𝑈𝑆𝐷𝑀𝑜𝑛𝑡ℎ𝑁_𝑒𝑛𝑑𝑑𝑎𝑦
is the security market
capitalization at the end of the month,
𝑆𝑒𝑐𝑢𝑟𝑖𝑡𝑦𝐴𝑑𝑗𝑢𝑠𝑡𝑒𝑑𝑀𝑎𝑟𝑘𝑒𝑡𝐶𝑎𝑝𝑈𝑆𝐷𝑀𝑜𝑛𝑡ℎ𝑁_𝑒𝑛𝑑𝑑𝑎𝑦, adjusted with FIF
𝑆𝑒𝑐𝑢𝑟𝑖𝑡𝑦𝐷𝐼𝐹𝐴𝑑𝑗𝑢𝑠𝑡𝑒𝑑𝑀𝑎𝑟𝑘𝑒𝑡𝐶𝑎𝑝𝑈𝑆𝐷𝑀𝑜𝑛𝑡ℎ𝑁_𝑒𝑛𝑑𝑑𝑎𝑦
is the security market
capitalization at the end of the month,
𝑆𝑒𝑐𝑢𝑟𝑖𝑡𝑦𝐴𝑑𝑗𝑢𝑠𝑡𝑒𝑑𝑀𝑎𝑟𝑘𝑒𝑡𝐶𝑎𝑝𝑈𝑆𝐷𝑀𝑜𝑛𝑡ℎ𝑁_𝑒𝑛𝑑𝑑𝑎𝑦 , adjusted with DIF
3. Annualized Traded Value Ratio (ATVR)
𝐴𝑇𝑉𝑅_𝐹𝐼𝐹𝐴𝑑𝑗𝑀𝑜𝑛𝑡ℎ𝑁 = ∑ 𝑀𝑇𝑉𝑅_𝐹𝐼𝐹𝐴𝑑𝑗𝑀𝑜𝑛𝑡ℎ_𝑖
𝑖∈𝑁,𝑁−1...𝑁−11
𝐴𝑇𝑉𝑅_𝐷𝐼𝐹𝐴𝑑𝑗𝑀𝑜𝑛𝑡ℎ𝑁 = ∑ 𝑀𝑇𝑉𝑅_𝐷𝐼𝐹𝐴𝑑𝑗𝑀𝑜𝑛𝑡ℎ_𝑖
𝑖∈𝑁,𝑁−1...𝑁−11
The ATVR is not calculated when less than 12 months of monthly traded value ratios are
available.
4. Annual Traded Value
The annual traded value is the sum of the monthly median traded values.
𝐴𝑛𝑛𝑢𝑎𝑙𝑇𝑟𝑎𝑑𝑒𝑑𝑉𝑎𝑙𝑢𝑒𝑀𝑜𝑛𝑡ℎ𝑁 = ∑ 𝑀𝑜𝑛𝑡ℎ𝑙𝑦𝑀𝑒𝑑𝑖𝑎𝑛𝑇𝑟𝑎𝑑𝑒𝑑𝑉𝑎𝑙𝑢𝑒𝑀𝑜𝑛𝑡ℎ_𝑖
𝑖∈𝑁,𝑁−1...𝑁−11
The Annual Traded Value is not calculated when less than 12 months of monthly median
traded values are available.

MSCI.COM | PAGE 48 OF 123 © 2018 MSCI Inc. All rights reserved. Please refer to the disclaimer at the end of this document.
MSCI INDEX CALCULATION METHODOLOGY | JANUARY 2018
5. Aggregated information
In the calculation of the aggregated information, the trading volumes in depository receipts
associated with that security, such as ADRs or GDRs, are also considered. It is obtained by
summing up the ATVR of each listing.
Aggregated FIF/DIF adjusted ATVR is the sum of FIF/DIF adjusted ATVR of K securities that
are linked by the same issuer, share class and share type:
𝐴𝑔𝑔𝑟𝑒𝑔𝑎𝑡𝑒𝑑𝐴𝑇𝑉𝑅_𝐹𝐼𝐹𝐴𝑑𝑗𝑀𝑜𝑛𝑡ℎ𝑁 = ∑ 𝐴𝑇𝑉𝑅_𝐹𝐼𝐹𝐴𝑑𝑗𝑀𝑜𝑛𝑡ℎ𝑁,𝑙𝑖𝑛𝑘𝑒𝑑𝑆𝑒𝑐_𝑖
𝑖∉1,2...𝐾
𝐴𝑔𝑔𝑟𝑒𝑔𝑎𝑡𝑒𝑑𝐴𝑇𝑉𝑅_𝐷𝐼𝐹𝐴𝑑𝑗𝑀𝑜𝑛𝑡ℎ𝑁 = ∑ 𝐴𝑇𝑉𝑅_𝐷𝐼𝐹𝐴𝑑𝑗𝑀𝑜𝑛𝑡ℎ𝑁,𝑙𝑖𝑛𝑘𝑒𝑑𝑆𝑒𝑐_𝑖
𝑖∉1,2...𝐾
Aggregated ATVR is calculated even if less than 12 months of monthly median traded values
are available for one, several or all listings. When less than 12 months are available for a
given listing, MSCI will use the ATVR based on the monthly median traded values for the last
6 months, 3 months or 1 month for that listing (depending on data availability).
The Aggregated Annual Traded Value includes trading volumes in depositary receipts or
other alternate listings associated with that security. It is obtained by summing up the
Annual Traded Values of each listing:
𝐴𝑔𝑔𝑟𝑒𝑔𝑎𝑡𝑒𝑑𝐴𝑛𝑛𝑢𝑎𝑙𝑇𝑟𝑎𝑑𝑒𝑑𝑉𝑎𝑙𝑢𝑒𝑀𝑜𝑛𝑡ℎ𝑁 = ∑ 𝐴𝑛𝑛𝑢𝑎𝑙𝑇𝑟𝑎𝑑𝑒𝑑𝑉𝑎𝑙𝑢𝑒𝑀𝑜𝑛𝑡ℎ𝑁,𝑙𝑖𝑛𝑘𝑒𝑑𝑆𝑒𝑐_𝑖
𝑖∉1,2...𝐾

MSCI.COM | PAGE 49 OF 123 © 2018 MSCI Inc. All rights reserved. Please refer to the disclaimer at the end of this document.
MSCI INDEX CALCULATION METHODOLOGY | JANUARY 2018
APPENDIX III: EXCHANGE RATES
Closing Spot Rates
Until December 30, 1993, MSCI used the exchange rates taken from the Reuters multi
contributor pages at 4.00PM CET.
Since December 31st, 1993, MSCI has been using the WM/Reuters Closing Spot Rates, taken
at 4PM London time, for all the countries for which it provides indexes, except for the Latin
American countries. At the time, MSCI established a special foreign exchange policy for Latin
American countries in view of the risks of important movement of currencies in some of
these markets between the 4PM London closing and the close of the respective Latin
American markets.
Starting July 26, 2000, MSCI began to use the WM/Reuters Closing Spot Rates, taken at 4PM
London time, for all the countries it provides indexes including Latin American countries.
In case WM/Reuters does not provide spot rates for specific markets on given days (for
example Christmas Day and New Year Day), the previous business day’s rates are used.
MSCI independently monitors the exchange rates on all its indexes. MSCI may under
exceptional circumstances elect to use alternative sources of exchange rates if MSCI
determines that the WM/Reuters rates are not reflective of market circumstances for a
given currency on a particular day (for example divergence between onshore and offshore
rates). In such circumstances, an announcement would be sent to clients with the related
information. All such determinations are made by the MSCI Equity Index Committee (EIC). If
appropriate, MSCI may conduct a consultation with the investment community to gather
feedback on the most relevant exchange rate.
Forward Rates
MSCI uses the spot and 1-month premium/discount as provided by WM/Reuters to compute
the 1-month Forward exchange rates. These values are taken at 4PM London time.
In case WM/Reuters does not provide forward rates for specific markets on given days (for
example Christmas Day and New Year Day), the previous business day’s rates are used.

MSCI.COM | PAGE 50 OF 123 © 2018 MSCI Inc. All rights reserved. Please refer to the disclaimer at the end of this document.
MSCI INDEX CALCULATION METHODOLOGY | JANUARY 2018
APPENDIX IV: SINGAPORE & MALAYSIA – A HISTORY OF INCLUSION
IN THE EMERGING AND DEVELOPED MARKETS INDEXES
Stock Markets
Stock trading has a long history in Singapore dating back to the 1930’s. In 1960 the Malayan
Stock Exchange started trading shares publicly. There were trading floors in both Singapore
and Kuala Lumpur linked as a single market. When Singapore split from Malaysia the stock
exchange continued to operate as one under the name Stock Exchange of Malaysia and
Singapore (SEMS). In 1973 the accord that allowed for the convertibility at par between the
Singapore Dollar and Malaysian Ringgit was terminated. This led to the separation of SEMS
into the Kuala Lumpur Stock Exchange (KLSE) and the Stock Exchange of Singapore (SES).
Malaysian companies continued to trade heavily in Singapore.
MSCI Indexes
On December 1st 1972, the MSCI Singapore/Malaysia Index was added to the World Index.
The index was developed in cooperation with the Overseas-Chinese Banking Corporation,
which published the same index under the name O.C.B.C. Index. As is the case with other
MSCI Indexes the purpose was to track those securities representative of Singapore.
However as approximately half the market capitalization and liquidity of the SES was due to
Malaysian shares the index was designed to incorporate both Singaporean companies as
well as those Malaysian shares that traded in Singapore. This aspect was different from
other MSCI Indexes, as the norm is to only include domestically listed shares. In light of the
long integrated history of the Malay Peninsula and Singapore, and the continued dual listing
of shares, it was deemed to be more representative to include these Malaysian companies
as representative of the opportunity set of the SES.
MSCI launched its emerging market series on January 1, 1988. Among other country indexes
was an index of Malaysia with 59 securities. As MSCI was now covering emerging markets
the MSCI Mexico Index was pulled out of MSCI World. The World Index was to be
considered a developed market index.
In 1989 the Malaysian government announced that Malaysian companies would be asked to
delist their shares from the SES. Previously the government had prohibited newly listed
shares of Malaysian companies from listing on the SES. In November 1989, reacting to the
Malaysian government announcement, MSCI initially announced its intention to remove
Malaysian securities from the Singapore/Malaysia index. The following month MSCI
announced that the terms and timing of the Malaysian delisting were too ambiguous. As a

MSCI.COM | PAGE 51 OF 123 © 2018 MSCI Inc. All rights reserved. Please refer to the disclaimer at the end of this document.
MSCI INDEX CALCULATION METHODOLOGY | JANUARY 2018
result MSCI would take a wait and see approach prior to removing any Malaysian securities
from the Singapore/Malaysia index. As a result the Malaysian shares in the MSCI
Singapore/Malaysia Index were effectively frozen or grandfathered. Over time, some of
these shares were no longer listed on Singapore but continued to be included in the index
using the Ringgit price at which they were traded in Kuala Lumpur.
In January 1992 MSCI announced a change. The Singapore/Malaysia index was now
composed of a representative sampling of Singaporean companies coupled with
grandfathered Malaysian securities that used to trade in Singapore but were no longer
trading there as a result of the delisting requirement. Malaysia was clearly an emerging
market, for example its GDP per capita was $2,340 considerably below that of Spain
($10,920), the lowest country that was currently in the MSCI World Index. Nonetheless
many developed market investors had historically purchased Malaysian companies as a
result of some Malaysian companies being included in the MSCI World and EAFE Indexes.
Deleting all Malaysian companies from the developed market indexes could have been very
disruptive to the markets. As a result of this dilemma MSCI decided to add Malaysia as a
country to the World and related developed market indexes while continuing to include
Malaysia in the emerging market series. One could not have a credible emerging market
series without the continued inclusion of Malaysia in that series.
Thus Malaysia was to be represented in both the developed and emerging market series. At
the time MSCI acknowledged that the existence of Malaysia in both the developed and
emerging market series was less than ideal. As of April 30th 1993 Malaysia was fully added
to the developed market series, resulting in the addition of approximately 40 securities. This
was because the MSCI Malaysia Index was designed to represent the profile of the entire
Malaysian market whereas the current Malaysian stocks in the World and EAFE Indexes
were selected to reflect the composition of those Malaysian stocks trading in Singapore.
ACWI clients would not have to worry about double counting as Malaysia was represented
at its appropriate market cap weight. The index of Singapore represented the continuation
of the Singapore/Malaysia index and therefore retains its base date of December 31, 1969.
Developed and emerging market indexes excluding Malaysia were calculated for those
clients who preferred a different classification.
The Asian Crisis
The “Asian Crisis”, starting in 1997 with the devaluation of the Thai Baht eventually spread
to Malaysia. On September 1st 1998 Malaysia imposed a series of restrictions on the
convertibility of the Ringgit. These controls effectively prohibited the repatriation of funds.
On Sept 4th, 1998 MSCI announced that effective Sept 30th Malaysia would be removed
from the EAFE and World Indexes and that its status in EMF was under review. In the MSCI
MSCI.COM | PAGE 52 OF 123 © 2018 MSCI Inc. All rights reserved. Please refer to the disclaimer at the end of this document.
MSCI INDEX CALCULATION METHODOLOGY | JANUARY 2018
announcement of the change it was stated “…the limitations in repatriating investment
proceeds would seriously challenge the objective and integrity of the MSCI Developed
Markets Indexes, were the Malaysian securities to remain in these indexes.” These
restrictions imposed by the government of Malaysia thus ended the legacy issue of
Malaysian securities appearing in both the developed and emerging market series.
On Sept 28th, 1998 MSCI announced that Malaysia would be removed from the MSCI EMF
and ACWI Free series as of the close of November 30th, 1998. As part of the capital controls
imposed, foreign investors became obligated to hold Malaysian securities for a period of
one-year commencing Sept 1st, 1998, before any possible capital repatriation. The
authorities also imposed a fixed exchange rate of 3.8 Ringgit to the US dollar. The measures
taken by the government along with the lack of transparency meant that Malaysia’s
inclusion in the Free series of indexes was no longer justified. A discount of 30% was applied
to the valuation of the MSCI Malaysia Index in US dollars, effective Sept 30th, 1998. The
discount was applied because market forces no longer determined the official exchange
rate.
On February 5th, 1999 MSCI announced that effective February 26th, 1999 the discount
would be reduced to 15%. This followed the Malaysian Government announcement on the
previous day that it was alleviating the restrictions on the repatriation of investments.
As a result of the removal of the restrictions on the repatriation of capital, MSCI announced
on August 12, 1999, the removal of the 15% discount effective August 30, 1999. On
November 23, 1999, MSCI announced that Malaysia would be re-included fully at 100% in
the EMF and AC Free indexes as of May 31, 2000.
MSCI Malaysia Indexes will be removed from the MSCI Emerging Markets Free (EMF) series
and the MSCI All Country (AC) Free Indexes effective as of the close of 30th November, 1998
Of course Malaysia was not readmitted to the developed market series, as its inclusion there
was a result of the previously explained anomaly.
Quick Facts
Malaysia was part of the Developed Market indexes:
From December 1, 1972 to May 2, 1993, MSCI calculated a combined index, the
Singapore/Malaysia index - due to the history of Malaysian securities trading in
Singapore.
From May 3, 1993 up to the close of Sep 30, 1998, Malaysia was part of DM as an
individual country (separated from Singapore).

MSCI.COM | PAGE 53 OF 123 © 2018 MSCI Inc. All rights reserved. Please refer to the disclaimer at the end of this document.
MSCI INDEX CALCULATION METHODOLOGY | JANUARY 2018
Malaysia has been part of the Emerging Market indexes from 1987 to present:
With a discount of 30% from Sep 30, 1998 to Feb 25, 1999
With a discount of 15% from Feb 26, 1999 to Aug 29, 1999
With no discount since Aug 30, 1999
Malaysia has been part of the EMF index:
From 1987 to Nov 30, 1998
And since June 1, 2000

MSCI.COM | PAGE 54 OF 123 © 2018 MSCI Inc. All rights reserved. Please refer to the disclaimer at the end of this document.
MSCI INDEX CALCULATION METHODOLOGY | JANUARY 2018
APPENDIX V: SINGAPORE AND SINGAPORE FREE
What is the difference between the MSCI Singapore Index and the MSCI Singapore Free
Index; the MSCI EAFE Index and the MSCI EAFE Free Index; the MSCI World Index and the
MSCI World Free Index?
In the 1990s, Singapore enacted a system to prevent companies in strategic industries
(mainly banks, airlines and the media) from being controlled by foreigners. Certain shares
had limits on the percent that could be purchased by foreigners. Once the limit was reached,
these shares traded at a premium price. The MSCI Singapore Free Index used the prices at
which foreigners could trade.
MSCI also started calculating the regional indexes, MSCI World Free Index, MSCI EAFE Free
Index and MSCI Pacific Free Index to include the MSCI Singapore Free Index as well as to
reflect investment restrictions in some of the Nordic countries and Switzerland. The MSCI
Singapore Index (non-free version) reflected the investment opportunities applicable to
domestic investors.
In May of 1999, the foreign ownership restrictions in Singapore were lifted and as of that
date, the MSCI Singapore Index and MSCI Singapore Free Index and the corresponding
regional developed market Free and non-Free indexes have had the same constituent
market caps and performance. Only the absolute index levels continue to differ. MSCI will
continue both the Free and Non-Free versions of MSCI Singapore Index, MSCI EAFE Index
and MSCI World Index to reflect the differing history.

MSCI.COM | PAGE 55 OF 123 © 2018 MSCI Inc. All rights reserved. Please refer to the disclaimer at the end of this document.
MSCI INDEX CALCULATION METHODOLOGY | JANUARY 2018
APPENDIX VI: WITHHOLDING TAX RATES
Country Of Incorporation Withholding Tax
Rates (%)(1)
Country Of Incorporation Withholding Tax
Rates (%)(1)
Code Name Foreign Domestic
Code Name Foreign Domestic
AE United Arab Emirates 0 0
KR Korea 22
AN Netherlands Antilles 0
KW Kuwait 0 0
AR Argentina 10
KY Cayman Islands 0
AT Austria 27.5
KZ Kazakhstan 15
AU Australia (2)
30
LB Lebanon 10
BA Bosnia & Herzegovina 5
LI Liechtenstein 4
BD Bangladesh 20
LK Sri Lanka 10
BE Belgium 30
LR Liberia 15
BF Burkina Faso 12.5 LT Lithuania 15
BG Bulgaria 5
LU Luxembourg 15
BH Bahrain 0 0
MA Morocco 15
BM Bermuda 0
MH Marshall Islands 0
BR Brazil (3)
0
MK Macedonia 10
BS Bahamas 0
MU Mauritius 0
BW Botswana 7.5
MT Malta 0
CA Canada 25
MX Mexico (9)
10
CH Switzerland 35
MY Malaysia (5)
0
CI Ivory Coast 10 NG Nigeria 10
CL Chile 35
NL Netherlands 15
CN China (4)
0 or 10 10
NO Norway 25
CO Colombia 5
NZ New Zealand 15
CW Curacao 0
OM Oman 10 0
CY Cyprus 0
PA Panama 10
CZ Czech Republic 35
PE Peru 5
DE Germany 26.375 PG Papua New Guinea 15
DK Denmark 27
PH Philippines 30
EE Estonia 0
PK Pakistan(11)
15
EG Egypt 10
PL Poland 19
ES Spain 19
PR Puerto Rico 10
FI Finland 30
PS Palestine 0

MSCI.COM | PAGE 56 OF 123 © 2018 MSCI Inc. All rights reserved. Please refer to the disclaimer at the end of this document.
MSCI INDEX CALCULATION METHODOLOGY | JANUARY 2018
Country Of Incorporation Withholding Tax
Rates (%)(1)
Country Of Incorporation Withholding Tax
Rates (%)(1)
Code Name Foreign Domestic
Code Name Foreign Domestic
FO Faroe Islands 35
PT Portugal 25
FR France 30
QA Qatar 0 0
GB United Kingdom (6,10)
0
RO Romania 5
GG Guernsey 0
RS Serbia 25
GH Ghana 8
RU Russia 15
GI Gibraltar 0
SA Saudi Arabia 5 0
GR Greece 15
SE Sweden 30
HK Hong Kong 0
SG Singapore (7)
0
HR Croatia 12
SI Slovenia 15
HU Hungary 0
SN Senegal 10
ID Indonesia 20
TG Togo 13
IE Ireland 20
TH Thailand 10
IL Israel 25
TN Tunisia 5
IM Isle Of Man 0
TR Turkey 15
IN India 0 0
TT Trinidad And Tobago 10
IT Italy 26
TW Taiwan(8)
21
JE Jersey 0
UA Ukraine 15
JM Jamaica 33.333
US USA 30 30
JO Jordan 0
VG British Virgin Islands 0
JP Japan 15.315
VN Vietnam 0
KE Kenya 10
ZA South Africa 20
ZW Zimbabwe 10
Notes:
1. Used in the calculation of the MSCI Net Daily Total Return (DTR) Indexes.
Withholding tax rates used are the maximum rates of the company’s country of
incorporation applicable to institutional investors who do not benefit from double
taxation treaties. Foreign rates are used in the MSCI Net DTR International Indexes
and Domestic rates are used in the MSCI Net DTR Domestic Indexes.
2. For Australian dividends, franking percentage and conduit foreign income are taken
into consideration on calculation of the MSCI Net DTR Indexes. The actual

MSCI.COM | PAGE 57 OF 123 © 2018 MSCI Inc. All rights reserved. Please refer to the disclaimer at the end of this document.
MSCI INDEX CALCULATION METHODOLOGY | JANUARY 2018
withholding tax rate for an Australian dividend ranges from 0% to 30%. For details,
please refer to the section 2.3.7.2.1.
3. Interest on capital is subject to a 15% withholding tax.
4. For the MSCI China Index, the dividend withholding tax rates are determined as
follows:
1) Companies incorporated within mainland China, including B-Share and
H-Share, are subject to a 10% withholding tax.
2) Companies that are incorporated outside mainland China.
2.1) Red-Chip and P-Chip are subject to a 0% withholding tax, unless the
company publicly announces that it is a Chinese Tax Resident Enterprise
and therefore subject to a withholding tax of 10%.
2.2) ADRs are subject to a 10% withholding tax, unless a specific
withholding tax of 0% is announced by the companies.
5. Dividends on Real Estate Investment Trusts (REITS) are subject to a 10% withholding
tax.
6. Cash dividends paid by companies incorporated in the United Kingdom include a
10% tax credit. MSCI does not take into consideration the tax credit for both the
gross and net dividend amounts. As there is no withholding tax in the United
Kingdom, the gross and net amounts of the cash dividends to be reinvested in the
MSCI Net Daily Total Return (DTR) indexes are equal.
7. Dividends on Real Estate Investment Trusts (REITS) are subject to a 10% withholding
tax.
8. Dividends on Real Estate Investment Trusts (REITs) are subject to a 15% withholding
tax.
9. Dividends on Real Estate Investment Trusts (REITs) are subject to a 30% withholding
tax.
10. PID components of dividends on Real Estate Investment Trusts (REITs) are subject to
a 20% withholding tax
11. Dividends paid by power utilities companies are subject to 7.5% withholding tax.

MSCI.COM | PAGE 58 OF 123 © 2018 MSCI Inc. All rights reserved. Please refer to the disclaimer at the end of this document.
MSCI INDEX CALCULATION METHODOLOGY | JANUARY 2018
APPENDIX VII: CLOSING PRICES POLICY
Prices used in MSCI End of Day Index Calculations
Unless otherwise indicated, the prices used to calculate the MSCI Indexes are the official exchange closing prices or those figures accepted as such.
The sources listed below are the "standard" MSCI pricing sources.
Country Exchange Reuters
Code
Bloomberg
Code
Market
Identifier
Code
(MIC)
Price used Description (For more detailed information, please contact the relevant exchange)
Closing Prices
availability
(local time)
Argentina Bolsa de Comercio
de Buenos Aires .BA AF XBUE Last traded price
Last round lot trade with a 72 hour settlement basis. Round lots in Argentina-Bolsa de
Comercio de Buenos Aires vary for each stock and are established on a daily basis. 5:00PM
Argentina (US
listed
Depository
Receipts)
NASDAQ Global
Select Market .OQ UW XNGS
See USA
(NASDAQ Global
Select Market)
See USA (NASDAQ Global Select Market)
see USA
(NASDAQ
Global Select
Market)
Argentina (US
listed
Depository
Receipts)
NYSE .N UN XNYS See USA (NYSE) See USA (NYSE) see USA (NYSE)
Australia Australian Stock
Exchange (ASX) .AX AU XASX Official close
The official price is determined during the Closing Single Price Auction (“CSPA”) which takes
place at the end of the normal trading session. If a trade does not occur during CSPA, the
final automatically matched trade during the normal trading session will be used.
4:12PM
Austria Vienna Stock
Exchange .VI AV WBAH Auction close
The chosen price is the price for which the highest number of orders can be executed. The
auction begins at 5:30PM. 5:35PM
Bahrain Bahrain Stock
Exchange .BH BI XBAH Last traded price Last traded price 12:30PM
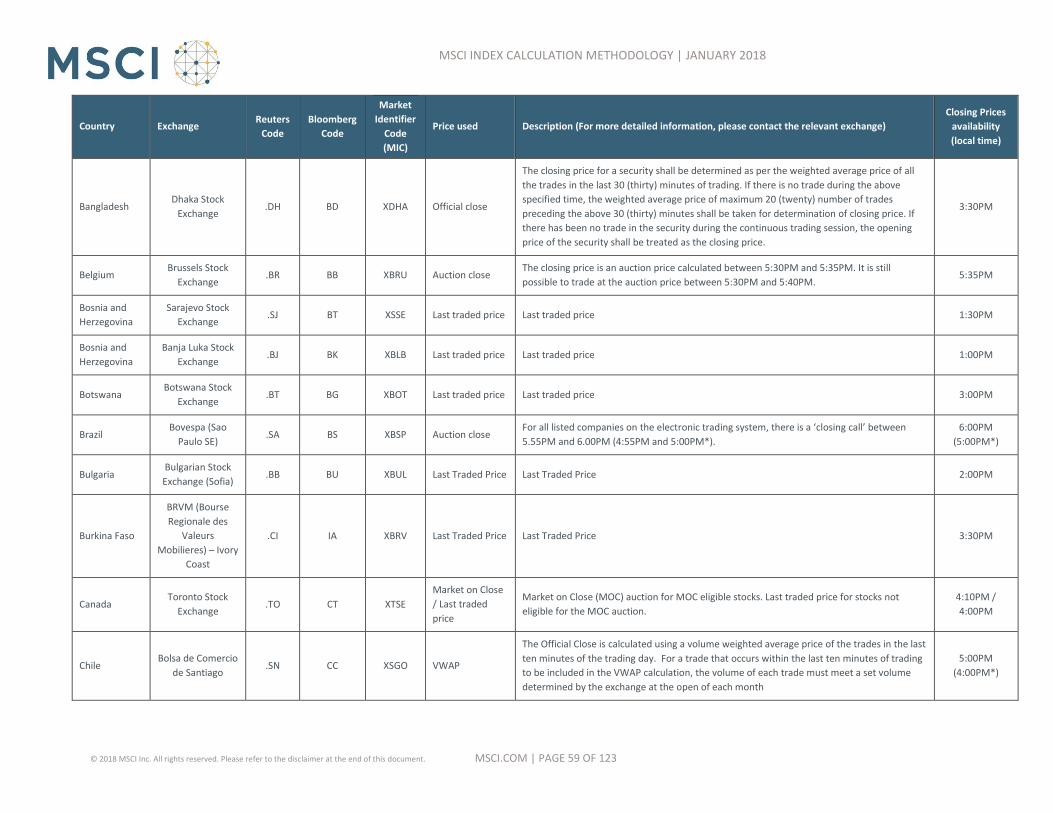
MSCI.COM | PAGE 59 OF 123 © 2018 MSCI Inc. All rights reserved. Please refer to the disclaimer at the end of this document.
MSCI INDEX CALCULATION METHODOLOGY | JANUARY 2018
Country Exchange Reuters
Code
Bloomberg
Code
Market
Identifier
Code
(MIC)
Price used Description (For more detailed information, please contact the relevant exchange)
Closing Prices
availability
(local time)
Bangladesh Dhaka Stock
Exchange .DH BD XDHA Official close
The closing price for a security shall be determined as per the weighted average price of all
the trades in the last 30 (thirty) minutes of trading. If there is no trade during the above
specified time, the weighted average price of maximum 20 (twenty) number of trades
preceding the above 30 (thirty) minutes shall be taken for determination of closing price. If
there has been no trade in the security during the continuous trading session, the opening
price of the security shall be treated as the closing price.
3:30PM
Belgium Brussels Stock
Exchange .BR BB XBRU Auction close
The closing price is an auction price calculated between 5:30PM and 5:35PM. It is still
possible to trade at the auction price between 5:30PM and 5:40PM. 5:35PM
Bosnia and
Herzegovina
Sarajevo Stock
Exchange .SJ BT XSSE Last traded price Last traded price 1:30PM
Bosnia and
Herzegovina
Banja Luka Stock
Exchange .BJ BK XBLB Last traded price Last traded price 1:00PM
Botswana Botswana Stock
Exchange .BT BG XBOT Last traded price Last traded price 3:00PM
Brazil Bovespa (Sao
Paulo SE) .SA BS XBSP Auction close
For all listed companies on the electronic trading system, there is a ‘closing call’ between
5.55PM and 6.00PM (4:55PM and 5:00PM*).
6:00PM
(5:00PM*)
Bulgaria Bulgarian Stock
Exchange (Sofia) .BB BU XBUL Last Traded Price Last Traded Price 2:00PM
Burkina Faso
BRVM (Bourse
Regionale des
Valeurs
Mobilieres) – Ivory
Coast
.CI IA XBRV Last Traded Price Last Traded Price 3:30PM
Canada Toronto Stock
Exchange .TO CT XTSE
Market on Close
/ Last traded
price
Market on Close (MOC) auction for MOC eligible stocks. Last traded price for stocks not
eligible for the MOC auction.
4:10PM /
4:00PM
Chile Bolsa de Comercio
de Santiago .SN CC XSGO VWAP
The Official Close is calculated using a volume weighted average price of the trades in the last
ten minutes of the trading day. For a trade that occurs within the last ten minutes of trading
to be included in the VWAP calculation, the volume of each trade must meet a set volume
determined by the exchange at the open of each month
5:00PM
(4:00PM*)
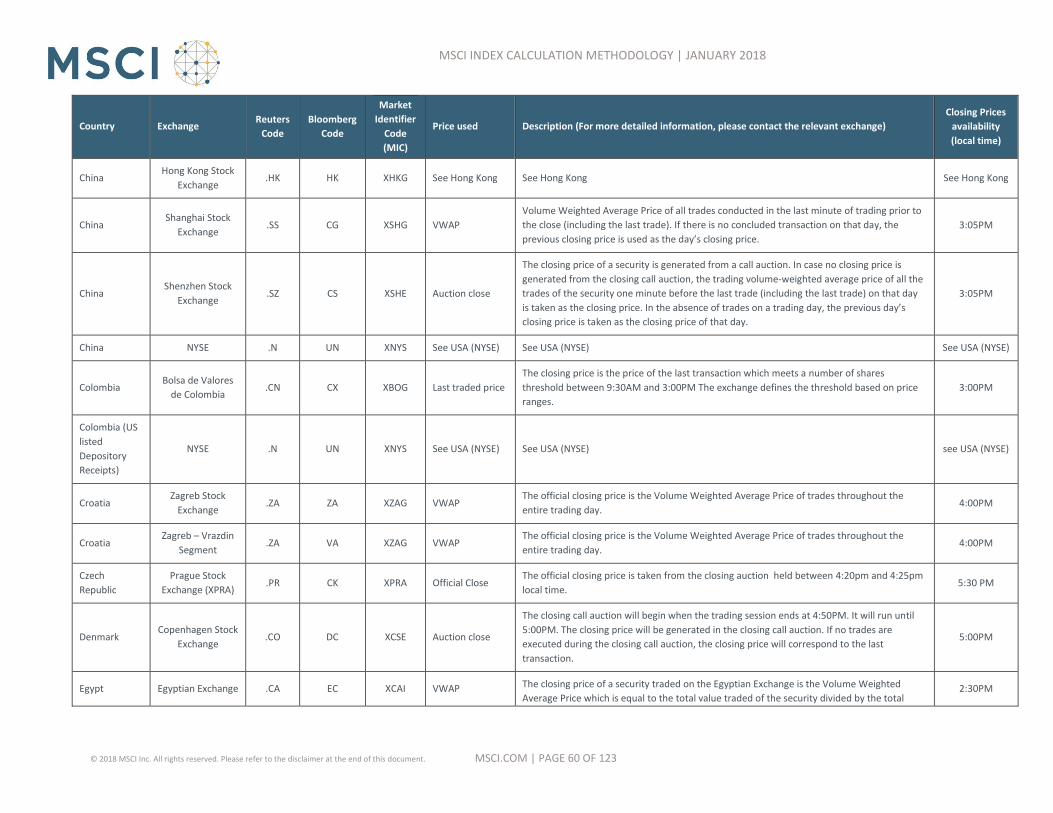
MSCI.COM | PAGE 60 OF 123 © 2018 MSCI Inc. All rights reserved. Please refer to the disclaimer at the end of this document.
MSCI INDEX CALCULATION METHODOLOGY | JANUARY 2018
Country Exchange Reuters
Code
Bloomberg
Code
Market
Identifier
Code
(MIC)
Price used Description (For more detailed information, please contact the relevant exchange)
Closing Prices
availability
(local time)
China Hong Kong Stock
Exchange .HK HK XHKG See Hong Kong See Hong Kong See Hong Kong
China Shanghai Stock
Exchange .SS CG XSHG VWAP
Volume Weighted Average Price of all trades conducted in the last minute of trading prior to
the close (including the last trade). If there is no concluded transaction on that day, the
previous closing price is used as the day’s closing price.
3:05PM
China Shenzhen Stock
Exchange .SZ CS XSHE Auction close
The closing price of a security is generated from a call auction. In case no closing price is
generated from the closing call auction, the trading volume-weighted average price of all the
trades of the security one minute before the last trade (including the last trade) on that day
is taken as the closing price. In the absence of trades on a trading day, the previous day’s
closing price is taken as the closing price of that day.
3:05PM
China NYSE .N UN XNYS See USA (NYSE) See USA (NYSE) See USA (NYSE)
Colombia Bolsa de Valores
de Colombia .CN CX XBOG Last traded price
The closing price is the price of the last transaction which meets a number of shares
threshold between 9:30AM and 3:00PM The exchange defines the threshold based on price
ranges.
3:00PM
Colombia (US
listed
Depository
Receipts)
NYSE .N UN XNYS See USA (NYSE) See USA (NYSE) see USA (NYSE)
Croatia Zagreb Stock
Exchange .ZA ZA XZAG VWAP
The official closing price is the Volume Weighted Average Price of trades throughout the
entire trading day. 4:00PM
Croatia Zagreb – Vrazdin
Segment .ZA VA XZAG VWAP
The official closing price is the Volume Weighted Average Price of trades throughout the
entire trading day. 4:00PM
Czech
Republic
Prague Stock
Exchange (XPRA) .PR CK XPRA Official Close
The official closing price is taken from the closing auction held between 4:20pm and 4:25pm
local time. 5:30 PM
Denmark Copenhagen Stock
Exchange .CO DC XCSE Auction close
The closing call auction will begin when the trading session ends at 4:50PM. It will run until
5:00PM. The closing price will be generated in the closing call auction. If no trades are
executed during the closing call auction, the closing price will correspond to the last
transaction.
5:00PM
Egypt Egyptian Exchange .CA EC XCAI VWAP The closing price of a security traded on the Egyptian Exchange is the Volume Weighted
Average Price which is equal to the total value traded of the security divided by the total 2:30PM

MSCI.COM | PAGE 61 OF 123 © 2018 MSCI Inc. All rights reserved. Please refer to the disclaimer at the end of this document.
MSCI INDEX CALCULATION METHODOLOGY | JANUARY 2018
Country Exchange Reuters
Code
Bloomberg
Code
Market
Identifier
Code
(MIC)
Price used Description (For more detailed information, please contact the relevant exchange)
Closing Prices
availability
(local time)
volume traded of the same security, only if the total executed volume exceeds the 0.5 % of
the average volume (calculated based on three month average) and the total value exceeds
10,000 EGP or equivalent in other currencies, otherwise the previous day’s closing price is
considered to be the official closing price.
Estonia Tallinn Stock
Exchange .TL ET XTAL Auction Close
In the course of the closing auction, transaction orders are matched in the order book
according to the equilibrium price. The equilibrium price is achieved only if the prices of buy
and sell orders entered in the order book are crossing or equal. An auction is not held unless
there are transaction orders with crossing prices.
4:00PM
Finland Helsinki Stock
Exchange .HE FH XHEL Auction close
As of Sep 27 2004, the official closing price is the result of the closing call which occurs during
the last 10 minutes of trading. If no trades are matched in the closing call then the last trade
prior to the auction will be defined as the closing price.
6:30PM
France Paris Stock
Exchange .PA FP XPAR Auction close
The closing price is an auction price calculated between 5:30PM and 5:35PM. It is still
possible to trade at the auction price between 5:30PM and 5:40PM. 5:35PM
Germany
(XETRA) XETRA Exchange .DE GY XETR Auction close
The Auction price is defined during the auction that closes the trading session. The chosen
price is the price for which the highest number of orders can be executed. 5:35PM
Ghana Ghana Stock
Exchange .GH GN XGHA VWAP
The official closing price is the Volume Weighted Average Price of trades throughout the
entire trading day. 3:00PM
Greece Athens Stock
Exchange .AT GA XATH Auction close
The closing price is determined through a call auction at the conclusion of the continuous
trading session, whereby the price at which the greatest trading volume is attained is the
auction close price. If there is no price set by the call auction, the closing price will be the
VWAP of the last 30% of trades.
5:20PM
Hong Kong Hong Kong Stock
Exchange .HK HK XHKG
Auction Close /
Median Price
If there is closing auction session for the security, final Indicative Equilibrium Price (IEP)
would be taken as auction close price. Otherwise, median price would be applied. The
median price is determined by taking the median of five nominal prices in the last minute of
the trading hours to avoid the closing price being biased by one single trade. HKSE takes up
to 5 snapshots of the nominal prices at interval of every 15 seconds starting from 3:59PM,
local time.
4:08PM-
4:10PM
Hungary Budapest Stock
Exchange .BU HB XBUD Last traded price Last traded price 5:10PM
India The Bombay Stock
Exchange .BO IB XBOM WAP The Weighted Average Price is defined as the volume weighted average of all orders
executed within the last 15 minutes of the continuous trading session. If there are no trades 3:30PM

MSCI.COM | PAGE 62 OF 123 © 2018 MSCI Inc. All rights reserved. Please refer to the disclaimer at the end of this document.
MSCI INDEX CALCULATION METHODOLOGY | JANUARY 2018
Country Exchange Reuters
Code
Bloomberg
Code
Market
Identifier
Code
(MIC)
Price used Description (For more detailed information, please contact the relevant exchange)
Closing Prices
availability
(local time)
during the last 15 minutes, then the last traded price in continuous trading is taken as the
official close. Bombay Stock Exchange prices are only used for securities not traded on the
NSE.
India National Stock
Exchange of India .NS IS XNSE VWAP
The closing price of a security is the volume weighted average price of the last half hour
(3:00PM-3:30PM). If there are no trades during the last 30 minutes, then the last traded price
is taken as the official close. However, in cases where such prices are not available due to the
delisting from the National Stock Exchange (NSE), official closing prices from the Bombay
Stock Exchange will be used.
3:30PM
Indonesia Jakarta Stock
Exchange .JK IJ XIDX Auction close
The pre-closing session auction results are between 04:00 and 04:05 p.m. JKT. If there is an
auto-matched trade for a security during the closing auction, The auction price will be the
official closing price. If there are trades during the opening auction or during the continuous
trading period but none during the closing auction, the last traded price will be the official
closing price. The previous day’s official closing price will be the official closing price for days
where there are no trades.
4:15PM
Ireland Irish Stock
Exchange .I ID XDUB Auction close
The session ends with a 2 minute auction (between 4:28PM and 4:30PM). If a security is
traded during the closing auction, the auction price will be the official closing price. If there
are trades during the opening auction or during the continuous trading period, but no trades
during the closing auction, the last traded price will be the official closing price. If there are
no trades on a particular day, the previous day’s official closing price will be the official
closing price.
5.05PM
Israel Tel Aviv Stock
Exchange .TA IT XTAE Auction Close
The closing price will be the one set during the closing call alone, where the volume of the
share at the closing call auction will be at least: NIS 400,000 in the TA-25 NIS 200,000 in the
TA-75 NIS 100,000 in the “Mid Cap” index If the closing volume is less than mentioned above,
the price will be set at the weighted average of the latest transaction prices, including those
executed in the closing call.
4:30PM
Italy Italian Stock
Exchange .MI IM MTAA Auction close
The closing auction, including a pre-auction phase that can end at any time within the last
minutes of that actual pre-auction phase. Closing auction, comprising the closing phases and
validation, will end at 5.40PM local time. Where no auction price is available, the reference
price, defined by the exchange as the Volume Weighted average of the last 10% of the day’s
trading volume, will be used.
5:40PM
Ivory Coast
BRVM (Bourse
Regionale des
Valeurs
Mobilieres) – Ivory
.CI IA XBRV Last Traded Price Last Traded Price 3:30PM

MSCI.COM | PAGE 63 OF 123 © 2018 MSCI Inc. All rights reserved. Please refer to the disclaimer at the end of this document.
MSCI INDEX CALCULATION METHODOLOGY | JANUARY 2018
Country Exchange Reuters
Code
Bloomberg
Code
Market
Identifier
Code
(MIC)
Price used Description (For more detailed information, please contact the relevant exchange)
Closing Prices
availability
(local time)
Coast
Jamaica Jamaica Stock
Exchange .JS JA XJAM Average price
The Average Price calculation is the volumes of a stock purchased at different prices, divided
by the cumulative volumes of the stock unit that traded throughout the day. 1:30PM
Japan Nagoya Stock
Exchange .NG JN XNGO Auction close
The closing price is determined during a price auction which takes place at the end of the
normal trading day. During this auction, all orders entered in the individual order book are
aggregated before the execution, and treated as simultaneous orders. In accordance with the
principle of price priority, each buy order is compared with sell orders until its volume and
price are matched. By this method, a single price is determined and this price makes up the
closing price. In the event of a closing auction not happening for a particular day, the last
price (Itayose or special quote method) will be used instead.
3:30PM
Japan Osaka Securitites
Exchange .OS JO XOSE Auction close
The closing price is determined during a price auction which takes place at the end of the
normal trading day. During this auction, all orders entered in the individual order book are
aggregated before the execution, and treated as simultaneous orders. In accordance with the
principle of price priority, each buy order is compared with sell orders until its volume and
price are matched. By this method, a single price is determined and this price makes up the
closing price. In the event of a closing auction not happening for a particular day, the last
price (Itayose or special quote method) will be used instead.
3:10PM
Japan Tokyo Stock
Exchange .T JT XTKS Auction close
The closing price is determined during a price auction which takes place at the end of the
normal trading day. During this auction, all orders entered in the individual order book are
aggregated before the execution, and treated as simultaneous orders. In accordance with the
principle of price priority, each buy order is compared with sell orders until its volume and
price are matched. By this method, a single price is determined and this price makes up the
closing price. In the event of a closing auction not happening for a particular day, the last
price (Itayose or special quote method) will be used instead.
3:00PM
Japan JASDAQ .Q JQ XJAS Auction close
The closing price is determined during a price auction which takes place at the end of the
normal trading day. During this auction, all orders entered in the individual order book are
aggregated before the execution, and treated as simultaneous orders. In accordance with the
principle of price priority, each buy order is compared with sell orders until its volume and
price are matched. By this method, a single price is determined and this price makes up the
closing price. In the event of a closing auction not happening for a particular day, the last
price (Itayose or special quote method) will be used instead.
3:10PM
Jordan Amman Stock
Exchange .AM JR XAMM Last traded price Last traded price 12:40PM

MSCI.COM | PAGE 64 OF 123 © 2018 MSCI Inc. All rights reserved. Please refer to the disclaimer at the end of this document.
MSCI INDEX CALCULATION METHODOLOGY | JANUARY 2018
Country Exchange Reuters
Code
Bloomberg
Code
Market
Identifier
Code
(MIC)
Price used Description (For more detailed information, please contact the relevant exchange)
Closing Prices
availability
(local time)
Kazakhstan Kazakhstan Stock
Exchange .KZ KZ XKAZ Last traded price Last traded price 6:00PM
Kazakhstan
(UK listed
Depository
Receipts)
London Stock
Exchange .L LI XLON see UK (SETS) see UK (SETS) see UK (SETS)
Kenya Nairobi Stock
Exchange .NR KN XNAI VWAP
The closing price of a security shall be the Volume Weighted Average Price (VWAP) or
transactions executed during the last hour of trading of the specific security. If the security
does not trade within the last hour the closing price will be the average price calculated for
the session.
3:00PM
Korea KSE .KS KP XKRX Auction close The closing price is the price for which the highest number of orders can be executed during
the auction. The auction starts 10 minutes before the official close at 3:00PM. 3:00PM
Korea KOSDAQ .KQ KQ XKOS Auction close The closing price is the price for which the highest number of orders can be executed during
the auction. The auction starts 10 minutes before the official close at 3:00PM. 3:00PM
Kuwait Kuwait Stock
Exchange .KW KK XKUW Auction close
The closing price will be determined by an auction held at the close of trading with a pre-
auction period (without matching) of two minutes, where orders cannot be cancelled or
modified
12:30PM
Lebanon Beirut Stock
Exchange .BY LB XBEY Last traded price Last traded price 12:30PM
Lithuania Vilnius Stock
Exchange .VL LH XLIT
Closing Call
Auction
In the course of the closing auction, transaction orders are matched in the order book
according to the equilibrium price. The equilibrium price is calculated to be the price where
in a particular Order Book the highest buy price is higher than or equal to the lowest sell
price.
4:00PM
Malaysia The Bursa
Malaysia Berhad .KL MK XKLS Last traded price Last traded price 5:00PM
Mauritius
The Stock
Exchange of
Mauritius
.MZ MP XMAU Last traded price Last traded price 1:30PM
Mexico Bolsa Mexicana de
Valores .MX MM XMEX
Weighted
average price Weighted Average Price of the last 20 minutes of trading 3:00PM

MSCI.COM | PAGE 65 OF 123 © 2018 MSCI Inc. All rights reserved. Please refer to the disclaimer at the end of this document.
MSCI INDEX CALCULATION METHODOLOGY | JANUARY 2018
Country Exchange Reuters
Code
Bloomberg
Code
Market
Identifier
Code
(MIC)
Price used Description (For more detailed information, please contact the relevant exchange)
Closing Prices
availability
(local time)
Morocco Bourse De
Casablanca .CS MC XCAS Last traded price Last traded price 3:30PM
Netherlands EuroNext
Amsterdam .AS NA XAMS Auction price
The closing price is an auction price calculated between 5:30PM and 5:35PM. It is still
possible to trade at the auction price between 5:30PM and 5:40PM. 5:35PM
New Zealand New Zealand
Exchange Limited .NZ NZ XNZE Last traded price Last traded price 5:00PM
Nigeria Nigeria Stock
Exchange .LG NL XNSA Official Close
The official closing price is defined as the last trade with volume greater than 50,000 shares.
If there are no trades over 50,000 shares during the current trading day, the previous close is
carried over
2:30PM
Norway Oslo Stock
Exchange .OL NO XOSL Auction close
The official closing prices is determined during a closing auction which takes place at the end
of the continuous trading between 16:20 and 16:30. When the closing auction for a particular
security cannot be completed, the last traded price before the start of the auction will be
used.
5:30PM
Oman Oman Muscat
Exchange .OM OM XMUS VWAP
The closing price is considered to be the volume weighted average price. The closing price
will not change unless a minimum number of securities are traded. This minimum is 500
Shares for securities listed in the Regular & Parallel markets and 2000 for securities listed in
the Third market. In case traded securities do not exceed the specified threshold for their
market, the closing price will equal the previous close.
1:00PM
Pakistan Karachi Stock
Exchange .KA PK XKAR Official Close
The closing price is determined by the volume weighted average price of the last 30 minutes
trades of that security for the day. In case of no trading in a particular security during the last
30 minutes of the day, the closing price is the volume weighted average price for the last
traded 30 minutes of that security.
2:15PM (Mon-
Thu), 4:00PM
(Fri)
Peru Bolsa De Valores
de Lima .LM PE XLIM Last traded price Last round lot regular trade 3:00PM
Peru (US listed
Depository
Receipts)
NYSE .N UN XNYS see USA (NYSE) see USA (NYSE) see USA (NYSE)
Philippines Philippine Stock
Exchange .PS PM XPHS Closing Price
The Closing Price is determined using an auction process during the Pre-Close period. If there
is no computed Closing Price for that trading day, the Closing Price taken is the price of the
last transaction during the trading day’s Continuous Period.
3:30PM

MSCI.COM | PAGE 66 OF 123 © 2018 MSCI Inc. All rights reserved. Please refer to the disclaimer at the end of this document.
MSCI INDEX CALCULATION METHODOLOGY | JANUARY 2018
Country Exchange Reuters
Code
Bloomberg
Code
Market
Identifier
Code
(MIC)
Price used Description (For more detailed information, please contact the relevant exchange)
Closing Prices
availability
(local time)
Poland Warsaw Stock
Exchange .WA PW XWAR Auction Close
The closing price is determined in an auction procedure in which the closing price will be
based on orders submitted during the closing phase. If no orders are placed during the
closing phase then the closing price will be that of the last transaction.
5:10PM
Portugal EuroNext Lisbon .LS PL XLIS Auction close The closing price is an auction price calculated between 5:30PM and 5:35PM. It is still
possible to trade at the auction price between 5:30PM and 5:40PM. 5:35PM
Qatar Doha Securities
Market .QA QD DSMD Auction Close
The closing price is an auction price set during the closing auction period. If there is no price
set during the closing auction period, the closing price is the last traded price. 12:30PM
Romania Bucharest Stock
Exchange .BX RO XBSE Last traded price Last Traded Price 4:30PM
Russia Moscow Exchange
(MOEX) .MM RX MISX Auction Close
The closing price is an auction price set during the closing auction period. If there is no price
set during the closing auction period, the closing price is the last traded price. 6:50PM
Russia (US
listed
Depository
Receipts)
New York Stock
Exchange .N UN XNYS see USA (NYSE) see USA (NYSE) see USA (NYSE)
Russia (UK
listed
Depository
Receipts)
London Stock
Exchange .L LI XLON see UK (SETS) see UK (SETS) see UK (SETS)
Saudi Arabia Saudi SE
(Tadawul) .SE AB XSAU VWAP
The Official Close is calculated using a Volume Weighted Average Price. The VWAP takes the
average price of trades that occurred in the last 15 minutes before the market closes, where
the total of all traded value of a company is divided by the total traded shares of that
company, resulting in the VWAP closing price. In the case where a security does not trade in
the last 15 minutes before the market closes, the Official Close will be the "last normal price",
defined by the exchange as a trade greater than or equal to 15,000 Saudi Riyals. In the
instance that no normal price is available (no trade equal or above 15,000 Saudi Riyals), the
previous day's Official Close will be used.
3:32PM
Senegal
BRVM (Bourse
Regionale des
Valeurs
Mobilieres) – Ivory
.CI IA XBRV Last Traded Price Last Traded Price 3:30PM

MSCI.COM | PAGE 67 OF 123 © 2018 MSCI Inc. All rights reserved. Please refer to the disclaimer at the end of this document.
MSCI INDEX CALCULATION METHODOLOGY | JANUARY 2018
Country Exchange Reuters
Code
Bloomberg
Code
Market
Identifier
Code
(MIC)
Price used Description (For more detailed information, please contact the relevant exchange)
Closing Prices
availability
(local time)
Coast
Serbia Belgrade SE .BEL SG XBEL VWAP The closing price is considered to be the volume weighted average price. 2:00PM
Singapore
Singapore
Exchange
Securities Trading
.SI SP XSES Auction close
At 5:00PM, all unmatched orders are carried forward to Pre-Close Routine, which runs for 6
minutes and consists of a Pre-Close Period and a Non-Cancel Period. Similarly, orders can be
entered, amended or cancelled during the Pre-Close Period (5:00PM – 5:05PM). During the
Non-Cancel Period (5:05PM – 5:06PM), orders are matched and executed at a Closing price
computed for the day, while unmatched orders will become void.
5:06PM
Slovenia Ljubljana Stock
Exchange .LJ SV XLJU Official Close
The Official Closing Price is defined as the Auction Price formed during the Closing Auction. If
there are no trades executed for a given security during the Closing Auction, the Closing Price
will be the last trade of the day. If there are no trades executed in a given security on a given
day, the closing price for the day will be the closing price of the previous trading day.
1:00PM
South Africa Johannesburg
Stock Exchange .J SJ XJSE
Last traded price
/ VWAP
The closing prices on securities traded on the South Africa Exchange will be calculated based
on the price at which trades occurred in a closing execution. In this closing execution, the last
traded price will be the official closing price, unless there is a higher bid price or a lower ask
offer, which will then be used as the closing price. In the event that there is no closing
execution, then a Volume Weighted Average Price (VWAP) taken over the last 10 minutes of
trading leading up to the “closing auction” is used.
5:05PM
Spain Mercado Continuo
CATS .MC SQ XMCE Auction price
The session ends with a 5 minute auction (between 5:30PM and 5:35PM) and a random
closing of 30 seconds. The resulting auction price will be the session’s Closing price. In case
an Auction price does not exist, the closing price will be the price of the last 500 traded units
closest to their weighted average. If two prices have the same difference with respect to this
weighted price, the price will be the last one executed. If 500 units have not been traded, the
closing price will be the price of the previous session.
5:35PM
Sri Lanka Colombo Stock
Exchange .CM SL XCOL VWAP
Closing price is defined as the Volume Weighted Average Price (VWAP) of trades executed
during the last one hour of trading of the specific security. If the security does not trade
during such one hour the closing price will be the VWAP calculated for the period of time it
has traded.
2:30PM
Sweden Stockholm Stock
Exchange .ST SS XSTO Auction price
The official closing price is the result of the closing call which occurs during the last 10
minutes of trading. If no trades are matched in the closing call then the last trade prior to the
auction will be defined as the closing price.
5:30PM
Switzerland The Swiss
Exchange (SWX) .S SE XSWX Auction price Closing price is the result of the closing auction (the auction pre-opening starting at 5:20PM,
and the auction being run at 5:30PM). If no price update occurs during that auction, the last 5:30PM

MSCI.COM | PAGE 68 OF 123 © 2018 MSCI Inc. All rights reserved. Please refer to the disclaimer at the end of this document.
MSCI INDEX CALCULATION METHODOLOGY | JANUARY 2018
Country Exchange Reuters
Code
Bloomberg
Code
Market
Identifier
Code
(MIC)
Price used Description (For more detailed information, please contact the relevant exchange)
Closing Prices
availability
(local time)
Virt-X
.VX
VX
XVTX
paid price on the exchange will represent the reference price. If there is no paid price for the
given security that day, the reference price will be calculated by either taking the bid-price, if
the bid is higher than the reference price, or it will take the ask-price if the ask is lower than
the reference price.
Taiwan Taiwan Stock
Exchange .TW TT XTAI Auction price
The closing price is determined by a closing call auction. The Exchange will accumulate orders
for 5 minutes (from 1:25 p.m. to 1:30 p.m.) before the closing call auction. If there is no
closing auction for a security, the last traded price will be used.
1:30PM
Thailand
The Stock
Exchange Of
Thailand
.BK TB XBKK Auction price
The closing price is defined by using the random call auction method. The closing auction can
take place anytime between 4:35PM and 4:40PM local time. This method apply to securities
trade on both main board and foreign board of stock exchange of Thailand.
4:40PM
Trinidad and
Tobago
Trinidad and
Tobago Stock
Exchange
.JM TP XTRN Official Close
The closing price is the Volume Weighted Average Price, calculated as the total value of
shares traded in the day divided by the total volume of shares traded in the same trading
day. If a share does not trade in a trading day, the closing price will be the same as the
closing price of the previous day.
2:00PM
Tunisia Tunis Stock
Exchange .TN TU XTUN Last Trade Last traded price 11:30AM
Turkey Istanbul Stock
Exchange .IS TI XIST Auction price
The closing price is determined by matching all unmatched orders in the regular session and
the new orders without matching in a pre-determined period of time with the price leading
to the maximum amount of trading volume. If no closing price is provided on a trading day,
the closing price of the previous day is used for index calculation.
5:30PM
Ukraine PFTS .PFT UZ PFTS Last traded price Last traded price 5:45PM
Ukraine Ukrainian
Exchange .UAX UK UKEX Last traded price Last traded price 5:30PM
United Arab
Emirates
Abu Dhabi
Securities Market .AD DH XADS Auction price
The closing price is calculated using an auction during the last ten minutes of the trading
session. Buy and sell orders are queued in the order book with the possibility of changing and
cancelling them without any execution. At the end of this period, the closing price will be
calculated using the same algorithm of calculating the opening price. The orders will be then
executed using the calculated closing price.
2:00PM
United Arab
Emirates
Dubai Financial
Market .DU DB XDFM Closing price
The Closing price is determined from the Theoretical Auction Price (TAP) at the end of the
pre-closing adjustment session. If there is no order matching at the end of the session, the
last traded price of the continuous trading session shall be the Closing price. If there are no
2:00PM

MSCI.COM | PAGE 69 OF 123 © 2018 MSCI Inc. All rights reserved. Please refer to the disclaimer at the end of this document.
MSCI INDEX CALCULATION METHODOLOGY | JANUARY 2018
Country Exchange Reuters
Code
Bloomberg
Code
Market
Identifier
Code
(MIC)
Price used Description (For more detailed information, please contact the relevant exchange)
Closing Prices
availability
(local time)
trades on the same business day, then the previous day’s Closing price shall be the Closing
price.
United Arab
Emirates NASDAQ Dubai .DI DU DIFX Closing price
The Closing price is determined from the Theoretical Auction Price (TAP) at the end of the
pre-closing adjustment session. If there is no order matching at the end of the session, the
last traded price of the continuous trading session shall be the Closing price. If there are no
trades on the same business day, then the previous day’s Closing price shall be the Closing
price.
2:00PM
United
Kingdom
London Stock
Exchange .L LN XLON Auction price
For SETS, the closing trade price is the uncrossing trade price at which orders execute during
an auction, or a Volume Weighted Average Price (VWAP), or the last automatic trade price. If
a closing auction fails to take place, then the VWAP of the last 10 minutes of trading will be
used to set the closing price. If however, no trading has occurred during the VWAP period,
then the last automatic trade price will be used as the official closing price.
4:35PM
United
Kingdom
London Stock
Exchange .L LN XLON Mid price
For SEAQ, SEATS and AIM securities the closing price is the mid price of the best bid and best
offer calculated from market maker quotes at the end of the mandatory quote period. 4:35PM
USA NASDAQ Capital
Market .OQ UR XNCM NOCP
The NOCP is either determined using the normalized price of the last trade reported to
NASDAQ's proprietary trade reporting system or, for selected securities, using the newly
introduced NASDAQ Closing Cross. The normalized NASDAQ Official Closing Price (NOCP)
adjusts reported trade price outside the closing bid-ask spread, "moving up" to the bid
whenever the last sale is below the bid or "moving down" to the ask whenever the last sale is
above the ask.
4:02PM
USA NASDAQ Global
Market .OQ UQ XNMS NOCP
The NOCP is either determined using the normalized price of the last trade reported to
NASDAQ's proprietary trade reporting system or, for selected securities, using the newly
introduced NASDAQ Closing Cross. The normalized NASDAQ Official Closing Price (NOCP)
adjusts reported trade price outside the closing bid-ask spread, "moving up" to the bid
whenever the last sale is below the bid or "moving down" to the ask whenever the last sale is
above the ask.
4:02PM
USA NASDAQ Global
Select Market .OQ UW XNGS NOCP
The NOCP is either determined using the normalized price of the last trade reported to
NASDAQ's proprietary trade reporting system or, for selected securities, using the newly
introduced NASDAQ Closing Cross. The normalized NASDAQ Official Closing Price (NOCP)
adjusts reported trade price outside the closing bid-ask spread, "moving up" to the bid
whenever the last sale is below the bid or "moving down" to the ask whenever the last sale is
above the ask.
4:02PM
USA NYSE .N UN XNYS Auction Close The official closing price is set during the closing auction. If there is no price set during the 4:00PM

MSCI.COM | PAGE 70 OF 123 © 2018 MSCI Inc. All rights reserved. Please refer to the disclaimer at the end of this document.
MSCI INDEX CALCULATION METHODOLOGY | JANUARY 2018
Country Exchange Reuters
Code
Bloomberg
Code
Market
Identifier
Code
(MIC)
Price used Description (For more detailed information, please contact the relevant exchange)
Closing Prices
availability
(local time)
closing auction, the official closing price will be the most recent last-sale eligible trade.
USA NYSE American .A UA XASE Auction Close The official closing price is set during the closing auction. If there is no price set during the
closing auction, the official closing price will be the most recent last-sale eligible trade. 4:00PM
Vietnam
Ho Chi Minh
Securities Trading
Center
.HM VM XSTC Last traded price Last traded price 11:00AM
Vietnam Hanoi Securities
Trading Center .HN VH HSTC Last traded price Last traded price 11:00AM
Zimbabwe Zimbabwe Stock
Exchange ,ZI ZH XZIM Last traded price Last traded price 12:30PM
* Refers to price availability times during DST period in the US.
Prices availability shown in this table refers to the time prices are normally available. It considers changes due to DST periods but no other factors such
as Ramadan period, changes in opening hours on a day prior a holiday, etc.
In case of market closure or if a security does not trade on a specific day or a specific period, MSCI carries the latest available closing price to calculate
its indexes.
In case of market outage, MSCI will use the prices provided up to the point of the of that market for calculation of MSCI indexes on that day. If MSCI
determines that another price is more appropriate based on the circumstances, an announcement would be sent to clients with the related
information. All such determinations are made by the MSCI Equity Index Committee (EIC).
Special note for countries open on Saturday and/or Sunday:
In the event that a security does not trade on a Monday but was traded on the previous Saturday and/or Sunday, the latest price available during the
weekend will be used for the Monday index calculation.
In addition, a security that does not trade on Monday but traded ex corporate event during the previous weekend will have the event reflected in the
Monday index calculation.
Special note for Japanese securities:

MSCI.COM | PAGE 71 OF 123 © 2018 MSCI Inc. All rights reserved. Please refer to the disclaimer at the end of this document.
MSCI INDEX CALCULATION METHODOLOGY | JANUARY 2018
Japanese companies can be listed simultaneously on more than one stock exchange in Japan. A company may apply for delisting from one stock
exchange while remaining listed in the other stock exchange(s). For such delisting, most Japanese stock exchanges give one month notice prior to the
last trading date of the security. Should such delisting involve a change in primary exchange and/or trigger a change in the price source, MSCI will
source the price of the security from the new primary exchange two weeks after an announcement of delisting from the stock exchange.

MSCI.COM | PAGE 72 OF 123 © 2018 MSCI Inc. All rights reserved. Please refer to the disclaimer at the end of this document.
MSCI INDEX CALCULATION METHODOLOGY | JANUARY 2018
APPENDIX VIII: COUNTRY COMPOSITION OF MSCI SELECTED REGIONAL INDEXES
MSCI CODE INDEX NAME
89
24
00
AC
WI
(fo
rme
r A
CW
IF)
89
18
00
EM
(fo
rme
r EM
F)
99
01
00
THE
WO
RLD
IND
EX (
3)
99
03
00
EAFE
99
05
00
EUR
OP
E
10
64
00
EMU
30
22
00
AC
EU
RO
PE
& M
IDD
LE E
AST
30
20
00
AC
ASI
A P
AC
IFIC
89
99
02
AC
AM
ERIC
AS
13
37
09
GC
C C
OU
NTR
IES
13
37
07
AR
AB
IAN
MA
RK
ETS
13
66
14
FM (
FRO
NTI
ER M
AR
KET
S)
903200 ARGENTINA 1-Jan-1988 to 29-May-2009
1-Jan-1988 to 29-May-2009
- - - - - - 1-Jan-1988 to 29-May-2009
- - 1-Jun-2009
903600 AUSTRALIA 1-Jan-1988 - 1-Jan-1970 1-Jan-1970 - - - 1-Jan-1988 - - - -
904000 AUSTRIA 1-Jan-1988 - 1-Jan-1970 1-Jan-1970 1-Jan-1970 1-Jan-1988 1-Jan-1988 - - - - -
133712 BAHRAIN - - - - - - - - - 1-Jun-2005 1-Jun-2005
3-Jun-2002
700396 BANGLADESH - - - - - - - - - - - 27-May-2010
905600 BELGIUM 1-Jan-1988 - 1-Jan-1970 1-Jan-1970 1-Jan-1970 1-Jan-1988 1-Jan-1988 - - - - -
700589 BOSNIA AND HERZEGOVINA
- - - - - - - - - - - -
700074 BOTSWANA - - - - - - - - - - - -
907600 BRAZIL 1-Jan-1988 1-Jan-1988 - - - - - - 1-Jan-1988 - - -
106576 BRAZIL FORMER - - - - - - - - - - - -
136634 BULGARIA - - - - - - - - - - - 1-Jun-2005
912400 CANADA (3) 1-Jan-1988 - 1-Jan-1970 - - - - - 1-Jan-1988 - - -
915200 CHILE 1-Jan-1988 1-Jan-1988 - - - - - - 1-Jan-1988 - - -
302400 CHINA 3-Sep-1996 3-Sep-1996 - - - - - 3-Sep-1996 - - - -
917000 COLOMBIA 2-Feb-1994 2-Feb-1994 - - - - - - 2-Feb-1994 - - -
136635 CROATIA - - - - - - - - - - - 3-Jun-2002
920000 CZECH REPUBLIC 3-Sep-1996 3-Sep-1996 - - - - 3-Sep-1996 - - - - -
920800 DENMARK 1-Jan-1988 - 1-Jan-1970 1-Jan-1970 1-Jan-1970 - 1-Jan-1988 - - - - -
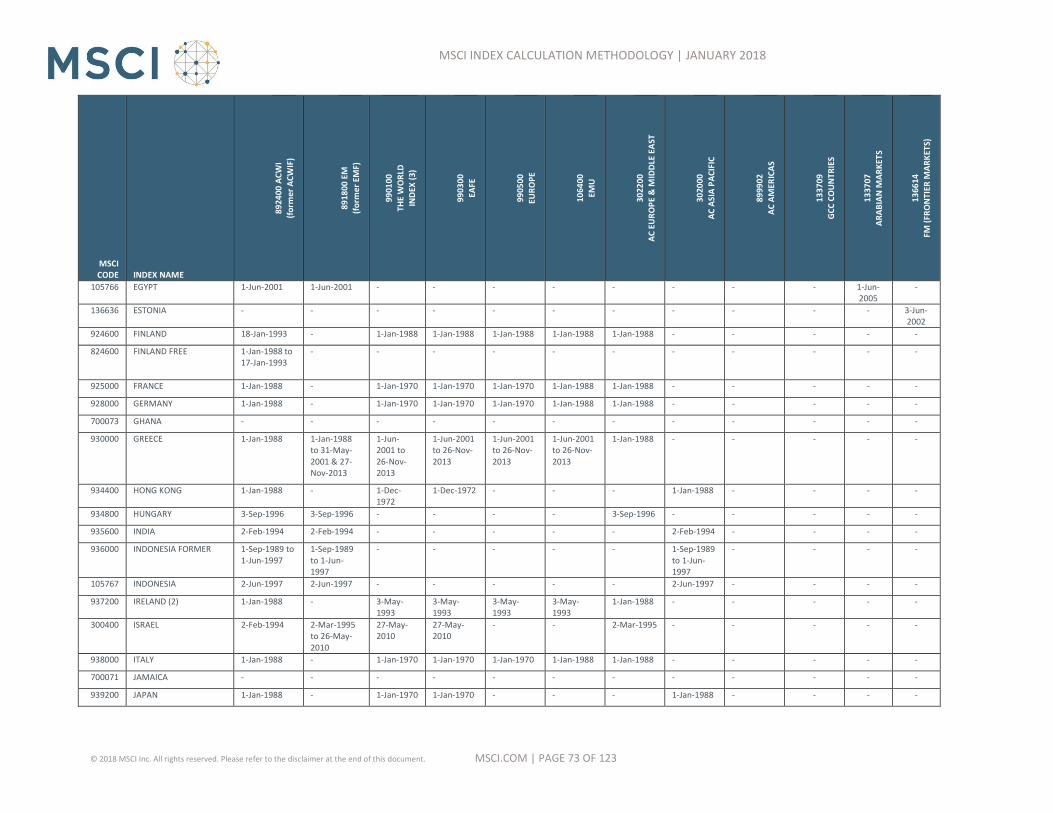
MSCI.COM | PAGE 73 OF 123 © 2018 MSCI Inc. All rights reserved. Please refer to the disclaimer at the end of this document.
MSCI INDEX CALCULATION METHODOLOGY | JANUARY 2018
MSCI CODE INDEX NAME
89
24
00
AC
WI
(fo
rme
r A
CW
IF)
89
18
00
EM
(fo
rme
r EM
F)
99
01
00
THE
WO
RLD
IND
EX (
3)
99
03
00
EAFE
99
05
00
EUR
OP
E
10
64
00
EMU
30
22
00
AC
EU
RO
PE
& M
IDD
LE E
AST
30
20
00
AC
ASI
A P
AC
IFIC
89
99
02
AC
AM
ERIC
AS
13
37
09
GC
C C
OU
NTR
IES
13
37
07
AR
AB
IAN
MA
RK
ETS
13
66
14
FM (
FRO
NTI
ER M
AR
KET
S)
105766 EGYPT 1-Jun-2001 1-Jun-2001 - - - - - - - - 1-Jun-2005
-
136636 ESTONIA - - - - - - - - - - - 3-Jun-2002
924600 FINLAND 18-Jan-1993 - 1-Jan-1988 1-Jan-1988 1-Jan-1988 1-Jan-1988 1-Jan-1988 - - - - -
824600 FINLAND FREE 1-Jan-1988 to 17-Jan-1993
- - - - - - - - - - -
925000 FRANCE 1-Jan-1988 - 1-Jan-1970 1-Jan-1970 1-Jan-1970 1-Jan-1988 1-Jan-1988 - - - - -
928000 GERMANY 1-Jan-1988 - 1-Jan-1970 1-Jan-1970 1-Jan-1970 1-Jan-1988 1-Jan-1988 - - - - -
700073 GHANA - - - - - - - - - - - -
930000 GREECE 1-Jan-1988 1-Jan-1988 to 31-May-2001 & 27-Nov-2013
1-Jun-2001 to 26-Nov-2013
1-Jun-2001 to 26-Nov-2013
1-Jun-2001 to 26-Nov-2013
1-Jun-2001 to 26-Nov-2013
1-Jan-1988 - - - - -
934400 HONG KONG 1-Jan-1988 - 1-Dec-1972
1-Dec-1972 - - - 1-Jan-1988 - - - -
934800 HUNGARY 3-Sep-1996 3-Sep-1996 - - - - 3-Sep-1996 - - - - -
935600 INDIA 2-Feb-1994 2-Feb-1994 - - - - - 2-Feb-1994 - - - -
936000 INDONESIA FORMER 1-Sep-1989 to 1-Jun-1997
1-Sep-1989 to 1-Jun-1997
- - - - - 1-Sep-1989 to 1-Jun-1997
- - - -
105767 INDONESIA 2-Jun-1997 2-Jun-1997 - - - - - 2-Jun-1997 - - - -
937200 IRELAND (2) 1-Jan-1988 - 3-May-1993
3-May-1993
3-May-1993
3-May-1993
1-Jan-1988 - - - - -
300400 ISRAEL 2-Feb-1994 2-Mar-1995 to 26-May-2010
27-May-2010
27-May-2010
- - 2-Mar-1995 - - - - -
938000 ITALY 1-Jan-1988 - 1-Jan-1970 1-Jan-1970 1-Jan-1970 1-Jan-1988 1-Jan-1988 - - - - -
700071 JAMAICA - - - - - - - - - - - -
939200 JAPAN 1-Jan-1988 - 1-Jan-1970 1-Jan-1970 - - - 1-Jan-1988 - - - -

MSCI.COM | PAGE 74 OF 123 © 2018 MSCI Inc. All rights reserved. Please refer to the disclaimer at the end of this document.
MSCI INDEX CALCULATION METHODOLOGY | JANUARY 2018
MSCI CODE INDEX NAME
89
24
00
AC
WI
(fo
rme
r A
CW
IF)
89
18
00
EM
(fo
rme
r EM
F)
99
01
00
THE
WO
RLD
IND
EX (
3)
99
03
00
EAFE
99
05
00
EUR
OP
E
10
64
00
EMU
30
22
00
AC
EU
RO
PE
& M
IDD
LE E
AST
30
20
00
AC
ASI
A P
AC
IFIC
89
99
02
AC
AM
ERIC
AS
13
37
09
GC
C C
OU
NTR
IES
13
37
07
AR
AB
IAN
MA
RK
ETS
13
66
14
FM (
FRO
NTI
ER M
AR
KET
S)
940000 JORDAN 1-Jan-1988 to 25-Nov-2008
1-Jan-1988 to 25-Nov-2008
- - - - 1-Jan-1988 to 25-Nov-2008
- - - 1-Jun-2005
26-Nov-2008
136637 KAZAKHSTAN - - - - - - - - - - - 1-Dec-2005
136643 KENYA - - - - - - - - - - - 3-Jun-2002
941000 KOREA 1-Sep-1998 1-Sep-1998 - - - - - 1-Sep-1998 - - - -
841000 KOREA (FORMER) (7) 7-Jan-1992 to 31-Aug-1998
7-Jan-1992 to 31-Aug-1998
- - - - - 7-Jan-1992 to 31-Aug-1998
- -
133713 KUWAIT - - - - - - - - - 1-Jun-2005 1-Jun-2005
3-Jun-2002
136642 LEBANON - - - - - - - - - - 2-Jun-2008
3-Jun-2002
136638 LITHUANIA - - - - - - - - - - - 26-Nov-2008
944200 LUXEMBOURG (2) 1-Jan-1988 to 30-Sep-1996
- - - - - 1-Jan-1988 to 30-Sep-1996
- - - - -
105768 MALAYSIA 2-Jun-1997 to 30-Nov-1998 & 1-Jun-2000
2-Jun-1997 to 30-Nov-1998 & 1-Jun-2000
- - - - - 2-Jun-1997 to 30-Nov-1998 & 1-Jun-2000
- - - -
945800 MALAYSIA FORMER 1-Jan-1988 to 1-Jun-1997
1-Jan-1988 to 1-Jun-1997
3-May-1993 to 30-Sep-98
3-May-1993 to 30-Sep-98
- - - 1-Jan-1988 to 1-Jun-1997
- - - -
136644 MAURITIUS - - - - - - - - - - - 3-Jun-2002
848400 MEXICO 1-Jan-1988 1-Jan-1988 - - - - - - 1-Jan-1988 - - -
948400 MEXICO FORMER - - 5-Nov-1981 to 31-Dec-1987
- - - - - - - - -

MSCI.COM | PAGE 75 OF 123 © 2018 MSCI Inc. All rights reserved. Please refer to the disclaimer at the end of this document.
MSCI INDEX CALCULATION METHODOLOGY | JANUARY 2018
MSCI CODE INDEX NAME
89
24
00
AC
WI
(fo
rme
r A
CW
IF)
89
18
00
EM
(fo
rme
r EM
F)
99
01
00
THE
WO
RLD
IND
EX (
3)
99
03
00
EAFE
99
05
00
EUR
OP
E
10
64
00
EMU
30
22
00
AC
EU
RO
PE
& M
IDD
LE E
AST
30
20
00
AC
ASI
A P
AC
IFIC
89
99
02
AC
AM
ERIC
AS
13
37
09
GC
C C
OU
NTR
IES
13
37
07
AR
AB
IAN
MA
RK
ETS
13
66
14
FM (
FRO
NTI
ER M
AR
KET
S)
105765 MOROCCO 1-Jun-2001 to 26-Nov-2013
1-Jun-2001 to 26-Nov-2013
- - - - - - - - 1-Jun-2005
27-Nov-2013
952800 NETHERLANDS 1-Jan-1988 - 1-Jan-1970 1-Jan-1970 1-Jan-1970 1-Jan-1988 1-Jan-1988 - - - - -
955400 NEW ZEALAND 1-Jan-1988 - 1-Jan-1988 1-Jan-1988 - - - 1-Jan-1988 - - - -
136645 NIGERIA - - - - - - - - - - - 3-Jun-2002
957800 NORWAY 1-Feb-1995 - 1-Jan-1970 1-Jan-1970 1-Jan-1970 - 1-Jan-1988 - - - - -
857800 NORWAY FREE (5) 1-Jan-1988 to 31-Jan-1995
- - - - - - - - - - -
133714 OMAN - - - - - - - - - 1-Jun-2005 1-Jun-2005
3-Jun-2002
958600 PAKISTAN 2-Feb-1994 to 31-Dec-2008
2-Feb-1994 to 31-Dec-2008
- - - - - 2-Feb-1994 to 31-Dec-2008
- - - 1-Jun-2009
703301 PALESTINE IMI - - - - - - - - - - - -
960400 PERU 2-Feb-1994 2-Feb-1994 - - - - - - 2-Feb-1994 - - -
860800 PHILIPPINES 1-Jan-1988 1-Jan-1988 - - - - - 1-Jan-1988 - - - -
960800 PHILIPPINES FORMER - - - - - - - - - - - -
961600 POLAND 2-Mar-1995 2-Mar-1995 - - - - 2-Mar-1995 - - - - -
962000 PORTUGAL 1-Jan-1988 1-Jan-1988 to 30-Nov-1997
01-Dec-1997
01-Dec-1997
01-Dec-1997
01-Dec-1997
1-Jan-1988 - - - - -
133715 QATAR 2-Jun-2014 2-Jun-2014 - - - - 2-Jun-2014 - - 1-Jun-2005 1-Jun-2005
3-Jun-2002 to 31-May-
2014
136639 ROMANIA - - - - - - - - - - - 1-Dec-2005

MSCI.COM | PAGE 76 OF 123 © 2018 MSCI Inc. All rights reserved. Please refer to the disclaimer at the end of this document.
MSCI INDEX CALCULATION METHODOLOGY | JANUARY 2018
MSCI CODE INDEX NAME
89
24
00
AC
WI
(fo
rme
r A
CW
IF)
89
18
00
EM
(fo
rme
r EM
F)
99
01
00
THE
WO
RLD
IND
EX (
3)
99
03
00
EAFE
99
05
00
EUR
OP
E
10
64
00
EMU
30
22
00
AC
EU
RO
PE
& M
IDD
LE E
AST
30
20
00
AC
ASI
A P
AC
IFIC
89
99
02
AC
AM
ERIC
AS
13
37
09
GC
C C
OU
NTR
IES
13
37
07
AR
AB
IAN
MA
RK
ETS
13
66
14
FM (
FRO
NTI
ER M
AR
KET
S)
105653 RUSSIA 01-Dec-1997 01-Dec-1997 - - - - 01-Dec-1997
- - - - -
133716 SAUDI ARABIA - - - - - - - - - 1-Jun-2005 1-Jun-2005
-
141415 SERBIA - - - - - - - - - - - 26-Nov-2008
998100 SINGAPORE (SINGAPORE/MALAYSIA)
1-Dec-1999 - 01-Dec-1972
01-Dec-1972
- - - 1-Dec-1999 - - - -
970200 SINGAPORE (FORMER) 1-Jan-1988 to 30-Apr-1993
- - - - - - 1-Jan-1988 to 30-Apr-1993
- - - -
870200 SINGAPORE FREE (4) (6) 3-May-1993 to 30-Nov-1999
- - - - - - 3-May-1993 to 30-Nov-1999
- - - -
136640 SLOVENIA - - - - - - - - - - - 3-Jun-2002
971000 SOUTH AFRICA 2-Mar-1995 2-Mar-1995 - - - - - - - - - -
998000 SOUTH AFRICAN GOLD MINES (1)
1-Jan-1988 to 1-Mar-1995
- 2-Dec-1974 to 1-Mar-1995
- - - - - - - - -
972400 SPAIN 1-Jan-1988 - 1-Jan-1970 1-Jan-1970 1-Jan-1970 1-Jan-1988 1-Jan-1988 - - - - -
914400 SRI LANKA 2-Feb-1994 to 31-May-2001
2-Feb-1994 to 31-May-2001
- - - - - 2-Feb-1994 to 31-May-2001
- - 1-Dec-2003
975200 SWEDEN 18-Jan-1993 - 1-Jan-1970 1-Jan-1970 1-Jan-1970 - 1-Jan-1988 - - - - -
875200 SWEDEN FREE 1-Jan-1988 to 17-Jan-1993
- - - - - - - - - -
975600 SWITZERLAND 16-Jul-1992 - 1-Jan-1970 1-Jan-1970 1-Jan-1970 - 1-Jan-1988 - - - - -
875600 SWITZERLAND FREE 1-Jan-1988 to 15-Jul-1992
- - - - - - - - - - -
915800 TAIWAN 3-Jun-2002 3-Jun-2002 - - - - - 3-Jun-2002 - - - -

MSCI.COM | PAGE 77 OF 123 © 2018 MSCI Inc. All rights reserved. Please refer to the disclaimer at the end of this document.
MSCI INDEX CALCULATION METHODOLOGY | JANUARY 2018
MSCI CODE INDEX NAME
89
24
00
AC
WI
(fo
rme
r A
CW
IF)
89
18
00
EM
(fo
rme
r EM
F)
99
01
00
THE
WO
RLD
IND
EX (
3)
99
03
00
EAFE
99
05
00
EUR
OP
E
10
64
00
EMU
30
22
00
AC
EU
RO
PE
& M
IDD
LE E
AST
30
20
00
AC
ASI
A P
AC
IFIC
89
99
02
AC
AM
ERIC
AS
13
37
09
GC
C C
OU
NTR
IES
13
37
07
AR
AB
IAN
MA
RK
ETS
13
66
14
FM (
FRO
NTI
ER M
AR
KET
S)
815800 TAIWAN@80% (8) 3-Sep-1996 to 2-Jun-2002
3-Sep-1996 to 2-Jun-2002
- - - - - 3-Sep-1996 to 2-Jun-2002
- - - -
976400 THAILAND FORMER 1-Jan-1988 to 1-Jun-1997
1-Jan-1988 to 1-Jun-1997
- - - - - 1-Jan-1988 to 1-Jun-1997
- - - -
105769 THAILAND 2-Jun-1997 2-Jun-1997 - - - - - 2-Jun-1997 - - - -
700072 TRINIDAD AND TOBAGO - - - - - - - - - - - 1-Jun-2009 to
31-May-2011
136646 TUNISIA - - - - - - - - - - 2-Jun-2008
1-Jun-2004
979200 TURKEY 1-Sep-1989 1-Sep-1989 - - - - 1-Oct-1996 - - - - -
136641 UKRAINE - - - - - - - - - - - 1-Jun-2006 to 31-Aug-
2015
133717 UNITED ARAB EMIRATES 2-Jun-2014 2-Jun-2014 - - - - 2-Jun-2014 - - 1-Jun-2005 1-Jun-2005
3-Jun-2002 to 31-May-
2014
982600 UNITED KINGDOM 1-Jan-1988 - 1-Jan-1970 1-Jan-1970 1-Jan-1970 - 1-Jan-1988 - - - - -
984000 USA (3) 1-Jan-1988 - 1-Jan-1970 - - - - - 1-Jan-1988 - - -
886200 VENEZUELA 2-Feb-1994 to 31-May-2006
2-Feb-1994 to 31-May-2006
- - - - - - 2-Feb-1994 to 31-May-2006
- - -
986200 VENEZUELA (FORMER) - - - - - - - - - - - -
136647 VIETNAM - - - - - - - - - - - 1-Dec-2006
700873 ZIMBABWE - - - - - - - - - - - -
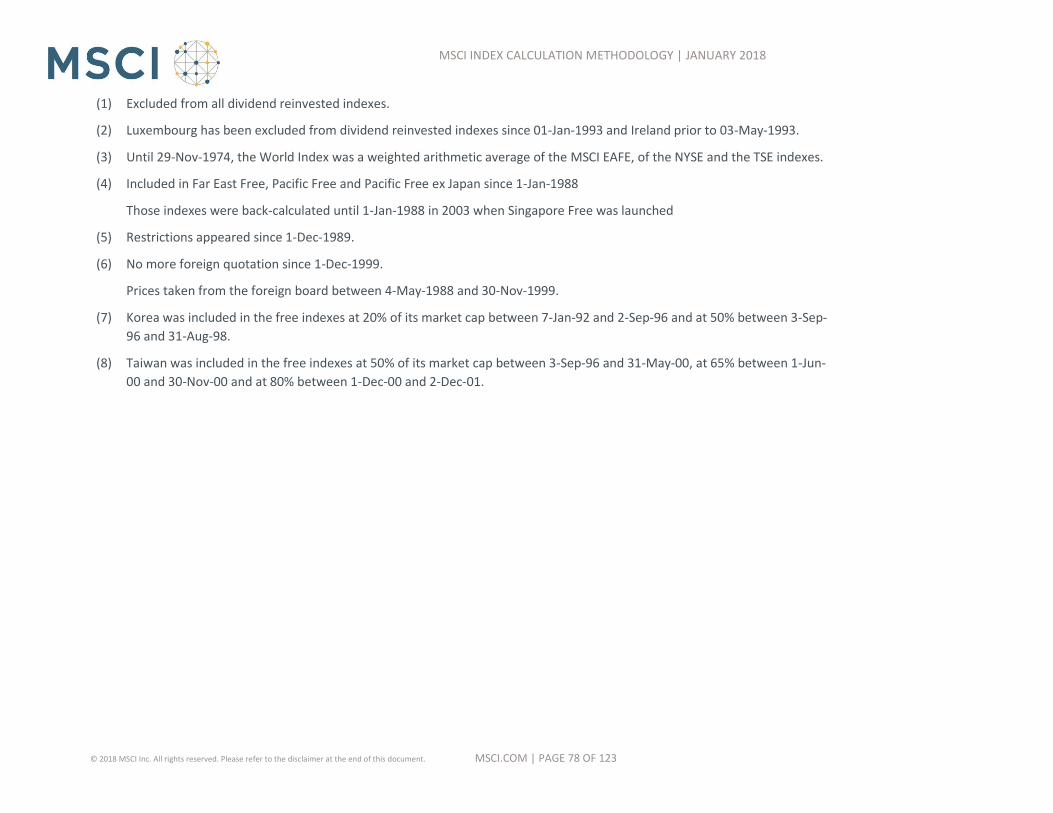
MSCI.COM | PAGE 78 OF 123 © 2018 MSCI Inc. All rights reserved. Please refer to the disclaimer at the end of this document.
MSCI INDEX CALCULATION METHODOLOGY | JANUARY 2018
(1) Excluded from all dividend reinvested indexes.
(2) Luxembourg has been excluded from dividend reinvested indexes since 01-Jan-1993 and Ireland prior to 03-May-1993.
(3) Until 29-Nov-1974, the World Index was a weighted arithmetic average of the MSCI EAFE, of the NYSE and the TSE indexes.
(4) Included in Far East Free, Pacific Free and Pacific Free ex Japan since 1-Jan-1988
Those indexes were back-calculated until 1-Jan-1988 in 2003 when Singapore Free was launched
(5) Restrictions appeared since 1-Dec-1989.
(6) No more foreign quotation since 1-Dec-1999.
Prices taken from the foreign board between 4-May-1988 and 30-Nov-1999.
(7) Korea was included in the free indexes at 20% of its market cap between 7-Jan-92 and 2-Sep-96 and at 50% between 3-Sep-
96 and 31-Aug-98.
(8) Taiwan was included in the free indexes at 50% of its market cap between 3-Sep-96 and 31-May-00, at 65% between 1-Jun-
00 and 30-Nov-00 and at 80% between 1-Dec-00 and 2-Dec-01.

MSCI.COM | PAGE 79 OF 123 © 2018 MSCI Inc. All rights reserved. Please refer to the disclaimer at the end of this document.
MSCI INDEX CALCULATION METHODOLOGY | JANUARY 2018
APPENDIX IX: MSCI REAL TIME INDEXES
MSCI currently calculates price, net and gross variants for approximately 9,000 equity based
indexes in real time as well as the FX Hedge, Currency, Short/Leveraged and Daily Hedged
indexes. All MSCI Real Time Indexes are calculated based on the corresponding end-of-day
index calculation methodologies.
MSCI disseminates real time indexes every 60 seconds or 15 seconds depending on the
index type and its use in the marketplace. On a daily basis for each real time index, MSCI
will provide an Index Open value (IO) which will occur when the first security belonging to
that index trades, an Index Update value (IU) which will occur throughout the day after the
Index Open has been sent and an Index Close value (IC) which will be sent out as the last real
time level and indicate the real time closing value.8
Real Time Intraday Foreign Exchange Rates vs. Real Time Close Foreign Exchange Rates
MSCI Real Time Indexes use the Reuters Multi Contributor FX Rates for all Index Open and
Index Updates and MSCI applies the WM 4PM London time Closing Mid Rates for the Index
Close.
Mono-currency indexes which are indexes that have exposure to a single currency will have
their Index Close value sent shortly after the underlying stock exchange(s) close and do not
require the WM 4PM London closing rate to calculate the Index Close.
Multi-currency indexes (which have exposure to multiple currencies) require the WM 4PM
London closing rate to calculate the Index Close. Multi-currency indexes whose underlying
stock exchanges close before the WM 4PM London rates are received will have their last
Index Update sent shortly after the last underlying stock exchange closes and then will have
their Index Close sent when the WM 4PM London Close is received. Multi-currency indexes
whose underlying stock exchanges close after the WM 4PM London rates are received will
continue to use the Reuters Multi Contributor FX rates for all Index Updates until the last
underlying stock exchange closes and the Index Close is sent using the WM 4PM London
Close.
8 The real time Index Close could be different from the index value for the same index delivered in MSCI’s end-of-day
product files due to manual data updates implemented during the end-of-day calculation process. The official closing
level of any MSCI index is the level distributed in MSCI’s end-of-day product files.

MSCI.COM | PAGE 80 OF 123 © 2018 MSCI Inc. All rights reserved. Please refer to the disclaimer at the end of this document.
MSCI INDEX CALCULATION METHODOLOGY | JANUARY 2018
Real Time Intraday Security Pricing vs. Real Time Close Security Pricing
Index Open and Index Update calculations use the last traded price available and the Index
Close uses the official closing price or last trade as described in the MSCI Closing Prices
Policy found in Appendix VII of this document.
Price filtering
MSCI has various price filters set in place to ensure that high quality prices are used in
MSCI’s Real Time index calculations. MSCI’s price market filters exclude trades such as block
sales and odd lots among others and MSCI’s price threshold filters ensure that price
fluctuations above or below a certain threshold are checked prior to being included in the
calculation of the MSCI Real Time Indexes.
Real Time Cash Dividend Reinvestment
Consistent with the Daily Total Return (DTR) end-of-day index calculation methodology,
MSCI’s real time DTR calculation will reinvest a dividend only if the security paying the
dividend trades on the ex-date. The dividend will be reflected in real time index calculations
as soon as the security paying the dividend trades in real time. If the security does not
trade on the ex-date or on the scheduled reinvestment date, the dividend reinvestment will
be postponed to the day when the security resumes trading. Late dividends or corrections
will be treated in real time calculations consistent with the end-of-day DTR index calculation
methodology. For more details on MSCI’s DTR methodology please refer to the Section 2.
General Announcement Policy for Dividends
Upcoming dividends to be reinvested in the MSCI DTR Indexes are announced prior to their
reinvestment in the MSCI Security Advanced Dividend File.
Late dividends and dividend corrections that are received after their ex-date are reinvested
or corrected in the MSCI DTR Indexes on the next business day following the reception date
from the data sources. Therefore, there is at least one day’s notice through the MSCI
Security Advanced Dividend File prior to their reinvestment and / or correction.
In exceptional cases, MSCI will announce the treatment of dividends that are not pre-
announced in the MSCI Security Advanced Dividend File and are received by MSCI during
market hours on their ex-date through an intraday option email announcement.

MSCI.COM | PAGE 81 OF 123 © 2018 MSCI Inc. All rights reserved. Please refer to the disclaimer at the end of this document.
MSCI INDEX CALCULATION METHODOLOGY | JANUARY 2018
Intraday Price Adjustment Factor (PAF) Announcements
MSCI sends an Opening and Closing PAF announcement for all Real Time constituents that
have a corporate event effective involving the calculation of a theo-cum PAF such as a
special cash dividend, capital repayment or when a shareholder receives something other
than the underlying asset.
The opening PAF announcement uses the opening price of the security. It is provided for
information purpose and is sent shortly after the first trade of the security having the
corporate event. However, Real Time indexes are computed using a PAF that is calculated
using real time prices throughout the day.
The closing PAF announcement uses the closing price of the security having the corporate
event and is used in the Index Close calculation. The closing PAF value is sent shortly after
the closing price of the security having the corporate event is received. For more
information on corporate events, please see the MSCI Corporate Event Methodology
document.
MSCI.COM | PAGE 82 OF 123 © 2018 MSCI Inc. All rights reserved. Please refer to the disclaimer at the end of this document.
MSCI INDEX CALCULATION METHODOLOGY | JANUARY 2018
APPENDIX X: INDEX CALCULATION METHODOLOGY USING INDEX
DIVISORS
INTRODUCTION
An index level is calculated by multiplying the weighted average performance of the index
constituents by the previous index level. This section presents an alternative way of
calculating an index level (which is similar to the traditional way of valuing a portfolio), by
simply multiplying asset constituent quantities by current prices, and adding up the results.
The index divisor concept, introduced below, is central to this alternative index calculation.
When calculating a security’s performance on days with certain corporate events, a price
adjustment factor (PAF) is needed to ensure historical price comparability. This factor often
accounts for assets that contribute to the index performance for a day, such as rights
offerings, spun-off companies or cash. In the alternative index calculation methodology
described herein, the PAF is replaced by the interim constituents, which explicitly capture
the impact of corporate events.
DEFINITIONS
Index Divisor (t)
The index divisor for a day t is defined as the ratio of the initial market capitalization and the
previous index level.
𝐼𝑛𝑑𝑒𝑥𝐷𝑖𝑣𝑖𝑠𝑜𝑟𝑡 =𝐼𝑛𝑑𝑒𝑥𝐼𝑛𝑖𝑡𝑖𝑎𝑙𝑀𝑎𝑟𝑘𝑒𝑡𝐶𝑎𝑝𝑡
𝐼𝑛𝑑𝑒𝑥𝐿𝑒𝑣𝑒𝑙𝑡−1
The index divisor does not change unless the index composition changes, e.g., in cases of
corporate events and index additions / deletions where a change in index market
capitalization is not due to performance and does not correspond to a change in the index
level.
The index divisor for day t is known after the close of day t-1 (the initial index market
capitalization is calculated using prices and exchange rates as of day t-1 but constituents as
of t).
The index divisor can be calculated in any currency: both the index initial market
capitalization and the previous index level need to be expressed in that currency.

MSCI.COM | PAGE 83 OF 123 © 2018 MSCI Inc. All rights reserved. Please refer to the disclaimer at the end of this document.
MSCI INDEX CALCULATION METHODOLOGY | JANUARY 2018
Index Unit
The index unit describes the set of index constituents and corresponding quantities of total
value equal to the index level. It can be derived by dividing the total index quantities by the
index divisor.
Intraday Index Number of Shares (t)
The intraday index number of shares is the number of shares of a security taken into
account for the index calculation and valid both intraday and at the close of day t (before
any changes due to corporate events or index reviews). Note that it is adjusted by the
various index inclusion factors, such as the Foreign Inclusion Factor (FIF)9, for day t. Also,
note that it can be different from the number of shares used for the index calculation
described in Section 1.1 (which is an end of day number of shares) in cases of corporate
events.
Intraday Index Unit Number of Shares (t)
The intraday index unit number of shares is the intraday index number of shares expressed
for one index unit. It is defined as the ratio of the intraday index number of shares and the
index divisor.
𝐼𝑛𝑡𝑟𝑎𝑑𝑎𝑦𝐼𝑛𝑑𝑒𝑥𝑈𝑛𝑖𝑡𝑁𝑢𝑚𝑏𝑒𝑟𝑂𝑓𝑆ℎ𝑎𝑟𝑒𝑠𝑡 =𝐼𝑛𝑡𝑟𝑎𝑑𝑎𝑦𝐼𝑛𝑑𝑒𝑥𝑁𝑢𝑚𝑏𝑒𝑟𝑂𝑓𝑆ℎ𝑎𝑟𝑒𝑠𝑡
𝐼𝑛𝑑𝑒𝑥𝐷𝑖𝑣𝑖𝑠𝑜𝑟𝑡
End of Day Index Number of Shares (t)
The end of day index number of shares is the number of shares of a security taken into
account for the index calculation for the next day (t+1) but expressed on a pre t+1 events
basis (for example, if a company has a stock split on t+1, the end of day index number of
shares for day t will be on a pre-split basis). This number of shares, however, takes into
account changes due to corporate events effective as of the close of t and is adjusted by the
various index inclusion factors such as the Foreign Inclusion Factor (FIF) for day t+1. Note
that it is based on the same number of shares as the one used for the index calculation on
t+1 (EndOfDayIndexNumberOfSharest) and described in Section 1.1.
9 Index inclusion factors encompass any inclusion factors specific to a given index, for example, the Value Inclusion Factor
(VIF) for a Value index.
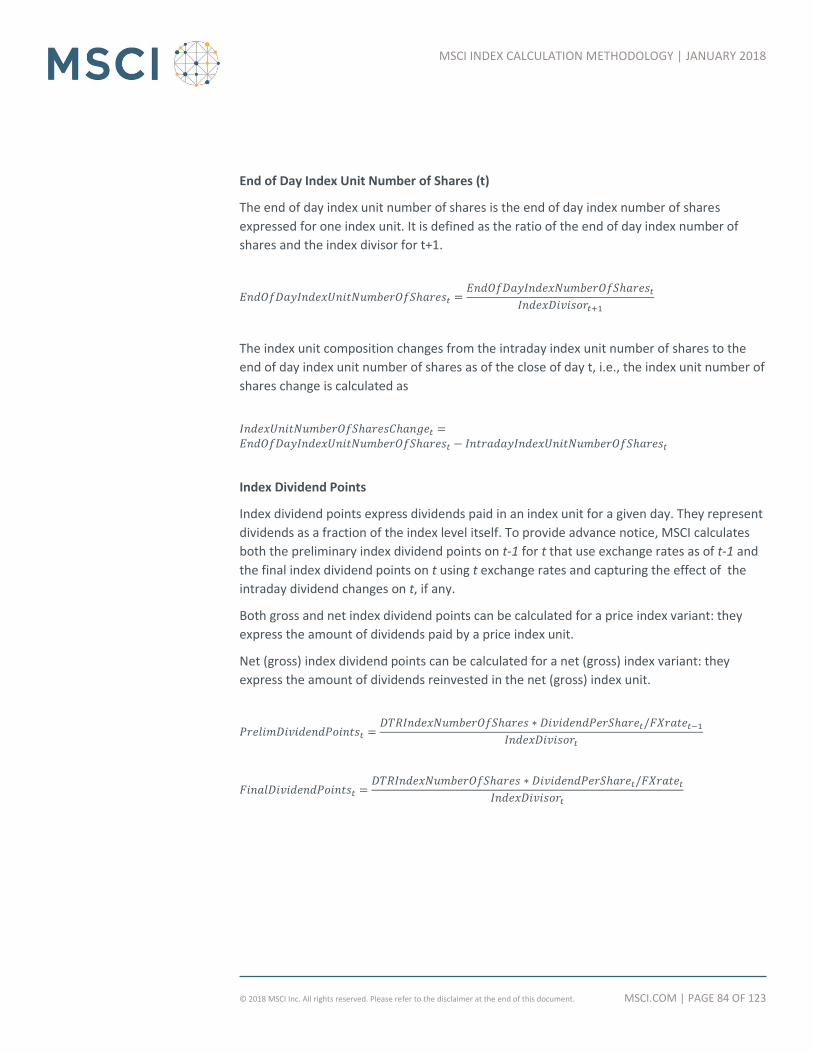
MSCI.COM | PAGE 84 OF 123 © 2018 MSCI Inc. All rights reserved. Please refer to the disclaimer at the end of this document.
MSCI INDEX CALCULATION METHODOLOGY | JANUARY 2018
End of Day Index Unit Number of Shares (t)
The end of day index unit number of shares is the end of day index number of shares
expressed for one index unit. It is defined as the ratio of the end of day index number of
shares and the index divisor for t+1.
𝐸𝑛𝑑𝑂𝑓𝐷𝑎𝑦𝐼𝑛𝑑𝑒𝑥𝑈𝑛𝑖𝑡𝑁𝑢𝑚𝑏𝑒𝑟𝑂𝑓𝑆ℎ𝑎𝑟𝑒𝑠𝑡 =𝐸𝑛𝑑𝑂𝑓𝐷𝑎𝑦𝐼𝑛𝑑𝑒𝑥𝑁𝑢𝑚𝑏𝑒𝑟𝑂𝑓𝑆ℎ𝑎𝑟𝑒𝑠𝑡
𝐼𝑛𝑑𝑒𝑥𝐷𝑖𝑣𝑖𝑠𝑜𝑟𝑡+1
The index unit composition changes from the intraday index unit number of shares to the
end of day index unit number of shares as of the close of day t, i.e., the index unit number of
shares change is calculated as
𝐼𝑛𝑑𝑒𝑥𝑈𝑛𝑖𝑡𝑁𝑢𝑚𝑏𝑒𝑟𝑂𝑓𝑆ℎ𝑎𝑟𝑒𝑠𝐶ℎ𝑎𝑛𝑔𝑒𝑡 =𝐸𝑛𝑑𝑂𝑓𝐷𝑎𝑦𝐼𝑛𝑑𝑒𝑥𝑈𝑛𝑖𝑡𝑁𝑢𝑚𝑏𝑒𝑟𝑂𝑓𝑆ℎ𝑎𝑟𝑒𝑠𝑡 − 𝐼𝑛𝑡𝑟𝑎𝑑𝑎𝑦𝐼𝑛𝑑𝑒𝑥𝑈𝑛𝑖𝑡𝑁𝑢𝑚𝑏𝑒𝑟𝑂𝑓𝑆ℎ𝑎𝑟𝑒𝑠𝑡
Index Dividend Points
Index dividend points express dividends paid in an index unit for a given day. They represent
dividends as a fraction of the index level itself. To provide advance notice, MSCI calculates
both the preliminary index dividend points on t-1 for t that use exchange rates as of t-1 and
the final index dividend points on t using t exchange rates and capturing the effect of the
intraday dividend changes on t, if any.
Both gross and net index dividend points can be calculated for a price index variant: they
express the amount of dividends paid by a price index unit.
Net (gross) index dividend points can be calculated for a net (gross) index variant: they
express the amount of dividends reinvested in the net (gross) index unit.
𝑃𝑟𝑒𝑙𝑖𝑚𝐷𝑖𝑣𝑖𝑑𝑒𝑛𝑑𝑃𝑜𝑖𝑛𝑡𝑠𝑡 =𝐷𝑇𝑅𝐼𝑛𝑑𝑒𝑥𝑁𝑢𝑚𝑏𝑒𝑟𝑂𝑓𝑆ℎ𝑎𝑟𝑒𝑠 ∗ 𝐷𝑖𝑣𝑖𝑑𝑒𝑛𝑑𝑃𝑒𝑟𝑆ℎ𝑎𝑟𝑒𝑡/𝐹𝑋𝑟𝑎𝑡𝑒𝑡−1
𝐼𝑛𝑑𝑒𝑥𝐷𝑖𝑣𝑖𝑠𝑜𝑟𝑡
𝐹𝑖𝑛𝑎𝑙𝐷𝑖𝑣𝑖𝑑𝑒𝑛𝑑𝑃𝑜𝑖𝑛𝑡𝑠𝑡 =𝐷𝑇𝑅𝐼𝑛𝑑𝑒𝑥𝑁𝑢𝑚𝑏𝑒𝑟𝑂𝑓𝑆ℎ𝑎𝑟𝑒𝑠 ∗ 𝐷𝑖𝑣𝑖𝑑𝑒𝑛𝑑𝑃𝑒𝑟𝑆ℎ𝑎𝑟𝑒𝑡/𝐹𝑋𝑟𝑎𝑡𝑒𝑡
𝐼𝑛𝑑𝑒𝑥𝐷𝑖𝑣𝑖𝑠𝑜𝑟𝑡

MSCI.COM | PAGE 85 OF 123 © 2018 MSCI Inc. All rights reserved. Please refer to the disclaimer at the end of this document.
MSCI INDEX CALCULATION METHODOLOGY | JANUARY 2018
Dividend points can be aggregated at index level.
𝐼𝑛𝑑𝑒𝑥𝑃𝑟𝑒𝑙𝑖𝑚𝐷𝑖𝑣𝑖𝑑𝑒𝑛𝑑𝑃𝑜𝑖𝑛𝑡𝑠𝑡 =∑𝑃𝑟𝑒𝑙𝑖𝑚𝐷𝑖𝑣𝑑𝑒𝑛𝑑𝑃𝑜𝑖𝑛𝑡𝑠𝑡
𝐼𝑛𝑑𝑒𝑥𝐹𝑖𝑛𝑎𝑙𝐷𝑖𝑣𝑖𝑑𝑒𝑛𝑑𝑃𝑜𝑖𝑛𝑡𝑠𝑡 =∑𝐹𝑖𝑛𝑎𝑙𝐷𝑖𝑣𝑑𝑒𝑛𝑑𝑃𝑜𝑖𝑛𝑡𝑠𝑡
Pre-open Price
The pre-open price of a security on day t is its closing price of day t-1 theoretically adjusted
for the effects of corporate events affecting the security ex on day t.
CALCULATING THE INDEX
Index Calculation Formula
The index unit value serves to calculate the index level. The equation below is valid both
intraday and as of the close.
𝐼𝑛𝑑𝑒𝑥𝐿𝑒𝑣𝑒𝑙𝑡 =∑𝐼𝑛𝑡𝑟𝑎𝑑𝑎𝑦𝐼𝑛𝑑𝑒𝑥𝑈𝑛𝑖𝑡𝑁𝑢𝑚𝑏𝑒𝑟𝑂𝑓𝑆ℎ𝑎𝑟𝑒𝑠𝑖,𝑡 ∗ 𝑃𝑟𝑖𝑐𝑒𝑖,𝑡/𝐹𝑋𝑟𝑎𝑡𝑒𝑖,𝑡𝑖∈𝐼
where Pricei,t is replaced by the pre-open price for the constituents that have not yet traded
on t and I is the index unit constituent set. The previous index level can also be recalculated
by using pre-open prices and exchange rates of the previous day.
𝐼𝑛𝑑𝑒𝑥𝐿𝑒𝑣𝑒𝑙𝑡−1 =∑𝐼𝑛𝑡𝑟𝑎𝑑𝑎𝑦𝐼𝑛𝑑𝑒𝑥𝑈𝑛𝑖𝑡𝑁𝑢𝑚𝑏𝑒𝑟𝑂𝑓𝑆ℎ𝑎𝑟𝑒𝑠𝑖,𝑡 ∗ 𝑃𝑟𝑒𝑂𝑝𝑒𝑛𝑃𝑟𝑖𝑐𝑒𝑖,𝑡/𝐹𝑋𝑟𝑎𝑡𝑒𝑖,𝑡−1𝑖∈𝐼
Index Calculation Example
Consider the MSCI Austria index unit on October 27, 2009 described below. Its composition
is fully known after the close of October 26, 2009 and is described by the constituent list and
the intraday index unit number of shares (column F) calculated as the ratio of the intraday
index number of shares and the index divisor.
To calculate the index level on October 27, 2009 (intraday or close), current prices and
exchange rates (columns I and J respectively) are used for each constituent, and the market
capitalization of the constituent in the index unit (column K) is obtained by multiplying the
intraday index unit NOS by the prices and dividing by the exchange rate. The sum of the
column K gives the value of the index unit, which is equal to the index level.

MSCI.COM | PAGE 86 OF 123 © 2018 MSCI Inc. All rights reserved. Please refer to the disclaimer at the end of this document.
MSCI INDEX CALCULATION METHODOLOGY | JANUARY 2018
CALCULATING INDEX UNIT CHANGES DUE TO CORPORATE EVENTS AND INDEX
REBALANCINGS
As corporate events and rebalancings occur, the index unit composition can change. All
adjustments are based on closing prices. To get the index unit adjustment, the new index
divisor needs to be calculated. Dividing the end of day index number of shares by the new
index divisor results in the end of day index unit number of shares. Given the equations
𝐼𝑛𝑑𝑒𝑥𝐷𝑖𝑣𝑖𝑠𝑜𝑟𝑡+1 =𝐼𝑛𝑑𝑒𝑥𝐼𝑛𝑖𝑡𝑖𝑎𝑙𝑀𝑎𝑟𝑘𝑒𝑡𝐶𝑎𝑝𝑡+1
𝐼𝑛𝑑𝑒𝑥𝐿𝑒𝑣𝑒𝑙𝑡 (coming from the divisor definition), and
𝐼𝑛𝑑𝑒𝑥𝐷𝑖𝑣𝑖𝑠𝑜𝑟𝑡 =𝐼𝑛𝑑𝑒𝑥𝐴𝑑𝑗𝑢𝑠𝑡𝑒𝑑𝑀𝑎𝑟𝑘𝑒𝑡𝐶𝑎𝑝𝑡
𝐼𝑛𝑑𝑒𝑥𝐿𝑒𝑣𝑒𝑙𝑡 (coming from the divisor definition and the fact
the index level is proportional to the index market capitalization on any given day), a
practical way of calculating the new divisor is
𝐼𝑛𝑑𝑒𝑥𝐷𝑖𝑣𝑖𝑠𝑜𝑟𝑡+1 = 𝐼𝑛𝑑𝑒𝑥𝐷𝑖𝑣𝑖𝑠𝑜𝑟𝑡 ∗𝐼𝑛𝑑𝑒𝑥𝐼𝑛𝑖𝑡𝑖𝑎𝑙𝑀𝑎𝑟𝑘𝑒𝑡𝐶𝑎𝑝𝑡+1𝐼𝑛𝑑𝑒𝑥𝐴𝑑𝑗𝑢𝑠𝑡𝑒𝑑𝑀𝑎𝑟𝑘𝑒𝑡𝐶𝑎𝑝𝑡
As an example, consider the MSCI Brazil index unit on October 21, 2009 described below.
Effective October 22, 2009, a new security, BC SANTANDER BRASIL UNIT will be added to the
* Columns A-F come from the MSCI Market Open Index File
The file will be distributed after the close of October 26 for use on October 27
21,413,261
A B C D E F I J K
Calculation
DateAs of Date Security Name
Idx Incl
Flag (as
of date)
Intraday
Index NOS
MM
Intraday
Idx Unit
NOS
Price (As
of Date)
FX (As of
Date)
Mcap in
Idx Unit
D*F*I/J
10/26/2009 10/27/2009 ERSTE GROUP BANK 1 174.36 8.14 28.50 0.67 344
10/26/2009 10/27/2009 OMV AG 1 150.00 7.01 29.03 0.67 301
10/26/2009 10/27/2009 TELEKOM AUSTRIA 1 322.00 15.04 11.88 0.67 265
10/26/2009 10/27/2009 VOESTALPINE 1 117.53 5.49 23.83 0.67 194
10/26/2009 10/27/2009 VERBUND OESTERR ELEK A 1 77.05 3.60 31.80 0.67 170
10/26/2009 10/27/2009 RAIFFEISEN INT'L BANK 1 54.13 2.53 42.50 0.67 159
10/26/2009 10/27/2009 VIENNA INSURANCE GROUP 1 38.40 1.79 41.10 0.67 109
Index (USD) 1,541.96
Divisor (As of Date)

MSCI.COM | PAGE 87 OF 123 © 2018 MSCI Inc. All rights reserved. Please refer to the disclaimer at the end of this document.
MSCI INDEX CALCULATION METHODOLOGY | JANUARY 2018
index. Hence, the index divisor and the index unit composition will change as of the close of
October 21, 2009.
A new index divisor (for October 22, 2009) is calculated by multiplying the current divisor
(for October 21, 2009) by the sum of the next day constituents’ initial market capitalizations
(column M) and dividing by the current index market capitalization (sum of column L). The
new end of day index unit number of shares (column N) is calculated by dividing the end of
day index number of shares (column H) by the new divisor. The index unit composition is
adjusted by the difference between the end of day index unit number of shares and intraday
index unit number of shares (column O): in this case, 0.16 shares of BC SANTANDER BRASIL
UNIT are added to the index unit by decreasing the index unit number of shares of all the
other index constituents.
INTERIM CONSTITUENTS10
On days with certain corporate events, the index can hold constituents that influence the
performance for a day. When calculating the index performance using price adjustment
factors (as described in section 1.1), these do not appear explicitly in the calculation formula
but are accounted for implicitly by applying a price adjustment factor (PAF) on the
capitalization of the security affected by the corporate event. The index, however, is
exposed to all the constituents and when valuing an index unit, these need to be explicitly
taken into account. For example, the following corporate events result in a creation of
interim constituents:
10 Interim constituents were added to the product files in the second phase of the MSCI Market Open Index product
(delivered at the end of 2010).
* Subset of the MSCI Brazil Index Unit
142,324,185
144,319,620
A B C D E F G H I J L M N O
Calculation
DateAs of Date Security Name
Idx Incl
Flag (as
of date)
Intraday
Index NOS
MM
Intraday
Idx Unit
NOS
Idx Incl
Flag (as of
date + 1)
End of Day
Index NOS
MM
Price (As
of Date)
FX (As of
Date)
Mcap
(As of Date)
D*E*I/J
Initial Mcap
(As of Date + 1)
G*H*I/J
End of Day
Idx Unit
NOS
Idx Unit NOS
Change
(N-F)
10/20/2009 10/21/2009 BC SANTANDER BRASIL UNIT 0 1 525 23.19 1.74 0 7,017 0.16 0.16
10/20/2009 10/21/2009 PETROBRAS PN 1 3,146 22.10 1 3,146 36.70 1.74 66,538 66,538 21.80 -0.31
10/20/2009 10/21/2009 PETROBRAS ON 1 2,283 16.04 1 2,283 43.00 1.74 56,582 56,582 15.82 -0.22
10/20/2009 10/21/2009 VALE PNA 1 2,109 14.82 1 2,109 40.77 1.74 49,549 49,549 14.61 -0.20
10/20/2009 10/21/2009 ITAU UNIBANCO PN 1 2,053 14.43 1 2,053 36.00 1.74 42,608 42,608 14.23 -0.20
10/20/2009 10/21/2009 VALE ON 1 1,440 10.12 1 1,440 46.11 1.74 38,272 38,272 9.98 -0.14
10/20/2009 10/21/2009 BANCO BRADESCO PN 1 1,535 10.78 1 1,535 36.00 1.74 31,849 31,849 10.64 -0.15
10/20/2009 10/21/2009 CSN SIDERURGICA NAC'L ON 1 397 2.79 1 397 63.50 1.74 14,519 14,519 2.75 -0.04
Divisor (As of Date)
Divisor (As of Date + 1)

MSCI.COM | PAGE 88 OF 123 © 2018 MSCI Inc. All rights reserved. Please refer to the disclaimer at the end of this document.
MSCI INDEX CALCULATION METHODOLOGY | JANUARY 2018
Capital Repayments: the index calculation assumes that cash is received in the index and
held until the close when it is finally reinvested in the index so cash effectively brings
performance to the index on the ex-date and is part of the index unit
Spin-off with the spun-off company not eligible for the index: the calculation assumes that
the spun-off company is received in the index on the ex-date and is held until the close when
it is finally sold and the proceeds reinvested back in the index. In this case, the spun-off
company is effectively part of the index on the ex-date
Note that the interim constituents play a similar role in the index calculation as the price
adjustment factor (PAF) and the resulting index levels are exactly the same whether using
interim constituents or PAFs.
To explain how interim constituents are created, several examples of common corporate
events are described below. Some corporate events can result in the creation of more than
one interim constituent, but these can also be broken up in several simple consecutive
corporate events.
Examples
Capital Repayment
As an example, consider the repayment of EUR 0.4 per share by ELISA A effective October
26, 2009. According to the calculation methodology, this cash is reinvested back in the index
as of the close of the ex date, October 26, 2009. Hence, intraday, the MSCI Finland index
unit holds both ELISA A and the cash. An interim constituent is therefore added to the index
unit, as shown below, with the following characteristics:
Intraday index unit number of shares equal to the stock that repaid capital (given that each
share of ELISA A in the index unit is entitled to the cash payment)
Fixed price equals to the repayment amount, EUR 0.40.
Cash will leave the index unit as of the close of October 26 (as indicated by column G) and
the proceeds reinvested back in the index. Repeating the calculations described in the
previous section gives the index unit number of shares change (column O) that represents
the theoretical trade adjustment to the index unit: cash is “sold” (negative change) while the
index unit holdings in all the other constituents increase (positive change)

MSCI.COM | PAGE 89 OF 123 © 2018 MSCI Inc. All rights reserved. Please refer to the disclaimer at the end of this document.
MSCI INDEX CALCULATION METHODOLOGY | JANUARY 2018
Spin-off with the Spun-off Company Traded on the Ex date
As an example, consider the spin-off of GAM HOLDING by JULIUS BAER HOLDING with 1:1
terms effective October 1, 2009 for the MSCI Switzerland Large Cap index (displayed below).
The spun-off company is not eligible to stay in the index.
On the ex date (October 1, 2009), the spun-off company still brings performance to the
index and is hence part of the index unit. It is therefore part of the index with the following
characteristics:
Intraday index unit number of shares calculated according to the terms (intraday index unit
number of shares of the parent stock * 1/1)
Market price given that the spun-off company is traded on the ex-date.
It is “sold” from the MSCI Switzerland Large Cap index unit at the close of the ex-date and
the proceeds are reinvested back in the index. To determine the index unit number of shares
(column O), the calculations described in the previous section should be repeated.
Subset of the MSCI Finland
* Interim constituents will be added to the product files in the second phase of the MSCI Market Open Index project (expected d elivery at the end of 2010)
249,175,772
249,001,078
A B C D E F G H I J L M N O
Calculation
DateAs of Date Security Name
Interim
constituent type
Interim const.
trading
status
Idx Incl
Flag (as
of date)
Intraday
Index NOS
MM
Intraday
Idx Unit
NOS
Idx Incl
Flag (as of
date + 1)
End of Day
Index NOS
MM
Price (As
of Date)
FX (As of
Date)
Mcap
(As of Date)
D*E*I/J
Initial Mcap
(As of Date + 1)
G*H*I/J
End of Day
Idx Unit
NOS
Idx Unit NOS
Change
(N-F)
10/25/2009 10/26/2009 ELISA A 1 133 0.53 1 133 13.90 0.67 2,763 2,763 0.53 0.0004
10/25/2009 10/26/2009 ELISA A (INTERIM 1)* CASH FIXED 1 133 0.53 0 0.40 0.67 80 0 0.00 -0.5339
10/25/2009 10/26/2009 NOKIA CORP 1 3,745 15.03 1 3,745 8.78 0.67 49,129 49,129 15.04 0.0105
10/25/2009 10/26/2009 FORTUM CORP 1 444 1.78 1 444 16.65 0.67 11,050 11,050 1.78 0.0013
10/25/2009 10/26/2009 SAMPO A 1 420 1.69 1 420 16.76 0.67 10,521 10,521 1.69 0.0012
10/25/2009 10/26/2009 UPM-KYMMENE 1 520 2.09 1 520 8.11 0.67 6,301 6,301 2.09 0.0015
10/25/2009 10/26/2009 KONE B 1 154 0.62 1 154 26.30 0.67 6,040 6,040 0.62 0.0004
10/25/2009 10/26/2009 STORA ENSO R 1 582 2.33 1 582 5.29 0.67 4,598 4,598 2.34 0.0016
10/25/2009 10/26/2009 METSO CORP 1 128 0.51 1 128 18.74 0.67 3,572 3,572 0.51 0.0004
10/25/2009 10/26/2009 WARTSILA B 1 84 0.34 1 84 25.83 0.67 3,235 3,235 0.34 0.0002
Divisor (As of Date)
Divisor (As of Date + 1)

MSCI.COM | PAGE 90 OF 123 © 2018 MSCI Inc. All rights reserved. Please refer to the disclaimer at the end of this document.
MSCI INDEX CALCULATION METHODOLOGY | JANUARY 2018
Spin-off with Spun-off Not Traded on the Ex date
As an example, consider the spinoff of SONAE CAPITAL by SONAE SGPS effective January 4,
2008. Given that the spun-off company is not trading on the ex-date but the market
capitalization of the parent stock drops nevertheless to account for the value of the spun-off
company, MSCI creates a “dummy” security called “detached” to represent it. Its price is
calculated as the difference between the cum and ex prices of the parent security on the ex-
date from the ex-date + 1 onwards. It will be carried in the index at this calculated fixed
price until the day it starts trading where it is either added to the index or deleted at the end
of the first trading day. On the ex-date, however, it is represented by an interim constituent
with the following characteristics:
Intraday index unit number of shares equal to the parent company (terms are not
considered as this is a “dummy” security
Calculated price in real time equal to the difference between the cum price (closing price of
the previous day) of the parent company and the ex (current) price
At the close of the ex-date, the interim constituent is replaced by the detached security.
Note that there is no divisor change and hence no index unit number of shares change.
Subset of the MSCI Switzerland Large Cap Index Unit
* Interim constituents will be added to the product files in the second phase of the MSCI Market Open Index project (expected delivery at the end of 2010)
861,052,729
857,954,025
A B C D E F G H I J L M N O
Calculation
DateAs of Date Security Name
Interim
constituent type
Underlying
Asset
Description
Interim const.
trading
status
Idx Incl
Flag (as
of date)
Intraday
Index NOS
MM
Intraday
Idx Unit
NOS
Idx Incl
Flag (as of
date + 1)
End of Day
Index NOS
MM
Price (As
of Date)
FX (As of
Date)
Mcap
(As of Date)
D*E*I/J
Initial Mcap
(As of Date + 1)
G*H*I/J
End of Day
Idx Unit
NOS
Idx Unit NOS
Change
(N-F)
9/30/2009 10/1/2009 JULIUS BAER HOLDING 1 211 0.25 1 211 38.30 1.04 7,765 7,765 0.25 0.0009
9/30/2009 10/1/2009JULIUS BAER HOLDING
(INTERIM 1)*
OTHER ASSET
DISTRIBUTEDGAM HOLDING TRADED 1 211 0.25 0 12.00 1.04 2,433 0 0.00 -0.2451
9/30/2009 10/1/2009 NESTLE 1 3,639 4.23 1 3,639 43.96 1.04 153,656 153,656 4.24 0.0153
9/30/2009 10/1/2009 ROCHE HOLDING GENUSS 1 703 0.82 1 703 166.30 1.04 112,240 112,240 0.82 0.0029
9/30/2009 10/1/2009 NOVARTIS 1 2,115 2.46 1 2,115 51.65 1.04 104,937 104,937 2.47 0.0089
9/30/2009 10/1/2009 UBS NAMEN 1 3,558 4.13 1 3,558 18.39 1.04 62,859 62,859 4.15 0.0149
9/30/2009 10/1/2009 CREDIT SUISSE 1 1,125 1.31 1 1,125 57.45 1.04 62,111 62,111 1.31 0.0047
9/30/2009 10/1/2009 ABB LTD 1 2,207 2.56 1 2,207 20.46 1.04 43,372 43,372 2.57 0.0093
9/30/2009 10/1/2009 ZURICH FINL SERVICES 1 147 0.17 1 147 244.80 1.04 34,552 34,552 0.17 0.0006
9/30/2009 10/1/2009 SYNGENTA 1 97 0.11 1 97 229.90 1.04 21,404 21,404 0.11 0.0004
9/30/2009 10/1/2009 HOLCIM 1 245 0.28 1 245 68.50 1.04 16,143 16,143 0.29 0.0010
Divisor (As of Date)
Divisor (As of Date + 1)

MSCI.COM | PAGE 91 OF 123 © 2018 MSCI Inc. All rights reserved. Please refer to the disclaimer at the end of this document.
MSCI INDEX CALCULATION METHODOLOGY | JANUARY 2018
Rights Issue
As an example, consider the rights issue for BALFOUR BEATTY effective October 8, 2009 in
the MSCI UK Index11 and described below. 3 rights were offered for every 7 shares held at
1.8 GBP.
The performance of the index on the ex-date reflects an exposure to the rights and the
BALFOUR BEATTY weight increases only as of the close of the ex-date. Note that the
adjustment for a rights issue is always theoretical (the intrinsic value of the right is the
difference between the underlying stock price and the subscription price), even if the rights
will list on an exchange. An interim constituent with the following characteristics is created:
Intraday index unit number of shares calculated according to the terms (intraday index unit
number of shares of BALFOUR BEATTY times 3/7)
A calculated price defined as the price of BALFOUR BEATTY minus the subscription price of
1.8
At the end of the day, the interim constituent is deleted from the index (the rights are
subscribed to) and the exposure to BALFOUR BEATTY increases (its intraday index number of
shares and the divisor increase). The index unit adjustment (column O) is given by the
calculations described in the previous sections.
11 Note that this example is based on the current adjustment methodology for rights issue. The methodology being
different before November 2009, the published index level was calculated in a different way in practice
Subset of the MSCI Portugal Index Unit
* Interim constituents will be added to the product files in the second phase of the MSCI Market Open Index project (expected delivery at the end of 2010)
216,755,858
216,755,858
A B C D E F G H I J L M N O
Calculation
DateAs of Date Security Name
Interim
constituent
type
Underlying
Asset
Description
Interim const.
trading
status
Pricing
Formula
Idx Incl
Flag (as
of date)
Intraday
Index NOS
MM
Intraday
Idx Unit
NOS
Idx Incl
Flag (as of
date + 1)
End of Day
Index NOS
MM
Price (As
of Date)
FX (As of
Date)
Mcap
(As of Date)
D*E*I/J
Initial Mcap
(As of Date + 1)
G*H*I/J
End of Day
Idx Unit
NOS
Idx Unit NOS
Change
(N-F)
1/3/2008 1/4/2008 SONAE SGPS 1 800 3.69 1 800 1.65 0.68 1,950 1,950 3.69 0.0000
1/3/2008 1/4/2008 SONAE SGPS (INTERIM 1)*OTHER ASSET
DISTRIBUTEDSONAE CAPITAL Calculated
1.91 - SONAE
SGPS P(t)1 800 3.69 0 0.26 0.68 307 0 0.00 -3.6908
1/3/2008 1/4/2008 SONAE SGPS (DETACHED) 0 1 800 0.26 0.68 0 307 3.69 3.6908
1/3/2008 1/4/2008 EDP ENERGIAS DE PORTUGAL 1 2,011 9.28 1 2,011 4.54 0.68 13,490 13,490 9.28 0.0000
1/3/2008 1/4/2008 PORTUGAL TELECOM SGPS 1 790 3.65 1 790 8.70 0.68 10,157 10,157 3.65 0.0000
1/3/2008 1/4/2008 BCP BANCO COMERCIAL 1 1,806 8.33 1 1,806 2.72 0.68 7,256 7,256 8.33 0.0000
1/3/2008 1/4/2008 BANCO ESPIRITO SANTO 1 225 1.04 1 225 14.45 0.68 4,804 4,804 1.04 0.0000
1/3/2008 1/4/2008 BRISA 1 300 1.38 1 300 10.00 0.68 4,432 4,432 1.38 0.0000
1/3/2008 1/4/2008 PT MULTIMEDIA SERVIC COM 1 235 1.09 1 235 9.25 0.68 3,216 3,216 1.09 0.0000
1/3/2008 1/4/2008 CIMPOR CIMENTOS DE PORT 1 202 0.93 1 202 6.03 0.68 1,796 1,796 0.93 0.0000
1/3/2008 1/4/2008 BANCO BPI 1 228 1.05 1 228 4.97 0.68 1,674 1,674 1.05 0.0000
1/3/2008 1/4/2008 JERONIMO MARTINS SGPS 1 189 0.87 1 189 5.59 0.68 1,559 1,559 0.87 0.0000
1/3/2008 1/4/2008 SONAE INDUSTRIA SGPS 1 63 0.29 1 63 6.11 0.68 569 569 0.29 0.0000
Divisor (As of Date)
Divisor (As of Date + 1)

MSCI.COM | PAGE 92 OF 123 © 2018 MSCI Inc. All rights reserved. Please refer to the disclaimer at the end of this document.
MSCI INDEX CALCULATION METHODOLOGY | JANUARY 2018
Subset of the MSCI UK Index Unit
* Interim constituents will be added to the product files in the second phase of the MSCI Market Open Index project (expected delivery at the end of 2010)
2,020,072,842
2,020,659,252
A B C D E F G H I J K L M N O
Calculation
DateAs of Date Security Name
Interim constituent
type
Interim const.
trading
status
Pricing Formula
Idx Incl
Flag (as
of date)
Intraday
Index NOS
MM
Intraday
Idx Unit
NOS
Idx Incl
Flag (as of
date + 1)
End of Day
Index NOS
MM
Price (As
of Date)
FX (As of
Date)
Mcap in
Idx Unit
D*F*I/J
Mcap
(As of Date)
D*E*I/J
Initial Mcap
(As of Date + 1)
G*H*I/J
End of Day
Idx Unit
NOS
Idx Unit NOS
Change
(N-F)
10/7/2009 10/8/2009 BALFOUR BEATTY 1 478 0.24 1 683 2.80 0.62 1 2,152 3,074 0.34 0.1013
10/7/2009 10/8/2009 BALFOUR BEATTY (INTERIM 1)*THEO RIGHT - NEW
UNDERLYING SHRAESCALCULATED
BALFOUR
BEATTY P(t) - 1.81 205 0.10 0 0 1.00 0.62 0 329 0 0.00 -0.1014
10/7/2009 10/8/2009 HSBC HOLDINGS (GB) 1 17,315 8.57 1 17,315 7.12 0.62 98 198,497 198,497 8.57 -0.002
10/7/2009 10/8/2009 BP 1 18,738 9.28 1 18,738 5.46 0.62 81 164,556 164,556 9.27 -0.003
10/7/2009 10/8/2009 VODAFONE GROUP 1 52,487 25.98 1 52,487 1.35 0.62 56 113,736 113,736 25.98 -0.008
10/7/2009 10/8/2009 GLAXOSMITHKLINE 1 5,188 2.57 1 5,188 12.35 0.62 51 103,157 103,157 2.57 -0.001
10/7/2009 10/8/2009 ROYAL DUTCH SHELL A 1 3,546 1.76 1 3,546 17.68 0.62 50 100,892 100,892 1.75 -0.001
10/7/2009 10/8/2009 ROYAL DUTCH SHELL B 1 2,696 1.33 1 2,696 17.18 0.62 37 74,561 74,561 1.33 0.000
Divisor (As of Date)
Divisor (As of Date + 1)

MSCI.COM | PAGE 93 OF 123 © 2018 MSCI Inc. All rights reserved. Please refer to the disclaimer at the end of this document.
MSCI INDEX CALCULATION METHODOLOGY | JANUARY 2018
Interim Constituent Creation Rules
Description of event Parent Security Intraday NOS*
Parent Security Pre-open Price
Interim Constituent Type
Trading Status
Interim Constituent Intraday NOS
Interim Constituent
Pre-open Price
Interim Constituent Intraday/Closing
Price
Buyback Against Cash -
EndOfDayNOS(t-1) adjusted to take only
into account the shares that have not
been bought back
Theo-ex price taking into account the terms of the
event CASH Fixed
EndOfDayNOS(t-1) of parent security adjusted to take into account the shares that have been
bought back
Buyback price Buyback price
Buyback Exchange of
Shares -
EndOfDayNOS(t-1) adjusted to take only
into account the shares that have not
been bought back
Theo-ex price taking into account the terms of the
event
OTHER ASSET ACQUIRED
Traded
EndOfDayNOS(t-1) of parent security adjusted to take into account the shares that have been bought back and the
amount of other asset acquired
Other asset acquired price
Other asset acquired price
Capital Repayment
- - EndOfDayNOS(t-1) Theo-ex price taking into account the terms of the
event CASH Fixed
EndOfDayNOS(t-1) of parent security
Cash amount Cash amount
Installment Receipt
- - EndOfDayNOS(t-1) Theo-ex price taking into account the terms of the
event CASH Fixed
EndOfDayNOS(t-1) of parent security
- [minus] Cash amount
- [minus] Cash amount
Partial Tender Offer
Exchange of Shares
-
EndOfDayNOS(t-1) adjusted to take only
into account the shares that have not
been bought back
Theo-ex price taking into account the terms of the
event
OTHER ASSET ACQUIRED
Traded
EndOfDayNOS(t-1) of parent security adjusted to take into account the shares that have been bought back and the
amount of other asset acquired
Other asset acquired price
Other asset acquired price
Partial Tender Offer
Against Cash -
EndOfDayNOS(t-1) adjusted to take only
into account the shares that have not
been bought back
Theo-ex price taking into account the terms of the
event CASH Fixed
EndOfDayNOS(t-1) of parent security adjusted to take into account the shares that have been
bought back
Tender offer price
Tender offer price
Redemption Against Cash -
EndOfDayNOS(t-1) adjusted to take only
into account the shares that have not
been bought back
Theo-ex price taking into account the terms of the
event CASH Fixed
EndOfDayNOS(t-1) of parent security adjusted to take into account the shares that have been
bought back
Redemption price
Redemption price
Rights Issue Right of New Underlying
- EndOfDayNOS(t-1) Theo-ex price taking into account the terms of the
THEORETICAL RIGHT - NEW
Calculated EndOfDayNOS(t-1) of parent security adjusted
Theo-ex price of parent
Ex price of parent constituent -

MSCI.COM | PAGE 94 OF 123 © 2018 MSCI Inc. All rights reserved. Please refer to the disclaimer at the end of this document.
MSCI INDEX CALCULATION METHODOLOGY | JANUARY 2018
Description of event Parent Security Intraday NOS*
Parent Security Pre-open Price
Interim Constituent Type
Trading Status
Interim Constituent Intraday NOS
Interim Constituent
Pre-open Price
Interim Constituent Intraday/Closing
Price
Shares event UNDERLYING SHARES
by the terms of the right constituent - subscription
price
subscription price
Rights Issue
Right of New Underlying Shares Not Entitled to
Forthcoming Dividend
- EndOfDayNOS(t-1) Theo-ex price taking into account the terms of the
event
THEORETICAL RIGHT - NEW UNDERLYING
SHARES
Calculated EndOfDayNOS(t-1) of
parent security adjusted by the terms of the right
Theo-ex price of parent
constituent - subscription price - gross dividend per
share
Ex price of parent constituent -
subscription price - gross dividend per
share
Rights Issue
Right of New Underlying Shares with
Another Asset (bond,
warrant, preferred,
etc.) attached
If market right is traded
EndOfDayNOS(t-1) Theo-ex price taking into account the terms of the
event MARKET RIGHT Traded
If market right is traded for one "old" share:
EndOfDayNOS(t-1) of parent security
If market right is traded
for one "new" share: EndOfDayNOS(t-1) of
parent security adjusted by the terms of the right
If market right is traded for one
"old" share: Market right or Theo-ex price of
parent constituent - subscription
price adjusted for the terms of
the right
If market right is traded for one "new" share:
Market right or Theo-ex price of
parent constituent - subscription
price
Market right
If market right is not traded but other asset attached is
traded
EndOfDayNOS(t-1) Theo-ex price taking into account the terms of the
event
THEORETICAL RIGHT - NEW UNDERLYING
SHARES
and
OTHER ASSET ATTACHED
Calculated
and
traded
"Theoretical right constituent":
EndOfDayNOS(t-1) of parent security adjusted for the terms of the right
"OtherAssetAttached
constituent": EndOfDayNOS(t-1) of
parent security adjusted
"Theo right constituent":
Theo-ex price of parent security -
subscription price
"OtherAssetAtta
ched constituent": Other Asset
"Theo right constituent":
Ex price of parent security -
subscription price
"OtherAssetAttached constituent":
Other Asset Attached price
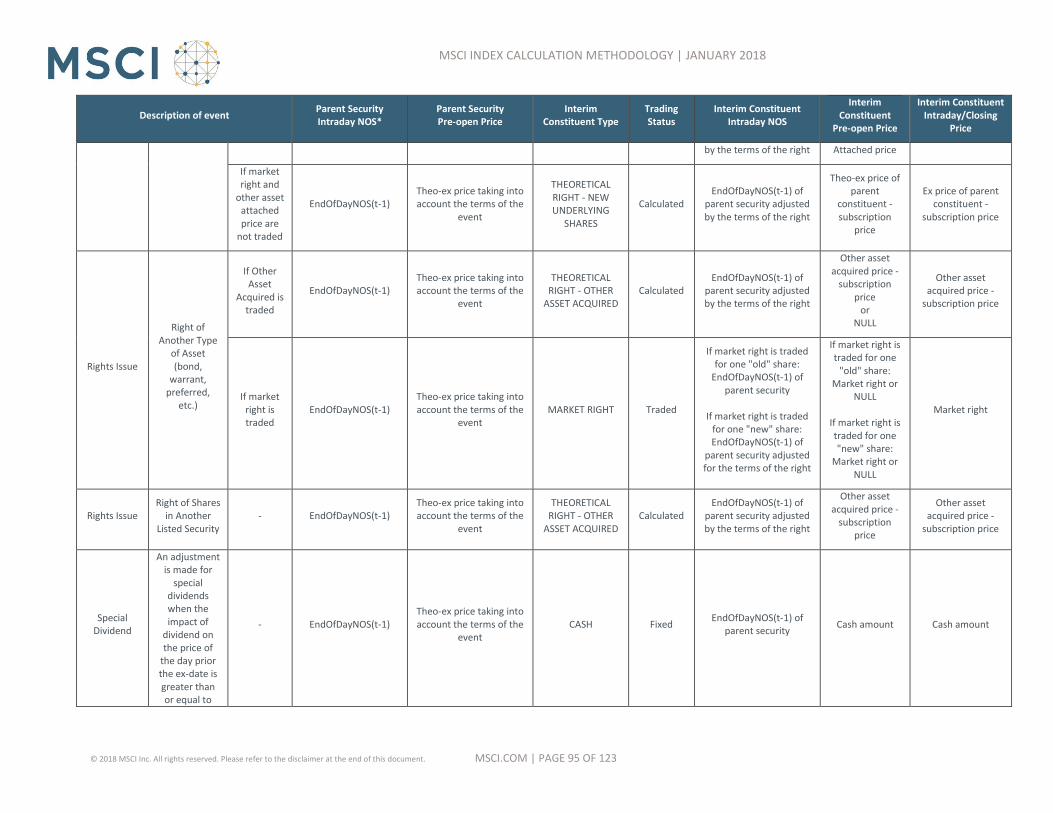
MSCI.COM | PAGE 95 OF 123 © 2018 MSCI Inc. All rights reserved. Please refer to the disclaimer at the end of this document.
MSCI INDEX CALCULATION METHODOLOGY | JANUARY 2018
Description of event Parent Security Intraday NOS*
Parent Security Pre-open Price
Interim Constituent Type
Trading Status
Interim Constituent Intraday NOS
Interim Constituent
Pre-open Price
Interim Constituent Intraday/Closing
Price
by the terms of the right Attached price
If market right and
other asset attached price are
not traded
EndOfDayNOS(t-1) Theo-ex price taking into account the terms of the
event
THEORETICAL RIGHT - NEW UNDERLYING
SHARES
Calculated EndOfDayNOS(t-1) of
parent security adjusted by the terms of the right
Theo-ex price of parent
constituent - subscription
price
Ex price of parent constituent -
subscription price
Rights Issue
Right of Another Type
of Asset (bond,
warrant, preferred,
etc.)
If Other Asset
Acquired is traded
EndOfDayNOS(t-1) Theo-ex price taking into account the terms of the
event
THEORETICAL RIGHT - OTHER
ASSET ACQUIRED Calculated
EndOfDayNOS(t-1) of parent security adjusted by the terms of the right
Other asset acquired price -
subscription price
or NULL
Other asset acquired price -
subscription price
If market right is traded
EndOfDayNOS(t-1) Theo-ex price taking into account the terms of the
event MARKET RIGHT Traded
If market right is traded for one "old" share:
EndOfDayNOS(t-1) of parent security
If market right is traded
for one "new" share: EndOfDayNOS(t-1) of
parent security adjusted for the terms of the right
If market right is traded for one
"old" share: Market right or
NULL
If market right is traded for one "new" share:
Market right or NULL
Market right
Rights Issue Right of Shares
in Another Listed Security
- EndOfDayNOS(t-1) Theo-ex price taking into account the terms of the
event
THEORETICAL RIGHT - OTHER
ASSET ACQUIRED Calculated
EndOfDayNOS(t-1) of parent security adjusted by the terms of the right
Other asset acquired price -
subscription price
Other asset acquired price -
subscription price
Special Dividend
An adjustment is made for
special dividends when the impact of
dividend on the price of
the day prior the ex-date is greater than or equal to
- EndOfDayNOS(t-1) Theo-ex price taking into account the terms of the
event CASH Fixed
EndOfDayNOS(t-1) of parent security
Cash amount Cash amount

MSCI.COM | PAGE 96 OF 123 © 2018 MSCI Inc. All rights reserved. Please refer to the disclaimer at the end of this document.
MSCI INDEX CALCULATION METHODOLOGY | JANUARY 2018
Description of event Parent Security Intraday NOS*
Parent Security Pre-open Price
Interim Constituent Type
Trading Status
Interim Constituent Intraday NOS
Interim Constituent
Pre-open Price
Interim Constituent Intraday/Closing
Price
5%.
Spin-off Spun-off
traded on the ex-date
- EndOfDayNOS(t-1) Theo-ex price taking into account the terms of the
event
OTHER ASSET DISTRIBUTED
Traded
EndOfDayNOS(t-1) of parent security adjusted by the terms of the spin-
off
Other Asset Distributed price
Other Asset Distributed price
Spin-off
Spun-off NOT traded on the
ex-date (creation of a
'detached' security)
- EndOfDayNOS(t-1) Theo-ex price taking into account the terms of the
event
OTHER ASSET DISTRIBUTED
Calculated EndOfDayNOS(t-1) of
parent security
Other Asset Distributed price adjusted by the
terms of the event
Cum price - Ex price of parent security
Stock
Stock with New Shares
Not Entitled to Forthcoming
Dividend
- EndOfDayNOS(t-1)
adjusted to take into account the Stock
Theo-ex price taking into account the terms of the
event CASH Fixed
EndOfDayNOS(t-1) of parent security adjusted by the terms of the stock
- [minus] Forthcoming
Gross Dividend
- [minus] Forthcoming Gross
Dividend
Stock
Distribution of Another Type
of Asset (bond,
warrant, preferred,
etc.)
- EndOfDayNOS(t-1) Theo-ex price taking into account the terms of the
event
OTHER ASSET DISTRIBUTED
Traded EndOfDayNOS(t-1) of
parent security adjusted by the terms of the stock
Other Asset Distributed or
NULL
Other Asset Distributed
Stock
Distribution of New
Underlying Shares with
Warrants attached
- EndOfDayNOS(t-1)
adjusted to take into account the Stock
Theo-ex price taking into account the terms of the
event
OTHER ASSET ATTACHED
Traded EndOfDayNOS(t-1) of
parent security adjusted by the terms of the stock
Other Asset Attached or
NULL
Other Asset Attached
Multiple corporate events happening on the same day use a combination of the above rules and can potentially result in several interim constituents
being created
*In case of multiple corporate events, the field "EndOfDayNOS(t-1)" should be replaced by the "IntradayNOS" calculated during the previous event

MSCI.COM | PAGE 97 OF 123 © 2018 MSCI Inc. All rights reserved. Please refer to the disclaimer at the end of this document.
MSCI INDEX CALCULATION METHODOLOGY | JANUARY 2018
APPENDIX XI: INDEX CORRECTION POLICY
If the impact of an error is below 50 basis points on the country index OR on the World/EM
Industry Group (or 50 basis points on the MSCI Frontier Markets region including the MSCI
GCC Countries), no index re statement is made.
If the impact of the error is greater or equal to 50 basis points on the country index OR on
the World/EM Industry Group (or 50 basis points on the MSCI Frontier Markets region
including the MSCI GCC Countries), all of the indexes affected by 50 basis points or more are
re stated.
In certain circumstances, such as errors in the list of constituents (i.e. a security missed), or if
MSCI finds that the error is significant enough to justify the revision of indexes impacted by
less than 50 basis point (e.g. 1/3 of US prices wrong), MSCI reserves the right to correct
information even if the impact is lower than the 50 basis points correction threshold.
MSCI applies a 12 months correction period. Errors on historical values older than 12
months are in general not revised.

MSCI.COM | PAGE 98 OF 123 © 2018 MSCI Inc. All rights reserved. Please refer to the disclaimer at the end of this document.
MSCI INDEX CALCULATION METHODOLOGY | JANUARY 2018
MSCI INDEX CALCULATION METHODOLOGY BOOK TRACKED
CHANGES
The following section has been updated since January 2008.
2008
February:
Daily Hedged Indexes
Change in the wording to clarify the hedged indexes calculation methodology (3.2.1
and 3.2.2)
Update of the Daily Hedged Index example (3.2.5)
Appendix VI: Withholding Tax Rates
Addition of Frontier Markets
Removal of Venezuela
Appendix VII: Closing Prices Policy
Addition of Frontier Markets
Removal of Venezuela
Appendix VIII: Country Composition of MSCI Regional Indexes
Addition of Frontier Markets countries
Addition of 3 regions (GCC countries, Arabian Markets, Frontier Markets)
March:
Appendix VII: Closing Prices Policy
Change in the closing price description for Croatia
Addition of Dubai International Financial Exchange for United Arab Emirates
April:
Appendix VII: Closing Prices Policy

MSCI.COM | PAGE 99 OF 123 © 2018 MSCI Inc. All rights reserved. Please refer to the disclaimer at the end of this document.
MSCI INDEX CALCULATION METHODOLOGY | JANUARY 2018
Change in the closing price description for Croatia
Addition of Dubai International Financial Exchange for United Arab Emirates
May:
Appendix VII: Closing Prices Policy
Change in the closing price description for Israel (Domestic).
Change in the Closing price available time (local) of Bahrain market
Change in the Closing price used, price description and available time for HK.
July:
Appendix II: Security level information: Annualized Traded Value Ratio (ATVR) and
Annual Traded Value
New section
September:
Appendix VII: Closing Prices Policy
Closing prices available at 5:30pm local time for Norway (Oslo Stock Exchange).
Include Serbia and Belgrade Stock Exchange trading information.
November:
Appendix VI: Withholding Taxes Rates
Addition of Lithuania and Serbia
Appendix VII: Closing Prices Policy
Closing price availability for Greece updated to be 5:20pm local time.
Closing price used for Serbia market updated to be VWAP.
Closing price used for Chile market updated to be Official Closing Price.
Appendix VIII: Country Composition of MSCI Regional Indexes
Addition of Lithuania and Serbia.

MSCI.COM | PAGE 100 OF 123 © 2018 MSCI Inc. All rights reserved. Please refer to the disclaimer at the end of this document.
MSCI INDEX CALCULATION METHODOLOGY | JANUARY 2018
Updates for Jordan
December:
Appendix VII: Closing Prices Policy
Closing price description of Thailand includes explanation of applying random
auction call method to both main board and foreign board of stock exchange of
Thailand.
Price used for The Bombay Stock Exchange update to be WAP, description is also
updated accordingly.
Closing price description of The National Stock Exchange of India has been
confirmed to be Volume Weighted Average Price.
Closing price used and description for Pakistan will take last available ASK price for
those securities that do not report one or more trades on the Karachi Stock
Exchange for the calculation date.
Include coverage of Botswana, Ghana, Jamaica and Trinidad and Tobago.
Closing price availability time change of Israel market
Appendix VIII: Country Composition of MSCI Regional Indexes
Updates for Pakistan
2009
February:
Section 2: MSCI Daily Total Return (DTR) Index Methodology
Country Exceptions
Update on Russian dividends treatment (2.3.6)
Taxes on Dividends
Change in the wording to clarify the dividend taxes (2.3.7)
Addition of Australian Dividends as an exception (2.3.7.2.1)
Appendix VI: Withholding Tax Rates
Addition of Botswana, Ghana, Jamaica and Trinidad and Tobago

MSCI.COM | PAGE 101 OF 123 © 2018 MSCI Inc. All rights reserved. Please refer to the disclaimer at the end of this document.
MSCI INDEX CALCULATION METHODOLOGY | JANUARY 2018
Updates for China on B shares and H shares, Estonia, Germany, Greece, Korea, and
Philippines
March:
Appendix VI: Withholding Tax Rates
Updates for Kazakhstan and Lithuania
April
Appendix VII: Closing Prices Policy
Update close price definition and description of Trinidad and Tobago
May:
Section 1: MSCI Price Index Methodology
Reordering of chapters
Addition of example of index calculation using contribution method
Addition of chapter ‘Note on Index Calculation in Local Currency’
Addition of chapter ‘Conversion of indexes into Another Currency’
Section 2: MSCI Daily Total Return (DTR) Index Methodology
2.2.3 dividends resulting in a reinvestment only
Change in paragraph related to optional dividend
Appendix V: Singapore and Singapore Free Indexes
Section added. Information was previously part of Frequently Asked Questions
Appendix
Appendix VI: Withholding Tax Rates
Updates for China Red Chip and Kuwait
Appendix VII: Closing Prices Policy
Closing price used for Jamaica updated to be Average Price
Closing price used for Pakistan updated to be Official Close

MSCI.COM | PAGE 102 OF 123 © 2018 MSCI Inc. All rights reserved. Please refer to the disclaimer at the end of this document.
MSCI INDEX CALCULATION METHODOLOGY | JANUARY 2018
Additional closing price used for Kazakhstan updated to be closing price of
Kazakhstan (UK listed Depository Receipts) and following UK closing price policy.
Appendix VIII: Country composition of MSCI Regional Indexes
Update for Argentina
Update for Pakistan
Update for Trinidad and Tobago
Frequently Asked Questions
Section removed: Removal of information related to Israel Domestic and Israel Non-
Domestic
Information related to Singapore and Singapore Free Indexes moved to Appendix V.
July:
Appendix VII: Closing Prices Policy
Closing price used for UAE, International Financial Exchange, updated to be Official
Close Price
Closing price used for Czech Republic updated to be Official Close Price.
Update closing prices availability for the Belgium, Netherlands, France and Portugal.
Update close price definition and description of USA (NASDAQ Global Market,
NASDAQ Global Select Market)
Additional column of market identifier code (MIC) is added.
Closing price description update of ADR from Argentina, Colombia, Israel and Peru.
Bloomberg country codes for the following countries have been updated.
(Argentina, Brazil, Canada, Chile, Columbia, Czech Republic, Egypt, Kazakhstan (UK
listed Depository Receipts), Korea, Pakistan, Russia (UK listed Depository Receipts),
Spain, UAE, USA, Vietnam)
September:
Appendix VII: Closing Prices Policy
MIC update for Oslo Stock Exchange and Taiwan Stock Exchange.

MSCI.COM | PAGE 103 OF 123 © 2018 MSCI Inc. All rights reserved. Please refer to the disclaimer at the end of this document.
MSCI INDEX CALCULATION METHODOLOGY | JANUARY 2018
November:
MSCI Equity Indexes
Addition of CNY as a currency indexes are provided in.
Section 1 and section 2
Addition of note for China A indexes related to the use of the Index Inclusion Factor
Section 2
Net Daily Today Return
Updates for Net Daily Total Return (2.2)
Withholding Tax
Country of incorporation is used to determine the relevant dividend withholding tax
rate (2.3.7.2)
Section 3: Alternative Index Calculation
Section renamed Gross Domestic Product (GDP) Weighted Indexes
Removal of Daily Hedged Indexes chapter
Appendix I: MSCI GCC Country Indexes: Saturday/Sunday Index Calculation
Removal of the note related to the use of Index Inclusion Factor which is not
relevant for GCC Countries.
Appendix III: Exchange Rates
Details added related to treatment in special circumstances and if WM/Reuters
does not provide rates.
Appendix VI: Withholding Tax Rates
Updates for withholding tax rates based upon country of incorporation
2010
January:
Appendix VI: Withholding Tax Rates
Updates for Lithuania and Spain

MSCI.COM | PAGE 104 OF 123 © 2018 MSCI Inc. All rights reserved. Please refer to the disclaimer at the end of this document.
MSCI INDEX CALCULATION METHODOLOGY | JANUARY 2018
February:
MSCI Equity Indexes
Addition of BRL, HKD, INR, RUB and SGD as currencies indexes are provided in
Addition of a note related to the treatment of index ruptures
Appendix VII: Closing Prices Policy
Update for the change of closing price for Saudi Arabia
Appendix VIII: Country Composition of MSCI Selected Regional Indexes
Addition of Bangladesh
Changes for Israel to reflect its move from EM to DM coverage
May:
Section 2: MSCI Daily Total Return (DTR) Index Methodology
2.3.3 Correction
Addition of precision in correction implementation timing
2.3.6 Country Exceptions
Addition of precision on timing for implementation of late dividends (2.3.6)
Addition of precision on Korean and Russian late dividends (2.3.6)
Appendix I: Saturday/Sunday Index Calculation
Addition of precision on corporate Events treatment
Appendix VII: Closing Prices Policy
Removal of pricing information for Israel non Domestic
Closing price used for Pakistan updated to be Official Close
Appendix VIII: Country Composition of MSCI Selected Regional Indexes
Changes for Bangladesh to reflect its inclusion into the FM regional index.
Appendix IX: Real Time Indexes
New section

MSCI.COM | PAGE 105 OF 123 © 2018 MSCI Inc. All rights reserved. Please refer to the disclaimer at the end of this document.
MSCI INDEX CALCULATION METHODOLOGY | JANUARY 2018
June:
Appendix VII: Closing Prices Policy
Closing price used for Greece updated to be Auction Close
Appendix X: Index Calculation Methodology Using Index Divisors
New section
August:
Appendix VI: Withholding Tax Rates
Addition of Bosnia and Herzegovina
Update for Slovenia
Appendix VII: Closing Prices Policy
Addition of Bangladesh
Addition of Bosnia and Herzegovina
Closing price used for Greece updated
Closing price used for Czech Republic updated
Appendix VIII: Country Composition of MSCI Selected Regional Indexes
Addition of Bosnia and Herzegovina
September:
Section 2: MSCI Daily Total Return (DTR) Index Methodology
2.3.3 Correction
Addition of correction policy for MSCI Frontier Markets Indexes
Appendix VII: Closing Prices Policy
Closing price used for Nigeria updated to Official Close
Removal of Saudi Arabia
Appendix VIII: Country Composition of MSCI Selected Regional Indexes

MSCI.COM | PAGE 106 OF 123 © 2018 MSCI Inc. All rights reserved. Please refer to the disclaimer at the end of this document.
MSCI INDEX CALCULATION METHODOLOGY | JANUARY 2018
Replaced index GCC COUNTRIES by index GCC COUNTRIES ex SA
Replaced index ARABIAN MARKETS by index ARABIAN MARKETS ex SA
Removal of Saudi Arabia
October:
Appendix I: Sunday Index Calculation
Discontinuation of Saturday products
Appendix VII: Closing Prices Policy
Closing price used for Qatar updated to Last traded price
November:
MSCI Equity Indexes
Addition of KRW as a currency indexes are provided in.
Appendix VII: Closing Prices Policy
Removal of closing price information for Russian Trading System (RTS)
2011
January:
Appendix VI: Withholding Tax Rates
Update for Portugal
Appendix VII: Closing Prices Policy
Closing price used for Slovenia updated to Official Close
February:
Section 3: Gross Domestic Products (GDP) Weighted Indexes
Section removed.
Appendix VI: Withholding Tax Rates
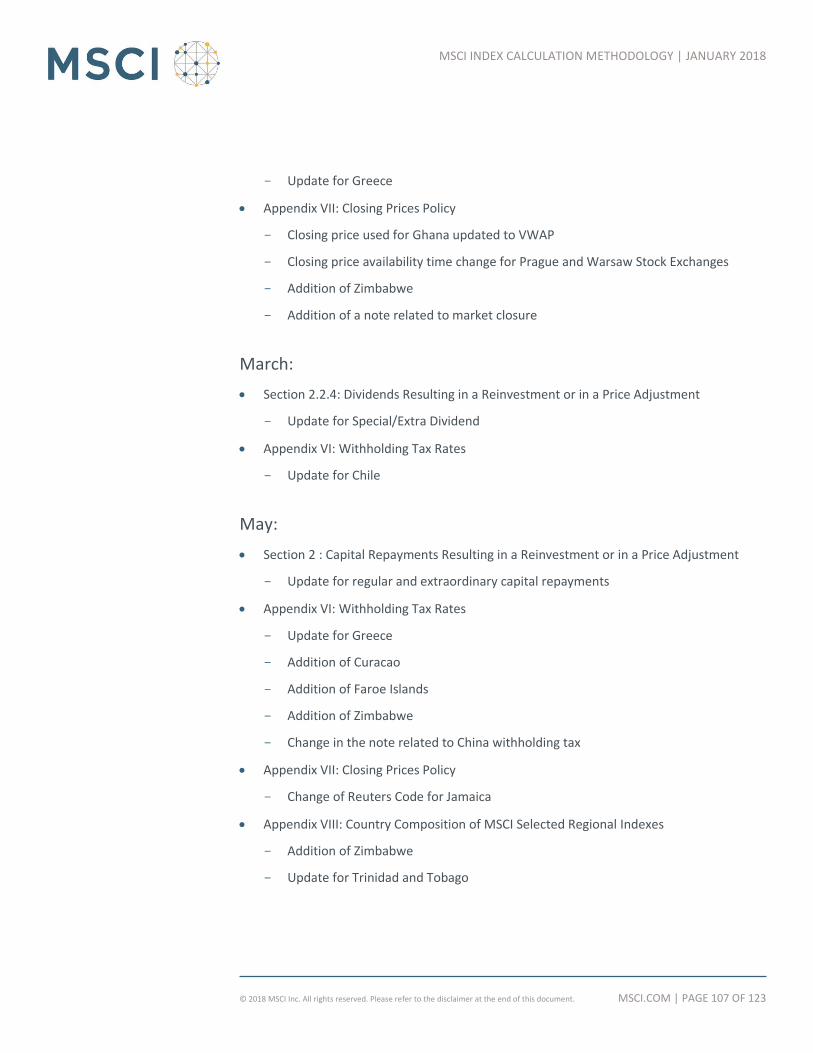
MSCI.COM | PAGE 107 OF 123 © 2018 MSCI Inc. All rights reserved. Please refer to the disclaimer at the end of this document.
MSCI INDEX CALCULATION METHODOLOGY | JANUARY 2018
Update for Greece
Appendix VII: Closing Prices Policy
Closing price used for Ghana updated to VWAP
Closing price availability time change for Prague and Warsaw Stock Exchanges
Addition of Zimbabwe
Addition of a note related to market closure
March:
Section 2.2.4: Dividends Resulting in a Reinvestment or in a Price Adjustment
Update for Special/Extra Dividend
Appendix VI: Withholding Tax Rates
Update for Chile
May:
Section 2 : Capital Repayments Resulting in a Reinvestment or in a Price Adjustment
Update for regular and extraordinary capital repayments
Appendix VI: Withholding Tax Rates
Update for Greece
Addition of Curacao
Addition of Faroe Islands
Addition of Zimbabwe
Change in the note related to China withholding tax
Appendix VII: Closing Prices Policy
Change of Reuters Code for Jamaica
Appendix VIII: Country Composition of MSCI Selected Regional Indexes
Addition of Zimbabwe
Update for Trinidad and Tobago

MSCI.COM | PAGE 108 OF 123 © 2018 MSCI Inc. All rights reserved. Please refer to the disclaimer at the end of this document.
MSCI INDEX CALCULATION METHODOLOGY | JANUARY 2018
July:
Appendix VII: Closing Prices Policy
Change in closing price definition for Trinidad and Tobago
Appendix VI: Withholding Tax Rates
Update for Botswana
August:
Section 2.2.5: Dividends Resulting in a Price Adjustment Only
Update of Stock Dividend (stock bonus/gratis issue)
Section 2.3.7.2.1: Country Exception
Addition of Taiwanese Stock Dividends
October:
Appendix VI: Withholding Tax Rates
Addition of a note related to Malaysia withholding tax
Addition of a note related to United Kingdom withholding tax
November:
Appendix VII: Closing Prices Policy
Addition of special note for Japanese securities
Closing price availability time change for Chile, Colombia, Estonia, India, Japan,
Jordan, Lithuania, Mauritius, Nigeria, Philippines, Portugal and Ukraine.
Addition of Ukrainian Exchange (Ukraine)
Addition of Banja Luka Exchange (Bosnia and Herzegovina)

MSCI.COM | PAGE 109 OF 123 © 2018 MSCI Inc. All rights reserved. Please refer to the disclaimer at the end of this document.
MSCI INDEX CALCULATION METHODOLOGY | JANUARY 2018
2012
January:
Appendix VI: Withholding Tax Rates
Update for Chile, Denmark, Finland, France, Greece, Israel, Italy, Portugal and Spain
February:
Appendix VI: Withholding Tax Rates
Update for Finland
March:
Appendix VI: Withholding Tax Rates
Removal of the note related to Italy withholding tax
Update for Croatia
Appendix VII: Closing Prices Policy
Change in closing price definition for Turkey
April:
Appendix VI: Withholding Tax Rates
Update for South Africa
Appendix VII: Closing Prices Policy
Correction of the Market Identifier Code (MIC) for Ukrainian Exchange
May:
Section 2: MSCI Daily Total Return (DTR) Index Methodology
2.2.1 Timing of reinvestment
Details added related to reinvestment when the security does not trade
Appendix VI: Withholding Tax Rates

MSCI.COM | PAGE 110 OF 123 © 2018 MSCI Inc. All rights reserved. Please refer to the disclaimer at the end of this document.
MSCI INDEX CALCULATION METHODOLOGY | JANUARY 2018
Addition of a note related to Japan withholding tax
Appendix IX: MSCI Real Time Indexes
Details added related to reinvestment when the security does not trade
Appendix VII: Closing Prices Policy
Change in closing price definition for Kuwait
Change in closing price availability for Indonesia
June:
Appendix VII: Closing Prices Policy
Addition of Saudi Arabia
Appendix I: Saturday/Sunday Index Calculation
Reintroduction of Saturday Calculation information
Appendix VI: Withholding Tax Rates
Update for Kazakhstan
August:
Section 2.2.3: Dividends Resulting in a Reinvestment Only
Update of Regular Capital Repayment
Section 2.3.6: Country Exceptions
Update of the dividend reinvestment treatment in Korea and Russia
November:
Section 2.2.3: Dividends Resulting in a Reinvestment Only
Update of Regular Capital Repayment
Section 2.3.6: Country Exceptions
Addition of Taiwanese Capital Repayments
Appendix VI: Withholding Tax Rates
MSCI.COM | PAGE 111 OF 123 © 2018 MSCI Inc. All rights reserved. Please refer to the disclaimer at the end of this document.
MSCI INDEX CALCULATION METHODOLOGY | JANUARY 2018
Update for Japan
Removal of the note related to Japan withholding tax
December:
Appendix VII: Closing Prices Policy
Change in closing price definition, closing prices availability time, Exchange and
Bloomberg Code for Czech Republic.
2013
January:
Appendix VII: Closing Prices Policy
Change in closing price definition for Indonesia.
Change in closing price definition for Abu Dhabi Securities Exchange.
Appendix VI: Withholding Tax Rates
Update for Chile
Update for Czech Republic
Update for Portugal
Update for Slovenia
February:
Appendix VI: Withholding Tax Rates
Update for Trinidad and Tobago
May:
Appendix IX: MSCI Real Time Indexes
Update of Intraday Price Adjustment Factor announcements
Section 2.3.6: Country Exceptions

MSCI.COM | PAGE 112 OF 123 © 2018 MSCI Inc. All rights reserved. Please refer to the disclaimer at the end of this document.
MSCI INDEX CALCULATION METHODOLOGY | JANUARY 2018
Update of the dividend reinvestment treatment in Russia
Appendix VI: Withholding Tax Rates
Addition of Malta
Appendix VII: Closing Prices Policy
Change in Exchange Name for Egypt
Change in closing price Description for Egypt
August:
Section 2.3.7.2.1: Country Exceptions
Addition of Thailand Cash Dividends
Appendix I: Sunday Index Calculation
Discontinuation of Saturday products
Appendix VI: Withholding Tax Rates
Addition of a note related to Taiwan REIT withholding tax
Addition of a note related to Japan withholding tax
September:
Appendix VII: Closing Prices Policy
Change in closing price Description for Philippines
Change in closing prices Availability for Philippines
Appendix VI: Withholding Tax Rates
Update for Morocco
October:
Appendix VI: Withholding Tax Rates
Update for Argentina
Addition of Palestine

MSCI.COM | PAGE 113 OF 123 © 2018 MSCI Inc. All rights reserved. Please refer to the disclaimer at the end of this document.
MSCI INDEX CALCULATION METHODOLOGY | JANUARY 2018
November:
Appendix VI: Withholding Tax Rates
Update for Japan
Removal of the note related to Japan withholding tax
Update for Portugal
Appendix VIII: Country Composition of MSCI Selected Regional Indexes
Replaced index GCC COUNTRIES ex SA by index GCC COUNTRIES
Replaced index ARABIAN MARKETS ex SA by index ARABIAN MARKETS
Update for Greece and Morocco
Addition of Palestine
2014
January:
Appendix VI: Withholding Tax Rates
Update for Slovenia, Mexico, Greece and Bosnia and Herzegovina
February:
Section 2.2.2: Reinvestment Rules
Update in the definitions
Section 2.2.3: Dividends Resulting in a Reinvestment Only
Update for Regular Cash Dividend
Update for Regular Capital Repayment
Section 2.2.4: Dividends Resulting in a Reinvestment or in a Price Adjustment
Update for Special/Extra Dividend
Change in Special Dividend to Non-Domestic Shareholders
Section 2.2.5: Dividends Resulting in a Reinvestment or in a Price Adjustment

MSCI.COM | PAGE 114 OF 123 © 2018 MSCI Inc. All rights reserved. Please refer to the disclaimer at the end of this document.
MSCI INDEX CALCULATION METHODOLOGY | JANUARY 2018
Update for Extraordinary Capital Repayment
Section 2.3.6: Country Exceptions
Addition of Singapore
Updates for Korea
Section 2.3.7.1: Tax Credit
Update of footnote 3
Appendix VI: Withholding Tax Rates
Updates for Malaysia
March:
Appendix VI: Withholding Tax Rates
Updates for Mexico
April:
Appendix VII: Closing Prices Policy
Change in closing price definition for Saudi Arabia
Change in closing prices availability for Saudi Arabia
Change in closing price definition for Shenzhen Stock Exchange
Clarification in closing price definition for Greece
Change in closing price definition for Qatar
Change in closing price definition for Australia
Change in closing prices availability for Australia
Appendix VI: Withholding Tax Rates
Update for Faroe Islands

MSCI.COM | PAGE 115 OF 123 © 2018 MSCI Inc. All rights reserved. Please refer to the disclaimer at the end of this document.
MSCI INDEX CALCULATION METHODOLOGY | JANUARY 2018
May:
Appendix VII: Closing Prices Policy
Updated Exchange name from Dubai Stock Exchange to Dubai Financial Market
Updated Exchange name from Dubai International Financial Exchange to NASDAQ
Dubai
Updated Exchange name from Doha Securities Market to Qatar Exchange
Change in closing prices availability for NASDAQ Dubai
Change in closing price definition for Dubai Financial Market
Change in closing price definition for NASDAQ Dubai
Appendix XII: MSCI Indexes with IDCo Fair Value Pricing
Addition of Appendix XII: MSCI Indexes with IDCo Fair Value Pricing
July:
Appendix VI: Withholding Tax Rates
Update for Italy and Egypt
Addition of Burkina Faso, Ivory Coast, Senegal and Togo
August:
Section 2.3.6: Country Exceptions
Update for Russia
October:
Appendix VII: Closing Prices Policy
Correction of the Market Identifier Code (MIC) for Moscow Interbank Currency
Exchange (MICEX) and NASDAQ Global Market

MSCI.COM | PAGE 116 OF 123 © 2018 MSCI Inc. All rights reserved. Please refer to the disclaimer at the end of this document.
MSCI INDEX CALCULATION METHODOLOGY | JANUARY 2018
December:
Appendix VI: Withholding Tax Rates
Update for Serbia and Togo
2015
January:
Appendix VI: Withholding Tax Rates
Update for Spain and Tunisia
February:
Section 2.3.7.2.1 Country Exceptions
United Kingdom Cash Dividends
Appendix VI: Withholding Tax Rates
Update for United Kingdom
April:
Appendix VIII: Country composition of MSCI Regional Indexes
Update for Qatar
Update for United Arab Emirates
May:
Section 2.3.6 Country Exceptions
Change in dividend reinvestment treatment for Russian DRs

MSCI.COM | PAGE 117 OF 123 © 2018 MSCI Inc. All rights reserved. Please refer to the disclaimer at the end of this document.
MSCI INDEX CALCULATION METHODOLOGY | JANUARY 2018
June:
Appendix VII: Closing Prices Policy
Change in closing prices availability for NASDAQ Dubai
Change in closing prices availability for Dubai Financial Market
Appendix XII: MSCI Indexes with Fair Value Pricing
Change in Appendix name from Appendix XII: MSCI Indexes with IDCo Fair Value
Pricing to Appendix XII: MSCI Indexes with Fair Value Pricing
Addition of MSCI Indexes with ITG Fair Value Model
July:
Appendix VI: Withholding Tax Rates
Update for Pakistan
Update for Spain
2016
January:
Appendix VI: Withholding Tax Rates
Update for Spain, Belgium, Austria and Romania
Appendix VIII: Country composition of MSCI Regional Indexes
Update for Qatar
Update for Ukraine
Update for United Arab Emirates

MSCI.COM | PAGE 118 OF 123 © 2018 MSCI Inc. All rights reserved. Please refer to the disclaimer at the end of this document.
MSCI INDEX CALCULATION METHODOLOGY | JANUARY 2018
April:
Appendix VI: Withholding Tax Rates
Update of the note related to China withholding tax
July:
Appendix VII: Closing Prices Policy
Change in closing prices availability for Hong Kong Stock Exchange
2017
January:
Appendix VI: Withholding Tax Rates
Update for Belgium
Update for Greece
March:
Appendix VI: Withholding Tax Rates
Update for Oman
Update for South Africa
May:
Appendix VI: Withholding Tax Rates
Update for Kuwait
MSCI.COM | PAGE 119 OF 123 © 2018 MSCI Inc. All rights reserved. Please refer to the disclaimer at the end of this document.
MSCI INDEX CALCULATION METHODOLOGY | JANUARY 2018
June:
Appendix VI: Withholding Tax Rates
Update for India
Addition of Papua New Guinea
Update for Peru
Update of the note related to Pakistan withholding tax
Appendix VII: Closing Prices Policy
Change in closing prices availability time for Peru.
Section 1: MSCI Price Index Methodology
- Update in language in footnote for IIF
• Section 2: MSCI Daily Total Return (DTR) Index Methodology
- Update in language in footnote for IIF
July:
Appendix VI: Withholding Tax Rates
- Update for Papua New Guinea
- Update for Pakistan
August:
Appendix VII: Closing Prices Policy
Updated Exchange name from AMEX to NYSE American
Closing price used for NYSE and NYSE American (formerly known as AMEX) updated
to be Auction Close
Addition of Burkina Faso, Ivory Coast and Senegal
Section 2.3.7.2: Whithholding Tax
- Clarification on the treatment of cash distributions subject to different withholding
tax rates.

MSCI.COM | PAGE 120 OF 123 © 2018 MSCI Inc. All rights reserved. Please refer to the disclaimer at the end of this document.
MSCI INDEX CALCULATION METHODOLOGY | JANUARY 2018
September:
Introduction
- Update in language to better reflect this methodology book's description.
Appendix III: Exchange Rates
- Update in language related to treatments in special circumstances and if
WM/Reuters does not provide rates (Closing Spot Rates and Forward Rates).
Appendix VII: Closing Prices Policy
- Update in language in the process to be followed by MSCI in case of market outage
(Announcement to clients with related information).
Appendix XII: MSCI Indexes with IDCo Fair Value Pricing
- Deletion of Appendix XII: MSCI Indexes with IDCo Fair Value Pricing.
October:
Appendix VII: Closing Prices Policy
- Update in language in the header located in the gray box on top of the table related
to the prices used in MSCI End of Day Index Calculations to better reflect the
contents of such table.
- Update in language related to market closure and market outage to make clearer
the actions MSCI would take on those cases.
- Updated Exchange name from Moscow Interbank Currency Exchange (MICEX) to
Moscow Exchange (MOEX).
- Closing price used for Moscow Exchange (MOEX) updated to be Auction Close.
- Change in the Closing price available time (local) of Moscow Exchange (MOEX).

MSCI.COM | PAGE 121 OF 123 © 2018 MSCI Inc. All rights reserved. Please refer to the disclaimer at the end of this document.
MSCI INDEX CALCULATION METHODOLOGY | JANUARY 2018
2018
January:
Appendix VI: Withholding Tax Rates
Update for Colombia
Update for Taiwan

MSCI.COM | PAGE 122 OF 123 © 2018 MSCI Inc. All rights reserved. Please refer to the disclaimer at the end of this document.
MSCI INDEX CALCULATION METHODOLOGY | JANUARY 2018
AMERICAS
Americas 1 888 588 4567 *
Atlanta + 1 404 551 3212
Boston + 1 617 532 0920
Chicago + 1 312 675 0545
Monterrey + 52 81 1253 4020
New York + 1 212 804 3901
San Francisco + 1 415 836 8800
Sao Paulo + 55 11 3706 1360
Toronto + 1 416 628 1007
EUROPE, MIDDLE EAST & AFRICA
Cape Town + 27 21 673 0100
Frankfurt + 49 69 133 859 00
Geneva + 41 22 817 9777
London + 44 20 7618 2222
Milan + 39 02 5849 0415
Paris 0800 91 59 17 *
ASIA PACIFIC
China North 10800 852 1032 *
China South 10800 152 1032 *
Hong Kong + 852 2844 9333
Mumbai + 91 22 6784 9160
Seoul 00798 8521 3392 *
Singapore 800 852 3749 *
Sydney + 61 2 9033 9333
Taipei 008 0112 7513 *
Tokyo + 81 3 5290 1555
* = toll free
ABOUT MSCI
For more than 40 years, MSCI’s research-
based indexes and analytics have helped
the world’s leading investors build and
manage better portfolios. Clients rely on
our offerings for deeper insights into the
drivers of performance and risk in their
portfolios, broad asset class coverage and
innovative research.
Our line of products and services includes
indexes, analytical models, data, real estate
benchmarks and ESG research.
MSCI serves 98 of the top 100 largest
money managers, according to the most
recent P&I ranking.
For more information, visit us at
www.msci.com.
CONTACT US

MSCI INDEX CALCULATION METHODOLOGY | JANUARY 2018
MSCI.COM | PAGE 123 OF 123 © 2017 MSCI Inc. All rights reserved.
This document and all of the information contained in it, including without limitation all text, data, graphs, charts (collectively, the “Information”) is the property of MSCI Inc. or its subsidiaries (collectively, “MSCI”), or MSCI’s licensors, direct or indirect suppliers or any third party involved in making or compiling any Information (collectively, with MSCI, the “Information Providers”) and is provided for informational purposes only. The Information may not be modified, reverse-engineered, reproduced or redisseminated in whole or in part without prior written permission from MSCI.
The Information may not be used to create derivative works or to verify or correct other data or information. For example (but without limitation), the Information may not be used to create indexes, databases, risk models, analytics, software, or in connection with the issuing, offering, sponsoring, managing or marketing of any securities, portfolios, financial products or other investment vehicles utilizing or based on, linked to, tracking or otherwise derived from the Information or any other MSCI data, information, products or services.
The user of the Information assumes the entire risk of any use it may make or permit to be made of the Information. NONE OF THE INFORMATION PROVIDERS MAKES ANY EXPRESS OR IMPLIED WARRANTIES OR REPRESENTATIONS WITH RESPECT TO THE INFORMATION (OR THE RESULTS TO BE OBTAINED BY THE USE THEREOF), AND TO THE MAXIMUM EXTENT PERMITTED BY APPLICABLE LAW, EACH INFORMATION PROVIDER EXPRESSLY DISCLAIMS ALL IMPLIED WARRANTIES (INCLUDING, WITHOUT LIMITATION, ANY IMPLIED WARRANTIES OF ORIGINALITY, ACCURACY, TIMELINESS, NON-INFRINGEMENT, COMPLETENESS, MERCHANTABILITY AND FITNESS FOR A PARTICULAR PURPOSE) WITH RESPECT TO ANY OF THE INFORMATION.
Without limiting any of the foregoing and to the maximum extent permitted by applicable law, in no event shall any Information Provider have any liability regarding any of the Information for any direct, indirect, special, punitive, consequential (including lost profits) or any other damages even if notified of the possibility of such damages. The foregoing shall not exclude or limit any liability that may not by applicable law be excluded or limited, including without limitation (as applicable), any liability for death or personal injury to the extent that such injury results from the negligence or willful default of itself, its servants, agents or sub-contractors.
Information containing any historical information, data or analysis should not be taken as an indication or guarantee of any future performance, analysis, forecast or prediction. Past performance does not guarantee future results.
The Information should not be relied on and is not a substitute for the skill, judgment and experience of the user, its management, employees, advisors and/or clients when making investment and other business decisions. All Information is impersonal and not tailored to the needs of any person, entity or group of persons.
None of the Information constitutes an offer to sell (or a solicitation of an offer to buy), any security, financial product or other investment vehicle or any trading strategy.
It is not possible to invest directly in an index. Exposure to an asset class or trading strategy or other category represented by an index is only available through third party investable instruments (if any) based on that index. MSCI does not issue, sponsor, endorse, market, offer, review or otherwise express any opinion regarding any fund, ETF, derivative or other security, investment, financial product or trading strategy that is based on, linked to or seeks to provide an investment return related to the performance of any MSCI index (collectively, “Index Linked Investments”). MSCI makes no assurance that any Index Linked Investments will accurately track index performance or provide positive investment returns. MSCI Inc. is not an investment adviser or fiduciary and MSCI makes no representation regarding the advisability of investing in any Index Linked Investments.
Index returns do not represent the results of actual trading of investible assets/securities. MSCI maintains and calculates indexes, but does not manage actual assets. Index returns do not reflect payment of any sales charges or fees an investor may pay to purchase the securities underlying the index or Index Linked Investments. The imposition of these fees and charges would cause the performance of an Index Linked Investment to be different than the MSCI index performance.
The Information may contain back tested data. Back-tested performance is not actual performance, but is hypothetical. There are frequently material differences between back tested performance results and actual results subsequently achieved by any investment strategy.
Constituents of MSCI equity indexes are listed companies, which are included in or excluded from the indexes according to the application of the relevant index methodologies. Accordingly, constituents in MSCI equity indexes may include MSCI Inc., clients of MSCI or suppliers to MSCI. Inclusion of a security within an MSCI index is not a recommendation by MSCI to buy, sell, or hold such security, nor is it considered to be investment advice.
Data and information produced by various affiliates of MSCI Inc., including MSCI ESG Research LLC and Barra LLC, may be used in calculating certain MSCI indexes. More information can be found in the relevant index methodologies on www.msci.com.
MSCI receives compensation in connection with licensing its indexes to third parties. MSCI Inc.’s revenue includes fees based on assets in Index Linked Investments. Information can be found in MSCI Inc.’s company filings on the Investor Relations section of www.msci.com.
MSCI ESG Research LLC is a Registered Investment Adviser under the Investment Advisers Act of 1940 and a subsidiary of MSCI Inc. Except with respect to any applicable products or services from MSCI ESG Research, neither MSCI nor any of its products or services recommends, endorses, approves or otherwise expresses any opinion regarding any issuer, securities, financial products or instruments or trading strategies and MSCI’s products or services are not intended to constitute investment advice or a recommendation to make (or refrain from making) any kind of investment decision and may not be relied on as such. Issuers mentioned or included in any MSCI ESG Research materials may include MSCI Inc., clients of MSCI or suppliers to MSCI, and may also purchase research or other products or services from MSCI ESG Research. MSCI ESG Research materials, including materials utilized in any MSCI ESG Indexes or other products, have not been submitted to, nor received approval from, the United States Securities and Exchange Commission or any other regulatory body.
Any use of or access to products, services or information of MSCI requires a license from MSCI. MSCI, Barra, RiskMetrics, IPD, FEA, InvestorForce, and other MSCI brands and product names are the trademarks, service marks, or registered trademarks of MSCI or its subsidiaries in the United States and other jurisdictions. The Global Industry Classification Standard (GICS) was developed by and is the exclusive property of MSCI and Standard & Poor’s. “Global Industry Classification Standard (GICS)” is a service mark of MSCI and Standard & Poor’s.
NOTICE AND DISCLAIMER


