Download - MultiSpec Student v3 Web

Stop and Check• Whathappenswhenyousetallthreecolorstothesamevalue,suchas150?
• Whathappenswhenyoumakeallthreecolorsequalto255?• Trysettingtwoofthecolorsto255andoneto0.Inthiscolorsystem,forexample,redandgreencombinetomakeyellow.Whatothercombinationsdoyounotice?
2. Band Combinations
Landsats5and7collectsevenimagesatonce.*Eachimageshowsaspecificsectionoftheelectromagneticspectrum,calledaband.Landsats5and7havesevendifferentbands.Thetablebelowshowsthesevenbands.
1. Basics of RGB
BeforewestartopeningandworkingwithsatelliteimagesinMultiSpec,weneedtounderstandabitmoreabouthowsatellitesensorsrecordimages.Allofthecolorsinasatelliteimage,similartoimagesonatelevisionorcomputermonitor,aremadeupofacombinationofred,green,andblue,orRGBforshort.
Thesatellitesensorsthatcapturedtheimagesyouarestudyingrecordimagesingrayscale—eachpixelisassignedavalueofbrightnessonascalefrom0to255.Blackis0,andwhiteis255,andshadesofgrayareinbetween.Thesegrayscaleimagesareassignedthecolorred,green,orblue,whichdisplaythebrightnessofeachofthesecolors.Whenwecombinethethreeimages,wegetafalsecolorimage.Withallofthepossiblecombinationsofred,green,andbluevalues,thisprovidesforadisplaysystemcapableofprovidingoveramilliondifferentcolors.Trythiscolorslidertoseehowthisworks:http://www.calculatorcat.com/free_calculators/color_slider/rgb_hex_color_slider.phtml.
Student Guide
Tracking Change Over Time: Using MultiSpec to Interpret Satellite Imagery
U.S. Department of the InteriorU.S. Geological Survey
General Information Product 133
Color slider
*Landsat 7 also uses an eighth band called the panchromatic band. This band captures visible and infrared bands at 15-meter resolution and is often used to sharpen images from the other bands. We will not be dealing with the panchromatic band in this lesson.
Band Portion of Use Wavelength Spectrum (micrometers)1 blue-green Monitor sediment in water, map 0.45–0.52 coral reefs, and water depth; can also be used to distinguish forest types2 green Monitor vegetation health, identify 0.52–0.60 human-made structures3 red Help identify plant species; can help 0.63–0.69 highlight barren lands, urban areas, and street patterns4 near-infrared Monitor vegetation (leafy plants 0.76–0.90 reflect this band well)5 mid-infrared Measure vegetation moisture content 1.55–1.75 and soil moisture6 thermal Measure surface temperature, 10.4–12.5 infrared identify rock types; detect changes in ground temperature caused by moisture variation7 mid-infrared Monitor moisture content in soil and 2.08–2.35 vegetation; identify minerals
Threeofthebandsarecombinedtoformanimage,eachbandassignedred,green,orblueinthatorder.Differentbandcombinationsrevealdifferentdetailsaboutthesurface.InMultiSpec,youwillbeabletochangethebandcombinationstohelpidentifydifferentfeaturesinsatelliteimages.
3. Working Your Way around MultiSpec
1. LaunchMultiSpec2. OpentheRenoimage
a. IntheFilemenu,select“OpenImage.”b. IntheOpendialoguebox,locatethefilenameReno.tif
andclickOpen.c. The“SetDisplaySpecificationfor:”boxwillappear.
Thenameoftheimageyouopenedwillappearatthetopofthisbox.LeaveallofthedefaultsastheyareandclickOK.
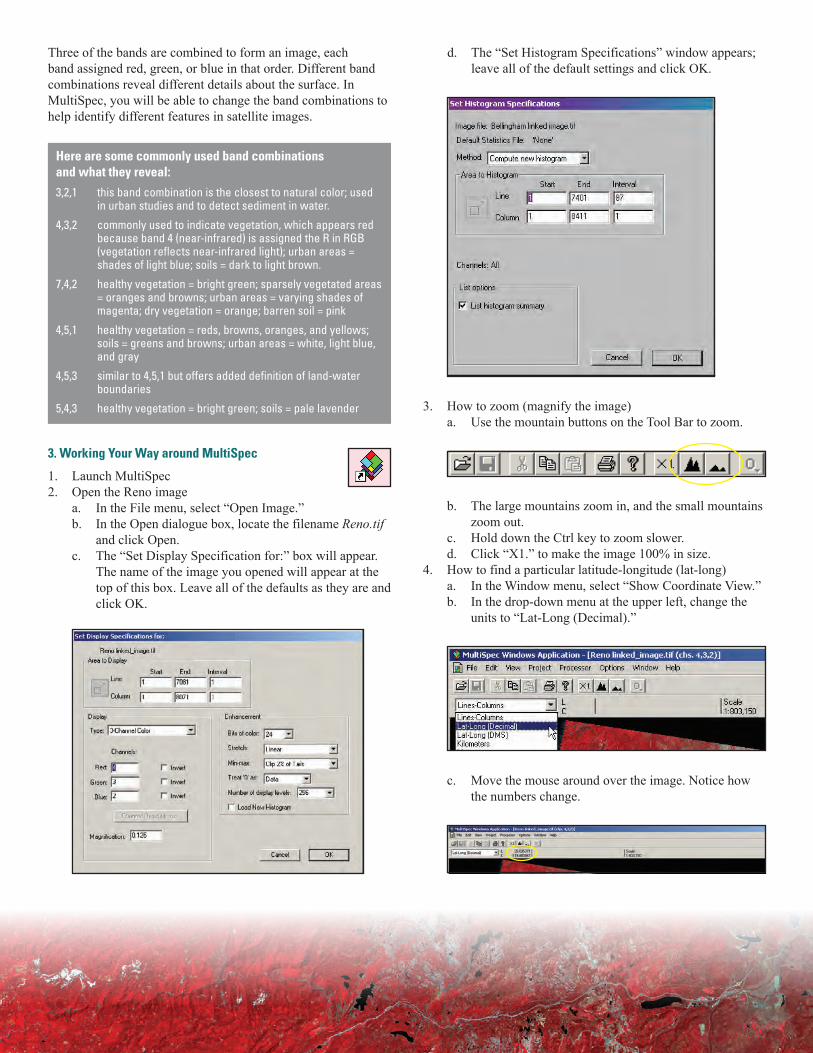
d. The“SetHistogramSpecifications”windowappears;leaveallofthedefaultsettingsandclickOK.
3. Howtozoom(magnifytheimage)a. UsethemountainbuttonsontheToolBartozoom.
b. Thelargemountainszoomin,andthesmallmountainszoomout.
c. HolddowntheCtrlkeytozoomslower.d. Click“X1.”tomaketheimage100%insize.
4. Howtofindaparticularlatitude-longitude(lat-long)a. IntheWindowmenu,select“ShowCoordinateView.”b. Inthedrop-downmenuattheupperleft,changethe
unitsto“Lat-Long(Decimal).”
c. Movethemousearoundovertheimage.Noticehowthenumberschange.
Here are some commonly used band combinations and what they reveal:3,2,1 this band combination is the closest to natural color; used
in urban studies and to detect sediment in water.
4,3,2 commonly used to indicate vegetation, which appears red because band 4 (near-infrared) is assigned the R in RGB (vegetation reflects near-infrared light); urban areas = shades of light blue; soils = dark to light brown.
7,4,2 healthy vegetation = bright green; sparsely vegetated areas = oranges and browns; urban areas = varying shades of magenta; dry vegetation = orange; barren soil = pink
4,5,1 healthy vegetation = reds, browns, oranges, and yellows; soils = greens and browns; urban areas = white, light blue, and gray
4,5,3 similar to 4,5,1 but offers added definition of land-water boundaries
5,4,3 healthy vegetation = bright green; soils = pale lavender

d. Keepmovingthemouseuntilyouareatthelatitude-longitude(lat-long)coordinatesyouwant.AforestfirenearRenoisatabout39.35°latitude,-120.00°longitude.Clickonceontheimagewhenyouareatthesecoordinates;youdonothavetobetooexact.
e. Nownoticethatthelat-longnumbersontherightstaylocked.
f. Nowyoucanzoominonthatlat-longandthatpointwillstayinthecenteruntilyouselectanotherpoint.
5. Howtochangebandcombinations.a. IntheProcessormenu,select“DisplayImage.”b. Inthe“SetDisplaySpecificationsfor:”dialoguebox,
changethenumbersunder“Channels.”
i. Youwillonlybeabletoenternumbers1–7becausethereare7bands.
c. ClickOK.6. Howtocrop.
a. Clickandholdwhiledraggingthemousetochoosearectangularareatocrop.Watchthenumberunder“Numberpixels”asyoudrag;thisisthenumberofpixelsthatwillbeinthecroppedimage.Anarealessthan3,000,000pixelsshouldfitonmostscreens.
b. IntheProcessormenu,choose“Reformat”and“ChangeImageFileFormat.”
c. Inthe“SetImageFileFormatChangeSpecifications”window,leaveallofthedefaultsettings.
d. ClickOK.e. Choosewheretosavethenewcroppedimageandgive
theimageafilename,suchas“croppedimage1.tif”(makesurethefilenamehas“.tif”attheend).ClickSave.
f. Opentheimageyoujustcropped(seeStep2).i. Inthe“SetDisplaySpecificationsfor:”window,
youcanchoosethebandcombinationyouwanttoview,orjustclickOK.
ii. The“SetHistogramSpecifications”windowwillappearnext;leaveallofthedefaultsettingsandclickOK.
g. Nowitshouldbeeasiertoseemoredetailinyourimage.

7. Howtocalculatearea.a. IntheWindowmenu,select“ShowCoordinateView.”b. Clickandholdwhiledraggingthemousetochoosea
rectangulararea.c. Nextto“Numberpixels”isadrop-downmenu.Use
thistoselect“Sq.kilometers”oranotherunit.
d. MultiSpecnowdisplayshowmanysquarekilometers(orotherunit)makeuptheareayouselected.
8. Howtosave.a. Inthefilemenu,select“SaveImagetoGeoTIFF
As…”
b. The“SaveActiveImageWindowAs:”windowappears.
c. Thefilenamehasthebandcombinationadded.ClickSave.
4. Experiment with the Reno image
UsetheMultiSpecinstructionsandthesuggestedbandcombinationstoanswerthefollowingquestionsabouttheforestfirenearReno,NV.
• Lookagainatthetablewiththecommonlyusedbandcombinations.Whichbandcombinationshowsmostclearlythesizeoftheareaburnedbythefire?
• Whichcommonlyusedbandcombinationshowsmostclearlytheextentofsmoke?
• Ofthefollowingbandcombinations,whichoneallowsyoutofilterthroughthesmokeandobservelandsurfacefeatures?7,5,3;5,4,3;7,4,1;6,5,5;4,2,1
• Ofthefollowingbandcombinations,whichoneshowswherethefireswereburningatthetimeoftheimage?4,2,1;6,5,5;7,5,3;6,3,6;5,3,2
• Ofthefollowingbandcombinations,whichonesbestshowtheurbanareainthisimage?3,2,1;5,4,1;7,5,3
• Whichcommonlyusedbandcombinationbestshowsagricultureandvegetation?
• ImagineyouarearemotesensingspecialistlivingandworkinginReno,andyouarestudyingsatelliteimagesofthisfire.Becausetheimagesshowalotofsmoke,youwanttosendoutwarningstoresidentsaboutairquality.Whatdirectionisthesmokeblowingatthetimeofthisimage?Howcanyoutell?Which,ifany,residentialareasneedtobewarned?
• Challenge:Estimatethearea,insquarekilometers,thathasbeenburnedbytheforestfireinthisimage.(SeeStep7intheprevioussection.)

![Qcl 14-v3[poor placement of student][banasthali university][reena arora]](https://cdn.vdocument.in/doc/165x107/55aaa0241a28abbd708b4735/qcl-14-v3poor-placement-of-studentbanasthali-universityreena-arora.jpg)


