
1
Nagaland’s Demographic Somersault: An Empirical Investigation
Ankush Agrawal
Vikas Kumar
Abstract
Nagaland’s population decreased during 2001–11 after growing at abnormally high rates
during the past few decades. This is the first time since independence that a state in India
has witnessed an absolute decline in population. In this context, the paper examines the
census population estimates for internal consistency. It also tries to validate the census
estimates using information on birth and death rates from other demographic surveys and
information on gross school enrolment (6–14 years population) and the electorate (adult
population). The paper also checks if illegal/unaccounted international immigration and
politically-motivated manipulation could explain the abnormal changes in Nagaland’s
population. The paper shows that the Census substantially overestimated Nagaland’s
population during 1981–2001 and, by implication, questions the sanctity of the Census.
Keywords: Census, India, migration, Naga, over-count, political economy of statistics
JEL Codes: J11, J13, 015, R23

2
ACKNOWLEDGEMENTS
We are grateful to Bina Agarwal, S. Chandrasekhar, R. N. Chhipa, Vikram Dayal, Kunal
Ghosh, Chandan Gowda, Sanjoy Hazarika, Sabyasachi Kar, Bhaskar Mishra, Arup Mitra, Theja
Therieh, B. G. Verghese, and Lungsang Zeliang for information, criticism, and discussions.
This paper has also benefitted from presentations at the Centre for Development of North
Eastern Region (Indian Institute of Management, Shillong), Azim Premji University, and the
Institute of Economic Growth. The IDRC Seed Grant at the Institute of Economic Growth and
Research Grant from Azim Premji University facilitated the authors’ field visits to Nagaland.
The authors alone are responsible for the views expressed in this working paper.
Ankush Agrawal is Assistant Professor, Institute of Economic Growth, Delhi.
Email: [email protected]
Vikas Kumar is Assistant Professor, Azim Premji University, Bangalore.
Email: [email protected]
3
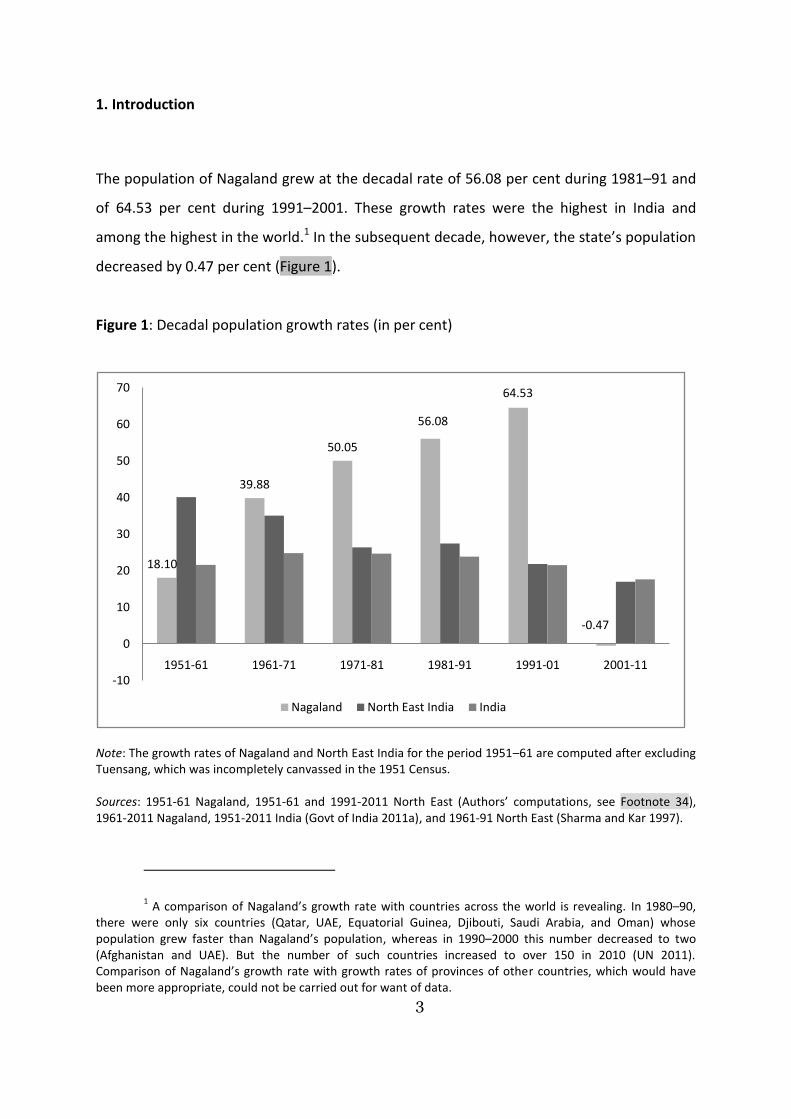
1. Introduction
The population of Nagaland grew at the decadal rate of 56.08 per cent during 1981–91 and
of 64.53 per cent during 1991–2001. These growth rates were the highest in India and
among the highest in the world.1 In the subsequent decade, however, the state’s population
decreased by 0.47 per cent (Figure 1).
Figure 1: Decadal population growth rates (in per cent)
Note: The growth rates of Nagaland and North East India for the period 1951–61 are computed after excluding Tuensang, which was incompletely canvassed in the 1951 Census. Sources: 1951-61 Nagaland, 1951-61 and 1991-2011 North East (Authors’ computations, see Footnote 34), 1961-2011 Nagaland, 1951-2011 India (Govt of India 2011a), and 1961-91 North East (Sharma and Kar 1997).
1 A comparison of Nagaland’s growth rate with countries across the world is revealing. In 1980–90,
there were only six countries (Qatar, UAE, Equatorial Guinea, Djibouti, Saudi Arabia, and Oman) whose population grew faster than Nagaland’s population, whereas in 1990–2000 this number decreased to two (Afghanistan and UAE). But the number of such countries increased to over 150 in 2010 (UN 2011). Comparison of Nagaland’s growth rate with growth rates of provinces of other countries, which would have been more appropriate, could not be carried out for want of data.
18.10
39.88
50.05
56.08
64.53
-0.47
-10
0
10
20
30
40
50
60
70
1951-61 1961-71 1971-81 1981-91 1991-01 2001-11
Nagaland North East India India
4
This is the first time that a state in independent India2 has witnessed an absolute
decline in population in the absence of war, famine, natural calamities, epidemical diseases,
political disturbance, or any significant changes in the socioeconomic correlates of fertility
(Table 1).3
Observers drew attention to Nagaland’s high growth rate and its developmental
consequences as early as the 1970s (Means 1971: 1028; von-Furer Haimendorf 1977: 2–4),
but the State government took note only recently when it rejected the 2001 Census (Govt of
India 2011b: viii). And, long after the State government rejected the 2001 Census of
Nagaland (Assam Tribune 2009),4 many state and non-state organisations continue to use
the flawed population statistics. For instance, the Economic Survey of 2010–11 (Govt of
India 2011e: A125) used the wrong population series for Nagaland, which resulted in
erroneous estimates of a few development indicators. In fact, even the State government
uses the rejected population estimates (see for example, Govt of Nagaland 2012: 30).
2 The population of Punjab decreased between 1941 and 1951 (Govt of India 2011a). The 1941 Census
over-enumerated the population of Punjab due to competition between communities. The error was corrected in the 1951 Census (Natrajan 1972: vii; Govt of India 1954: 5). Other reasons for the decline of Punjab’s population include population transfer and unprecedented bloodshed following the partition of British India. Also, there was a decrease in the population of two union territories, the Andaman and Nicobar Islands (during 1941–51) and Daman and Diu (during 1951–61) (Govt of India 2011a), most likely due to out-migration.
3 Key socioeconomic correlates of fertility include income, literacy, urbanisation, female work
participation, and access to public health services (Anker 1978; Barro and Sala-i-Martin 2004: 407–8; Bongaarts and Watkins 1996; Dreze and Murthi 2001). In the case of Nagaland, fertility has been shown to be inversely related to female literacy and the standard of living and directly related to child mortality (Dey and Goswami 2009; Narendra Singh 2005). Table 1 does not indicate any change in the above correlates that could support the abrupt decline in Nagaland’s population through a decline in fertility. To the contrary, Nagaland’s Human Development Index rank improved steadily over the past four decades. Nagaland ranked second among Indian states during 2002–06 (Suryanarayana and Agrawal 2011). However, the possibility of increase in fertility despite a contrary trend of the socioeconomic and developmental indicators cannot be ruled out entirely. For instance, in the late 1970s and early 1980s, an increase in fertility was recorded in Malaysia (Hirschman 1986).
4 On 18 August 2005, the State Legislative Assembly passed a resolution that demanded a fresh
census in Nagaland. On 22 August 2005, the Chief Secretary of Nagaland informed the Registrar General of India of ‘the decision of Govt of Nagaland rejecting 2001 Census Report’ (Chakhesang Public Organisation & Ors. vs. Union of India & Ors., W.P. No. 67 of 2006). In a consultative meeting held on 30 September 2009, the State Government canvassed the support of political parties, a wide range of civil society organisations, and organisations of religious bodies, students, tribal bodies, and village elders to make a fresh start with regard to the Census of Nagaland. All the parties involved in that consultative meeting agreed that ‘previous censuses conducted in Nagaland were defective and inaccurate’ and that the next census ‘should be conducted properly’ (Govt of Nagaland 2009b). Another fact that bears noting here is that while the Census department published Provisional Population Tables for Nagaland after the 2001 Census, it did not publish the General Population Tables for Nagaland. But, surprisingly, long after the State Assembly’s 2005 resolution, the central government continued to insist that the 2001 Census was correct (Chakhesang Public Organisation & Ors. vs. Union of India & Ors., W.P. No. 67 of 2006).

5
Similarly, others uncritically refer to the Census of Nagaland as a benchmark (see, for
instance, Lokniti 2008: 3; Nachane 2011: Table A12).
Table 1: Socioeconomic correlates of fertility
Growth rate/ socio-
economic correlate
Nagaland India
1981 1991 2001 2011 1981 1991 2001 2011
Population growth rate 50.05 56.08 64.53 -0.47 24.66 23.86 21.54 17.64
Income per capita 10560 14103 16582 17898 8793 11579 16684 24304
Human Development
Index
0.328
(20/32)
0.468
(11/32) NA
0.609
(2/27) 0.302 0.381 NA NA
Female literacy 40.39 54.75 61.46 76.49 29.76 39.29 53.67 65.46
Literacy (All) 50.28 61.65 66.59 80.11 43.57 52.21 64.83 74.04
Female work
participation rate 33.2 38 38.1 NA 19.7 22.3 25.7 NA
Infant Mortality Rate NA 42 38 NA NA 68 57 NA
Urbanisation 15.52 17.21 17.23 28.97 23.31 25.71 26.33 31.16
Notes: 1. ‘Population growth rate’ for India includes the estimated populations of Assam for 1981 and Jammu and
Kashmir for 1991, where the Census could not be conducted. 2. ‘Income per capita’ is measured at constant 1999–2000 prices. The values for 1981, 1991, and 2001 are three-
year averages (central) for the financial years; the value for 2011 corresponds to the period 2007–08. 3. The Human Development Index for 2011 pertains to the 2002–06 period. It is not directly comparable with the
Index for 1981 or 1991 because of differences in data sources and methodology. However, the ranks for 2011 are likely to be better indicators of human development because of methodological improvements (for instance, the education dimension in the 2011 Index comprises of mean years of schooling and expected years of schooling, whereas for earlier years it was based on the gross enrolment ratio). The numerals in parentheses for Nagaland indicate the state’s rank (out of 32 states and union territories or 27 states).
4. ‘Female literacy’ corresponds to those aged ‘seven years and above’; the figures for India exclude Assam in 1981 and Jammu and Kashmir in 1991.
5. ‘Female Work Participation Rate’ for India excludes Assam, Jammu and Kashmir, and Paomata, Mao Maram, and Purul sub-divisions of Senapati district of Manipur in all the years.
6. ‘Infant Mortality Rate’ for 1991 corresponds to the 1996–98 period and for 2001 to the 2003–05 period. 7. ‘NA’ indicates that comparable data is not available.
Sources:
1. Population growth rate and female literacy: Govt of India (2011a, b) 2. Income per capita: Reserve Bank of India (2005, 2011) and Govt of India (2011c) 3. Human Development Index: Govt of India (2002) and Suryanarayana and Agrawal (2011) 4. Female work participation rate: Govt of India (1999a, 2008a) 5. Infant Mortality Rate: IIPS and MI (2007, 2009) 6. Urbanisation: Govt of India (1985a, 1992, 2011a, 2011b).
6
Anomalies in the head count of sub-groups of population in censuses are, however,
not unheard of in India. For instance, the proportion of Punjabi (Hindi) speakers in the state
of Punjab registered a substantial increase (decrease) between 1971 and 1991 because
those who incorrectly returned their mother tongue as Hindi in earlier censuses reverted to
Punjabi during the 1991 Census (Gill 2007). The error can be primarily attributed to the
ethno-political struggle for power in Punjab. Similarly, the 1941 Census conducted before
the religious partition of British India over-enumerated the population in Punjab and Bengal.
These two provinces suffered most due to ethnic competition, and were also the only
provinces to be directly affected by partition in 1947. Their growth rates decreased sharply
in the 1951 Census (Natrajan 1972: vii).5 Horowitz (2000) discusses related cases from
Nigeria, Kenya, Pakistan, Mauritania, Iraq, Lebanon, Belgium, Trinidad, Guyana, and the
Indian provinces of Punjab and Assam. Others study these cases in depth. For instance,
Ahonsi (1988: 555) suggests that the 1952–53 Census of Nigeria undercounted the actual
population by 18 per cent as ‘[m]any people erroneously associated the census with
taxation; [M]oslems in the Islamic North opposed the counting of women in purdah; and
difficult terrain alongside inadequate transportation led to the omission of many villages’.
However, the Censuses of 1963 and 1973 in Nigeria were believed to be over-counts
because of ethno-regional competition. Slack and Doyon (2001) discuss the demographic
aspects of the Bosnian conflict, whereas Kaufmann (2011) and Anderson et al. (nd) examine
the interaction between ethnic conflict and demographic change in Northern Ireland.6
In another case of misreporting, the population of the Halba tribe in the state of
Maharashtra increased from 7,205 to 2,42,819 between 1971 and 1981 owing to
misreporting of the members of the Halba Koshti caste as that of the Halba tribe (Kulkarni
1991). The error in Maharashtra can be traced to the political economy of state support for
certain communities, which tempts others to misreport their ethnic identity. But correct
enumeration of Scheduled Tribes has long been a problem for Indian censuses because of
the ambiguity in the definition of tribes (Nongkynrih 2010) and, in a few cases, the
5 See Agrawal and Kumar (2012d) for a detailed discussion of these cases.
6 For a formal model of the political economy of fertility, see Janus (forthcoming).
7
inaccessibility of their habitats (Govt of India nd3).7 Similar problems have been noticed in
censuses in other parts of the world as well. For instance, enumeration of marginalised
communities has long been a problem in the US (Siegel 1973), where the problem of under-
enumeration sparked political and legal controversies after the 1990 Census on the
desirability of the use of post-enumeration surveys to correct censuses (Breiman 1994;
Freedman and Wachter 1994).
In most of the above cases, either censuses under-enumerated the population or
there was a content error (information was misreported). Content errors—as in the cases of
Punjab and Maharashtra—affect the composition of population without necessarily
affecting the overall head count. However, the trend of population change in Nagaland
stands apart because of the sheer magnitude and the persistence of anomalies across, at
least, three censuses (1981, 1991, and 2001). Despite the developmental challenges posed
by Nagaland’s demographic somersault—decades of very high population growth (1971-
2001) followed by a sudden contraction (2001-11)—the anomalies in the Census have not
received the attention of social scientists. It evoked a lot of interest in the North Eastern
media in the run-up to the 2011 Census, though (for example, Nagaland Post 2009).
Three possible explanations have emerged from debates in popular media and
quasi–social-scientific discussions. First, some argue that net out-migration could account
for the decline in population between 2001 and 2011 (Chaurasia 2011; Jeermison 2011; also
Kundu and Kundu 2011). Others argue that net in-migration was responsible for the high
population growth rate between 1991 and 2001 (Amarjeet Singh 2009; Rio 2010). Second,
the prevalence of HIV/AIDS and drug addiction has been invoked to explain the population
decline between 2001 and 2011 (Jeermison 2011). But Agrawal and Kumar (2012b: 8) have
argued that deaths due to these factors are far fewer than the drop in Nagaland’s
population. Third, Nagaland Chief Minister Neiphiu Rio cited the struggle among tribes for
political power and development funds as the reason for the high population growth
between the 1991 and 2001 Censuses (Hazarika 2005).
But, to our knowledge, neither these nor other plausible explanations have been
systematically, empirically investigated yet (for exceptions see Agrawal and Kumar 2012a, b,
7 See Agrawal and Kumar (2012d) for detailed discussion of these and other cases.
8
c, and d). This paper examines the plausibility of Nagaland’s demographic somersault during
the 1971–2011 period. While this paper is primarily related to demography, it also throws
light on the political economy of conflicts (Horowitz 2000) and on the political economy of
statistics (Pitre 2007; Wade 1985, 2012).
The rest of the discussion is organised as follows. The next section draws attention to
the discrepancies between the actual and projected populations of Nagaland over the past
four decades. It also throws light on other sources that question the validity of the Census of
Nagaland. In Section 3, we examine internal consistency of the Census. Section 4 externally
validates the Census using information from the Sample Registration System (SRS) and
National Family Health Surveys (NFHS) and also compares these with information on school
enrolment and the size of the electorate. Since both internal and external validations
indicate that the pre-2011 Censuses overestimated the population of Nagaland, in Section 5
we discuss the possibility of incomplete coverage and related mistakes in earlier censuses.
The next section examines if other factors such as the indigenisation of illegal/unaccounted
international immigrants and political-economic competition among ethnic groups can
explain the changes in Nagaland’s population. The final section offers concluding remarks.
2. Growing Concerns about the Census of Nagaland
During the past three decades, Nagaland’s population repeatedly defied projections (Table
2). To begin with, the Expert Committee of 1974 underestimated the 1991 population by
about 20 per cent. The underestimation indicates that the dynamics of population growth
between 1981 and 1991 was inconsistent with the fertility and mortality conditions in the
1960s and 1970s that formed the basis of the Expert Committee’s projections. Again, the
Technical Group of 1988, which based its projections on the socioeconomic and
demographic conditions in the 1980s and used the 1991 Census as the baseline,
underestimated the 2001 population by 14 per cent.
Underestimation for 2001 despite an inflated baseline (1991 Census) means that the
population growth between 1991 and 2001 was very high. Also, note that the discrepancy
persists even if adjusted for the coverage error detected in the post-enumeration surveys

9
(PES). While the PES excluded Nagaland in 1981 and 1991, in 2001 the state was included
along with other North Eastern states en bloc. The 2001 PES revealed a net omission rate of
7.6 per 1000 persons in the North Eastern region compared to 23.3 for the country as a
whole (Govt of India 2006b: 9).8 If we assume that the 2001 PES for the North East is
representative for individual states of the region such as Nagaland, then the forecast error
in 2001 after adjusting for the PES omission rate is (-) 14.17 per cent compared to the
unadjusted figure of (-) 13.52 per cent in Table 2.
Other sources also cast doubt on the veracity of the 2001 Census of Nagaland. For
instance, leading politicians of the region suggested figures for the population of Nagaland
that differ substantially from the 2001 Census estimates: Nagaland Chief Minister Neiphiu
Rio estimated the state’s population in 2001 at only 1.4 million (Hazarika 2005) and the
erstwhile Manipur Chief Minister Radhabinod Koijam at 1.6 million (Koijam 2001). More
importantly, a comparison of the 2001 Censuses of Assam and Nagaland with regard to 62
disputed villages along the Assam-Nagaland border can be used to validate the Census of
Nagaland, albeit for a small area. According to the Registrar General of India, in 2001, ‘*the+
population [of the disputed villages] enumerated by Assam is consistently lower than that
enumerated by Nagaland’ (Govt of India 2005: 24). While this indicates overestimation of
the head count in the Census of Nagaland, we cannot entirely rule out the possibility that
the villagers did not cooperate with the Census officials from Assam, either voluntarily or
under threat from supporters of ‘Greater’ Nagaland that includes parts of Assam. A similar
problem was reported from the Naga-dominated areas of Manipur, where villagers refused
to cooperate with enumerators during the 2001 Census (Laithangbam 2004).9
8 PES is more likely than not to reveal undercount ‘as the count has necessarily to be taken over an
extended period; and the people move about during the period, one cannot be absolutely sure that the same person was not counted in two different places by two different enumerators, even though very careful precautions had been taken in advance to guard against this contingency. Over-enumeration is, therefore, possible though far less likely than under-enumeration’ (Govt of India 1953a: 1).
9 Here it bears noting that studies based on the Census data found a declining trend in crude birth
rates (Govt of India 1997c; Guilmoto and Irudaya Rajan 2002). This is in agreement with the improvement in human development indicators (Table 1) but contrary to the Census, which records progressively increasing rate of growth of Nagaland’s population until 2001 (Figure 1) despite limited in-migration(Section 3).

10
Table 2: Actual and projected populations of Nagaland
Year Source Population (in '000)
Error (in per cent)* Projected Actual
1981 Expert Committee (1974) 714.5 774.9 -7.80
1991 Expert Committee (1974) 957.9 1209.6 -20.80
2001 Technical Group (1988) 1721 1990.0 -13.52
2011 Technical Group (1988) 2185 1980.6 10.32
2011 Technical Group (2001) 2249 1980.6 13.55
2011 PFI-PRB (2006) 2426-2439** 1980.6 22.49-23.14**
Notes:
* ‘Error (in per cent)’ is the difference between projected and actual populations normalized by actual
population. A negative (positive) error is indicative of under (over) projection.
** PFI–PRB (2006) provides two projections, corresponding to low and high fertility scenarios.
Sources:
1. Expert Committee (1974): Govt of India (1978a:158–59)
2. Technical Group (1988): Govt of India (1996: 64)
3. Technical Group (2001): Govt of India (2006a: 35)
4. PFI–PRB (2006): Population Foundation of India–Population Reference Bureau (2006: 7, 11).
While the forecasts for 1991 and 2001 happened to be underestimates vis-à-vis the
corresponding censuses, the forecasts for 2011 were overestimates (Table 2). The Technical
Groups on Population Projections constituted in 1988 and 2001 overestimated the 2011
population of Nagaland by 10 per cent and 14 per cent, respectively. Still later, in 2006, the
Population Reference Bureau and Population Foundation of India overestimated the 2011
population by 23 per cent. But a sample survey conducted in six districts of Nagaland in
2009 found fewer people in almost all parts of Nagaland than the 2001 Census (Nagaland
Post 2009) and added to growing doubts.
In short, over the past four decades, experts consistently failed to make reasonable
forecasts for Nagaland’s population. But, interestingly, this did not force demographers and
policy-makers to revisit their presumptions regarding the demographic dynamics of
Nagaland.
3. Internal Validation
11
In light of the discrepancies between the actual and projected populations of Nagaland over
the past three decades, it is imperative to assess the reliability of the population estimates
of the Census of Nagaland. This section examines whether births, deaths, and lawful
migration can explain the abnormal changes in Nagaland’s population. Note that the State
of Nagaland came into existence in 1963, and that the pre- and post-1963 decennial
censuses cannot be compared directly because of the sustained increase until 1963 of both
the reach of census operations (Govt of India 2011b, also see Section 5.2) as well as the area
of the Naga Hills (the precursor to the State of Nagaland) (Govt of India 1975a: 4). Even
otherwise the population figures for areas covered fully during the pre-1961 period were
based on estimates rather than direct enumeration (Govt of India 2011b: xii). So, the
analysis is restricted to the 1971–2011 period.
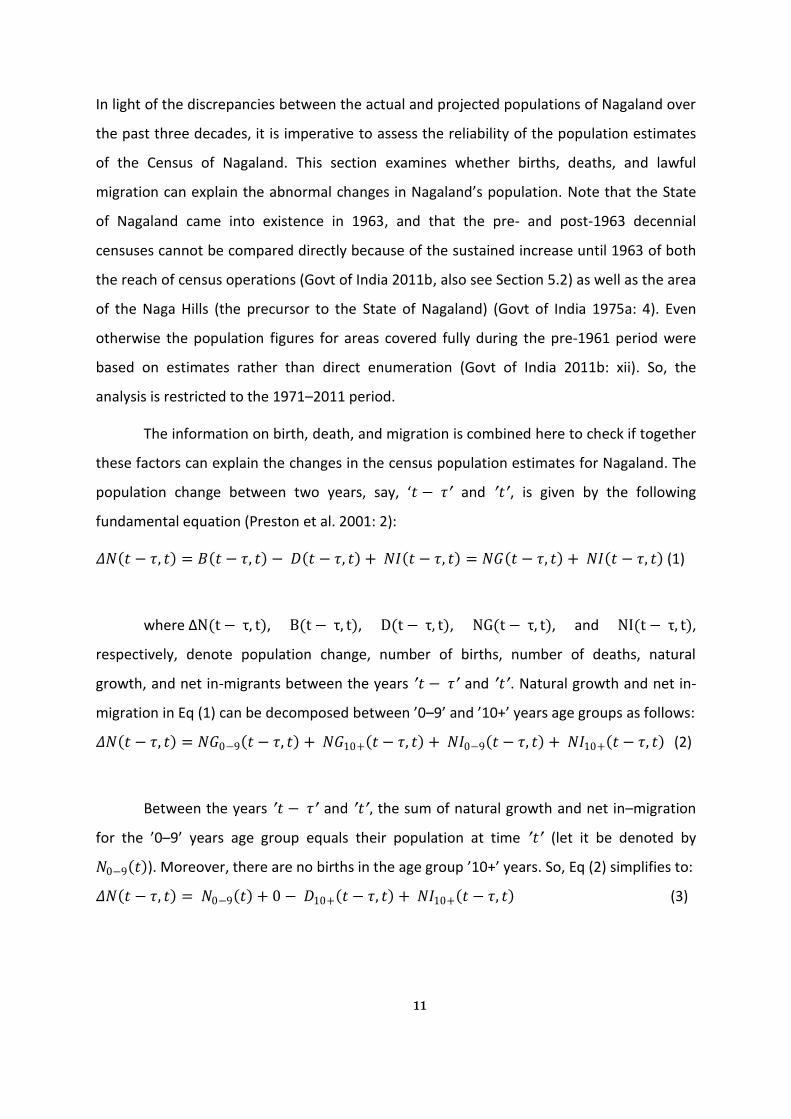
The information on birth, death, and migration is combined here to check if together
these factors can explain the changes in the census population estimates for Nagaland. The
population change between two years, say, ‘𝑡 − 𝜏′ and ′𝑡′, is given by the following
fundamental equation (Preston et al. 2001: 2):
𝛥𝑁 𝑡 − 𝜏, 𝑡 = 𝐵 𝑡 − 𝜏, 𝑡 − 𝐷 𝑡 − 𝜏, 𝑡 + 𝑁𝐼 𝑡 − 𝜏, 𝑡 = 𝑁𝐺 𝑡 − 𝜏, 𝑡 + 𝑁𝐼 𝑡 − 𝜏, 𝑡 (1)
where ΔN(t − τ, t), B(t − τ, t), D(t − τ, t), NG(t − τ, t), and NI(t − τ, t),
respectively, denote population change, number of births, number of deaths, natural
growth, and net in-migrants between the years ′𝑡 − 𝜏′ and ′𝑡′. Natural growth and net in-
migration in Eq (1) can be decomposed between ’0–9’ and ’10+’ years age groups as follows:
𝛥𝑁 𝑡 − 𝜏, 𝑡 = 𝑁𝐺0−9 𝑡 − 𝜏, 𝑡 + 𝑁𝐺10+ 𝑡 − 𝜏, 𝑡 + 𝑁𝐼0−9 𝑡 − 𝜏, 𝑡 + 𝑁𝐼10+ 𝑡 − 𝜏, 𝑡 (2)
Between the years ′𝑡 − 𝜏′ and ′𝑡′, the sum of natural growth and net in–migration
for the ’0–9’ years age group equals their population at time ′𝑡′ (let it be denoted by
𝑁0−9 𝑡 ). Moreover, there are no births in the age group ’10+’ years. So, Eq (2) simplifies to:
𝛥𝑁 𝑡 − 𝜏, 𝑡 = 𝑁0−9 𝑡 + 0 − 𝐷10+ 𝑡 − 𝜏, 𝑡 + 𝑁𝐼10+ 𝑡 − 𝜏, 𝑡 (3)
12
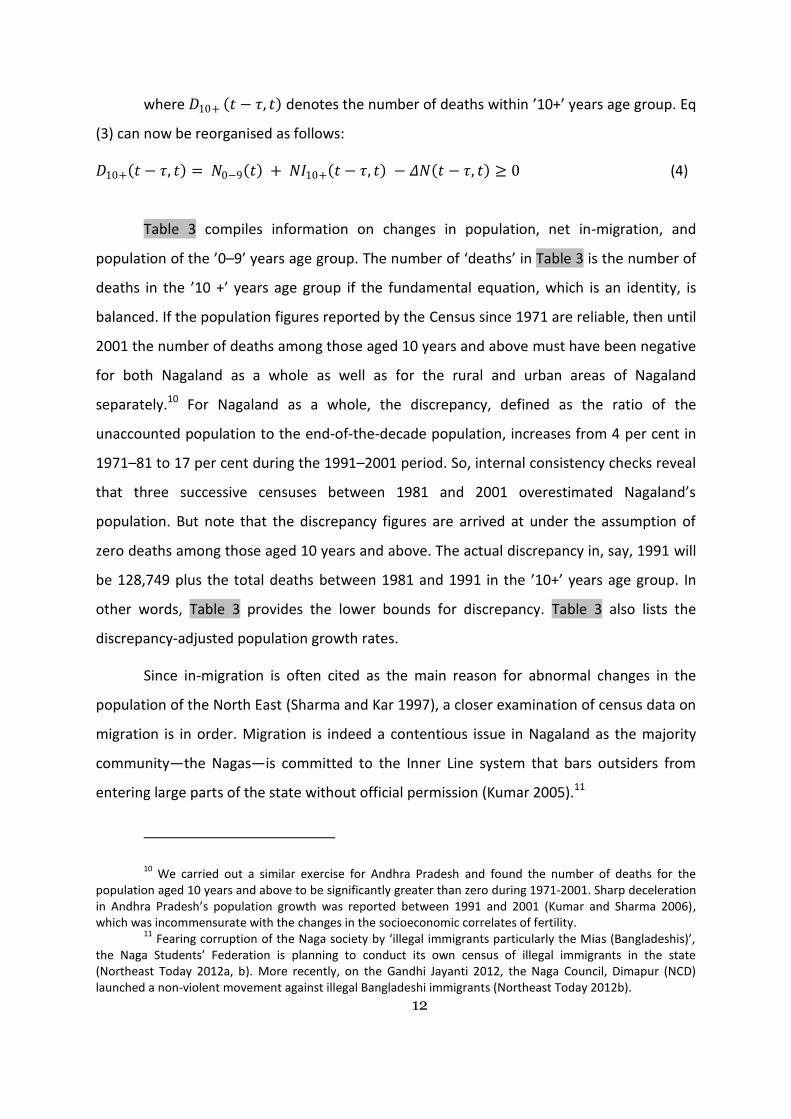
where 𝐷10+ 𝑡 − 𝜏, 𝑡 denotes the number of deaths within ’10+’ years age group. Eq
(3) can now be reorganised as follows:
𝐷10+ 𝑡 − 𝜏, 𝑡 = 𝑁0−9 𝑡 + 𝑁𝐼10+ 𝑡 − 𝜏, 𝑡 − 𝛥𝑁 𝑡 − 𝜏, 𝑡 ≥ 0 (4)
Table 3 compiles information on changes in population, net in-migration, and
population of the ’0–9’ years age group. The number of ‘deaths’ in Table 3 is the number of
deaths in the ’10 +’ years age group if the fundamental equation, which is an identity, is
balanced. If the population figures reported by the Census since 1971 are reliable, then until
2001 the number of deaths among those aged 10 years and above must have been negative
for both Nagaland as a whole as well as for the rural and urban areas of Nagaland
separately.10 For Nagaland as a whole, the discrepancy, defined as the ratio of the
unaccounted population to the end-of-the-decade population, increases from 4 per cent in
1971–81 to 17 per cent during the 1991–2001 period. So, internal consistency checks reveal
that three successive censuses between 1981 and 2001 overestimated Nagaland’s
population. But note that the discrepancy figures are arrived at under the assumption of
zero deaths among those aged 10 years and above. The actual discrepancy in, say, 1991 will
be 128,749 plus the total deaths between 1981 and 1991 in the ’10+’ years age group. In
other words, Table 3 provides the lower bounds for discrepancy. Table 3 also lists the
discrepancy-adjusted population growth rates.
Since in-migration is often cited as the main reason for abnormal changes in the
population of the North East (Sharma and Kar 1997), a closer examination of census data on
migration is in order. Migration is indeed a contentious issue in Nagaland as the majority
community—the Nagas—is committed to the Inner Line system that bars outsiders from
entering large parts of the state without official permission (Kumar 2005).11
10 We carried out a similar exercise for Andhra Pradesh and found the number of deaths for the
population aged 10 years and above to be significantly greater than zero during 1971-2001. Sharp deceleration in Andhra Pradesh’s population growth was reported between 1991 and 2001 (Kumar and Sharma 2006), which was incommensurate with the changes in the socioeconomic correlates of fertility.
11 Fearing corruption of the Naga society by ‘illegal immigrants particularly the Mias (Bangladeshis)’,
the Naga Students’ Federation is planning to conduct its own census of illegal immigrants in the state (Northeast Today 2012a, b). More recently, on the Gandhi Jayanti 2012, the Naga Council, Dimapur (NCD) launched a non-violent movement against illegal Bangladeshi immigrants (Northeast Today 2012b).

13
Table 3: Population changes in Nagaland
Population/Change Total Rural Urban
1971–81 1981–91 1991–01 1971–81 1981–91 1991–01 1971–81 1981–91 1991–01
The end of decade population 774930 1209546 1990036 654696 1001323 1647249 120234 208223 342787
Total population change, all ages 258481 434616 780490 189641 346627 645926 68840 87989 134564
Net in-migrants, all ages 38227 13797 -16511 24023 5657 -22291 14461 8355 7542
Net in-migrants, 0–9 years 0 3092 -6738 0 1532 -4930 0 1560 -1808
Net in-migrants, aged 10
years and above
38227 10705 -9773 24023 4125 -17361 14461 6795 9350
0–9 years population (end of the
decade)
189739 295162 445190 158436 243268 371715 31303 51894 73475
Deaths (among those aged more
than 10 years)
-30515 -128749 -345073 -7182 -99234 -291572 -23076 -29300 -51739
Discrepancy (%) 3.94 10.64 17.34 1.10 9.91 17.70 19.19 14.07 15.09
Actual population growth rate 50.04 56.08 64.53 40.78 52.94 64.51 133.95 73.18 64.62
Adjusted population growth rate 44.14 39.47 35.99 39.23 37.79 35.39 89.04 48.81 39.78
Notes: The estimates of discrepancy for 1971–81 are not accurate because we could not find information on out-migrants in the 0–9 years age group and, therefore, assumed zero net in-migration in that age group. However, if we replace ‘Net in-migrants, 0–9 years’ (0 in the above table) with ‘In–migrants, 0–12/0–7 years’ (6700/3443), the estimate of discrepancy in case of ‘Total’ population changes to 4.80/4.38 per cent. The corresponding figures for ‘In-migrants, 0–12/0–7 years’ and the discrepancy are, respectively, 4169/2133 and 1.73/1.42 per cent for the ‘Rural’ population and 2531/1310 and 21.30/20.28 per cent for the ‘Urban’ population. ‘Adjusted population growth rate’ is ‘Actual population growth rate’ adjusted for the ‘Discrepancy’. Sources: Govt of India (1976b: 28, 24; 1977: 84–85; 1985b: 34, 48, 50; 1988a: 318–19; 1997a: 52–53; 1997b: 6, 40, 52; nd2)
14
If in-migration was the dominant cause of population growth between 1981 and
2001, then substantial net out-migration from the state could have caused the subsequent
absolute decline in population. Chaurasia (2011: 15), for instance, implicitly assumes no
abnormality in the 2001 Census population estimate and uses SRS (2004–09) birth and
death rates to project the 2011 population of Nagaland. He overestimates the actual
population by 14 per cent and attributes the discrepancy between the projected and actual
figures to ‘very heavy out-migration (almost 14 per cent) between 2001 and 2011’. While
the 2011 Census migration data are not available yet, out-migration is unlikely to explain the
absolute decline in Nagaland’s population after decades of very high growth, as the number
of out-migrants during 2001–11 would have to far exceed 83,083, the number of out-
migrants during the entire 1971–2001 period (Govt of India 1977: 84–85; 1988a: 318–19;
nd1; nd2).
Though ad hoc invocation of migration as the root cause of Nagaland’s population
change can be rejected straightaway, a political–geographic explanation—people migrate to
cope with arbitrary post-colonial boundaries leading to otherwise unexpected shifts in
population dynamics—would bear closer scrutiny. It has often been argued that post-
colonial international and intra-national boundaries have divided seamless communities and
their homelands on the one hand and corralled unwilling partners within rigid boundaries
on the other.12 While claims about the age-old ethno-cultural and political unity of Naga
tribes spread across the hilly border between India and Myanmar and their political isolation
from the outside world do not hold, several Naga and other related tribes are indeed
distributed across Myanmar and North Eastern states such as Nagaland, Manipur, Assam,
and Arunachal Pradesh. We, therefore, need to check if conflicts rooted in colonial
(between Myanmar and India) and post-colonial (between North Eastern states of India)
boundaries have indeed generated demographic gradients that have pushed people from
neighbouring states and countries into Nagaland.
12 Englebert et al. (2002: 1094) trace to Clifford Geertz the idea that modern boundaries have caused
suffocation (heterogeneous groups contained within a state) and dismemberment (partitioning of homogenous groups by borders). The debate has mostly focused on Africa, where a number of national and sub-national boundaries are straight lines, and is polarised between those who are appalled at the artificiality of these boundaries (Alesina et al. 2006; Englebert et al. 2002) and those who argue that the discourse of artificiality betrays ignorance of ground realities (Herbst 2000; Nugent and Asiwaju 1996).

15
To begin with, one could argue that ethnic conflict and/or economic hardship is
pushing Nagas from other jurisdictions (particularly, Myanmar) into Nagaland. (Even other
tribes could be fleeing from conflict hotspots in Nagaland’s neighbourhood.) But in the
1980s and 1990s the level of conflict and economic development did not vary substantially
across Nagaland’s neighbourhood (Myanmar, Assam, Arunachal Pradesh, and Manipur) to
support an influx into Nagaland on a scale that can explain the dramatic increase in
Nagaland’s population. Exceptions like the Naga–Kuki conflict in the hill districts of Manipur
during the 1990s sent Kukis away from Naga-dominated areas rather than towards those.
Even if it is assumed for the sake of argument that an influx can explain the abnormal
increase in population, the complementary assumption—there was a reverse flow in the
following decade—is highly implausible because in the latest census decade Nagaland did
not witness any significant increase in conflict relative to its neighbourhood (South Asia
Terrorism Portal nd1). On the contrary, if anything, in-migration should have increased
during the 2001–11 period because of the ceasefire between various insurgent groups and
the government, which created an unprecedentedly peaceful environment in the state
(South Asia Terrorism Portal nd2).
So far we have argued that (lawful) migration recorded in the census cannot alone
explain both very high population growth rates in Nagaland for three decades (1971–2001)
and the negative growth in the subsequent decade (2001–11). But we have not rejected a
qualified variant of the migration-based explanation that could arguably explain high growth
rates between 1971 and 2001 if there was massive in-migration from other states and
countries. The statistics on in-migration indicate that even the restricted explanation is
implausible for two reasons.
First, migrants constituted about 5 per cent of Nagaland’s population in both 1991
and 2001 and only 40 per cent of these migrants were from outside the state (Table 4).13
Therefore, the migrants from outside Nagaland constituted about 2 per cent of its
population in both these years. Second, the share of in-migrants from other states and
13 The migration figures correspond to ‘migration by place of last residence’. We have taken into
account the migrants with a reference period of 0–9 years so that only those individuals who changed residence between the inter-censual periods are considered.
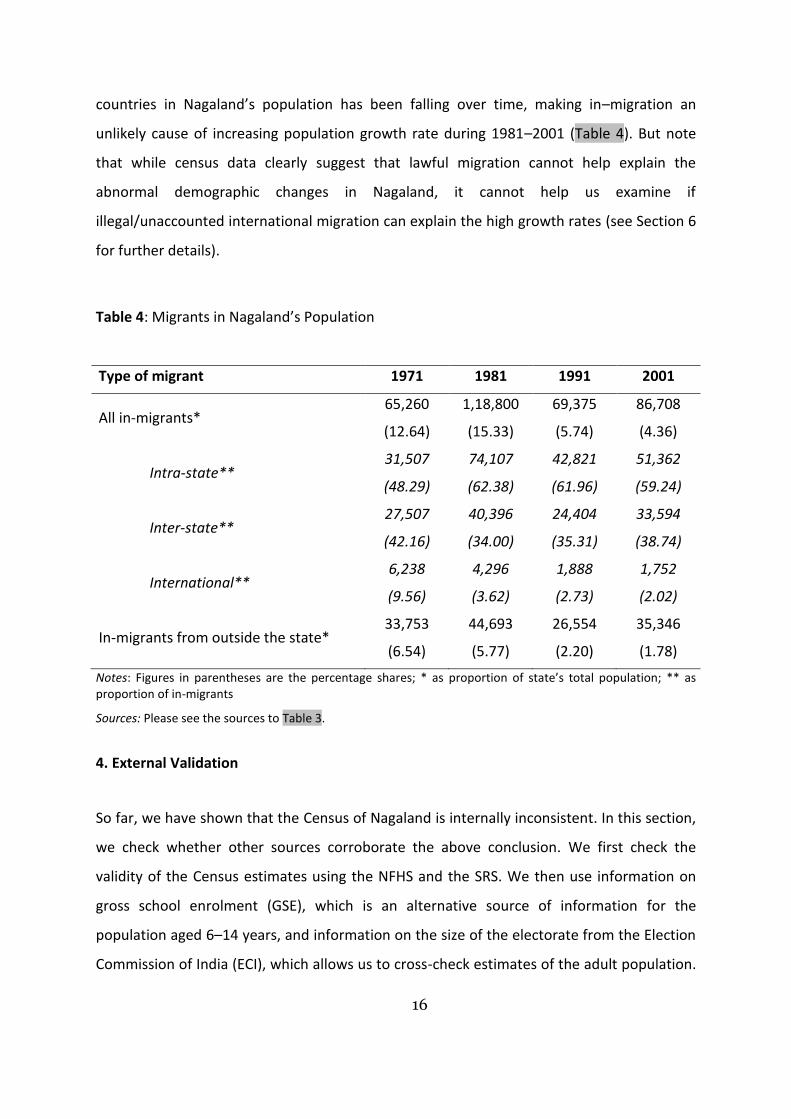
16
countries in Nagaland’s population has been falling over time, making in–migration an
unlikely cause of increasing population growth rate during 1981–2001 (Table 4). But note
that while census data clearly suggest that lawful migration cannot help explain the
abnormal demographic changes in Nagaland, it cannot help us examine if
illegal/unaccounted international migration can explain the high growth rates (see Section 6
for further details).
Table 4: Migrants in Nagaland’s Population
Type of migrant 1971 1981 1991 2001
All in-migrants* 65,260
(12.64)
1,18,800
(15.33)
69,375
(5.74)
86,708
(4.36)
Intra-state** 31,507
(48.29)
74,107
(62.38)
42,821
(61.96)
51,362
(59.24)
Inter-state** 27,507
(42.16)
40,396
(34.00)
24,404
(35.31)
33,594
(38.74)
International** 6,238
(9.56)
4,296
(3.62)
1,888
(2.73)
1,752
(2.02)
In-migrants from outside the state* 33,753
(6.54)
44,693
(5.77)
26,554
(2.20)
35,346
(1.78)
Notes: Figures in parentheses are the percentage shares; * as proportion of state’s total population; ** as proportion of in-migrants
Sources: Please see the sources to Table 3.
4. External Validation
So far, we have shown that the Census of Nagaland is internally inconsistent. In this section,
we check whether other sources corroborate the above conclusion. We first check the
validity of the Census estimates using the NFHS and the SRS. We then use information on
gross school enrolment (GSE), which is an alternative source of information for the
population aged 6–14 years, and information on the size of the electorate from the Election
Commission of India (ECI), which allows us to cross-check estimates of the adult population.

17
Note that the last two sources are complementary and together they cover almost the
entire population.
4.1 NFHS and SRS
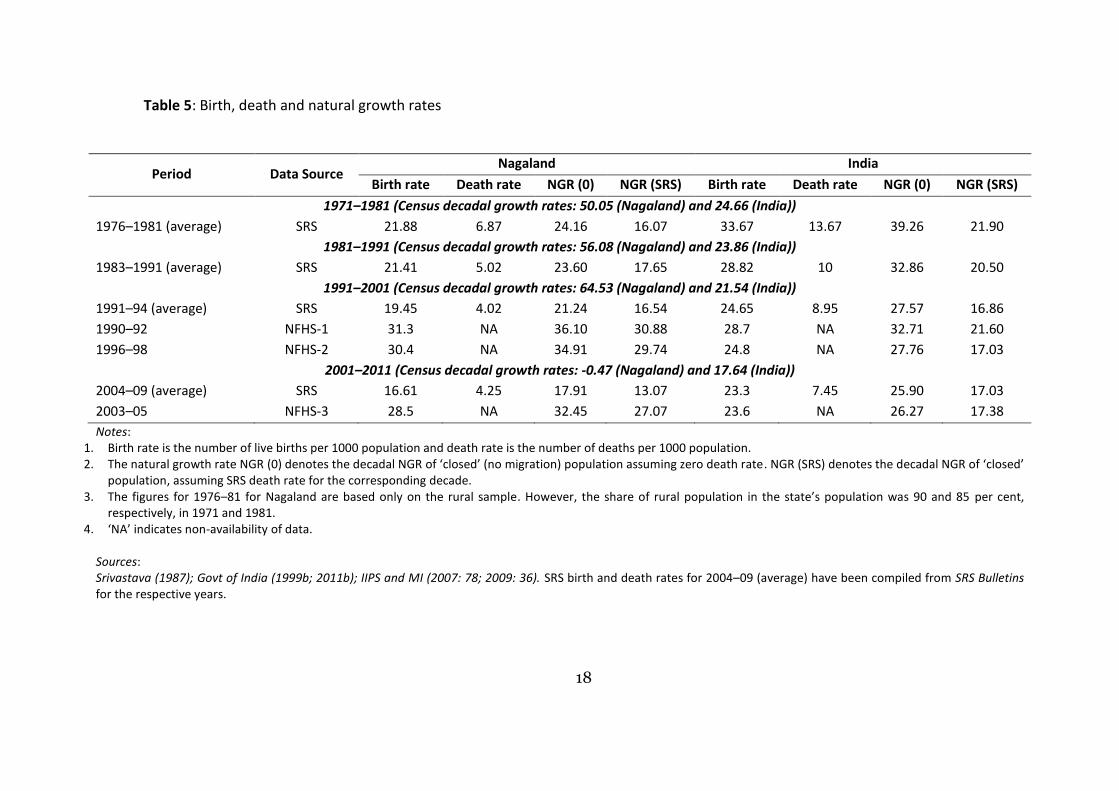
Demographic data from NFHS and SRS can be used to validate the Census estimates of
population growth rates. Table 5 compiles estimates of crude birth rate (CBR) from these
sources for the 1971-2011 period.14 For each decade between 1971 and 2011, Table 5 also
provides estimates of natural growth rate (NGR) corresponding to NFHS and SRS birth rates
for two scenarios: one assuming zero death rate, NGR (0), and the other assuming death
rate equal to the SRS death rate, NGR (SRS). The SRS (NFHS) estimates of CBR for Nagaland
are lower (higher) than the estimates for the whole of the country.15 The population growth
observed for the country as a whole lies within the range spanned by NGR (SRS) and NGR
(0), whereas for Nagaland the CBRs cannot support the observed population growth even
when the crude death rate is assumed to be zero, which is impossible. Furthermore, neither
the SRS nor the NFHS reported substantial changes in birth or death rates between 1991–
2001 and 2001–11, which rules out the possibility of explaining the decline in population
between 2001 and 2011 by transition to a low birth-and-death rates regime.16
14 The NFHS estimates of CBR are based on information on the number of children ever born during a
reference period of three years prior to the day of survey to the women in the reproductive age group (15–49 years). Unlike the NFHS, the SRS is a dual record system that compiles information on births based on continuous enumeration in sample units (Govt of India 2012b: 1). So, CBRs from these sources are not directly comparable owing to difference in methods of data collection and reference periods. Nevertheless, they can be used to verify broad trends.
15 A study comparing fertility estimates from NFHS 1 and SRS for India as a whole and its major states
points out three possible reasons for the former being higher: (1) under-registration of births in SRS; (2) backward displacement of births in the NFHS; and (3) omission of births in the NFHS in some years before the survey (Narasimhan et al. 1997).
16 The inferences based on the NGR derived from SRS and NFHS birth rates (Table 3) are supported by
evidence from other studies. For instance, in 1961, the CBR was 49.77 per 1000 population among the Zemi Nagas of Benreu village in the present district of Peren (Bhowmik et al 1971: 74–75), which compares with the corresponding figure for India as a whole, viz., 41.7 during 1951–60. Similarly, Murry et al. (2005) found that the CBR was 28.35 per 1000 population among the Lotha Nagas in a village in Wokha district (the survey period is not mentioned in the study though it appears to be sometime during 1991–2001). This figure is quite close to the CBR estimates for Nagaland (viz., 30.4 for 1996–98 from NFHS–2 in Table 3) and for rural India (viz., 29.4 for 1995–97 from SRS (Govt of India 1999c)).
18
Table 5: Birth, death and natural growth rates
Period Data Source Nagaland India
Birth rate Death rate NGR (0) NGR (SRS) Birth rate Death rate NGR (0) NGR (SRS)
1971–1981 (Census decadal growth rates: 50.05 (Nagaland) and 24.66 (India))
1976–1981 (average) SRS 21.88 6.87 24.16 16.07 33.67 13.67 39.26 21.90
1981–1991 (Census decadal growth rates: 56.08 (Nagaland) and 23.86 (India))
1983–1991 (average) SRS 21.41 5.02 23.60 17.65 28.82 10 32.86 20.50
1991–2001 (Census decadal growth rates: 64.53 (Nagaland) and 21.54 (India))
1991–94 (average) SRS 19.45 4.02 21.24 16.54 24.65 8.95 27.57 16.86
1990–92 NFHS-1 31.3 NA 36.10 30.88 28.7 NA 32.71 21.60
1996–98 NFHS-2 30.4 NA 34.91 29.74 24.8 NA 27.76 17.03
2001–2011 (Census decadal growth rates: -0.47 (Nagaland) and 17.64 (India))
2004–09 (average) SRS 16.61 4.25 17.91 13.07 23.3 7.45 25.90 17.03
2003–05 NFHS-3 28.5 NA 32.45 27.07 23.6 NA 26.27 17.38
Notes: 1. Birth rate is the number of live births per 1000 population and death rate is the number of deaths per 1000 population. 2. The natural growth rate NGR (0) denotes the decadal NGR of ‘closed’ (no migration) population assuming zero death rate. NGR (SRS) denotes the decadal NGR of ‘closed’
population, assuming SRS death rate for the corresponding decade. 3. The figures for 1976–81 for Nagaland are based only on the rural sample. However, the share of rural population in the state’s population was 90 and 85 per cent,
respectively, in 1971 and 1981. 4. ‘NA’ indicates non-availability of data.
Sources: Srivastava (1987); Govt of India (1999b; 2011b); IIPS and MI (2007: 78; 2009: 36). SRS birth and death rates for 2004–09 (average) have been compiled from SRS Bulletins for the respective years.
19
So, the decline in population has to be explained almost entirely by either substantial
out-migration during 2001–11 and/or overestimation of population in earlier censuses.
Since we have already ruled out the former in Section 3, the latter possibility remains to be
explored.
Here, a few words are in order on verification of census estimates using state-level
household surveys. Certain districts of Nagaland reported an increase in the average
household size in 2001, and there was tremendous variation in household size even within
districts. The Chakhesang Public Organisation used household surveys conducted by
ministries of the state government to validate the results of the 2001 Census (Chakhesang
Public Organisation’s letter to the Office of the Registrar General of India dated 8 January
2007 in The Chakhesang Public Organisation & Ors. vs. Union of India & Ors., W.P. No. 67 of
2006). The comparison of households as per the 2001 Census and the Basic and Vital Health
Statistics Survey conducted by the State Health and Family Welfare Department in 2004
shows that the former reports 48,776 additional households in Nagaland, which translates
into an additional population of 2,96,070 (assuming 6.07 persons per family).17 A similar
survey carried out by the State Rural Development Department suggested that the Census
overestimated the number of rural households by 48,671, which translates into a population
overestimation of 2,94,432.18 Note that these estimates of population overestimates
compare with our estimates of lower bounds of discrepancy in Table 3.
4.2 Gross school enrolment
Gross school enrolment (GSE) data (1963–2009), which provide information on the total
number of children enrolled in primary and middle standards (Classes I-VIII), allows us to
build an alternative data series for the population aged 6–14 years19 and validate the census
17 As per the 2001 Census the average family size in Nagaland was 5.99 (Govt of India nd2) rather than
6.07, the figure mentioned in the Chakhesang Public Organisation’s Writ Petition. 18
The average household size according to this computation turns out to be about 6.05, which is marginally lesser than 6.07, the figure mentioned in the Chakhesang Public Organisation’s Writ Petition.
19 The National Policies on Education 1968 and 1992 lay down guidelines to implement free
elementary schooling (up to class VIII) for children. The Right of Children to Free and Compulsory Education Act 2009, recently included in the Constitution as Article 21 A under Fundamental Rights, provides for ‘free and compulsory elementary education to all children of the age six to fourteen years’. The Directive Principles of

20
population of the corresponding age group (cf. Steel and Poulton 1988; Black 1985: 288).
We will first discuss a few limitations of the enrolment data and examine its internal
consistency (by comparing growth in enrolment in Nagaland with that in the country as a
whole) before comparing it with the Census of Nagaland.
The gross enrolment figures underestimate the 6–14 years population to the extent
that all the children of school going age may not have been enrolled, and even some of
those enrolled would have dropped out, inter alia, due to poor performance, lack of
interest, poverty, prevalence of child labour, or gender bias. On the other hand, children
who spend more than a year in any given class, children enrolled late in schools, and
children whose age has been underreported (making them eligible for more attempts in
competitive examinations and government jobs interviews) bias the 6–14 years population
upwards. More importantly, state governments have an incentive to inflate enrolment
figures to meet targets and also to attract federal funds linked to student head counts,
which can bias the enrolment figures upwards. But a priori the net effect of these effects is
ambiguous and, in any case, we do not have reliable data to estimate their relative effect.
We now compare state and national level enrolment figures. In 1961, the literacy
rate in the state was 17.91 per cent, lower than the national average of 24.02 per cent (Govt
of India 1973a). But since then growth in enrolment has been higher in Nagaland than the
national average (Table 6), resulting in a much higher literacy rate in Nagaland than the rest
of the country (Table 1). Both in Nagaland and India, growth in enrolment during 1971–81
was lower than in 1964–71, but increased during 1981–91 before tapering off in the
subsequent decade and picking up again after 2001. Thus, the enrolment data for Nagaland
are broadly consistent with that for the rest of the country.
The information on GSE can now be compared with the census estimates for the ’0–
14’ years population. At the national level, the ratio of GSE to the census population (0–14
years)20 increased from 32 per cent to 45 per cent between 1971 and 2001 (Table 6).
State Policy (Art 45) stipulates provision of ‘early childhood care and education to children below the age of six years’ (Govt of India 2009; 2011d). So, the 6–14 years age group corresponds to the primary and middle standards.
20 The ratio of gross school enrolment to the Census population (0–14 years) is not the same as the
Gross Enrolment Ratio—the ratio of the 6–14 years population in school to the overall 6–14 years population—because of the difference in denominators.

21
However, the contrary is true of Nagaland, where the ratio decreased from 58 per cent to
35 per cent. Given the importance of education for individuals and the numerous initiatives
taken by government and non-government organisations to universalise primary education,
this is surprising, because it indicates that a state which was ahead of the rest of the country
in terms of the aforesaid ratio as early as 1971 now ranks among the worst-performing
states. Add to this the fact that since the early 1980s Nagaland has been among the most
literate states of India (Table 1). So, the fall in the enrolment–population ratio appears to be
an artefact of the abnormality in the Census. The extent of abnormality in the census
population estimates is so much that despite a higher rate of growth of enrolment than the
national average (Table 6), the trend in enrolment–population ratio for Nagaland is contrary
to that for India as a whole (Figure 2). This becomes clearer once the figures for 2008 are
compared with the pre-2002 figures. While the enrolment–population ratio for the country
as a whole continues to improve gradually until 2008, in the case of Nagaland the ratio
declines steeply and before reverting to the pre-1991 level (about 50 per cent). The
decrease in the enrolment–population ratio in Nagaland is largest during the 1991–2001
decade. The ratio attains its minimum value in 2001, the year of maximum discrepancy in
the Census (Table 3). In short, GSE data suggest that the Census overestimates the
population of the ‘0–14’ years age group until 2001.

22
Table 6: Population (0–14 years) and Gross School Enrolment (GSE)
Period
Nagaland India
GSE GSE growth Population
(0-14)
GSE/ Population (0-14) GSE GSE growth Population
(0-14)
GSE/ Population (0-14)
1971 112184 8.48 195056 57.51 73173500 3.24 230334822 31.77 1981 136484 2.96 285535 47.80 95468300 2.53 263107050 36.28 1991 209963 3.79 451044 46.55 137501000 3.65 312364662 44.02 2001 252677 1.57 728409 34.69 163896800 0.13 363610812 45.07 2008 362646 5.50 725863 49.96 191220060 2.28 407464130 46.93
Notes: 1. ‘GSE’ pertains to enrolment in primary and middle standards (classes I–VIII) and is the three year (central) average. 2. ‘GSE growth’ is the compounded annual growth rate of GSE and has been estimated using a semi–log trend function for the corresponding decade (except for 1971 and
2008, where the reference periods are 1964–71 and 2001–08, respectively). 3. ‘Population (0–14)’ refers to the census population aged 14 years or below. The ‘Population (0–14)’ for 2008 have been extrapolated using the growth of total population
between 2001 and 2011 since the figures on ‘Population (0–14)’ from the 2011 Census are not yet available. The population figures for India exclude Assam in 1981 and Jammu and Kashmir in 1991.
Sources:
1. Indiastat (nd) for GSE 2. Govt of India (1976a: 8–9; 1987a: 46–47; nd1; nd2) for Population (0–14 years)

23
Figure 2: The ratio of the population enrolled in schools (I-VIII) to the census population
aged 0–14 years
Source: Table 6
4.3 Electoral rolls
The ECI archives provide information on the size of the electorate and number of voters—
both disaggregated by gender—for the State Legislative Assembly and
parliamentary/general elections, which can be compared with the corresponding census
population estimates. Ideally, the size of the electorate should be smaller than the
comparable census population because of two reasons. First, electoral rolls are built
through voluntary enumeration—unlike the census estimates, which are based on
compulsory enumeration. Second, electoral registration requires citizens to produce
documentary evidence of identity and residence.21 Before checking the electoral data for
21 An electoral roll is a list of electors, i.e., all citizens eligible to vote in an election. According to
Section 14(b) of the Representation of the People Act 1950, any citizen who fulfils the minimum age
0
10
20
30
40
50
60
1971 1981 1991 2001 2008
Nagaland India

24
internal consistency and comparing it with the census data, a brief discussion on the
evolution of Nagaland’s electoral constituencies is in order.
When the state of Nagaland was formed in 1963, a separate unicameral state
legislative assembly was constituted, the seats of which are filled through direct election.
Nagaland was also assigned a seat each in the lower and upper houses of the Parliament.
The seat in the lower house is filled through direct election, whereas the seat in the upper
house is filled through indirect election. We will use data on direct elections to the State
Legislative Assembly and the lower house of the Parliament. Note that pre- and post-
November 1973 elections are not directly comparable because of the extension of direct
elections to the district of Tuensang of Nagaland in 1974 and redistribution of seats among
other districts.22 So, the analysis will be restricted to the post-1974 period. Between 1974
and 2012, the people of Nagaland participated in nine assembly (1974–2008) and ten
parliamentary (1977–2009) elections, which provide us with 19 comparable observations.
But we need to account for the change in the minimum age for voting, which was reduced
from 21 years to 18 years through the Constitution (Sixty-first) Amendment Act, 1988 with
effect from March 1989 (Govt of India 1989; ECI nd2).
4.3.1 Internal consistency of election data
The internal consistency of the election data can be checked in at least four different ways.
First, consistency can be checked by comparing sex ratios drawn from data on the electorate
(registered voters) and on the electors who cast their votes (actual voters). Under the
assumptions that women have not been systematically excluded at any stage of the election
process and that the propensity to vote is gender-invariant, the sex ratio calculated using
electorate and voter information should be identical. We found that voter sex ratios
requirement and a few other requirements by the first day of the year in which the electoral roll is prepared or revised is eligible to register as an elector (ECI 2006).
22 Between 1963 and 1973, Tuensang did not participate in direct elections because of its
socioeconomic backwardness. It was directly governed by the Governor of Nagaland with the assistance of a Regional Council that in turn elected members who represented it in the State Legislative Assembly (Article 371A, Govt of India 2011d). This arrangement lasted until 1974, when Tuensang was fully assimilated into Nagaland. Until then Nagaland’s Legislative Assembly had 40 directly elected members. In 1974, Tuensang was assigned 20 newly created assembly seats, whereas the existing 40 seats were redistributed between the then districts of Kohima and Mokokchung.

25
generally lie within 5 per cent of electorate sex ratios.
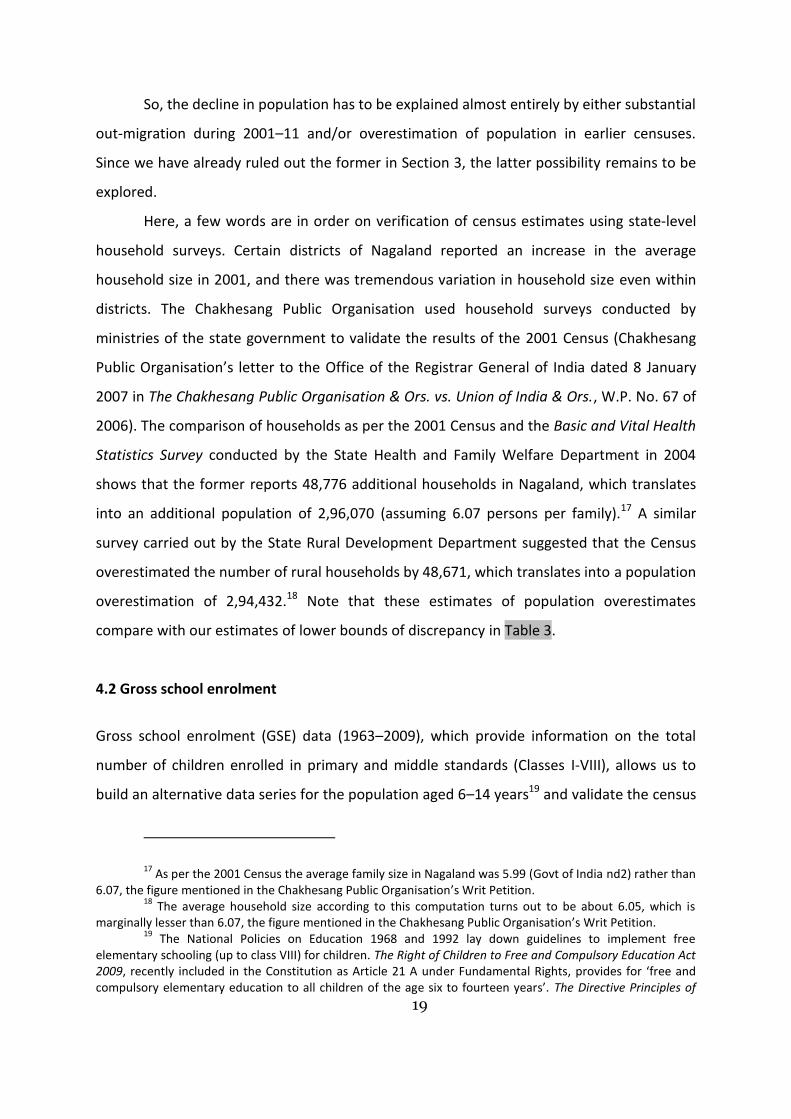
Second, on three occasions—1977, 1989, and 1998—assembly and parliamentary
elections were held in the same year.23 In 1977, the parliamentary election was held in
March and the assembly election in November. The size of the parliament electorate was
4,73,257 and of the assembly electorate 4,03,454—a substantial difference of 70,000 (Table
7). However, the size of the parliamentary electorate decreased from 4,73,254 in 1977 to
4,60,110 in 1980. This suggests that in the parliamentary election held in March 1977, the
electoral roll might have been inflated due to a delay in summary revision to drop the
names of deceased and (out)-migrant electors or due to the registration of bogus electors,
which were verified and deleted only before the assembly election that was held in
November 1977. In 1989 too, there is a substantial difference (2,30,595) between the
assembly and parliamentary electorate sizes. Though both elections took place on the same
day, it seems that the reduction in the minimum age requirement was followed only in the
parliamentary election because of which those aged between 18 and 21 became eligible to
vote.24 In 1998, the assembly and parliamentary electorates were identical in size.
23 Electoral rolls are prepared for each state assembly constituency separately. Except in the state of
Jammu and Kashmir, where voter eligibility differs between parliamentary and assembly elections, the electoral roll of a parliamentary constituency aggregates the electoral rolls of its constituent assembly constituencies (ECI 2006). Hence, the assembly and parliamentary data for the same year can be compared.
24 The effect of reduction in age may not reflect immediately in electorate size, especially in a state
where the majority of population lives in rural areas. This is because it is the voters’ duty to find out whether his/her name has been registered (ECI nd1), and in places where the population is sparsely distributed over remote areas, the spread of information (about the revision of electoral rolls) may take time. Even otherwise, electoral officers may be not be easily accessible. However, the magnitude of the difference in assembly and parliamentary electorate sizes for the 1989 elections suggests that, for some reason, the revised minimum age for voting was only implemented in the parliamentary election. Two facts enhance the plausibility of the preceding claim. One, from the next assembly election onwards, the sizes of the electorate in assembly and parliamentary elections are comparable. Two, in 1989 Nagaland was not the only state where there was a serious mismatch between the two rolls. In 1989, assembly and parliamentary elections were held together in eight states, including Nagaland. While the size of the electorate was same in both elections in Sikkim, it was larger in parliamentary elections in Uttar Pradesh, Mizoram, Nagaland, Andhra Pradesh, Tamil Nadu, and Goa, whereas it was smaller in parliamentary elections Karnataka. The difference is less than 1 per cent in all but three cases (Tamil Nadu–12 per cent, Mizoram–20 per cent, and Nagaland–40 per cent).
26
Table 7: Electorate size and voter turnout in assembly and general elections in Nagaland
Year Electorate Voter turnout (%) Comments
Assembly election (A)
General election (G)
Electoral rolls (E)
Nagaland India
1974 (A) 412068 - - 74.35 - 2 candidates won unopposed (from Akuluto and Tobu)
1977 (G) - 473257 - 52.83 60.49
Some North Eastern states recorded higher turnout than Nagaland
1977 (A) 403145 - - 83.26 - 1 candidate won unopposed (from Southern Angami II)
1980 (G) - 460083 - 63.90 56.92
Some North Eastern states recorded higher turnout than Nagaland
1982 (A) 596453 - - 74.44 - -
1984 (G) - 594062 - 66.46 63.56
Some North Eastern states recorded higher turnout than Nagaland
1987 (A) 581953 - - 85.65 - - 1989 (A) 582416 - - 85.65 - -
1989 (G) - 813011 - 74.71 61.95
Turnout higher than all other North Eastern states except Tripura
1991 (G) - 814836 - 77.07 56.73 Turnout highest in the North East
1993 (A) 810127 - - 91.53 - 1 candidate won unopposed (from Northern Angami I)
1996 (G) - 874518 - 88.32 57.94 Turnout highest in the North East
1998 (G) - 926569 - 45.41 61.97
Turnout lowest in the North East due to the boycott call given by the Naga Hoho
1998 (A) 926569 - - 78.95 -
43 candidates won unopposed due to the Hoho’s boycott call
1999 (G) - 955914 - 76.25 59.99
Turnout higher than all other North Eastern states except Sikkim

27
Year Electorate Voter turnout (%) Comments
Assembly election (A)
General election (G)
Electoral rolls (E)
Nagaland India
2003 (A) 1014841 - - 87.85 - -
2004 (G) - 1041433 - 91.67 58.07 Turnout highest in the North East
2007 (E) - - 1286694 - - - 2008 (A/E)
1302266 - 1300507 86.19 - -
2009 (G/E)
- 1317729 1317725 89.99 58.19 Turnout highest in the North East
2010 (E) - - 1327224 - - -
2011 (E) - - 1339559 - - - Notes:
1. The figures prior to (after) 1993 for Assembly and 1989 for parliament correspond to the population aged
21 (18) years and above.
2. In Nagaland, the last intensive revision of Electoral Rolls was carried out in 2005.
3. The figures reported for India correspond to the average turnouts in general elections.
4. The size of the electorate of Nagaland is calculated by aggregating the electorate of all the 60 assembly
constituencies. Since the ECI report for 1974 does not mention the size of the electorate of Tobu constituency,
where only one candidate contested election, we have used the 1977 figure. For the same reason, the size of
the electorate for the constituency ‘Northern Angami I’ is not available for 1993 and has been substituted by
the average of the size of the electorate in 1989 and 1993. The share of these two constituencies in total
electorate of the state was, however, less than 2 per cent.
Sources:
1. Election reports from http://eci.gov.in/eci_main1/ElectionStatistics.aspx
2. Electoral Rolls from http://eci.gov.in/eci_main/eroll&epic/ER0112011.pdf,
http://eci.gov.in/eci_main/eroll&epic/ER0112010.pdf, http://eci.gov.in/eci_main/eroll&epic/ER0112009.pdf,
http://eci.gov.in/eci_main/eroll&epic/ER0112008.pdf, http://eci.gov.in/eci_main/eroll&epic/ER0112007.pdf.
Third, two assembly (1987 and 1989), two parliamentary (1998 and 1999), and an
assembly and parliamentary (1998 and 1999) elections were held within a year or two of
each other (Table 7). The difference between the numbers of electors in the 1987 and 1989
assembly elections was merely 463, which strengthens our suspicion (see second point
above) that obsolete rolls were used in the latter elections. The size of the electorate
increased by 29,345 between 1998 parliamentary/assembly and 1999 parliamentary
elections, which is not implausible.
Fourth, the number of voters should always be less than or equal to the size of the
electorate. Of the 60 assembly constituencies and the only parliamentary constituency
being examined for the period 1974–2009, the number of voters never exceeded the size of
28
the electorate, except in one case: in the 1993 Assembly Election to Tenning constituency,
where the number of women voters (8595) exceeded the women electorate (8534).
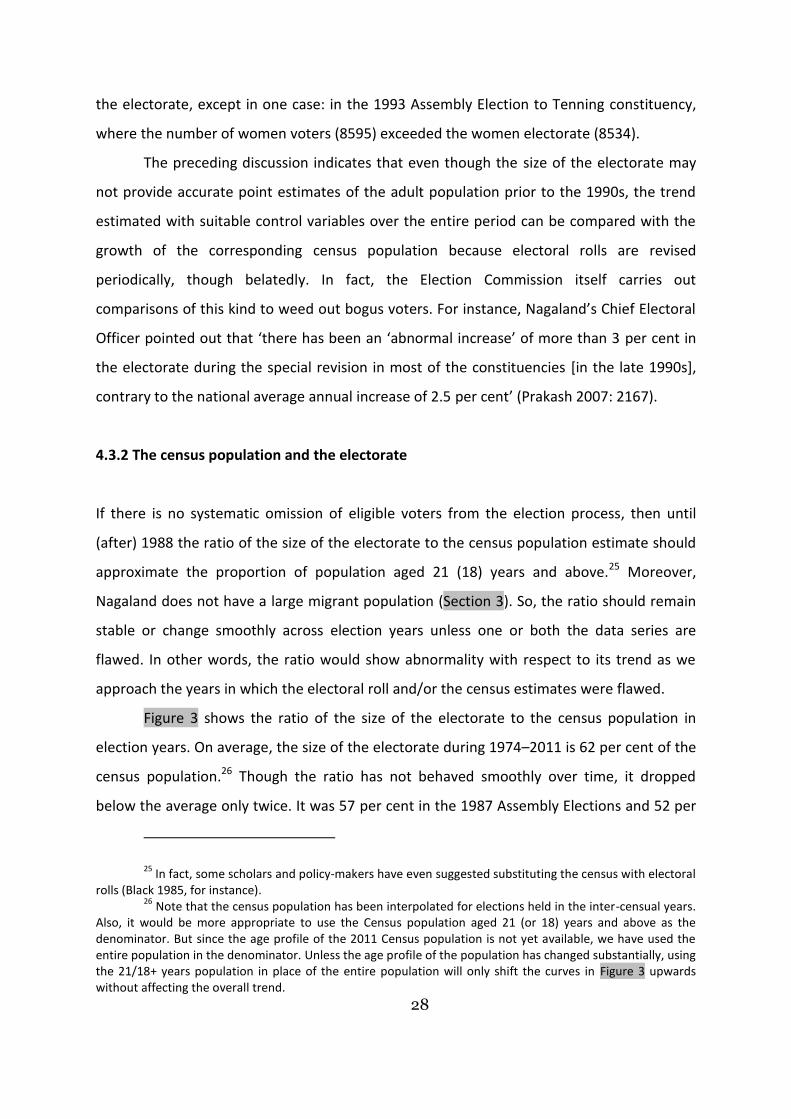
The preceding discussion indicates that even though the size of the electorate may
not provide accurate point estimates of the adult population prior to the 1990s, the trend
estimated with suitable control variables over the entire period can be compared with the
growth of the corresponding census population because electoral rolls are revised
periodically, though belatedly. In fact, the Election Commission itself carries out
comparisons of this kind to weed out bogus voters. For instance, Nagaland’s Chief Electoral
Officer pointed out that ‘there has been an ‘abnormal increase’ of more than 3 per cent in
the electorate during the special revision in most of the constituencies [in the late 1990s],
contrary to the national average annual increase of 2.5 per cent’ (Prakash 2007: 2167).
4.3.2 The census population and the electorate
If there is no systematic omission of eligible voters from the election process, then until
(after) 1988 the ratio of the size of the electorate to the census population estimate should
approximate the proportion of population aged 21 (18) years and above.25 Moreover,
Nagaland does not have a large migrant population (Section 3). So, the ratio should remain
stable or change smoothly across election years unless one or both the data series are
flawed. In other words, the ratio would show abnormality with respect to its trend as we
approach the years in which the electoral roll and/or the census estimates were flawed.
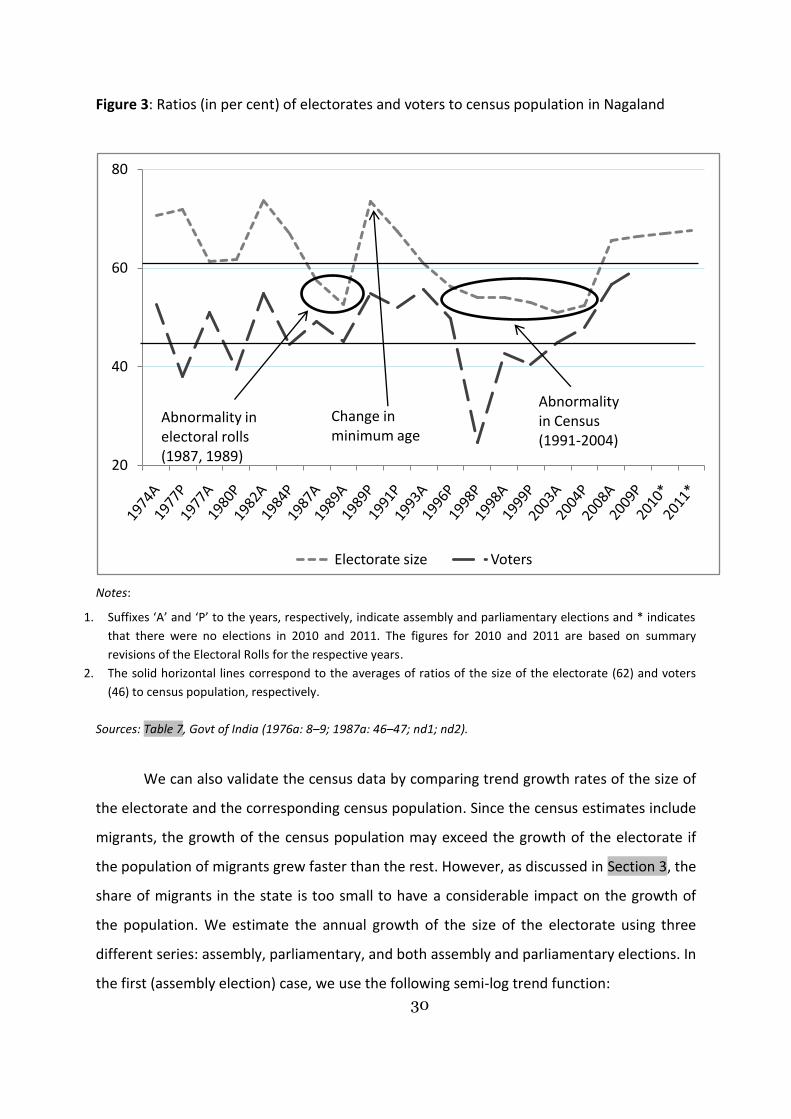
Figure 3 shows the ratio of the size of the electorate to the census population in
election years. On average, the size of the electorate during 1974–2011 is 62 per cent of the
census population.26 Though the ratio has not behaved smoothly over time, it dropped
below the average only twice. It was 57 per cent in the 1987 Assembly Elections and 52 per
25 In fact, some scholars and policy-makers have even suggested substituting the census with electoral
rolls (Black 1985, for instance). 26
Note that the census population has been interpolated for elections held in the inter-censual years. Also, it would be more appropriate to use the Census population aged 21 (or 18) years and above as the denominator. But since the age profile of the 2011 Census population is not yet available, we have used the entire population in the denominator. Unless the age profile of the population has changed substantially, using the 21/18+ years population in place of the entire population will only shift the curves in Figure 3 upwards without affecting the overall trend.
29
cent in the 1989 Assembly Elections. Since the size of the electorate in both these elections
was smaller than the size in the preceding assembly elections (Table 7), the abnormality in
the ratio could possibly be attributed to a discrepancy in the respective electoral rolls (see
Section 4.3.1 for details). The other period when the ratio fell below 62 per cent is 1991–
2004. Since the analysis in Section 3 indicated substantial discrepancy in the censuses
conducted in 1991 and 2001 (Table 3), and there is a high degree of internal consistency in
the electoral rolls of this period (Table 7), the abnormality for this period could be attributed
to discrepancy in the corresponding censuses. Further, as we move closer to 2001, the
census year with maximum discrepancy, the ratio approaches 50 per cent.27 Recall that
analysis of schooling data also highlighted discrepancies in the censuses of 1991 and 2001
(Section 4.2) and now another external source corroborates the conclusions regarding
discrepancies in the 1991 and 2001 Censuses identified through internal consistency checks
(Section 3).
27 If we correct the Census population series for the discrepancy estimated in Table 3, then the ratio
falls below the 60 per cent threshold only in two assembly election years: 1989 (there was some problem in revision of electoral rolls, also see Footnote 24) and 2003 (the first election held after the Census with the greatest discrepancy).
30
Figure 3: Ratios (in per cent) of electorates and voters to census population in Nagaland
Notes:
1. Suffixes ‘A’ and ‘P’ to the years, respectively, indicate assembly and parliamentary elections and * indicates
that there were no elections in 2010 and 2011. The figures for 2010 and 2011 are based on summary
revisions of the Electoral Rolls for the respective years.
2. The solid horizontal lines correspond to the averages of ratios of the size of the electorate (62) and voters
(46) to census population, respectively.
Sources: Table 7, Govt of India (1976a: 8–9; 1987a: 46–47; nd1; nd2).
We can also validate the census data by comparing trend growth rates of the size of
the electorate and the corresponding census population. Since the census estimates include
migrants, the growth of the census population may exceed the growth of the electorate if
the population of migrants grew faster than the rest. However, as discussed in Section 3, the
share of migrants in the state is too small to have a considerable impact on the growth of
the population. We estimate the annual growth of the size of the electorate using three
different series: assembly, parliamentary, and both assembly and parliamentary elections. In
the first (assembly election) case, we use the following semi-log trend function:
20
40
60
80
Electorate size Voters
Abnormality in electoral rolls (1987, 1989)
Abnormality in Census (1991-2004)
Change in minimum age

31
ln 𝐸𝑙𝑒𝑐𝑡𝑜𝑟𝑎𝑡𝑒 𝑠𝑖𝑧𝑒𝑡 = 𝛼 + 𝛽𝑡 + 𝛾1𝐷1993 + 휀𝑡 (5)
where D1993 is a dummy which assumes a value of unity 1993 onwards, when the
change in minimum age for voting (from 21 to 18 years) became effective. In the second
(parliamentary) case, the following equation is estimated in which the dummy for 1993 is
replaced with a dummy for 1989:
ln 𝐸𝑙𝑒𝑐𝑡𝑜𝑟𝑎𝑡𝑒 𝑠𝑖𝑧𝑒𝑡 = 𝛼 + 𝛽𝑡 + 𝛾1𝐷1989 + 휀𝑡 (6)
In the third (assembly and parliamentary combined) case, we estimate the following:
ln 𝐸𝑙𝑒𝑐𝑡𝑜𝑟𝑎𝑡𝑒 𝑠𝑖𝑧𝑒𝑡 = 𝛼 + 𝛽𝑡 + 𝛿 Type + 𝛾1𝐷1989*Type + 𝛾2𝐷1993*(1–Type) + 휀𝑡 (7)
where ‘Type’ is a control for type of the election (Type = 1 for parliamentary and 0
for assembly elections), and D1989 and D1993 are the dummies as defined in Eqs (6) and (5),
respectively. Here the dummy ‘Type’ is different from the year dummy. The latter is a unit
step function-type dummy typically used to test structural change in a time series that
allows us to control for the change in minimum voting age requirement. The coefficient 𝛽
provides an estimate of instantaneous rate of growth. But, (𝑒𝑥𝑝𝛽 ‐1)*100, the compounded
(over a period) annual growth rate given instantaneous rate of growth (Gujarati 2005: 180),
is used for comparison with the census growth rates.
The regressions indicate that the growth in the size of the electorate has been less
than 3 per cent per annum irrespective of the specification of the trend equations, which
implies a 2.4-times increase in population in three decades compared to the much higher
growth rate recorded in the Census (4.42 per cent per annum) that leads to 3.66 times
increase in population between 1971 and 2001 (Table 8).28 We can conclude that the Census
28 We also estimated Eq (7) by replacing the size of the electorate with the number of voters. Between
1974 and 2009, the annual growth rate of voters was 3.43 per cent (Table 8), which would imply a population increase of 2.75 times in three decades. However, the growth so computed will also capture the effect of changes in voter turnout. If, for example, the voting rate shows a general upward trend due to, say, deepening
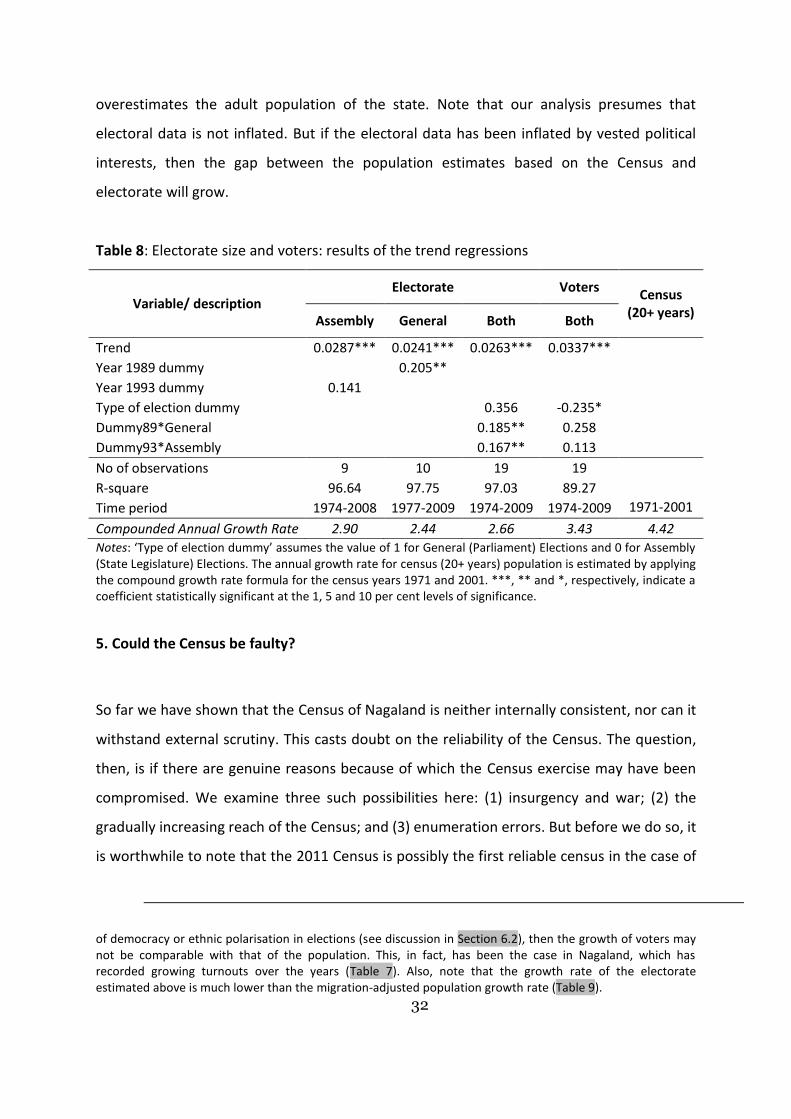
32
overestimates the adult population of the state. Note that our analysis presumes that
electoral data is not inflated. But if the electoral data has been inflated by vested political
interests, then the gap between the population estimates based on the Census and
electorate will grow.
Table 8: Electorate size and voters: results of the trend regressions
Variable/ description Electorate Voters
Census (20+ years)
Assembly General Both Both
Trend 0.0287*** 0.0241*** 0.0263*** 0.0337*** Year 1989 dummy
0.205**
Year 1993 dummy 0.141
Type of election dummy
0.356 -0.235*
Dummy89*General
0.185** 0.258 Dummy93*Assembly
0.167** 0.113
No of observations 9 10 19 19 R-square 96.64 97.75 97.03 89.27 Time period 1974-2008 1977-2009 1974-2009 1974-2009 1971-2001
Compounded Annual Growth Rate 2.90 2.44 2.66 3.43 4.42 Notes: ‘Type of election dummy’ assumes the value of 1 for General (Parliament) Elections and 0 for Assembly (State Legislature) Elections. The annual growth rate for census (20+ years) population is estimated by applying the compound growth rate formula for the census years 1971 and 2001. ***, ** and *, respectively, indicate a coefficient statistically significant at the 1, 5 and 10 per cent levels of significance.
5. Could the Census be faulty?
So far we have shown that the Census of Nagaland is neither internally consistent, nor can it
withstand external scrutiny. This casts doubt on the reliability of the Census. The question,
then, is if there are genuine reasons because of which the Census exercise may have been
compromised. We examine three such possibilities here: (1) insurgency and war; (2) the
gradually increasing reach of the Census; and (3) enumeration errors. But before we do so, it
is worthwhile to note that the 2011 Census is possibly the first reliable census in the case of
of democracy or ethnic polarisation in elections (see discussion in Section 6.2), then the growth of voters may not be comparable with that of the population. This, in fact, has been the case in Nagaland, which has recorded growing turnouts over the years (Table 7). Also, note that the growth rate of the electorate estimated above is much lower than the migration-adjusted population growth rate (Table 9).
33
Nagaland. The government canvassed the support of the opposition parties, the
bureaucracy, and a wide range of organisations of churches, civil society, students, tribes,
and village elders (Govt of Nagaland 2009b; Assam Tribune 2009). The government
impressed upon all concerned that a reliable and accurate census is necessary ‘for proper
planning of development and also establishing political and social harmony’ (Assam Tribune
2009; Indian Express 2011).29
5.1 Insurgency and war
Unlike other parts of the country where the Census was cancelled during periods of extreme
political disturbances (for instance, Assam in 1981 and Jammu and Kashmir in 1951 and
1991 [Govt of India 1953b: 3; Govt of India 2011a: x]), in Nagaland the Census was never
cancelled or postponed despite the four decades-long armed insurgency that subsided only
in 1999. But one could argue that if during a period an area was out of bounds for security
forces then it could have been inaccessible to census enumerators as well. After all, even six
decades after India’s independence the reach of the National Sample Surveys—one of the
most comprehensive, reliable and widely used sources of information on Indian
households—is restricted to 5 kilometres from bus routes in rural areas of Nagaland (Govt
of India 2012a: 5), while a number of other surveys completely ignore Nagaland.30
Five decennial censuses have been conducted since 1963, when the state of
Nagaland was formed, and of these at least three overestimated the population (Table 3).
Insurgency was not intense at the time of the 1971, 2001, and 2011 Censuses. But the 1981
and 1991 Censuses may have been affected by insurgency. Moreover, even the 1971 Census
29 Former finance minister of Nagaland K. Therie has questioned even the 2011 Census (Times of India
2012b). According to his estimates, the latest census overestimates the state’s population by about half a million.
30 In fact, most national level surveys either do not cover the smaller states of the North East India (for
instance, various waves of Rural Economic and Demographic Surveys) or cover them irregularly (for instance, District Level Household and Facility Survey did not cover Nagaland in 2007-08). Even the surveys that cover the region regularly do not have sufficiently representative samples to generate reliable estimates for the smaller states (National Sample Surveys and, until recently, SRS). A similar picture emerges if we look at non-demographic surveys. For instance, ‘[a]bout 48 per cent of the area could not be covered by systematic geological mapping on 1:50,000 scale owing to inaccessibility’ (Geological Survey of India 2011: 2, 76; emphasis added).

34
had to be rushed due to mid-term parliamentary elections and the Bangladesh War, which
most affected Eastern and North Eastern India (Govt of India 1975a: 1).31 But disturbed
conditions during censuses due to insurgency or war are unlikely to explain the sustained
increase in population growth rates over three decades. If anything, reduced coverage due
to disturbances should have resulted in under-enumeration32 and then a greater increase in
population in the first post-disturbance census. So, the 2011 Census, the first Census of
Nagaland to be conducted in the absence of war and insurgency,33 ought to have recorded
an increase in the population growth rate rather than an absolute decrease in the
population.
5.2 Expanding reach of Census
It can be argued that the reach of census operations must have expanded gradually across
the remote areas that fall under the present state of Nagaland. Between 1881 and 1901, the
Census covered only the western parts of the districts of Kohima and Mokokchung and,
thereafter, the whole of these districts. Tuensang, where permanent administrative
presence dates to only 1948 (Govt of Nagaland 2009a: 4), was not covered until 1951 (Eaton
1984: Table 2). In 1951, the Census covered only 129.5 sq km of Tuensang. In the next
census, the coverage increased to 5356.1 sq km of Tuensang and the population increased
from 7,025 in 1951 to 134,275 in 1961 (Govt of India 2011a: x).34 It appears that even the
31 One could alternatively argue that until 1971 Nagaland was under the jurisdiction of the Ministry of
External Affairs and, therefore, the Census could not be conducted properly leading to under-enumeration (Toshi Wungtung, personal communication). But we do not have independent verification for this claim.
32 During our field work civil society organisations and census officials suggested that in some earlier
censuses— pre-2011, according to some and pre-2001, according to others—complete enumeration was not possible in strongholds of partisans of independence (for instance, parts of districts along the Myanmar border like Phek and Tuensang), who did not want to legitimate the state by cooperating with state officials. But anecdotal evidence suggests that such instances of non-cooperation are not sufficient to explain the abnormally high growth rate in 2001. In this context it is worth recalling that non-cooperation with civil authorities did affect some of the earlier censuses in other parts of the country. For instance, as pointed out by Natrajan (1972: vii), during the British period there was ‘under-enumeration of population in the Census of 1931 mainly in Gujarat due to [the] non-cooperation movement’.
33 The durability of the ceasefires of 1997 and 1999 between the government and insurgents, which
may have influenced the peace and stability of the state during the Census, was not unambiguous in 2001. However, even if the 2001 Census is treated as the first insurgency-free census, it can only explain the high population growth rate recorded in that year but not the negative growth rate recorded in the 2011 Census.
34 Even for the districts that were covered by the colonial censuses we only have estimates: ‘Due to
35
1961 Census did not cover Tuensang entirely because later census records show its area to
be 6014 sq km (Govt of India 1984a: 13) even though no new areas were added to it. Thus,
the expanding reach of the state and, by implication, the Census could have resulted in
higher recorded population growth rates initially. For instance, between 1951 and 1961,
Nagaland’s population grew by 73.35 per cent according to the Census (Govt of India 2011a:
165), by 79.29 per cent according to Eaton (1984: 18), and by 14.07 per cent according to
Sharma and Kar (1997: 77). But the adjusted growth rate for the state (after excluding
Tuensang) is only 18.10 per cent.35 In the subsequent decades all the sources agree that the
growth rate was 39.88 per cent and growth rates increased steadily until 2001 (Figure 1).
But, in any case, the expanding reach of the Census can explain only one spike in the
growth rate, which should decrease subsequently with socioeconomic progress (growing
income and access to better healthcare and education; also see Footnote 3). Also, had
incomplete coverage been responsible for the high rate of growth, the abnormality would
not have been pervasive across all major ethnic and socioeconomic groups and districts of
the state (see Agrawal and Kumar 2012d for details). Therefore, the expanding reach of the
Census and consequent reduction in gross omission can explain neither the sustained
increase in the growth rate of Nagaland’s overall population over three decades until 2001,
nor the subsequent decline.
5.3 Enumeration errors
Almost everyone we met during our fieldwork suggested that until 2001 it was very
common for people to get enumerated (in the Census) and enrolled (in the electoral rolls) in
each location where they had some property or at least in the town where they were
currently staying as well as their native village. This was possible because of the structure of
non–availability of Census data the figures for the decades, from 1901 to 1951 have been estimated for the Districts of Kohima, Phek, Wokha, Zunheboto, and Mokokchung of Nagaland. Estimation however could not be done for Tuensang and Mon as they were not fully censused prior to 1961.’ (Govt of India 2011b: xii)
35 The Census population estimates for Nagaland in 1951 and 1961 are 205,950 and 369,200,
respectively. After excluding Tuensang in both the years the corresponding estimates are 198,925 and 234,925, respectively, which implies a decadal growth of 18.10 per cent. Sharma and Kar (1997: 77) adjust only the 1961 population.
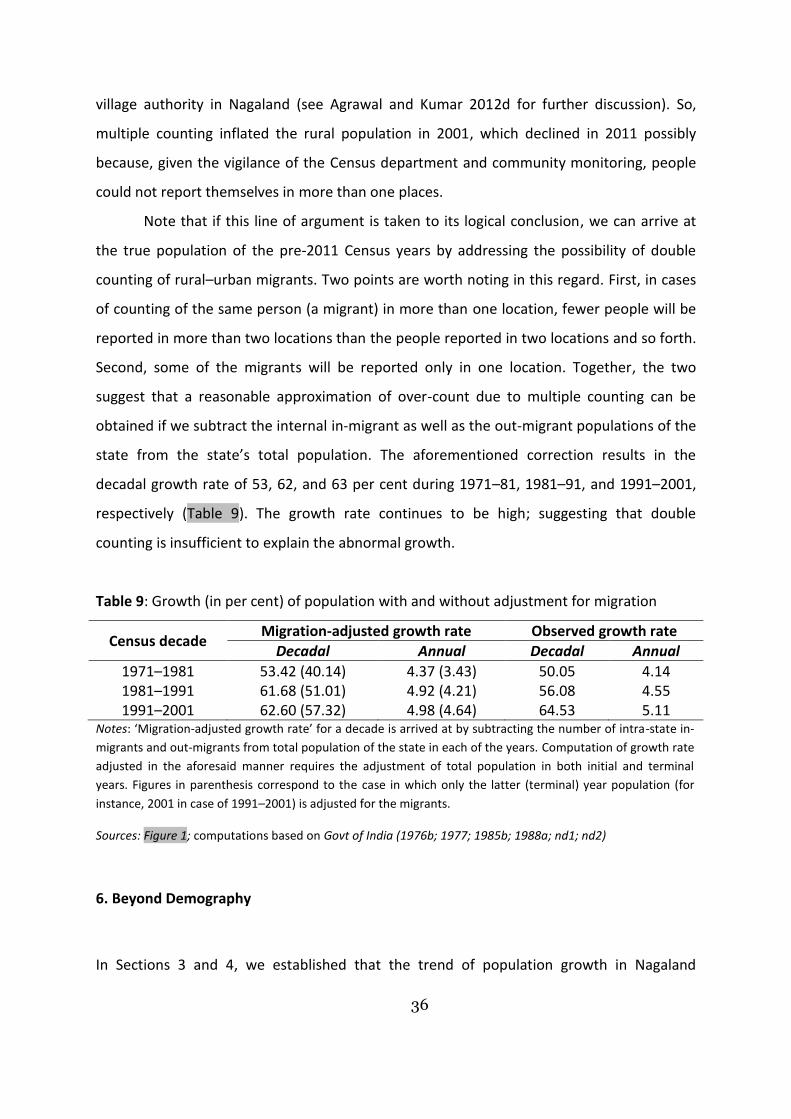
36
village authority in Nagaland (see Agrawal and Kumar 2012d for further discussion). So,
multiple counting inflated the rural population in 2001, which declined in 2011 possibly
because, given the vigilance of the Census department and community monitoring, people
could not report themselves in more than one places.
Note that if this line of argument is taken to its logical conclusion, we can arrive at
the true population of the pre-2011 Census years by addressing the possibility of double
counting of rural–urban migrants. Two points are worth noting in this regard. First, in cases
of counting of the same person (a migrant) in more than one location, fewer people will be
reported in more than two locations than the people reported in two locations and so forth.
Second, some of the migrants will be reported only in one location. Together, the two
suggest that a reasonable approximation of over-count due to multiple counting can be
obtained if we subtract the internal in-migrant as well as the out-migrant populations of the
state from the state’s total population. The aforementioned correction results in the
decadal growth rate of 53, 62, and 63 per cent during 1971–81, 1981–91, and 1991–2001,
respectively (Table 9). The growth rate continues to be high; suggesting that double
counting is insufficient to explain the abnormal growth.
Table 9: Growth (in per cent) of population with and without adjustment for migration
Census decade Migration-adjusted growth rate Observed growth rate
Decadal Annual Decadal Annual
1971–1981 53.42 (40.14) 4.37 (3.43) 50.05 4.14 1981–1991 61.68 (51.01) 4.92 (4.21) 56.08 4.55 1991–2001 62.60 (57.32) 4.98 (4.64) 64.53 5.11
Notes: ‘Migration-adjusted growth rate’ for a decade is arrived at by subtracting the number of intra-state in-
migrants and out-migrants from total population of the state in each of the years. Computation of growth rate
adjusted in the aforesaid manner requires the adjustment of total population in both initial and terminal
years. Figures in parenthesis correspond to the case in which only the latter (terminal) year population (for
instance, 2001 in case of 1991–2001) is adjusted for the migrants.
Sources: Figure 1; computations based on Govt of India (1976b; 1977; 1985b; 1988a; nd1; nd2)
6. Beyond Demography
In Sections 3 and 4, we established that the trend of population growth in Nagaland
37
between 1971 and 2011 was abnormal and cannot be explained by births, deaths, or lawful
migration. Then, in Section 5, we argued that enumeration errors due to political
disturbances during earlier censuses, the expanding reach of the Census, and/or double
counting cannot explain the dramatic changes in Nagaland’s population. So, the puzzle
posed by Nagaland’s demographic somersault persists. This section examines two
alternative explanations of changes in Nagaland’s population—unaccounted international
migration and manipulation of the Census due to competition for state resources.
6.1 Unaccounted International Migration
In Section 3, we ruled out a political–geographic explanation based on lawful intra-national
and international migration. We also noted that the Census data does not allow us to
investigate the contribution of illegal/unaccounted international migration. Recall that in-
migration in the state is predominantly intra-state in nature and the proportion of migrants
from outside the state is too small to affect the growth rate of overall population (Table 4).
Now if unaccounted international migration is to be blamed for the abnormal increase in
the population reported in the Census, then we have to assume that unaccounted
international migrants get reported as natives rather than as migrants. There are two
possibilities here that are not mutually exclusive and are, in fact, in all likelihood
complementary. First, international immigrants lured by opportunities in the state might try
to influence officials and politicians to record them as natives in official records. Second,
given the intensity of ethno-political competition driven by the numerical strengths of
different groups, it is not inconceivable that some indigenous communities might find it
beneficial to encourage outsiders—Nagas and non-Nagas—to settle in their respective areas
of influence and get them registered as native-born members of their community.
If only intra-national boundaries are considered, then the number of potential
settlers belonging to the Naga tribes and related tribes of Arunachal Pradesh and Assam are
too few to account for changes in Nagaland’s population. In Assam, such population is
limited to a few villages (Singh 1998). In Arunachal, the concerned population is limited to a
38
few small tribes of the districts along the Nagaland border, whose population did not
register lower growth between 1991 and 2001.36 Migration of North Manipur’s large tribal
population related to Nagas could possibly account for a part of Nagaland’s unaccounted
opulation (Table 3). But the relevant districts of Manipur—Senapati, Tamenglong, and
Ukhrul–recorded very high growth rates37 despite the out-migration of Kuki tribes due to
ethnic conflict. Moreover, we have not come across media or official sources referring to
large-scale movement of Naga and related tribes from North Eastern states like Manipur
into Nagaland. This leaves us with unaccounted international migration from other
countries (Hazarika 2000; Bezboruah 2006: 47; Gogoi 2001; Amarjeet Singh 2009; Sharma
and Kar 1991; Rio 2010).
We can group unaccounted international immigrants according to the country of
origin—Myanmar38 and Bangladesh—and identity assumed in India—Naga tribal, non-Naga
tribal, and other. While it is commonplace to trace the problem to Bangladesh, Myanmarese
immigrants are often ignored because they can easily inter-mingle with kindred tribes (cf.
Jeermison 2011; Sharma and Kar 1997: 87).39 There are many Naga tribes in Myanmar
(Shimray 2007: Appendix II). According to one source, until 1991, conflict pushed as many as
100,000 Myanmarese Nagas into Nagaland (Banerjee 1992: 1525; also see Nag 2002: 286
who quotes Banerjee 1992; Lwin 2003, more recently, puts the number of Myanmarese
36 The population growth of all Scheduled Tribes in Tirap—the only district of Arunachal Pradesh
bordering Nagaland—was 22 per cent during 1991–2001 (Govt of India nd1; nd2) compared to the overall population growth rates of India and Arunachal Pradesh–21.54 and 27 per cent, respectively (Govt of India 2011a).
37 The growth rate of all Scheduled Tribes in Ukhrul was 32 per cent during 1991–2001 and the
Tangkhul tribe in the district registered a growth of about 40 per cent (Govt of India nd1; nd2). The growth of tribes in Tamenglong district was 28 per cent (Govt of India nd1; nd2). The population growth in some divisions of Senapati district was, in fact, so high that the government had to reject the Census and report estimated figures (Govt of India 2011a).
38 Racially similar migrants from Bhutan, Nepal, and Tibet are either too few (Govt of India nd1; nd2)
or their presence is not contentious (Govt of Nagaland 2009a: 24). They should not be reluctant to register as genuine international migrants. But note that India has a large indigenous Nepali-speaking population and Nepali is recognized by the Eighth Schedule of the Constitution as a major language of India.
39 We do not have the information to cross-check the census data of the countries of origin of
unaccounted international migrants in Nagaland. The Census of Myanmar is unreliable for tribal areas. Bangladesh’s population is almost hundred times larger than that of Nagaland. So, even if the entire abnormal growth in Nagaland’s population is due to Bangladeshis, it will not reflect in the Census of Bangladesh. Even otherwise, it may be difficult to trace the abnormal change to Bangladesh. Bangladeshi migrants generally settle among ethnically close communities close to the Bangladesh-India border before moving deeper into the Indian territory after acquiring the readily available insignia of Indian citizenship, which makes them that much more difficult to detect.
39
immigrants at more than 100,000).40 The figure cited by Banerjee (1992) is about one-tenth
of the Naga population of Myanmar, estimated at about one million (Assam Tribune 2012;
Koijam 2001).41 Myanmarese immigrants have no incentive to register themselves as non-
Naga and non-tribal in a state dominated by Naga tribes when they can easily pass as Nagas.
In this context, it is noteworthy that the Anghs, traditional village heads based in the Mon
district of Nagaland, continue to enjoy traditional authority over a number of villages across
the border in Myanmar (Govt of Nagaland 2011). So, it is not unexpected that in the case of
conflict kindred Myanmarese Nagas take shelter in Konyak villages in Nagaland, where their
Anghs live. Also, it is well-known that the NSCN (Khaplang), the second most important
underground organisation in Nagaland, which is headed by a Myanmarese Naga, enjoys
support from sections of Naga tribes close to the India-Myanmar border. This is one of the
main reasons why the rival Tangkhul-dominated NSCN (IM) has been unable to monopolise
the Naga underground. So, the indigenisation of Myanmarese Nagas who cross the border is
not inconceivable. Indeed, between 1981 and 1991, the decadal population growth rate of
Konyaks–the largest tribe in the districts along Myanmar border–was a phenomenal at 63
per cent, which contrasts sharply with their growth in the preceding decade (16 per cent)
(Table 10). Similarly, during 1981–91, the population of Mon district—their stronghold
40 We also checked if the Myanmarese immigrants in Nagaland have been counted as refugees in, say,
United Nations High Commissioner for Refugees (UNHCR) reports (since the early 1990s). But we have not been able to find any reliable information regarding Myanmarese Naga refugees. A publication at the UNHCR website (Refworld 2004) inter alia estimates that 1,000 Myanmarese Naga refugees crossed into Nagaland during two weeks of January 1992.
41 But it bears noting that a number of our interviewees in Nagaland (as well outside observers)
disagreed with the possibility of such a large influx from Myanmar on grounds of carrying capacity of the eastern districts of the state. One of our interviewees from the eastern districts pointed out that there was an influx during the late 1980s and early 1990s; but most people returned to Myanmar. We need to probe the issue of Myanmarese immigration further because (a) Sumanta Banerjee (1992), our source, did not withdraw his claim (personal communication), (b) many of the interviewees did not deny the possibility of an equally significant Myanmarese tribal influx into Mizoram and southern Manipur, which are comparable in terms of area as well as population, and (c) while denying the possibility of a large Myanmarese influx, some interviewees simultaneously stressed that 100,000 if not more Bangladeshi Muslims have settled along the western fringe alone. In other words, there seems to be a mismatch between the way Myanmarese and Bangladeshi influxes are viewed. This reminds of a similar pan-Indian phenomenon. The Bangladeshi Hindus and Christians are invisible in India compared to their Muslim counterparts. The argument that helps overlook the former group is that they are persecuted in their home country and India has a special responsibility being the successor state to British India. A similar argument is made in Nagaland with regard to Myanmarese Nagas, who are viewed as ‘Eastern’ Nagas–Myanmar being incidental to their identity.

40
bordering Myanmar—grew 57 per cent.42
In the absence of authoritative official figures on the number of unaccounted
international immigrants, we can only indirectly verify popular estimates. As discussed
above, Myanmarese Nagas have no incentive to identify themselves as non-Nagas or non-
Christian in a Christian Naga-majority state or to join the ranks of miscellaneous Nagas as
they can join the closely related Naga tribes in the Tuensang division.43 In short, if
Myanmarese Nagas are being indigenised, then among other things the population of
Christians and Naga tribes close to the international border should show abnormality
around, say, 1991.44 Tables 10 and 11, respectively, show the changes in the populations of
different tribes and religions in Nagaland. During 1971–81, the growth rate of other groups
exceeded that of the Naga tribes; the converse holds for the period 1981–2001 (Table 10).
The growth of the Naga population accelerated from 42 per cent during 1971–81 to 63 per
cent in 1981–91 and to 69 per cent in 1991–2001. Similarly, during 1971–81, all the major
religions, including Christianity, recorded very high growth rates (Table 11). The high growth
rate of Christianity can be partly accounted for by the rapid decline in the population of
those with ‘Other’ religions. Because of its large population base, the growth of Christianity
stands out as it contributed to a large increase in the overall population of the state. But the
large base also makes the growth of Christians less susceptible to changes due to migration.
Although there is an abnormality in both Naga and Christian populations after the 1981
Census (viz., 1991 Census), the abnormality persists in 2001 as well. Thus, the empirical
evidence neither clearly supports, nor does it entirely rule out the possibility indigenisation
of Myanmarese Nagas, who may have entered the state in the late 1980s.
42 We do not have separate figures for Mon for the decade of 1971–81, when it was part of Tuensang.
The population growth rate of undivided Tuensang increased from 33.68 per cent in 1971–81 to 65.44 per cent in 1981–91 (Govt of India 1973b; 1984a; nd1).
43 Note that a majority of the state’s population is Naga (87.48 per cent in 2001) (Table 11) and 99 per
cent of them follow Christianity. 44
But note that both the Naga and Christian populations could show abnormality for a variety of other reasons, particularly, in the districts close to the Myanmar border. For instance, fertility rates could be higher among the socio-economically backward Christian Nagas of these districts.

41
Table 10: Tribal population in Nagaland
Classification Population Decadal growth
1971 1981 1991 2001 1971-81 1981-91 1991-2001
All Population 516449 774930 1209546 1990036 50.05 56.08 64.53 All Scheduled Tribes 457602 650885 1060822 1774026 42.24 62.98 67.23
Garo 934 1473 2272 1582 † 54.24 -30.37 Kachari 4329 7212 8244 7807 66.60 14.31 -5.30 Kuki 6206 9839 16100 20195 58.54 63.63 25.43 Mikir 519 440 703 106 † † † Naga etc. 445266 630970 1029589 1741692 41.71 63.18 69.16
Angami 43994 62557 97408 124696 42.19 55.71 28.01 Ao 74016 104578 165893 231823 41.29 58.63 39.74 Chakhesang and Pochury 43438 60771 99205 150554 39.90 63.24 51.76 Chang 16075 22375 30370 60885 39.19 35.73 100.48 Khiemnungan 14338 18079 21665 38137 26.09 19.84 76.03 Konyak 72319 83652 136458 243758 15.67 63.13 78.63 Lotha 36638 58030 82586 148210 58.39 42.32 79.46 Phom 18019 24426 65339 115389 35.56 167.50 76.60 Rengma 8174 15312 32368 50966 87.33 111.39 57.46 Sangtam 19315 29016 51975 83714 50.23 79.13 61.07 Sema 64918 95312 150780 241806 46.82 58.20 60.37 Yimchunger 14146 22054 35461 75983 55.90 60.79 114.27 Chirr‡ 692 1560 2067 19 † 32.50 † Tikhir‡ 2800 3587 9177 10377 28.11 155.84 13.08 Makware‡‡ 2501 612 863 †† -75.53 † † Zeliang 13883 21084 36012 71871 51.87 70.80 99.58 Other Nagas 0 7965 11962 93504 † 50.18 681.67
Unclassified/ unspecified 348 951 3914 2644 † † -32.45
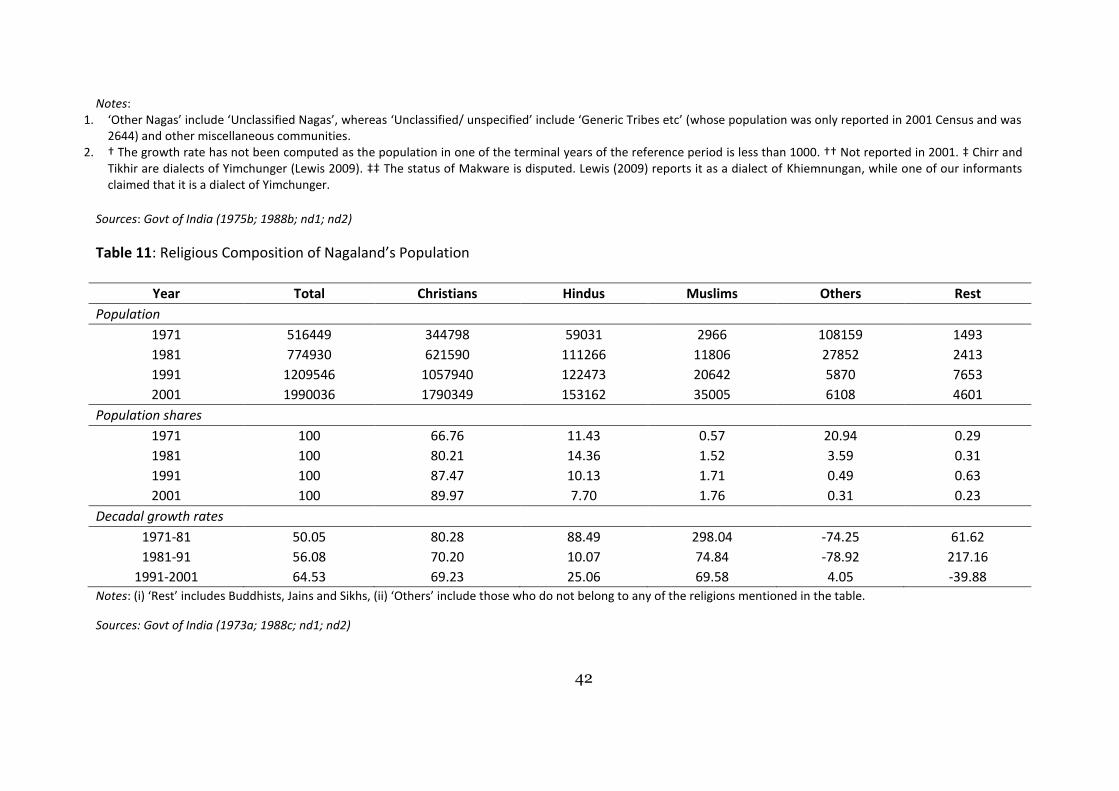
42
Notes: 1. ‘Other Nagas’ include ‘Unclassified Nagas’, whereas ‘Unclassified/ unspecified’ include ‘Generic Tribes etc’ (whose population was only reported in 2001 Census and was
2644) and other miscellaneous communities. 2. † The growth rate has not been computed as the population in one of the terminal years of the reference period is less than 1000. †† Not reported in 2001. ‡ Chirr and
Tikhir are dialects of Yimchunger (Lewis 2009). ‡‡ The status of Makware is disputed. Lewis (2009) reports it as a dialect of Khiemnungan, while one of our informants claimed that it is a dialect of Yimchunger.
Sources: Govt of India (1975b; 1988b; nd1; nd2)
Table 11: Religious Composition of Nagaland’s Population
Year Total Christians Hindus Muslims Others Rest
Population
1971 516449 344798 59031 2966 108159 1493
1981 774930 621590 111266 11806 27852 2413 1991 1209546 1057940 122473 20642 5870 7653 2001 1990036 1790349 153162 35005 6108 4601
Population shares
1971 100 66.76 11.43 0.57 20.94 0.29 1981 100 80.21 14.36 1.52 3.59 0.31 1991 100 87.47 10.13 1.71 0.49 0.63
2001 100 89.97 7.70 1.76 0.31 0.23
Decadal growth rates
1971-81 50.05 80.28 88.49 298.04 -74.25 61.62 1981-91 56.08 70.20 10.07 74.84 -78.92 217.16
1991-2001 64.53 69.23 25.06 69.58 4.05 -39.88 Notes: (i) ‘Rest’ includes Buddhists, Jains and Sikhs, (ii) ‘Others’ include those who do not belong to any of the religions mentioned in the table.
Sources: Govt of India (1973a; 1988c; nd1; nd2)
43
As regards Bangladeshis, they should be reporting themselves as native non-Naga; it
is indeed difficult to believe that thousands of relatively dark-complexioned, Bengali-
speaking plainsmen from Bangladesh could get registered as Nagas in the Census without
being noticed in a state populated largely by fiercely territorial Mongoloid tribes. However,
a recent criminal case has highlighted the indigenisation of Bangladeshi Muslims as Nagas.
*T+he ‘audacity’ of the *assault+ incident, served as another reminder about
the ‘danger’ of ‘patronising’ migrant mians *Bangladeshis+ by Nagas who employ
them as cheap labour . . . local Nagas were not only employing mians as cheap
labour but even ‘accommodating’ them as ‘citizens’ in most ‘rural villages of
Dimapur district’ . . . it has become a rule that some local Nagas who have adopted
mians as ‘sons and daughters’ and naming them with Naga names . . . such
adopted mians have proved effective in ‘pitting one Naga against the other’ and
thrive in Dimapur under the ‘patronage of local dadas *strongmen+’. (Nagaland
Post 2012; also Times of India 2012a)45
The above news excerpt is among the spate of media reports that refer to the
deepening roots of immigrants through indigenisation on the sly – through adoption or
inter-marriage, something we heard often during our fieldwork. The following throws more
light on the process of indigenization.
As a result of rising intermarriage, a community called ‘Sumias’ has
reportedly emerged in the state . . . The ‘Sumias’ are the children of intermarriage
between the Sumi Naga tribe and immigrants . . . In this regard, a student leader
asserted: “These children are also confused about the religion they should adopt.
In most cases, they are given Naga names. So, they cannot be detected by the
authorities concerned when they apply for advantages like jobs, which are meant
only for the indigenous people of Nagaland”. (Amarjeet Singh 2009, p. 22-23, 40)
45 But this concern is not new. More than a decade ago Nagaland Page (10 August 1999) complained
in similar terms (Shimray 2007: 36): ‘In Dimapur, all the rickshaw pullers are Bangladeshis and they are highly aggressive lot in a land where the non–tribals are living a second class living (emphasis added). All these are signs of a growing and highly visible problem – the virtual colonization of Nagaland by Bangladeshi Muslims, locally known as Miyan. But sadly in Nagaland very little attention is being given to this problem, which is much more serious than even the sovereignty issue.’
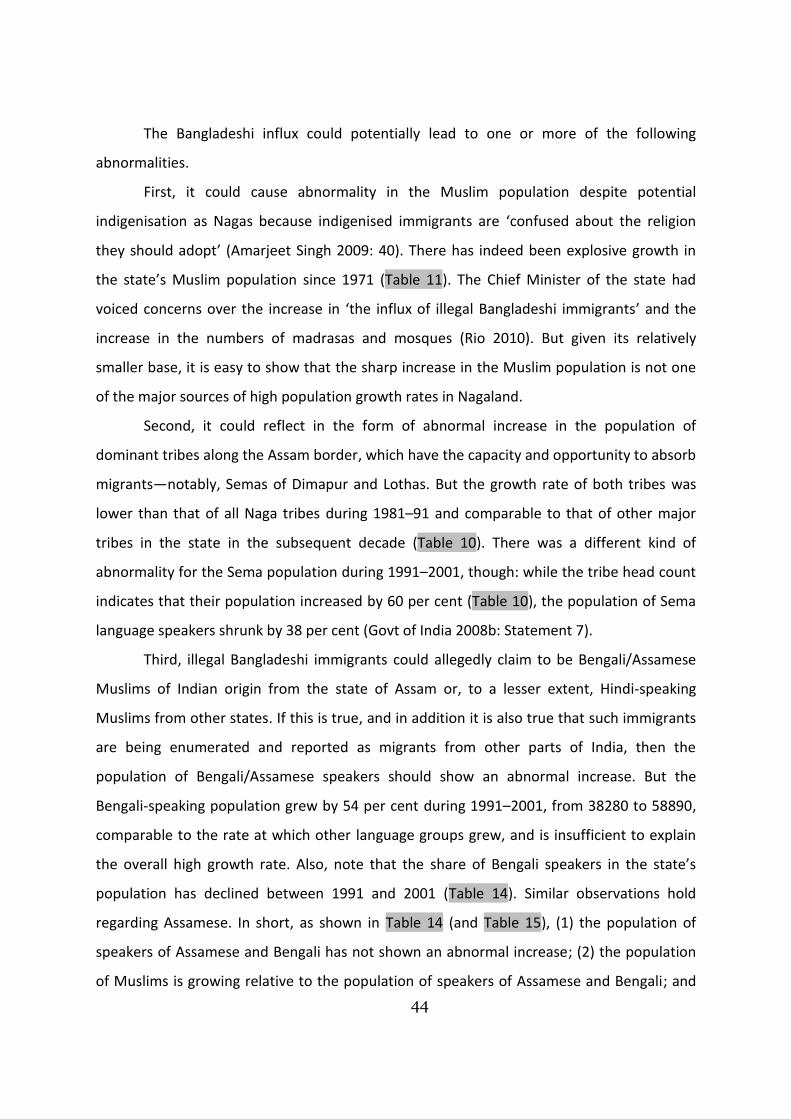
44
The Bangladeshi influx could potentially lead to one or more of the following
abnormalities.
First, it could cause abnormality in the Muslim population despite potential
indigenisation as Nagas because indigenised immigrants are ‘confused about the religion
they should adopt’ (Amarjeet Singh 2009: 40). There has indeed been explosive growth in
the state’s Muslim population since 1971 (Table 11). The Chief Minister of the state had
voiced concerns over the increase in ‘the influx of illegal Bangladeshi immigrants’ and the
increase in the numbers of madrasas and mosques (Rio 2010). But given its relatively
smaller base, it is easy to show that the sharp increase in the Muslim population is not one
of the major sources of high population growth rates in Nagaland.
Second, it could reflect in the form of abnormal increase in the population of
dominant tribes along the Assam border, which have the capacity and opportunity to absorb
migrants—notably, Semas of Dimapur and Lothas. But the growth rate of both tribes was
lower than that of all Naga tribes during 1981–91 and comparable to that of other major
tribes in the state in the subsequent decade (Table 10). There was a different kind of
abnormality for the Sema population during 1991–2001, though: while the tribe head count
indicates that their population increased by 60 per cent (Table 10), the population of Sema
language speakers shrunk by 38 per cent (Govt of India 2008b: Statement 7).
Third, illegal Bangladeshi immigrants could allegedly claim to be Bengali/Assamese
Muslims of Indian origin from the state of Assam or, to a lesser extent, Hindi-speaking
Muslims from other states. If this is true, and in addition it is also true that such immigrants
are being enumerated and reported as migrants from other parts of India, then the
population of Bengali/Assamese speakers should show an abnormal increase. But the
Bengali-speaking population grew by 54 per cent during 1991–2001, from 38280 to 58890,
comparable to the rate at which other language groups grew, and is insufficient to explain
the overall high growth rate. Also, note that the share of Bengali speakers in the state’s
population has declined between 1991 and 2001 (Table 14). Similar observations hold
regarding Assamese. In short, as shown in Table 14 (and Table 15), (1) the population of
speakers of Assamese and Bengali has not shown an abnormal increase; (2) the population
of Muslims is growing relative to the population of speakers of Assamese and Bengali; and

45
(3) the ratio of Muslims to the population of Hindi speakers shows a gradual increase (Table
14).
Fourth, it could reflect in an abnormal increase in the population of Dimapur, which
continues to be the most preferred destination for migrants, for two reasons: (1) it is the
only district not completely beyond the Inner Line; and (2) it is the economic hub of the
state and generates the maximum employment outside the public sector. But Dimapur’s
population growth has not shown any abnormality with respect to its trend.
Fifth, it could reflect in the Unclassified/Other Naga population, who do not belong
to any specific Naga tribes.46 Between 1991 and 2001, the population of ‘Other Nagas’
increased by more than 600 per cent from 11,962 to 93,504 (Table 10), almost entirely in
districts bordering Assam. ‘Other Nagas’ are predominantly Christians (about 98 per cent)
(Govt of India nd2). It is worth noting that Sema dominated Zunheboto district is the only
district away from Assam order that records a significant increase in the population of
‘Other Nagas’ (Table 12). Since the growth of all major tribes was already high, the
abnormally high growth of ‘Other Nagas’ indicates that immigrants, more than direct
absorption into the larger tribes, could possibly be getting absorbed under this
miscellaneous category. But we do not of any conclusive evidence in this regard.
Finally, note that if as alleged in a number of news reports it is indeed the case that
there is a large Sumia community (Sema mother and Bangladeshi father), then the sex ratio
of Semas should have dropped faster than the rest of the Naga tribes. But a comparison of
sex ratios of Semas with the rest of the Naga tribes rules out this possibility (Table 13). In
fact, the sex ratios also suggest that it is not the case that the Sema tribe has excess girls,
which in turn could have made them preferred targets of Bangladeshi Muslims in search for
a toehold in a tribal-dominated state.
46 Note that we did not check for this in the case of the Myanmarese influx, because the absolute
growth of Unclassified/Other Nagas is negligible along the Myanmar border (Table 12).
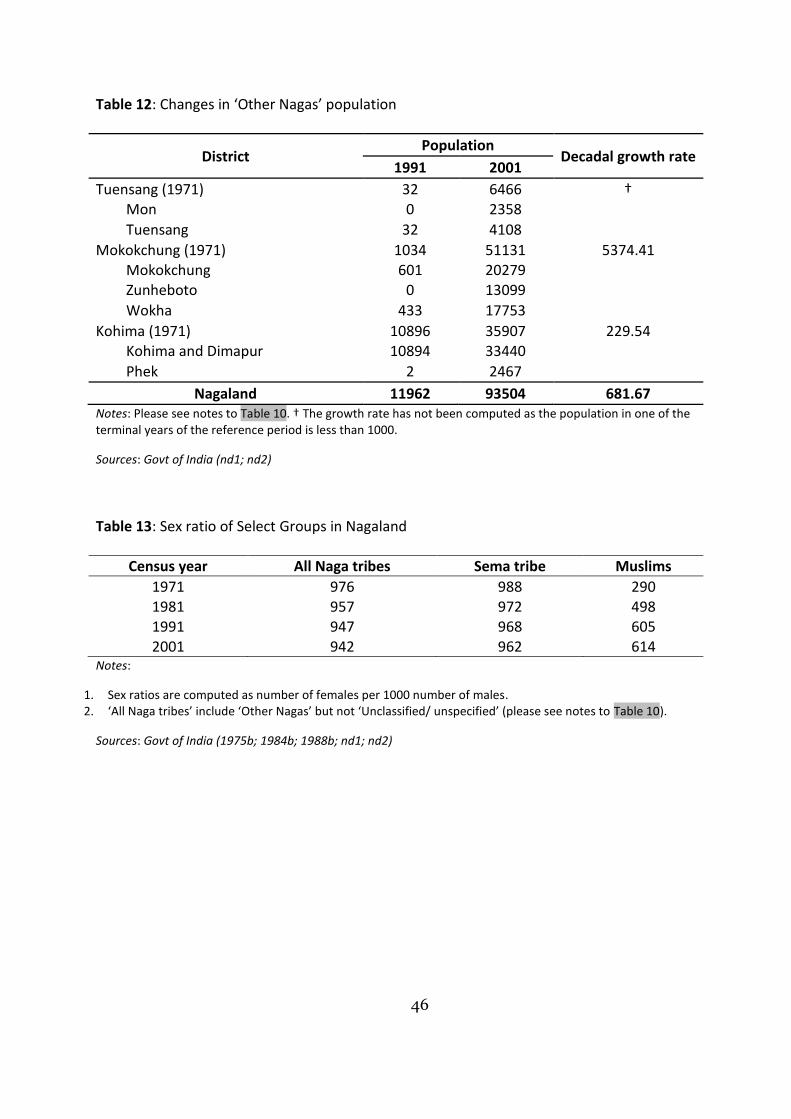
46
Table 12: Changes in ‘Other Nagas’ population
District Population
Decadal growth rate 1991 2001
Tuensang (1971) 32 6466 † Mon 0 2358
Tuensang 32 4108
Mokokchung (1971) 1034 51131 5374.41
Mokokchung 601 20279
Zunheboto 0 13099
Wokha 433 17753
Kohima (1971) 10896 35907 229.54 Kohima and Dimapur 10894 33440
Phek 2 2467
Nagaland 11962 93504 681.67
Notes: Please see notes to Table 10. † The growth rate has not been computed as the population in one of the terminal years of the reference period is less than 1000.
Sources: Govt of India (nd1; nd2)
Table 13: Sex ratio of Select Groups in Nagaland
Census year All Naga tribes Sema tribe Muslims
1971 976 988 290 1981 957 972 498 1991 947 968 605 2001 942 962 614
Notes:
1. Sex ratios are computed as number of females per 1000 number of males. 2. ‘All Naga tribes’ include ‘Other Nagas’ but not ‘Unclassified/ unspecified’ (please see notes to Table 10).
Sources: Govt of India (1975b; 1984b; 1988b; nd1; nd2)
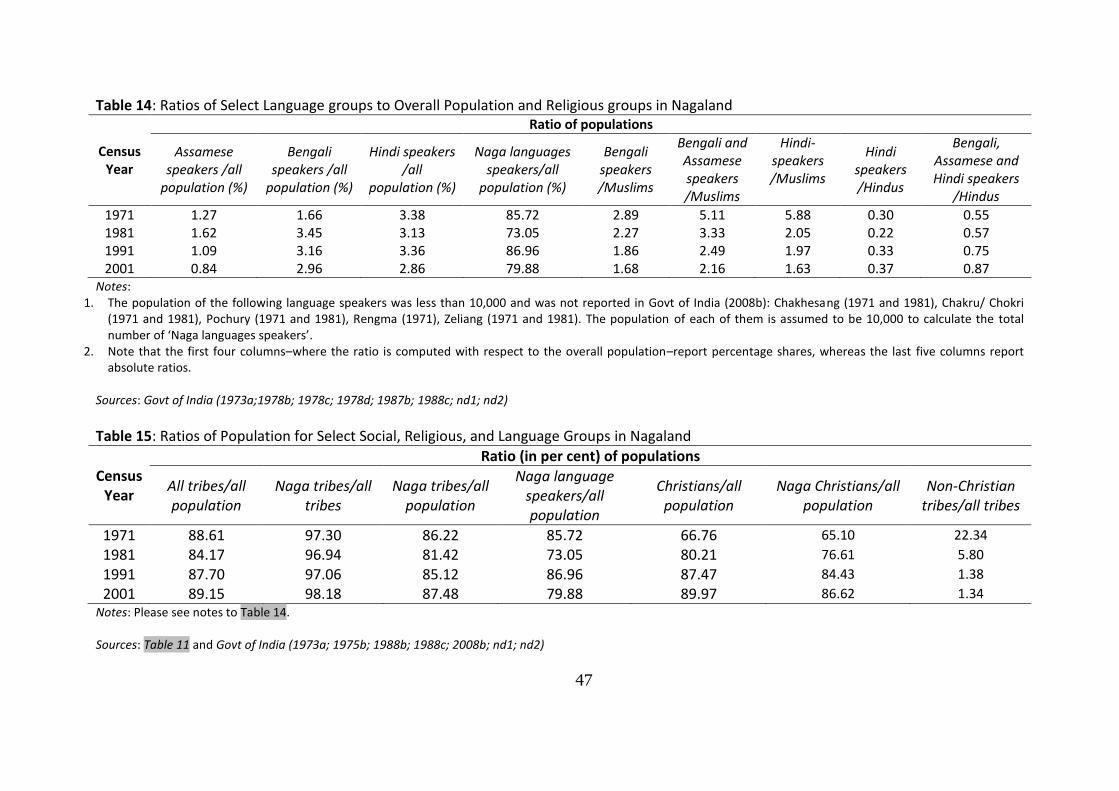
47
Table 14: Ratios of Select Language groups to Overall Population and Religious groups in Nagaland
Census Year
Ratio of populations
Assamese speakers /all
population (%)
Bengali speakers /all
population (%)
Hindi speakers /all
population (%)
Naga languages speakers/all
population (%)
Bengali speakers /Muslims
Bengali and Assamese speakers /Muslims
Hindi-speakers /Muslims
Hindi speakers /Hindus
Bengali, Assamese and Hindi speakers
/Hindus
1971 1.27 1.66 3.38 85.72 2.89 5.11 5.88 0.30 0.55 1981 1.62 3.45 3.13 73.05 2.27 3.33 2.05 0.22 0.57 1991 1.09 3.16 3.36 86.96 1.86 2.49 1.97 0.33 0.75 2001 0.84 2.96 2.86 79.88 1.68 2.16 1.63 0.37 0.87
Notes: 1. The population of the following language speakers was less than 10,000 and was not reported in Govt of India (2008b): Chakhesang (1971 and 1981), Chakru/ Chokri
(1971 and 1981), Pochury (1971 and 1981), Rengma (1971), Zeliang (1971 and 1981). The population of each of them is assumed to be 10,000 to calculate the total number of ‘Naga languages speakers’.
2. Note that the first four columns–where the ratio is computed with respect to the overall population–report percentage shares, whereas the last five columns report absolute ratios.
Sources: Govt of India (1973a;1978b; 1978c; 1978d; 1987b; 1988c; nd1; nd2)
Table 15: Ratios of Population for Select Social, Religious, and Language Groups in Nagaland
Census Year
Ratio (in per cent) of populations
All tribes/all population
Naga tribes/all tribes
Naga tribes/all population
Naga language speakers/all population
Christians/all population
Naga Christians/all population
Non-Christian tribes/all tribes
1971 88.61 97.30 86.22 85.72 66.76 65.10 22.34
1981 84.17 96.94 81.42 73.05 80.21 76.61 5.80
1991 87.70 97.06 85.12 86.96 87.47 84.43 1.38
2001 89.15 98.18 87.48 79.88 89.97 86.62 1.34 Notes: Please see notes to Table 14. Sources: Table 11 and Govt of India (1973a; 1975b; 1988b; 1988c; 2008b; nd1; nd2)
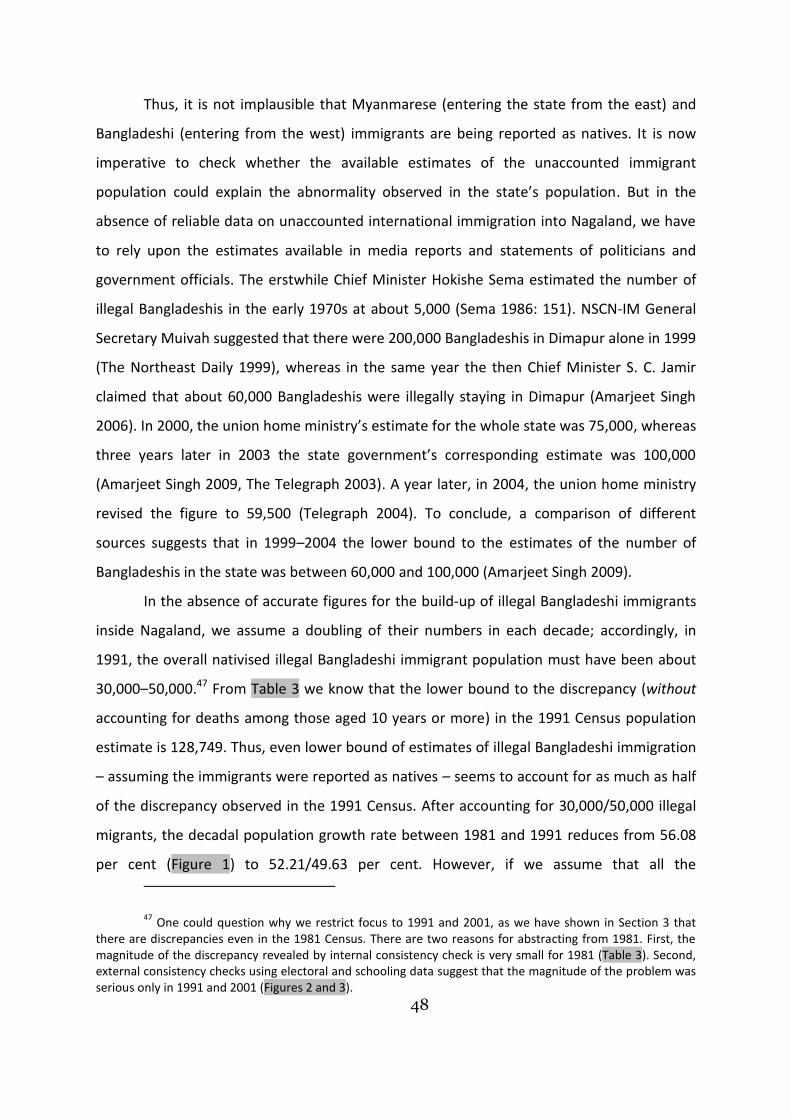
48
Thus, it is not implausible that Myanmarese (entering the state from the east) and
Bangladeshi (entering from the west) immigrants are being reported as natives. It is now
imperative to check whether the available estimates of the unaccounted immigrant
population could explain the abnormality observed in the state’s population. But in the
absence of reliable data on unaccounted international immigration into Nagaland, we have
to rely upon the estimates available in media reports and statements of politicians and
government officials. The erstwhile Chief Minister Hokishe Sema estimated the number of
illegal Bangladeshis in the early 1970s at about 5,000 (Sema 1986: 151). NSCN-IM General
Secretary Muivah suggested that there were 200,000 Bangladeshis in Dimapur alone in 1999
(The Northeast Daily 1999), whereas in the same year the then Chief Minister S. C. Jamir
claimed that about 60,000 Bangladeshis were illegally staying in Dimapur (Amarjeet Singh
2006). In 2000, the union home ministry’s estimate for the whole state was 75,000, whereas
three years later in 2003 the state government’s corresponding estimate was 100,000
(Amarjeet Singh 2009, The Telegraph 2003). A year later, in 2004, the union home ministry
revised the figure to 59,500 (Telegraph 2004). To conclude, a comparison of different
sources suggests that in 1999–2004 the lower bound to the estimates of the number of
Bangladeshis in the state was between 60,000 and 100,000 (Amarjeet Singh 2009).
In the absence of accurate figures for the build-up of illegal Bangladeshi immigrants
inside Nagaland, we assume a doubling of their numbers in each decade; accordingly, in
1991, the overall nativised illegal Bangladeshi immigrant population must have been about
30,000–50,000.47 From Table 3 we know that the lower bound to the discrepancy (without
accounting for deaths among those aged 10 years or more) in the 1991 Census population
estimate is 128,749. Thus, even lower bound of estimates of illegal Bangladeshi immigration
– assuming the immigrants were reported as natives – seems to account for as much as half
of the discrepancy observed in the 1991 Census. After accounting for 30,000/50,000 illegal
migrants, the decadal population growth rate between 1981 and 1991 reduces from 56.08
per cent (Figure 1) to 52.21/49.63 per cent. However, if we assume that all the
47 One could question why we restrict focus to 1991 and 2001, as we have shown in Section 3 that
there are discrepancies even in the 1981 Census. There are two reasons for abstracting from 1981. First, the magnitude of the discrepancy revealed by internal consistency check is very small for 1981 (Table 3). Second, external consistency checks using electoral and schooling data suggest that the magnitude of the problem was serious only in 1991 and 2001 (Figures 2 and 3).
49
60,000/100,000 Bangladeshi immigrants entered Nagaland before (after) 1991, then the
adjusted decadal population growth rate would be 48.34/43.18 (56.08/56.08) per cent.
The adjusted growth rate further declines if we account for possible Myanmarese
influx. Estimates in this case are even more difficult to obtain due to racial similarity and
sympathy for kin divided by the international border. Sumanta Banerjee (1992) cites an
unidentified official estimate of 1,00,000. But as noted above (see Footnote 40) while
almost all our interviewees admitted that the Myanmarese influx, if any, is largely
undocumented and understudied, Banerjee’s figure is implausible. The alternative estimates
suggested by some of our interviewees indicate that at present the numbers could be
around 20,000-25,000. It is not clear if all these immigrants came in the late 1980s and early
1990s or in various waves. If we assume that the former scenario is more likely, then the
estimate of Myanamrese influx in the late 1980s and early 1990s ranges between 20,000
and 1,00,000 and the corresponding adjusted growth rates for the period 1981–91 are 47.05
and 36.73 per cent, respectively.48 The unaccounted international immigration-adjusted
estimates of population growth rate compare favourably with discrepancy-adjusted growth
rates estimated in Table 3). But it bears noting that positive results arrived at in this section
using anecdotal evidence does not conclusively prove that international immigrants are
indeed being indigenized.
6.2 Politics as a zero–sum game
Horowitz’s global survey of ethnic conflicts draws attention to the inter-relationship among
ethnic conflict, elections, and politicisation of censuses, which reduces politics and census in
ethnically divided societies to zero-sum number games. He notes:
As an entitlement issue, the census is a splendid example of the blending of
group anxiety with political domination. On the one hand, it is common to
encounter anxiety–laden perceptions of fecundity or illegal immigration of
competing groups; these produce considerable overestimates of the population of
48 In addition to the Myanmarese immigrants, each of these growth rates account for 50,000
Bangladeshi immigrants as well.
50
outgroups. … On the other hand, since numbers count in the quest for political
domination, the hope of a group is to enlarge its relative share of the population ….
Disputes over census results in ethnically divided societies are common ….In a
severely divided society, we have seen that an election can become an ethnic head
count. Now it is clear that a census needs to be ‘won.’ So the election is a census,
and the census is an election. (Horowitz 2000: 194–196, 326; emphasis added)
Horowitz’s argument can be referred to as a political–economic explanation of
manipulation of census, which relates to the Nagaland Chief Minister Neiphiu Rio’s claim
that inter-community struggles for political representation and public resources were
responsible for abnormal population growth recorded in the 2001 Census. Horowitz (2000:
194–196, 326) suggests that in such cases politicisation of the head count can manifest itself
in one or more of the following: (1) movements against ‘outsiders’; (2) very high voter
turnouts; (3) separatism (demands for partition of state); (4) demands for proportional
representation in bureaucracy and legislature; and (5) manipulation of census results. The
first four manifestations are evident in the case of Nagaland. There have been movements
against ‘outsiders’ in the state (Northeast Today 2012a; Amarjeet Singh 2009; Nag 2002).
Table 7 shows that Nagaland’s voter turnouts have exceeded the national average by a wide
margin in the past decades. The third, namely, demand for partition, manifests itself as
demands for separate states for backward and/or minority ethnic groups like the Eastern
Nagas, Zeliangrong Nagas, and Kacharis (Hindustan Times 2011; NENA 2011a). In addition,
there has been stiff ethnic competition for quotas in educational institutions and
government jobs (NENA 2011a; Sentinel 2012; Assam Tribune 2010; Morung Express 2011;
Means 1971). The last—manipulation of census—is demonstrated below first through the
admissions of key political players in the state and then through computations based on the
last three decennial censuses.
In 2005, Mr. Rio admitted that the population was inflated in the 2001 Census due to
struggle for political representation:
All this is because of competition among the tribes, between districts …. The
delimitation commission process [of distributing seats in proportion to population] is
also creating problems because some districts are losing seats and Dimapur is
51
gaining five seats. Mokokchung seats are dropping by three, Phek will have one less
and so on. (Hazarika 2005, emphasis added; also see The Assam Tribune 2011;
Nagaland Post 2009; Delimitation Commission of India 2008: 50, 1060)
The Naga Hoho, the apex tribal council, admitted as much when it noted that ‘the
Census has been a much misunderstood exercise in Nagaland with the people equating it
with the electoral roll listing’ (Eastern Panorama 2011). The Director of Census Operations,
Nagaland throws more light on the causes of inflation and adds an economic aspect to the
political aspect highlighted by Rio:
Many equate it with electoral rolls and saw the decennial Census exercise as
an opportunity to … increase [the] vote bank …. [The d]evelopmental model followed
in the State in which allocation of funds … is made on the basis of population …
naturally led many to try and increase the fund flow into their villages by showing
non-existing population and households in the Census records. (Govt of India 2011b:
viii)
It bears noting that during the last delimitation of electoral constituencies in the
1970s, two assembly seats were transferred to Dimapur from the hill districts. Since then,
the disparity in the sizes of constituencies has grown tremendously. In 2003, the last
assembly election before Hazarika (2005) interviewed Rio, the largest constituency Ghaspani
I (Dimapur district) had 54,402 voters, whereas the smallest Mokokchung Town
(Mokokchung district) had 4,963 voters. This disparity indicates the excessive political power
wielded by voters in the hills. Since most ethnic communities are geographically
concentrated, the disparity in voting power gives an idea of the scale of inter-community
disparity and the potential for ethnic conflict due to delimitation between the groups
favouring status quo and those demanding rectification of imbalances. Until the late 1990s,
conditions were not conducive for the growth of the private sector and the state was the
biggest actor in Nagaland’s economy; these intensified the competition for public

52
resources.49 In a state generally lacking in economic development, Dimapur, the only plains
district of the state, was the locus of competition because historically it has been the most
developed district and transport hub of Nagaland.
Now it is understandable why the Chief Minister believes the conflict between
Dimapur district and the hill districts was the driving force behind the manipulation of
census. The hills–plains dichotomy is coterminous with the Naga–non-Naga divide. Our
analysis shows that based on the 1991 Census, the 2002 Delimitation would have
transferred five seats to the district of Dimapur (Table 16).50
49 Nagaland continues to be a special category state that receives as much as 90 per cent of its plan
assistance as grants from the central government. In 2006–07, central grants and loans and debt from RBI, etc. accounted for 86.36 per cent of the state’s receipts (Govt of Nagaland nd).
50 The Delimitation Commission had awarded nine seats to Dimapur, which is equivalent to a gain of
four seats compared to five seats as per our calculations (see Annexure to the letter of Sumit Mukherjee, Under Secretary, Delimitation Commission, dated 4 August 2005 addressed to the Commissioner of Nagaland) (The Chakhesang Public Organisation & Ors. vs. Union of India & Ors., W.P. No. 67 of 2006: 48, 80–81). The difference of one seat can be explained by the fact that we have used the population above 18 years, whereas the Delimitation Commission has used the entire population in its calculations. Since Dimapur has a large migrant population compared to other districts and most of these migrants are economic migrants (and are, therefore, more likely than not to be above 18 years of age), Dimapur’s share in the state’s above-18 years population exceeds its share in the overall population.

53
Table 16: Estimated number of seats and loss therein in State Legislative Assembly (SLA)
Characteristic Dimapur Rest of the state
Existing seats in SLA 5 55 Census Year 1991
Population (18+) 97768 575803 Population share 0.15 0.85 Projected seats in SLA 9 51 Loss of seats -4 4
Census Year 2001 Population (18+) 175579 931394
Population share 0.16 0.84 Projected seats in SLA 10 50 Loss of seats -5 5 Growth of total population (1991-2001) 73.66 62.95
Census Year 2011 Population (18+) 215774 886469 Population share 0.20 0.80 Projected seats in SLA 12 48 Loss of seats -7 7 Growth of total population (2001-2011) 22.89 -4.77
Notes: ‘Existing seats in SLA’ are the number of seats in the present SLA allotted on the basis of the 1971 Census. ‘Projected seats in SLA’ for a census year is the number of seats estimated using the ‘Population share’ from the corresponding census. ‘Loss of seats’ for a census year is the difference between ‘Existing seats’ and ‘Projected seats in SLA’ for that year. For 2011, detailed population estimates by age are not yet available hence the same is derived assuming the share of population aged 18 years and more in 2001. Sources: Delimitation Commission of India (2008) for ‘Existing seats in SLA’ and Govt of India (nd1; nd2) for ‘Population (18+)’.
So, threatened by the possibility of loss of political representation, the hill tribes
inflated their numbers in the 2001 Census; the Dimapur-based tribes also inflated their
population. While hill districts like Tuensang and Wokha were able to increase their seats,
the hill districts as a whole did not gain from inflation. Since the tribes were not all equally
successful at false enumeration, the Census triggered conflict and litigation (for instance,
Chakhesang Public Organisation & Ors. vs. Union of India & Ors., W.P. No. 67 of 2006;
Telegraph 2008). In 2008, an Ordinance deferred delimitation in Nagaland (and Manipur,
Assam, and Arunachal Pradesh) to until after the first census after 2026, i.e., 2031 (Govt of
India 2008). So, after 2008 there was no incentive to inflate population count in Nagaland.
Moreover, the government was alert to the possibility of subversion of its data collection
exercises.

54
As pointed out earlier, a sample survey in 2009 revealed that population fell across
the hill districts, where the 2001 population was heavily inflated (Nagaland Post 2009). This
was confirmed later in the 2011 Census that recorded a negative growth rate of 5 per cent
in the hill districts, whereas growth remained positive in Dimapur (Table 16). In other words,
the deflation in Nagaland’s 2011 population is restricted entirely to the hills. So, while the
inflation in the 2001 Census can be attributed to the expected loss of political
representation due to the impending delimitation, the deflation of population in the 2011
Census too is related to the inflation in the preceding decade insofar as only the hills
witnessed a negative growth rate. Interestingly, if delimitation is conducted as per the 2011
Census, then Dimapur will gain seven seats at the expense of the hill districts.
In Table 3, we showed that after accounting for discrepancies Nagaland’s population
had grown at the decadal rate of 39.47 per cent during the 1981–91 decade. Since
socioeconomic correlates of fertility continued to improve (Table 1) a decrease rather than
further increase in growth rate was expected in the next census decade (1991–2001).
Assuming that the entire increase in the population growth rate during 1991–2001 over and
above the discrepancy-adjusted growth rate observed in the preceding decade can be
attributed to the politically-motivated manipulation of the Census (i.e., the actual
population growth rate in 1991–2001 was equal to the adjusted growth rate for 1981–91),
the true population in 2001 should have been 1,686,957. (If we adjust this figure for
Bangladeshi immigration, then the true population would lie between 1,716,957 and
1,786,957.)51 This revised estimate for Nagaland’s population in 2001 is close to erstwhile
Manipur Chief Minister Radhabinod Koijam’s estimate of 1.6 million (Koijam 2001). Under
the above assumption, the discrepancy in the 2001 Census works out to be 303,079 (or,
2,73,079 and 2,71,079, respectively, if adjusted for Bangladeshi immigrants), which is a
lower bound to the actual discrepancy because improvements in socio–economic
conditions, by reducing fertility, should have translated into a lower population growth rate
51 The estimates of the number of Bangladeshi immigrants vary between 60,000 and 100,000. The
immigrants could have entered into the state's territory either entirely before 1991 or continuously. In the latter case, it is assumed that the immigrant population doubles every year. Thus, the following four scenarios are possible: (i) 100,000 immigrants, all before 1991, (ii) 60,000 immigrants, all before 1991, (iii) 50,000 immigrants each in the pre- and post-1991 periods, and (iv) 30,000 immigrants each in the pre- and post-1991 periods. The growth estimates given above correspond to the extreme scenarios.
55
during 1991–2001 compared to 1981–91. The discrepancy calculated here is comparable to
the estimate of discrepancy for 1991-2001 (viz., 345,073) computed based on internal
consistency checks (Table 3).
7. Concluding Remarks
Developing countries like India need information on the socioeconomic division of their
populations to design redistributive policies. And, given their obsession with global rankings,
they also need information to compare themselves with other countries. But India’s official
statistics are not free of errors (Agrawal and Kumar 2012a). The Census of India is a case in
point. This paper examined a largely ignored surprise thrown up by the 2011 Census of
India, one of the biggest data collection exercises in the world, which shows that after
decades of abnormally high growth the population of Nagaland decreased in absolute terms
during 2001–11. This is unprecedented in the history of independent India.
Internal consistency checks revealed that the Census overestimated the state’s
population between 1981 and 2001. We also verified the Census estimates using
information on birth and death rates from other surveys like NFHS and SRS, the child
population from gross school enrolment data, and the adult population from the archives of
the Election Commission of India. But the Census population estimates did not withstand
external scrutiny either. We concluded that births, deaths, and lawful migration alone are
insufficient to explain Nagaland’s demographic somersault and, therefore, other factors
need to be examined. We then ruled out enumeration errors due to insurgency and war, the
growing reach of administration and the Census in remote areas, and multiple counting as
potential explanations.
So, there are genuine reasons to believe that earlier censuses overestimated
Nagaland’s population. We then explored other explanations of abnormalities in the Census
of Nagaland. Our analysis indicated that the discrepancy in the census population estimate
of 1991 could possibly be accounted for mostly by unaccounted international immigrants
from Bangladesh and, possibly, Myanmar. On the other hand, a substantial portion of the
discrepancy in the 2001 Census could possibly be attributed to the deliberate inflation of

56
population figures to avoid potential loss of seats due to the impending delimitation of
electoral constituencies.
While we discussed only the case of Nagaland in the context of politicisation of the
Census, the Naga-dominated hill districts of the neighbouring state of Manipur also
witnessed manipulation of its Naga population in the 2001 Census (Laithangbam 2004).
Furthermore, Nagaland was not the only state in which the 2002 Delimitation proved to be
contentious—it could not be conducted in the North Eastern states of Arunachal Pradesh,
Assam, or Manipur, and could not be implemented in Jharkhand although it was conducted.
In all these states, the government was forced to defer delimitation to 2031 (‘on the basis of
the first census after the year 2026’). Future work should examine the political economy
within which official statistics are generated and disseminated, which in turn will help better
understand the interaction between census and electoral processes and the process
through which the manipulation of census could be affected.

57
References
Agrawal, Ankush and Vikas Kumar. 2012a. "How reliable are India’s official statistics?" East
Asia Forum: April 06. Available at http://www.eastasiaforum.org/2012/04/06/nagaland-s-
demographic-somersault-how-reliable-are-india-s-official-statistics/ (last accessed on May
11, 2012)
Agrawal, Ankush and Vikas Kumar. 2012b. "Nagaland’s Demographic Somersault." IEG
Working Paper No 311. Institute of Economic Growth: Delhi.
Agrawal, Ankush and Vikas Kumar. 2012c. "Number games in Nagaland." The Hindu, July 12,
p. 11 (Corrigendum July 14, p. 13)
Agrawal, Ankush and Vikas Kumar. 2012d. "The Political Economy of Nagaland’s
Demographic Somersault." IEG Working Paper forthcoming. Institute of Economic Growth:
Delhi.
Ahonsi, Babatunde A. 1988. "Deliberate Falsification and Census Data in Nigeria." African
Affairs, 87:349, pp. 553-62.
Alesina, Alberto, William Easterly, and Janina Matuszeski. 2006. "Artificial States." NBER
Working Paper No 12328. National Bureau of Economic Research: Cambridge.
Amarjeet Singh, M. 2006. "Nagaland: Another Bangladeshi Destination." Outlook, August 11.
Available at http://www.outlookindia.com/article.aspx?232159 (last accessed on June 21,
2012)
Amarjeet Singh, M. 2009. "A Study on Illegal Immigration into North-East India: The Case of
Nagaland." IDSA Occasional Paper No. 8. Institute for Defence Studies and Analyses: New
Delhi.
Anker, R. 1978. "An Analysis of Fertility Differentials in Developing Countries." The Review of
Economics and Statistics, 60:1, pp. 58–69.
Anderson, James, Ian Shuttleworth, Chris Lloyd, and Owen McEldowney. nd. "Political
demography: the Northern Ireland Census, discourse and territoriality." Available at
www.esds.ac.uk/doc/5362%5Cmrdoc%5Cpdf%5Cq5362uguide.pdf (last accessed on June
16, 2012)

58
Assam Tribune. 2009. "Nagaland discards last 4 Census reports."October 04. Available at
http://www.assamtribune.com/scripts/details.asp?id=oct0409/ne1 (last accessed on April
29, 2012).
Assam Tribune. 2010. "Hearing on Nagaland job reservation policy." October 06. Available at
http://www.assamtribune.com/scripts/detailsnew.asp?id=oct0610/oth07 (last accessed on
February 18, 2012)
Assam Tribune. 2011. "PC keeps mum on population growth." April 02. Available at
http://www.assamtribune.com/scripts/detailsnew.asp?id=apr0211/at09 (last accessed on
June 23, 2012)
Assam Tribune. 2012. "Indo-Myanmar border policy working well: Rio." February 01.
Available at http://www.assamtribune.com/scripts/detailsnew.asp?id=feb0212/oth06 (last
accessed on February 27, 2012)
Banerjee, Sumanta. 1992. "Dangerous Game in Nagaland." Economic and Political Weekly,
XXVII: 29, pp. 1525-27.
Barro, R J and X Sala-i-Martin. 2004. Economic Growth. Cambridge, Massachusetts: The MIT
Press.
Bezboruah, D N. 2006. "Illegal migration from Bangladesh," in Illegal migration from
Bangladesh. Braja Bihari Kumara ed. Delhi: Astha Bharati.
Bhowmik, K L, M K Chowdhuri, Pruranjan Das, and K K Chaudhuri. 1971. Fertility of Zemi
Women in Nagaland. Calcutta: Institute of Social Studies.
Biemer, Paul P and Lars E Lyberg. 2003. Introduction to Survey Quality. Hoboken, New
Jersey: John Wiley & Sons, Inc.
Black, Robert W. 1985. "Instead of the 1986 Census: The Potential Contribution of Enhanced
Electoral Registers." Journal of the Royal Statistical Society. Series A (General), 148:4, pp.
287-316.
Bongaarts, John and Susan Cotts Watkins. 1996. "Social interactions and contemporary
fertility transitions." Population and Development Review, 22:4, pp. 639-82.
Breiman, Leo. 1994. "The 1991 Census Adjustment: Undercount or Bad Data?" Statistical
Science, 9:4, pp. 458-75.
59
Chakhesang Public Organization & Ors. vs. Union of India & Ors., W.P. No. 67 of 2006.
Chaurasia, A R. 2011. "Population Growth in India during 2001-2011: An Analysis of
Provisional Results of 2011 Population Census." Studies in Population and Development, No
11-02. Shyam Institute: Bhopal. Available at
http://shyaminstitute.in/yahoo_site_admin/assets/docs/11_02.91173244.pdf
(last accessed on March 19, 2012)
Delimitation Commission of India. 2008. "Changing Face of Electoral India: Delimitation
2008, Volumes I & II." Delimitation Commission of India: New Delhi.
Dev, Rajesh. 2003. "More Space for Democratic Politics." Economic and Political Weekly,
38:17, pp. 1637-40.
Dey, Sanku and Sankar Goswami. 2009. "Fertility Pattern and Its Correlates in North East
India." Journal of Human Ecology, 26:2, pp. 145-52.
Dreze, J and M Murthi. 2001. "Fertility, Education, and Development: Evidence from India."
Population and Development Review, 27:1, pp. 33–63.
Eastern Panorma. 2011. "Nagaland census 2011 begins." July. Available at
http://www.easternpanorama.in/index.php?option=com_content&view=article&id=1065:n
agaland-census-2011-begins&catid=59:july (last accessed on February 13, 2012)
Eaton, Richard M. 1984. "Conversion to Christianity among the Nagas, 1876-1971." Indian
Economic Social History Review, 21:1, pp. 1-44.
ECI. 2006. "Compendium of Instructions on Electoral Rolls, EPIC, SLAs & Computerisation
2006 (Upto May 2006)." Election Commission of India: New Delhi.
ECI. nd1. "A guide for the Voters." Election Commission of India: New Delhi. Available at
http://eci.nic.in/eci_main/ECI_voters_guideline_2006.pdf (last accessed on April 30, 2012)
ECI. nd2. "FAQs - Electoral Rolls." Election Commission of India: New Delhi. Available at
http://eci.nic.in/eci_main1/Elecroll.aspx (last accessed on April 30, 2012)
Englebert, Pierre, Stacy Tarango, and Matthew Carter. 2002. "Dismemberment and
Suffocation: A Contribution to the Debate on African Boundaries." Comparative Political
Studies, 35, pp. 1093-118.
60
Freedman, D. and K. Wachter. 1994. "Heterogeneity and Census Adjustment for the
Intercensal Base." Statistical Science, 9:4, pp. 476-85.
Geological Survey of India. 2011. "Geology and Mineral Resources of Manipur, Mizoram, Nagaland and Tripura." Vol. Miscellaneous Publication, No. 30, Part IV, Vol 1 (Part-2). Geological Survey of India: Kolkata. Gill, Mehar Singh. 2007. "Politics of Population Census Data in India." Economic and Political Weekly, 42:3, pp. 241-49. Gogoi, Nitin. 2001. "Nagaland may face brunt of illegal migration from Bangladesh.” Rediff
News. Available at http://ia.rediff.com/news/2001/mar/27assam.htm (last accessed on Sept
11, 2011)
Govt of India. 1953a. "Census of India 1951, Paper No. 1 of 1953, Sample Verification of the 1951 Census Count." Registrar General, India: Delhi. Govt of India. 1953b. "Census of India 1951, Volume I India, Part I - A - Report." Registrar General, India: New Delhi.
Govt of India. 1973a."Census of India 1971, Series 15, A Portrait of Population Nagaland."Director of Census Operations, Nagaland and Registrar General, India. Govt of India. 1973b. "Census of India 1971, Series 15 Nagaland, Part II - A, General Population Tables." Director of Census Operations: Kohima.
Govt of India. 1975a. "Census of India 1971, Series 1, India, Part II-A (i) General Population
Tables." Registrar General and Census Commissioner, India.
Govt of India. 1975b. "Census of India 1971, Series 15, Nagaland, Part II-C(i), Social and
Cultural Tables (Tables C-VII and C-VIII Part B with their Appendices) and Special Tables on
Scheduled Tribes (Table ST-I to ST-V)." Director of Census Operations, Nagaland: Kohima.
Govt of India. 1976a. "Census of India 1971, Series 1, India, Part II-C(ii), Social and Cultural
Tables (Table C-II, C-III Part A & B and C-IV)." Registrar General and Census Commissioner,
India.
Govt of India. 1976b. "Census of India 1971, Series 15, Nagaland, Part II D, Migration
Tables." Director of Census Operations, Nagaland.

61
Govt of India. 1977. "Census of India 1971, Series 1 - India, Part II - D (i), Migration Tables
(Tables D-I to D-IV)." Registrar General and Census Commissioner India.
Govt of India. 1978a. "Census of India 1971, India Series 1, paper 1 of 1979, Report of the
Expert Committee on Population Projections." Demography Division, Office of the Registrar
General of India, Ministry of Home Affairs: New Delhi.
Govt of India. 1978b. "Census of India 1971, Series 15 Nagaland, District Census Handbook,
Part X-C, Kohima District." Director of Census Operations, Nagaland: Kohima.
Govt of India. 1978c. "Census of India 1971, Series 15 Nagaland, District Census Handbook,
Part X-C, Mokokchung District." Director of Census Operations, Nagaland: Kohima.
Govt of India. 1978d. "Census of India 1971, Series 15 Nagaland, District Census Handbook,
Part X-C, Tuensang District." Director of Census Operations, Nagaland: Kohima.
Govt of India. 1984a. "Census of India 1981, Series 15 Nagaland, Part II - A, General
Population Tables." Director of Census Operations: Kohima.
Govt of India. 1984b. "Census of India 1981, India Series 1, Paper 4 of 1984, Household
Population by Religion of Head of Household." Registrar General, India: New Delhi.
Govt of India. 1985a. "Census of India 1981, Series 1 India, Part II - A (i), General Population
Tables." Registrar General and Census Commissioner, India: New Delhi.
Govt of India. 1985b. "Census of India 1981, Series 15, Nagaland, Part - V A & B, Migration
Tables." Director of Census Operations, Nagaland.
Govt of India. 1987a. "Census of India 1981, Series 1 India, Part IV-A, Social and Cultural
Tables (Table C-1 to C-6)." Registrar General and Census Commissioner, India: New Delhi.
Govt of India. 1987b. "Census of India 1981, Series 15, Nagaland, Households and Household
Population by Language Mainly Spoken in the Household, Paper 1 of 1987." Director of
Census Operations, Nagaland: Kohima.
Govt of India. 1988a. "Census of India 1981, Series 1 - India, Part V-A & B (i), Migration
Tables (Table D-1 and D-2)." Registrar General and Census Commissioner India.
Govt of India. 1988b. "Census of India 1981, Series 15 - Nagaland, Part IX, Special Tables for
Scheduled Tribes." Registrar General and Census Commissioner India.

62
Govt of India. 1988c. "Census of India 1981, A Portrait of Population Nagaland." Director of
Census Operations, Nagaland, Kohima and Registrar General, India, New Delhi.
Govt of India. 1989. "The Constitution (Sixty-first Amendment) Act, 1988." Available at
http://india.gov.in/govt/documents/amendment/amend61.htm (last accessed on April 30,
2012)
Govt of India. 1992. "Census of India 1991, Series 1 India, Paper 1 of 1992, Volume I, Final
Population Totals." Registrar General, India: New Delhi.
Govt of India. 1995. "Census of India 1991, Series 15, Manipur, Part II-A General Population
Tables." Directorate of Census Operations, Manipur.
Govt of India. 1996. "Census of India 1991, Population Projections for India and States 1996-
2016, Report of the Technical Group on Population Projections Constituted by the Planning
Commission." Registrar General, India, Ministry of Home Affairs: New Delhi.
Govt of India. 1997a. "Census of India 1991 Series-1 India, Part V- D Series, Migration Tables,
Volume 2 Part 1." Registrar General and Census Commissioner India.
Govt of India. 1997b. "Census of India 1991 Series 1 India, Part V- D Series, Migration Tables,
Volume 2 Part 2." Registrar General and Census Commissioner India.
Govt of India. 1997c. "District Level Estimates of Fertility and Child Mortality for 1991 and
Their Inter Relations with Other Variables, Occasional Paper No 1 of 1997." Registrar
General, India: New Delhi.
Govt of India. 1998. "Census of India 1991, Series 18, Nagaland, Part II-A General Population
Tables." Directorate of Census Operations, Nagaland: Kohima.
Govt of India. 1999a. "Census of India 1991 Non Workers in India: An Analysis of the 1991
Census Data." Registrar General, India: New Delhi.
Govt of India. 1999b. "Compendium of India's Fertility and Mortality Indicators 1971-1997
based on the Sample Registration System (SRS)." Registrar General, India: New Delhi.
Govt of India. 1999c. "Sample Registration System Bulletin." Vol. 33. No 2 (October)
Registrar General, India: New Delhi.
63
Govt of India. 2002. "National Human Development Report 2001." Planning Commission:
New Delhi.
Govt of India. 2005. "General Population Tables: India, States and Union Territories (Tables
A-1 to A-3), Part-1." Office of the Registrar General and Census Commissioner, India: New
Delhi.
Govt of India. 2006a. "Population Projections for India and States 2001-2026, Report of the
Technical Group on Population Projections Constituted By the National Commission on
Population." Office of the Registrar General & Census Commissioner, India: New Delhi.
Govt of India. 2006b. "Report On Post Enumeration Survey." Office of the Registrar General
and Census Commissioner, India: New Delhi.
Govt of India. 2008a. "Census of India 2001 Workers and Non Workers - An Analysis based
on 2001 Census." Office of the Registrar General and Census Commissioner, Ministry of
Home Affairs: New Delhi.
Govt of India. 2008b. " Census of India 2001, Series 1-India, Language: India, States and UTs,
Table C-18." Office of the Registrar General, India: New Delhi.
Govt of India. 2008c. "The Gazette of India Extraordinary, Part II - Section 3 - Sub-section (ii),
No 189, February 8, 2008." Legislative Department, Ministry of Law and Justice: New Delhi.
Govt of India. 2009. "The Gazette of India Extraordinary, Part II - Section 1, No 39, August
27, 2009." Legislative Department, Ministry of Law and Justice: New Delhi.
Govt of India. 2011a. "Census of India 2011, Provisional Population Totals, Paper 1 of 2011,
Series 1 India." Office of the Registrar General and Census Commissioner, India: New Delhi.
Govt of India. 2011b. "Census of India 2011, Provisional Population Totals, Paper 1 of 2011,
Series 14 Nagaland." Directorate of Census Operations Nagaland: Kohima.
Govt of India. 2011c. "Census of India 2011, Provisional Population Totals, Paper 2, Volume
1 of 2011, Rural-Urban Distribution, Series 14 Nagaland." Directorate of Census Operations
Nagaland: Kohima.
Govt of India. 2011d. "The Constitution of India (As on 1st December, 2011)." Ministry of
Law and Justice. Available at http://lawmin.nic.in/olwing/coi/coi-english/coi-
indexenglish.htm (last accessed on May 21, 2012)

64
Govt of India. 2011e. "Economic Survey 2010-11." Ministry of Finance, Govt of India: New
Delhi. Available at http://indiabudget.nic.in/budget2011-2012/survey.asp (last accessed on
March 19, 2012)
Govt of India. 2011g. "Census of India 2011, Provisional Population Totals, Paper 1 of 2011,
Series 25 Gujarat." Directorate of Census Operations, Gujarat: Ahmadabad.
Govt of India. 2012a. "Household Consumption of Various Goods and Services in India,
Report No. 541 (66/1.0/3), NSS 66th Round, July 2009 - June 2010." National Sample Survey
Office, Ministry of Statistics and Programme Implementation: New Delhi.
Govt of India. 2012b. "SRS Statistical Report 2010." Office of the Registrar General, India,
Ministry of Home Affairs: New Delhi.
Govt of India. nd1. "Census of India 1991, Provisional Population Totals for India and
Nagaland, Series C” Database available as CD.
Govt of India. nd2. "Census of India 2001, Provisional Population Totals for India and
Nagaland, Series C” Database available as CD
Govt of India. nd5. "Enumeration of Primitive Tribes in A&N Islands – A Challenge." Drop-in-
Article on Census - No.6. Available at
http://www.censusindia.gov.in/Ad_Campaign/drop_in_articles/06-
Enumeration_of_Primitive_Tribes_in_A&N_Islands.pdf (last accessed on May 05, 2012)
Govt of Nagaland. 2009a. "Rural-Urban Migration: A Thematic Report 2009." Department of
Planning and Coordination, Government of Nagaland: Kohima.
Govt of Nagaland. 2009b. "Resolutions adopted in the Consultative Meeting on Census-2011
held at the Zonal Council Hall, Kohima, on 30th September, 2009." (Photocopy obtained from
the Director of Census Operations, Nagaland)
Govt of Nagaland. 2011. "District Human Development Report Mon 2009." Department of
Planning and Coordination, Government of Nagaland: Kohima.
Govt of Nagaland. 2012. "Statistical Handbook of Nagaland 2011." Directorate of Economics
and Statistics, Government of Nagaland: Kohima.

65
Govt of Nagaland. nd. "Budget Speech." Department of Finance. Available at
http://finngl.nic.in/Budget%20Speech/BUDGET2006.pdf (last accessed on June 23, 2012)
Guilmoto, Christophe Z and S Irudaya Rajan. 2002. "District Level Estimates of Fertility from
India’s 2001 Census." Economic and Political Weekly, 37:7, pp. 665-72.
Gujarati, D N. 2005. Basic Econometrics. Second Edition. New Delhi: McGraw-Hill Book
Company.
Hazarika, Sanjoy. 2000. Rites of Passage: Border Crossing, Imagined Homelands, India's East
and Bangladesh. New Delhi: Penguin Books.
Hazarika, Sanjoy. 2005. "Rio tosses interim solution idea." The Statesman. December 24.
Herbst, Jeffrey. 2000. States and Power in Africa: Comparative Lessons in Authority and
Control. New Jersey: Princeton University Press.
Hindustan Times. 2011. "Telengana Effect? Divide Nagaland demand intensifies." Available
at http://www.hindustantimes.com/StoryPage/Print/647505.aspx (last accessed on June 15,
2012)
Hirschman, Charles. 1986. "The Recent Rise in Malay Fertility: A New Trend or a Temporary
Lull in a Fertility Transition." Demography, 23:2, pp. 161-84.
Horowitz, Donald L. 2000. Ethnic Groups in Conflict. Second Edition. Berkeley: University of
California Press.
Indian Express. 2011. "Nagaland minus an old defect."April 01. Available at
http://www.indianexpress.com/news/nagaland-minus-an-old-defect/770004/0 (accessed
last on April 29, 2012)
Indiastat. nd. Tables on Gross School Enrolment (Primary and Secondary standards). Data
retrieved from www.indiastat.com (original source: Ministry of Human resource
Development, Govt of India)
IIPS and MI. 2007. National Family Health Survey (NFHS-3), 2005–06: India: Vols I and II.
International Institute for Population Sciences: Mumbai and Macro International.
IIPS and MI. 2009. National Family Health Survey (NFHS-3), India, 2005-06: Nagaland.
International Institute for Population Sciences: Mumbai and Macro International.

66
Janus, Thorsten. forthcoming. "The Political Economy of Fertility." Public Choice.
Jeermison, R K. 2011. "Politics of Population Growth in Nagaland." Available at http://e-
pao.net/epSubPageExtractor.asp?src=manipur.Census_of_Manipur.Politics_of_Population_
Growth_in_Nagaland (last accessed January 07, 2012)
Kaufmann, Eric. 2011. "Demographic Change and Conflict in Northern Ireland: Reconciling
Qualitative and Quantitative Evidence." Ethnopolitics, 10:3-4, pp. 369-89.
Koijam, Radhabinod. 2001. "Naga ceasefire and Manipur." The Hindu: July 13. Available at
http://www.hindu.com/2001/07/13/stories/05132524.htm (last accessed on June 23, 2012)
Kulkarni, Sharad. 1991. "Distortion of Census Data on Scheduled Tribes." Economic and
Political Weekly, 26:5, pp. 205-08.
Kumar, Sanjay and N K Sharma. 2006. "Riddle of Population Growth Deceleration in Andhra
Pradesh during 1991-2001." Economic and Political Weekly, 41:42, pp. 4507-12.
Kumar, Vikas. 2005. "The Historical Background of the Demand for ‘Greater Nagaland."
Mainstream, XLIII: 10, February 26, pp. 15-18.
Kundu, A and D Kundu. 2011. " The Census and the 'development' myth." Business Standard.
April 08. Available at http://www.business-standard.com/india/news/amitabh-
kundudebolina-kunducensusthe-%5Cdevelopment%5C-myth/431360/ (last accessed on
March 23, 2012)
Laithangbam, Iboyaima. 2004. "Naga tribal council plans blockade." The Hindu: Nov 13.
Available at http://www.hindu.com/2004/11/13/stories/2004111301591300.htm (last
accessed on April 29, 2012)
Lokniti. 2008. "On Nagaland Assembly Election 2008." Centre for the Study of Developing
Societies: New Delhi.
Lwin, Saw Min. 2003. "The General Situation of Migrant Workers from Burma." The Human
Rights Solidarity, 13:4-5. Available at
http://www.hrsolidarity.net/mainfile.php/2003vol13no04-05/2294/ (last accessed on June
15, 2012)
Means, G P. 1971. "Cease-Fire Politics in Nagaland." Asian Survey, 11:10, pp. 1005–28.
67
Morung Express. 2011. "On Job Reservation among Nagas." Available at
http://www.morungexpress.com/editorial/63436.html (last accessed on February 14, 2012)
Murry, Benrithung, M. P. Sachdeva, and A. K. Kalla. 2005. "Estimates of Fertility and
Mortality Differentials among the Lotha Nagas of Nagaland." Anthropologist, 7:1, pp. 45-52.
MyDimapur.com. 2010. "Rio presents deficit budget; total deficit for 2010-11 at rs.603.64
cr." July 22. Available at http://www.mydimapur.com/content/view/649/ (last accessed on
June 23, 2012)
Nachane, D. M. ed. 2011. India Development Report. 2011. New Delhi: Oxford University
Press.
Nag, Sajal. 2002. Contesting Marginality: Ethnicity, Insurgency and Sub-nationalism in North-
East India. New Delhi: Manohar Publishers and Distributors.
Nagaland Post. 2009. "Nagaland’s inflated census." Nagaland Post, September 20. Available
at http://www.nagalandpost.com/ShowStory.aspx?npoststoryiden=UzEwMTczNTc%3D-
yM3AkZLK3uc%3D (last accessed on January 07, 2012)
Nagaland Post. 2012. “Naga woman gang raped; 4 arrested.” Nagaland Post, February 10.
Available at
http://www.nagalandpost.com/ChannelNews/State/StateNews.aspx?news=TkVXUzEwMDA
xMzMwNQ%3D%3D-eR5JbBag54U%3D (last accessed on June 14, 2012)
Narendra Singh, Kh. 2005. "Some Socioeconomic Correlates of Fertility: Exploring RCH data
from Nagaland." Tribal Health Bulletin, 11:1 & 2, pp. 38-44.
Narasimhan, R. L., Robert D. Retherford, Vinod Mishra, Fred Arnold, and T. K. Roy. 1997.
"Comparison of Fertility Estimates from India’s Sample Registration System and National
Family Health Survey." National Family Health Survey Subject Reports Number 4. Mumbai:
International Institute for Population Sciences and Honolulu: East-West Center Program on
Population.
Natrajan, D. 1972. Census of India 1971, Intercensal Growth of Population (Analysis of
Extracts from All India Census Reports), Census Centenary Monograph No 3. New Delhi:
Office of the Registrar General, India, Ministry of Home Affairs, Government of India.

68
NENA (North East News Agency). 2011. "ENPO rally for statehood." September 22. Available
at http://www.nenanews.com/ANE%20Sept.22,%202011/mj3.htm (last accessed February
14, 2012)
Nongkynrih, A K. 2010. "Scheduled Tribes and the Census: A Sociological Inquiry." Economic
and Political Weekly, 45:19, pp. 43-47.
The Northeast Daily. 1999. "Nagalim has never been a part of India." June 13. Available at
http://www.write2kill.in/reportseditorials/northeast/169.html (last accessed on August 18,
2012)
Northeast Today. 2012a. "NSF to Conduct Statistical Census Data of Non-Nagas in
Nagaland."March 11. Available at http://www.northeasttoday.in/our-states/nagaland/nsf-
to-conduct-statistical-census-data-of-non-nagas-in-nagaland/ (last accessed on May 07,
2012)
Northeast Today. 2012b. "Nagaland Wake up to Immigration." October 05. Available at
http://www.northeasttoday.in/our-states/nagaland/nagaland-wake-up-to-immigration/
(Last accessed on October 06, 2012)
Nugent, Paul and A.I. Asiwaju eds. 1996. African Boundaries: Barriers, Conduits and
Opportunities. London: Pinter.
Pitre, Vidya. 2007. "Political Economy of Statistics." Economic and Political Weekly, 41: 52,
pp. 5309-5310.
Population Foundation of India-Population Reference Bureau. 2007. "The Future Population
of India: A Long-range Demographic View." Population Foundation of India: New Delhi and
Population Reference Bureau: Washington DC.
Prakash, Ved. 2007. Encyclopaedia of North-East India. New Delhi: Atlantic Publishers &
Distributors.
Preston, S H, P Heuveline, and M Guillot. 2001. Demography: Measuring and Modeling
Population Processes. Oxford: Blackwell Publishers.
Refworld. 2004. "Chronology for Nagas in India." Minorities at Risk Project. Refworld,
UNHCR. Available Available at http://www.unhcr.org/refworld/docid/469f38981e.html (last
accessed on August 28, 2012)

69
Reserve Bank of India. 2005. "The Handbook of Statistics on the Indian Economy: 2004-05."
Reserve Bank of India: Mumbai.
Reserve Bank of India. 2011. "The Handbook of Statistics on the Indian Economy: 2010-11."
Reserve Bank of India: Mumbai.
Rio, Neiphiu. 2010. "Address at the Conference of the Chief Ministers on Internal Security.”
February 07. New Delhi.
Sema, Hokishe. 1986. Emergence of Nagaland: Socio-Economic and Political Transformation
and the Future. Delhi: Vikas Publishing House Pvt. Ltd.
The Sentinel. 2012. “CPO slams Nagaland Chief Secretary for ‘senseless’ comments.”
February 03. Available at
http://www.sentinelassam.com/northeast/story.php?sec=2&subsec=9&id=62938&dtP=201
2-01-28&ppr=1 (last accessed February 14, 2012)
Sharma, H N and B K Kar. 1997. "Pattern of Population Growth in North-East India," in
Demographic Transition: The Third World Scenario. Aijazuddin Ahmad, Daniel Noin and H.N.
Sharma eds. Jaipur: Rawat Publications, pp. 73–93.
Shimray, U.A. 2007. Naga Population and Integration Movement: Documentation. New
Delhi: Mittal Publications.
Siegel, Jacob S. 1973. "Estimates of Coverage of the Population by Sex, Race, and Age in the
1970 Census." Demography, 11:1, pp. 1-23.
Singh, K S ed. 1998. People of India, National Series, India's Communities, Vols III, IV and V.
Delhi: Anthropological Survey of India and Oxford University Press.
Slack, J Andrew and Roy R Doyon. 2001. "Population Dynamics and Susceptibility for Ethnic
Conflict: The Case of Bosnia and Herzegovina." Journal of Peace Research, 38:2, pp. 139-61.
South Asia Terrorism Portal. nd1. "India Datasheets." Available at
http://www.satp.org/satporgtp/countries/india/database/index.html (last accessed on June
23, 2012)
South Asia Terrorism Portal. nd2. "Nagalim (Greater Nagaland)." Available at
http://www.satp.org/satporgtp/countries/india/states/nagaland/data_sheets/insurgency_r
elated_killings.htm (last accessed on March 23, 2012)
70
Srivastava, S C. 1987. Demographic Profile of North East India. New Delhi: Mittal
Publications.
Steel, David and Jennifer Poulton. 1988. "Geographic Estimates of Underenumeration."
Proceedings of the Survey Research Methods Section, American Statistical Association
(1988), VII. Census Coverage: Improvement and Adjustment: 119-28. American Statistical
Association. Available at www.amstat.org/sections/srms/proceedings/papers/1988_021.pdf
(last accessed on April 18, 2012)
Suryanarayana, M.H. and Ankush Agrawal. 2011. "Human Development across States in
India: Costs of Inequality." Vision, XXXI: 4, pp. 6-17.
The Telegraph. 2008. "Bandh as weapon for delimitation - 3 tribes protest process
suspension." January 28. Available at
http://www.telegraphindia.com/1080128/jsp/others/print.html (last accessed on June 23,
2012)
The Telegraph. 2004. "Minister eats his figures." October 01. Available at
http://www.telegraphindia.com/1040724/asp/nation/story_3536552.asp (last accessed on
August 18, 2012)
The Telegraph. 2003. "Rio to warn Delhi on settlers with expose." Available at
http://www.telegraphindia.com/1031226/asp/northeast/story_2719485.asp (last accessed
November 30, 2012)
Times of India. 2012a. "Naga groups want capital punishment for rapists." Available at
http://articles.timesofindia.indiatimes.com/2012-02-09/guwahati/31041375_1_naga-
groups-naga-council-illegal-migrants (last accessed on June 17, 2012)
Times of India. 2012b. "4 lakh bogus voters in Nagaland: K Therie."June 17. Available at
http://articles.timesofindia.indiatimes.com/2012-06-17/guwahati/32281674_1_electoral-
rolls-lakh-bogus-voters-associate-members (last accessed on July 25, 2012)
United Nations. 2011. "World Population Prospects: The 2010 Revision, CD ROM Edition."
Population Division, Department of Economic and Social Affairs, United Nations.
von Furer-Haimendorf, C. 1977. "The Changing Position of Tribal Populations in India." RAIN,
22, pp. 2-8.

71
Wade, Robert. 2012. "The Politics behind World Bank Statistics: The Case of China’s
Income." Economic and Political Weekly, 47:25, 17-18.
Wade, Robert. 1985. "On the Sociology of Irrigation Statistics: How Do We Know the Truth about Canal Performance?" Agricultural Administration, 19:2, pp. 63-79.


