
National Discovery Data
Coordination Procedure
FINAL
September 30, 2015
September 30, 2015 i National Discovery Data Coordination Procedure
Revision History Version Number Version Date Summary of Changes Team (Principal Authors)
1 9/14/2011 Document Creation: Final Work Product
PTS MLI Project Team:
BakerAECOM, RAMPP, STARR
2 9/28/2012 Procedure and data updates for FY12: Final Work Product
RAMPP
3 9/30/2013 Procedure and data updates for FY13:
Final Work Product RAMPP
4 9/30/2015 Procedure and data updates for FY15:
Final Work Product Resilience Action Partners
Table of Contents
Acronyms and Abbreviations ....................................................................................................................... ii
Purpose .......................................................................................................................................................... 1
National Discovery Data Resources ............................................................................................................. 2
State Contacts.............................................................................................................................................. 12
State Standard Operating Procedures .......................................................................................................... 12
Federal Mapping Program Factsheets ......................................................................................................... 12

September 30, 2015 ii National Discovery Data Coordination Procedure
National Discovery Data Coordination Procedure
Acronyms and Abbreviations
AAL Average Annualized Loss
BIA Bureau of Indian Affairs
BLM Bureau of Land Management
B/W Black and White
CAC Community Assistance Contact
CAV Community Assistance Visit
CBRS Coastal Barrier Resources System
CCM Compressed County Mosaic
CIR Color Infrared
CIS Community Information System
CLICK Center for LiDAR Information Coordination and Knowledge
CNMS Coordinated Needs Management Strategy
CRS Community Rating System
CSC Coastal Services Center
CTP Cooperating Technical Partners
DEM Digital Elevation Model
DHS Department of Homeland Security
DOQ Digital Orthophoto Quadrangle
DOQQ Digital Orthophoto Quarter Quadrangle
EROS Earth Resources Observation and Science
FEMA Federal Emergency Management Agency
FHWA Federal Highway Administration
FIRM Flood Insurance Rate Map
FTP File Transfer Protocol
GeoMAC Geospatial Multi Agency Coordination
GeoTIFF Georeferenced TIFF
GIS Geographic Information System
HMGP Hazard Mitigation Grant Program
HUC Hydrologic Unit Code
IA Individual Assistance
JALBTCX Joint Airborne LiDAR Bathymetry Technical Center of Expertise

September 30, 2015 iii National Discovery Data Coordination Procedure
National Discovery Data Coordination Procedure
KML Keyhole Markup Language
LiDAR Light Detection and Ranging
LOMA Letter of Map Amendment
LOMC Letter of Map Change
LOMR Letter of Map Revision
MEOW Maximum Envelope of Water
MIP Mapping Information Platform
MLI Mid-term Levee Inventory
MOM Maximum of Maximum
MRLC Multi-Resolution Land Characterization
MSC Mapping Service Center
NAD27 North American Datum of 1927
NAD83 North American Datum of 1983
NAIP National Agriculture Imagery Program
NAVD88 North American Vertical Datum of 1988
NBI National Bridge Inventory
NDOP National Digital Orthophoto Program
NED National Elevation Dataset
NFHL National Flood Hazard Layer
NFIP National Flood Insurance Program
NGA National Geospatial-Intelligence Agency
NGVD29 National Geodetic Vertical Datum of 1929
NHD National Hydrography Dataset
NID National Inventory of Dams
NLCD National Land Cover Database
NOAA National Oceanic and Atmospheric Administration
NRCS Natural Resources Conservation Service
OFA Other Federal Agency
PA Public Assistance
PLSS Public Land Survey System
PM Procedure Memorandum
QQ Full-Resolution Quarter-Quad Tiles

September 30, 2015 iv National Discovery Data Coordination Procedure
National Discovery Data Coordination Procedure
Risk MAP Risk Mapping, Assessment, and Planning
RSC Regional Service Center
SLOSH Sea, Lake, and Overland Surges from Hurricanes
SOP Standard Operating Procedure
TIGER Topologically Integrated Geographic Encoding and Referencing
USACE U.S. Army Corps of Engineers
USDA U.S. Department of Agriculture
USFWS U.S. Fish and Wildlife Service
USGS U.S. Geological Survey
UTM Universal Transverse Mercator
September 30, 2015 1 National Discovery Data Coordination Procedure
National Discovery Data Coordination Procedure
Purpose
The Department of Homeland Security’s Federal Emergency Management Agency (FEMA) prepared the
Geospatial Data Coordination Procedures to outline sources of geospatial data and contact information,
preferences for base map data in Flood Insurance Studies, information for the project Discovery stage,
and other useful information.
To implement the Geospatial Data Coordination Procedures, each Regional Service Center (RSC)
maintains State Standard Operating Procedure (SOP) documents that detail how specific datasets within
that State should be used for flood hazard mapping and Discovery projects. Some of the data to be used in
those projects can be retrieved from national data suppliers, which are typically other Federal agencies
(OFAs).
To supplement the Discovery element of the Geospatial Data Coordination Procedures, this document, the
National Discovery Data Coordination Procedure, provides instruction on the most appropriate data to
collect on a national scale for Discovery. This information, in conjunction with the State SOPs, is
intended to help reduce the level of effort needed to find appropriate data.
Detailed information about the role of geospatial data coordination in studies is in the Geospatial Data
Coordination portal, which is available at:
https://riskmapportal.msc.fema.gov/riskmap_usergroups/GeoCoord/default.aspx (password required). A
link to this portal and additional information relating to geospatial coordination can be found on FEMA’s
Mapping Information Platform (MIP) at http://www.hazards.fema.gov. Navigate to the “Tools & Links”
page and then locate the “Additional Resources” section.

September 30, 2015 2 National Discovery Data Coordination Procedure
National Discovery Data Coordination Procedure
National Discovery Data Resources
The table below lists sources of data that are suitable for Discovery from national data maintained by
FEMA and OFAs. The FEMA Discovery Data Repository, which is to be used only for official FEMA
purposes, such as Discovery, can be found on the MIP File Explorer at
J:\DISCOVERY_DATA_REPOSITORY. The Discovery Data Repository is maintained by FEMA and
contains up-to-date downloads for the below datasets that are continually revised. It also contains
spatially converted datasets where the source data is text or non-spatial. Geospatial data available from
FEMA and OFAs are often the preferred sources for performing Discovery activities and are referenced
in the table below, as well as in the Federal Mapping Program Fact Sheets section of this document. Note
that data that are used for Discovery may not be at a suitable scale for Flood Insurance Rate Map (FIRM)
production. Note also that links in this document are continually changing and may not be live at the time
it is used; therefore, please follow the links back to the source to find your datasets as needed.
Data Agency Location
In The
Discovery Data
Repository
Digital
Orthophotogra
phy
Multi
Refer to the Federal Mapping Program Fact Sheets for National Digital
Orthophoto Program (NDOP), National Agriculture Imagery Program
(NAIP), and the Natural Resources Conservation Service / U.S. Department
of Agriculture (NRCS/USDA) Geospatial Data Gateway provided in this
document.
No
Elevation and
Bathymetry Multi
Refer to the Federal Mapping Program Fact Sheets for National Elevation
Dataset (NED), Center for Light Detection And Ranging (LiDAR)
Information Coordination and Knowledge (CLICK), National Geospatial-
Intelligence Agency (NGA), and National Oceanic and Atmospheric
Administration (NOAA) Coastal Services Center (CSC) provided in this
document.
Additionally, the U.S. Geological Survey (USGS), in cooperation with
NRCS, NOAA, and FEMA has created an inventory of elevation data for
the country. The inventory can be used to identify the best available data for
much of the U.S., it is current as of March 2015, and is available at
http://coast.noaa.gov/inventory/
Lacking elevation data from other valid, more detailed sources, the USGS
Digital Elevation Model (DEM) data can be used. USGS DEM resolution
for an area can be determined using the Resolution Layer shapefiles
(downloaded from the USGS National Map Viewer) in the Discovery Data
Repository. USGS DEM data can be downloaded from the National Map
Viewer at http://viewer.nationalmap.gov/viewer/.
Yes
Tribal Land
Boundaries BIA
The Bureau of Indian Affairs (BIA) maintains Tribal Land Boundary data
nationally. Local data should be reviewed before beginning project work.
The BIA does not distribute a geographic information system (GIS) layer
for Tribal Land Boundaries through its Web site, but Tribal boundary data
can be found in the Discovery Data Repository or through the National
Atlas raw data download site at
http://nationalmap.gov/small_scale/mld/indlanp.html. The layer was last
updated in November 2014. The data are available at a scale of
1:2,000,000.
Yes
September 30, 2015 3 National Discovery Data Coordination Procedure
National Discovery Data Coordination Procedure
Data Agency Location
In The
Discovery Data
Repository
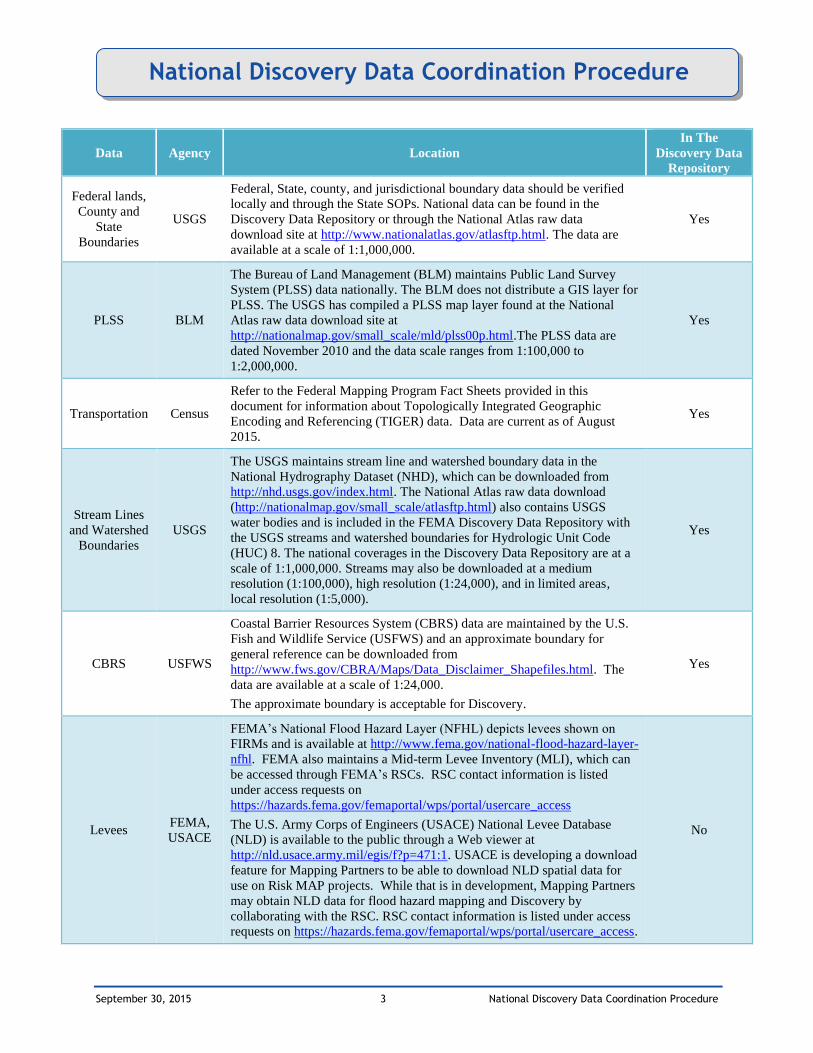
Federal lands,
County and
State
Boundaries
USGS
Federal, State, county, and jurisdictional boundary data should be verified
locally and through the State SOPs. National data can be found in the
Discovery Data Repository or through the National Atlas raw data
download site at http://www.nationalatlas.gov/atlasftp.html. The data are
available at a scale of 1:1,000,000.
Yes
PLSS BLM
The Bureau of Land Management (BLM) maintains Public Land Survey
System (PLSS) data nationally. The BLM does not distribute a GIS layer for
PLSS. The USGS has compiled a PLSS map layer found at the National
Atlas raw data download site at
http://nationalmap.gov/small_scale/mld/plss00p.html.The PLSS data are
dated November 2010 and the data scale ranges from 1:100,000 to
1:2,000,000.
Yes
Transportation Census
Refer to the Federal Mapping Program Fact Sheets provided in this
document for information about Topologically Integrated Geographic
Encoding and Referencing (TIGER) data. Data are current as of August
2015.
Yes
Stream Lines
and Watershed
Boundaries
USGS
The USGS maintains stream line and watershed boundary data in the
National Hydrography Dataset (NHD), which can be downloaded from
http://nhd.usgs.gov/index.html. The National Atlas raw data download
(http://nationalmap.gov/small_scale/atlasftp.html) also contains USGS
water bodies and is included in the FEMA Discovery Data Repository with
the USGS streams and watershed boundaries for Hydrologic Unit Code
(HUC) 8. The national coverages in the Discovery Data Repository are at a
scale of 1:1,000,000. Streams may also be downloaded at a medium
resolution (1:100,000), high resolution (1:24,000), and in limited areas,
local resolution (1:5,000).
Yes
CBRS USFWS
Coastal Barrier Resources System (CBRS) data are maintained by the U.S.
Fish and Wildlife Service (USFWS) and an approximate boundary for
general reference can be downloaded from
http://www.fws.gov/CBRA/Maps/Data_Disclaimer_Shapefiles.html. The
data are available at a scale of 1:24,000.
The approximate boundary is acceptable for Discovery.
Yes
Levees FEMA,
USACE
FEMA’s National Flood Hazard Layer (NFHL) depicts levees shown on
FIRMs and is available at http://www.fema.gov/national-flood-hazard-layer-
nfhl. FEMA also maintains a Mid-term Levee Inventory (MLI), which can
be accessed through FEMA’s RSCs. RSC contact information is listed
under access requests on
https://hazards.fema.gov/femaportal/wps/portal/usercare_access
The U.S. Army Corps of Engineers (USACE) National Levee Database
(NLD) is available to the public through a Web viewer at
http://nld.usace.army.mil/egis/f?p=471:1. USACE is developing a download
feature for Mapping Partners to be able to download NLD spatial data for
use on Risk MAP projects. While that is in development, Mapping Partners
may obtain NLD data for flood hazard mapping and Discovery by
collaborating with the RSC. RSC contact information is listed under access
requests on https://hazards.fema.gov/femaportal/wps/portal/usercare_access.
No

September 30, 2015 4 National Discovery Data Coordination Procedure
National Discovery Data Coordination Procedure
Data Agency Location
In The
Discovery Data
Repository
Dams USACE,
USGS
The National Inventory of Dams (NID) database is available for viewing
and querying from the NID Web site at http://nid.usace.army.mil. The NID
includes the locations of dams, notes on their structure, and inspection
information for 87,000 dams in the United States. The NID is maintained
by the USACE. The USGS provides dam locations as a subset of the NID
from this File Transfer Protocol (FTP) Web site:
ftp://nhdftp.usgs.gov/DataSets/National//. Data are based on 1:24,000 scale.
Yes
Bridges FHWA
National Bridge Inventory (NBI) data are maintained and distributed by the
Federal Highway Administration (FHWA) at the Web site:
http://www.rita.dot.gov/bts/sites/rita.dot.gov.bts/files/publications/national_t
ransportation_atlas_database/2015/index.html. FHWA updates ASCII files
on a more frequent basis at http://www.fhwa.dot.gov/bridge/nbi/ascii.cfm.
FEMA has downloaded the latest available ASCII file (the 2014 release)
and it is available in the Discovery Data Repository.
Yes
Stream Gages USGS
USGS maintains stream gages across the Nation as well as a variety of
information at each gage station. Search for gages and download
information from http://waterdata.usgs.gov/nwis/inventory. Data are also
available as a Keyhole Markup Language (KML) file from USGS at
http://waterwatch.usgs.gov/new/?m=real&w=kml, and FTP download of the
data are available at ftp://nhdftp.usgs.gov/DataSets/National//.
Yes
Wave Gages NOAA
NOAA’s buoy datasets can be helpful for wave gages, wind, and other
measurements and can be found at http://www.ndbc.noaa.gov/. Click a buoy
on the NOAA map to be taken to that buoy’s data download section for
specific information.
No
Tide Gages NOAA
Tide gage station data can be downloaded by State from NOAA at
http://tidesandcurrents.noaa.gov/stations.html?type=Water+Levels or from
http://tidesandcurrents.noaa.gov/googleearth.shtml.
No
Coastal Wind
Stations NOAA
NOAA meteorological station observations can be located at
http://tidesandcurrents.noaa.gov/stations.html?type=Meteorological%20Obs
ervations or the National Climatic Data Center at
http://www.ncdc.noaa.gov/cdo-web/datasets.
No
Historic Flood
Events Multi
FEMA maintains a shapefile containing historical disaster declaration areas
that may be useful for Discovery. This file can be found on FEMA’s Web
site at http://gis.fema.gov/DataFeeds.html.
The NOAA severe weather events database includes floods and can be
downloaded at ftp://ftp.ncdc.noaa.gov/pub/data/swdi/stormevents/.
Yes
Historic
Earthquakes NOAA
NOAA manages and distributes historic non-geospatial earthquake data at
http://www.ngdc.noaa.gov/hazard/earthqk.shtml. FEMA has converted this
dataset to geospatial points for the Discovery Data Repository.
Yes
Landslides USGS
Landslide data are maintained by USGS and are available from the USGS
raw data download site at http://pubs.usgs.gov/of/1997/ofr-97-0289/. See
also: http://landslides.usgs.gov/hazards/nationalmap/. Data are available at
a scale of 1:4,000,000.
Yes

September 30, 2015 5 National Discovery Data Coordination Procedure
National Discovery Data Coordination Procedure
Data Agency Location
In The
Discovery Data
Repository
Soils NRCS
The USDA NRCS maintains national soil data in a GIS format. Data can be
downloaded from the NRCS Data Mart at
http://websoilsurvey.sc.egov.usda.gov/App/HomePage.htm or from the
NRCS Data Gateway listed in the Other Resources section of this document.
Data ranges in scale from 1:12,000 to 1:63,360.
No
Volcanic
Eruptions NOAA
NOAA maintains and distributes historical non-geospatial volcanic eruption
data on its Web site at
http://www.ngdc.noaa.gov/nndc/struts/form?t=102557&s=50&d=50. FEMA
has converted these data to a geospatial point file. An interactive viewer is
available at http://maps.ngdc.noaa.gov/viewers/hazards/?layers=3.
Yes
Storm Surge
Inundation
Zones
NOAA
Most storm surge data must be obtained from local flood hazard
management authorities. For more information about storm surge, see
NOAA’s Web site at http://www.nhc.noaa.gov/ssurge/ssurge.shtml.
No
SLOSH Zones NOAA
NOAA produces composite storm surge products, by basin, by modeling
thousands of potential storms through the basins. This produces maximum
possible surge elevations for a variety of storm categories, trajectories, and
speeds. These data also include information on land inundation, but the land
elevation data are generally very coarse.
You can download all the most current Maximum of Maximum (MOM) and
Maximum Envelope of Water (MEOW) data here (registration required):
http://slosh.nws.noaa.gov/sloshPub/
Additionally, many State and local emergency management Web sites post
the Sea, Lake, and Overland Surges from Hurricanes (SLOSH) storm tide
inundation limit maps (using MOM data) in various formats, including
shapefiles.
The National Hurricane Program, National Weather Service, NOAA, U.S.
Department of Transportation, and the USACE fund hurricane evacuation
studies. These studies use the SLOSH Basins surge outputs to more
accurately map potential inundation areas (SLOSH Zones) for different
storm characteristics and then define evacuation zones based on the
potential inundation. Some studies can be obtained through the FEMA
Hurricane Program contacts in each Region, especially in Regions III, IV,
and VI. Nonetheless, the older studies, generally those prepared before
2000, may no longer be available from any source. For more information
about hurricane evacuation studies, see NOAA’s Web site at
http://www.csc.noaa.gov/hes/hes.html.
No
Wildfire
Hazard Areas GeoMAC
The Geospatial Multi Agency Coordination (GeoMAC) Group comprises 11
Agencies coordinating wildfire data and displaying it in an online GIS map,
which can be found at http://www.geomac.gov/index.shtml. GeoMAC also
maintains an Esri layer file containing its data. USGS maintains an FTP site
to download historic fire perimeters from 2002 to 2014 at
http://rmgsc.cr.usgs.gov/outgoing/Geomac/historic_fire_data/.
Yes
Wildland-
Urban
Interfaces
GeoMAC
Wildland-Urban interfaces are most commonly created in conjunction with
local wildfire susceptibility analyses. A national dataset from the GeoMAC
exists, but has not been acquired by FEMA. The State SOPs should be
consulted.
No
September 30, 2015 6 National Discovery Data Coordination Procedure
National Discovery Data Coordination Procedure
Data Agency Location
In The
Discovery Data
Repository
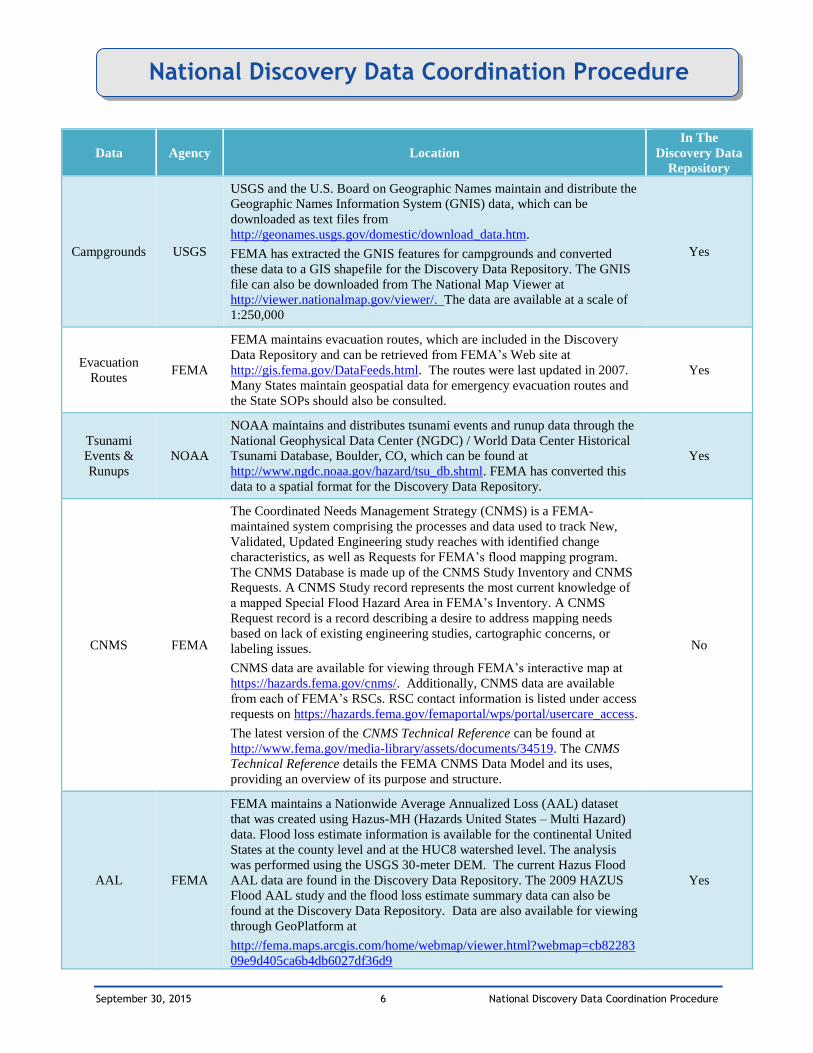
Campgrounds USGS
USGS and the U.S. Board on Geographic Names maintain and distribute the
Geographic Names Information System (GNIS) data, which can be
downloaded as text files from
http://geonames.usgs.gov/domestic/download_data.htm.
FEMA has extracted the GNIS features for campgrounds and converted
these data to a GIS shapefile for the Discovery Data Repository. The GNIS
file can also be downloaded from The National Map Viewer at
http://viewer.nationalmap.gov/viewer/. The data are available at a scale of
1:250,000
Yes
Evacuation
Routes FEMA
FEMA maintains evacuation routes, which are included in the Discovery
Data Repository and can be retrieved from FEMA’s Web site at
http://gis.fema.gov/DataFeeds.html. The routes were last updated in 2007.
Many States maintain geospatial data for emergency evacuation routes and
the State SOPs should also be consulted.
Yes
Tsunami
Events &
Runups
NOAA
NOAA maintains and distributes tsunami events and runup data through the
National Geophysical Data Center (NGDC) / World Data Center Historical
Tsunami Database, Boulder, CO, which can be found at
http://www.ngdc.noaa.gov/hazard/tsu_db.shtml. FEMA has converted this
data to a spatial format for the Discovery Data Repository.
Yes
CNMS FEMA
The Coordinated Needs Management Strategy (CNMS) is a FEMA-
maintained system comprising the processes and data used to track New,
Validated, Updated Engineering study reaches with identified change
characteristics, as well as Requests for FEMA’s flood mapping program.
The CNMS Database is made up of the CNMS Study Inventory and CNMS
Requests. A CNMS Study record represents the most current knowledge of
a mapped Special Flood Hazard Area in FEMA’s Inventory. A CNMS
Request record is a record describing a desire to address mapping needs
based on lack of existing engineering studies, cartographic concerns, or
labeling issues.
CNMS data are available for viewing through FEMA’s interactive map at
https://hazards.fema.gov/cnms/. Additionally, CNMS data are available
from each of FEMA’s RSCs. RSC contact information is listed under access
requests on https://hazards.fema.gov/femaportal/wps/portal/usercare_access.
The latest version of the CNMS Technical Reference can be found at
http://www.fema.gov/media-library/assets/documents/34519. The CNMS
Technical Reference details the FEMA CNMS Data Model and its uses,
providing an overview of its purpose and structure.
No
AAL FEMA
FEMA maintains a Nationwide Average Annualized Loss (AAL) dataset
that was created using Hazus-MH (Hazards United States – Multi Hazard)
data. Flood loss estimate information is available for the continental United
States at the county level and at the HUC8 watershed level. The analysis
was performed using the USGS 30-meter DEM. The current Hazus Flood
AAL data are found in the Discovery Data Repository. The 2009 HAZUS
Flood AAL study and the flood loss estimate summary data can also be
found at the Discovery Data Repository. Data are also available for viewing
through GeoPlatform at
http://fema.maps.arcgis.com/home/webmap/viewer.html?webmap=cb82283
09e9d405ca6b4db6027df36d9
Yes

September 30, 2015 7 National Discovery Data Coordination Procedure
National Discovery Data Coordination Procedure
Data Agency Location
In The
Discovery Data
Repository
Flood Claims
and Repetitive
Loss
Properties
FEMA
A Discovery report has been developed in the Community Information
System (CIS), which is available to registered CIS users.
Additionally, FEMA maintains information on the number of flood
insurance policies, the number of single claims, and repetitive losses at the
HUC8 watershed level. The FEMA Risk Mapping, Assessment, and
Planning (Risk MAP) National Flood Risk Analysis Version 2.0 report is
available in Excel format and can be found in the Discovery Data
Repository.
Mapping Partners may obtain repetitive loss and severe repetitive loss data
for use in their Discovery project, but must take appropriate privacy
precautions. The following are the guidelines for obtaining the data and
maintaining privacy:
1. Contact the Regional Insurance Specialist and request Bureaunet
access. Include requestor’s name and contact information,
organization, reason access is needed, and how long access is needed.
2. Do not release maps or data to the public at large in a format that would
enable identification of specific addresses of repetitive loss properties
and its respective payments. Use a more general color coding method
for areas with repetitive loss properties. This way, a community can see
in a detailed manner where severe repetitive loss properties are located
without disclosing specific addresses and information linked to those
addresses.
3. If a State or municipality wants repetitive loss information with address
specificity, it may make a Privacy Act routine use request. More
detailed information can then be placed on a map and disclosed to the
State/municipality. In this situation, though, the State/municipality
would not be allowed to further disclose the information to the public.
Yes
CRS FEMA
The Community Rating System (CRS) is a voluntary program for national
Flood Insurance Program (NFIP)-participating communities. A link to the
pages from the most recent Flood Insurance Agent’s Manual containing
current and historical listings of all CRS communities, their class, and
insurance discount is available at the following Web site:
http://www.fema.gov/library/viewRecord.do?id=3629.
CRS data can also be pulled from CIS.
Yes
September 30, 2015 8 National Discovery Data Coordination Procedure
National Discovery Data Coordination Procedure
Data Agency Location
In The
Discovery Data
Repository
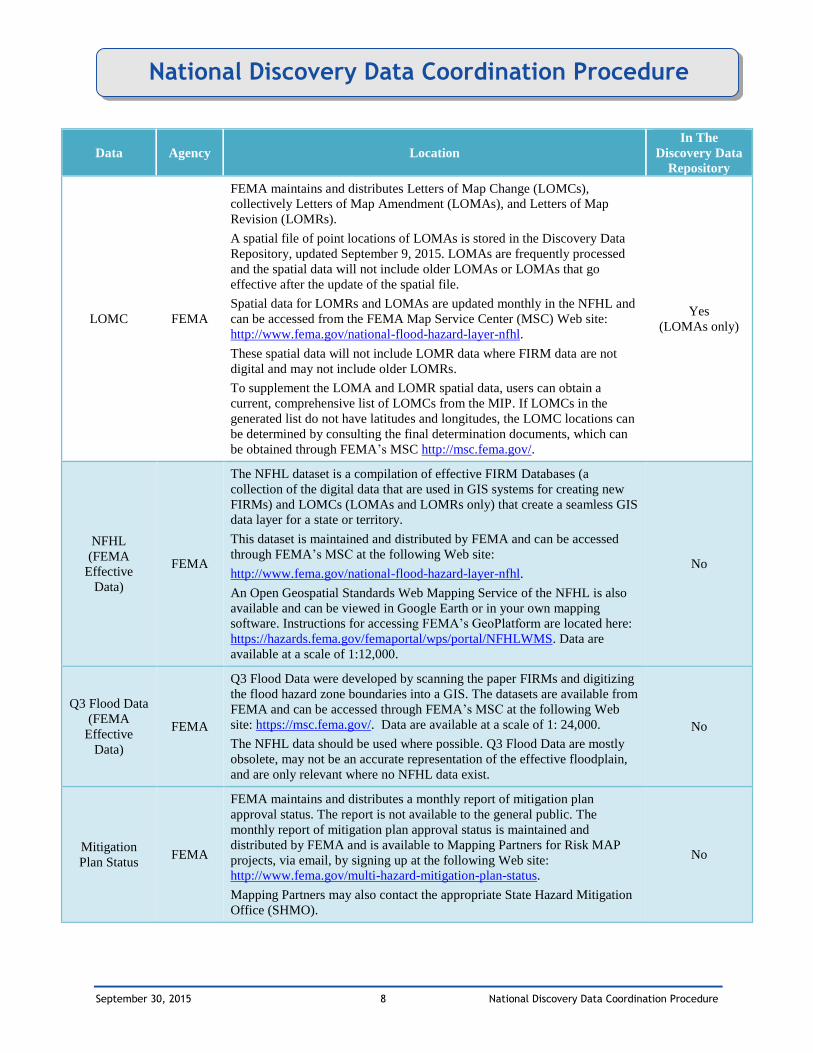
LOMC FEMA
FEMA maintains and distributes Letters of Map Change (LOMCs),
collectively Letters of Map Amendment (LOMAs), and Letters of Map
Revision (LOMRs).
A spatial file of point locations of LOMAs is stored in the Discovery Data
Repository, updated September 9, 2015. LOMAs are frequently processed
and the spatial data will not include older LOMAs or LOMAs that go
effective after the update of the spatial file.
Spatial data for LOMRs and LOMAs are updated monthly in the NFHL and
can be accessed from the FEMA Map Service Center (MSC) Web site:
http://www.fema.gov/national-flood-hazard-layer-nfhl.
These spatial data will not include LOMR data where FIRM data are not
digital and may not include older LOMRs.
To supplement the LOMA and LOMR spatial data, users can obtain a
current, comprehensive list of LOMCs from the MIP. If LOMCs in the
generated list do not have latitudes and longitudes, the LOMC locations can
be determined by consulting the final determination documents, which can
be obtained through FEMA’s MSC http://msc.fema.gov/.
Yes
(LOMAs only)
NFHL
(FEMA
Effective
Data)
FEMA
The NFHL dataset is a compilation of effective FIRM Databases (a
collection of the digital data that are used in GIS systems for creating new
FIRMs) and LOMCs (LOMAs and LOMRs only) that create a seamless GIS
data layer for a state or territory.
This dataset is maintained and distributed by FEMA and can be accessed
through FEMA’s MSC at the following Web site:
http://www.fema.gov/national-flood-hazard-layer-nfhl.
An Open Geospatial Standards Web Mapping Service of the NFHL is also
available and can be viewed in Google Earth or in your own mapping
software. Instructions for accessing FEMA’s GeoPlatform are located here:
https://hazards.fema.gov/femaportal/wps/portal/NFHLWMS. Data are
available at a scale of 1:12,000.
No
Q3 Flood Data
(FEMA
Effective
Data)
FEMA
Q3 Flood Data were developed by scanning the paper FIRMs and digitizing
the flood hazard zone boundaries into a GIS. The datasets are available from
FEMA and can be accessed through FEMA’s MSC at the following Web
site: https://msc.fema.gov/. Data are available at a scale of 1: 24,000.
The NFHL data should be used where possible. Q3 Flood Data are mostly
obsolete, may not be an accurate representation of the effective floodplain,
and are only relevant where no NFHL data exist.
No
Mitigation
Plan Status FEMA
FEMA maintains and distributes a monthly report of mitigation plan
approval status. The report is not available to the general public. The
monthly report of mitigation plan approval status is maintained and
distributed by FEMA and is available to Mapping Partners for Risk MAP
projects, via email, by signing up at the following Web site:
http://www.fema.gov/multi-hazard-mitigation-plan-status.
Mapping Partners may also contact the appropriate State Hazard Mitigation
Office (SHMO).
No

September 30, 2015 9 National Discovery Data Coordination Procedure
National Discovery Data Coordination Procedure
Data Agency Location
In The
Discovery Data
Repository
CIS Data
(including
CACs and
CAVs)
FEMA
FEMA’s CIS is available, via authorized user account, at the following Web
site: https://portal.fema.gov/famsVuWeb/home. The CIS provides
information about floodplain management, mapping, and insurance for
NFIP communities. The CIS includes demographic, engineering, insurance,
and community-specific information for jurisdictions in the U.S. that are
identified as flood prone.
The specific datasets that can come from CIS include CRS Status,
Population, Disaster Assistance Claims, Flood Insurance Claim Info,
Floodplain Management Ordinance Level, Last Community Assistance
Visit (CAV) (FEMA CAV – does not include State CAVs necessarily),
NFIP Participation, and of course, a start on Contact info (however, it’s
frequently out of date).
Community Assistance Contacts (CACs) and CAVs are two key methods
FEMA uses to identify community floodplain management program
deficiencies and violations and to provide technical assistance to resolve
these issues.
To obtain the CAC/CAV-related information, run a Discovery Report from
the Web site above. Most FEMA, Cooperating Technical Partners (CTP),
and Production and Technical Services contractor offices have staff with
access to the CIS. New user CIS access can be requested through the Web
site above.
Additionally, some policy information is available through GeoPlatform. A
1-km raster dataset of policy concentrations is available for viewing through
GeoPlatform at
http://fema.maps.arcgis.com/home/webmap/viewer.html?webmap=a5607f5
7a52a4c569e2f3e9838b969d2
Subsidized policyholders by State and county are available through
GeoPlatform at
http://fema.maps.arcgis.com/home/webmap/viewer.html?webmap=e020898
5e8e64d44bca999325254ff5b
No
HMGP FEMA
The Hazard Mitigation Grant Program (HMGP) provides grants to states
and local governments to implement long-term hazard mitigation measures
after a major disaster declaration. A spreadsheet with HMGP information by
community can be found at http://catalog.data.gov/dataset/fema-hazard-
mitigation-grant-program-summary.
For HMGP grant datasets with spatial detail at a higher resolution than the
community level, contact ([email protected]) for further assistance.
No
IA n/a
The Individual Assistance (IA) program provides grants and assistance for
individuals. IA data are currently unavailable. Procedures for accessing
these data will be determined by FEMA in the future.
No

September 30, 2015 10 National Discovery Data Coordination Procedure
National Discovery Data Coordination Procedure
Data Agency Location
In The
Discovery Data
Repository
PA FEMA
Through the Public Assistance (PA) Program, FEMA provides
supplemental Federal disaster grant assistance for debris removal;
emergency protective measures; and the repair, replacement, or restoration
of disaster-damaged, publicly owned facilities and the facilities of certain
Private Non-Profit organizations. FEMA maintains a spreadsheet listing all
PA recipients, designated as Applicants in the data. The dataset also features
project worksheets that list every funded project.
The dataset can be found at http://catalog.data.gov/dataset/public-assistance-
funded-projects-detail.
No
FloodSmart FEMA
The NFIP launched the FloodSmart campaign to educate the public about
the dangers of flooding and to help them protect their property. It is the
premier resource for flood insurance and flood risk information. More
information can be found on the following Web site
http://www.floodsmart.gov/floodsmart/.
Datasets from FloodSmart are available from ([email protected]).
No
Information on
active
disasters
FEMA
A list of Federal Disaster Declarations since 1953 can be obtained from the
FEMA Web site at:
https://www.fema.gov/media-library/assets/documents/28318#.
Another source for declared disasters is from data.gov; the FEMA Disaster
Declarations Summary provides tabular data for all disasters by county.
Dataset is called data.gov.FEMADeclarations.
No
CTP FEMA
Information about FEMA’s CTP Program, including active partners can be
found at this Web site: https://www.fema.gov/cooperating-technical-
partners-program.
A list of CTPs can be found at:
http://www.floodmaps.fema.gov/fhm/scripts/ctp_list.asp.
No

September 30, 2015 11 National Discovery Data Coordination Procedure
National Discovery Data Coordination Procedure
Data Agency Location
In The
Discovery Data
Repository
Areas of land
use change
datasets
USGS,
NOAA
The Multi-Resolution Land Characterization (MRLC) consortium is a group
of Federal agencies that coordinate and generate consistent and relevant
land cover information at the national scale for a wide variety of
environmental, land management, and modeling applications. The creation
of this consortium has resulted in the mapping of the lower 48 States,
Hawaii, Alaska, and Puerto Rico into a comprehensive land cover product
termed the National Land Cover Database (NLCD), from decadal Landsat
satellite imagery and other supplementary datasets.
All MRLC NLCD data products are available at
http://www.mrlc.gov/finddata.php. The data has a 30-meter resolution.
The National Urban Change Indicator dataset provides vector and raster
data to show annual persistent change in urban areas of the U.S. over the
past 25 years. Urbanization of areas due to events such as land development
and construction can be key indicators of where Risk MAP Discovery is
planned. GIS data are available for use on Discovery projects by contacting
the RSC. RSC contact information is listed under access requests on
https://hazards.fema.gov/femaportal/wps/portal/usercare_access. The
NOAA Coastal Change Analysis Program (C-CAP) Regional Land Cover
Data are developing a standardized database on habitat and land cover
change in coastal regions of the United States. C-CAP notes changes in
habitats (from one class to another) on 1 to 5 year cycles depending on the
rate and magnitude of change in a geographic region. Data are currently
available from 1996 to 2006, but 2011 data are being added (30-meter
resolution raster converted to polygon shapefile). Data can be downloaded
by county at http://www.csc.noaa.gov/ccapatlas/.
No

September 30, 2015 12 National Discovery Data Coordination Procedure
National Discovery Data Coordination Procedure
Additional Resources
The following are additional non-specific sources for national data that can be researched for Discovery
or flood hazard mapping data. If a dataset cannot be found from the National Discovery Data Resources
and cannot be found in the State SOPs through the FEMA RSC, the following list is useful to review.
Service Internet Location
OpenFEMA http://www.fema.gov/openfema
Geospatial One-Stop http://geo.data.gov/geoportal/ The National Map http://viewer.nationalmap.gov/viewer/
USDA NRCS Data Gateway http://datagateway.nrcs.usda.gov/
Bureau of Land Management GeoCommunicator http://www.geocommunicator.gov/GeoComm/
FEMA Map Service Center http://www.msc.fema.gov
FEMA Mapping Information Platform http://www.hazards.fema.gov
State Contacts
FEMA maintains contact information for State geospatial representatives and their Federal counterparts
on the MIP at https://hazards.fema.gov/contacts/statecontacts/contacts.asp.
State Standard Operating Procedures
FEMA also maintains State SOPs that detail the best practices for obtaining and using State and
community data for Discovery and flood hazard mapping. The State SOPs are available through the MIP
through the link under the “Additional Resources” Section of “Tools and Links.” For additional
assistance, contact the respective RSC representative. RSC contact information is listed under access
requests on https://hazards.fema.gov/femaportal/wps/portal/usercare_access.
Federal Mapping Program Factsheets
Additionally, the following Federal Mapping Program Fact Sheets provide summary information on the
primary national mapping programs that are tracking, developing, and/or sharing geospatial data. This
information is available to support the Regions, RSCs, and FEMA’s Mapping Partners as they conduct
Discovery.

National Elevation Dataset
Bare Earth Elevation Data http://nationalmap.gov/elevation.html
Program Highlights
Data Product
2-arc-second (60-meter) posting Digital Elevation Model (DEM).
1-arc-second (30-meter) posting DEM.
1/3rd-arc-second (10-meter) posting DEM.
1/9th-arc-second (3-meter) posting DEM.
Advantages
Most edge matching / seam issues from quad-based DEMs have been fixed.
1/3rd-arc-second National Elevation Dataset (NED) provides very close fidelity to quad contours.
Suitable for non-regulatory flood risk products.
Avoids many of the problems in original 30-meter DEMs.
1/9th-arc-second data are generally good enough for regulatory mapping.
Newer 1/3rd- and 1/9th-arc-second data increasingly are from Light Detection and Ranging
(LiDAR) and other high-resolution data sources.
Disadvantages
2- and 1-arc-second NED based on many sources with variable quality. Generally not suitable for
hydraulics or floodplain mapping.
1/9th-arc-second data are not available everywhere.
1/3rd-arc-second quality varies based on original quad contour interval and NED production
methods.
Small areas of 1/3rd-arc-second data are resampled 1-arc-second data and are low quality.
Program Overview
The U.S. Geological Survey (USGS) NED has been developed by merging the highest resolution, best
quality elevation data available across the U.S. into a seamless raster format. The NED has a consistent
projection (Geographic) and elevation units (meters). Nationwide coverage is available for data at a 1-arc-
second (30-meter) post spacing, with portions of Alaska at a 2-arc-second (60-meter) post spacing; and
1/3rd-arc-second (10-meter) post spacing (although small areas are resampled 1 arc second). The
horizontal datum is the North American Datum of 1983 (NAD83), except for Alaska, which uses the
North American Datum of 1927 (NAD27). The vertical datum is the North American Vertical Datum of
1988 (NAVD88), except for Alaska, which uses the National Geodetic Vertical Datum of 1929
(NGVD29). NED is a living dataset that is updated bi-monthly to incorporate the “best available” DEM
data. As more 1/9th-arc-second (3-meter) post-spacing data covering the U.S. become available, they will
be added to the seamless dataset.

Data Details
NED is designed to provide national elevation data in a seamless form with a consistent datum, elevation
unit, and projection. NED has a resolution of 1 arc second (approximately 30 meters) for the
conterminous U.S., Hawaii, Puerto Rico, and the island territories, and a resolution of 2 arc seconds
(approximately 60 meters) for Alaska. NED data sources have a variety of elevation units, horizontal
datums, and map projections. In the NED assembly process, the elevation values are converted to decimal
meters as a consistent unit of measure, NAD83 is consistently used as the horizontal datum, and all the
data are recast in a geographic projection. Older DEMs produced by methods that are now obsolete have
been filtered during the NED assembly process to minimize artifacts that are commonly found in data
produced by these methods. Artifact removal greatly improves the quality of the slope, shaded-relief, and
synthetic drainage information that can be derived from the elevation data. NED processing also includes
steps to adjust values where adjacent DEMs do not match well, and to fill sliver areas of missing data
between DEMs. These processing steps ensure that NED has no void areas and artificial discontinuities
have been minimized. The artifact removal filtering process does not eliminate all of the artifacts. In areas
where the only available DEM is produced by older methods “striping” may still occur.
(The following information about the accuracy of the NED is from Maune, D., (ed.), 2007, Digital
elevation model technologies and applications: the DEM user’s manual (2nd edition), Chapter 4.
Courtesy of Dean Gesch, USGS.)
The accuracy of the NED varies spatially because of the variable quality of the source DEMs. As such,
the NED inherits the accuracy of the source DEMs. In an effort to provide more information to users on
the vertical accuracy of the NED, the dataset has been tested by comparing it with an independent
reference source of very high accuracy. The reference data are the geodetic control points that the
National Geodetic Survey uses for gravity and geoid modeling. The overall absolute vertical accuracy
expressed as the root mean square error is 2.44 meters. As better sources of data are incorporated, the
accuracy improves.
For some applications of elevation data, the relative, or point-to-point, vertical accuracy is more important
than the absolute vertical accuracy. Whereas absolute accuracy accounts for the combined effects of
systematic and random errors, relative accuracy is a measure of just random errors. Averaged over all
9,187 point pairs, the relative vertical accuracy is 1.64 meters.
One caveat to note about the accuracy assessment presented here is that even though the reference control
point dataset is large, the number of quadrangle-based USGS DEMs on which the points are located is
relatively small. Thus, if users have a need for very specific accuracy information for the NED for a local
area, a separate assessment should be done with suitable reference data just for that area.
Data Applicability to Flood Mapping Program
1/3rd-arc-second data provide very close fidelity to quad contours and may be acceptable for flood
risk products.
1/9th-arc-second data are generally good enough for most regulatory flood map updates.
Data Availability
The data dictionary, release notes, and update information can be found at
http://ned.usgs.gov/Ned/downloads.asp.

Information about the best resolution available and methods of production are available through the
USGS GISDATA Map Studio Interactive Viewer at http://nationalmap.gov/elevation.html. The following
figure illustrates the resolution of data available on September 9, 2013:
Data Ordering
In the Seamless Data Distribution System at http://viewer.nationalmap.gov/viewer/, users specify the
footprint of the data they require. Large downloads may be broken into chunks.
For very large datasets, users may provide the Earth Resources Observation and Science (EROS) data
center a hard drive to ship the data. Requests for bulk data may take several weeks to process
(http://cumulus.cr.usgs.gov/bulk.php).

Center for LiDAR Information Coordination and Knowledge (CLICK) LiDAR Point Cloud Data
http://lidar.cr.usgs.gov/index.php
Program Highlights
Data Highlights
Provides information about discrete-return Light Detection and Ranging (LiDAR), including
information and download capability for publicly available LiDAR
(https://lta.cr.usgs.gov/LIDAR) and the ability to look for articles
(http://lidar.cr.usgs.gov/knowledge.php) and other Web sites about LiDAR.
Advantages
LiDAR data available from the Center for LiDAR Information Coordination and Knowledge
(CLICK) are in native format.
Point cloud data maintain the most detail and precision.
Disadvantages
Datasets are large.
Not as easy to work with as gridded data available through the NED.
Program Overview
The goal of CLICK is to facilitate data access, user coordination, and education of LiDAR remote sensing
for scientific needs. The program responds to the increasing demand for research utilizing all information
generated from LiDAR remote sensing data and not just bare earth Digital Elevation Models (DEMs).
CLICK focuses on managing point cloud data, not necessarily bare earth data. However, many of the
point clouds may be classified to indicate bare earth points.
Data Details
LiDAR point cloud data available through the site are provided “As Is,” with varying processing and
accuracy. The U.S. Geological Survey (USGS) is not responsible for bare earth processing, populating
fields other than xyz, or validating reported vertical and horizontal accuracies.
Data Applicability to Flood Mapping Program
The Federal Emergency Management Agency’s Guidelines and Standards for Flood Risk Analysis and
Mapping provide the specifications for elevation data for Risk Mapping Assessment, and Planning (Risk
MAP) projects. Most LiDAR data will satisfy these data standards, and thus can be used on most Risk
MAP projects. Some older datasets were provided without, or with very limited, metadata. These may or
may not provide reliable accuracy statements. Most newer and current datasets include documentation of
the tested accuracy of the dataset.
Data Availability and Ordering
See viewer at http://earthexplorer.usgs.gov/.

National Geospatial-Intelligence Agency LiDAR Data over Core Areas of Major Cities
www1.nga.mil
Program Highlights
Data Product
High resolution Light Detection and Ranging (LiDAR) data for select urban areas.
Advantages
Very high accuracy, density.
Disadvantages
Coverage is generally small areas in urban cores.
Some processing is required to ensure proper bare earth model for flood study.
Program Overview
The National Geospatial-Intelligence Agency (NGA) has a goal to collect LiDAR over major urban areas
in the U.S. However, funding is not consistent, so future collections are unpredictable.
Data Details and Availability
There are limitations for the use of the data. NGA will make the data available to FEMA and FEMA
contractors working on a flood study. However, the data can be used for flood studies only and not
distributed to anyone else or used for other purposes.
Data Applicability to Flood Mapping Program
These data meet FEMA’s terrain mapping requirements for all risk classes.
Data Ordering
Contact Paul Rooney for information on availability at (617) 832-4719 or [email protected].

NOAA Office For Coastal Management
Coastal LiDAR, bathymetry, shoreline data, and inventories of terrestrial elevation data
and bathymetry http://coast.noaa.gov/
Program Highlights
Data Products
NOAA Digital Coast: Light Detection and Ranging (LiDAR) data collected by the National
Oceanic and Atmospheric Administration (NOAA) and other agencies, such as the U.S. Army
Corps of Engineers (USACE) Joint Airborne LiDAR Bathymetry Technical Center of Expertise
(JALBTCX) over the U.S. coast is available at http://coast.noaa.gov/digitalcoast/
NOAA Shoreline Website: Historical shoreline data with the average accuracy of measured
benchmarks at 3.06 meters (10 feet), which
meets the NOAA guidelines for fixed aids to
navigation and objects charted as landmarks,
is available at http://shoreline.noaa.gov/.
U.S. Interagency Elevation Inventory:
Inventories of coastal LiDAR and bathymetric
data are available at
http://coast.noaa.gov/dataregistry/search/collection/info/coastallidar.
Advantages
LiDAR data covering most of the coast generally have sub-meter vertical and horizontal root
mean square error.
Data can be downloaded for free in the user’s choice of vertical datum and projection.
Variety of shoreline data.
Topography and bathymetry inventories survey a wide variety of sources to identify the best
available information.
Disadvantages
USACE JALBTCX elevation data in narrow strip along coast only.
Not all of the U.S. coastline has been mapped.
Shoreline data are dated with no update schedule provided.
Program Overview
This organization was established in 2014 when NOAA combined two offices: the Coastal Services
Center and the Office of Ocean and Coastal Resource Management. The basic missions of the two
programs remain intact, but the new organizational structure is bringing value-added services to
taxpayers.
In addition to implementing specific initiatives, a top priority for NOAA's Office for Coastal Management
is to unify efforts to make communities more resilient. Many organizations are involved, including the
private sector, nonprofits, the scientific community, and all levels of government. The Office for Coastal
Management works to be a unifying force in these efforts, providing unbiased NOAA data and tools and
providing opportunities for the community to come together to define common goals and find ways to
work smarter by working together. Issues run the gamut from protecting endangered species to erosion to
generating better building codes for storm-resistant buildings.
Data Details and Availability
These data are generated through both private sector contracts and government-owned systems. The
USACE-collected LiDAR data are typically targeted at a narrow strip of coastline and are usually a
kilometer or less in width. Wide-area topographic LiDAR are also available for coastal areas. The
vectorized shoreline data were created from scanned historical shoreline maps in raster format and are in
decimal degrees, referenced to the NAD83 datum. The accuracy of the shoreline datasets is stricter than
national standards and four times the accuracy of current U.S. Geological Survey 1:24,000 scale
topographic maps. This means that the original topographic sheets can be assumed to also meet NOAA
guidelines and to be very accurate in their depiction of the shoreline that existed at the time of the
surveys. The topographic and bathymetric inventories are compiled regionally and are not updated on a
regular schedule. They integrate inventory information from a wide variety of sources to provide a
reasonably comprehensive summary of what bathymetric data and topographic data are available for a
particular area.
The NOAA Digital Coast site at http://coast.noaa.gov/digitalcoast/ also provides access to a wide variety
of other data sets for coastal resource managers.
Data Applicability to Flood Mapping Program
Federal Emergency Management Agency (FEMA) Procedure Memorandum (PM) 61, Standards for
Lidar and Other High Quality Digital Topography, provides the specifications for elevation data for
regulatory flood mapping projects. Most LiDAR data will satisfy the data standards in PM 61, and thus
can be used on most Risk Mapping, Assessment, and Planning (Risk MAP) projects. The metadata
records for each LiDAR dataset should be reviewed prior to use on a FEMA project to ensure sufficient
accuracy for the project. Some LiDAR datasets also include precise near shore bathymetry. Because of
the historical nature of the shoreline data, each dataset should be examined for its potential use for FEMA
projects.
Data Ordering
These data are available for download directly through the NOAA Web sites listed in the Data Products
section above.

National Digital Orthophoto Program Leaf-Off Orthophotography Base Maps
www.ndop.gov
Program Highlights
Data Product
1-meter-resolution, black and white (B/W)
orthophotography nationwide.
High-resolution (usually 1-foot) natural color
(some B/W) orthophotography in selected
urban areas.
High-resolution (finer than 1-meter)
orthophotography for some States.
Advantages
1-meter-resolution data are available
nationally.
All these data meet Federal Emergency
Management (FEMA) accuracy
specifications.
Uncompressed imagery provides the
maximum visual quality.
Urban area orthophotographs are very recent.
Accessible through the Seamless Data Distribution System at
http://viewer.nationalmap.gov/viewer/.
Disadvantages
High-resolution data in urban areas are more difficult to manipulate because of file size.
Much of the 1-meter-resolution data are several years old.
Full-resolution quarter quad tiles are difficult to manage compared to compressed mosaics of the
same imagery available from the U.S. Department of Agriculture.
Source of orthophotographs if local or State data are not available.
Limited areas are fairly poor quality or Color-Infrared (CIR) photography, which is not as
visually pleasing.
Program Overview
The National Digital Orthophoto Program (NDOP) was chartered in 1993 as a consortium of Federal
agencies with the purpose of developing and maintaining national orthoimagery coverage in the public
domain by establishing partnerships with Federal, State, local, tribal, and private organizations.

Data Details
Nationwide Digital Orthophoto Quadrangles (DOQs) are B/W, natural color, or CIR images with 1-meter
ground resolution.
High-resolution (usually 1-foot) imagery is available for the Nation’s largest urban areas and State
capitals. The imagery usually is natural color.
The U.S. Geological Survey (USGS) also has agreements in which it distributes statewide high-resolution
imagery for some States.
Data Applicability to Flood Mapping Program
All these data meet FEMA’s accuracy specifications and could be used as base maps for Flood Insurance
Rate Maps if the image quality is acceptable.
Data Availability
Data status for high-resolution imagery can be found at http://viewer.nationalmap.gov/viewer/.
Data Ordering
In the Seamless Data Distribution System at http://viewer.nationalmap.gov/viewer/, users specify the
footprint of the data they require. The data are then made available for download. The data are in
Georeferenced TIFF (GeoTIFF) format, Universal Transverse Mercator (UTM) coordinate system, North
American Datum of 1983 (NAD83). Large requests may be broken into smaller sections. For very large
datasets, users may provide the Earth Resources Observation and Science (EROS) data center a hard drive
to ship the data. Requests for bulk data may take several weeks to process at
http://cumulus.cr.usgs.gov/bulk.php .
In the past, USGS produced three types of tiled DOQs, which may also be used:
1. 3.75-minute (quarter-quad) DOQs are available in both Native and GeoTIFF formats. DOQs in
native format are cast to the UTM projection and referenced to either North American Datum of
1927 (NAD27) or NAD83. DOQs in GeoTIFF format are cast to the UTM projection and
referenced to NAD83. The average file size of a B/W quarter quad is 40–45 megabytes, and a
color file is generally 140–150 megabytes. Quarter-quad DOQs are distributed on CD-ROM,
DVD, and File Transfer Protocol (FTP) as uncompressed files.
2. 7.5-minute (full-quad) DOQs cover an area measuring 7.5-minutes longitude by 7.5-minutes
latitude. Full-quad DOQs are mostly available for Oregon, Washington, and Alaska. Limited
coverage may also be available for other States.
3. County DOQs consist of collections of individual DOQs that have been compiled on a county-
by-county basis. Coverage for counties in Kansas, Georgia, Minnesota, North Carolina, and
Pennsylvania is fairly good. Other States may have limited counties available. The files are cast
to the UTM projection and referenced to either NAD27 or NAD83. County DOQs are packaged
as individual JPEG-compressed 8-bit binary files on CD-ROM.
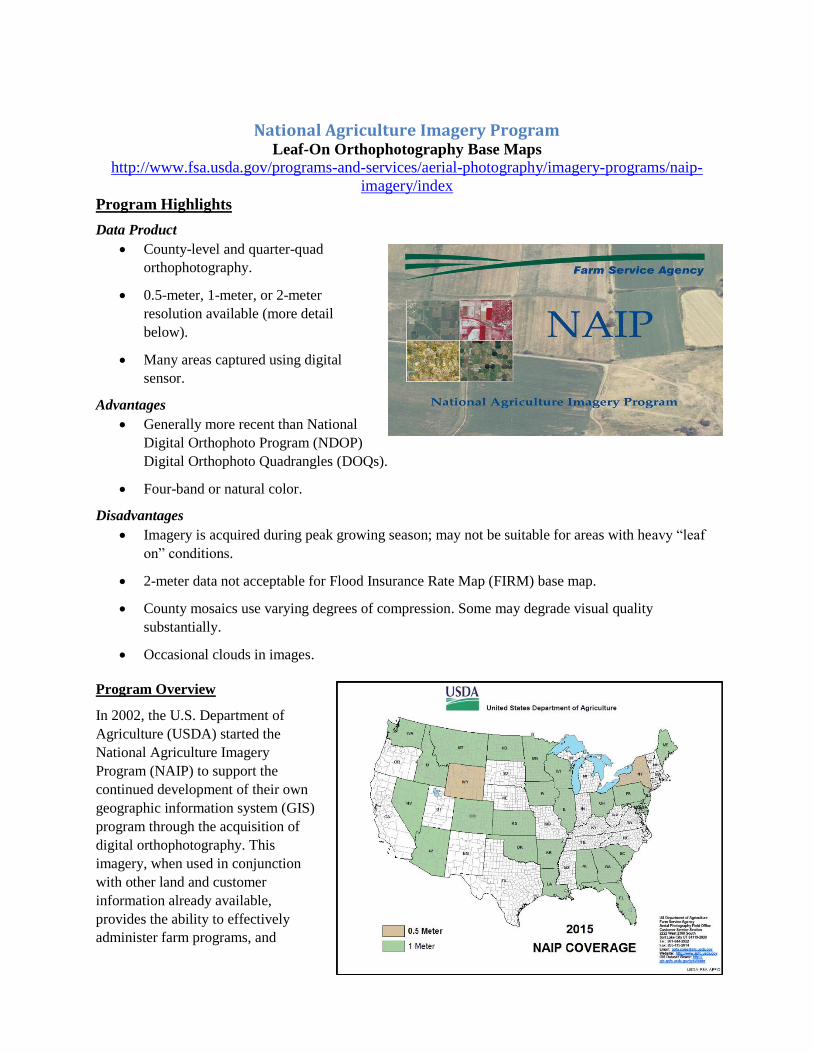
National Agriculture Imagery Program
Leaf-On Orthophotography Base Maps
http://www.fsa.usda.gov/programs-and-services/aerial-photography/imagery-programs/naip-
imagery/index
Program Highlights
Data Product
County-level and quarter-quad
orthophotography.
0.5-meter, 1-meter, or 2-meter
resolution available (more detail
below).
Many areas captured using digital
sensor.
Advantages
Generally more recent than National
Digital Orthophoto Program (NDOP)
Digital Orthophoto Quadrangles (DOQs).
Four-band or natural color.
Disadvantages
Imagery is acquired during peak growing season; may not be suitable for areas with heavy “leaf
on” conditions.
2-meter data not acceptable for Flood Insurance Rate Map (FIRM) base map.
County mosaics use varying degrees of compression. Some may degrade visual quality
substantially.
Occasional clouds in images.
Program Overview
In 2002, the U.S. Department of
Agriculture (USDA) started the
National Agriculture Imagery
Program (NAIP) to support the
continued development of their own
geographic information system (GIS)
program through the acquisition of
digital orthophotography. This
imagery, when used in conjunction
with other land and customer
information already available,
provides the ability to effectively
administer farm programs, and

georeference natural disasters and animal or plant disease outbreaks to support better decision-making.
The program’s goal is to acquire 1-meter-resolution imagery on a 3-year cycle over the contiguous 48
States, and deliver it to users within a few months. In order to support agriculture analysis, imagery is
captured during the peak growing seasons (June–August).
Data Details
Two primary data products are developed and available through NAIP. These include the Compressed
County Mosaic (CCM) and the Full-Resolution Quarter-Quad Tiles (QQ). Historically some states were
acquired at 2-meter resolution, but more recently all data are acquired at 1-meter resolution. The data are
natural color (red/green/blue bands) and many recent datasets include a near infrared band that is often
used for vegetation identification and other image analysis techniques.
Because the imagery is captured during peak growing season, this “leaf on” status is likely to obscure
some ground level features, especially in heavily treed areas. This issue should be considered based on the
geography of the region under consideration. All data come with a full suite of Federal Geographic Data
Committee compliant metadata for documentation.
Compressed County Mosaic
The CCMs are developed for the convenience of full county coverage. In many contexts,
manipulating a single, full county file is easier than multiple, smaller Digital Orthophoto Quarter

Quadrangles (DOQQs). It can reduce the costs for management of data and increase production
efficiency. CCMs are useful when larger geographic coverage is required. CCMs use varying
degrees of compression. Some may degrade visual quality substantially.
Full-Resolution Quarter-Quad Tiles
The QQ is the full-resolution standard delivery product. The QQ can be a better format when
smaller geographic areas are concerned as the tiles cover an area measuring 3.75-minutes
longitude by 3.75-minutes latitude, or approximately 2.5 miles on each side. The DOQQ format is
Georeferenced TIFF (GeoTIFF).
Digital Sensors
In some cases, vendors use digital cameras for an entire State. In a fully digital workflow
retrieving the raw imagery for other uses can be very efficient for vendors. Negotiating with the
vendors to produce high-quality elevation data for targeted areas may be possible using these
data. Because the data are already acquired, this procedure may be a practical way to obtain small
areas of quality elevation data for high-risk areas.
Data Applicability to Flood Mapping Program
The 1-meter-resolution data are acceptable for FIRM base maps provided vegetation does not obscure
roads or other important ground features. This imagery is more recent than NDOP DOQs, but 2-meter-
resolution data and highly compressed county mosaics are not acceptable for FIRM base maps.
Data Availability
The program has been meeting or exceeding a 3-year refresh cycle, so all States have new 1-meter-
resolution data within the past 3 years.
Data Ordering
For more information call (801) 975-3500. To order full-resolution NAIP imagery, visit the main Web
page.

U.S. Census Bureau TIGER Files
Accurate Detailed Vector Street Base Maps http://www.census.gov/geo/www/tiger/index.html
Program Highlights
Data Product
Street centerline files with road names and address ranges for geocoding.
Advantages
Realigned files accurate enough to
use as Flood Insurance Rate Map
(FIRM) base map and are now
considered the default source for
FIRM Database transportation
features.
Smaller, often easier to work with
than orthophotographs.
Vector-based maps can be easier to
read.
Topologically Integrated Geographic
Encoding and Referencing (TIGER)
spatial data are available in shapefile
format.
Disadvantages
Some communities may prefer orthophotographs.
Local planimetric data could be more current or contain better attributes (i.e., local road names).
TIGER/Line files may still contain features that have not been realigned to more accurate source
data.
Program Overview
The U.S. Census Bureau realigned the street features for all counties in the U.S. in preparation for the
2010 Census.
Data Details and Availability
The U.S. Census Bureau has continued to release updated TIGER/Line files on a regular basis. The
newest files incorporate updates discovered during the field activities for the 2010 Census and
information reported by cooperators.
Data Applicability to Flood Mapping Program
Realigned files are accurate enough to use as FIRM base maps and are now considered the default source
for FIRM Database transportation features.

Data Ordering
Files containing nationwide primary roads and State-by-State primary and secondary roads are available
directly from the U.S. Census Web site at ftp://ftp2.census.gov/geo/tiger/TIGER2015/. Files containing
all roads by county are available at ftp://ftp2.census.gov/geo/tiger/TIGER2015/ROADS/.
In addition, you can purchase the files on CD-ROM or DVD from the Customer Services Center at
(800) 923-8282 or (301) 763-INFO (4636).

NRCS/USDA Geospatial Data Gateway
Distribution of a Variety of Base Maps and Other GIS Data
http://datagateway.nrcs.usda.gov/
Program Highlights
Data Product
The Geospatial Data Gateway provides
one-stop shopping for natural resources
or environmental data.
Source for Natural Resources
Conservation Service (NRCS) U.S.
Department of Agriculture (USDA)
Countywide Compressed Orthophoto
Mosaics.
Advantages
Data downloads are free and near-real
time.
Compressed, mosaicked counties are
easier to work with, color/tone
balanced, and potentially more accurate
than individual quarter quad National Digital Orthophoto Program (NDOP) Digital Orthophoto
Quadrangles (DOQs).
Disadvantages
Compression of imagery may degrade visual quality.
County mosaics generally use first generation NDOP imagery so they are fairly old.
USDA is not the authoritative source for all data on the site, so some data may be out of date.
Program Overview
The Geospatial Data Gateway is intended to
provide a single access point for resource data. It
provides a way to easily locate data that exist for
selected geographic areas, find the types of data
for that area, and deliver the data packaged in
formats compatible with commercial and USDA
Service Center application formats.
One major purpose of the Gateway is to support
the development, presentation, and dissemination
of information by Service Center field staff
working in the field with customers away from
the office. However, the public has access to the
Gateway to find and retrieve resource data.

Data Details
The datasets served by the Gateway are primarily determined by the USDA Service Center Geographic
Information System (GIS) Strategy. The data themes are listed on the Gateway Data Management page at
http://datagateway.nrcs.usda.gov/GDGHome_StatusMaps.aspx. This page also identifies non-geospatial
data that may be available through the Gateway.
The Gateway provides metadata that comply with the Federal Geographic Data Committee metadata
standards for all data available through the Gateway. Metadata enable users to assess the applicability of a
dataset to their needs before downloading or ordering it.
Data Applicability to Flood Mapping Program
County orthophotograph mosaics can be used as Flood Insurance Rate Map base maps provided the
compression does not reduce the usability of the image. These mosaics are much easier to work with,
have more consistent image brightness, contrast, and sometimes improved positional accuracy compared
to the first-generation tiled DOQs.
Data Availability
The Geospatial Data Gateway provides access to many different data layers, which may be updated as
frequently as once per week. The most critical themes are generally available nationwide.
Critical Themes
Orthoimagery
Soils
Common Land Unit
Data Ordering
Users can download the data from the Web site directly, retrieve it from a File Transfer Protocol (FTP)
site, or order it on CD or DVD.


