NATURAL HAZARD AND NATURAL HAZARD AND VULNERABILITY ASSESSMENT FOR VULNERABILITY ASSESSMENT FOR
PORTMORE, PORTMORE, ST. CATHERINEST. CATHERINE
Presenters: Presenters: Norman Harris & Norman Harris &
Rupert GreenRupert GreenMines and Geology Mines and Geology
DivisionDivisionJune 25 2008June 25 2008
BACKGROUNDBACKGROUND
UNDP Funded ProjectUNDP Funded Project
Project began in July 2006; 14 month project Project began in July 2006; 14 month project periodperiod
Portmore located on South coast, affected by Portmore located on South coast, affected by frequent storms & hurricanesfrequent storms & hurricanes
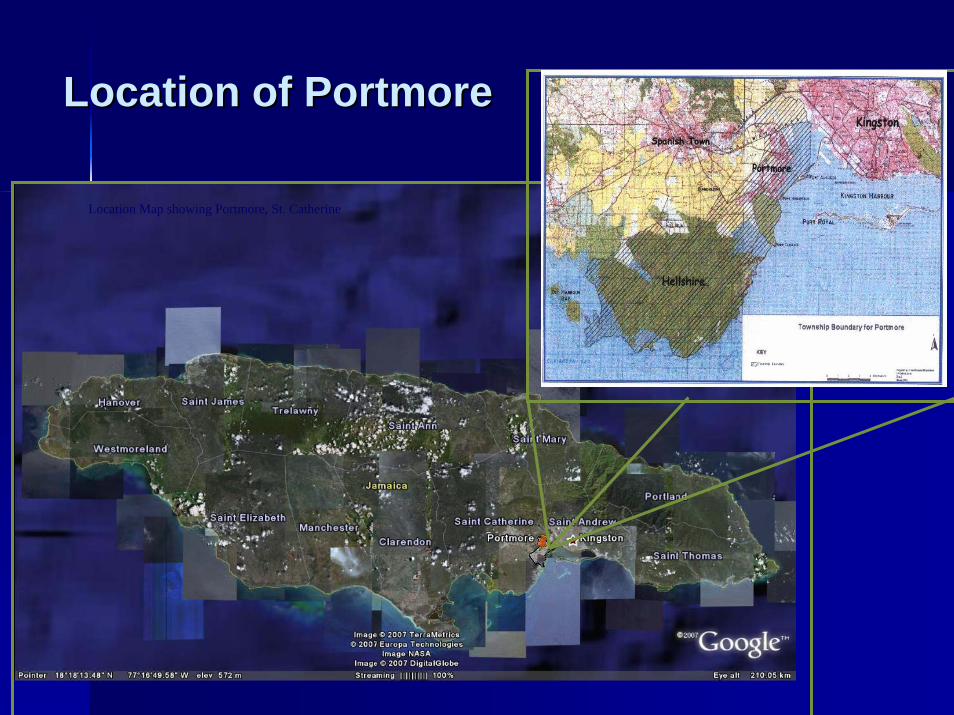
Location of PortmoreLocation of Portmore
Location Map showing Portmore, St. Catherine
BACKGROUND CONTBACKGROUND CONT’’DD
Portmore accounts for 31 percent of total Portmore accounts for 31 percent of total population of St. Catherinepopulation of St. Catherine
Fastest growing city in Jamaica Fastest growing city in Jamaica -- 4% growth 4% growth raterate
The area suffered in the past from The area suffered in the past from Earthquakes, Hurricane and FloodingEarthquakes, Hurricane and Flooding
AIM OF PROJECTAIM OF PROJECTConduct technical review of major natural hazards: Conduct technical review of major natural hazards: inland floods, storm surge and earthquakeinland floods, storm surge and earthquake
Conduct hazard mappingConduct hazard mapping
Conduct vulnerability mappingConduct vulnerability mapping
Determine current status of evacuation routesDetermine current status of evacuation routes
Recommend changes to improve/update Portmore Recommend changes to improve/update Portmore Evacuation PlanEvacuation Plan
METHODOLOGYMETHODOLOGYLiterature review, data gathering, aerial photoLiterature review, data gathering, aerial photo--interpretation is conducted to assess major natural interpretation is conducted to assess major natural hazardshazards
Flood hazards determined through comprehensive Flood hazards determined through comprehensive interviews, anecdotal evidence and literature reviewsinterviews, anecdotal evidence and literature reviews
NOAA methodology adapted to assess vulnerability NOAA methodology adapted to assess vulnerability of communities in Portmoreof communities in Portmore
METHODOLOGY CONTMETHODOLOGY CONT’’DD
Evacuation routes reviewed based on Evacuation routes reviewed based on vulnerability analysisvulnerability analysis
Natural Hazard and Vulnerability Maps Natural Hazard and Vulnerability Maps created using GIScreated using GIS
NATURAL HAZARDNATURAL HAZARD
Inland Flooding Inland Flooding -- Major FocusMajor Focus
EarthquakeEarthquake
Storm Surge Storm Surge –– Minor FocusMinor Focus
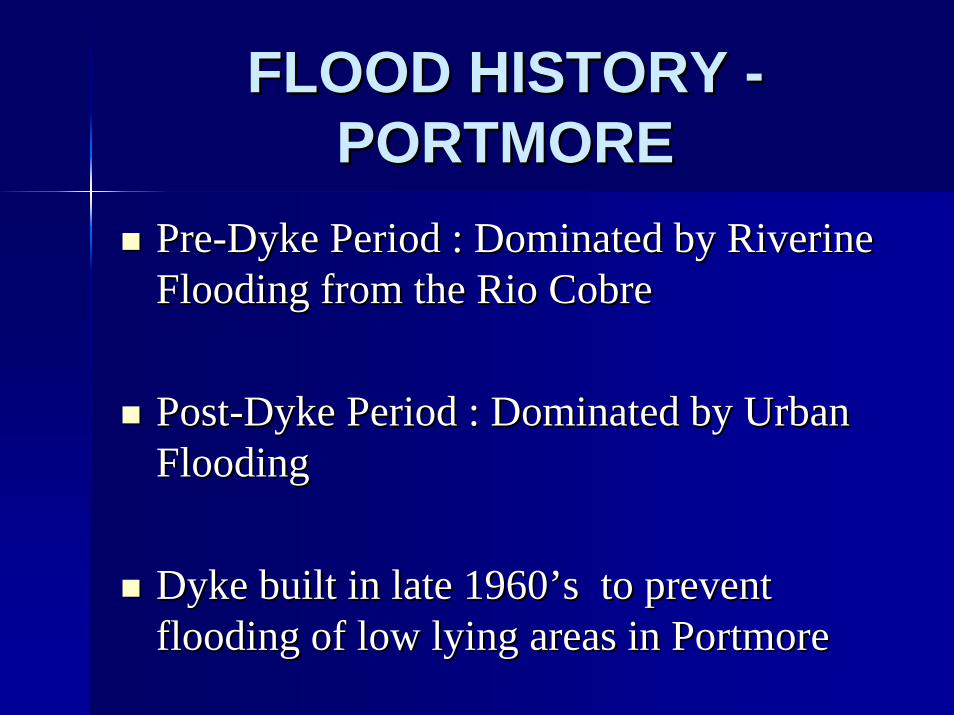
FLOOD HISTORY FLOOD HISTORY --PORTMOREPORTMORE
PrePre--Dyke Period : Dominated by Riverine Dyke Period : Dominated by Riverine Flooding from the Rio Cobre Flooding from the Rio Cobre
PostPost--Dyke Period : Dominated by Urban Dyke Period : Dominated by Urban FloodingFlooding
Dyke built in late 1960Dyke built in late 1960’’s to prevent s to prevent flooding of low lying areas in Portmoreflooding of low lying areas in Portmore
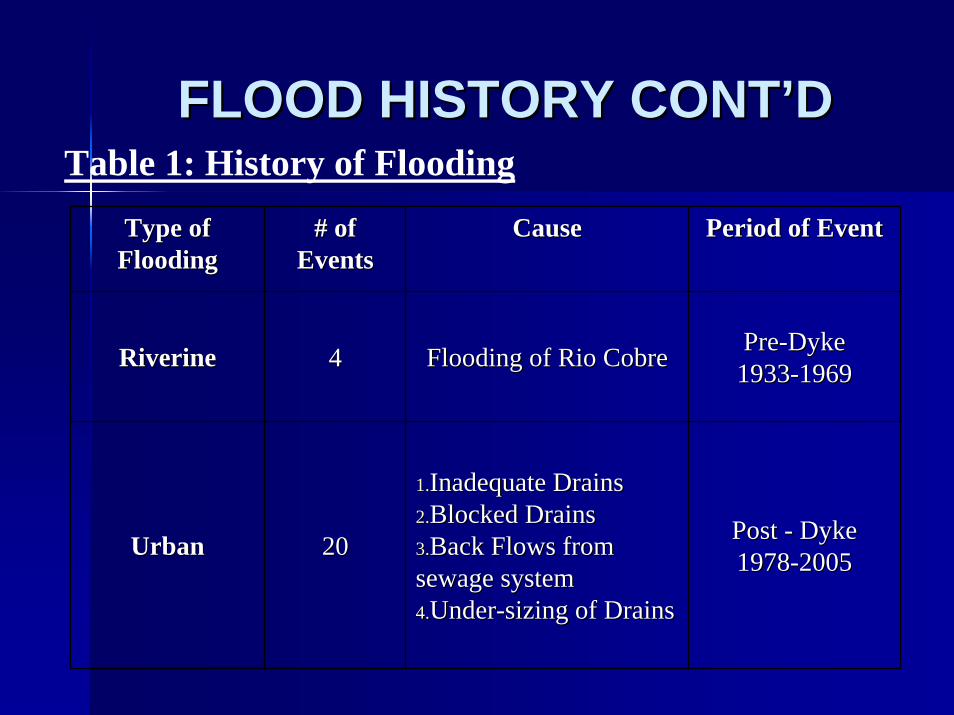
FLOOD HISTORY CONTFLOOD HISTORY CONT’’DDTable 1: History of Flooding
Type of Type of FloodingFlooding
# of # of EventsEvents
CauseCause Period of EventPeriod of Event
RiverineRiverine 44 Flooding of Rio CobreFlooding of Rio Cobre PrePre--DykeDyke19331933--19691969
UrbanUrban 2020
1.1.Inadequate DrainsInadequate Drains2.2.Blocked DrainsBlocked Drains3.3.Back Flows from Back Flows from sewage systemsewage system4.4.UnderUnder--sizing of Drainssizing of Drains
Post Post -- DykeDyke19781978--20052005
FLOOD HAZARD MAPPING FLOOD HAZARD MAPPING PROCESSPROCESS
METHODOLOGYMETHODOLOGY : URBAN FLOODING: URBAN FLOODING
Data collection and correctionsData collection and corrections
Create flood database and correct for errorsCreate flood database and correct for errors
FLOOD HAZARD MAPPING FLOOD HAZARD MAPPING PROCESS CONTPROCESS CONT’’DD
Generate flood zones/classes using Generate flood zones/classes using GeostatisticalGeostatistical Analyst Extension of Arc GISAnalyst Extension of Arc GIS
Correction and modification of flood zonesCorrection and modification of flood zones
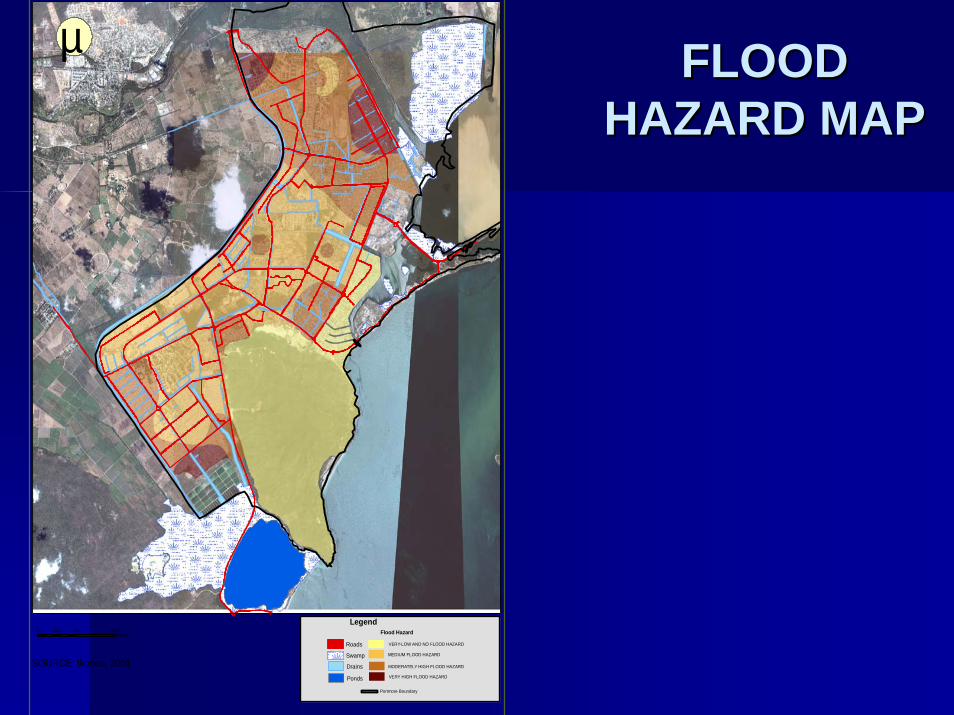
0 740 1,480370Meters
SOURCE: Ikonos, 2001
Legend
Portmore Boundary
Ponds
Roads
Swamp
Drains
Flood Hazard
VERY-LOW AND NO FLOOD HAZARD
MEDIUM FLOOD HAZARD
MODERATELY HIGH FLOOD HAZARD
VERY HIGH FLOOD HAZARD
µ FLOOD FLOOD HAZARD MAPHAZARD MAP

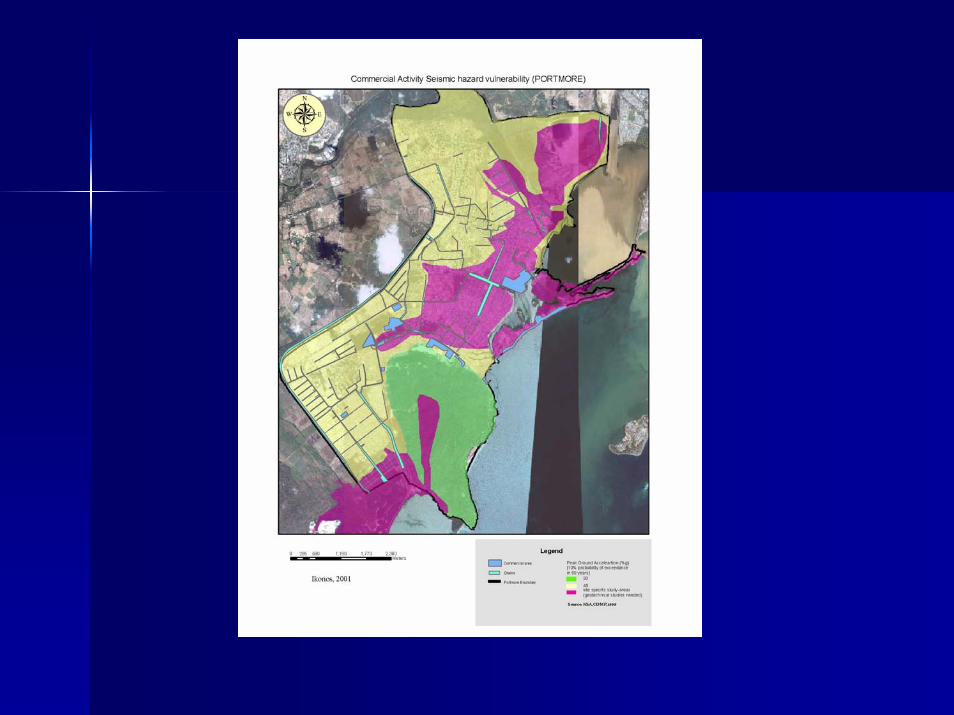
EARTHQUAKE HAZARD MAPEARTHQUAKE HAZARD MAPEarthquake Hazard Map for KMA (CDMP Earthquake Hazard Map for KMA (CDMP Seismic Hazard Assessment Project 1999)Seismic Hazard Assessment Project 1999)
Three Seismic Hazard ZonesThree Seismic Hazard Zones–– Zone of Ground acceleration : 30% gravityZone of Ground acceleration : 30% gravity–– Zone of Ground acceleration : 45% gravityZone of Ground acceleration : 45% gravity–– Zone of Site Specific assessmentZone of Site Specific assessment
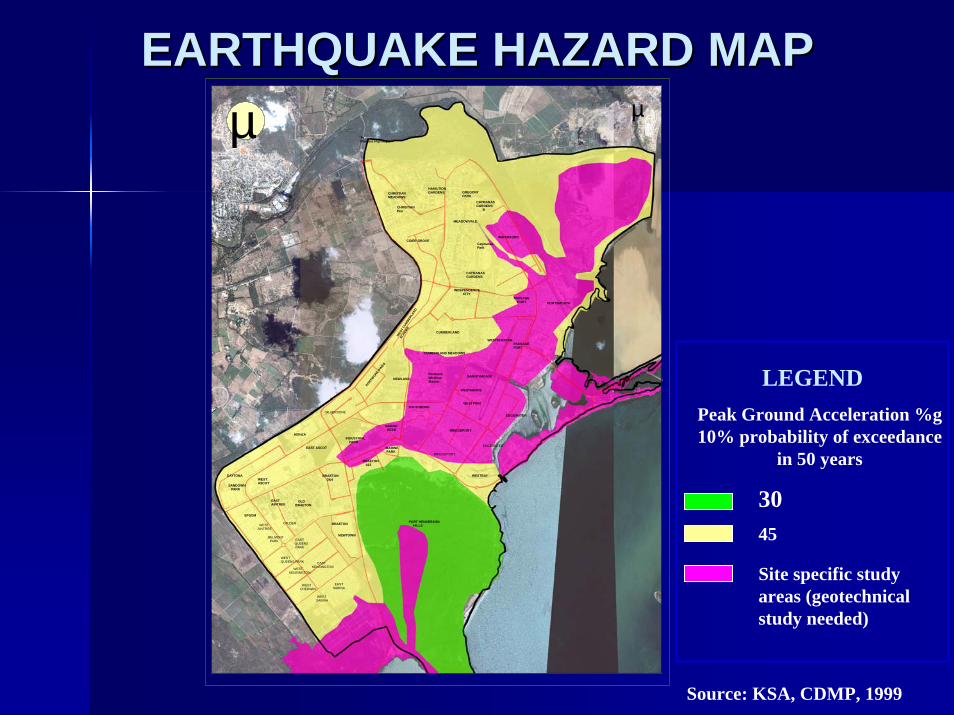
EARTHQUAKE HAZARD MAPEARTHQUAKE HAZARD MAP
CHRISTIANMEADOWS
CHRISTIANPen
HAMILTIONGARDENS GREGORY
PARK
CAYMANASGARDENS B
MEADOWVALE
CaymanasPark
WATERFORDCIDER GROVE
CAYMANASGARDENS
INDEPENDENCE CITY
PASSAGE PORT PORTSMOUTH
WES
T CUM
BERLA
ND
SCHEM
E
CUMBERLAND
WESTCHESTERPASSAGE FORT
EDGEWATER
WESTBAY
GARVEYMEADE
WESTMEADE
WESTPORT
BRIDGEPORT
CUMBERLAND MEADOWS
PortmoreWirelessStation
SOUTHBORO
PORTM
ORE PIN
ES
NAGGO HEAD
MARINE PARK
INDUSTRIAL PARK
BRAETON 1&2
SILVERSONE
EAST ASCOT
NEWLAND
BRAETON 3&4
OLDBRAETON
BRAETON
NEWTOWN
MONZA
WESTASCOT
EAST AINTREE
CALDER
EASTQUEENS PARK
EASTKENSINGTON
EASTSABINA
WESTSABINA
WESTCHEDWIN
WESTKENSINGTON
WESTQUEENS PARK
BELMONT PARK
WESTAINTREE
EPSOM
SANDOWN PARK
DAYTONA
ToMandela Highway
Causeway Road
EDGEWATER
BRIDGEPORT
PORT HENDERSON HILLS
µµ
Peak Ground Acceleration %g10% probability of exceedance
in 50 years
3045
Site specific study areas (geotechnical study needed)
LEGEND
Source: KSA, CDMP, 1999
STORM SURGESTORM SURGE
Data from Hurricanes Ivan (2004) and Data from Hurricanes Ivan (2004) and Dean (2007) used to generate flood Dean (2007) used to generate flood incident mapincident map
Storm Surge hazard and vulnerability Storm Surge hazard and vulnerability assessment conducted for Portmore under assessment conducted for Portmore under CDB funded project (Smith Warner and CDB funded project (Smith Warner and ESL)ESL)

STORM SURGE STORM SURGE INCIDENT MAPINCIDENT MAP
Hazard Vulnerability Hazard Vulnerability Assessment in an Urban Assessment in an Urban Area Area
Using Portmore case studyUsing Portmore case study

Table of ContentsTable of Contents
VulnerabilityVulnerabilityVulnerability Assessment MethodologyVulnerability Assessment MethodologySocietal AnalysisSocietal AnalysisBuilt Environment AnalysisBuilt Environment AnalysisCritical Facilities AnalysisCritical Facilities AnalysisConclusions and LimitationsConclusions and Limitations
Vulnerability Vulnerability
What is VulnerabilityWhat is Vulnerability
““The likelihood that an individual or group will be The likelihood that an individual or group will be exposed to and adversely affected by a hazard. It is exposed to and adversely affected by a hazard. It is the interaction of the hazards of place (risk and the interaction of the hazards of place (risk and migration) with the social profile of communitiesmigration) with the social profile of communities””(Susan Cutter, 1993). (Susan Cutter, 1993).
Vulnerability Assessment Vulnerability Assessment Methodology Methodology
Hazard identification & analysisHazard identification & analysis
Vulnerability analysis which Vulnerability analysis which includedincluded
Societal analysisSocietal analysisBuilt Environment AnalysisBuilt Environment AnalysisCritical Facilities AnalysisCritical Facilities Analysis
Societal Analysis Societal Analysis
Identification of the Vulnerable groupsIdentification of the Vulnerable groupsData Acquisition Data Acquisition Calculation of Social Vulnerability Calculation of Social Vulnerability ScoreScore

Societal Analysis cont.Societal Analysis cont.
Identification of the Vulnerable groupsIdentification of the Vulnerable groups–– Youth and Infant PopulationYouth and Infant Population–– Female PopulationFemale Population–– Elderly PopulationElderly Population–– Total PopulationTotal Population
Data AcquisitionData Acquisition–– The Portmore enumeration data obtained from The Portmore enumeration data obtained from
Statistical Institute of JamaicaStatistical Institute of Jamaica
Societal Analysis cont.Societal Analysis cont.
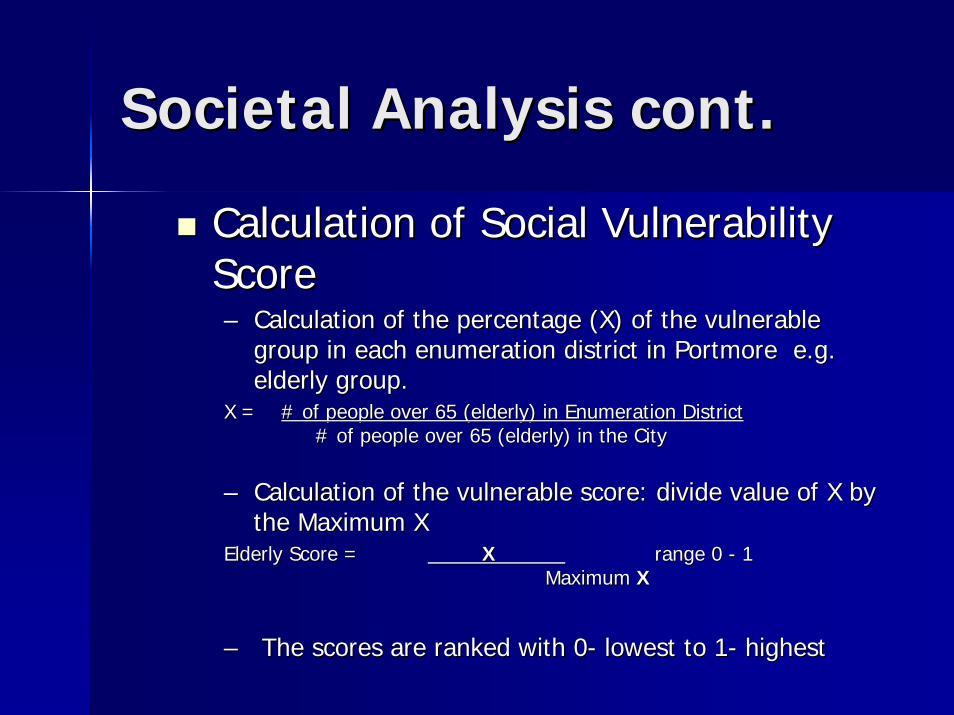
Calculation of Social Vulnerability Calculation of Social Vulnerability ScoreScore–– Calculation of the percentage (X) of the vulnerable Calculation of the percentage (X) of the vulnerable
group in each enumeration district in Portmore e.g. group in each enumeration district in Portmore e.g. elderly group.elderly group.
X = X = # of people over 65 (elderly) in Enumeration District# of people over 65 (elderly) in Enumeration District# of people over 65 (elderly) in the City# of people over 65 (elderly) in the City
–– Calculation of the vulnerable score: divide value of X by Calculation of the vulnerable score: divide value of X by the Maximum Xthe Maximum X
Elderly Score = Elderly Score = XX range 0 range 0 -- 11Maximum Maximum XX
–– The scores are ranked with 0The scores are ranked with 0-- lowest to 1lowest to 1-- highesthighest
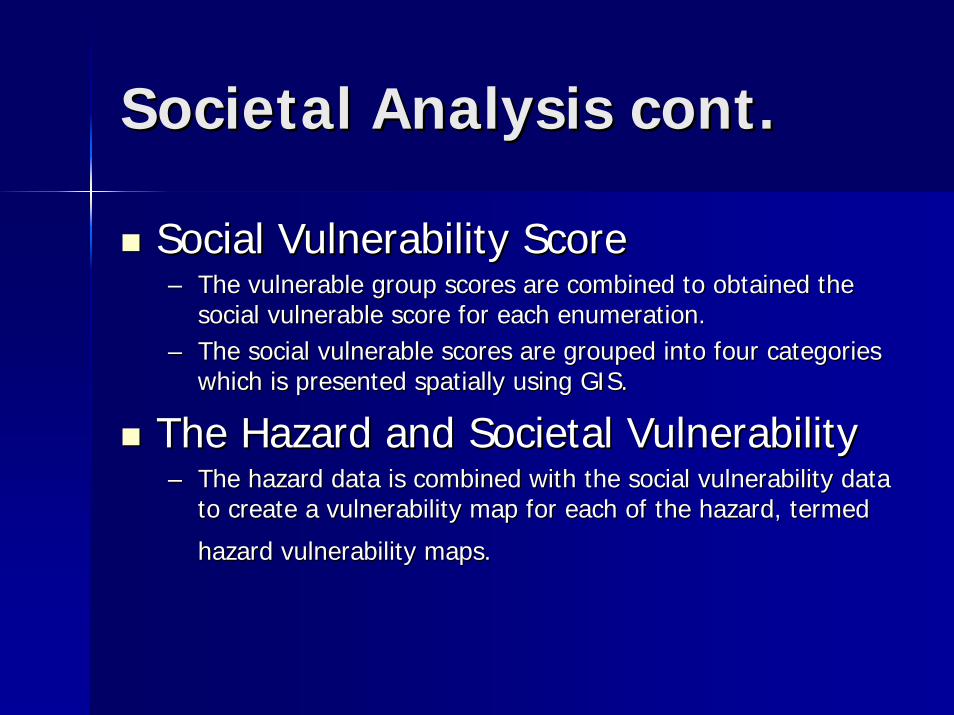
Societal Analysis cont.Societal Analysis cont.
Social Vulnerability ScoreSocial Vulnerability Score–– The vulnerable group scores are combined to obtained the The vulnerable group scores are combined to obtained the
social vulnerable score for each enumeration. social vulnerable score for each enumeration. –– The social vulnerable scores are grouped into four categories The social vulnerable scores are grouped into four categories
which is presented spatially using GIS. which is presented spatially using GIS.
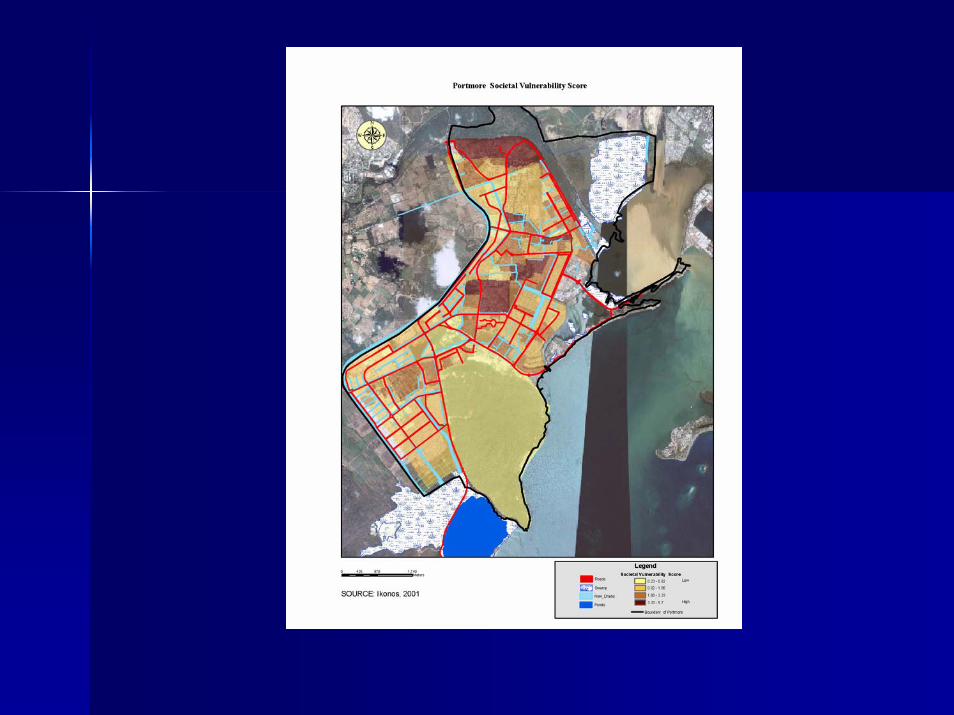
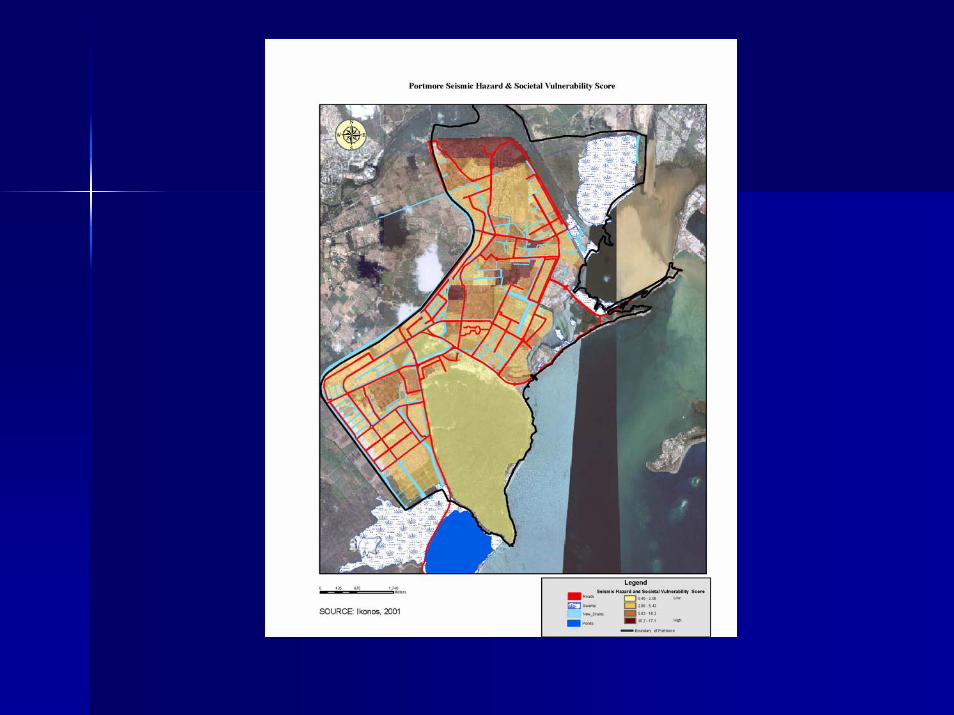
The Hazard and Societal VulnerabilityThe Hazard and Societal Vulnerability–– The hazard data is combined with the social vulnerability data The hazard data is combined with the social vulnerability data
to create a vulnerability map for each of the hazard, termed to create a vulnerability map for each of the hazard, termed
hazard vulnerability maps.hazard vulnerability maps.
Built Environment Built Environment AnalysisAnalysis
The Built EnvironmentThe Built Environment–– ResidentResident–– CommercialCommercial
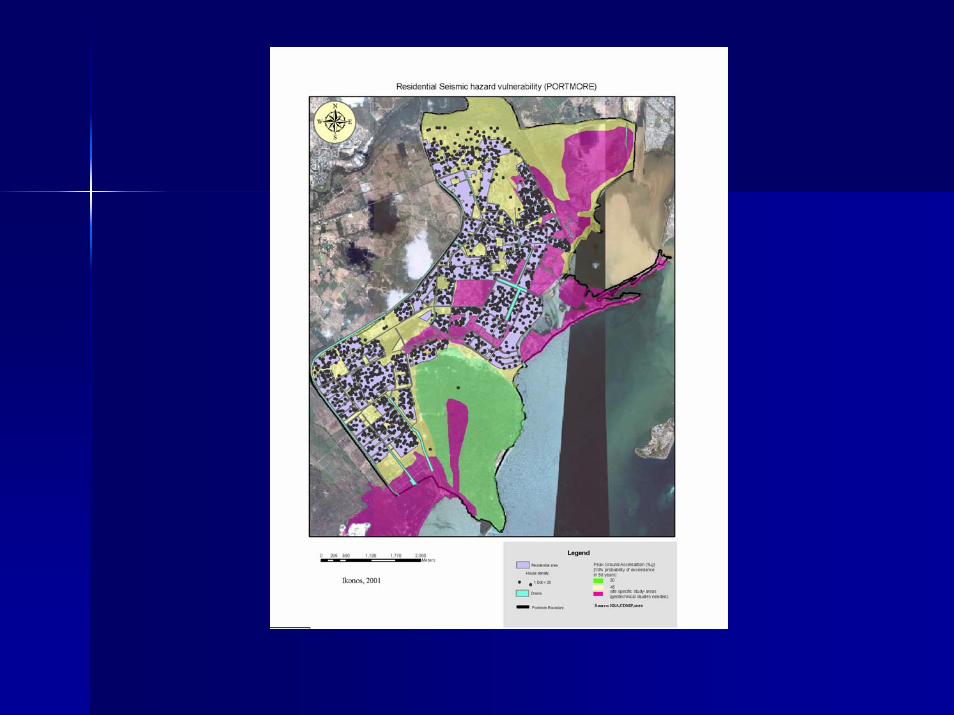
The Residential Built Environment The Residential Built Environment –– Residential environs are group based on the various Residential environs are group based on the various
communities in the Portmore.communities in the Portmore.–– The residential built environment is represented as dot The residential built environment is represented as dot
density to ascertain the spatial distribution of the households.density to ascertain the spatial distribution of the households.
–– The residential area is subsequently overlain on the seismic The residential area is subsequently overlain on the seismic data and represented spatially using GIS.data and represented spatially using GIS.
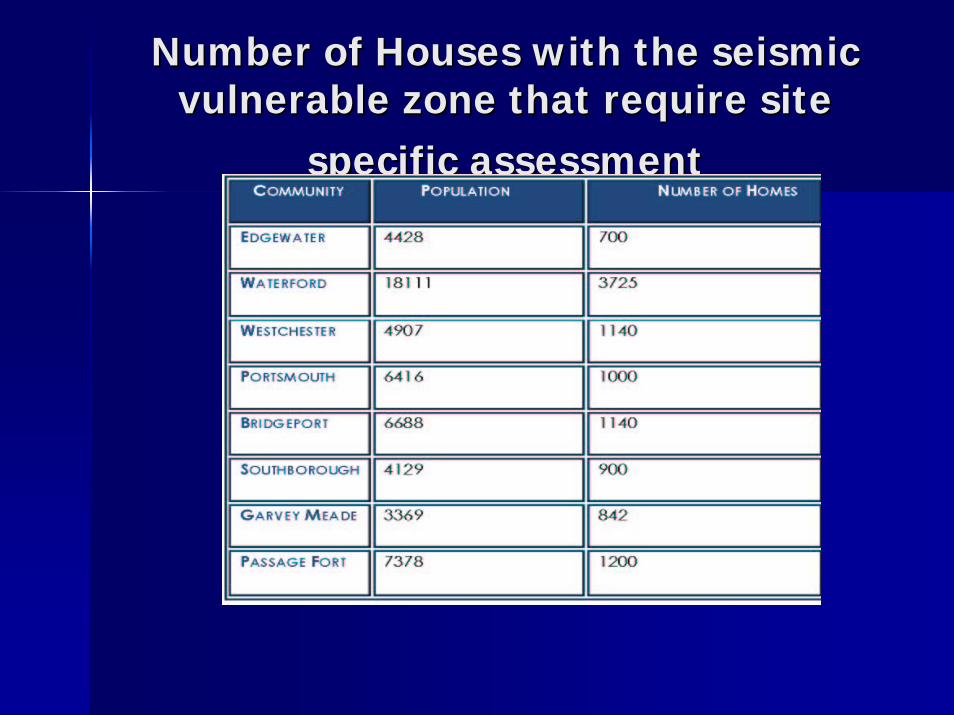
Number of Houses with the seismic Number of Houses with the seismic vulnerable zone that require site vulnerable zone that require site
specific assessmentspecific assessment
Built Environment Built Environment Analysis cont.Analysis cont.
The Commercial Built EnvironmentThe Commercial Built Environment–– The commercial areas were spatially analyzed with respect to The commercial areas were spatially analyzed with respect to
the seismic data and areas that were located within the the seismic data and areas that were located within the seismic specific zone identified.seismic specific zone identified.
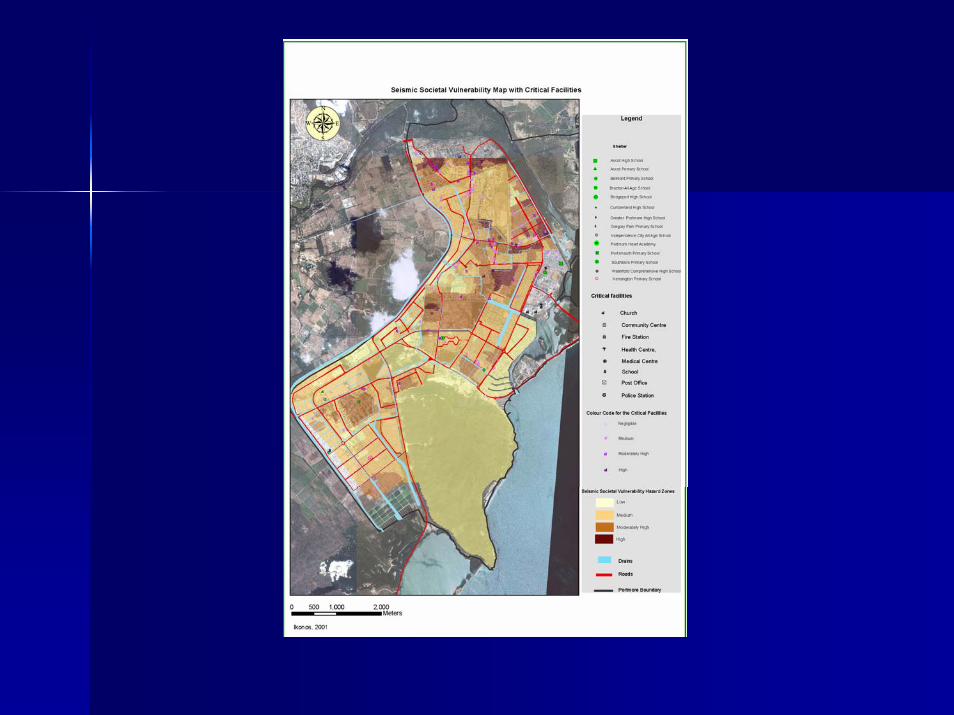
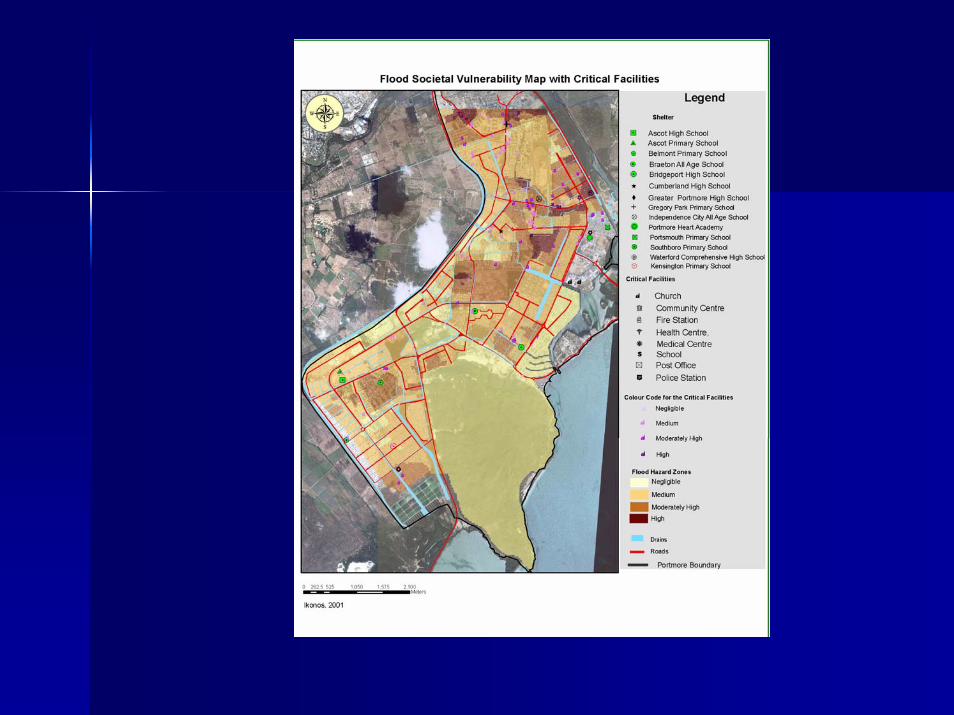
Critical Facilities AnalysisCritical Facilities Analysis
Identification of the Critical Facilities Identification of the Critical Facilities –– The critical facilities are located using data from the NationalThe critical facilities are located using data from the National
Land AgencyLand Agency–– The critical facilities are overlain on the Hazard vulnerabilityThe critical facilities are overlain on the Hazard vulnerability
maps.maps.–– The critical facilities are colour The critical facilities are colour --coded according to the coded according to the
hazard vulnerability zone they are situated in. hazard vulnerability zone they are situated in.
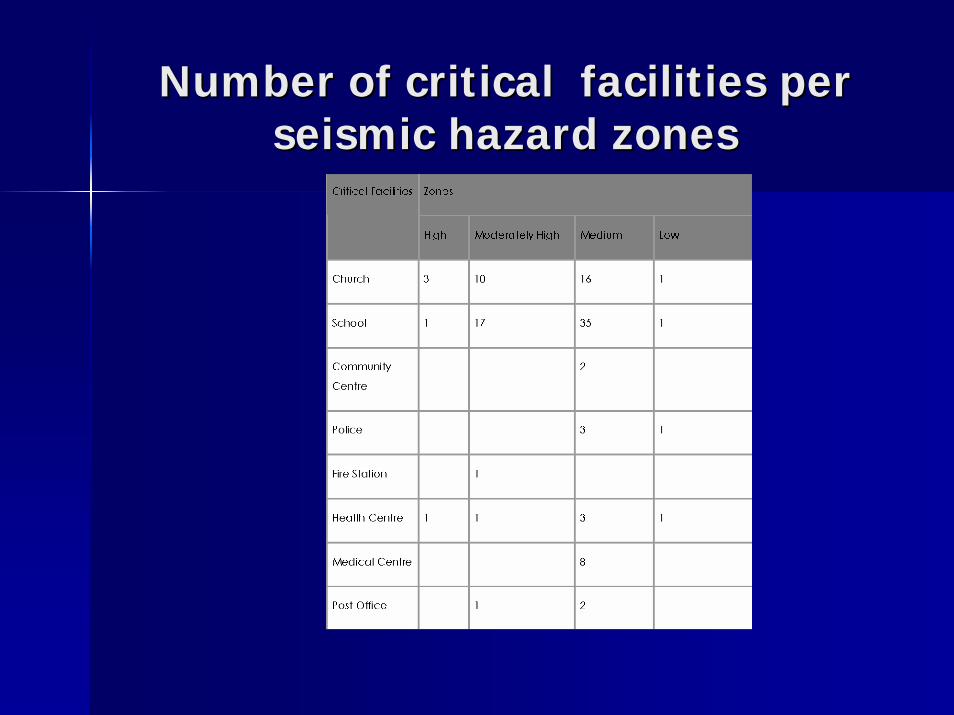
Number of critical facilities per Number of critical facilities per seismic hazard zonesseismic hazard zones
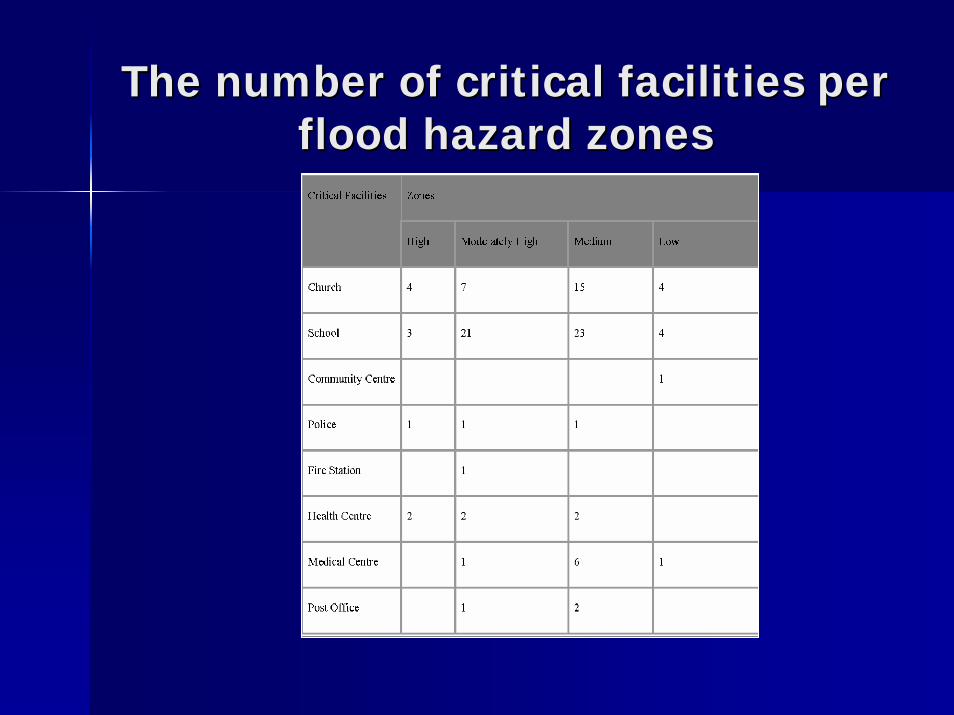
The number of critical facilities per The number of critical facilities per flood hazard zonesflood hazard zones
Conclusions and Conclusions and LimitationsLimitations
The urban areas such as Portmore are The urban areas such as Portmore are vulnerable to various hazards. vulnerable to various hazards. The vulnerability to these hazard The vulnerability to these hazard involve both the natural factors as well involve both the natural factors as well as socioas socio--economic factorseconomic factors
REFERENCESREFERENCES
Cutter, S. L., 1993. Cutter, S. L., 1993. Living with RiskLiving with Risk. London: . London: Edward Arnold. 214 pp Edward Arnold. 214 pp Cutter, S. L., Mitchell, J.T and Scott, M. S., 1997. Cutter, S. L., Mitchell, J.T and Scott, M. S., 1997. Handbook For Conducting A GISHandbook For Conducting A GIS-- Based Hazard Based Hazard Assessment at The County Level. Report, South Assessment at The County Level. Report, South Carolina Emergency Preparedness Division, and Carolina Emergency Preparedness Division, and Hazard Research Lab, Department of Geography, Hazard Research Lab, Department of Geography,
University of South CarolinaUniversity of South Carolina


