Download - Nature Comms 2015

ARTICLE
Received 26 May 2015 | Accepted 23 Oct 2015 | Published 3 Dec 2015
Osteoclasts control reactivation of dormantmyeloma cells by remodelling the endosteal nicheMichelle A. Lawson1,2,*, Michelle M. McDonald3,4,*, Natasa Kovacic3, Weng Hua Khoo3,5, Rachael L. Terry3,4,
Jenny Down3, Warren Kaplan3,4, Julia Paton-Hough1,2, Clair Fellows1,2, Jessica A. Pettitt3, T. Neil Dear6,
Els Van Valckenborgh7, Paul A. Baldock3,4, Michael J. Rogers3,4, Colby L. Eaton2,8, Karin Vanderkerken7,
Allison R. Pettit9, Julian M.W. Quinn3, Andrew C.W. Zannettino6,10, Tri Giang Phan 3,4 & Peter I. Croucher3,4
Multiple myeloma is largely incurable, despite development of therapies that target myeloma
cell-intrinsic pathways. Disease relapse is thought to originate from dormant myeloma cells,
localized in specialized niches, which resist therapy and repopulate the tumour. However, little
is known about the niche, and how it exerts cell-extrinsic control over myeloma cell dormancy
and reactivation. In this study, we track individual myeloma cells by intravital imaging as they
colonize the endosteal niche, enter a dormant state and subsequently become activated to
form colonies. We demonstrate that dormancy is a reversible state that is switched ‘on’
by engagement with bone-lining cells or osteoblasts, and switched ‘off’ by osteoclasts
remodelling the endosteal niche. Dormant myeloma cells are resistant to chemotherapy that
targets dividing cells. The demonstration that the endosteal niche is pivotal in controlling
myeloma cell dormancy highlights the potential for targeting cell-extrinsic mechanisms to
overcome cell-intrinsic drug resistance and prevent disease relapse.
DOI: 10.1038/ncomms9983 OPEN
1 Department of Oncology, University of Sheffield Medical School, University of Sheffield, Beech Hill Road, Sheffield, South Yorkshire S10 2RX, UK. 2 MellanbyCentre for Bone Research, University of Sheffield Medical School, University of Sheffield, Beech Hill Road, Sheffield, South Yorkshire S10 2RX, UK. 3 GarvanInstitute of Medical Research, 384 Victoria Street, Sydney, New South Wales 2010, Australia. 4 St Vincent’s Clinical School, Faculty of Medicine, UNSWAustralia, Sydney, New South Wales 2010, Australia. 5 School of Biotechnology and Biomolecular Sciences, UNSW Australia, Sydney, New South Wales 2010,Australia. 6 South Australian Health and Medical Research Institute, Adelaide, South Australia 5000, Australia. 7 Department of Hematology andImmunology, Vrije Universiteit Brussel, Brussels 1090, Belgium. 8 Department of Human Metabolism and Clinical Biochemistry, University of SheffieldMedical School, University of Sheffield, Beech Hill Road, Sheffield, South Yorkshire S10 2RX, UK. 9 Mater Research Institute, The University of Queensland,Translational Research Institute, 37 Kent Street, Woolloongabba, Queensland 4102, Australia. 10 School of Medical Sciences, University of Adelaide, FromeRoad, Adelaide, South Australia 5000, Australia. * These authors contributed equally to this work. Correspondence and requests for materials should beaddressed to T.G.P. (email: [email protected]) or to P.I.C. (email: [email protected]).
NATURE COMMUNICATIONS | 6:8983 | DOI: 10.1038/ncomms9983 | www.nature.com/naturecommunications 1
Cancer cell dormancy is a poorly understood and oftenneglected stage in the evolution of many cancers, whereextrinsic signals from the tumour microenvironment
suppress active growth and proliferation, until more favourableconditions arise1,2. This is a major clinical problem, as dormantcancer cells may disseminate at an early stage in the disease3,become resistant to conventional therapies that target dividingcells1 and persist as minimal residual disease (MRD), which canbe reactivated to promote disease relapse long after treatmentcessation4. In the skeleton, dormant cells may co-exist inequilibrium with the bone microenvironment for years beforereactivation and clinical relapse. In this regard, multiplemyeloma, a primary haematological malignancy arising in bone,exemplifies the major therapeutic challenges posed by cancer celldormancy. While novel therapies that selectively target cell‘intrinsic’ cancer properties have improved survival5, patientscontinue to relapse and myeloma remains largely incurable.Hence, understanding the ‘extrinsic’ environmental factorsthat regulate myeloma cell dormancy is required to delivercomplementary treatment strategies to overcome drug resistanceand achieve complete remission and cure.
Recently, whole-genome sequencing has identified key drivermutations and complex mutation patterns during the naturalhistory of myeloma within individual patients6. Theselongitudinal analyses have revealed marked intra-clonalheterogeneity and shifting clonal dominance during diseaseprogression and in response to drug treatments7–9. The ‘waxingand waning’ of different myeloma clones (clonal tides) suggeststhat cancer cell growth and proliferation are not fixed geneticprogrammes8,9 that follow a linear model, but rather a branchingand parallel, ‘Darwinian’, model of clonal evolution that is subjectto external selective pressures6,10. These data suggest thatmyeloma cell clones are able to reversibly switch ‘on’ or ‘off’depending on the presence of favourable or unfavourableenvironmental signals. A critical component of this tumourmicroenvironment is the bone niche where myeloma cells initiallycolonize and are believed to reside11. However, the nature of thisniche and mechanisms that control myeloma cell occupancy arepoorly defined.
Haematopoietic stem cells (HSCs) have long been known tooccupy unique niches within the bone marrow microenvironmentand this controls HSC dormancy, self-renewal and mobilization.These specialized microenvironments contain cells of theosteogenic lineage, perivascular cells and/or endothelial cells,and remodelling of these niches by osteoclasts regulates nicheoccupancy12–18. More recently, leukaemic cells and other cancercells, including prostate cancer cells, have been shown to engraftin the HSC niche19–21. However, despite the importance of theniche in controlling tumour cell engraftment, the dynamicinteractions between colonizing cancer cells and components ofthese specialized niches, and the impact of these interactions onthe long-term fate of these cells, is poorly understood.
Studying the dynamic interactions between dormant myelomacells and the bone niche is particularly challenging, because itrequires high-resolution deep-tissue imaging through intact bonein a live animal. Nevertheless, intravital microscopy of the bonemarrow space beneath the bregma in the calvarium22 has beensuccessfully used to study haematopoiesis23 and the HSCniche24–27, and has recently been applied to study thecolonization of bone by leukaemic and myeloma cells20,28.However, to date, non-destructive microscopic imaging overperiods of weeks to months is yet to be performed tolongitudinally track the fate of the same individual myeloma cellsas they become activated and escape dormancy. This would be asignificant advance on longitudinal imaging by bioluminescence,which lacks the image resolution and potential for simultaneous
visualization of the cells and structures that make up the boneniche. Furthermore, it would have distinct advantages over cross-sectional intravital microscopy, which may not capture theheterogeneity within and between different animals. Nevertheless,to image dormant myeloma cells in vivo, a robust method isrequired to discriminate resting from actively dividing cancer cells.Intravital dyes such as carboxyfluorescein succinimidyl ester, whichlabel intracellular proteins, have relatively short half-lives and areunsuitable for the study of long-term cancer cell dormancy.Fluorescent stem cell markers have been used to track HSCs andstudy the epithelial stem cell niche, but these reporters may lackspecificity when used in isolation29–32.
To address this, here we have developed a method for dynamiclongitudinal imaging of dormant myeloma cells within intact longbones of mice using intravital two-photon microscopy. Myelomacells are double-labelled with both fixed genetic reporters andlipophilic membrane dyes, which are retained by non-dividingmyeloma cells. Intravital microscopy is used to resolve singletumour cells as they arrive in bone and engage in the bone niche,to track the transition from dormancy to active growth, and tofollow the serial growth of tumour colonies by repeated imagingof the same mouse at weekly intervals. These studies show thatmyeloma cells can be held in a dormant state by osteoblast-likecells in the endosteal niche, and this state confers dormant cellswith drug resistance. Furthermore, direct activation of osteoclastscan remodel the endosteal surface to release dormant myelomacells from the niche and stochastically facilitate their reactivationto repopulate the tumour. Thus, myeloma cell dormancy is areversible state controlled by the extrinsic bone microenviron-ment, which can be manipulated to change the course of thedisease.
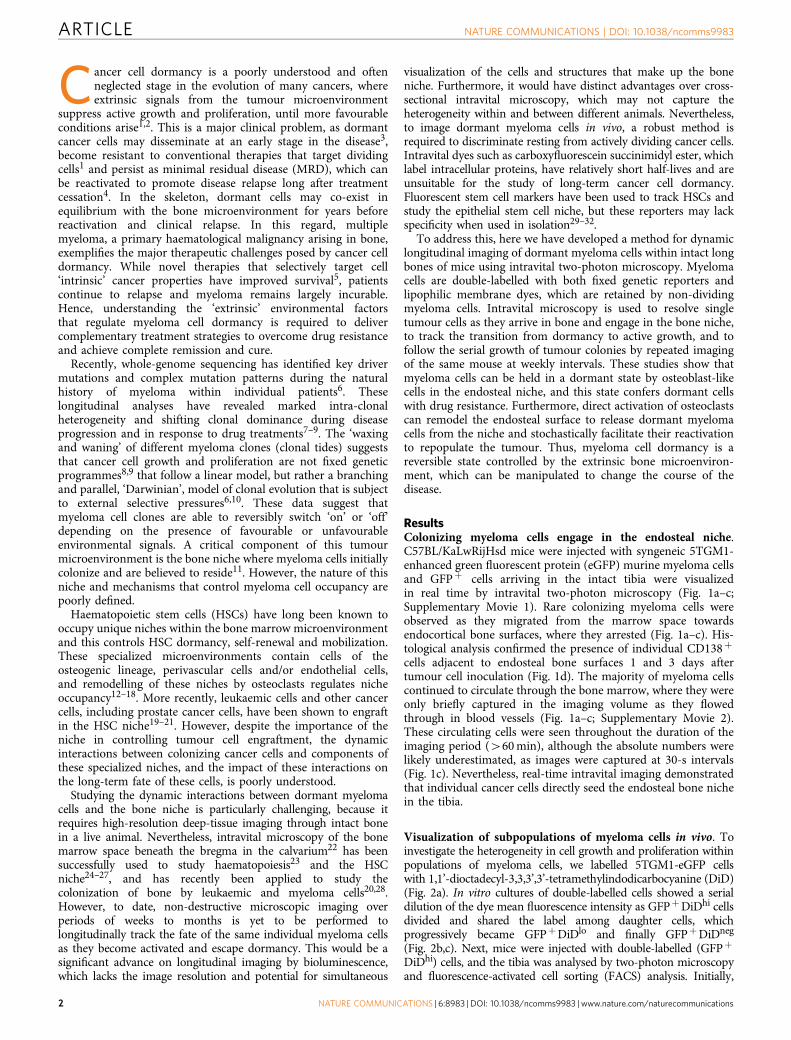
ResultsColonizing myeloma cells engage in the endosteal niche.C57BL/KaLwRijHsd mice were injected with syngeneic 5TGM1-enhanced green fluorescent protein (eGFP) murine myeloma cellsand GFPþ cells arriving in the intact tibia were visualizedin real time by intravital two-photon microscopy (Fig. 1a–c;Supplementary Movie 1). Rare colonizing myeloma cells wereobserved as they migrated from the marrow space towardsendocortical bone surfaces, where they arrested (Fig. 1a–c). His-tological analysis confirmed the presence of individual CD138þ
cells adjacent to endosteal bone surfaces 1 and 3 days aftertumour cell inoculation (Fig. 1d). The majority of myeloma cellscontinued to circulate through the bone marrow, where they wereonly briefly captured in the imaging volume as they flowedthrough in blood vessels (Fig. 1a–c; Supplementary Movie 2).These circulating cells were seen throughout the duration of theimaging period (460 min), although the absolute numbers werelikely underestimated, as images were captured at 30-s intervals(Fig. 1c). Nevertheless, real-time intravital imaging demonstratedthat individual cancer cells directly seed the endosteal bone nichein the tibia.
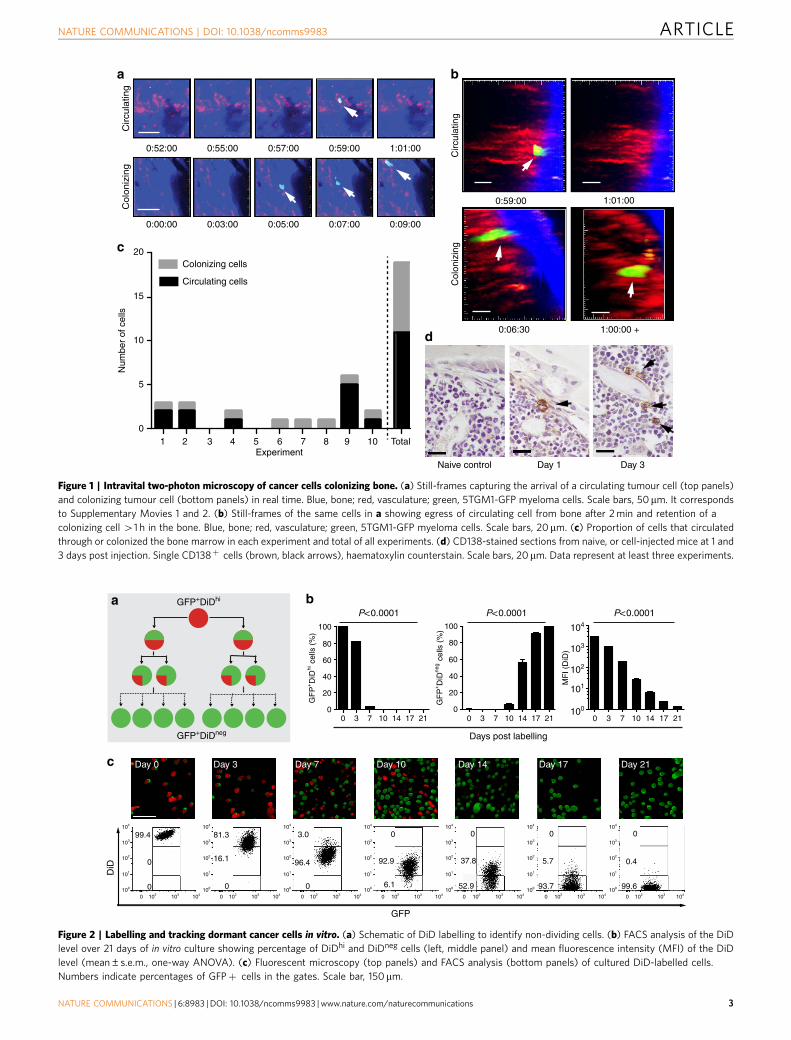
Visualization of subpopulations of myeloma cells in vivo. Toinvestigate the heterogeneity in cell growth and proliferation withinpopulations of myeloma cells, we labelled 5TGM1-eGFP cellswith 1,1’-dioctadecyl-3,3,3’,3’-tetramethylindodicarbocyanine (DiD)(Fig. 2a). In vitro cultures of double-labelled cells showed a serialdilution of the dye mean fluorescence intensity as GFPþDiDhi cellsdivided and shared the label among daughter cells, whichprogressively became GFPþDiDlo and finally GFPþDiDneg
(Fig. 2b,c). Next, mice were injected with double-labelled (GFPþ
DiDhi) cells, and the tibia was analysed by two-photon microscopyand fluorescence-activated cell sorting (FACS) analysis. Initially,
ARTICLE NATURE COMMUNICATIONS | DOI: 10.1038/ncomms9983
2 NATURE COMMUNICATIONS | 6:8983 | DOI: 10.1038/ncomms9983 | www.nature.com/naturecommunications
0:00:00 0:03:00 0:05:00 0:07:00 0:09:00
Co
lon
izin
gC
ircu
latin
g
Col
oniz
ing
Circ
ulat
ing
Naive control Day 1 Day 3
0:52:00 0:55:00 0:57:00 0:59:00 1:01:00
0:59:00 1:01:00
0:06:30 1:00:00 +
20
15
10
5
01 32 4 5 6 7 8 9 10 Total
Circulating cells
Colonizing cells
Num
ber
of c
ells
Experiment
a
c
b
d
Figure 1 | Intravital two-photon microscopy of cancer cells colonizing bone. (a) Still-frames capturing the arrival of a circulating tumour cell (top panels)
and colonizing tumour cell (bottom panels) in real time. Blue, bone; red, vasculature; green, 5TGM1-GFP myeloma cells. Scale bars, 50 mm. It corresponds
to Supplementary Movies 1 and 2. (b) Still-frames of the same cells in a showing egress of circulating cell from bone after 2 min and retention of a
colonizing cell 41 h in the bone. Blue, bone; red, vasculature; green, 5TGM1-GFP myeloma cells. Scale bars, 20mm. (c) Proportion of cells that circulated
through or colonized the bone marrow in each experiment and total of all experiments. (d) CD138-stained sections from naive, or cell-injected mice at 1 and
3 days post injection. Single CD138þ cells (brown, black arrows), haematoxylin counterstain. Scale bars, 20mm. Data represent at least three experiments.
Day 0 Day 7Day 3 Day 14Day 10 Day 17 Day 21
DiD
0 3 7 10 14 17 21
104
103
102
101
100
MF
I (D
iD)
0 3 7 10 14 17 210
20
40
60
80
100
0 3 7 10 14 17 21
100
Days post labelling
GF
P+D
iDhi c
ells
(%
)
GF
P+D
iDne
g cel
ls (
%)
GFP+DiDhi
GFP+DiDneg
0
20
40
60
80
0
99.4
0
16.1
81.3
0
3.0
0
0
6.1
0
37.8
0
5.7
0
0.496.4 92.9
52.9 93.7 99.6
P<0.0001 P<0.0001 P<0.0001
GFP
104
103
102
101
100
104
103
102
101
100
104
103
102
101
100
104
103
102
101
100
104
103
102
101
100
102 103 1040 102 103 1040 102 103 1040 102 103 1040 102 103 1040 102 103 1040
104
103
102
101
100
104
103
102
101
100
102 103 1040
a
c
b
Figure 2 | Labelling and tracking dormant cancer cells in vitro. (a) Schematic of DiD labelling to identify non-dividing cells. (b) FACS analysis of the DiD
level over 21 days of in vitro culture showing percentage of DiDhi and DiDneg cells (left, middle panel) and mean fluorescence intensity (MFI) of the DiD
level (mean±s.e.m., one-way ANOVA). (c) Fluorescent microscopy (top panels) and FACS analysis (bottom panels) of cultured DiD-labelled cells.
Numbers indicate percentages of GFPþ cells in the gates. Scale bar, 150 mm.
NATURE COMMUNICATIONS | DOI: 10.1038/ncomms9983 ARTICLE
NATURE COMMUNICATIONS | 6:8983 | DOI: 10.1038/ncomms9983 | www.nature.com/naturecommunications 3
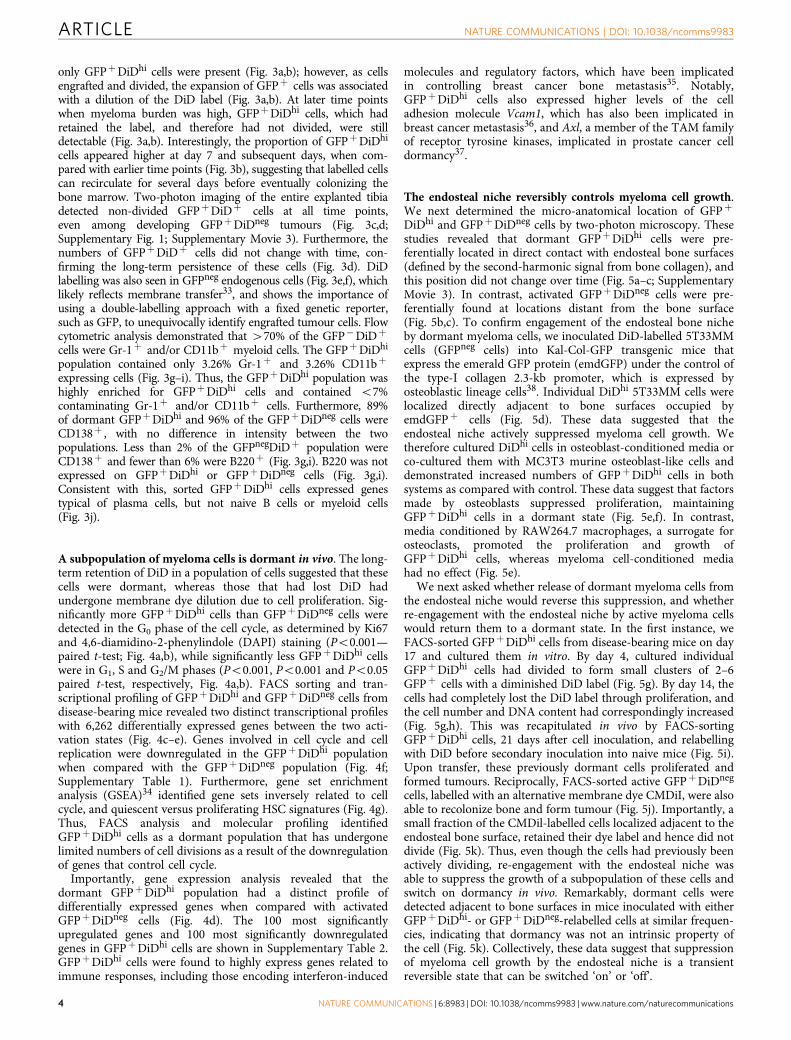
only GFPþDiDhi cells were present (Fig. 3a,b); however, as cellsengrafted and divided, the expansion of GFPþ cells was associatedwith a dilution of the DiD label (Fig. 3a,b). At later time pointswhen myeloma burden was high, GFPþDiDhi cells, which hadretained the label, and therefore had not divided, were stilldetectable (Fig. 3a,b). Interestingly, the proportion of GFPþDiDhi
cells appeared higher at day 7 and subsequent days, when com-pared with earlier time points (Fig. 3b), suggesting that labelled cellscan recirculate for several days before eventually colonizing thebone marrow. Two-photon imaging of the entire explanted tibiadetected non-divided GFPþDiDþ cells at all time points,even among developing GFPþDiDneg tumours (Fig. 3c,d;Supplementary Fig. 1; Supplementary Movie 3). Furthermore, thenumbers of GFPþDiDþ cells did not change with time, con-firming the long-term persistence of these cells (Fig. 3d). DiDlabelling was also seen in GFPneg endogenous cells (Fig. 3e,f), whichlikely reflects membrane transfer33, and shows the importance ofusing a double-labelling approach with a fixed genetic reporter,such as GFP, to unequivocally identify engrafted tumour cells. Flowcytometric analysis demonstrated that 470% of the GFP�DiDþ
cells were Gr-1þ and/or CD11bþ myeloid cells. The GFPþDiDhi
population contained only 3.26% Gr-1þ and 3.26% CD11bþ
expressing cells (Fig. 3g–i). Thus, the GFPþDiDhi population washighly enriched for GFPþDiDhi cells and contained o7%contaminating Gr-1þ and/or CD11bþ cells. Furthermore, 89%of dormant GFPþDiDhi and 96% of the GFPþDiDneg cells wereCD138þ , with no difference in intensity between the twopopulations. Less than 2% of the GFPnegDiDþ population wereCD138þ and fewer than 6% were B220þ (Fig. 3g,i). B220 was notexpressed on GFPþDiDhi or GFPþDiDneg cells (Fig. 3g,i).Consistent with this, sorted GFPþDiDhi cells expressed genestypical of plasma cells, but not naive B cells or myeloid cells(Fig. 3j).
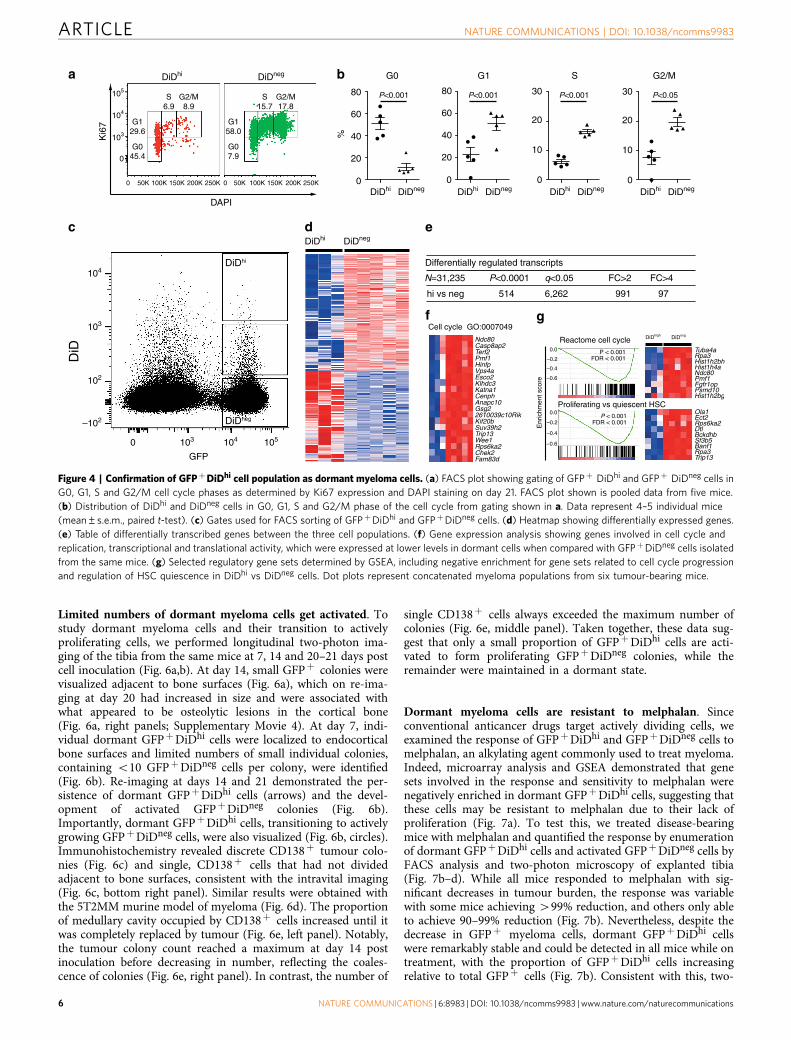
A subpopulation of myeloma cells is dormant in vivo. The long-term retention of DiD in a population of cells suggested that thesecells were dormant, whereas those that had lost DiD hadundergone membrane dye dilution due to cell proliferation. Sig-nificantly more GFPþDiDhi cells than GFPþDiDneg cells weredetected in the G0 phase of the cell cycle, as determined by Ki67and 4,6-diamidino-2-phenylindole (DAPI) staining (Po0.001—paired t-test; Fig. 4a,b), while significantly less GFPþDiDhi cellswere in G1, S and G2/M phases (Po0.001, Po0.001 and Po0.05paired t-test, respectively, Fig. 4a,b). FACS sorting and tran-scriptional profiling of GFPþDiDhi and GFPþDiDneg cells fromdisease-bearing mice revealed two distinct transcriptional profileswith 6,262 differentially expressed genes between the two acti-vation states (Fig. 4c–e). Genes involved in cell cycle and cellreplication were downregulated in the GFPþDiDhi populationwhen compared with the GFPþDiDneg population (Fig. 4f;Supplementary Table 1). Furthermore, gene set enrichmentanalysis (GSEA)34 identified gene sets inversely related to cellcycle, and quiescent versus proliferating HSC signatures (Fig. 4g).Thus, FACS analysis and molecular profiling identifiedGFPþDiDhi cells as a dormant population that has undergonelimited numbers of cell divisions as a result of the downregulationof genes that control cell cycle.
Importantly, gene expression analysis revealed that thedormant GFPþDiDhi population had a distinct profile ofdifferentially expressed genes when compared with activatedGFPþDiDneg cells (Fig. 4d). The 100 most significantlyupregulated genes and 100 most significantly downregulatedgenes in GFPþDiDhi cells are shown in Supplementary Table 2.GFPþDiDhi cells were found to highly express genes related toimmune responses, including those encoding interferon-induced
molecules and regulatory factors, which have been implicatedin controlling breast cancer bone metastasis35. Notably,GFPþDiDhi cells also expressed higher levels of the celladhesion molecule Vcam1, which has also been implicated inbreast cancer metastasis36, and Axl, a member of the TAM familyof receptor tyrosine kinases, implicated in prostate cancer celldormancy37.
The endosteal niche reversibly controls myeloma cell growth.We next determined the micro-anatomical location of GFPþ
DiDhi and GFPþDiDneg cells by two-photon microscopy. Thesestudies revealed that dormant GFPþDiDhi cells were pre-ferentially located in direct contact with endosteal bone surfaces(defined by the second-harmonic signal from bone collagen), andthis position did not change over time (Fig. 5a–c; SupplementaryMovie 3). In contrast, activated GFPþDiDneg cells were pre-ferentially found at locations distant from the bone surface(Fig. 5b,c). To confirm engagement of the endosteal bone nicheby dormant myeloma cells, we inoculated DiD-labelled 5T33MMcells (GFPneg cells) into Kal-Col-GFP transgenic mice thatexpress the emerald GFP protein (emdGFP) under the control ofthe type-I collagen 2.3-kb promoter, which is expressed byosteoblastic lineage cells38. Individual DiDhi 5T33MM cells werelocalized directly adjacent to bone surfaces occupied byemdGFPþ cells (Fig. 5d). These data suggested that theendosteal niche actively suppressed myeloma cell growth. Wetherefore cultured DiDhi cells in osteoblast-conditioned media orco-cultured them with MC3T3 murine osteoblast-like cells anddemonstrated increased numbers of GFPþDiDhi cells in bothsystems as compared with control. These data suggest that factorsmade by osteoblasts suppressed proliferation, maintainingGFPþDiDhi cells in a dormant state (Fig. 5e,f). In contrast,media conditioned by RAW264.7 macrophages, a surrogate forosteoclasts, promoted the proliferation and growth ofGFPþDiDhi cells, whereas myeloma cell-conditioned mediahad no effect (Fig. 5e).
We next asked whether release of dormant myeloma cells fromthe endosteal niche would reverse this suppression, and whetherre-engagement with the endosteal niche by active myeloma cellswould return them to a dormant state. In the first instance, weFACS-sorted GFPþDiDhi cells from disease-bearing mice on day17 and cultured them in vitro. By day 4, cultured individualGFPþDiDhi cells had divided to form small clusters of 2–6GFPþ cells with a diminished DiD label (Fig. 5g). By day 14, thecells had completely lost the DiD label through proliferation, andthe cell number and DNA content had correspondingly increased(Fig. 5g,h). This was recapitulated in vivo by FACS-sortingGFPþDiDhi cells, 21 days after cell inoculation, and relabellingwith DiD before secondary inoculation into naive mice (Fig. 5i).Upon transfer, these previously dormant cells proliferated andformed tumours. Reciprocally, FACS-sorted active GFPþDiDneg
cells, labelled with an alternative membrane dye CMDiI, were alsoable to recolonize bone and form tumour (Fig. 5j). Importantly, asmall fraction of the CMDil-labelled cells localized adjacent to theendosteal bone surface, retained their dye label and hence did notdivide (Fig. 5k). Thus, even though the cells had previously beenactively dividing, re-engagement with the endosteal niche wasable to suppress the growth of a subpopulation of these cells andswitch on dormancy in vivo. Remarkably, dormant cells weredetected adjacent to bone surfaces in mice inoculated with eitherGFPþDiDhi- or GFPþDiDneg-relabelled cells at similar frequen-cies, indicating that dormancy was not an intrinsic property ofthe cell (Fig. 5k). Collectively, these data suggest that suppressionof myeloma cell growth by the endosteal niche is a transientreversible state that can be switched ‘on’ or ‘off’.
ARTICLE NATURE COMMUNICATIONS | DOI: 10.1038/ncomms9983
4 NATURE COMMUNICATIONS | 6:8983 | DOI: 10.1038/ncomms9983 | www.nature.com/naturecommunications
GFP
DiD
Day 3100
0
0
Day 1011.8
29.7
55.2
Day 140.4
1.7
97.5
Day 170.05
0.5
99.2
Day 210.06
0.4
99.5
Day 21Day 3
0.00
0.02
0.04
0.06
GF
P+D
iDhi c
ells
(%
of B
M)
GFP+DiDhi GFP-negDiDhiGFP+DiDneg GFP+ DiDhi GFPneg DiDhiGFP+ DiDneg
GF
P+D
iDhi c
ells
(×
103 )
/mm
3
GF
P+D
iDne
g cel
ls
(% o
f BM
)Day post injection
0 3 7 10 14 17 21
0.08
Days post injection
1 3 7 10 14 17 210
2
4
6
8
0 3 7 10 14 17 210
20
40
60P<0.0001
Day post injection
GFP
DiD
No cells GFP+ cells GFPneg DiD+cells
0.12 0.25 1.27
GFP
DiD
CD11b
Freq
uenc
y(n
orm
aliz
ed to
mod
e)Fr
eque
ncy
(nor
mal
ized
to m
ode)
Freq
uenc
y(n
orm
aliz
ed to
mod
e)Fr
eque
ncy
(nor
mal
ized
to m
ode)
3.26 0.083 60.1
3.26 0.37 61.0
Gr-1
CD138
B220
89.0 96.0 1.5
0.00 0.17 5.94
5
10
15
mR
NA
exp
ress
ion
leve
l (R
MA
log 2
)
Prdm1Sdc1
Igk-v28
Myb
Sfpl1 Ly
z1Pax5
Fcer2aCr
2
Plasma Näive B cell Macrophage
CD11b
Gr-
1
4.89 2.17
91.8 1.09
0.55 0.070
99.4 9.98E-3
14.1 51.8
26.6 7.40
CD11b 2.19±3.74 0.08±0.05
Gr-1 1.91±3.27 0.35±0.15 52.96±20.51
CD138
B220 0.00±0.00 8.00±0.03
104
105
104
104
104
104
105
105
105
103
103
103
103
–103
–103
102
–103 103 104 105 –1030 103 104 105 –1030 103 104 1050
–103 103 104 105 –1030 103 104 105 –1030 103 104 1050
105
–1020 0 0
0
0
105
104
104 105
103
103
102
–102
0
105
104
104 105
103
103
102
–102
0
105
104
104 105
103
103
102
–102
0
0
0 104 105103–103 0 104 105103–103 0
103
102
101
100
100 101 102 103 104
Day 763.8
31.9
2.1100 101 102 103 104 100 101 102 103 104 100 101 102 103 104 100 101 102 103 104 100 101 102 103 104
52.90±20.44
1.42±0.0196.58±0.0289.84±0.03
0.00±0.00
GFP+DiDneg
GFP+DiDneg
GFPneg DiD+Marker GFP+DiDhi
GFP+DiDhi
103 104 1050 103 104 1050 103 104 1050
103 1040 103 104 1050 103 104 1050
a
b
d
g h
i
j
e f
c
Figure 3 | Labelling and tracking dormant myeloma cells in vivo. (a) FACS analysis of bone marrow (BM) cells after inoculation of GFPþDiD-labelled
5TGM1-eGFP cells. Numbers indicate percentages in the gates. (b) Percentage of total BM of GFPþDiDhi dormant cells and GFPþDiDneg cells by FACS
analysis from a (individual data points and mean±s.e.m., one-way ANOVA). (c) Two-photon images of the metaphyseal region of explanted tibias
harvested at days 3 and 21. White, bone; red, GFPþDiDþ cells (white arrows); green, GFPþDiDneg cells. Scale bars, 200mm. (d) Enumeration of
GFPþDiDþ cells (meanþ s.e.m.). Data represent 4–5 individual mice. (e) FACS plots of BM samples from naive (no cells), mice injected with GFP cells not
labelled with DiD (GFPþDiDneg) or injected with DiD-labelled GFPþ cells (GFPþDiDþ), % of BM cells presented. (f) FACS plot demonstrating the three
populations of cells examined in g–i. (g) Histograms showing the frequency of cells that are CD11bþ , Gr-1þ , CD138þ or B220þ for each cell population
from f. (h) FACS plots showing distribution of CD11b and Gr-1-expressing cells in each GFP/DiD population from f. (i) Table showing the % of cells
(meanþ s.e.m.) that are CD11bþ , Gr-1þ , CD138þ or B220þ for each cell population from f. (j) Transcript profile of GFPþDiDhi and GFPþDiDneg cells
showing the expression level of plasma cell, naive B-cell and myeloid lineage genes.
NATURE COMMUNICATIONS | DOI: 10.1038/ncomms9983 ARTICLE
NATURE COMMUNICATIONS | 6:8983 | DOI: 10.1038/ncomms9983 | www.nature.com/naturecommunications 5
Limited numbers of dormant myeloma cells get activated. Tostudy dormant myeloma cells and their transition to activelyproliferating cells, we performed longitudinal two-photon ima-ging of the tibia from the same mice at 7, 14 and 20–21 days postcell inoculation (Fig. 6a,b). At day 14, small GFPþ colonies werevisualized adjacent to bone surfaces (Fig. 6a), which on re-ima-ging at day 20 had increased in size and were associated withwhat appeared to be osteolytic lesions in the cortical bone(Fig. 6a, right panels; Supplementary Movie 4). At day 7, indi-vidual dormant GFPþDiDhi cells were localized to endocorticalbone surfaces and limited numbers of small individual colonies,containing o10 GFPþDiDneg cells per colony, were identified(Fig. 6b). Re-imaging at days 14 and 21 demonstrated the per-sistence of dormant GFPþDiDhi cells (arrows) and the devel-opment of activated GFPþDiDneg colonies (Fig. 6b).Importantly, dormant GFPþDiDhi cells, transitioning to activelygrowing GFPþDiDneg cells, were also visualized (Fig. 6b, circles).Immunohistochemistry revealed discrete CD138þ tumour colo-nies (Fig. 6c) and single, CD138þ cells that had not dividedadjacent to bone surfaces, consistent with the intravital imaging(Fig. 6c, bottom right panel). Similar results were obtained withthe 5T2MM murine model of myeloma (Fig. 6d). The proportionof medullary cavity occupied by CD138þ cells increased until itwas completely replaced by tumour (Fig. 6e, left panel). Notably,the tumour colony count reached a maximum at day 14 postinoculation before decreasing in number, reflecting the coales-cence of colonies (Fig. 6e, right panel). In contrast, the number of
single CD138þ cells always exceeded the maximum number ofcolonies (Fig. 6e, middle panel). Taken together, these data sug-gest that only a small proportion of GFPþDiDhi cells are acti-vated to form proliferating GFPþDiDneg colonies, while theremainder were maintained in a dormant state.
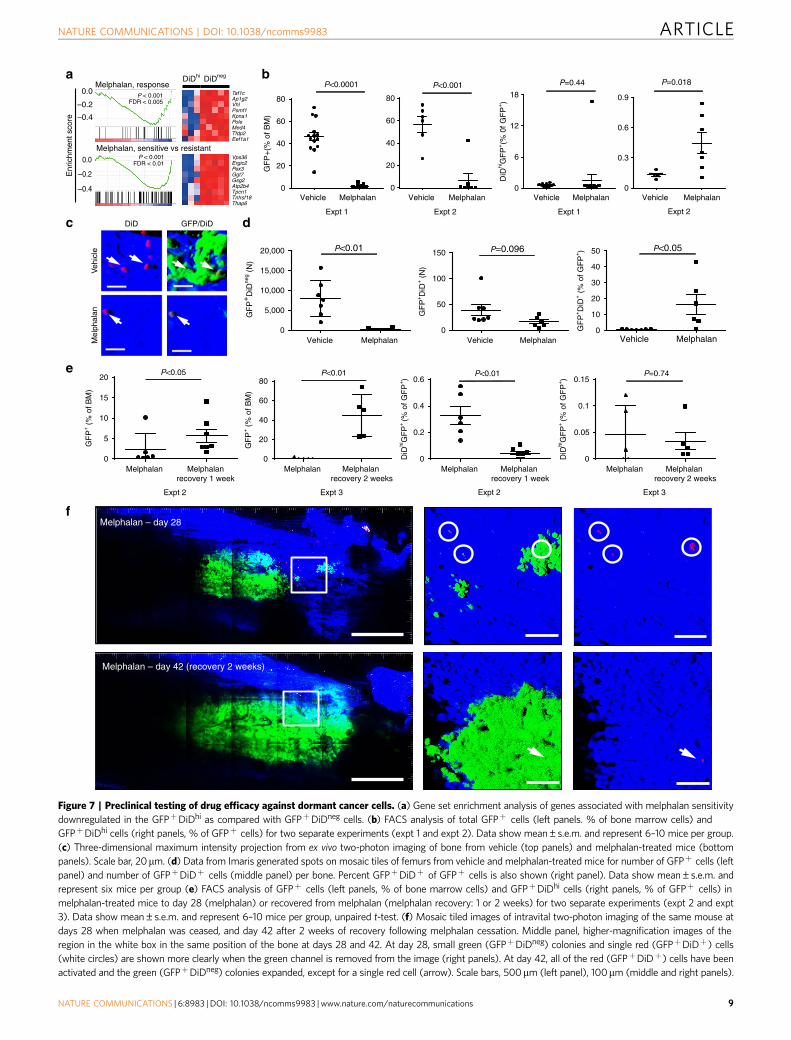
Dormant myeloma cells are resistant to melphalan. Sinceconventional anticancer drugs target actively dividing cells, weexamined the response of GFPþDiDhi and GFPþDiDneg cells tomelphalan, an alkylating agent commonly used to treat myeloma.Indeed, microarray analysis and GSEA demonstrated that genesets involved in the response and sensitivity to melphalan werenegatively enriched in dormant GFPþDiDhi cells, suggesting thatthese cells may be resistant to melphalan due to their lack ofproliferation (Fig. 7a). To test this, we treated disease-bearingmice with melphalan and quantified the response by enumerationof dormant GFPþDiDhi cells and activated GFPþDiDneg cells byFACS analysis and two-photon microscopy of explanted tibia(Fig. 7b–d). While all mice responded to melphalan with sig-nificant decreases in tumour burden, the response was variablewith some mice achieving 499% reduction, and others only ableto achieve 90–99% reduction (Fig. 7b). Nevertheless, despite thedecrease in GFPþ myeloma cells, dormant GFPþDiDhi cellswere remarkably stable and could be detected in all mice while ontreatment, with the proportion of GFPþDiDhi cells increasingrelative to total GFPþ cells (Fig. 7b). Consistent with this, two-
c d e
DiDhi
DiDNeg
f
Tuba4aRpa3Hist1h2bhHist1h4aNdc80Pmf1Fgfr1opPsmd10Hist1h2bg
Reactome cell cycle0.0
–0.2
–0.4
–0.6
P < 0.001FDR < 0.001
Ola1Ect2Rps6ka2DtlBckdhbSf3b5Banf1Rpa3Trip13
Proliferating vs quiescent HSC0.0
–0.2
–0.4
–0.6
P < 0.001FDR < 0.001
Enr
ichm
ent s
core
Ndc80Casp8ap2Terf2Pmf1HinfpVps4aEsco2Klhdc3Katna1CenphAnapc10Gsg22610039c10RikKif20bSuv39h2Trip13Wee1Rps6ka2Chek2Fam83d
Cell cycle GO:0007049g
a bDiDneg
DiDneg
DiDhi
DiDhi
DiDnegDiDhi
DiDnegDiDhi DiDnegDiDhi DiDnegDiDhi
DiDnegDiDhigh
DAPI
Ki6
7G2/M8.9
S6.9
G129.6
G045.4
G2/M17.8
S15.7
G158.0
G07.9
G0 G1 S G2/M
0
20
40
60
80
0
20
40
60
80
0 0
10
20
30P<0.001 P<0.001 P<0.05
10
20
30 P<0.001
%
DiDneg
GFP
DiD
105
104
103
103
103
102
–102
104
104 105
0
0 50K 50K100K 100K150K 150K200K 200K250K 250K0
0
Differentially regulated transcripts
N=31,235 P<0.0001 q<0.05 FC>2 FC>4
hi vs neg 514 6,262 991 97
Figure 4 | Confirmation of GFPþDiDhi cell population as dormant myeloma cells. (a) FACS plot showing gating of GFPþ DiDhi and GFPþ DiDneg cells in
G0, G1, S and G2/M cell cycle phases as determined by Ki67 expression and DAPI staining on day 21. FACS plot shown is pooled data from five mice.
(b) Distribution of DiDhi and DiDneg cells in G0, G1, S and G2/M phase of the cell cycle from gating shown in a. Data represent 4–5 individual mice
(mean±s.e.m., paired t-test). (c) Gates used for FACS sorting of GFPþDiDhi and GFPþDiDneg cells. (d) Heatmap showing differentially expressed genes.
(e) Table of differentially transcribed genes between the three cell populations. (f) Gene expression analysis showing genes involved in cell cycle and
replication, transcriptional and translational activity, which were expressed at lower levels in dormant cells when compared with GFPþDiDneg cells isolated
from the same mice. (g) Selected regulatory gene sets determined by GSEA, including negative enrichment for gene sets related to cell cycle progression
and regulation of HSC quiescence in DiDhi vs DiDneg cells. Dot plots represent concatenated myeloma populations from six tumour-bearing mice.
ARTICLE NATURE COMMUNICATIONS | DOI: 10.1038/ncomms9983
6 NATURE COMMUNICATIONS | 6:8983 | DOI: 10.1038/ncomms9983 | www.nature.com/naturecommunications
100806040200 100 200 300 400 500
GF
P+D
iD+
cel
ls (
%) Day 1
Day 3Day 7Day 10Day 14Day 17Day 21
2
4
6
8
10
12
14
DiD+/Kal-Col-GFP
GFP+DiD+
Freq
uenc
y (n
umbe
r of
cel
ls)
GFP+DiDneg20
15
10
5
0
25
30
3512 µm 55 µm
P<0.0001
Distance from bone surface (µm)
Distance from bone surface (µm)
40
80
120
0
pOsB
Control CM
RAW 264.7
Control CM
40
80
120
0
Cel
ls (
×10
3 )
P<0.0001
P=0.004
7 Days 14 Days
0.10
1
10
100
DiD
hi/5
TG
M1-
GF
P+
cells
(%
)
P<0.0001
P=0.007
ctrlMC3T3
5TGM1
40
80
120
0Control CM
NS
Relabelling of cells with
i.v. injection of relabelled cells
Isolation of cells
Cells from 1st isolation
GFP+DiDneg
DiD labelling of 5TGM1-eGFP cells
GFP+
DiDneg
GFP+
DiD+
GFP+
CMDiIneg
GFP+
CMDiI+GFP+CMDiI+
GFP+DiD+GFP+DiD+
Day 4
DiD
GF
PO
verla
yT
L
Day 0 Day 14
Days post sorting
0 14 20
Cel
ls (
×10
3 )
102
104
106P=0.0435
0 4 7 10 140
20406080
100120
DN
A (
µg)
P<0.0001
Dormant cells – 2nd isolation
GFP+CMDiI+ GFP+DiD+
*
Dor
man
t cel
ls m
m–2
GFP+
CMDiI+GFP+
DiD+
800
200
400
600
0
NS
SS
C
Myeloma burden – 2nd isolation
GFP
GFP+CMDiIneg GFP+DiDneg
GF
P+
cel
ls (
%)
0
1
2
2.5
1.5
0.5
GFP+
CMDiInegGFP+
DiDneg
NS
100
1.0k
800
600
400
200
0
1.0k
800
600
400
200
0
100
101
102 10
310
4 100
101
102 10
310
4
a b c
d e f
g h i
j k
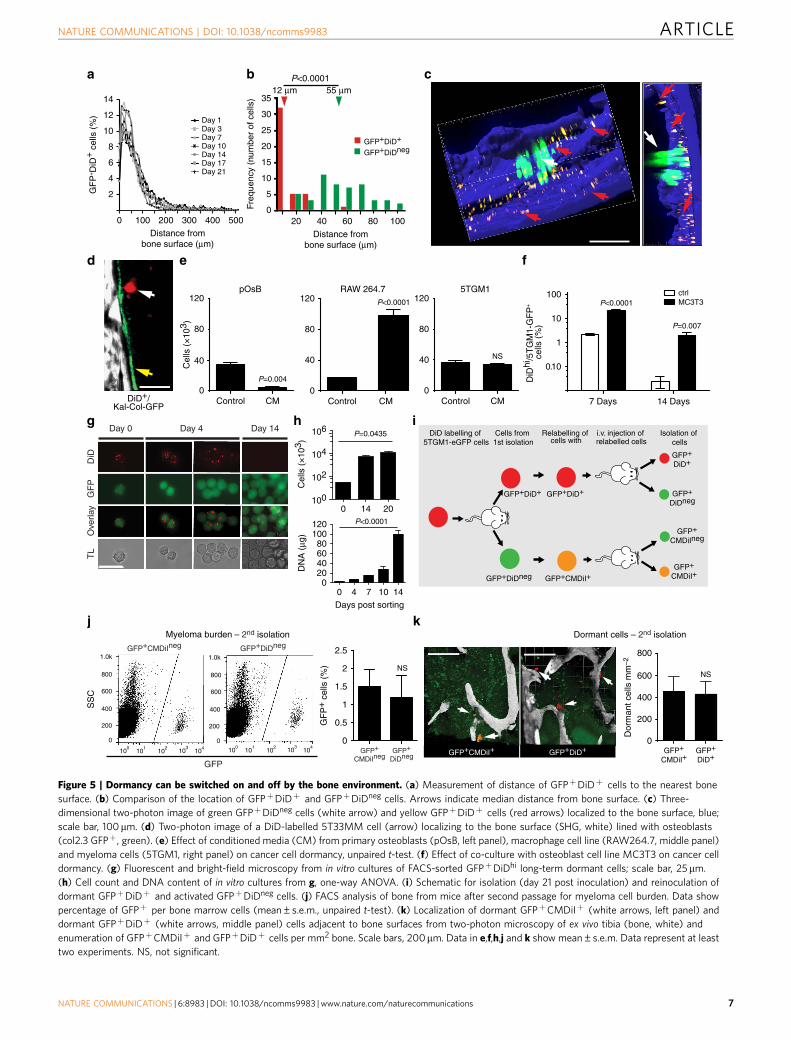
Figure 5 | Dormancy can be switched on and off by the bone environment. (a) Measurement of distance of GFPþDiDþ cells to the nearest bone
surface. (b) Comparison of the location of GFPþDiDþ and GFPþDiDneg cells. Arrows indicate median distance from bone surface. (c) Three-
dimensional two-photon image of green GFPþDiDneg cells (white arrow) and yellow GFPþDiDþ cells (red arrows) localized to the bone surface, blue;
scale bar, 100mm. (d) Two-photon image of a DiD-labelled 5T33MM cell (arrow) localizing to the bone surface (SHG, white) lined with osteoblasts
(col2.3 GFPþ, green). (e) Effect of conditioned media (CM) from primary osteoblasts (pOsB, left panel), macrophage cell line (RAW264.7, middle panel)
and myeloma cells (5TGM1, right panel) on cancer cell dormancy, unpaired t-test. (f) Effect of co-culture with osteoblast cell line MC3T3 on cancer cell
dormancy. (g) Fluorescent and bright-field microscopy from in vitro cultures of FACS-sorted GFPþDiDhi long-term dormant cells; scale bar, 25mm.
(h) Cell count and DNA content of in vitro cultures from g, one-way ANOVA. (i) Schematic for isolation (day 21 post inoculation) and reinoculation of
dormant GFPþDiDþ and activated GFPþDiDneg cells. (j) FACS analysis of bone from mice after second passage for myeloma cell burden. Data show
percentage of GFPþ per bone marrow cells (mean±s.e.m., unpaired t-test). (k) Localization of dormant GFPþCMDiIþ (white arrows, left panel) and
dormant GFPþDiDþ (white arrows, middle panel) cells adjacent to bone surfaces from two-photon microscopy of ex vivo tibia (bone, white) and
enumeration of GFPþCMDiIþ and GFPþDiDþ cells per mm2 bone. Scale bars, 200mm. Data in e,f,h,j and k show mean±s.e.m. Data represent at least
two experiments. NS, not significant.
NATURE COMMUNICATIONS | DOI: 10.1038/ncomms9983 ARTICLE
NATURE COMMUNICATIONS | 6:8983 | DOI: 10.1038/ncomms9983 | www.nature.com/naturecommunications 7
photon microscopy demonstrated a reduction in GFPþDiDneg
cells and a persistence of GFPþDiDhi cells apposed to endostealsurfaces (Fig. 7c,d). These data suggest that dormant GFPþDiDhi
cells are resistant to melphalan and may contribute to diseaserelapse upon drug withdrawal. In contrast, treatment of disease-bearing mice with bortezomib, which targets both dividing andnon-dividing cells, reduced myeloma burden and also the pro-portion of GFPþDiDhi dormant cells, suggesting that dormantcells may respond differently to different agents (SupplementaryFig. 2).
To directly address the contribution of GFPþDiDhi cells todisease relapse, we treated disease-bearing mice with melphalanfor 14 days, identified individual dormant GFPþDiDhi cells andactively growing GFPþDiDneg colonies by intravital imaging andthen re-imaged the same mice either 7 or 14 days after treatmentwithdrawal to track their fate. Following treatment cessation,FACS analysis demonstrated a significant increase in the numberof GFPþDiDneg cells, confirming escape from therapeutic controland mimicking disease relapse (Fig. 7e). However, unlike in thetreatment setting, dormant GFPþDiDhi cell numbers decreasedfollowing treatment withdrawal, consistent with their reactivationand their role in repopulating the tumour (Fig. 7e). In support ofthis, longitudinal intravital two-photon microscopy demonstrateda reduction in individual GFPþDiDhi cells as the tumour
repopulated the marrow following cessation of treatment atday 28 (Fig. 7f, circles).
Bone resorption activates dormant myeloma cells. To directlytest the impact of manipulating the bone microenvironment ondisease activity, we treated disease-bearing mice with a solubleform of the ligand for the receptor activator of NFkB (sRANKL),which is expressed by osteoblasts and osteocytes and is critical forosteoclast formation and bone resorption39. Daily treatment withsRANKL for 3 days in naive BKAL mice resulted in a significantreduction in trabecular bone volume and bone surface (Fig. 8a,b),along with a significant decrease in trabecular number and anincrease in trabecular separation (data not shown). Thesestructural changes in bone were associated with an increase inosteoclasts within trabecular bone regions and on endocorticalbone surfaces (Fig. 8c,d) and an increase in serum tartrate-resistant acid phosphatase, a marker of osteoclast activity (Fig. 8d,bottom panel). Importantly, FACS analysis demonstrated thatmanipulation of the bone microenvironment resulted in asignificant decrease in the number of dormant GFPþDiDhi
cells in the bone marrow, as anticipated (Fig. 8e). Interestingly,although there was also a modest reduction in myeloma burden,there were fewer GFPþDiDhi cells as a proportion of the GFPþ
GFP/DiDDiD
Day 7
Day 14
Day 21
aDay 14
Day 20
b
BM
GPCBPT
1 3 7 10 14 17 210N
o. o
f CD
138+
ve c
olon
ies
10
5
20
15
P<0.0001
1 3 7 10
20
0
80
60
40
No.
of
sing
le C
D13
8+ve
cel
ls P=0.002
c
14 17 211 3 7 100
% O
f CD
138+
ve c
ells
60
100
80
20
40
P<0.0001e
d
Days post injection
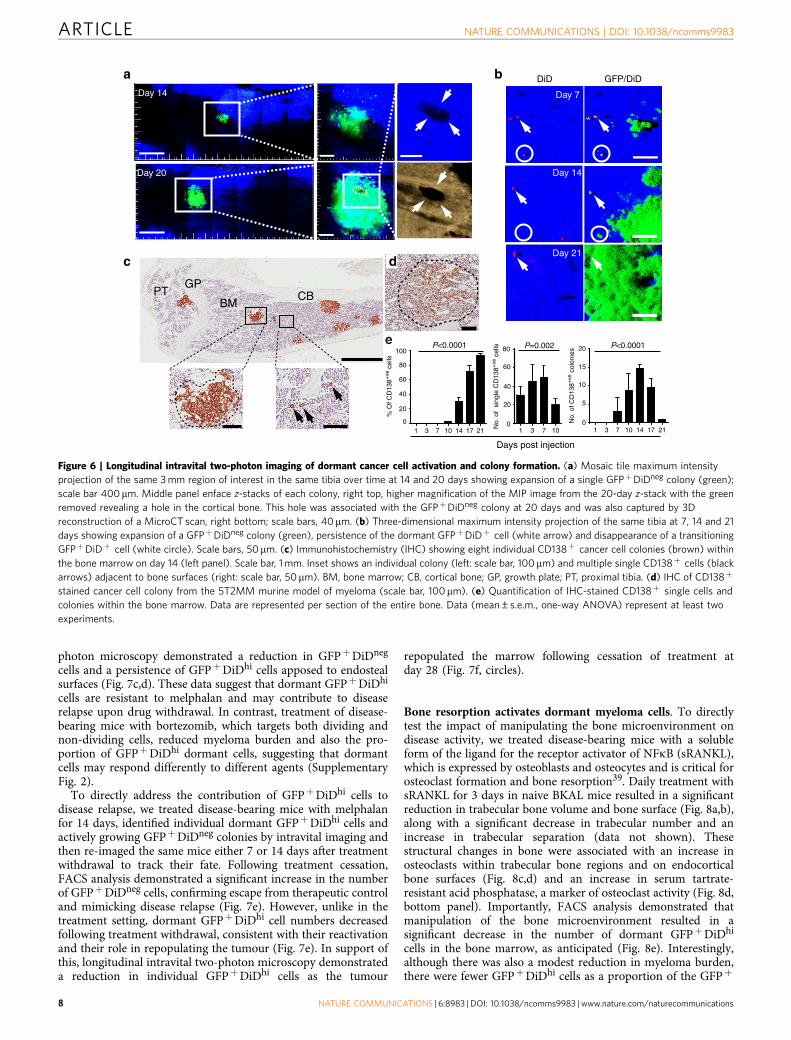
Figure 6 | Longitudinal intravital two-photon imaging of dormant cancer cell activation and colony formation. (a) Mosaic tile maximum intensity
projection of the same 3 mm region of interest in the same tibia over time at 14 and 20 days showing expansion of a single GFPþDiDneg colony (green);
scale bar 400mm. Middle panel enface z-stacks of each colony, right top, higher magnification of the MIP image from the 20-day z-stack with the green
removed revealing a hole in the cortical bone. This hole was associated with the GFPþDiDneg colony at 20 days and was also captured by 3D
reconstruction of a MicroCT scan, right bottom; scale bars, 40mm. (b) Three-dimensional maximum intensity projection of the same tibia at 7, 14 and 21
days showing expansion of a GFPþDiDneg colony (green), persistence of the dormant GFPþDiDþ cell (white arrow) and disappearance of a transitioning
GFPþDiDþ cell (white circle). Scale bars, 50mm. (c) Immunohistochemistry (IHC) showing eight individual CD138þ cancer cell colonies (brown) within
the bone marrow on day 14 (left panel). Scale bar, 1 mm. Inset shows an individual colony (left: scale bar, 100mm) and multiple single CD138þ cells (black
arrows) adjacent to bone surfaces (right: scale bar, 50mm). BM, bone marrow; CB, cortical bone; GP, growth plate; PT, proximal tibia. (d) IHC of CD138þ
stained cancer cell colony from the 5T2MM murine model of myeloma (scale bar, 100mm). (e) Quantification of IHC-stained CD138þ single cells and
colonies within the bone marrow. Data are represented per section of the entire bone. Data (mean±s.e.m., one-way ANOVA) represent at least two
experiments.
ARTICLE NATURE COMMUNICATIONS | DOI: 10.1038/ncomms9983
8 NATURE COMMUNICATIONS | 6:8983 | DOI: 10.1038/ncomms9983 | www.nature.com/naturecommunications
GF
P+ (
% o
f BM
)
Melphalan Melphalan recovery 1 week
15
20
10
5
0Melphalan Melphalan
recovery 1 week
DiD
hiG
FP
+ (%
of G
FP
+) 0.6
0.4
0.2
0
P<0.05 P<0.01
Melphalan Melphalan recovery 2 weeks
60
80
40
20
0
P<0.01
Melphalan Melphalan recovery 2 weeks
0.15
0.1
0.05
0
GF
P+ (
% o
f BM
)
Expt 2 Expt 2 Expt 3 Expt 3
Melphalan – day 42 (recovery 2 weeks)
d
f
GF
P+
(% o
f BM
)
60
80
b
40
20
0
P<0.0001
Vehicle Melphalan
Expt 1
c
Mel
phal
anV
ehic
le
GFP/DiDDiD
DiDhi DiDnega
Melphalan – day 28
e
GF
P+
DiD
neg (
N)
0
20,000
Vehicle Melphalan
15,000
10,000
5,000
Vehicle Melphalan 0
10
20
30
40
50
GF
P+D
iD+ (
% o
f GF
P+)
0
50
100
150
GF
P+D
iD+ (
N)
Vehicle Melphalan
P<0.01 P<0.05
DiD
hiG
FP
+ (%
of G
FP
+)
P=0.74
P=0.096
60
80
40
20
0
P<0.001
Vehicle Melphalan
Expt 2
DiD
hiG
FP
+(%
0f G
FP
+)
18
12
6
0Vehicle Melphalan
Expt 1
P=0.44 P=0.018
0.9
0
0.6
0.3
Vehicle Melphalan
Expt 2
Vps36Ergic2Pex3Ggt7Gsg2Atp2b4Tpcn1Tnfrsf18Thap6
Melphalan, sensitive vs resistant0.0
–0.2
–0.4
Enr
ichm
ent s
core
P < 0.001FDR < 0.01
Taf1cAp1g2VhlPsmf1Kpna1PoleMed4Tfdp2Eef1a1
0.0
–0.2
–0.4
Melphalan, responseP < 0.001
FDR < 0.005
Figure 7 | Preclinical testing of drug efficacy against dormant cancer cells. (a) Gene set enrichment analysis of genes associated with melphalan sensitivity
downregulated in the GFPþDiDhi as compared with GFPþDiDneg cells. (b) FACS analysis of total GFPþ cells (left panels. % of bone marrow cells) and
GFPþDiDhi cells (right panels, % of GFPþ cells) for two separate experiments (expt 1 and expt 2). Data show mean±s.e.m. and represent 6–10 mice per group.
(c) Three-dimensional maximum intensity projection from ex vivo two-photon imaging of bone from vehicle (top panels) and melphalan-treated mice (bottom
panels). Scale bar, 20mm. (d) Data from Imaris generated spots on mosaic tiles of femurs from vehicle and melphalan-treated mice for number of GFPþ cells (left
panel) and number of GFPþDiDþ cells (middle panel) per bone. Percent GFPþDiDþ of GFPþ cells is also shown (right panel). Data show mean±s.e.m. and
represent six mice per group (e) FACS analysis of GFPþ cells (left panels, % of bone marrow cells) and GFPþDiDhi cells (right panels, % of GFPþ cells) in
melphalan-treated mice to day 28 (melphalan) or recovered from melphalan (melphalan recovery: 1 or 2 weeks) for two separate experiments (expt 2 and expt
3). Data show mean±s.e.m. and represent 6–10 mice per group, unpaired t-test. (f) Mosaic tiled images of intravital two-photon imaging of the same mouse at
days 28 when melphalan was ceased, and day 42 after 2 weeks of recovery following melphalan cessation. Middle panel, higher-magnification images of the
region in the white box in the same position of the bone at days 28 and 42. At day 28, small green (GFPþDiDneg) colonies and single red (GFPþDiDþ) cells
(white circles) are shown more clearly when the green channel is removed from the image (right panels). At day 42, all of the red (GFPþDiDþ) cells have been
activated and the green (GFPþDiDneg) colonies expanded, except for a single red cell (arrow). Scale bars, 500mm (left panel), 100mm (middle and right panels).
NATURE COMMUNICATIONS | DOI: 10.1038/ncomms9983 ARTICLE
NATURE COMMUNICATIONS | 6:8983 | DOI: 10.1038/ncomms9983 | www.nature.com/naturecommunications 9
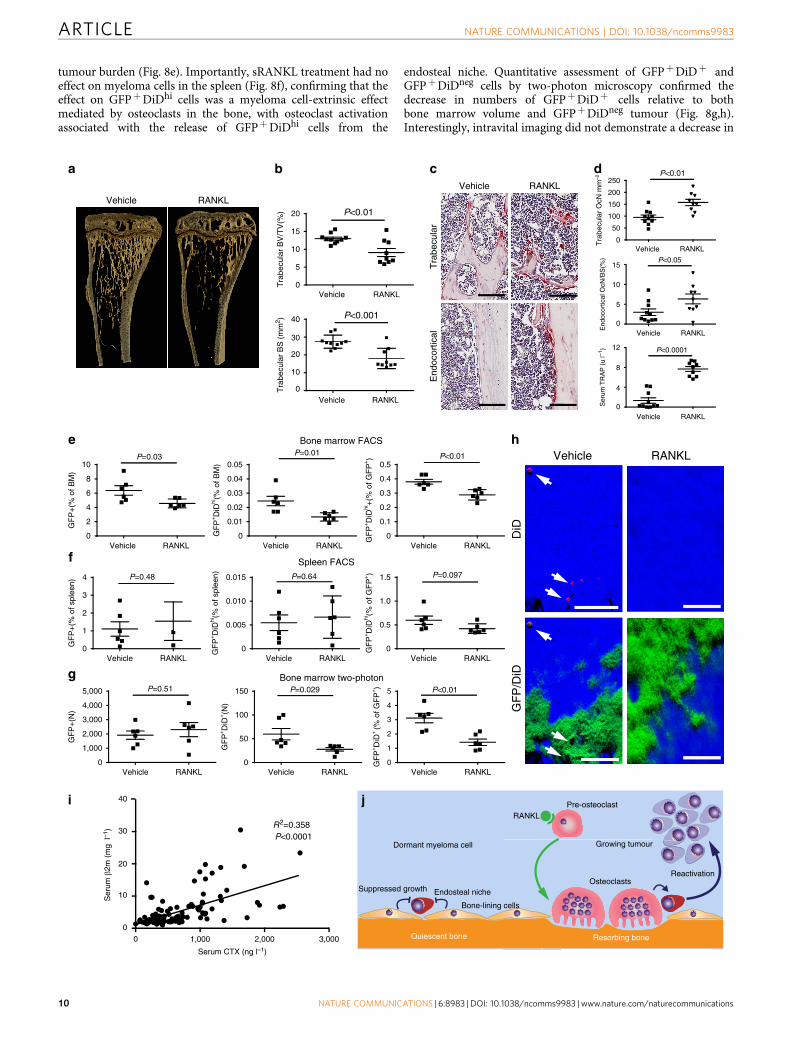
tumour burden (Fig. 8e). Importantly, sRANKL treatment had noeffect on myeloma cells in the spleen (Fig. 8f), confirming that theeffect on GFPþDiDhi cells was a myeloma cell-extrinsic effectmediated by osteoclasts in the bone, with osteoclast activationassociated with the release of GFPþDiDhi cells from the
endosteal niche. Quantitative assessment of GFPþDiDþ andGFPþDiDneg cells by two-photon microscopy confirmed thedecrease in numbers of GFPþDiDþ cells relative to bothbone marrow volume and GFPþDiDneg tumour (Fig. 8g,h).Interestingly, intravital imaging did not demonstrate a decrease in
Serum CTX (ng l–1)
Ser
um β
2m (
mg
l–1)
3,0002,0001,000
0
10
20
30
40
0
b ca
Tra
becu
lar
BV
/TV
(%)
Tra
becu
lar
BS
(m
m2 )
Vehicle RANKL
hT
rabe
cula
rE
ndoc
ortic
al
Vehicle RANKL
Vehicle RANKL
DiD
GF
P/D
iD
iRANKL
Suppressed growth
Dormant myeloma cell
Dormant Myeloma Cell
Bone-lining cells
Osteoclasts
Pre-osteoclast
Growing tumour
Quiescent bone
Reactivation
Resorbing bone
j
d
R2=0.358P<0.0001
Endosteal niche
10
5
0
15
RANKLVehicle
Vehicle RANKL 0
10
20
30
40 P<0.001
P<0.0120
Spleen FACSf
1
4
2
0
3
GF
P+
(% o
f spl
een)
RANKLVehicle
P=0.48
GF
P+D
iDhi(%
of s
plee
n)
0.010
0.015
0
0.005
RANKLVehicle
P=0.64
0.5
1.5
0
1.0
RANKLVehicle
GF
P+D
iDhi(%
of G
FP
+) P=0.097
e Bone marrow FACS
GF
P+
(% o
f BM
)
RANKL Vehicle
6
10
4
2
0
8
P=0.03
RANKLVehicle
GF
P+D
iDhi(%
of B
M)
0.03
0.05
0.02
0.01
0
0.04
P=0.01
RANKLVehicle
P<0.01
GF
P+D
iDhi+
(% o
f GF
P+)
0.3
0.5
0.2
0.1
0
0.4
Tra
becu
lar
OcN
mm
–2
Vehicle RANKL
200
150
0
250
100
50
P<0.01
End
ocor
tical
OcN
/BS
(%)
Vehicle RANKL
10
0
15
5
P<0.05
Vehicle RANKL
8
4
0
12
Ser
um T
RA
P (
u l–1
) P<0.0001
Bone marrow two-photon
RANKLVehicle
50
150
0
100
GF
P+D
iD+(N
)
P=0.029
RANKLVehicle
1
4
2
0
3
5
GF
P+D
iD+
(% o
f GF
P+) P<0.01
g
GF
P+
(N)
1,000
5,000
2,000
0
4,000
3,000
RANKLVehicle
P=0.51
ARTICLE NATURE COMMUNICATIONS | DOI: 10.1038/ncomms9983
10 NATURE COMMUNICATIONS | 6:8983 | DOI: 10.1038/ncomms9983 | www.nature.com/naturecommunications
GFPþDiDneg tumour burden, which may reflect the smallersample volume or a differential distribution of tumour, comparedwith analysis by FACS. Thus, sRANKL induces osteoclasticbone resorption and can release dormant myeloma cells fromosteoblastic or bone-lining-cell suppression, making themavailable to contribute to disease progression and/or relapse. Toestablish whether bone resorption is associated with myelomaburden, we examined serum levels of C-terminal telopeptide(CTX), a biochemical marker of bone resorption, andb2-microglobulin (b2m) as a measure of tumour burden in 118patients with newly diagnosed myeloma. CTX was significantlycorrelated with b2m (R2¼ 0.3588, Po0.0001, Pearson’scorrelation), suggesting that increased bone resorption is relatedto tumour burden in patients (Fig. 8i). Taken together, these datasuggest that dormant cells held in the endosteal niche can bereactivated by osteoclasts remodelling the endosteal niche(Fig. 8j).
DiscussionCancer cell dormancy is increasingly recognized as an importantclinical problem. Despite improved outcomes from new, targetedtherapies, patients continue to suffer from relapse and metastases,which are major causes of morbidity and mortality. Thus, there isan increasing need to understand cancer cell dormancy to preventdrug resistance and disease relapse. This is particularly true inmultiple myeloma where patients now achieve completeresponses to state-of-the-art combination therapy, yet stillharbour drug-resistant dormant myeloma cells as MRD and goon to progress at a later time point. Consequently, understandingthe extrinsic control of dormant myeloma cells by the bonemicroenvironment has the potential to uncover novel therapeuticapproaches. These may be used in combination with currenttreatments to either completely eradicate myeloma cells, or tomaintain MRD in a dormant state and achieve long-termremission. Accordingly, we developed a unique, non-destructive,method to track the fate of individual myeloma cells, long-itudinally, as they colonize the endosteal niche and form tumourcolonies over weeks or months, in live mice by intravital two-photon microscopy. By imaging through a natural opticalwindow in the tibia, we have overcome the long-held misconcep-tion that non-destructive intravital microscopy of bone can onlybe performed in the calvaria. Importantly, the tibia has differentdevelopmental origins from the calvaria and may also containdistinct anatomical and functional compartments that constitutethe specialized microenvironments required for myeloma cellcolonization, retention of dormancy and growth. Using this novelapproach, we demonstrated that myeloma cells entered the bonemarrow, left the vasculature and migrated directly towardsendosteal surfaces where they arrested in sites containing type-I
collagen-expressing osteoblasts or bone-lining cells. This isconsistent with the immunohistochemical studies reporting thepresence of leukaemic cells and primary myeloma cells adjacentto bone surfaces11,40.
Our intravital studies of myeloma cell dormancy werefacilitated by the use of a lipophilic membrane dye, DiD, toidentify dormant GFP-expressing myeloma cells that had notundergone cell division. This was supported by the detection ofstable numbers of these cells throughout the duration of theexperimental time course following initial equilibration, indicat-ing that they are long-lived dormant cells. In addition, analysis ofKi67 expression and DAPI staining showed that the majority ofGFPþDiDhi cells were in the resting G0 phase when comparedwith the GFPþDiDneg population. Furthermore, transcriptionalanalysis demonstrated that the GFPþDiDhi population main-tained this long-lived persistent dormant phenotype by down-regulating genes that control the cell cycle. Interestingly, a limitednumber of the GFPþDiDhi cells were also Ki67 positive,suggesting that, in certain niches, dormant cells may haverecently been activated to divide. This challenges the notion thatdormancy is a synchronized period of inactivity and supports theidea that dormancy may instead result from the dynamicinterplay between myeloma cells in the multiple heterogeneousniches and may exist in different states of activation.
To establish whether dormancy was a fixed or reversible state,we removed dormant GFPþDiDhi cells from their bone niche,relabelled them with DiD and reinoculated them into naive mice.We showed that some of the GFPþDiDhi cells remained dormantwhile others were released from dormancy in their newmicroenvironment and became activated to form GFPþDiDneg
colonies. Remarkably, in the reciprocal experiment, when weremoved proliferating GFPþDiDneg cells and labelled them withCMDiL before reinoculation, these cells not only formed coloniesbut could also be induced to enter a dormant state in their naivehost bone environment. These observations infer that cancer celldormancy is a reversible state that can be switched ‘on’ or ‘off’ bymicroenvironmental signals. Interestingly, we also showed that ofthe many dormant tumour cells that locate to the endosteal niche,only limited numbers become reactivated to form overt myelomacolonies. This is reminiscent of the ‘clonal tides’ and alteringclonal dominance that is observed in patients exposed to differentdrug regimens6,8–10. In addition, the plasticity of the 5TGM1 cellsunder these experimental conditions and the fact that 89%of GFPþDiDhi cells are CD138þ suggests that dormantmyeloma cells are distinct from cancer stem cells, which arethought to be poorly differentiated cancer cell precursors41,and the myeloma stem cell, which have been reported to beCD138neg (refs 42,43).
Crucially, the proportion of dormant GFPþDiDhi andproliferating GFPþDiDneg myeloma cells that form colonies
Figure 8 | RANKL-driven alterations in the endosteal niche activate dormant tumour cells. (a) Three-dimensional reconstructions of MicroCT scans of
representative tibia from vehicle- and RANKL-treated naive mice after 3 days of treatment. (b) Trabecular bone volume of total volume (BV/TV) and
trabecular bone surface (BS) in metaphyseal bone in vehicle- and RANKL-treated mice. (c) Representative sections of TRAP-stained tibia from trabecular
and endocortical regions of vehicle- and RANKL-treated naive mice; scale bar, 100mm. (d) Histograms of osteoclast surface per mm bone surface for
trabecular (top) and endocortical (middle) bone and serum TRAP levels (bottom). Data are from one experiment with 9–10 mice per group. (e) FACS
analysis of GFPþDiDneg cells (left, % of bone marrow cells), GFPþDiDhi (middle % of bone marrow cells) and percent GFPþDiDhi (right % of GFPþ) from
bone marrow samples. (f) FACS analysis of GFPþ cells (left, % of spleen cells), GFPþDiDhi (middle, % of spleen cells) and GFPþDiDhi (right, % of GFPþ)
from spleen samples. (g) Analysis of two-photon mosaic tiles of total number of GFPþ cells (left), number of GFPþDiDhi cells (middle) and GFPþDiDhi
(right % of GFPþ) in the analysed endocortical region. Data show mean±s.e.m. and represent 6–10 mice per group, unpaired t-test. (h) Two-photon
generated 3D images of multiple GFPþDiDþ dormant cells (white arrows) in the vehicle-treated mice compared with few or none in the RANKL treated;
scale bars, 60 mm. (i) Correlation between serum CTX and serum b2m levels in myeloma patients, Pearson’s correlation. (j) Schematic depicting myeloma
cell dormancy on quiescent bone surfaces and myeloma cell reactivation on actively resorbing bone surface. Data are from one experiment with six mice
per group.
NATURE COMMUNICATIONS | DOI: 10.1038/ncomms9983 ARTICLE
NATURE COMMUNICATIONS | 6:8983 | DOI: 10.1038/ncomms9983 | www.nature.com/naturecommunications 11
or became dormant after secondary transplantation werecomparable. This indicated that stochastic engagement with therelevant bone niche was more important than an intrinsicdevelopmental programme in determining the fate of thetransplanted myeloma cells. Consistent with this, osteoblast-conditioned media and co-culture with MC3T3 osteoblast-likecells maintained dormancy and suppressed proliferation, whereasosteoclast-like cell-conditioned media stimulated myeloma cellgrowth. This is consistent with studies in vitro, which show thatgrowth of patient-derived multiple myeloma cells is suppressedwhen cultured with patient-derived osteoblasts and inhibition ofmyeloma growth when patient-derived MSCs are deliveredsystemically or directly into bones of SCID-hu MM-bearingmice44,45. While the mechanisms responsible for suppression ofmultiple myeloma cell growth and holding MM cells in adormant state are poorly defined, they may include release ofbone morphogenic proteins46 or secretion of Wnt proteins andWnt antagonists47,48. Furthermore, our gene expression analysishas identified a number of cellular adhesion molecules andmembrane receptors, including Vcam1 and Axl, that could alsoplay a role in interactions between dormant myeloma cells andcells in the endosteal niche. Importantly, expression of thesemolecules may be used as biomarkers to help identify dormantmyeloma cells in bone and may also provide new therapeutictargets to aid in the erradication of these cells. Taken together,these data suggest that the extrinsic bone microenvironment, andlikely an endosteal niche, plays a critical role in controllingmyeloma cell dormancy.
Dormant GFPþDiDhi cells were more resistant than prolifer-ating GFPþDiDneg cells to melphalan treatment, but not to theproteasome inhibitor bortezomib. This may argue that dormantcells are intrinsically resistant to chemotherapeutic agents thattarget dividing cells by virtue of their dormant state. Moreover,even in mice with 499% reduction in tumour burden, GFPþ
DiDhi cells were still detectable and contributed to the re-establishment of myeloma growth following melphalan treatmentwithdrawal. This ‘awakening’ of dormant cells during recoverymay be a result of alterations in the local environment. Therefore,we tested the hypothesis that direct manipulation of the bonemicroenvironment itself would impact on dormancy and providea mechanism for reactivating dormant cells. Short-term treatmentwith sRANKL increased osteoclast numbers, resorption activityand decreased the bone surface containing endosteal niches. Thisosteoclastic activity released GFPþDiDhi cells from dormancyand resulted in a specific reduction of GFPþDiDhi cells in thebone, but not in the spleen. Consistent with this, serum CTXlevels were found to correlate with serum b2m, a marker oftumour burden, in a large cohort of patients with newlydiagnosed multiple myeloma. These data suggest that boneresorption, simply by remodelling the endosteal niche as part ofnormal physiological function, may inadvertently activate dor-mant tumour cells, arguing that activation of dormant cells is anenvironmentally controlled stochastic event. Interestingly, despitethe increased osteoclast activity following RANKL treatment, notall of the bone surface undergoes resorption and as a resultdormant cells are still present, suggesting mobilization events area localized phenomena. The reason why mobilization of dormantcells was associated with a reduction in myeloma burden isunclear. This could reflect a difference in the rate of growth ofmobilized cells following treatment or alternatively that, dormantcells that were mobilized by sRANKL died without undergoingcell division; however, the latter is not consistent with our studies,showing these cells have the capacity to grow in vitro and in vivo(Fig. 5). Nevertheless, these data suggest that stimulation of boneresorption may result in synchronized activation of dormant cells,thereby rendering them more susceptible to targeted therapies. Or
that inhibition of bone resorption by anti-resorptive agents, suchas bisphosphonates, may enforce cellular dormancy and preventmyeloma cell activation and relapse.
These data therefore have significant clinical implications. Wealready know inhibitors of bone resorption, includingbisphosphonates and strategies to block RANKL, reduce myelomaburden in experimental models49–51. Furthermore, bisphospho-nate treatment is associated with improvements in survival thatmay be independent of the development of skeletal-relatedevents52; however, the mechanisms responsible remain unclear.These data may provide at least one explanation for theseobservations, that is, that bisphosphonate treatment may preventreactivation of dormant myeloma cells. It could also argue thatconsideration needs to be given to very early anti-resorptivetreatment to prevent activation of dormant tumour cells to sustainlong-term remission. This is certainly supported by studies inpatients with monoclonal gammopathy of undeterminedsignificance, which show that patients with increased boneresorption are more likely to develop overt myeloma53.
The experimental data presented here provide the basis fordeveloping novel approaches to prevent disease progression inmyeloma. This could include repurposing bone-active drugs asfrontline therapies, to be used in combination with targetedtherapies, to prevent the reactivation of dormant myeloma cellsand sustain long-term remission. Alternatively, the promotion ofbone resorption to release tumour cells from dormancy mayfacilitate their targeting by the existing armamentarium of drugsto eliminate MRD and achieve long-term remission or even cure.Finally, further studies of the molecular mechanisms that regulatedormancy within the endosteal niche may reveal druggable targetsthat control myeloma reactivation. Thus, this new knowledge ofthe extrinsic control of cancer cell dormancy has implications forunderstanding cancer pathogenesis and the potential to unlockopportunities for developing innovative treatment strategies.
MethodsMice and in vivo mouse models. Six-to-eight-week-old C57BL/KaLwRijHsd(BKAL) male mice (Harlan, Netherlands) were injected intravenously with 2� 106
syngeneic 5TGM1-eGFP (a gift from Dr Oyajobi, University of Texas HealthSciences Center San Antonio, Texas, USA) or 5T33MM murine myeloma cells in200 ml PBS54,55. Cells were negative for mycoplasma. On specified days postinjection, mice were killed for FACS analysis and two-photon imaging of explantedbones. In separate studies, 6–8-week-old male BKAL mice were injected with5T2MM murine myeloma cells and killed 7 weeks later to examine tumour colonyformation. BKAL mice were also crossed with mice expressing emerald GFP underthe type-I collagen promoter (pOBCol2.3GFPemd)38 to produce C57BL/KaLwRijHsd.Cg-Tg (Col1a1-GFP) denoted as Kal-Col-GFP mice to markosteoblastic cells in vivo. For drug studies, BKAL mice were injected with DiD-labelled 5TGM1-eGFP cells. After 2 weeks, mice were injected, intraperitoneally,three times a week for 2 weeks with melphalan (Sigma-Aldrich, 5 mg kg� 1 in17.5% ethanol) or vehicle56; or twice a week, subcutaneously, with bortezomib(Sigma-Aldrich, 0.7 mg kg� 1 in 0.005% dimethylsulphoxide). Mice were killed 4weeks later and 1 or 2 weeks after cessation of melphalan treatment. Tibia, femursand spleens were isolated for FACS and two-photon imaging. Drug studies wereperformed in two separate experiments. Recombinant soluble RANKL-GST fusionprotein (RANKL, Oriental Yeast Company Ltd, Tokyo, Japan) or saline wasadministered at a dose of 0.5 mg kg� 1 intraperitoneally daily for 3 days in naivemice before harvest on day 4. RANKL was administered on days 4–6 post cellinjection and experiments ceased 18 days later. Experiments were approved bythe Garvan Institute/St Vincent’s Hospital (#12_20), University of Sheffield (PPL40/3,462) and Vrije Universiteit Brussel (#13-281-5) Animal Ethics Committees.
Cancer cell lines and intravital labelling of dormant cells. 5TGM1-eGFP and5T33MM myeloma cells were cultured in RPMI-1640 supplemented with 10% fetalcalf serum (FCS) and 1% penicillin–streptomycin, and incubated in 5% CO2 at 37 �C(refs 54,55). 5T2MM cells were maintained by serial passage in BKAL mice54.Cells were labelled with DiD, or 3H-Indolium, 5-[[[4-(chloromethyl)benzoyl]amino]methyl]-2-[3-(1,3-dihydro-3,3-dimethyl-1-octadecyl-2H-indol-2-ylidene)-1-propenyl]-3,3-dimethyl-1-octadecyl-, chloride (CMDiI) (Molecular Probes).
ARTICLE NATURE COMMUNICATIONS | DOI: 10.1038/ncomms9983
12 NATURE COMMUNICATIONS | 6:8983 | DOI: 10.1038/ncomms9983 | www.nature.com/naturecommunications
In vitro conditioned media and co-culture experiments. Primary osteoblastswere isolated from calvaria of 2–4-day-old C57BL/6 mice and differentiated inMEMa supplemented with ascorbic acid, b-glycerol phosphate, ribonucleosidesand 10% FCS for 4 weeks57,58. DiD-labelled 5TGM1-eGFP cells were culturedeither in media, or in media conditioned with 5TGM1, RAW264 cells or primaryosteoblasts. DiD-labelled 5TGM1-eGFP cells were co-cultured with MC3T3murine osteoblast-like cells plated in RPMI, supplemented with 10% FCS, 1%penicillin/streptomycin and 1% Glutamax.
Two-photon microscopy of explanted tibias and femurs. At the University ofSheffield, the tibia or femur were embedded in OCT solution (Tissue-Tek) andsnap-frozen in liquid nitrogen before cryosectioning. Images were acquired with aninverted Zeiss 510 META (Carl Zeiss). Two-photon excitation at 820 nm wasachieved with a Chameleon XR Ti:Sa laser (Coherent) and fluorescence detectedusing the following: BP435-485 to detect blue (second-harmonic generation), BP500–550 to detect green (GFP), BP 565–615 IR to detect orange/red (CMDiI) andBP 650–710 nm to detect far-red (DiD). In some images (Figs 3 and 4;Supplementary Fig. 2) this was pseudocoloured white. Three-dimensional (3D)mosaic tiles were performed at 128� 128 pixel resolution and individual450� 450� 150 mm volumes imaged at 256� 256 pixel resolution in 2-mm z-steps.Three-dimensional volumes were reconstructed and analysed using Volocitysoftware (Improvision, Perkin Elmer). At the Garvan Institute of Medical Research,imaging was performed on intact tibias or cryosectioned femurs using an uprightZeiss 7MP microscope (Carl Zeiss). We used LBF 760 and BSMP2 760 filters toenable detection of the far-red emission of BSA-Alexa Fluor680 and DiD. Fourexternal non-descanned detectors were used to detect blue (second-harmonicgeneration, SP 485), green (BP 500–550), red (BP 565–610) and far-red (BP640–710). Infrared excitation at 920 nm was provided by a Chameleon Vision IITi:Sa laser (Coherent Scientific). Each 512� 512-pixel xy-plane was acquiredat 2–3-mm z-step intervals. Time-lapse images were acquired at 30-s intervals.Images were acquired using ZEN 2009 software (Zeiss) and raw image filesprocessed using Imaris (Bitplane). Red dormant cells and green activated cancercells were counted using the spot detection function in Imaris.
Real-time intravital two-photon microscopy of the tibia. Mice were anaes-thetized as described59. Anaesthetized mice were kept warm using a customizedheated SmartStage (Biotherm). An incision was made over the medial surface of thetibia and soft tissue resected. Mice were intravenously injected with a single dose ofAlexa Fluor680/bovine serum albumin (2.5–10.0 mg kg� 1, Invitrogen) to labelblood vessels. 5TGM1-eGFP cells were injected four frames (2 min) aftercommencement of imaging. A Gaussian filter was applied and the display adjustedto reduce background noise and improve contrast in Imaris. Videos were compiledand annotated using Adobe AfterEffects (Adobe). Myeloma cells were counted ascirculating cells if they entered and left the imaging volume within two consecutiveframes. Colonizing cells entered, crawled and arrested within the imaging volumeand could be found in the same location again at least 5 min later.
Longitudinal intravital two-photon microscopy of the tibia. For longitudinalimaging, 2� 106 DiD-labelled 5TGM1-eGFP cells were injected 7 days before theinitial imaging session. During imaging, a 3D mosaic tile image was captured toinclude the growth plate and other landmarks as fiducial markers to enablerepeated imaging of the same volume. Mice were recovered after imaging, the skinsutured and buprenorphine hydrochloride 0.5 mg kg� 1 subcutaneously adminis-tered. Mice were re-imaged on days 14 and 21 in the same region based on theposition of the fiducial markers.
Micro-computed tomography of the tibia. Bones were scanned using a mCTscanner (Model 1172; Skyscan) at 50 kV, 200 mA with a 0.5-mm aluminium filter usinga pixel size of 4.3mm. Images were captured every 0.4̊ through 180̊, reconstructed andanalysed using NRecon and CTAn software (Skyscan). Three-dimensional models werecreated using the Drishti-2 tool (https://code.google.com/p/drishti-2/).
Histology. Bones were fixed in 4% paraformaldehyde, decalcified in EDTA,embedded in paraffin and 4-mm sections were cut. Antigen retrieval was performedin trypsin (Biocare Medical) at 37�C for 10 min, and washed for 5 min in PBS.Nonspecific binding was blocked in 10% FCS and 10% normal goat serum (S-1000,Vector Laboratories) for 1 h at room temperature (RT). Primary antibody (rat anti-mouse anti-CD138, clone 281-2, BD Pharmingen) and isotype control (purified ratIgG2a, k-isotype control, clone R35-95 BD Pharmingen) were incubated for 1 h atRT at a dilution of 1:300 and washed in PBS. Endogenous peroxidase activity wasquenched with 3% hydrogen peroxide (Sigma) for 30 min at RT. Primary antibodywas detected with a secondary biotinylated goat anti-rat IgG F(ab)2 fragment(SC-3,826, Santa Cruz) incubated for 30 min at RT and washed in PBS beforeincubation with strepavidin-horseradish peroxidase (DakoCytomation) for 30 minat RT. Antigen/antibody complex was visualized with 3,3,diaminobenzadine(SK-4105, Vector Laboratories) and counter-stained with haematoxylin.CD138þ ve cells and colonies were counted and data expressed/bone section.Identical data were obtained when data were expressed per unit area.
FACS analysis. Bones were flushed with PBS/2% FCS, cut longitudinally and theinner surface was scraped with a scalpel blade. Bones (including the epiphysis) wereminced and fragments flushed with PBS/2% FCS. Cells were syringed five timesthrough a 23-G needle and filtered through a 100-mm nylon cell strainer (Nunc).Red cells were lysed with 0.15 M NH4Cl. Cells were resuspended in PBS/2% FCSand filtered through a 70-mm strainer. For Ki67 staining, samples were incubatedwith Fixable Viability Dye eFluor780 (eBioscience) and then Fc-blocked with anti-mouse CD16/32 before fixation with the Nuclear Factor Fixation and Permeabi-lization Buffer Set (BioLegend). Cells were then incubated with PE anti-mouse Ki67at a dilution of 1:100 (BioLegend) and DAPI to stain DNA. For CD11b, Gr-1,CD138 and B220 staining, samples were incubated with Fixable Viability DyeeFluor780, then Fc-blocked with anti-mouse CD16/32. Cells were then incubatedwith PE anti-mouse B220, PERCP-Cy5.5 anti-mouse CD11b, Pe-Cy7 anti-mouseCD138 (clone 281-2) and Brilliant Violet 450 anti-mouse Gr-1 (BioLegend) at adilution of 1:100. Samples were acquired on a FACSCanto II or LSR II SORP (BDBiosciences). Analysis was performed with FlowJo software (Tree Star). Formicroarray analysis, up to 50,000 cells were sorted using BD FACSAria II or BDFACSAria III (BD Biosciences) directly into 0.5 ml of TRIzol LS reagent (LifeTechnologies Australia).
Transcript profiling. Total RNA was extracted using Trizol LS reagent and itsintegrity measured using a Total RNA Pico Chip (Agilent Technologies) accordingto manufacturer’s protocol. Complementary DNA was prepared and amplifiedusing the NuGEN Ovation Pico System V2, and hybridized with GeneChip MouseGene 2.0 ST Arrays (Affymetrix). Normalization and probe set summarization wasperformed using the robust multichip average implemented through the Affyme-trix library within R60. Control probe sets were removed leaving 31,235 probe setson the array following batch-correction using SVA package in R61. Differentialgene expression was assessed for each probe set using an empirical Bayes,moderated t-statistic implemented in Limma using the limmaGP tool inGenePattern60. GSEA34 was performed with the GenePattern tool GSEA pre-ranked using a ranked list of the Limma-moderated t-statistics against version 3.0of the ‘C2_all’ curated gene sets from the MSigDB supplemented with gene listsrelated to stem cell regulation, metastasis and melphalan treatment62,63. Functionalannotation of 867 significant genes (fold change 42, Q-valueo0.05) wasperformed using database for annotation, visualization and integrated discovery(DAVID)64,65. All analyses were performed using GenePattern software66 and areavailable at http://pwbc.garvan.unsw.edu.au/gp/. The microarray data have beendeposited in the GEO database under accession code GSE57695.
Patient serum analysis. Newly diagnosed myeloma patients, who had notreceived chemotherapy, were included in this study. Ethical approval for this studywas obtained from the Royal Adelaide Hospital Human Research Ethics Com-mittee and informed consent was obtained in accordance with the Declaration ofHelsinki. Staging was based on the ISS criteria. Of the 118 patients examined, 53were female (median age at diagnosis, 67 years; range, 47–83 years) and 66 weremale (median age at diagnosis, 61 years; range, 49–74 years). Serum b2m, a markerof tumour burden in renal-sufficient patients, creatinine concentrations andcreatinine-based renal parameters (estimated glomerular filtration rate and crea-tinine clearance) were evaluated using an Olympus AU5400 Chemistry Analyzer.Patients with renal insufficiency were excluded from further analysis. Serum levelsof C-terminal collagen crosslinks (CTX-1) were measured using a Roche modularE170 analyzer (Roche Diagnostics, Castle Hill, Australia).
Statistical analysis. Data were analysed using Prism software (GraphPad). One-way analysis of variance (ANOVA) and multiple comparisons were performedusing Tukey’s correction. Unpaired t-tests were performed when comparing twopopulations. Non-parametric data were assessed using Kruskal–Wallis one-wayANOVA. Two-way ANOVA were used for grouped analyses (co-culture) withSidak’s correction. Correlations between serum CTX-1 and b2m were assessedusing linear regression analysis. All data are expressed with error bars representings.e.m.
References1. Aguirre-Ghiso, J. A. Models, mechanisms and clinical evidence for cancer
dormancy. Nat. Rev. Cancer 7, 834–846 (2007).2. Goss, P. E. & Chambers, A. F. Does tumour dormancy offer a therapeutic
target? Nat. Rev. Cancer 10, 871–877 (2010).3. Schardt, J. A. et al. Genomic analysis of single cytokeratin-positive cells from
bone marrow reveals early mutational events in breast cancer. Cancer Cell 8,227–239 (2005).
4. Chambers, A. F., Groom, A. C. & MacDonald, I. C. Dissemination and growthof cancer cells in metastatic sites. Nat. Rev. Cancer 2, 563–572 (2002).
5. San Miguel, J. F. et al. Bortezomib plus melphalan and prednisone for initialtreatment of multiple myeloma. N. Engl. J. Med. 359, 906–917 (2008).
6. Morgan, G. J., Walker, B. A. & Davies, F. E. The genetic architecture of multiplemyeloma. Nat. Rev. Cancer 12, 335–348 (2012).
NATURE COMMUNICATIONS | DOI: 10.1038/ncomms9983 ARTICLE
NATURE COMMUNICATIONS | 6:8983 | DOI: 10.1038/ncomms9983 | www.nature.com/naturecommunications 13
7. Bolli, N. et al. Heterogeneity of genomic evolution and mutational profiles inmultiple myeloma. Nat. Commun. 5, 2997 (2014).
8. Egan, J. B. et al. Whole-genome sequencing of multiple myeloma fromdiagnosis to plasma cell leukemia reveals genomic initiating events, evolution,and clonal tides. Blood 120, 1060–1066 (2012).
9. Keats, J. J. et al. Clonal competition with alternating dominance in multiplemyeloma. Blood 120, 1067–1076 (2012).
10. Melchor, L. et al. Single-cell genetic analysis reveals the composition ofinitiating clones and phylogenetic patterns of branching and parallel evolutionin myeloma. Leukemias 28, 1705–1715 (2014).
11. Chen, Z., Orlowski, R. Z., Wang, M., Kwak, L. & McCarty, N. Osteoblasticniche supports the growth of quiescent multiple myeloma cells. Blood 123,2204–2208 (2014).
12. Ding, L., Saunders, T. L., Enikolopov, G. & Morrison, S. J. Endothelial andperivascular cells maintain haematopoietic stem cells. Nature 481, 457–462 (2012).
13. Kollet, O. et al. Osteoclasts degrade endosteal components and promotemobilization of hematopoietic progenitor cells. Nat. Med. 12, 657–664 (2006).
14. Calvi, L. M. et al. Osteoblastic cells regulate the haematopoietic stem cell niche.Nature 425, 841–846 (2003).
15. Mansour, A. et al. Osteoclasts promote the formation of hematopoietic stemcell niches in the bone marrow. J. Exp. Med. 209, 537–549 (2012).
16. Visnjic, D. et al. Hamatopoiesis is severely altered in mice with an inducedosteoblast deficiency. Blood 103, 3258–3264 (2004).
17. Zhang, J. et al. Identification of the haematopoietic stem cell niche and controlof the niche size. Nature 425, 836–841 (2003).
18. Sacchetti, B. et al. Self-renewing osteoprogenitors in bone marrow sinusoids canorganize a hematopoietic microenvironment. Cell 131, 324–336 (2007).
19. Boyd, A. L. et al. Niche displacement of human leukemic stem cells uniquelyallows their competitive replacement with healthy HSPCs. J. Exp. Med. 211,1925–1935 (2014).
20. Sipkins, D. A. et al. In vivo imaging of specialized bone marrow endothelialmicrodomains for tumour engraftment. Nature 435, 969–973 (2005).
21. Shiozawa, Y. et al. Human prostate cancer metastases target the hematopoieticstem cell niche to establish footholds in mouse bone marrow. J. Clin. Invest.121, 1298–1312 (2011).
22. Mazo, I. B. et al. Hematopoietic progenitor cell rolling in bone marrowmicrovessels: parallel contributions by endothelial selectins and vascular celladhesion molecule 1. J. Exp. Med. 188, 465–474 (1998).
23. Junt, T. et al. Dynamic visualization of thrombopoiesis within bone marrow.Science 317, 1767–1770 (2007).
24. Lo Celso, C. et al. Live-animal tracking of individual haematopoietic stem/progenitor cells in their niche. Nature 457, 92–96 (2009).
25. Lo Celso, C., Lin, C. P. & Scadden, D. T. In vivo imaging of transplantedhematopoietic stem and progenitor cells in mouse calvarium bone marrow.Nat. Protoc. 6, 1–14 (2011).
26. Adams, G. B. et al. Haematopoietic stem cells depend on Galpha(s)-mediatedsignalling to engraft bone marrow. Nature 459, 103–107 (2009).
27. Fujisaki, J. et al. In vivo imaging of Treg cells providing immune privilege to thehaematopoietic stem-cell niche. Nature 474, 216–219 (2011).
28. Roccaro, A. M. et al. BM mesenchymal stromal cell-derived exosomes facilitatemultiple myeloma progression. J. Clin. Invest. 123, 1542–1555 (2013).
29. Foudi, A. et al. Analysis of histone 2B-GFP retention reveals slowly cyclinghematopoietic stem cells. Nat. Biotechnol. 27, 84–90 (2009).
30. Wilson, A. et al. Hematopoietic stem cells reversibly switch from dormancy toself-renewal during homeostasis and repair. Cell 135, 1118–1129 (2008).
31. Tumbar, T. et al. Defining the epithelial stem cell niche in skin. Science 303,359–363 (2004).
32. Szotek, P. P. et al. Normal ovarian surface epithelial label-retaining cellsexhibit stem/progenitor cell characteristics. Proc. Natl Acad. Sci. USA 105,12469–12473 (2008).
33. Lassailly, F., Griessinger, E. & Bonnet, D. "Microenvironmentalcontaminations" induced by fluorescent lipophilic dyes used for noninvasivein vitro and in vivo cell tracking. Blood 115, 5347–5354 (2010).
34. Subramanian, A. et al. Gene set enrichment analysis: a knowledge-basedapproach for interpreting genome-wide expression profiles. Proc. Natl Acad.Sci. USA 102, 15545–15550 (2005).
35. Bidwell, B. N. et al. Silencing of Irf7 pathways in breast cancer cells promotesbone metastasis through immune escape. Nat. Med. 18, 1224–1231 (2012).
36. Lu, X. et al. VCAM-1 promotes osteolytic expansion of indolent bonemicrometastasis of breast cancer by engaging alpha4beta1-positive osteoclastprogenitors. Cancer cell 20, 701–714 (2011).
37. Taichman, R. S. et al. GAS6 receptor status is associated with dormancy andbone metastatic tumor formation. PLoS ONE 8, e61873 (2013).
38. Kalajzic, I. et al. Use of type I collagen green fluorescent protein transgenes toidentify subpopulations of cells at different stages of the osteoblast lineage.J. Bone Miner. Res. 17, 15–25 (2002).
39. Boyle, W. J., Simonet, W. S. & Lacey, D. L. Osteoclast differentiation andactivation. Nature 423, 337–342 (2003).
40. Ninomiya, M. et al. Homing, proliferation and survival sites of human leukemiacells in vivo in immunodeficient mice. Leukemia 21, 136–142 (2007).
41. Rosen, J. M. & Jordan, C. T. The increasing complexity of the cancer stem cellparadigm. Science 324, 1670–1673 (2009).
42. Van Valckenborgh, E. et al. Tumor-initiating capacity of CD138- and CD138þ
tumor cells in the 5T33 multiple myeloma model. Leukemia 26, 1436–1439(2012).
43. Matsui, W. et al. Clonogenic multiple myeloma progenitors, stem cellproperties, and drug resistance. Cancer Res. 68, 190–197 (2008).
44. Yaccoby, S. et al. Inhibitory effects of osteoblasts and increased bone formationon myeloma in novel culture systems and a myelomatous mouse model.Haematologica 91, 192–199 (2006).
45. Li, X., Ling, W., Khan, S. & Yaccoby, S. Therapeutic effects of intrabone andsystemic mesenchymal stem cell cytotherapy on myeloma bone disease andtumor growth. J. Bone Miner. Res. 27, 1635–1648 (2012).
46. Ro, T. B. et al. Bone morphogenetic protein-5, -6 and -7 inhibit growth andinduce apoptosis in human myeloma cells. Oncogene 23, 3024–3032 (2004).
47. Tan, S. H. et al. Wnts produced by Osterix-expressing osteolineage cellsregulate their proliferation and differentiation. Proc. Natl Acad. Sci. USA 111,E5262–E5271 (2014).
48. Dosen, G. et al. Wnt expression and canonical Wnt signaling in human bonemarrow B lymphopoiesis. BMC Immunol. 7, 13 (2006).
49. Croucher, P. I. et al. Osteoprotegerin inhibits the development of osteolyticbone disease in multiple myeloma. Blood 98, 3534–3540 (2001).
50. Croucher, P. I. et al. Zoledronic acid treatment of 5T2MM-bearing miceinhibits the development of myeloma bone disease: evidence for decreasedosteolysis, tumor burden and angiogenesis, and increased survival. J. BoneMiner. Res. 18, 482–492 (2003).
51. Vanderkerken, K., Asosingh, K., Van Camp, B. & Croucher, P. Anti-tumor effectof recombinant OPG in the murine 5T33MM model. Blood 98, 637a (2001).
52. Morgan, G. J. et al. First-line treatment with zoledronic acid as compared withclodronic acid in multiple myeloma (MRC Myeloma IX): a randomisedcontrolled trial. Lancet 376, 1989–1999 (2010).
53. Bataille, R., Chappard, D. & Basle, M. Quantifiable excess of bone resorption inmonoclonal gammopathy is an early sympton of malignancy: a prospectivestudy of 87 bone biospies. Blood 87, 4762–4769 (1996).
54. Vanderkerken, K. et al. Organ involvement and phenotypic adhesion profileof 5T2 and 5T33MM cells in the C57BL/KaLwRij mouse. Br. J. Cancer 76,451–460 (1997).
55. Oyajobi, B. O. et al. Detection of myeloma in skeleton of mice by whole-bodyoptical fluorescence imaging. Mol. Cancer Ther. 6, 1701–1708 (2007).
56. Riedel, S. S. et al. Non-invasive imaging provides spatiotemporal informationon disease progression and response to therapy in a murine model of multiplemyeloma. PLoS ONE 7, e52398 (2012).
57. Sudo, H., Kodama, H. A., Amagai, Y., Yamamoto, S. & Kasai, S. In vitrodifferentiation and calcificatio n in a new clonal osteogenic cell line derivedfrom newborn mouse calvaria. J. Cell Biol. 96, 191–198 (1983).
58. Bakker, A. & Klein-Nulend, J. Osteoblast isolation from murine calvariae andlong bones. Methods Mol. Med. 80, 19–28 (2003).
59. Chtanova, T. et al. Real-time interactive two-photon photoconversion ofrecirculating lymphocytes for discontinuous cell tracking in live adult mice.J. Biophotonics 123, 2204–2208 (2012).
60. Nair, R. et al. c-Myc and Her2 cooperate to drive a stem-like phenotype withpoor prognosis in breast cancer. Oncogene 33, 3992–4002 (2013).
61. Leek, J. T. & Storey, J. D. Capturing heterogeneity in gene expression studies bysurrogate variable analysis. PLoS Genet. 3, 1724–1735 (2007).
62. Augustine, C. K. et al. Gene expression signatures as a guide to treatment strategiesfor in-transit metastatic melanoma. Mol. Cancer Ther. 9, 779–790 (2010).
63. Boegsted, M. et al. Generation of a predictive melphalan resistance index bydrug screen of B-cell cancer cell lines. PLoS ONE 6, e19322 (2011).
64. Huang, da, W., Sherman, B. T. & Lempicki, R. A. Systematic and integrativeanalysis of large gene lists using DAVID bioinformatics resources. Nat. Protoc.4, 44–57 (2009).
65. Huang, da, W., Sherman, B. T. & Lempicki, R. A. Bioinformatics enrichmenttools: paths toward the comprehensive functional analysis of large gene lists.Nucleic Acids Res. 37, 1–13 (2009).
66. Reich, M. et al. GenePattern 2.0. Nat. Genet. 38, 500–501 (2006).
AcknowledgementsWe thank A. Basten and R. Brink for critical reading of the manuscript and D. Rowe(University of Connecticut Health Center) for his kind gift of the pOBCol2.3GFPemdmice. We thank the MLC Flow Facility for cell sorting, the Small Animal Imaging Facilityfor intravital imaging, the Biological Testing Facility for animal husbandry at the GarvanInstitute of Medical Research, and the UNSW Australia, Ramaciotti Centre for GeneFunction Analysis for microarry analysis. P.I.C. is funded by Mrs Janice Gibson and theErnest Heine Family Foundation, T.G.P. by an NHMRC Career Development Fellowship(1005097), M.M.M. by an International Bone and Mineral Society Gregory MundyFellowship, P.A.B. by an Australian Research Council Future Fellowship and E.V.V. by
ARTICLE NATURE COMMUNICATIONS | DOI: 10.1038/ncomms9983
14 NATURE COMMUNICATIONS | 6:8983 | DOI: 10.1038/ncomms9983 | www.nature.com/naturecommunications

the FWO-VI and J.M.W.Q. by an NHMRC Project Grant (GNT1057706). This work wassupported at least in part by a specialist programme grant from Leukaemia and Lym-phoma Research, the OverMyr European Union Framework VII programme, the CancerCouncil NSW (726), the Prostate Cancer Foundation of Australia and Movember, andthe NHMRC (project grant 631484).
Author contributionsP.I.C. and T.G.P. conceived the study. M.A.L., M.M.M., N.K., W.-H.K. and J.D. designedand performed experiments, and analysed data. R.L.T., T.N.D., J.P.-H., C.F., E.V.V. andJ.A.P. performed experiments. P.A.B., M.J.R., W.K., C.L.E., K.V., A.R.P., J.M.W.Q.,E.V.V. and A.Z. analysed and interpreted data. M.M.M., P.I.C. and T.G.P. wrote themanuscript. All authors have read and approved the manuscript.
Additional informationAccession codes: The microarray data have been deposited in the GEO database underaccession code GSE57695.
Supplementary Information accompanies this paper at http://www.nature.com/naturecommunications
Competing financial interests: The authors declare no competing financial interests.
Reprints and permission information is available online at http://npg.nature.com/reprintsandpermissions/
How to cite this article: Lawson, M. A. et al. Osteoclasts control reactivation ofdormant myeloma cells by remodelling the endosteal niche. Nat. Commun. 6:8983doi: 10.1038/ncomms9983 (2015).
This work is licensed under a Creative Commons Attribution 4.0International License. The images or other third party material in this
article are included in the article’s Creative Commons license, unless indicated otherwisein the credit line; if the material is not included under the Creative Commons license,users will need to obtain permission from the license holder to reproduce the material.To view a copy of this license, visit http://creativecommons.org/licenses/by/4.0/
NATURE COMMUNICATIONS | DOI: 10.1038/ncomms9983 ARTICLE
NATURE COMMUNICATIONS | 6:8983 | DOI: 10.1038/ncomms9983 | www.nature.com/naturecommunications 15


