NAVAL POSTGRADUATE
SCHOOL
MONTEREY, CALIFORNIA
MBA PROFESSIONAL REPORT
An Analysis of the Factors Generating the Variance between the Budgeted and Actual
Operating Results of the Naval Aviation Depot at North Island, California
By: Thomas Curran
Joshua J Schimpff
June 2008
Co-Advisors: Kenneth J. Euske John E. Mutty
Approved for public release; distribution is unlimited.

THIS PAGE INTENTIONALLY LEFT BLANK

i
REPORT DOCUMENTATION PAGE Form Approved OMB No. 0704-0188 Public reporting burden for this collection of information is estimated to average 1 hour per response, including the time for reviewing instruction, searching existing data sources, gathering and maintaining the data needed, and completing and reviewing the collection of information. Send comments regarding this burden estimate or any other aspect of this collection of information, including suggestions for reducing this burden, to Washington headquarters Services, Directorate for Information Operations and Reports, 1215 Jefferson Davis Highway, Suite 1204, Arlington, VA 22202-4302, and to the Office of Management and Budget, Paperwork Reduction Project (0704-0188) Washington DC 20503. 1. AGENCY USE ONLY (Leave blank)
2. REPORT DATE June 2008
3. REPORT TYPE AND DATES COVERED MBA Professional Report
4. TITLE AND SUBTITLE An Analysis of the Factors Generating the Variance Between the Budgeted and Actual Operating Results of the Naval Aviation Depot at North Island, California 6. AUTHOR(S) Thomas Curran and Joshua J. Schimpff
5. FUNDING NUMBERS
7. PERFORMING ORGANIZATION NAME(S) AND ADDRESS(ES) Naval Postgraduate School Monterey, CA 93943-5000
8. PERFORMING ORGANIZATION REPORT NUMBER
9. SPONSORING /MONITORING AGENCY NAME(S) AND ADDRESS(ES) N/A
10. SPONSORING/MONITORING AGENCY REPORT NUMBER
11. SUPPLEMENTARY NOTES The views expressed in this thesis are those of the author and do not reflect the official policy or position of the Department of Defense or the U.S. Government. 12a. DISTRIBUTION / AVAILABILITY STATEMENT Approved for public release; distribution is unlimited
12b. DISTRIBUTION CODE
13. ABSTRACT (maximum 200 words) For six of the past eight years, naval aviation depot-level maintenances activities have encountered operating losses that were not anticipated in the Navy Working Capital Fund (NWCF) budgets. These unanticipated losses resulted in increases or surcharges to the stabilized rates as an offset. This project conducts a variance analysis to uncover possible causes of the unanticipated losses. The variance analysis between budgeted (projected) and actual financial results was performed on financial data collected on the E-2C aircraft program from Fleet Readiness Center Southwest (FRCSW) located in San Diego, California. The results of the variance analysis are interpreted and discussed in terms of labor sales quantity, mix, and rate variances, material sales variance, material expense variance, labor, production overhead, and general & administrative rate/spending and quantity variances. The results of this project reveal the factors that created the greatest variance in FRCSW’s net operating results. The variance analysis suggests that the factors having the greatest affect on the operating results were the material sales variances, material expense variances, and the variances due to the quantity of work. Additionally, the analysis revealed that during the year analyzed (FY 2007) FRCSW was not reimbursed for 21 percent of its material costs.
15. NUMBER OF PAGES
87
14. SUBJECT TERMS Navy Working Capital Fund, Naval Aviation Depot, Fleet Readiness Center, Net Operating Result, Variance Analysis
16. PRICE CODE
17. SECURITY CLASSIFICATION OF REPORT
Unclassified
18. SECURITY CLASSIFICATION OF THIS PAGE
Unclassified
19. SECURITY CLASSIFICATION OF ABSTRACT
Unclassified
20. LIMITATION OF ABSTRACT
UU NSN 7540-01-280-5500 Standard Form 298 (Rev. 2-89) Prescribed by ANSI Std. 239-18

ii
THIS PAGE INTENTIONALLY LEFT BLANK
iii
Approved for public release; distribution is unlimited
AN ANALYSIS OF THE FACTORS GENERATING THE VARIANCE BETWEEN THE BUDGETED AND ACTUAL OPERATING RESULTS OF THE
NAVAL AVIATION DEPOT AT NORTH ISLAND, CALIFORNIA
Thomas Curran, Commander, United States Navy Joshua Schimpff, Lieutenant, United States Navy
Submitted in partial fulfillment of the requirements for the degree of
MASTER OF BUSINESS ADMINISTRATION
from the
NAVAL POSTGRADUATE SCHOOL June 2008
Authors: _____________________________________ Thomas Curran
_____________________________________
Joshua J Schimpff Approved by: _____________________________________
Kenneth J. Euske, Co-Advisor _____________________________________ John E. Mutty, Co-Advisor _____________________________________ Robert N. Beck, Dean
Graduate School of Business and Public Policy

iv
THIS PAGE INTENTIONALLY LEFT BLANK

v
AN ANALYSIS OF THE FACTORS GENERATING THE VARIANCE BETWEEN THE BUDGETED AND ACTUAL
OPERATING RESULTS OF THE NAVAL AVIATION DEPOT OF NORTH ISLAND, CALIFORNIA
ABSTRACT
For six of the past eight years, naval aviation depot-level maintenances activities
have encountered operating losses that were not anticipated in the Navy Working Capital
Fund (NWCF) budgets. These unanticipated losses resulted in increases or surcharges to
the stabilized rates as an offset. This project conducts a variance analysis to uncover
possible causes of the unanticipated losses. The variance analysis between budgeted
(projected) and actual financial results was performed on financial data collected on the
E-2C aircraft program from Fleet Readiness Center Southwest (FRCSW) located in San
Diego, California. The results of the variance analysis are interpreted and discussed in
terms of labor sales quantity, mix, and rate variances, material sales variance, material
expense variance, labor, production overhead, and general & administrative rate/spending
and quantity variances. The results of this project reveal the factors that created the
greatest variance in FRCSW’s net operating results. The variance analysis suggests that
the factors having the greatest affect on the operating results were the material sales
variances, material expense variances, and the variances due to the quantity of work.
Additionally, the analysis revealed that during the year analyzed (FY 2007) FRCSW was
not reimbursed for 21 percent of its material costs.

vi
THIS PAGE INTENTIONALLY LEFT BLANK

vii
TABLE OF CONTENTS
I. INTRODUCTION........................................................................................................1 A. PURPOSE OF THIS STUDY .........................................................................1 B. BACKGROUND ..............................................................................................1 C. RESEARCH QUESTIONS.............................................................................1
1. Primary Question.................................................................................1 2. Secondary Questions............................................................................1
D. PROJECT SCOPE AND LIMITATIONS ....................................................2 1. Scope......................................................................................................2 2. Limitations to the Project....................................................................2
E. RESEARCH METHOD ..................................................................................2 F. CONTENT OF CHAPTERS ..........................................................................3
II. NAVAL AVIATION DEPOTS AND WORKING CAPITAL FUNDS ..................5 A. NAVAL AVIATION DEPOTS.......................................................................5
1. United States Code Title 10.................................................................5 2. BRAC 2005 ...........................................................................................6 3. NADEP North Island...........................................................................8
B. DEFENSE FINANCIAL MANAGEMENT REGULATIONS....................9 C. NAVY WORKING CAPITAL FUND ...........................................................9
1. History...................................................................................................9 2. Design..................................................................................................10 3. Objectives............................................................................................11
a. Management............................................................................11 b. Financial .................................................................................13
4. Operations ..........................................................................................14 5. Budget Formulation...........................................................................14
D. RATE SETTING............................................................................................16 1. Cost Elements .....................................................................................16 2. Unit Cost Goal ....................................................................................17 3. Recovery Rate.....................................................................................18
E. SUMMARY ....................................................................................................19
III. DATA COLLECTION AND PROCESSING .........................................................21 A. INTRODUCTION..........................................................................................21 B. DATA GATHERING ....................................................................................21 C. VARIANCE ANALYSIS...............................................................................22
1. Variance Analysis Definition ............................................................22 2. Variance Analysis Process.................................................................23
a. Labor Sales Variance..............................................................24 b. Material Sales and Expense Variance ...................................27 c. Civilian Labor Expense Variance ..........................................28 d. Contract Labor Expense Variance .........................................29 e. Production Overhead Expense Variance ...............................32

viii
f. General & Administrative Expense Variance........................34 D. SUMMARY ....................................................................................................36
IV. FINDINGS AND ANALYSIS ...................................................................................37 A. INTRODUCTION..........................................................................................37 B. RESULTS OF VARIANCE ANALYSIS .....................................................37
1. Labor Sales Variance.........................................................................37 2. Material Sales Variance ....................................................................38 3. Material Expense Variance...............................................................39 4. Rate & Spending Variance................................................................39 5. Quantity Variance..............................................................................40
C. SUMMARY ....................................................................................................40
V. CONCLUSION AND RECOMMENDATIONS.....................................................43 A. INTRODUCTION..........................................................................................43 B. PRIMARY QUESTION ................................................................................43
1. What are Factors Affecting the Operating Results at FRCSW?...43 C. SECONDARY QUESTIONS........................................................................44
1. Is the Current Model Accurate at Predicting Workload Quantity? ............................................................................................44
2. Is the Current Model Accurate at Predicting the Labor Rates? ...45 3. Is the Current Model Accurate at Predicting Overhead and
G&A Rates?........................................................................................45 4. Where Should the Office of Budget (FMB), Commander FRCs
(COMFRC), and FRCSW Invest Resources to Reduce the Size of Variances? ......................................................................................45
D. RECOMMENDATIONS FOR FURTHER RESEARCH .........................46 E. CONCLUSION ..............................................................................................47
APPENDIX A. UNITED STATES CODE TITLE 10 HIGHLIGHTS....................49
APPENDIX B. BASE CLOSURE AND REALIGNMENT REPORT - FRC SUMMARY ..............................................................................................................55
APPENDIX C. FRC SOUTHWEST ORGANIZATIONAL CHART.....................59
APPENDIX D. DEFENSE WORKING CAPITAL FUND BUSINESS AREAS ...61
APPENDIX E. REVOLVING FUND CASH FLOW ...............................................63
APPENDIX F. REPRESENTATIVE RAW DATA..................................................65
LIST OF REFERENCES......................................................................................................69
INITIAL DISTRIBUTION LIST .........................................................................................71

ix
LIST OF FIGURES
Figure 1. Naval Aviation Enterprise (NAE) Fleet Readiness Centers (From Johns, 2006) ..................................................................................................................7

x
THIS PAGE INTENTIONALLY LEFT BLANK

xi
LIST OF TABLES
Table 1. FRCSW, E-2C, Variances by Line Item..........................................................24 Table 2. FRCSW, E-2C, 2007 Labor Sales Variances...................................................26 Table 3. FRCSW, E-2C, 2007 Material Sales Variances...............................................27 Table 4. FRCSW, E-2C, Civilian Labor Rate Variance ................................................28 Table 5. FRCSW, E-2C, Civilian Labor Quantity Variance..........................................29 Table 6. FRCSW, E-2C, Contract Labor Rate Variance ...............................................30 Table 7. FRCSW, E-2C, Contract Labor Quantity Variance.........................................31 Table 8. FRCSW, E-2C, Production Overhead Spending Variance..............................32 Table 9. FRCSW, E-2C, Production Overhead Quantity Variance ...............................33 Table 10. FRCSW, E-2C, General and Administrative Spending Variance....................35 Table 11. FRCSW, E-2C, General and Administrative Quantity Variance.....................35 Table 12. FRCSW, E-2C, 2007 Labor Sales Variances...................................................38 Table 13. FRCSW, E-2C, 2007 Material Sales Variances...............................................38 Table 14. FRCSW, E-2C, Material Expense Variance ....................................................39 Table 15. FRCSW, E-2C, Expense Rate & Spending Variance ......................................40 Table 16. FRCSW, E-2C, Expense Quantity Variance....................................................40

xii
THIS PAGE INTENTIONALLY LEFT BLANK

xiii
ACKNOWLEDGMENTS
We would like to take this opportunity to thank our Co-Advisors, Professor
Kenneth J. Euske and CAPT John E. Mutty USN (ret), for mentoring us through this
process. We are grateful for the time, effort, and guidance that you provided in support
of this project.
We would also like to thank the FRCSW Commanding Officer, CAPT Mike
Kelly, for your unselfish support and the unlimited access you provided to your
command. To the FRSCW Comptroller, Ms. Diana Delgado and her staff, especially Ms.
Michelle Norris and Mr. Mohsen Ahmed, thank for your hospitality, the countless hours
you spent with us, and effort you provided.
Finally and most important, we would like to thank our families for their support
and understanding over the past year and a half.

xiv
THIS PAGE INTENTIONALLY LEFT BLANK
1
I. INTRODUCTION
A. PURPOSE OF THIS STUDY
The purpose of this project is to identify the factors that have the most influence
on the differences between the budgeted and actual operating results for Fleet Readiness
Center, Southwest’s (FRCSW) depot-level aviation maintenance activity. Since all the
Navy’s aviation depot-level activities operate in the same environment and face similar
challenges, it is conceivable that the factors generating differences at FRCSW are similar
to the factors generating differences at the other two Naval Aviation depot-level
maintenance activities.
B. BACKGROUND
Accurately predicting depot-level maintenance is difficult and includes a myriad
of variables that increase the complexity of the task. Over six of the past eight years, the
Naval Aviation depot-level maintenance activities have encountered operating losses that
were not anticipated in the Navy Working Capital Fund (NWCF) budgets. As a result an
increase, or surcharge, to the aviation depot-level maintenance NWCF stabilized rates
was required to offset the operating losses. Identifying possible causes of variances
between the budgeted and actual financial operating results could provide a better
understanding of why operating losses have occurred.
C. RESEARCH QUESTIONS
1. Primary Question
What are the factors affecting the operating results at FRCSW?
2. Secondary Questions
• Is the current model accurate at predicting workload quantity?
• Is the current model accurate at predicting the labor rates?
2
• Is the current model accurate at predicting overhead and G&A rates?
• Where should the Office of Budget (FMB), Commander FRCs (COMFRC), and FRCSW invest resources to reduce the size of variances?
D. PROJECT SCOPE AND LIMITATIONS
1. Scope
This project completes a variance analysis on the expense and revenue data
obtained from FRCSW’s depot-level maintenance activity. The data collected for this
project were on the E-2C Hawkeye program. This program was chosen because all work
done on the E-2C aircraft at FRCSW was at a fixed price and provided a manageable
sample size to complete the in-depth variance analysis.
2. Limitations to the Project
This project is limited to the data on the E-2C airframe. The E-2C program
provided homogeneous data to complete the in-depth variance analysis. The original
intent of this project was to complete a variance analysis on all type/model/series depot-
level work completed at FRCSW. Due to time constraints and the need for homogeneous
data only one type/model/series, the E-2C, was analyzed. As a result of limited sales
data, fiscal year (FY) 2007 was the only year that a full variance analysis was completed.
A variance analysis on expenses was performed for FY2004 through FY2006.
Additionally, due to limited data on material expenses and sales, an expense quantity and
mix analysis and a sales quantity and rate variance was not conducted.
E. RESEARCH METHOD
The research method utilized for this project consisted of a literature review,
interviews with FRCSW employees, analysis of historical data, and site visits to FRCSW.
The literature review included DoD regulations, DoD reports, briefs, textbooks, and
thesis work conducted by previous Naval Postgraduate School students.
3
During the two site visits to FRCSW, interviews were conducted with the
FRCSW Commanding Officer, the Plant General Manager for Production, the E-2C
Aircraft Product Manager, the Comptroller, and analysts on the Comptroller’s Staff.
These interviews revealed possible causes of the variances between the budgeted and
actual financial results. These interviews also provided background information for
NWCF activities and, in particular, FRCSW operations. Follow-on electronic and
telephonic correspondence was essential in answering questions and clarifying the data.
A variance analysis of historical financial data was done for four fiscal years (FY
2004, 2005, 2006, and 2007) on the budgeted expenses and expenses that were actually
incurred. A variance analysis on the sales data was completed for FY2007 only. The
data used in this analysis were primarily collected from the FRCSW Accounting and
Financial Information System (AFIS). Some data not maintained in the AFIS database
were derived from other financial reports during the site visits.
F. CONTENT OF CHAPTERS
Chapter II, titled “Naval Aviation Depots and Working Capital Funds” introduces
the legislation that established and provides legal guidance for aviation depot-level
maintenance organizations, also known as Fleet Readiness Centers, and acknowledges
the applicable defense financial management regulations. This chapter also discusses the
history of Navy Working Capital funded (NWCF) activities and the operations of a
NWCF activity as designed.
Chapter III, titled “Data Collection and Processing” defines variance analysis and
explains the process used to determine the variances. The focus of this chapter is to
present the variance analysis process performed on the financial data collected from
FRCSW.
Chapter IV, titled “Findings and Analysis” summarizes and interprets the results
of the analysis described and conducted in Chapter III. The results are discussed in terms
of labor sales variance, material sales variance, material expense variance, rate and
spending variances, and quantity variances. This chapter also indicates the factors that
created the greatest variance in this analysis.

4
Chapter V, titled “Conclusion and Recommendations” wraps up the project by
answering the primary and secondary research questions. This chapter also provides
recommendations for further research.

5
II. NAVAL AVIATION DEPOTS AND WORKING CAPITAL FUNDS
The purpose of this chapter is to introduce the reader to the legislation that
established and provides legal guidance for aviation depot-level maintenance
organizations (Fleet Readiness Centers), and to acknowledge the applicable Defense
Financial Management Regulations. It also discusses the history and operations of Navy
Working Capital funded activities and how they set their rates.
A. NAVAL AVIATION DEPOTS
1. United States Code Title 10
Title 10 of the U.S. Code provides the legislative foundation for depot-level
maintenance and the use of working capital funds for industrial type activities. The
section of Subtitle A, Part IV from Chapter 148 sets the requirement for depot-level
maintenance activities within DoD. Sections, 2460-2464, 2466-2467, 2469-2472 and
2474-2475, from Chapter 146, provide the majority of legislation for depot-level
maintenance activities.
The sections from Chapter 146:
• define depot-level maintenance
• establish the scope of work
• establish the studies and reports requirements
• encourage public-private competition
• establish the requirements for converting to and from a contracting workforce
• establish the requirement to maintain core logistics capabilities
• limit the amount of depot maintenance that can be contracted to private industry
• set the standard for managing DoD civilian employees
• allow depot-level maintenance activities to compete for other Federal Agency work

6
• authorize the Secretary of Defense (SECDEF) to designate Centers of Industrial and Technical Excellence
Section 2563, Chapter 152 allows depot maintenance activities to perform work
for private industry. Section 2687, Chapter 159 discusses base closures and realignments
and section 2208, Chapter 131 discusses working capital funds.
Title 10 provides legal justification, restrictions, opportunities, and requirements
of the military depot-level maintenance industry. Appendix A further discusses each
aforementioned section (Title 10).
By providing the Armed Forces with a critical capacity to respond to the needs of the Armed Forces for depot-level maintenance and repair of weapon systems and equipment, the depot-level maintenance and repair activities of the Department of Defense play an essential role in maintaining the readiness of the Armed Forces (Section 331 of Pub. L. 103-337, Title 10).
2. BRAC 2005
There have been five Base Realignment and Closure (BRAC) rounds (in 1988,
1991, 1993, 1995 and 2005). However, the BRAC 2005 was the driving force behind
reorganizing and restructuring Naval Aviation Maintenance into what it is today.
A comprehensive assessment in support of BRAC decisions revealed that the
DoD maintained a 24 percent excess capacity in installations to support the future forces
(Department of Defense [DoD], 2005). In his initial guidance to the DoD, then Secretary
of Defense (SECDEF) Donald Rumsfeld directed the DoD leaders to “reconfigure our
current infrastructure into one which maximizes both war fighting capability and
efficiency” (DoD, 2005). As a result, five themes were developed:
1. Support force transformation
2. Rebase forces to address new threat, strategy, and force protection
concerns
3. Consolidate business-oriented support functions
4. Promote joint and multi-Service basing
5. Achieve savings (DoD, 2005)

7
The two themes that are directly supported by the Naval Aviation Enterprise
(NAE) are to “consolidate business-oriented support functions” and to “achieve savings”
through restructuring support functions and reduction of support personnel, land, and
facilities (DoD, 2005). The NAE objectives of reducing the number of maintenance
levels by integrating the depot-level maintenance and intermediate level-maintenance,
and moving the integrated maintenance closer to the most populated fleet areas, support
the BRAC themes.
BRAC 2005 reorganization and restructuring of depot-level and intermediate-
level maintenance activities proposed the creation of six Fleet Readiness Centers (FRC)
and 13 satellite FRC sites. In essence, major intermediate and depot-level repair facilities
were merged into FRCs (DoD, 2005). Appendix B shows a detailed list of the
recommendations.
Naval Aviation Enterprise FRCs
Legend X - Closed & Moved
FRC Mid AtlanticSite New OrleansAIMD Atlanta (E-2C support)NAVAIRES New Orleans
FRC EASTNADEP Cherry Point MALS-14 Cherry PointAIMD Willow Grove
FRC MID ATLANTIC AIMD OceanaAIMD NorfolkAIMD NAS Corpus ChristiNADEP CP Det OceanaNADEP JAX Det NorfolkNADEP JAX Det OceanaNAWCAD LKE Det Norfolk
FRC WESTAIMD LemooreNADEP NI Det Lemoore
FRC West Site FallonNADEP NI Det Fallon
FRC West Site Fort WorthAIMD Atlanta (FA-18 support)NAVAIRES Fort Worth
FRC SouthwestSite Point MuguAIMD Point Mugu
FRC NORTHWESTAIMD Whidbey IslandNADEP NI Det Whidbey Island
FRC SOUTHWESTAIMD North IslandNADEP North IslandNADEP NI Det NINADEP NI Det Kaneohe Bay
FRC East Site New RiverMALS-26 & 29 New RiverNADEP CP Det New River
FRC SoutheastSite Key West
FRC SOUTHEASTNADEP JAXNADEP JAX Det Cecil FieldAIMD JAXAIMD Brunswick
FRC East Site BeaufortMALS-31 Beaufort NADEP JAX Det Beaufort
FRC SoutheastSite MayportAIMD MayportNADEP JAX Det MayportNAWCAD LKE Det Mayport
FRC Mid Atlantic SitePax River
FRC Southwest Site MiramarMALS-11 & 16 MiramarNADEP NI Det Miramar
FRC Southwest Site PendletonMALS-39 PendletonNADEP NI Det Pendleton
FRC Southwest Site YumaMALS-13 YumaNADEP NI Det Yuma
AIMD China Lake(OMD+Established)*
X
AIMD NAS Corpus Christi
X
AIMD Brunswick
X
AIMD Willow Grove
FRC East ‘Affiliation’HMX-1 Quantico
AIMD Atlanta X
FRC East Site RobinsMALS-42
FRC East Site McGuireAIMD Willow GroveMALS-49
X
Source: Johns, 2006
Figure 1. Naval Aviation Enterprise (NAE) Fleet Readiness Centers (From Johns, 2006)

8
BRAC 2005 disestablished Naval Aviation Depot (NADEP) North Island and the
Aviation Intermediate Maintenance Department (AIMD) entities at North Island, and
realigned these functions under FRC Southwest. Figure 1 is the Naval Aviation
Enterprise FRC layout as of April 2006 (Johns, 2006). As depicted in this figure, the
concentrations of maintenance activities are located where the Navy’s aviation assets are
concentrated.
3. NADEP North Island
The depot-level maintenance functions of FRC Southwest are nearly as old as
Naval Aviation itself. In 1919, nine years after the start of Naval Aviation, the FRC
began work as an Assembly and Repair Department of the Naval Air Station at North
Island. In 1969, the Assembly and Repair Department was renamed the Naval Air
Rework Facility (NARF). By 1987, the NARF was renamed the Naval Aviation Depot
(NADEP) North Island (Best Manufacturing Practices, 2003). As a result of BRAC
2005, NADEP North Island was disestablished and realigned into FRC Southwest.
Recognized as an innovator in depot-level maintenance by the Office of Naval
Research’s Best Manufacturing Practices program, FRC Southwest is the Navy’s
primary west coast aircraft repair and modification facility for mission essential fighter
and rotary wing aircraft for Navy and Marine Corps squadrons (Best Manufacturing
Practices, 2003). As of December 2007, FRC Southwest employed 4,371 people
consisting of 3,494 civilian employees and 877 military personnel (M. Kelly, Personal
Communication, December 14, 2007). The mission of the Fleet Readiness Center
Southwest is:
…CNAF’s [Commander Naval Air Forces] West Coast Aircraft repair D2I [Depot to Intermediate] facility specializing in the support of Navy and Marine Corps aircraft and related systems. Through partnerships with industry, other government agencies and supporting aerospace organizations, FRC Southwest, North Island repairs and overhauls aviation systems” (Fleet Readiness Center, Southwest [FRCSW], 2007).
This FRC performs repair and modification work on F/A-18 Hornets and Super
Hornets, EA-6B Prowlers, S-3 Vikings, E-2 Hawkeyes, C-2 Greyhounds, AV-8B

9
Harriers, SH-60 Seahawks and HH/MH-60s, AH-1 Cobras, UH/HH-1 Hueys, and CH-53
Sea Stallions. Additionally, FRC Southwest deploys Field Service Teams and Voyager
Repair Teams to deployed aviation squadrons, ships, and installations worldwide. The
Field Service and Voyager Repair Teams provide depot-level maintenance repair and
modification for aircraft, aviation structures, aircraft components, aircraft carrier catapult
and arresting gear systems, and aviation equipment and facilities on other ships
(FRCSW, 2007). In 2007, FRC Southwest deployed over 2,500 Field Service and
Voyager Repair Teams, repaired and modified approximately 285 aircraft, and
manufactured over 50,000 aircraft components (M. Kelly, Personal Communication,
December 14, 2007). Appendix C displays the organizational structure of FRC Southwest
as of December 2007.
B. DEFENSE FINANCIAL MANAGEMENT REGULATIONS
The Department of Defense Financial Management Regulations (FMR), DoD
7000.14-R, is the guiding document that provides policy, regulations, and procedures for
DoD activities. This regulation is issued by the Under Secretary of Defense
(Comptroller). The most applicable of the fifteen volumes for Navy Working Capital
Fund (NWCF) activities is Volume 11B, titled Reimbursable Operations, Policy and
Procedures-Working Capital Funds (WCF). Specifically, Volume 11B provides the
financial management mandates, systems, and functions for the WCF activities
(Department of Defense [DoD], 2008).
C. NAVY WORKING CAPITAL FUND
1. History
Revolving funds were authorized for use by DoD as a result of the National
Security Act Amendment of 1949. A revolving fund activity is an organization that
obtains all its income from the operations it performs. The organization is able to finance
continuing operations without the limits of fiscal year constraints which normally
constrain government financed organizations (Potvin, 2007).

10
Historically, the military has used two types of revolving funds:
1. Stock Funds are used to make volume purchases of spare parts and other
goods from commercial sources. These goods are then kept in inventory
until they are sold to operating forces at the price the stock fund purchased
the goods plus a surcharge (Office of the Secretary of Defense,
(Comptroller) [OSD(C)], 2007).
2. Industrial Funds are used to provide the operating forces with industrial
and commercial goods and services, such as depot-level maintenance. The
price charged for industrial and commercial goods and services to the
operating forces includes overhead costs and material costs (OSD(C),
2007).
In 1991, all of the Services’ stock and industrial funds were rolled into a single
revolving fund called the Defense Business Operations Fund (DBOF). The intent of the
DBOF was to share funds across all services; however, it failed. The reason it failed was
because it assumed that one large revolving fund would require a smaller cash reserve
than many smaller revolving funds. Since the working capital of the DBOF was less than
the sum of all the revolving funds it replaced, each service experienced severe cash
shortages (Potvin, 2007).
Over the period 1996 to 1999, the DBOF was reorganized into five Defense
Working Capital Funds —Army, Navy (NWCF), Air Force, Defense Wide, and Defense
Commissary Agency. These funds are now the responsibility of their respective agencies
and must maintain a positive cash balance or be in violation of the Antideficiency Act
(Potvin, 2007).
2. Design
The Defense Working Capital Fund (DWCF) operations are now organized as
business areas (such as Depot Maintenance). A business area is a collection of activities
(such as depot-level maintenance at FRC Southwest) that provides goods and services to
other organizations either within DoD or to non-DoD organizations as authorized by USC
Title 10 (OSD(C), 2007).

11
DWCF business operations include:
• Consumable spare parts and supplies
• Depot maintenance
• Storage and transportation of supplies and secondary equipment items
• Financial and accounting services
• Printing and publication services
• Commissaries
• Information services
• Research and development (OSD(C), 2007)
To become a DWCF business area, an activity must meet four criteria:
1. Produce identifiable goods and services
2. Have an approved accounting system
3. Have customers that need and order products or services
4. Have evaluated the advantages and disadvantages of establishing a
buyer/seller relationship (OSD(C), 2007)
Should a service component wish to establish a new business area, it must meet
the above criteria and propose the new business area to the Office of the Under Secretary
of Defense, (Comptroller) (Potvin, 2007). Appendix D includes a list of business areas,
detailing functions and customers.
3. Objectives
a. Management
DWCFs or, in the case of this project, NWCFs, attempt to provide total
cost visibility through the use of accounting tools, such as activity based costing, to
achieve full cost recovery. Managers are responsible to customers to meet customer
needs while at the same time operating within budget cost goals (OSD(C), 2007).

12
By establishing clear customer/provider relationships, adopting private-sector techniques for resource management, consolidating functions, and using activity-based accounting policies to display full costs, the working capital fund system provides managers with improved cost and performance data for more effective and efficient decision making (OSD(C), 2007).
The NWCF financial management structure employs free-market system
principles and encourages business-like processes that are mission driven. Since no
operating funds are provided by Congress, a NWCF activity must collect a fee for the
work it performs to sustain itself. This is different than a mission funded organization
that is funded by Congress and is driven to do the most it can while expending all the
funds provided (OSD(C), 2007).
Some of the advantages of using a NWCF include:
• Identifies the total or ‘true’ cost of DoD goods and services to Congress, military users (buyers), and those who provide goods and services (sellers)
• Promotes more efficient and effective allocation and use of resources
• Underlines the cost consequences of choices and allows purchases to be made in anticipation of future funded orders
• Provides managers with the financial authority and flexibility to procure and use manpower, materials, and other resources more effectively
• Improves cost estimates and cost control through comparison of estimates and actual costs
• Places customers in the position of critically evaluating purchase prices and the quality of goods and services ordered
• Allows for greater flexibility and security in decision making as there are no fiscal year limitations
• Establishes standard prices or stabilized rates and unit prices for goods and services furnished by NWCF Business Areas, enabling customers to plan and budget more confidently (OSD(C), 2007)

13
b. Financial
Unlike a mission funded activity, whose mission is to do the most it can
with funds provided in appropriations, the objective of the NWCF is to achieve a break-
even operating result over time. This means that the NWCF activity should neither make
a profit nor incur a loss. If a profit or a loss were to occur the NWCF activity will either
lower or raise prices to make up for the previous year’s operating results (OSD(C), 2007).
NWCF activities recover the cost of operations through the stabilized rates
that they charge to their customers. These rates include direct costs (i.e., labor, parts, and
material), indirect costs (e.g., supervisors), general and administrative costs (e.g.,
executive staff costs), any gains or losses from prior years, and possible surcharges. The
focus of a NWCF activity is not to save the Navy money; its focus is on recovering the
total cost of operations (OSD(C), 2007). NWCF activities make financial sense because
a NWCF:
• Provides for total-cost visibility and improved cost awareness
• Enables full-cost recovery (capital costs cannot be exceeded and money is saved for additional programming)
• Stabilizes rates to protect customers from inflation during program execution
• Gives managers more flexibility because they know the true cost of decisions
• Shifts the focus from spending to cost and cash management
• Minimizes costs because customers determine what they need and can justify their decisions and funding allocation
• Measures performance and promotes greater taxpayer accountability
• Allows for greater flexibility and security in decision-making, as there are no fiscal year limitations (OSD(C), 2007)
As indicated by the list above, a NWCF activity emphasizes
accountability, financial flexibility, and finding reliable ways to measure the total cost of
delivering a good or service.

14
4. Operations
The NWCF activity is a revolving fund structure that is designed to provide goods
and services to the operational forces. The revolving fund concept gets its name from the
circular flow of cash into and out of the fund (OSD(C), 2007).
The steps of the revolving cash flow are:
1. Customers justify their program requirements. Congress approves and the
President signs into law the annual budget for the customers (e.g., navy
stations, air wings, ships, and agencies). Finally, customers receive
appropriated funds.
2. The “funded” customers send their orders to the NWCF business area
activity. An order is generally in the form of a fixed-priced contract,
based upon the stabilized rate for the goods or services to be provided.
3. The provider incurs costs in the course of providing the customer with the
contracted goods or services. The provider submits an invoice to the
customer and receives payment.
4. This cycle continues for the life of the NWCF business activity (OSD(C),
2007).
Appendix E shows a graphical representation of the revolving flow. This cycle
operates like a commercial business; however, the financial goals of a revolving fund (or
NWCF) differ in that the NWCF seeks a zero net profit.
5. Budget Formulation
When NWCF business areas are established, funds are transferred from an
existing appropriation account into the NWCF. This initial working capital (commonly
known as capital investment in the commercial sector) is called the “corpus.” This
corpus is used to finance the initial cost of goods and services needed to provide the
contractually agreed upon goods and services to their customers (OSD(C), 2007).
The corpus and the subsequent revolving funds in the working capital fund are
known as “no year” funds and remain available across fiscal years with no time

15
limitation. In contrast, the appropriated funds provided to mission funded activities have
a finite period of time in which they must be used (OSD(C), 2007).
In order for a NWCF activity to operate effectively, it must be able to budget for
all of its activities and cover the cost of its operations. The central principle to remember
with NWCF activities is the customer-provider relationship. This means that if the
customer does not think the product meets cost or performance needs it can go to another
provider. However, the depot-level maintenance activity is somewhat protected by
Section 2466 of Title 10, which limits the amount of mission funded Depot level work
that could be outsourced to private industry to 50 percent. Nonetheless, there are
negotiations between the customer and provider as well as the Office of Budget (FMB),
which oversees the financial operations of all Navy activities, including the NWCF.
NWCF budgets are based on estimated costs and workloads nearly two years in
advance of when the work actually occurs. This creates some level of error in the budget
of the NWCF (Potvin, 2007). Estimated costs are used to calculate rates, called stabilized
rates (to be discussed later).
There are two budgets formulated simultaneously within the NWCF activity: the
operating budget and the capital budget. The operating budget covers annual operating
costs which are made up of all direct, indirect, and general & administrative (G&A)
costs, and depreciation expenses (except for military construction). The capital budget
covers the activity’s annual capital asset investment that includes items such as industrial
equipment, minor construction, telecommunications equipment, IT infrastructure, and
software, but does not include military construction projects. These two budgets are
combined to create the Annual Operating Budget (AOB) (Potvin, 2007).
The AOB, issued prior to the beginning of the fiscal year, provides the activity’s
throughput estimate, the unit cost goal, and desired Net Operating Result (NOR). The
NOR equals the annual revenue minus the annual costs. Adjustments to AOBs are made
during the execution year to account for changes in capital investment, costs, and
16
workload (Potvin, 2007). Adjustments to AOBs due to capital investment are not that
common. The majority of the adjustments are due to changes in workload mix (D.
Delgado, personal communication, March 18, 2008).
The budget process is the mechanism that ensures the Navy customers (mission
funded) are resourced to pay the established NWCF rates. Once the NWCF activities’
budgets are completed they are forwarded to the Assistant Secretary of the Navy
(Financial Management and Comptroller) (ASN (FM&C)) for review (Potvin, 2007). If
the NWCF activity’s submission shows a “significant increase” from the previous year’s
submission, the NWCF activity will be asked to explain the reason for the “significant
increase.” If the activity’s reason is not accepted, an adjustment to the submission will
be made, making sure that the NWCF submission matches the mission funded activity’s
funding level. If the reason is accepted, an adjustment to the mission funded activity’s
budget will occur, ensuring balance. For example, in the FY 2009 Program/Budget
Review, an issue was submitted as a result of a significant increase in NWCF direct labor
and direct material costs from the FY 2008 President’s Budget (Roth, 2007). ASN
(FM&C)’s goal is to balance the mission funded budgets with the NWCF budgets. Once
complete, the NWCF budget is sent to USD(C) as part of the annual Budget Estimate
Submission (BES) (Potvin, 2007).
D. RATE SETTING
Depot rates are based on the unit cost goal, which is adjusted for the depot’s
Accumulated Operating Results (AOR) and further adjusted by the depot activity group
and/or Navy Working Capital Fund Comptroller to achieve zero Navy Working Capital
Fund AOR.
1. Cost Elements
In order to understand the Navy Working Capital Funds (NWCF) and the rate
setting process, one must understand its cost elements and how the costs are allocated.
Some of these cost elements will be considered fixed costs and some will be considered
variable costs. Fixed costs are costs that do not change with changes in the organizations
17
activity, such as building maintenance. Variable costs are costs that change with changes
in activity, such as direct labor hours. These cost elements make up the estimate used for
total cost.
• Direct costs are costs that can be directly tied to the product or service. An example would be the amount of time (i.e., direct labor hours) a mechanic works on an aircraft engine. Direct costs are traced to the product that they are tied to.
• Indirect costs are costs that cannot economically be traced to the end product or service. These types of costs can include both labor and materials. An example of indirect labor would be a supervisor who supervises multiple production centers and cannot reasonably trace his time to any particular job. Indirect materials are materials that are consumed in producing the end product or service, but for which it is not economical to track the amount on an individual unit of output basis. A common method used in allocating indirect costs is to allocate costs based on direct labor hours.
• General & Administrative (G&A) costs are costs that do not contribute directly to producing goods or providing services, but to the overall operation of the activity. These include costs such as utilities, office supplies, housekeeping, and administrative salaries. These costs are allocated across all goods and services produced. A common method used in allocating G&A costs is to allocate costs based on direct labor hours.
While some of these costs are typically considered fixed, it is important to
remember that over the long run all costs are variable (Potvin, 2007).
2. Unit Cost Goal
NWCFs use the unit cost goal (UCG) for planning purposes. The UCG is an
estimate of what a unit of product or service “should cost.” The unit cost goal is
calculated by dividing the planned total cost by the planned output. Output could be
measured several ways including direct labor hours, dollars of sales, or units shipped
(Potvin, 2007).
Unit Cost Goal = Planned Total Cost/Planned Output
The unit cost goal can be used as the genesis for setting the recovery rate and as a
measure against which to compare actual costs (Potvin, 2007). In the case of FRCSW,
planned output is measured in direct labor hours.

18
3. Recovery Rate
The process for establishing recovery rates begins approximately two years before
the fiscal year in which they will go into effect. In this project, recovery rate is
synonymous with stabilized rate and sales rate. These rates are set during the budget
process and are proposed in the Navy’s Budget Estimate Submissions (BES), approved
by the Office of the Under Secretary of Defense (Comptroller) (OUSD(C)), and
documented in a Program Budget Decision (PBD). NWCF rates/prices are set by the
depot business activity at a level estimated to recover the full cost of providing goods or
services and to achieve a zero AOR (Potvin, 2007).
Using aviation depot-level maintenance as an example, the rate setting is an
incremental process which starts building from the individual work center level to the
depot-level activity and continues to build up to the depot activity group and ultimately
the Comptroller. For an aviation depot, the first estimate in computing the rate is the total
direct labor hours (DLH) needed to accomplish the projected throughput for the depot in
that fiscal year. It begins with determining the workload standard by calculating the
required DLHs to complete the work for the individual tasks that are going to be
performed and then multiplying by the number of times that those tasks will be
performed. The number of tasks and the types of tasks to be performed are calculated
through negotiations with the customer. This calculation will provide the total estimated
DLHs of work to be performed in the fiscal year (Potvin, 2007).
After calculating the DLHs, the total costs (i.e., direct, indirect, and G&A costs)
are estimated and referred to as the “cost goal.” The cost goal is then adjusted for the
AOR. If the AOR is positive, which means an accumulated profit, the AOR would be
subtracted from the cost goal. Conversely, a negative AOR would result in an addition to
the cost goal. This adjusted cost goal is divided by the estimated DLHs and equals the
initial recovery rate also known as Unit Cost Goal (Potvin, 2007).
DLHs = = Unit Cost
Goal Cost Goal ± AOR + Other Initial Recovery
Rate

19
Rates are then passed up to the depot activity group level, which oversees several
depot activities. The depot activity group may adjust one depot’s rate in order to make
up for a planned loss at another depot. This would have the effect of one depot
subsidizing another. This is appropriate as long as the NWCF as a whole is working
toward a zero AOR (Potvin, 2007).
Once established, recovery rates are held constant for the duration of the
applicable fiscal year. This protects appropriated fund customers with a “stabilized rate.”
This reduces disruptions in the customers’ budgets as well as planned NWCF workload
levels (Potvin, 2007).
E. SUMMARY
This chapter introduced the legislative foundation that established and governs
depot-level maintenance activities. Next, it discussed the aviation depot-level
maintenance organization (Fleet Readiness Centers) established as a result of BRAC
2005. This chapter explained the new organizational structure and the history of aviation
maintenance at FRC Southwest and acknowledged the financial regulations that govern
the operating policies and procedures for Navy Working Capital Fund activities. Finally,
this chapter covered the history of the Navy Working Capital Fund and the rate setting
process, which is important in understanding the factors generating the variances between
the budgeted and actual operating results. Chapter III analyzes the financial results from
FRC Southwest’s depot-level maintenance of the E-2C Hawkeye repair and overhaul
work.

20
THIS PAGE INTENTIONALLY LEFT BLANK

21
III. DATA COLLECTION AND PROCESSING
A. INTRODUCTION
This project examines the financial results of the maintenance work conducted on
the E-2C Hawkeye aircraft at FRCSW. The methods of data collection were interviews
with FRCSW employees and review of financial reports from FRCSW databases. A
variance analysis was performed that examined some of the potential causes of variance
from budgeted to actual operating results.
Since the depot’s billing rates are designed to recover the input costs, as explained
in Chapter II, it is important for the depot to be able to budget accurately for the costs it
will incur in its operations. If the budgeted expenses, which are used to generate the
billing rate, match the corresponding actual expense line item, then the depot will have
accomplished its goal of breaking even. A variance analysis displays the differences
between the budgeted and actual results.
B. DATA GATHERING
Interviews with FRCSW employees provided insight into the perceived factors
generating the differences between budgeted and actual operating results in FRCSW and
how the budgeting process worked. The most common comment by the interviewees was
that the quantity of work (number of aircraft needing work) being performed was much
different than the quantity of work planned for in the President’s budget. Additional
feedback from interviewees included comments about how the independence of FRCSW,
as a working capital fund activity, has been eroded somewhat by the Navy’s budget
process to ensure that mission funded customer activities can afford the work. An
example given was the price changes for materials. When material prices for FRCSW
increased significantly, FRCSW was only permitted to increase the price it charges to
customers at the same rate as an inflation index. The result was that FRCSW did not
recover the full cost of materials used as intended by the working capital fund design.

22
FRCSW provided historical data for fiscal years 2004 to 2007 from its
Accounting & Financial Information System (AFIS) database. These data included both
the budgeted and actual results. The data consisted of reports with period costs broken
out into six expense categories: labor expense, contract labor expense, material expense,
production overhead expense, G&A expense, and other expense. The reports also
detailed the budgeted and actual hourly expense or application rates for labor, contract
labor, production overhead, and G&A. Included in the data were the budgeted direct
labor hours and the actual direct labor hours worked. Refer to Appendix F for a
representative example of the data received from FRCSW.
Initially, it was intended to analyze data from fiscal year 2000 through fiscal year
2007; however, data were not available earlier than fiscal year 2004, the year that the
AFIS database was implemented. Although four years of data provided a trend in cost
variances, a larger sample would have provided a better representation of trends.
Detailed sales data were not available for the years prior to 2007, the year in
which a new data collection system was implemented. As a result of the lack of sales
data, there is no trend in sales variance discussed in later chapters.
C. VARIANCE ANALYSIS
To gather insight into the most influential factors on FRCSW’s net operating
result, a variance analysis was conducted on the E-2C product revenues and expenses. A
variance analysis measures the actual results against a benchmark for what was expected
to occur. The benchmark in this project is the E-2C operating results from the President’s
Budget for the given fiscal year, also referred to as the budgeted operating results.
1. Variance Analysis Definition
An organization’s budget is its plan of action, expressed in dollars, for a given
period of time. Any difference between this benchmark and the actual results is a
variance. A variance can be the result of numerous factors including: changes in
operational quantity of work, the price of inputs, or operating efficiencies. This project
conducts revenue and cost variance analyses.

23
Revenue or sales variances are typically computed for changes in sales price,
sales quantity, and sales mix (Horngren, Foster, & Datar, 1994). Cost or expense
variances are typically computed for both the price and quantity elements of items such
as direct labor expense, direct materials expense, and overhead expense (Garrison,
Noreen, & Brewer, 2006). The titles of the variances can vary depending on which
variable is being examined. A price variance for labor is often referred to as a “labor rate
variance” and a price variance for overhead is often referred to as an “overhead spending
variance” (Garrison et al., 2006). For the purposes of this project, labor price variance
will be referred to as “labor rate variance,” production overhead will be referred to as
“production overhead spending variance,” and G&A will be referred to as “G&A
spending variance.”
Additionally, a quantity variance is often referred to as an “efficiency variance” or
“quantity variance” (Garrison et al., 2006). For the purposes of this study, “labor
quantity variance” will be referred to as “labor quantity variance;” production overhead
will be referred to as “production overhead quantity variance,” and G&A “quantity
variance” will be referred to as “G&A quantity variance.”
2. Variance Analysis Process
A variance analysis was conducted comparing the total budgeted sales and
expenses by line item to the total actual sales and expenses by line item to get a sense of
the overall variance picture. The amounts for 2007 are shown in Table 1.
Sales figures for FRCSW consist of direct labor hours and direct material sold to
customers. The direct labor hours were broken down into sales quantity (total number of
direct labor hours), sales mix (types of work), and sales price (stabilized rate). Since
direct material sales are intended to reimburse FRCSW for the cost of materials used and
quantity/mix data were not available, direct material sales were compared with direct
material expenses.

24
Table 1. FRCSW, E-2C, Variances by Line Item
2007 Budget Actual Variance Sales
Labor $ 4,858,275 $ 8,783,594 $ 3,925,318 Material $ 7,348,653 $ 14,082,916 $ 6,734,264
Total Sales $ 12,206,928 $ 22,866,510 $ 10,659,582 Expenses
Material $ 7,202,189 $ 17,773,366 $ (10,571,177) Labor $ 1,791,437 $ 3,659,228 $ (1,867,791) Contractor $ 266,379 $ 321,545 $ (55,166) POH $ 2,152,877 $ 4,338,311 $ (2,185,434) G&A $ 942,574 $ 1,586,596 $ (644,022) Other $ - $ 205,931 $ (205,931)
Total Expenses $ 12,355,456 $ 27,884,977 $ (15,529,521) Net Income/(Loss) $ (148,528) $ (5,018,467) $ (4,869,939)
All expense variances are broken down into their respective spending and
quantity components. The formula approach was used in completing the variance
analysis for civilian labor, contract labor, production overhead, and G&A expenses. A
formula approach isolates individual variables that cause variances within an organization
by utilizing mathematical equations. A different equation is used for each variable.
Further analysis was not performed on the other-expense category because there was not
a budget for other expenses. The discussion of the detailed variance analysis for revenue
and the expenses (i.e., direct material, civilian labor, contract labor, production overhead,
and G&A) follow.
a. Labor Sales Variance
Labor sales variances were broken down and attributed to three factors:
labor sales quantity, labor sales mix, and labor sales price. A different formula was used
to calculate each of these variances.
1) Labor Sales Quantity Variance: The labor sales quantity
variance can be attributed to deviations in the total amount of sales from the budgeted

25
average hourly wages (budget average rate) paid for direct labor government workers.
The formula used to accomplish the analysis can be expressed as follows:
The actual labor quantity is the number of direct labor hours that
FRCSW billed customers for the work performed. The budget labor quantity is the
projected number of direct labor hours for sale. The budget average labor rate is the
stabilized rate used in the budget to calculate the sales dollars for labor billed. The
results of the calculations are presented in Table 2. Table 2 shows the labor sales
quantity variance, labor sales mix variance, and labor sales rate variance. The sum of the
three variances is the total variance for sales.
A negative or unfavorable labor sales quantity variance indicates
that the quantity of sales, as measured in hours, was lower than anticipated in the budget.
Conversely, a positive or favorable labor sales quantity variance indicates that the sales
quantity, as measured in hours, was higher than anticipated in the budget.
2) Labor Sales Rate Variance: The labor sales rate variance
can be attributed to changes in the sales price charged to customers. The formula used to
accomplish the analysis can be expressed as follows:
The actual rate is the stabilized rate, or recovery rate used for
actual sales. The budget rate is the stabilized rate used in the budget formulation for
sales. Actual quantity of work consists of the work that was started in the previous fiscal
year (carry-in) and work started in the current fiscal year (current year). An additional
calculation is required because the carry-in and current year work are sold at different
rates. The results of the calculations are depicted in Table 2.
Labor Sales Quantity Variance = (AQ – BQ) x BAR AQ = Actual Quantity BQ = Budget Quantity BAR = Budget Average Rate
Labor Sales Rate Variance = AQ x (AR – BR) AR = Actual Rate BR = Budget Rate
26
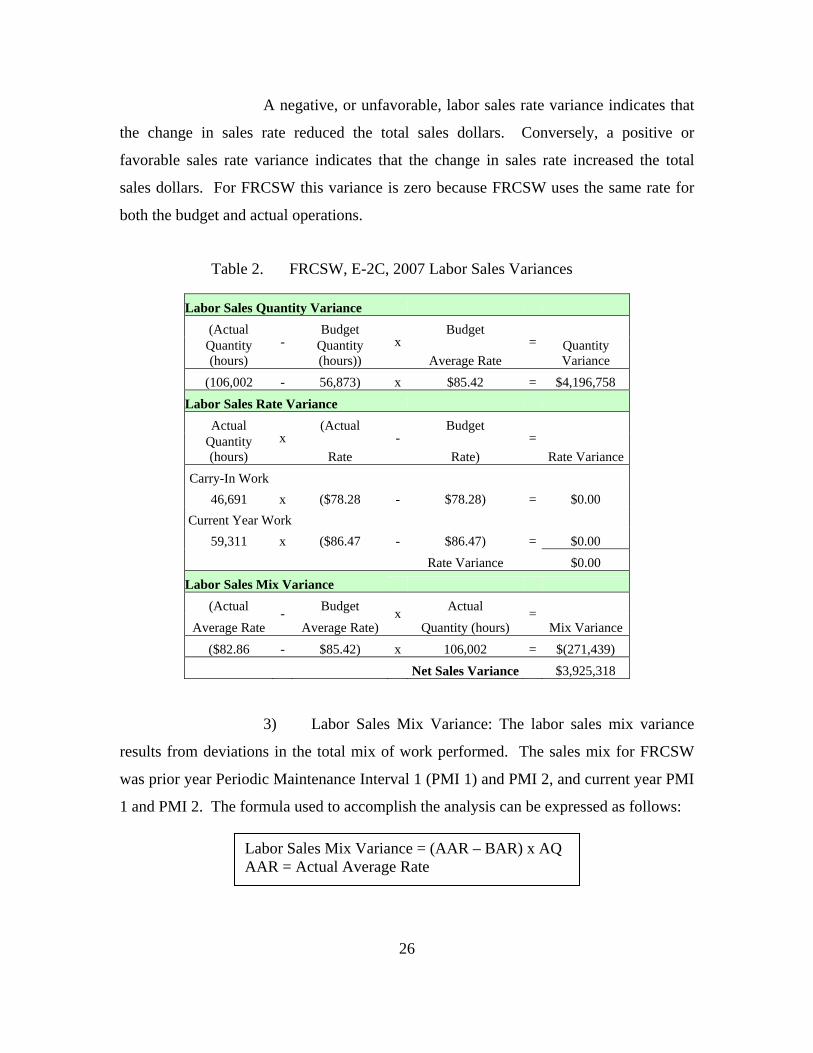
A negative, or unfavorable, labor sales rate variance indicates that
the change in sales rate reduced the total sales dollars. Conversely, a positive or
favorable sales rate variance indicates that the change in sales rate increased the total
sales dollars. For FRCSW this variance is zero because FRCSW uses the same rate for
both the budget and actual operations.
Table 2. FRCSW, E-2C, 2007 Labor Sales Variances
Labor Sales Quantity Variance (Actual Budget Budget Quantity (hours)
- Quantity (hours))
xAverage Rate
= Quantity Variance
(106,002 - 56,873) x $85.42 = $4,196,758 Labor Sales Rate Variance
Actual (Actual Budget Quantity (hours)
x Rate
- Rate)
=Rate Variance
Carry-In Work 46,691 x ($78.28 - $78.28) = $0.00
Current Year Work 59,311 x ($86.47 - $86.47) = $0.00
Rate Variance $0.00 Labor Sales Mix Variance
(Actual Budget Actual Average Rate
- Average Rate)
xQuantity (hours)
=Mix Variance
($82.86 - $85.42) x 106,002 = $(271,439) Net Sales Variance $3,925,318
3) Labor Sales Mix Variance: The labor sales mix variance
results from deviations in the total mix of work performed. The sales mix for FRCSW
was prior year Periodic Maintenance Interval 1 (PMI 1) and PMI 2, and current year PMI
1 and PMI 2. The formula used to accomplish the analysis can be expressed as follows:
Labor Sales Mix Variance = (AAR – BAR) x AQ AAR = Actual Average Rate

27
The actual average rate is the actual average stabilized rate used
for sales. The results of the calculations are depicted in Table 2.
A negative, or unfavorable, labor sales mix variance indicates that
the change in sales mix reduced the total sales dollars. Conversely, a positive or
favorable sales mix variance indicates that the change in sales mix increased the total
sales dollars.
b. Material Sales and Expense Variance
Direct material sales are intended to reimburse FRCSW for the cost of
direct materials utilized in performing work on aircraft. If FRCSW were to bill
customers for all direct material costs incurred, then net income from direct material
would be zero. However, FRCSW charges a fixed price for E-2C materials. This price is
an estimate of what the material should cost FRCSW. A variance between the actual and
estimated cost could have a positive or negative effect on operating results depending on
which direction the cost changed, while a variance in quantity of work should have a zero
net effect on FRCSW’s operating results due to material.
Budgeted and actual direct material sales were compared to determine the
net change in the effect on the overall operating results (Table 3). Fiscal year 2007 is the
only year analyzed as sufficient data were not available for previous years. A variance
was also calculated for budgeted to actual direct material sales and budgeted to actual
direct material expense. Variances for material sales and expenses reflect changes due to
both price and amount of direct materials used. A net loss for direct materials indicates
that FRCSW was not able to bill customers for all the direct material costs incurred.
Table 3. FRCSW, E-2C, 2007 Material Sales Variances
Budget Actual Variance Direct Material Sales $7,348,653 $14,082,916 $ 6,734,264 Direct Material Costs $7,202,189 $17,773,366 $(10,571,177)
Net Income/(Loss) $ 146,464 $(3,690,450) $ 3,836,913

28
c. Civilian Labor Expense Variance
The labor expense variance consists of variances due to labor rates and
labor quantity. The sum of the two variances is the total variance for labor expense. The
labor rate variance results from deviations from the budgeted average hourly wages paid
for direct labor government workers. The formula used to accomplish the analysis can be
expressed as follows:
The budget rate is the average hourly wage to be paid for each hour of
direct labor work. FRCSW refers to the average hourly rate as the composite rate. The
actual rate is the average hourly wage paid to direct labor workers by FRCSW. The
actual hours are the actual direct labor hours of work performed on E-2C aircraft. The
results of the calculations are depicted in Table 4. Table 4 is broken out by fiscal year
and shows the labor rate variance for each fiscal year.
A negative, or unfavorable, labor rate variance indicates that the actual
average hourly wage increased from the amount anticipated in the budget. Conversely a
positive, or favorable, labor rate variance indicates that the average hourly wage paid for
direct labor was lower than anticipated in the budget.
Table 4. FRCSW, E-2C, Civilian Labor Rate Variance
2004 2005
(Budget Actual Actual (Budget Actual Actual
Rate - Rate) x Hours = Variance Rate - Rate) x Hours = Variance
($34.37 - $34.48) x 97,555 = $(10,731) ($33.21 - $35.80) x 95,422 = $(247,143)
2006 2007
(Budget Actual Actual (Budget Actual Actual
Rate - Rate) x Hours = Variance Rate - Rate) x Hours = Variance
($34.55 - $36.95) x 119,527 = $(286,865) ($36.68 - $38.11) x 96,022 = $(137,311)
Labor rate variance = (BR – AR) x AH BR = Budget Rate AR = Actual Rate AH = Actual Hours

29
The labor quantity variance results from changes in the workload quantity
from the budget numbers. The workload quantity in this case is measured by direct labor
hours. The formula used to accomplish the analysis can be expressed as follows:
The budget hours are the number of direct labor hours of work to be
performed on E-2C aircraft anticipated in the budget. The effect of the variance from
budget hours to actual hours is depicted in Table 5. Table 5 is broken out by fiscal year
and shows the labor quantity variance for each fiscal year.
Table 5. FRCSW, E-2C, Civilian Labor Quantity Variance
2004 2005
(Budget Actual Budget (Budget Actual Budget
Hours - Hours) x Rate = Variance Hours - Hours) x Rate = Variance
(122,622 - 97,555) x $34.37 = $861,553 (175,500 - 95,422) x $33.21 = $2,659,390
2006 2007
(Budget Actual Budget (Budget Actual Budget
Hours - Hours) x Rate = Variance Hours - Hours) x Rate = Variance
(158,495 - 119,527) x $34.55 = $1,346,344 (48,834 - 96,022) x $36.68 = $(1,730,856)
A negative, or unfavorable, labor quantity variance, as seen in 2007,
reflects the increase from budgeted labor expense due to an increase in workload quantity
as measured by direct labor hours. Conversely a positive, or favorable, labor quantity
variance as seen in 2004 through 2006 reflects the decrease from budgeted labor expense
due to a decrease in workload quantity as measured by direct labor hours.
d. Contract Labor Expense Variance
The contract labor expense variance results from variances in the contract
labor rate and variances in the workload quantity performed by contract laborers. The
Labor quantity variance = (BH – AH) x BR BH = Budget Hours AH = Actual Hours BR = Budget Rate

30
sum of the two variances is the total variance for contract labor expense. The contract
labor rate variance results from deviations from the budgeted average hourly rates paid to
the contractor. The formula used to accomplish the analysis can be expressed as follows:
The budget rate is the average hourly price to be paid to the contractor for
each hour of contract labor work. The actual rate is the average hourly price paid to the
contractor by FRCSW. The actual hours are the actual number of contract labor hours
work performed on E-2C aircraft. The results of the calculations are depicted in Table 6.
Table 6 is broken out by fiscal year and shows the contract labor rate variance for each
fiscal year.
Table 6. FRCSW, E-2C, Contract Labor Rate Variance
2004 2005
(Budget Actual Actual (Budget Actual Actual
Rate - Rate) x Hours = Variance Rate - Rate) x Hours = Variance
($32.44 - $35.47) x 17,126 = $(51,973) ($24.51 - $41.86) x 15,516 = $(269,200)
2006 2007
(Budget Actual Actual (Budget Actual Actual
Rate - Rate) x Hours = Variance Rate - Rate) x Hours = Variance
($53.44 - $44.57) x 16,927 = $150,104 ($33.14 - $32.22) x 9,980 = $9,151
A negative, or unfavorable, contractor labor rate variance means that the
actual average hourly contract labor rate has increased from what had been anticipated in
the budget. Conversely a positive, or favorable, contractor labor rate variance means that
the average hourly contract rate paid for contract labor was lower than anticipated in the
budget.
Contract labor rate variance = (BR – AR) x AH BR = Budget Rate AR = Actual Rate AH = Actual Hours

31
The contract labor quantity variance can be attributed to changes in the
workload quantity from the budget amount. The workload quantity in this case is
measured by contract labor hours. The formula used to accomplish the analysis can be
expressed as follows:
The budget hours are the contract labor hours to be performed on E-2C
aircraft anticipated in the budget. In the case of FRCSW, the effects of the changes from
budget hours to actual hours are depicted in Table 7.
Table 7. FRCSW, E-2C, Contract Labor Quantity Variance
2004 2005 (Budget Actual Budget (Budget Actual Budget Hours - Hours) x Rate = Variance Hours - Hours) x Rate = Variance
(31,709 - 17,126) x $32.44 = $473,073 (34,454 - 15,516) x $24.51 = $464,170 2006 2007
(Budget Actual Budget (Budget Actual Budget Hours - Hours) x Rate = Variance Hours - Hours) x Rate = Variance
(14,608 - 16,927) x $53.44 = $(123,927) (8,039 - 9,980) x $33.14 = $(64,317)
A negative, or unfavorable, contractor labor quantity variance, as seen in
2006 and 2007, reflects the increase from budgeted contract labor expense due to an
increase in workload quantity as measured by contract labor hours. Conversely a
positive, or favorable, contractor labor quantity variance as seen in 2004 and 2005
reflects the decrease from budgeted contract labor expense due to a decrease in workload
quantity as measured by contract labor hours.
Contract labor quantity variance = (BH – AH) x BR BH = Budget Hours AH = Actual Hours BR = Budget Rate

32
e. Production Overhead Expense Variance
The production overhead expense variance results from the production
overhead spending variance and the total workload quantity variance. The sum of the
two variances is the total variance for the production overhead expense.
The production overhead spending variance is attributed to deviations
from the budgeted production overhead prices paid for items such as indirect labor,
indirect materials, and facilities expenses. The formula used to accomplish the analysis
can be expressed as follows:
The budget rate is the amount of production overhead expenses to be
applied for each hour of direct labor work, whether performed by government civilian or
contractor labor. The actual rate is the amount of production overhead expense actually
applied, plus or minus the over or under applied costs for each direct labor hour of work
performed by FRCSW. The actual hours are the actual number of direct labor hours of
work performed on E-2C aircraft. The results of the calculations are depicted in Table 8.
Table 8 is broken out by fiscal year and shows the production overhead spending
variance for each fiscal year.
Table 8. FRCSW, E-2C, Production Overhead Spending Variance
2004 2005 (Budget Actual Actual (Budget Actual Actual
Rate - Rate) x Hours = Variance Rate - Rate) x Hours = Variance ($32.04 - $33.19) x 114,681 = $(131,883) ($33.22 - $34.03) x 110,938 = $(89,860)
2006 2007 (Budget Actual Actual (Budget Actual Actual
Rate - Rate) x Hours = Variance Rate - Rate) x Hours = Variance ($39.09 - $37.92) x 136,454 = $159,651 ($37.85 - $40.93) x 106,002 = $(326,486)
Production overhead spending variance = (BR – AR) x AH BR = Budget Rate AR = Actual Rate AH = Actual Hours

33
A negative, or unfavorable, production overhead spending variance means
that the average price of production overhead expenses has increased from what had been
anticipated in the budget. Conversely a positive, or favorable, production overhead
spending variance means that the average price of production overhead expenses was
lower than anticipated in the budget.
The production overhead quantity variance results from changes in the
workload quantity from the budget amount. The workload quantity in this case is
measured by direct labor hours (contract and government civilian employees). The
formula used to accomplish the analysis can be expressed as follows:
The budget hours are the direct labor hours to be performed on E-2C
aircraft anticipated in the budget. In the case of FRCSW, the effects of the changes from
budget hours to actual hours are depicted in Table 9. Table 9 is broken out by fiscal year
and shows the production overhead quantity variance for each fiscal year.
Table 9. FRCSW, E-2C, Production Overhead Quantity Variance
2004 2005 (Budget Actual Budget (Budget Actual Budget Hours - Hours) x Rate = Variance Hours - Hours) x Rate = Variance
(154,331 - 114,681) x $32.04 = $1,270,386 (209,954 - 110,938) x $33.91 = $3,357,6332006 2007
(Budget Actual Budget (Budget Actual Budget Hours - Hours) x Rate = Variance Hours - Hours) x Rate = Variance
(158,495 - 136,454) x $39.09 = $861,583 (56,873 - 106,002) x $37.85 = $(1,859,533)
A negative, or unfavorable, production overhead quantity variance, as seen
in 2007, reflects the increase from budgeted applied production overhead expense due to
an increase in workload quantity as measured by direct labor hours. Conversely a
positive, or favorable, production overhead quantity variance, as seen in 2004 through
Production overhead quantity variance = (BH – AH) x BR BH = Budget Hours AH = Actual Hours BR = Budget Rate

34
2006, reflects the decrease from budgeted applied production overhead expense due to a
decrease in workload quantity as measured by direct labor hours.
f. General & Administrative Expense Variance
The G&A expense variance results from variances in G&A spending and
workload quantity. The sum of the two variances is the total variance for G&A expense.
The G&A spending variance results from deviations from the budgeted
G&A prices paid for items such as executive staff costs and support expenses. The
formula used to accomplish the analysis can be expressed as follows:
The budget rate is the amount of G&A expense that will be applied for
each hour of direct labor work. The actual rate is the amount of G&A expense actually
applied, plus or minus the over or under applied costs for each direct labor hour of work
performed by FRCSW. The actual hours are the actual number of direct labor hours of
work performed on E-2C aircraft. The results of the calculations are depicted in Table
10. Table 10 is broken out by fiscal year and shows the G&A spending variance for each
fiscal year.
A negative, or unfavorable, G&A spending variance means that the
average price of G&A expenses has increased from what had been anticipated in the
budget. Conversely a positive, or favorable, G&A spending variance means that the
average price of G&A expenses was lower than anticipated in the budget.
G&A spending variance = (BR – AR) x AH BR = Budget Rate AR = Actual Rate AH = Actual Hours

35
Table 10. FRCSW, E-2C, General and Administrative Spending Variance
2004 2005 (Budget Actual Actual (Budget Actual Actual
Rate - Rate) x Hours = Variance Rate - Rate) x Hours = Variance ($12.90 - $9.07) x 114,681 = $439,228 ($12.47 - $14.23) x 110,938 = $(195,251)
2006 2007 (Budget Actual Actual (Budget Actual Actual
Rate - Rate) x Hours = Variance Rate - Rate) x Hours = Variance ($13.61 - $12.72) x 136,454 = $121,444 ($16.57 - $14.97) x 106,002 = $169,603
The G&A quantity variance results from changes in the workload quantity
from the budgeted numbers. The workload quantity in this case is measured by direct
labor hours (contract and government employees). The formula used to accomplish the
analysis can be expressed as follows:
The budget hours are the direct labor hours to be performed on E-2C
aircraft anticipated in the budget. In the case of FRCSW, the effects of the changes from
budget hours to actual hours are depicted in Table 11. Table 11 is broken out by fiscal
year and shows the G&A quantity variance for each fiscal year.
Table 11. FRCSW, E-2C, General and Administrative Quantity Variance
2004 2005 (Budget Actual Budget (Budget Actual Budget Hours - Hours) x Rate = Variance Hours - Hours) x Rate = Variance
(154,331 - 114,681) x $12.90 = $511,485 (209,954 - 110,938) x $12.47 = $1,234,7302006 2007
(Budget Actual Budget (Budget Actual Budget Hours - Hours) x Rate = Variance Hours - Hours) x Rate = Variance
(158,495 - 136,454) x $13.61 = $299,978 (56,873 - 106,002) x $16.57 = $(814,068)
A negative, or unfavorable, G&A quantity variance, as seen in 2007,
reflects the increase from budgeted applied G&A expense due to an increase in workload
G&A quantity variance = (BH – AH) x BR BH = Budget Hours AH = Actual Hours BR = Budget Rate

36
quantity as measured by direct labor hours. Conversely a positive, or favorable, G&A
quantity variance, as seen in 2004 through 2006, reflects the decrease from budgeted
applied G&A expense due to a decrease in workload quantity as measured by direct labor
hours.
D. SUMMARY
This project began with collecting the cost and revenue data, then computing and
analyzing the variances, and finally providing areas for management to ask questions to
gain a better understanding of the origins of the variances. This chapter defined variance
analysis and discussed how the data for this analysis were collected. It then provided a
walkthrough of the steps taken to conduct the variance analysis of the financial results
from FRCSW’s depot-level maintenance of the E-2C Hawkeye repair and overhaul work.
Chapter IV summarizes the results of this analysis.

37
IV. FINDINGS AND ANALYSIS
A. INTRODUCTION
This chapter interprets the results of the analysis described in Chapter III. The
results are discussed in terms of labor sales variance, material sales variance, material
expense variance, rate and spending variances, and quantity variances. For a profit
oriented enterprise, a positive variance is favorable and a negative variance is
unfavorable. However, since the goal of a working capital fund enterprise is to achieve a
net zero operating result, both a positive or negative variance could both be interpreted as
bad, since the goal is to achieve a zero variance.
B. RESULTS OF VARIANCE ANALYSIS
1. Labor Sales Variance
The results of the analysis of the 2007 labor sales variance are presented below in
Table 12. With only one year’s worth of analysis, a trend for the labor sales variance
cannot be determined. The major cause of the labor sales variance was a result of the
positive $4.2 million sales quantity variance. Sales rate, or stabilized rate, is not a factor
in the total labor sales variance because the actual and budgeted sales rates are the same.
The sales mix provided a negative variance. However, the negative sales mix variance is
considered relatively insignificant when compared to the much larger positive sales
quantity variance. To summarize, the overwhelming cause of the variance in labor sales
indicates that the amount of actual work performed, as measured in direct labor hours,
was significantly higher than anticipated in the budget.

38
Table 12. FRCSW, E-2C, 2007 Labor Sales Variances
Variances Percent Budget Sales Sales Quantity $4,196,758 34% Sales Rate $0.00 0% Sales Mix ($271,439) 2%
Total Sales $3,925,318 32%
2. Material Sales Variance
The results of the FY 2007 material sales variance analysis are presented below in
Table 13. With only one year’s worth of analysis a trend in material sales variances
cannot be determined. There are two results of note from this analysis: the value of the
actual net income/(loss), and the budget to actual direct material sales variance.
The result of a $3.7 million loss in net income indicates that FRCSW did not get
reimbursed for all of the material costs incurred during FY 2007. Without additional
analysis it is not possible to determine if this is due to changes in the cost, quantity, or
mix of material.
Also, the actual material sales were approximately twice the amount anticipated in
the budget. While this analysis is not detailed enough to determine the causal factors,
some possibilities include changes in material prices, types of material purchased, or the
quantity of material used.
Table 13. FRCSW, E-2C, 2007 Material Sales Variances
Budget
Actual
Variance Percent Budget
Direct Material Sales $7,348,653 $14,082,916 $6,734,264 92% Direct Material Costs $7,202,189 $17,773,366 ($10,571,177) 147%
Net Income/(Loss) $146,464 ($3,690,450) ($3,836,913)
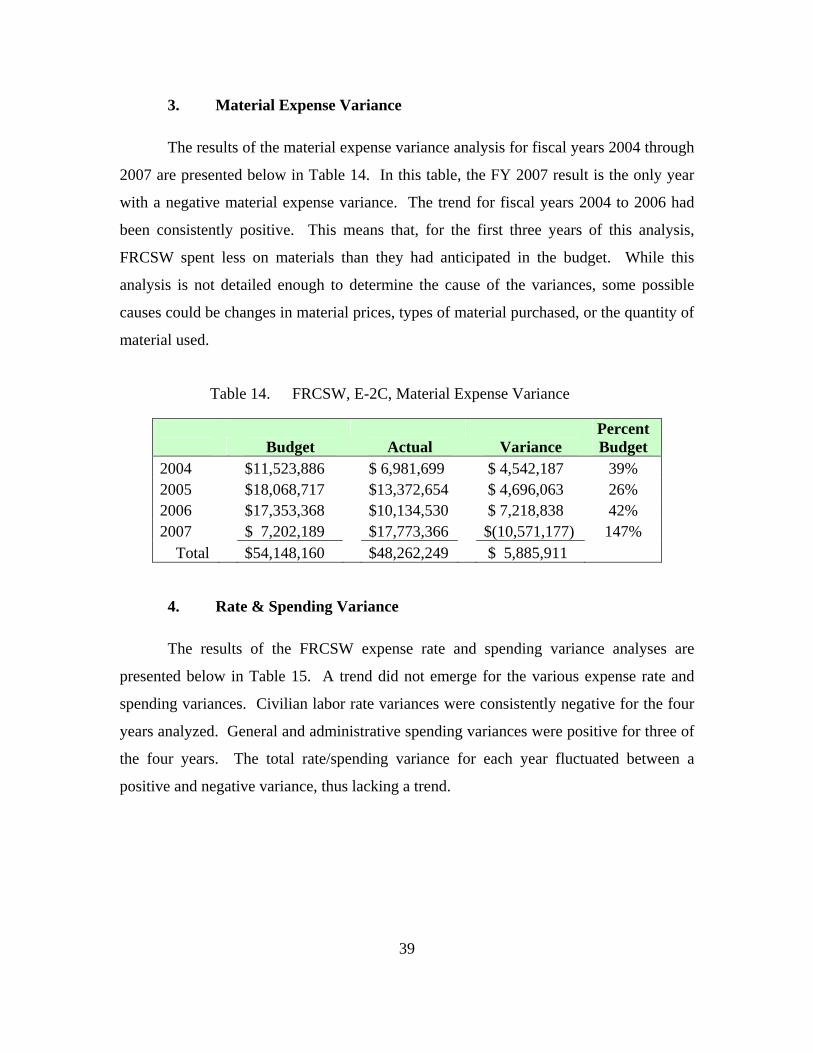
39
3. Material Expense Variance
The results of the material expense variance analysis for fiscal years 2004 through
2007 are presented below in Table 14. In this table, the FY 2007 result is the only year
with a negative material expense variance. The trend for fiscal years 2004 to 2006 had
been consistently positive. This means that, for the first three years of this analysis,
FRCSW spent less on materials than they had anticipated in the budget. While this
analysis is not detailed enough to determine the cause of the variances, some possible
causes could be changes in material prices, types of material purchased, or the quantity of
material used.
Table 14. FRCSW, E-2C, Material Expense Variance
Budget
Actual
Variance Percent Budget
2004 $11,523,886 $ 6,981,699 $ 4,542,187 39% 2005 $18,068,717 $13,372,654 $ 4,696,063 26% 2006 $17,353,368 $10,134,530 $ 7,218,838 42% 2007 $ 7,202,189 $17,773,366 $(10,571,177) 147%
Total $54,148,160 $48,262,249 $ 5,885,911
4. Rate & Spending Variance
The results of the FRCSW expense rate and spending variance analyses are
presented below in Table 15. A trend did not emerge for the various expense rate and
spending variances. Civilian labor rate variances were consistently negative for the four
years analyzed. General and administrative spending variances were positive for three of
the four years. The total rate/spending variance for each year fluctuated between a
positive and negative variance, thus lacking a trend.

40
Table 15. FRCSW, E-2C, Expense Rate & Spending Variance
2004 Percent Budget
2005
Percent Budget
2006
Percent Budget
2007
Percent Budget
Civilian Labor $(10,731) 0.3% $(247,143) 4% $(286,865) 5% $(137,311) 8% Contract Labor $(51,973) 5% $(269,200) 32% $150,104 20% $ 9,151 3% POH $(131,883) 3% $ (89,860) 1% $159,651 3% $(326,486) 15% G&A $439,228 22% $(195,251) 7% $121,444 6% $169,603 18%
Total $244,641 2% $(801,454) 5% $144,334 1% $(285,044) 6%
5. Quantity Variance
The results of the FRCSW expense quantity variance analysis are presented below
in Table 16. From 2004 through 2006, the trend had been positive total expense quantity
variances. Additionally, in those same years, except for the contract labor quantity
variance, the analysis of the individual line items resulted in positive quantity variances.
However, while the variances were positive, they fluctuated considerably. This indicates
that while there has been great fluctuation in the amount of work planned versus actually
performed, as measured by direct labor hours, the budget for FRCSW had consistently
anticipated a higher quantity of work than what was actually performed in 2004 through
2006.
Table 16. FRCSW, E-2C, Expense Quantity Variance
2004
Percent Budget
2005
Percent Budget
2006
Percent Budget
2007
Percent Budget
Civilian Labor $ 861,553 20% $2,659,390 46% $1,346,344 25% $(1,730,856) 97% Contract Labor $ 473,073 46% $ 464,170 55% $(123,927) 16% $ (64,317) 24% POH $1,270,386 26% $3,357,633 48% $ 861,583 14% $(1,859,533) 86% G&A $ 511,485 26% $1,234,730 47% $ 299,978 14% $ (814,068) 86%
Total $3,116,496 26% $7,715,923 47% $2,383,978 16% $(4,468,773) 87%
C. SUMMARY
The results of the variance analysis have been described throughout this chapter.
The analysis results were grouped into labor sales variance, material sales variance,
material expense variance, rate and spending variances, and expense quantity variances.

41
The findings from the variance analyses indicate that factors creating the most significant
impact to the FRCSW’s operating results are material sales net loss, materials expense
variance, and the quantity variances. Chapter V will address what these results mean and
what the takeaways from this project may be.

42
THIS PAGE INTENTIONALLY LEFT BLANK
43
V. CONCLUSION AND RECOMMENDATIONS
A. INTRODUCTION
The operations of defense working capital fund activities, as discussed here with
FRCSW, are affected by myriad factors both internally and externally. FRCSW, as a
NWCF, works within the confines of the Planning Programming Budgeting and
Execution System (PPBES) cycle and is subsequently influenced by the competition for
scarce resources. The extent to which its customers have had to compete for scarce
resources has eroded much of the intended customer-provider relationship proposed by
the formation of DWCFs. This is evidenced by the feedback from interviewees regarding
the material price changes during the budget submission and rate setting process.
The primary purpose of this research was to determine what factors were having
the greatest impact on the financial operating results of FRCSW, creating significant
fluctuations in the year to year results.
The Navy and FRCSW managers have limited time and resources. Knowing
where they can focus efforts to get the highest return on their process improvement
efforts will enable the best possible return on investment of time and resources.
B. PRIMARY QUESTION
1. What are Factors Affecting the Operating Results at FRCSW?
The results of the variance analysis summarized in Chapter IV show that the
factors affecting the operating results the most were the material sales variances, material
expense variances, and the variances due to quantity of work.
Since 2007 was the only year that a full variance analysis (sales and expense) was
conducted, 2007 will be explained by itself. The material sales variance analysis
supports the feedback provided by interviewees that FRCSW has not been able to recoup
the cost of material used through material sales. As can be derived from the data in
44
Chapter IV Table 13, the actual loss from this lack of recoupment is roughly 21 percent
of the total cost of materials. Although important, identifying the cause of this lack of
recoupment was beyond the scope of this project.
The comparison of budget and actual sales shows that the material sales variance
accounted for over 63 percent of the total sales variance for 2007 (Chapter III Table 1)
and was the largest contributor to the favorable sales variance. In 2007, the factor
providing the largest contribution to the unfavorable variance in expenses was material
expenses. The $10.6 million in material expense variance accounted for over 68 percent
of the total expense variance.
The workload quantity was the most significant underlying factor for labor sales
in 2007 and labor expenses in 2004 through 2006. This indicates that the Navy budgeting
process is having difficulty estimating the number of E-2C aircraft requiring work to be
conducted by FRCSW. The number of aircraft FRCSW was authorized to budget for has
been greater or less than what they actually inducted.
In 2002, Major Scott Griffith completed a NPS thesis titled, “An analysis of the
factors affecting the Net Operating Results at Naval Aviation Depot Cherry Point, North
Carolina.” His thesis included a variance analysis of labor expense, production overhead
expense, and G&A expense for two aircraft models and two engine types for three fiscal
years. His conclusions indicated that the unfavorable efficiency variance, called quantity
variance in this project, could have been caused by the workload standards being
consistently underestimated. Major Griffith’s findings seem in-line with the findings
here that quantity of work has a significant affect on aviation depot-level maintenance
activity’s operating results (Griffith, 2002).
C. SECONDARY QUESTIONS
1. Is the Current Model Accurate at Predicting Workload Quantity?
In 2004-2007, the quantity variances as a percent of the budgeted costs (less
material) was 25.6 percent, 47.5 percent, 16.3 percent and 86.7 percent, respectively, for

45
each year. This analysis indicates that the budget, or benchmark, for workload was not
accurate and caused large variations in the operating results.
Although this project did not break down material variances in as much detail as
the other expense items, the material expense variance may also be due to inaccurate
predictions of the workload quantity. Unfortunately, the data supporting this analysis of
material expenses were not detailed enough to indicate the cause of material variances
presented in this project. However, since the material expense variances fluctuate
positively and negatively in the same years as the quantity variances for the other
expenses (civilian labor, contract labor, G&A, and POH; see Table 14 and Table 16) it is
reasonable to assume that there is a correlation between the workload quantity and
material expense. Therefore, the workload quantity would likely be the most significant
contributor to material sales and expense variances.
2. Is the Current Model Accurate at Predicting the Labor Rates?
This analysis indicates that FRCSW was reasonably accurate at predicting the
civilian and contractor labor rates for FY 2004-2007. The labor rate variance for each
year was 0.51 percent, 3.2 percent, 0.94 percent, and 2.5 percent of the total budgeted
costs (less material) for each year, respectively.
3. Is the Current Model Accurate at Predicting Overhead and G&A Rates?
Production Overhead and G&A rates were also reasonably accurately predicted.
The POH and G&A rate variances were 2.5 percent, 1.8 percent, 1.9 percent, and 3.0
percent of the total budgeted costs (less material) for each year, respectively.
4. Where Should the Office of Budget (FMB), Commander FRCs (COMFRC), and FRCSW Invest Resources to Reduce the Size of Variances?
This analysis indicated that the budget to actual material variances were
extremely large but not sufficiently analyzed in this project to provide an understanding
of possible underlying causes. A focused analysis of the causes of material variances is

46
recommended. Since this project indicates that FRCSW has been unable to fully recover
the cost of materials, as designed in the NWCF process, it would be beneficial to
determine why this is happening.
This analysis reinforced the feedback from interviewees that the quantity of work
had a strong influence over the operating results for the E-2C program. It may be
beneficial to develop a system to more accurately predict the quantity of work that
FRCSW will be required to perform.
D. RECOMMENDATIONS FOR FURTHER RESEARCH
This project only scratched the surface of managerial accounting analysis to help
FRCSW and subsequently the Navy Working Capital Fund uncover the factors affecting
the operating results for aircraft depot-level maintenance activities. Based upon the
issues and results revealed in this project, the following are some recommendations
offered to provide additional insight into causal factors of variances in the operating
results for FRCSW.
1. Since there was only one year of complete data, FY 2007, to conduct a
variance analysis, it may be beneficial to conduct a sales variance analysis
on at least several more years of data to determine if any trends in sales
results exist.
2. A focused analysis should be conducted on material variances for all
type/model/series aircraft. This analysis indicated that the largest line
item that affected the operating results of FRCSW was material.
3. Develop a method to more accurately predict material costs and recover
material costs from the customers.
4. Analyze whether other state or federal revolving fund activities operate
better without losing independence during the customer’s budget
processes.

47
E. CONCLUSION
Depot-level maintenance activities provide an invaluable service to the fleet and
the warfighter. However, operating a working capital fund activity within the construct
of the Navy’s PPBE system presents many challenges and difficulties in the financial
operating results. For FRCSW, it appears that the factors affecting these operating results
are: accurately forecasting the material to budget for, reimbursement for the material that
was used, and accurately predicting the quantity of work that will be performed.
Focusing on the aforementioned factors may prevent the need for drastic fluctuations in
recovery rates and provide smoother budgeting evolutions. Since the other two depot-
level maintenance activities operate in similar environments to the depot-level
maintenance activity at FRCSW, this type of analysis could be beneficial to the other
facilities as well.

48
THIS PAGE INTENTIONALLY LEFT BLANK

49
APPENDIX A. UNITED STATES CODE TITLE 10 HIGHLIGHTS
US Code Title 10 – Armed Forces
Subtitle A - General Military Law
Part IV – Service, Supply and Procurement
Chapter 148 – National Defense Technology and Industrial Base,
Defense Reinvestment and Defense Conversion
Subchapter II – Policies and Planning
Section 2501 - National security objectives concerning national technology and
industrial base
This section ensures that “the national technology and industrial base be capable
of…” “…supplying and equipping the force structure of the armed forces…,” “sustaining
production, maintenance, repair and logistics for military operations…,” and provides
“…for the development, manufacture, and supply of items and technologies critical to the
production and sustainment of advanced weapons systems within the national technology
and industrial base” (Title 10). This section establishes the need and sets into law the
requirement for industrial type activities, like aviation depot-level maintenance, in
support of meeting U.S. national security objectives.
Chapter 146 - Contracting for Performance of Civilian
Commercial or Industrial Type Functions
Section 2460 - Definition of depot-level maintenance and repair
Defines depot-level repair as “material maintenance or repair requiring the
overhaul, upgrading, or rebuilding of parts, assemblies, or subassemblies, and the testing
and reclamation of equipment as necessary, regardless of the source of funds for the
maintenance or repair or location at which the maintenance or repair is performed.” This
also includes software maintenance and contractor support. This section does not
authorize the procurement or major modifications that improve the weapons system’s

50
performance or procurement for safety modifications (Title 10). This section defines the
scope of work that depot-level maintenance activities are authorized to perform.
Section 2461 – Commercial or industrial type functions: required studies and reports
before conversion to contracting performance and 2461a – Development of system for
monitoring cost savings resulting from workforce reductions
2641 Establishes the required studies and reports that need to be completed prior
to converting to a civilian contractor labor force in industrial type activities. Section
2461a establishes the requirement to monitor the workforce conversion for cost savings
(Title 10).
Section 2462- Contracting for certain supplies and services required when cost is lower
Requires the DoD to procure supplies and services from private industry if private
industry’s costs are cheaper than the costs to procure the supplies and services from DoD
activities (Title 10). This law enforces competition between private and public industry
as low cost providers.
Section 2463 - Collection and retention of cost information data on converted services
and functions and Section 2467 – Cost comparisons: inclusion of retirement costs;
consultation with employees; waiver of comparison
2463 requires the SECDEF to collect cost data when converting to contractor
support from DoD or converting to DoD to contractor support (Title 10). This
requirement allows the SECDEF and Congress to compare cost data to support or not
support the conversion. 2467 requires the inclusion of retirement costs when conducting
a cost comparison between contractor and DoD performance costs (Title 10).
Section 2464 – Core logistics capabilities
Requires the DoD to maintain core logistics capabilities that are essential to
national defense. These capabilities “shall include these capabilities that are essential to
maintain and repair weapons systems and other military equipment…” (Title 10). This

51
section also requires the SECDEF to identify the essential core capabilities and ensure
sufficient workload to maintain the core logistics functions of the Government-Owned
and Government-Operated facilities.
Section 2466 - Limitations on the performance of depot-level maintenance of material
Limits the amount of depot-level maintenance and repair work funding that can be
used to contract workload. The section states that, “Not more than 50 percent of the
funds made available in a fiscal year to a military department…for depot-level
maintenance and repair workload may be used to contract for performance by non-
Federal Government personnel…” (Title 10). This section ensures the DoD industrial
base is maintained.
Section 2469 – Contracts to perform workloads previously performed by depot-level
activities of the Department of Defense: requirement of competition
Covers competition in the award of contracts for depot-level activities of the
DoD. This section requires the SECDEF to ensure that depot-level maintenance and
repair is not moved from one depot to another depot or from one depot to a civilian
contractor without fair competition. Awards shall be based on merit and follow the
competitive procedures. However, this law is exempt for Public-Private Partnerships at a
depot that is designated a Center of Industrial and Technical Excellence (Title 10).
Section 2470 - Depot-level activities of the Department of Defense: authority to compete
for maintenance and repair workloads of other Federal agencies
Authorizes DoD depots to compete for other Federal agencies work (Title 10).
Section 2472 - Management of depot employees
Restricts the depot’s leadership to manage government civilian employees by
available workload and fund availability only (Title 10).

52
Section 2474 - Centers of Industrial and Technical Excellence: designation; public-
private partnerships
Authorizes the SECDEF to designate depots as Centers of Industrial and
Technical Excellence in the depot’s respective core competency. This designation
encourages depots to assimilate best business practices and encourages Public-Private
Partnerships to attain the requirements set forth in the SECDEF’s policy. The objectives
in the SECDEF’s policy are:
1. Maximize the utilization of capacity at the depots
2. Reduce costs of the depots
3. Reduce product costs
4. Gain synergy through private industry capital investments
5. Build a relationship with private industry (Title 10).
Chapter 152 – Issues of Supplies, Services and Facilities
Section 2563 – Articles and services of industrial facilities: sale to persons outside the
Department of Defense
Authorizes the SECDEF to sell working capital funded depot products or services
to other than DoD activities. The following conditions must be met:
1. Products or services are not available commercially
2. The “purchaser agrees to hold harmless and indemnify the Unites States”
3. Only incidental subcontracting will occur
4. It is in the U.S. public interest
5. Will not interfere with mission
6. Will not interfere with depot performance
This section opens the depot to the private market.

53
Chapter 159 – Real Property; Related Personal Property;
Lease of Non-Excess Property
Section 2687 –Base Closure and realignments
This section discusses the required procedures and reporting for base closures and
realignments (Title 10).
Chapter 131 – Planning and Coordination
Section 2208 – Working Capital Funds
This section discusses the regulations, procedures, and reporting requirements
governing working capital funds (WCF) for industrial type activities. The most
applicable paragraphs of Section 2208 to this project are the discussions on full cost
recovery of goods and services provided and the accumulation of funds (Title 10).

54
THIS PAGE INTENTIONALLY LEFT BLANK

55
APPENDIX B. BASE CLOSURE AND REALIGNMENT REPORT - FRC SUMMARY
Realign Disestablish Establish Workload and Capacity NAS Oceana, VA
AIMD Oceana
NADEP Jacksonville DET
FRC Mid Atlantic at NAS Oceana, VA
NADEP Cherry Point DET
Transfers all I-level maintenance workload and capacity to FRC Mid Atlantic, NAS Oceana, VA
NAS Patuxent River, MD
AIMD NAWC Aircraft Division
FRC Mid Atlantic Site at Patuxent River, NAS Patuxent River , MD
Transfers all I-level maintenance workload and capacity to FRC Mid Atlantic Site Patuxent River, NAS Patuxent River, MD
AIMD Norfolk, VA NADEP Jacksonville DET
FRC Mid Atlantic Site at Norfolk, NAS Norfolk, VA
Transfers all I-level and D-level maintenance workload and capacity to FRC Mid Atlantic Site Norfolk, NAS Norfolk, VA
NAS Norfolk, VA
NAWC Aircraft Division Lakehurst DET AIMD NAS JRB New
Orleans, LA
FRC Mid Atlantic Site at New Orleans, NAS JRB New Orleans, LA
Transfers all I-level maintenance workload and capacity to FRC Mid Atlantic Site New Orleans, NAS JRB New Orleans, LA
MCAS Cherry Point, NC
NADEP Cherry Point
FRC East, MCAS Cherry Point, NC
FRC East Site Beaufort, SC
FRC East Site New River, Camp Lejeune, NC
Relocate all D-level maintenance workload and capacity to: FRC Mid Atlantic, NAS Oceana, VA; FRC Mid Atlantic Site Norfolk, NAS Norfolk, VA; FRC Mid Atlantic Site Patuxent River, MD; FRC Mid Atlantic Site New Orleans, NAS JRB New Orleans, LA; FRC East Site Beaufort, SC; FRC East Site New River, Camp Lejeune, NC; FRC East, MCAS Cherry Point, NC
MCAS Beaufort, SC
NADEP Jacksonville DET Beaufort
Transfers all D-level maintenance workload and capacity to FRC East Site Beaufort, SC

56
Realign Disestablish Establish Workload and Capacity NADEP Jacksonville NAS
Jacksonville, FL FRC Southeast, NAS Jacksonville, FL NADEP Jacksonville DET
Jacksonville AIMD Jacksonville
FRC Southeast Site Mayport, NAS Mayport, FL
Relocate D-level maintenance workload and capacity to FRC Southeast Mayport, FL; Transfer I and D-level maintenance capacity and workload to FRC Southeast, NAS Jacksonville, FL
NAS Mayport, FL
AIMD, NADEP Jacksonville DET Mayport
NAWC Aircraft Division Lakehurst VRT DET Mayport
Transfers all I-level maintenance workload and capacity to FRC Southeast Site Mayport, NAS Mayport, FL
NAS Lemoore, CA
AIMD Lemoore
NADEP North Island DET
FRC West, NAS Lemoore, CA
Transfers all I-level and D-level maintenance workload and capacity to FRC West, NAS Lemoore, Lemoore, CA
NAS Fallon, NV AIMD Fallon
NADEP North Island DET Fallon
FRC Southwest Site Fallon, NAS Fallon, NV
Transfers all I-level and D-level maintenance workload and capacity to FRC West site Fallon, NAS Fallon, NV
AIMD NAWC Weapons Division China Lake, CA
Relocating I-level maintenance workload and capacity to FRC West, NAS Lemoore, CA
NAS JRB Fort Worth, TX
AIMD
FRC West Site Fort Worth, NAS Fort Worth, TX
Transfers all I-level maintenance workload and capacity to FRC West Site Fort Worth, NAS JRB Fort Worth, TX
AIMD NAS Whidbey Island, WA
FRC Northwest, NAS Whidbey Island, WA
Transfers all I-level maintenance workload and capacity to FRC Northwest, NAS Whidbey Island, WA
NSA Crane, IN
Relocate D-level maintenance workload and capacity to FRC Northwest, NAS Whidbey Island, WA

57
Realign Disestablish Establish Workload and Capacity NADEP North Island COMSEACONWINGPAC (AIMD)
NAS North Island, Naval Base Coronado, CA
FRC Southwest, NAS North Island, NB Coronado, CA
Transfer I-level and D-level maintenance workload and capacity to FRC Southwest, NAS North Island, NB Coronado, CA
NADEP North Island DET North Island
FRC Southwest Site Point Mugu, NAS Point Mugu, Ventura, CA
Relocate D-level maintenance workload and capacity to FRC Southwest Site Point Mugu, CA
FRC Southwest Site Miramar, MCAS Miramar, CA
Relocate D-level maintenance workload and capacity to FRC Southwest Site Miramar, CA
FRC Southwest Site Pendleton, MCAS Camp Pendleton, CA
Relocate D-level maintenance workload and capacity to FRC Southwest Site Pendleton, CA
FRC Southwest Site Yuma, MCAS Yuma, AZ
Relocate D-level maintenance workload and capacity to FRC Southwest Site Yuma, AZ
Relocate D-level maintenance workload and capacity to FRC West Site Fort Worth, TX
Relocate D-level maintenance workload and capacity to FRC Northwest, NAS Whidbey Island, WA
AIMD NAS Point Mugu, NB Venture, CA
Transfer all I-level maintenance workload and capacity to FRC Southwest Site Point Mugu, CA
MCAS Miramar, CA
Transfer D-level and I-level maintenance workload and capacity to FRC Southwest Site Miramar, CA
MCAS Camp Pendleton, CA
Transfer D-level and I-level maintenance workload and capacity to FRC Southwest Site Pendleton, CA
MCAS Yuma, AZ
Transfer D-level and I-level maintenance workload and capacity to FRC Southwest Site Yuma, AZ
Source: DoD, 2005Legend AIMD - Aviation Intermediate Maintenance Department MCAS - Marine Corps Air Station DET – Detachment NADEP - Naval Air Depot D-level - Depot level NAS - Naval Air Station FRC - Fleet Readiness Center NAWC - Naval Air Warfare Center I-level - Intermediate level NB - Naval Base JRB - Joint Reserve Base NSA - Naval Support Activity

58
THIS PAGE INTENTIONALLY LEFT BLANK

59
APPENDIX C. FRC SOUTHWEST ORGANIZATIONAL CHART

60
THIS PAGE INTENTIONALLY LEFT BLANK

61
APPENDIX D. DEFENSE WORKING CAPITAL FUND BUSINESS AREAS
Business Area Function Customers
Base Support
Provides utilities services, facility maintenance, transportation support, engineering services, and shore facilities planning
DoD activities
Building Maintenance (BMF)
Finances operation maintenance, protection, and repair of government-owned and leased facilities (exclusive of Pentagon Reservation)
All services
Commissary Operates stores for resale of groceries and household supplies.
Members of the DoD military services and their families
Defense Reutilization and Marketing Service
Manages excess property within the government; disposes of hazardous property
DoD, Federal agencies, the public
Depot Maintenance
Repairs, overhauls, rebuilds, manufacturers, converts, inspects, and tests materials and vehicles
Army, Navy, Air Force, Marines
Distribution Depots (DDC)
Provides worldwide warehousing for the DoD.
Inventory Control Points within military services and the operating units receiving materials
Financial Operations (DFAS)
Maintains payroll of all military personnel and responsible for all accounting operations.
All DoD services, including vendors, contractors, military personnel and their families
Information Services (DISA)
Provides information processing, software support, communications, technical support, and acquisition services.
Army, Navy, Air Force, Defense agencies, Office of the Secretary of Defense, other Federal agencies
Logistics (DLA) Operates Supply Management, Distribution Depot, Reutilization and Marketing, and Document Services
DoD Components and other government agencies
National Stockpile Center (DNSC)
Provides safe, secure, and environmentally sound stewardship for materials in the National Defense Stockpile
All services

62
Ordnance
Manufacturers and demilitarizes ammunition and artillery for all DoD branches, stores and issues ammunition, performs maintenance, and manages logistics of ordnance
All Services and Foreign Military Sales (FMS) for US allies
Pentagon Reservation (PRMRF)
Finances activities of Washington Headquarters Services (WHS) in providing space and building services for DoD Components within the Pentagon Reservation
Pentagon tenants
Printing Services (DAPS)
Provides printing and publication products and services. DoD activities
Research & Development
Provides research, development, test, evaluation and engineering support
Army, Navy, Air Force, and Office of the Secretary of Defense
Security (DSS)
Conducts personnel security investigations, provides industrial security products and services, provides security training
DoD agencies and other government entities
Supply Management
Manages inventories of fuels, weapon systems consumable, and depot level reparable spare parts.
Army, Navy, Air Force, other DoD agencies
Transportation
Provides airlift and sealift services for personnel and cargo; provides traffic management, land transportation, ocean terminals, and intermodal container management.
All services, Defense Logistics Agency, Joint Chiefs of Staff, Special Operations Command, National Security Agency, other DoD agencies
Source: (OSD(C), 2007)

63
APPENDIX E. REVOLVING FUND CASH FLOW
Source: (OSD(C), 2007)

64
THIS PAGE INTENTIONALLY LEFT BLANK

65
APPENDIX F. REPRESENTATIVE RAW DATA

66

67

68
69
LIST OF REFERENCES
Best Manufacturing Practices. (2003). Naval Aviation (NAVAIR) Depot, North Island – San Diego, CA: Best practices. Retrieved November 30, 2007 from http://www.bmpcoe.org/bestpractices/internal/nadep/index.html.
Department of Defense. (2008). Financial Management Regulation. (DoD Publication No. 7000.14-R). Washington, D.C.
Department of Defense. (2005). Base Closure and Realignment Report Part 1 of 2: Results and Process, Volume 1, Washington, D.C.
Fleet Readiness Center Southwest (FRC, SW) Homepage. Retrieved November 30, 2007 from http://www.frcsw.navy.mil/frcsw.
Garrison, R.H., Noreen, E.W., & Brewer, P.C. (2006). Managerial Accounting (11th ed.). New York: McGraw-Hill/Irwin.
Griffith, S. M. (2002). An Analysis of the Factors Affecting the Net Operating Result at Naval Aviation Depot Cherry Point, North Carolina. (M.S. in Management, Naval Postgraduate School), 77. (Springfield, Va.: Available from National Technical Information Service) Retrieved October 26, 2007 from http://bosun.nps.edu/uhtbin/hyperion-image.exe/02Dec%5FGriffith.pdf.
Horngren, C.T., Foster, G., & Datar, S.M. (1994). Cost Accounting (8th ed.). New Jersey: Prentice-Hall.
Johns, J. (2006), Naval Aviation Transformation Brief. Retrieved December 15, 2007 from http://www.dscr.dla.mil/uuserweb/dscrl/alc.alc2006/ALC% 202006%20 Briefings /1%20(A-8.1)%20Services%20Senrio%20Panel%20John% 20Johns.ppt#275,17,Slide17.
Office of the Secretary of Defense, (Comptroller) iCenter website. Retrieved December 15, 2007 from http://www.defenselink.mil/comptroller/icenter/dwcf/.
Potvin, L. (Ed.). (2007). Practical Financial Management: A Handbook for the Defense Department Financial Manager. Monterey, CA: Unites States Naval Postgraduate School.
Roth, N. (2007). Department of the Navy (FY 2009 Program/Budget Review), Issue 61485-Unjustified NADEP Direct Labor and Material Cost Growth. Retrieved April 08, 2007 from https://fmbweb1.nmci.navy.mil/cfdocs/Issue Papers.
Title 10 United States Code (2007). Retrieved December 15, 2007 from http://www.gpo.gov/uscode/title10/title10.html.

70
THIS PAGE INTENTIONALLY LEFT BLANK
71
INITIAL DISTRIBUTION LIST
1. Defense Technical Information Center Ft. Belvoir, Virginia
2. Dudley Knox Library Naval Postgraduate School Monterey, California
3. Kenneth J. Euske Naval Postgraduate School Monterey, California
4. John E. Mutty Naval Postgraduate School Monterey, California
5. Commanding Officer Fleet Readiness Center Southwest San Diego, California
6. Frank E. Widick Fleet Readiness Center Southwest San Diego, California
7. Diana Delgado Fleet Readiness Center Southwest San Diego, California
8. Harry A. Kinney
ASSTSECNAV FMC, OASN (FMB) Washington, DC


