Download - NAVIGANT’S ENERGY MARKET OUTLOOK

/ ©2017 NAVIGANT CONSULTING, INC. ALL RIGHTS RESERVED1
2017 VIEW OF THE NORTH AMERICAN ENERGY MARKETS
NAVIGANT’S ENERGY MARKET OUTLOOK
SEPTEMBER 13, 2017
ROB PATRYLAKMANAGING DIRECTOR
DAVID WALLSMANAGING DIRECTOR

/ ©2017 NAVIGANT CONSULTING, INC. ALL RIGHTS RESERVED2 / ©2017 NAVIGANT CONSULTING, INC. ALL RIGHTS RESERVED2
DISCLAIMER
Notice Regarding PresentationThis presentation was prepared by Navigant Consulting, Inc. (Navigant) for informational purposes only. Navigant makes no claim to any government data and other data obtained from public sources found in this publication (whether or not the owners of such data are noted in this publication).
Navigant does not make any express or implied warranty or representation concerning the information contained in this presentation, or as to merchantability or fitness for a particular purpose or function. This presentation is incomplete without reference to, and should be viewed solely in conjunction with the oral briefing provided by Navigant. No part of it may be circulated, quoted, or reproduced for distribution without prior written approval from Navigant.

/ ©2017 NAVIGANT CONSULTING, INC. ALL RIGHTS RESERVED3
1. Introductions
2. About Navigant and the Navigant Energy Market Outlook (NEMO)
3. Power Market Outlook
4. Power Fuels Outlook
5. NEMO Key Takeaways
AGENDA

/ ©2017 NAVIGANT CONSULTING, INC. ALL RIGHTS RESERVED4 / ©2017 NAVIGANT CONSULTING, INC. ALL RIGHTS RESERVED4
INTRODUCTIONS
ROB PATRYLAKMANAGING DIRECTOR
DAVID WALLSMANAGING DIRECTOR
MATTHEW SPADYMANAGING CONSULTANT

/ ©2017 NAVIGANT CONSULTING, INC. ALL RIGHTS RESERVED5
ABOUT NAVIGANT AND NEMO

/ ©2017 NAVIGANT CONSULTING, INC. ALL RIGHTS RESERVED6 / ©2017 NAVIGANT CONSULTING, INC. ALL RIGHTS RESERVED6
NAVIGANT AT A GLANCE

/ ©2017 NAVIGANT CONSULTING, INC. ALL RIGHTS RESERVED7 / ©2017 NAVIGANT CONSULTING, INC. ALL RIGHTS RESERVED7
ENERGY PRACTICE GEOGRAPHIC PROFILE
Many North American locations and an expanding global footprint.
San Francisco
Vancouver, BC
Folsom
Los Angeles
Boulder
Austin Houston
Verona
Miami
Washington, D.C.
Atlanta
New York
Toronto Burlington, VT
Chicago
Ann ArborHong Kong
Dubai
London
Doha
Vancouver
Burlington
Seattle
CharlottePhoenix
Philadelphia
Boston

/ ©2017 NAVIGANT CONSULTING, INC. ALL RIGHTS RESERVED8
POWER MARKET OUTLOOK

/ ©2017 NAVIGANT CONSULTING, INC. ALL RIGHTS RESERVED9 / ©2017 NAVIGANT CONSULTING, INC. ALL RIGHTS RESERVED9
MEGATRENDS THAT DRIVE POWER INDUSTRY TRANSFORMATION
The following megatrends1 underpin the industry transformation:1. The power of customer choice and changing demands2. Rising number of carbon emissions reduction policies and regulations3. Shifting power-generating sources4. Delivering shareholder value through mergers and acquisitions (M&A)5. Regionalizing of energy resources6. Merging industries, new entrants, and colliding giants7. The emerging Energy Cloud: Replacement of old infrastructure and transition toward an increasingly decentralized and
smarter power grid architecture
The transformation includes a wide range of strategic, operational, technological, commercial, environmental, and regulatory changes
that are transforming the traditional strategies and business models.1 Take Control of Your Future: Megatrends in the Utilities Industry

/ ©2017 NAVIGANT CONSULTING, INC. ALL RIGHTS RESERVED10 / ©2017 NAVIGANT CONSULTING, INC. ALL RIGHTS RESERVED10
NAVIGANT ENERGY MARKET OUTLOOK (NEMO)
INTEGRATED POWER, GAS,
ENVIRONMENTAL MODELING
NODAL PRICING
FULL TRANSMISSION REPRESENTATION
BENCHMARKING TO CAPTURE MARKET
VOLATILITY
PLANT RETIREMENT AND RETROFIT
DECISIONS
FEATURES
ENERGY PRICE FORECASTS
GAS PRICE FORECASTS
ALL CAPACITY MARKETS
EMISSION ALLOWANCE PRICES
REC PRICES
REPORTS FOR 13 REGIONS IN NORTH AMERICA
SEMIANNUAL DATA SUBSCRIPTION
PRODUCTS

/ ©2017 NAVIGANT CONSULTING, INC. ALL RIGHTS RESERVED11 / ©2017 NAVIGANT CONSULTING, INC. ALL RIGHTS RESERVED11
KEY UPDATES IN THE 2017 MID-YEAR OUTLOOK
• Latest announced/planned generation additions and retirements• Latest load forecasts• New coal price forecast from John T. Boyd and Associates• Continued renewable generation build-out• Overhaul of solar profile shapes, now accounting for regional and technological differences as
well as differences between residential and commercial-scale systems• Updated regional solar and wind capacity factors• Introduction of future storage capacity additions• Updated VOM and start-cost assumptions for thermal units• Polynomial heat rate curves for combined-cycle and simple-cycle gas turbines• Accelerated clean energy policies in Canada
- Coal phase out by 2030 to achieve 90% generation from non-emitting resources- Federal carbon floor price of CAD $10/ton starting in 2018 and increasing to CAD $50/ton in 2022

/ ©2017 NAVIGANT CONSULTING, INC. ALL RIGHTS RESERVED12 / ©2017 NAVIGANT CONSULTING, INC. ALL RIGHTS RESERVED12
STORAGE AND INCREASED RENEWABLE PENETRATION
California needs storage to meet renewable targets without adding
significant new natural gas generation
Declining costs, technological advancement, revised load forecasts, and updated capacity factor and profile assumptions are driving solar penetration throughout
North American markets
Source: Navigant Source: Navigant

/ ©2017 NAVIGANT CONSULTING, INC. ALL RIGHTS RESERVED13 / ©2017 NAVIGANT CONSULTING, INC. ALL RIGHTS RESERVED13
POWER MARKET OVERVIEW
• Renewables and distributed energy resources (DER) continue to grow across North America• Solar capital costs are expected to continue to decline, although at a slower rate than recent years• Navigant expects:
- 34 GW of DER and 47 GW of energy efficiency/demand-side management by 2030- 202 GW of wind and solar additions and 166 GW of net gas additions over the next 20 years- 63 GW of coal retirements over the next decade
• Removal of the US Clean Power Plan and real gas price escalation means economics for coal in the United States are better longer term; Canadian provinces are accelerating the retirement of coal-fired generation by implementing of environmental policies that put upward pressure on electricity prices
• Increased renewables and declining battery costs means that storage technology is on the precipice of increased deployment across the electric grid, for both renewable integration and to provide ancillary services- Navigant expects over 1 GW of storage additions in WECC over the next decade
/ ©2017 NAVIGANT CONSULTING, INC. ALL RIGHTS RESERVED14 / ©2017 NAVIGANT CONSULTING, INC. ALL RIGHTS RESERVED14
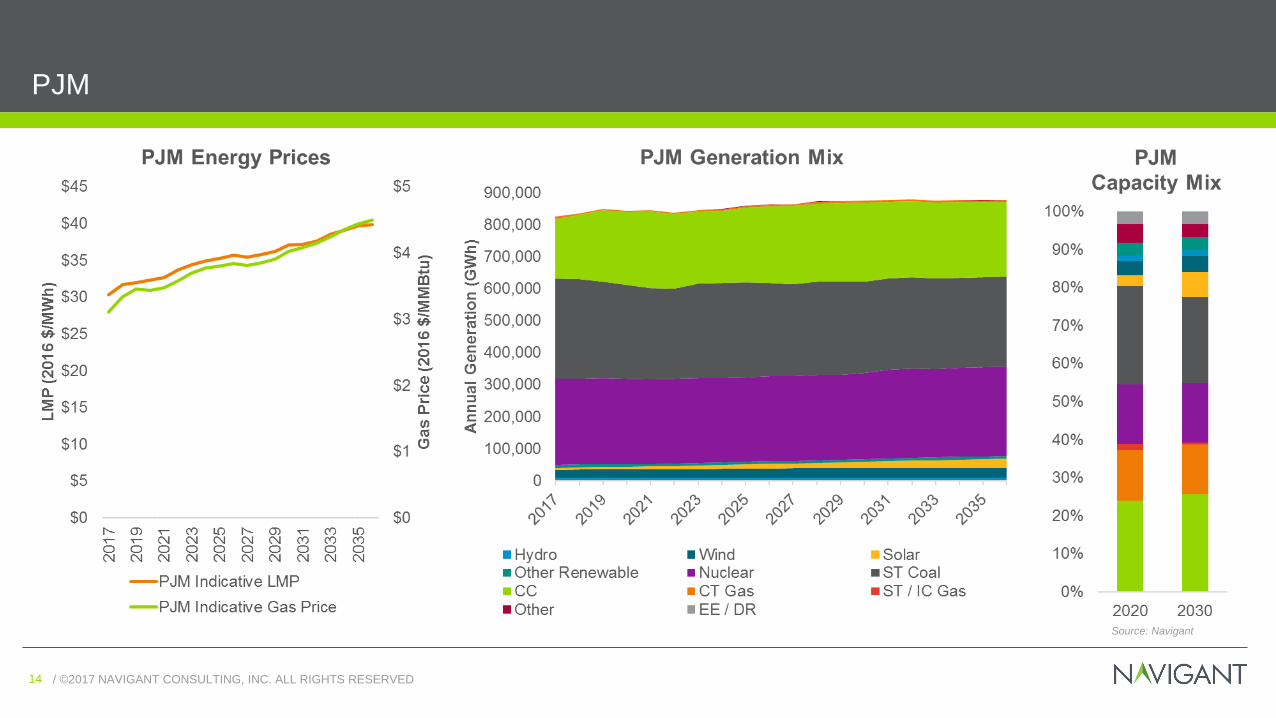
PJM
Source: Navigant

/ ©2017 NAVIGANT CONSULTING, INC. ALL RIGHTS RESERVED15 / ©2017 NAVIGANT CONSULTING, INC. ALL RIGHTS RESERVED15
NYISO
Source: Navigant

/ ©2017 NAVIGANT CONSULTING, INC. ALL RIGHTS RESERVED16 / ©2017 NAVIGANT CONSULTING, INC. ALL RIGHTS RESERVED16
CAISO
Source: Navigant

/ ©2017 NAVIGANT CONSULTING, INC. ALL RIGHTS RESERVED17 / ©2017 NAVIGANT CONSULTING, INC. ALL RIGHTS RESERVED17
ERCOT
Source: Navigant

/ ©2017 NAVIGANT CONSULTING, INC. ALL RIGHTS RESERVED18 / ©2017 NAVIGANT CONSULTING, INC. ALL RIGHTS RESERVED18
CANADA OVERVIEW
ALBERTA
Carbon Tax effective 2017 Coal phase out by 2030 30% RPS by 2030
Saskatchewan No provincial carbon price Coal phase out by 2030 50% RPS by 2030
Carbon Tax effective 2008 No coal; ~95% renewable 1.1 GW of new hydro, Site C
British Columbia
New Brunswick
Carbon policy under development Coal phase out by 2030 40% RPS by 2020
Manitoba
Carbon policy under development No coal; ~93% renewable 0.6 GW of new hydro, Keeyask
ONTARIO
Cap and Trade effective 2017 No coal; ~45% renewable 20 GW RPS by 2025
Quebec
Cap & Trade effective 2013 No coal; ~99% renewable 1.5 GW of new hydro, Romaine
Nova Scotia Carbon policy under development Coal phase out TBD (>2030) 41% RPS by 2022
Newfoundland & Labrador
Carbon policy under development No coal; ~55% renewable 0.8 GW of new hydro, Muskrat Falls
Source: Navigant

/ ©2017 NAVIGANT CONSULTING, INC. ALL RIGHTS RESERVED19 / ©2017 NAVIGANT CONSULTING, INC. ALL RIGHTS RESERVED19
ONTARIO
Source: Navigant

/ ©2017 NAVIGANT CONSULTING, INC. ALL RIGHTS RESERVED20 / ©2017 NAVIGANT CONSULTING, INC. ALL RIGHTS RESERVED20
ALBERTA
Source: Navigant

/ ©2017 NAVIGANT CONSULTING, INC. ALL RIGHTS RESERVED21
POWER FUELS OUTLOOK

/ ©2017 NAVIGANT CONSULTING, INC. ALL RIGHTS RESERVED22 / ©2016 NAVIGANT CONSULTING, INC. ALL RIGHTS RESERVED22
ABUNDANT AND WIDELY DISTRIBUTED DOMESTIC NATURAL GAS RESOURCES
Select North American Shale Plays
Source: Navigant, Ventyx

/ ©2017 NAVIGANT CONSULTING, INC. ALL RIGHTS RESERVED23 / ©2016 NAVIGANT CONSULTING, INC. ALL RIGHTS RESERVED23
PRICE GROWTH TO REMAIN RELATIVELY LOW AFTER REBOUND
Henry Hub Natural Gas Price Outlook: 2017-2040
Source: Navigant Energy Market Outlook Summer 2017
$-
$2.00
$4.00
$6.00
$8.00
$10.00
$12.00
2005 2009 2013 2017 2021 2025 2029 2033 2037
(201
6$/M
MB
tu)

/ ©2017 NAVIGANT CONSULTING, INC. ALL RIGHTS RESERVED24 / ©2017 NAVIGANT CONSULTING, INC. ALL RIGHTS RESERVED24
-
20
40
60
80
100
120
2005 2006 2007 2008 2009 2010 2011 2012 2015 2020 2025 2030 2035 2040
(Bcf
d)
US Natural Gas Supply Outlook: 2005-2040
Shale
Non Shale
US SUPPLY CONTINUES TO GROW
Source: Navigant Energy Market Outlook Summer 2017
Shale: 68% of US production by 2040
27.6% of US production now comes from Marcellus and Utica shale plays,up from 0.2% just 8 years ago

/ ©2017 NAVIGANT CONSULTING, INC. ALL RIGHTS RESERVED25 / ©2017 NAVIGANT CONSULTING, INC. ALL RIGHTS RESERVED25
-
20
40
60
80
100
120
2016 2020 2024 2028 2032 2036 2040
(Bcf
d)
Demand for US Natural Gas: 2016-2040
Residential/Commercial
Industrial
Gas Fired Generation
WHERE WILL ALL THE ADDITIONAL SHALE PRODUCTION GO?
Primary Growth Sectors (CAGR):- Industrial 1.5%- LNG Export 13.5%- Mexico Pipeline Export 3.9%- NGV 17.3%
LNG Export
Mexico Pipeline Export
NGV
New Markets
Low Growth Sectors (CAGR):- Electric Gen. 0.5%- Residential 0.1%- Commercial 0.3%
Source: Navigant Energy Market Outlook Summer 2017

/ ©2017 NAVIGANT CONSULTING, INC. ALL RIGHTS RESERVED26 / ©2017 NAVIGANT CONSULTING, INC. ALL RIGHTS RESERVED26
-
5
10
15
20
25
30
35
2016 2020 2024 2028 2032 2036 2040
(Bcf
d)
Incremental Demand Growth: 2016-2040
Industrial Demand
LNG Exports
Mexico Pipeline Export
NGV
• Industrial- Chemicals leading expansion with
over $160 billion in capital investment between 2010 and 2016
• Export- Growing liquefied natural gas (LNG)
export capacities in the next 5 years- Increasing pipeline export due to
Mexico demand growth
• Natural Gas Vehicle (NGV)- Strong long-term demand growth
INCREMENTAL GROWTH FROM NEW MARKETS
Over 32 Bcfd of Demand Market Growth from New and Revitalized Markets
Source: Navigant Energy Market Outlook Summer 2017

/ ©2017 NAVIGANT CONSULTING, INC. ALL RIGHTS RESERVED27 / ©2017 NAVIGANT CONSULTING, INC. ALL RIGHTS RESERVED27
Source: Navigant’s Global Natural Gas Outlook using the G2M2 global market model
ASIA AND EUROPE WILL DRIVE GLOBAL DEMAND FOR US LNG
-
10
20
30
40
50
60
70
80
90
(mtp
a)US LNG Exports by Importing Region: 2016-2035
Middle East Latin America Europe Asia

/ ©2017 NAVIGANT CONSULTING, INC. ALL RIGHTS RESERVED28 / ©2017 NAVIGANT CONSULTING, INC. ALL RIGHTS RESERVED28
PIPELINE EXPORTS TO MEXICO ARE ALSO INCREASING SHARPLY
Source: Navigant Energy Market Outlook Summer 2017
-
1
2
3
4
5
6
7
(Bcf
d)
US Pipeline Natural Gas Export to Mexico by Pipeline: 2014-2022
CFE Waha Header NET Mexico PEMEX Nueva Era Chihuahua North Baja KM Mexico Others
Forecast

/ ©2017 NAVIGANT CONSULTING, INC. ALL RIGHTS RESERVED29 / ©2017 NAVIGANT CONSULTING, INC. ALL RIGHTS RESERVED29
-15
-10
-5
0
5
10
2000 2004 2008 2012 2016 2020 2024 2028 2032
(Bcf
d)
Net Imports US Lower 48: 2000-2032
LNG Pipeline
Forecasted
INTERNATIONAL DEMAND FOR US GAS WILL BE A THRESHOLD EVENT
By the end of 2017, the United States will become a net exporter (by pipe and by ship) of natural gas for first time since 1957 (60 years ago).
13.7 BcfdExport
Source: Navigant Energy Market Outlook Summer 2017

/ ©2017 NAVIGANT CONSULTING, INC. ALL RIGHTS RESERVED30 / ©2017 NAVIGANT CONSULTING, INC. ALL RIGHTS RESERVED30
NYMEX PRICE SHOWS DECREASING TRENDS
$-
$1.00
$2.00
$3.00
$4.00
$5.00
$6.00
$7.00
Jan-
10
Jul-1
0
Jan-
11
Jul-1
1
Jan-
12
Jul-1
2
Jan-
13
Jul-1
3
Jan-
14
Jul-1
4
Jan-
15
Jul-1
5
Jan-
16
Jul-1
6
Jan-
17
Jul-1
7
Jan-
18
Jul-1
8
Jan-
19
Jul-1
9
Jan-
20
Jul-2
0
Jan-
21
Jul-2
1
Jan-
22
(Rea
l201
6$/M
MB
tu)
Henry Hub Price: 2010-2022
ForecastHistorical
Navigant Henry Hub Monthly Forecast
Henry Hub Monthly NYMEX Future
Source: Navigant Energy Market Outlook Summer 2017, Ventyx, ICE, NYMEX

/ ©2017 NAVIGANT CONSULTING, INC. ALL RIGHTS RESERVED31 / ©2017 NAVIGANT CONSULTING, INC. ALL RIGHTS RESERVED31
CASE STUDY: TODAY’S NYMEX—REALISTICALLY LOW?
• NYMEX Henry Hub Price is estimated to be $2.69/MMBtu for 2019
• To derive that price in Navigant’s 2017 Summer Outlook, holding everything else the same:
• US LNG export growth would need to be stagnant, at Sabine Pass volumes only
• US industrial and Mexican exports would remain flat
• Using more realistic assumptions—the annual average price in 2019 is $3.59/MMBtu:
• This is assuming LNG export of 9.5 Bcfd (12 Bcfd by 2022)• Growth in US industrial (2.1 Bcfd) and Mexican demand (2.5
Bcfd) per Navigant’s current outlook
• This illustrates that current levels of gas demand matter, and perhaps the current NYMEX does not reflect expected current market demand growth
Annual Average Henry Hub Price: 2019
$2.69
$3.59
$-
$0.50
$1.00
$1.50
$2.00
$2.50
$3.00
$3.50
$4.00
Status Quo/NYMEX Summer 2017
(Rea
l201
6$/M
MB
tu)
Source: Navigant Analysis, Ventyx, NYMEX

/ ©2017 NAVIGANT CONSULTING, INC. ALL RIGHTS RESERVED32
NEMOKEY TAKEAWAYS

/ ©2017 NAVIGANT CONSULTING, INC. ALL RIGHTS RESERVED33 / ©2017 NAVIGANT CONSULTING, INC. ALL RIGHTS RESERVED33
CHANGING US CAPACITY MIX
Capacity Mix (MW)
2017
2032
The share of gas-fired and renewable capacity increases significantly over
the next 15 years

/ ©2017 NAVIGANT CONSULTING, INC. ALL RIGHTS RESERVED34 / ©2017 NAVIGANT CONSULTING, INC. ALL RIGHTS RESERVED34
CHANGING US ENERGY GENERATION MIX
Generation Mix (GWh)
2017
2032
Through 2032, gas-fired and renewable generation increase as the
total share of coal generation declines
US Energy Demand: 4,156,043 GWh
US Energy Demand: 4,773,692 GWh

/ ©2017 NAVIGANT CONSULTING, INC. ALL RIGHTS RESERVED35 / ©2017 NAVIGANT CONSULTING, INC. ALL RIGHTS RESERVED35
TRANSACTION HISTORY
Source: SNL Financial, downloaded September 2017
M&A Statistics in Energy Industry

/ ©2017 NAVIGANT CONSULTING, INC. ALL RIGHTS RESERVED36 / ©2017 NAVIGANT CONSULTING, INC. ALL RIGHTS RESERVED36
KEY TAKEAWAYS
• With declining costs and technological advancement, renewables and DER continue to grow in areas with positive state policies and decent renewable potential
• Storage technology is on the precipice of increased deployment across the electric grid for both renewable integration and to provide ancillary services
• Ambitious Canadian environmental policies will put a significant upward pressure on electricity prices • North American natural gas supply abundance will continue due to vast shale resources across North
America, particularly in the Appalachian basin• With pipeline exports to Mexico and LNG exports to the rest of the world, demand for US natural gas
will turn US into a net exporter by the end of 2017• Removal of the US Clean Power Plan and real gas price escalation means the economics for coal in
the United States are better longer term• Generation market should continue to be active; the number of deals and spending on deals are
expected to increase above historical averages

/ ©2017 NAVIGANT CONSULTING, INC. ALL RIGHTS RESERVED37
CONTACTSROBERT PATRYLAKManaging DirectorPhone: 404.731.7802Email: [email protected]
DAVID WALLSManaging DirectorPhone: 781.270.8436Email: [email protected]


