
1
NedNamibia Holdings Highlights for the Year 1Profile, Vision, Mission and Values 2NedNamibia Holdings Group Structure 3Branch Network 4Board of Directors 5Executive Committee of Nedbank Namibia 7Chairman’s Report 11Managing Director’s Review 15Value Added Statement 19Corporate Governance Report 20Directors’ Responsibility 39Independent Auditor’s Report 40Statement of Actuarial Value of Assets and Liabilities of Coversure Limited 41Report of the Directors 43Balance Sheets 47Income Statements 48Statements of Changes in Equity 49Cash Flow Statements 51Notes to the Annual Financial Statements 52Contact Details 145

1
NedNamibia Holdings Highlights for the Year
• Netassetvaluepershare up by 22.2% from 555.37 cents to 678.62 cents per share
• Weightedearningspershare up by 106% to 117.46 cents per share
• Costeffeciencyratio improved from 72.6% to 64.3%
• Loansandadvancestocustomers up by 10.8% to N$4.11 billion
• Totalassets increased by 14.9% to N$5.47 billion

2
Profile, Vision, Mission and Values
PROFILE
NedNamibia Holdings Limited (“Ned-
Namibia Holdings” or “the Company”) is the
holding company for the subsidiaries (“the
Group”) offering a wide range of financial
services including commercial banking,
micro lending and wealth management with
total assets of N$5,47 billion (2006: N$4,76
billion). The principal subsidiary is Nedbank
Namibia Limited (“Nedbank Namibia” or
“the Bank”).
Nedbank Namibia is a registered Namibian
bank, with its head office based in Windhoek.
Well capitalised by international standards,
the Bank has assets of N$5,07 billion (2006:
N$4,24 billion).
Nedbank Namibia provides a comprehensive
range of domestic and global services to
individual, corporate and international clients
through a growing branch network. The
combination of an intensive understanding
of the Namibian market and the strong
support of its shareholder makes it a
uniquely competitive force in its market.
VISION
We are committed to be our nation’s
number one choice in banking.
MISSION
• Provide our existing and potential clients
with innovative banking solutions that
meet their needs.
• Create an environment conductive
to the development and growth of all
employees that will create value for all
our stakeholders.
• Sustainably grow our business through
the expertise and commitment of our
people and shareholders.
• Commit ourselves to diversity - our
strength is in our people.
VALUES
Accountability - To be prepared to make
commitments and be judged against
our commitments, to deliver on those
commitments and to be responsible for our
actions.
Integrity - To be honest, trustworthy,
truthful, consistent and open in all of our
conduct and decisions.
Pushingbeyondboundaries - To recognise
our obligation to the entire organisation - to
push beyond the limits of what is best for us
individually, or as a Group or unit and strive
to break new ground, fuelled by our passion
and commitment.
Respect - To recognise the inherent worth
of every human being and to treat all people
accordingly.
People-centred - We invest in our people and
create empowering environments through
development, support, mentoring, coaching,
valuing diversity, recognition and reward.

3
NedNamibia Holdings Group Structureas at 31 December 2007
Nedbank Group Limited
NedNamibia Holdings Limited
100%
NIB Mining Finance(Proprietary) Limited
Special purpose vehicle for a project
finance transaction
Manco Management Company(Proprietary) Limited*
*Dormant Company
100%100%100%
African Mining Company Limited*Mining private equity fund
*Dormant Company
CBN Nominees(Proprietary)
LimitedSafe Custodian Services
*Dormant Company
Namclear(Proprietary)
LimitedClearing Service Provider
Nedloans(Proprietary)
LimitedMicrolending
Administration
Ten Kaiser Wilhelm Strasse
(Proprietary) Limited
Property Holding
Walvis Bay Land Syndicate
(Proprietary) Limited
Property Holding
100% 25% 80% 50% 50%
Bellissima InvestmentsSeventy Two (Proprietary)
LimitedProperty Holding Company
NedCapital Namibia (Proprietary) LimitedSpecialised Financial Services
NedPlan Insurance Brokers Namibia (Proprietary)
LimitedInsurance Brokers
100%100%100%
Coversure LimitedLong-term insurance
Nedbank Namibia LimitedCommercial Banking
100% 100%

4
Branch Network

5
Board of Directors
THEOJFRANK-ChairmanIndependentnon-executivedirector*BA Law, LLB, Dip in Bus Man, Cert Tax Law
Senior counsel and former judge of the High Court
of Namibia and chairs companies in the fishing and
short-term insurance industry. He is the chairperson of
both NedNamibia Holdings and Nedbank Namibia.
WILLIAMETURTON-ManagingDirector(outgoing)Exec Dev Prog (Stellenbosch Business School), Sen Man Dev Prog (Wits Business School), BTech (Bus Admin) (Cape Technikon), MTech (Bus Admin) (Cape Technikon), Certificated associate and elected fellow of Institute of Bankers SA.
A seasoned banker who has held various positions in Nedbank Group Limited over the past 28 years. William was regional manager of Nedbank Group’s business banking division for five years and subsequently became the managing director of both NedNamibia Holdings and Nedbank Namibia for a period of 18 months. He resigned as managing director of both companies with effect from 31 December 2007.
ERASTUSTHOVEKA-ManagingDirector(incoming)CPA (Illinois, USA); MBA (Bradley University, Peoria, Illinois USA); B.S.(Acc) (Bradley University, Peoria, Illinois, USA)
Has held the position of Chief Financial Officer of the
Development Bank of Namibia prior to his appointment
as Deputy Managing Director of Nedbank Namibia on
1 April 2007 and subsequently as Managing Director
of NedNamibia Holdings and Nedbank Namibia, both
with effect from 1 January 2008.
DENYSDENYANon-executivedirectorBAcc (Hons), MBA (University of Zimbabwe), ACIS, CA (Z)
Has a thorough knowledge of the merchant banking
and finance sectors in Africa, developed over a 12
year career, which includes his previous appointment
as managing director of MBCA Bank Limited. Denys
is presently the managing director of Nedbank Africa,
based in Johannesburg, South Africa.
JOHANNES!GAWAXABNon-executivedirectorMBL, MA, BA, BCom, AMP (Harvard)
Managing director of Old Mutual Namibia and a
member of the board of the Namibian Stock Exchange.
Johannes has extensive experience in the financial
services industry. In addition to his current position,
he is also managing director of Old Mutual’s African
operations.
SEBULONIKANKONDIIndependentnon-executivedirector*BTech (Unisa); Sen Man Prog (USB); Exec Dev Prog (USB); Market Man Prog (UCT); Nat. Dip in Mech Eng (Peninsula Technikon)
Managing director of Namport. Sebulon has vast
expertise in logistics and freight management.

6
HEINZMWEILERTIndependentnon-executivedirector*BCom; BCom (Hons); CA (SA); MCom; FII (SA)
Currently Chief Operating Officer of Development
Bank of Southern Africa. Previously Divisional Director:
Strategy for Nedbank Corporate. He has particular
experience in business development and customer
value management.
MARKRWESTONNon-executivedirectorBCA, CA (New Zealand), AMP (Harvard)
Has extensive experience in investment banking and
strategic planning as well as governance and regulatory
issues. Mark resigned as director of NedNamibia
Holdings on 3 October 2007.
CHRISTOPHERJPEARCEIndependentnon-executivedirector*BCom, CA(SA), AMP (Harvard)
Over 30 years’ experience in the banking industry and
a former managing director of Nedbank Investment
Bank Limited.
ROLFHPETERSIndependentnon-executivedirector*BCom, BCompt (Hons), CA (SA), CA (Namibia)
Managing partner of Grant Thornton Neuhaus, with
over 30 years experience in the auditing profession
across all sectors of the Namibian economy. Rolf is
also advisor to several foreign investors. He is a past
president of the Public Accountants and Auditors Board
of Namibia.
MARTINKSHIPANGAIndependentnon-executivedirector*BCom (Wits); MSc Public Policy and Administration (ISS); Leadership and Management (University of Virginia); Exec Dev Prog (Harvard)
Executive Chairman of Smartswitch Namibia
(Proprietary) Limited and Vice President of Net 1
Inc. Martin has over 11 years executive management
experience in both the public and private sectors.

7
WILLIAMETURTON-ManagingDirector
(Until31December2007)
A seasoned banking professional. William was appointed
managing director in July 2006 to head the team managing the
Bank. In a career spanning 28 years with the Nedbank group,
William has held a number of challenging positions. William
has both a BTech and MTech in business administration, and
has completed a number of executive development courses
with the universities of Witwatersrand and Stellenbosch. He is
also a fellow of the Institute of Bankers in South Africa.
ERASTUSTHOVEKA-DeputyManagingDirector(ManagingDirectorfrom1January2008)
Erastus has distinguished himself locally and abroad,
qualifying as Certified Public Accountant and attaining
his MBA (Distinction), both in the United States, and also
served as Chief Financial Officer at the Development Bank
of Namibia. He currently serves in noteworthy capacities
for the Housing Trust of Namibia, Weatherly International
(Namibia), Government Institutions Pension Fund (GIPF) and
the International Federation of the Red Cross & Red Crescent
Societies, among others. His leadership is vital in steering the
organisation closer to its mission.
Executive Committee of Nedbank Namibia
JAMESMATTHEWS-ChiefOperatingOfficer(Appointedon1May2007)
James has been with Nedbank since 1995 and has extensive
experience in the process and operations area. Prior to his
appointment in Namibia he occupied the position of Head of
Operations for Nedbank Africa in Johannesburg. He has worked
in the Africa Operations of Nedbank since 2001 in various
positions and has made a significant contribution since joining
the Namibia team.
GEORGEGOLDRIDGE-Executive:SharedServices
George has 13 years experience in the banking industry with
in-depth understanding of Nedbank’s operations in Africa,
having headed the Technology and Support Services divisions
of Nedbank Swaziland and the Operations division of Nedbank
Lesotho, before joining Nedbank Namibia in December 2006. His
mandate is to establish and manage a shared services model for
the Bank, which includes centralised operations, technology and
electronic banking.

8
ABRINEL-Executive:CorporateandBusinessBanking(Until31October2007)
Abri brings extensive experience in the corporate banking sector,
gained in South Africa and Namibia. He holds a Bachelor of
Economics (Hons) majoring in Money and Banking from the
University of the Free State.
ALANLAWRENCE-ActingExecutive:Treasury
(Appointedon1August2007)
Alan has worked in the Financial Services industry in the United
Kingdom (“UK”) and Southern Africa for over 25 years and
has held a number of management positions in the banking,
investment management and insurance industries. He is a Fellow
of the Chartered Association of Certified Accountants and holds
an MBA from the University of Brighton as well as a number of
other finance and management qualifications obtained in the UK
and South Africa.
GRANTMARAIS-Executive:HeadofSales(Appointedon1January2008)
Grant’s track record over the past 25 years includes
responsibilities as Deputy MD of Standard Bank Namibia and
Executive Director at Stanbic Botswana, among others. A
Certified Associate of the Institute of Bankers in SA, he has
excelled in Bancassurance, Treasury Management, Corporate,
Business and Retail Banking, Custody and Trusteeship, Asset
and Liability Management and Foreign Exchange. Grant drives
Nedbank’s sales activities across Business and Corporate
Banking, Bancassurance, Micro-lending, Branch Network,
Global Trade and Treasury and Retail.
NEVILLEBECKMANN-Executive:Treasury
(Appointedon1February2008)
With a track record spanning 20 years, Neville has distinguished
himself in Treasury Management, Structured and Project
Finance, Asset and Liability Management, Custodial and
Trusteeship and Foreign Exchange. A Certified Associate of the
Institute of Bankers in SA, he was instrumental in NamPower’s
expansion drive and also in Namibia’s largest corporate bond
issue. Neville oversees Nedbank’s Treasury activities, supporting
the Sales team to optimise financing solutions for clients.

9
Executive Committee of Nedbank Namibia (cont)
ELINAHAIPINGE-Executive:HumanResources
Elina is spearheading the initiative to entrench global best practice in the performance management and talent development within the Bank. She has a masters degree in corporate strategy and economic policy from the School of Maastricht, Netherlands.
JOHANNESCJURGENS-ChiefFinancialOfficer
Johannes has 20 years banking experience, mostly in the
finance division. Johannes holds a BCompt (Unisa) degree
and has been a member of the Bank’s senior management
team since 1991.

10
RECTORMUTELO-Executive:MarketingandCommunications
Rector holds a masters degree in management from Emerson College, Boston, USA. In a lengthy career with the Namibian Broadcasting Corporation, Rector was general manager for corporate marketing, communication and business development. He is spearheading an active marketing campaign in the Bank, in tandem with an expanding branch network and broadening customer base. Rector has been seconded to South Africa for a period of 12 months training on a skills exchange basis with Nedbank South Africa.
PHILSILCOCK-Executive:MarketingandCommunications(From1April2007onsecondmentfromNedbankSouthAfrica,whileRectorattendeda12monthtrainingprogramme)
Phil has a Bachelor of Arts degree, which he obtained at Rhodes University, Grahamstown, South Africa and has attended a wide variety of post-graduate management development programmes. He has 20 years experience in banking (about 12 with Nedbank) in various roles. His extensive experience in the marketing environment, particularly in the retail, banking and research fields, has made him a valuable member of the executive team and he hasbeen instrumental in re-establishing pride in the Nedbank brand in Namibia.
ANDREJVENTER-ChiefRiskOfficer
Responsible for credit risk, internal audit, operational risk and legal services and compliance. Over the past 15 years Andre has developed broad expertise in finance and risk management, particularly in business banking and micro lending. He has a BCom - managerial accounting degree and has completed various management and leadership courses in recent years.
MARKVIVIER-Executive:Retail
Mark has 23 years experience in the banking industry, mainly in the retail environment. His banking career has afforded him the opportunity to work in the United Kingdom, Belgium and France on various projects and assignments. Mark’s responsibilities for retail banking operations include the branch network, micro lending, SMEs, external sales and branch conformance. He holds an MBA degree (cum laude) from the University of Stellenbosch, an Honours in Financial Management (University of Cape Town), an Honours in Business Administration (University of Stellenbosch) and a BCom (Unisa). He has also completed a number of Development and Leadership courses with Nedbank.

11
FOREWORD
In spite of competition in the market,
Nedbank Namibia Limited has not only
held its ground but managed to advance its
branch network.
As part of efforts to rapidly expand our
branch network throughout the country, we
opened new branches at Eenhana, Katima
Mulilo, Grootfontein and Outapi as well
as setting up a much-needed automatic
teller machine (“ATM”) facility at Okongo. A
significant increase of our ATMs and point-
of-sale (“POS”) devices is in the offing for
the next few years, which will enhance
banking convenience for our clients. By
2010, we expect to have 58 ATMs (up from
33 currently) and 320 POS devices, of which
we had 288 at the end of 2007, located
country-wide. Perhaps more importantly,
some 120 relationship managers will be
employed by 2010, which represents an
increase of over 50%, underpinning the
emphasis that we place on efficient and
quality customer service.
The Bank was successful in securing the
NamPost tender, which could facilitate a joint
venture offering Nedbank’s lending products
to the NamPost client base via the entity’s
120 network. Our appointment as NamPost’s
preferred banking partner followed a stringent
selection process in which six banks vied for
this sought-after banking initiative. We trust
that this relationship will prosper as there
are many benefits the venture can bring to
the “un-banked” people in Namibia.
During the year under review Nedbank
Group Limited became the sole share-
holder of NedNamibia Holdings Limited.
This followed an implementation of a
Scheme of Arrangement whereby minority
shareholders exchanged or relinquished
their NedNamibia Holdings shares for
either Nedbank Group Limited shares or
cash. Nedbank Group Limited subsequently
acquired all shares previously held by
Nedbank Limited (90.50%) and by NIB
Holdings (Namibia) (Proprietary) Limited
(3.39%).
Nedbank Namibia also prides itself on a
commitment to maintaining the Bank’s
status as a good corporate citizen. We fully
appreciate our obligation towards those
communities that have welcomed Nedbank
Namibia so warmly into their fold. Our
Social Report is submitted with this annual
report, reflecting our humble contributions
towards sustainable development initiatives
around the country.
GLOBAL TRENDS
The global economic climate started changing
in late 2007 after a positive start to the year.
Although developing countries continued to
be assisted by a Chinese-led commodities
boom, the world’s largest economy, the
United States (“US”), is showing signs of
vulnerability. A full-blown banking crisis
developed in the wake of a flagging US
housing market and the onset of the sub-
prime mortgage market crisis, forcing major
central banks to pump massive amounts of
liquidity into money markets to support the
banking system. The size and spread of the
difficulties has reduced the availability of
credit and damaged confidence, ironically
among the very consumers who had earlier
been the mainstay of the boom. Although
initial expectations were that the US would
bear the brunt of the crisis, it soon became
clear that other major economies will also
be affected.
Markets generally gained significantly in
2007, but started to reflect the uncertainty
as the year drew to a close. On equity
markets, emerging markets again shone, with
massive additional gains being extended
largely on the back of strong commodity
prices and the Asian boom.
Chairman’s ReportTheo Frank

12
The so-called “decoupling” theory helped
sustain much of the optimism as funds
switched into markets that would supposedly
not be affected by a possible US downturn.
However, the momentum started to fade
over the last quarter, although not to the
same extent as in developed markets where
sub-prime woes hit sentiment earlier.
Commodity prices generally held their
levels or improved further. Energy markets
were driven by supply-side fears, with coal
being helped by soaring oil prices. Precious
metals were boosted by financial market
uncertainty and the reflationary policies
followed by central banks. Food prices gained
the most after lagging other commodities
considerably in the early phases of the
bull market. Adverse weather conditions
affected several grain crops, but the new
focus on biofuels as a solution to energy
needs provided the catalyst for the strong
price rises. In contrast, certain base metals
began either to stabilise or ease after several
years of very strong performance.
Global prospects for 2008 are uncertain. The
US economy will continue to be battered
by weak construction and housing activity,
while lower house prices and reduced
confidence levels will moderate consumer
spending. The authorities have responded
by cutting interest rates significantly and
by introducing stimulatory fiscal measures.
However, much will depend on how quickly
financial sector conditions start to normalise
and credit conditions to ease. In the United
Kingdom, there has also been monetary
easing in response to recent weaker data.
Europe has been slow to respond to signs
of slowdown and the conventional wisdom
is that it will weaken as the US emerges
from its downturn late in 2008. Emerging
markets are expected to do better than
developed countries, helped by growing
internal momentum and strong Chinese
demand for commodities. However, China
itself is dependent on the US and Europe for
its export demand and is likely to slow after
several years of massive expansion.
LOCAL DEVELOPMENTS
The Namibian economy showed estimated
growth of just under 4% in 2007 following
growth of 4,1% in 2006. A key reason for
the slight drop in growth was the poor
performance of the mining sector, where
diamond production contracted off the high
base established in 2006. Other metals,
including gold, silver and copper, recorded
only a modest improvement in production.
Other areas of primary production faired
little better. The agricultural sector continued
to struggle, despite the fact that poor
grazing conditions meant that more cattle
were brought to market. Fishing conditions
remained depressed as low fish stocks
ensured that quotas remained in place.
Secondary activity was mixed. The
manufacturing sector was held back by
reduced fishing and farming output. The
tertiary sector was adversely affected by
higher interest rates and rising prices, which
constrained consumer demand, putting a
damper on the performance of wholesale
and retail sales as well as other services.
Namibia’s interest rate policy remains largely
tied to events in South Africa due to its
membership of the Common Monetary Area.
After mirroring the South African Reserve
Bank’s tightening for most of 2007, the
Bank of Namibia left rates unchanged
in December. The Namibian dollar has
benefited from persistent dollar weakness
over the past year. More recently, however,
heightened risk aversion and more modest
growth prospects in South Africa have left
the local currency weaker against most
major currencies.

13
Chairman’s Report (cont)
LOCAL DEVELOPMENTS (cont)
The current account remained in surplus.
Export earnings benefited from high
commodity prices, while weaker domestic
demand contained imports.
OUTLOOK
The economy is expected to grow by 4.5%
during 2008 as mining production expands
more rapidly, driven by higher uranium
output. Manufacturing output will benefit
from additional copper smelting capacity
and the increased production of locally cut
and polished diamonds. An above average
rainy season will boost activity in the
agricultural sector. The construction sector
will benefit from the development of the
new Kudu gas fields. Unfortunately, fishing
will remain depressed, given that quotas
are likely to remain unchanged. Tighter
monetary conditions will continue to cool
consumer and business spending, with
interest rates likely to peak in 2008.
The Namibian economy remains vulnerable
to adverse weather conditions, swings in
commodity prices and developments in
South Africa and the global economy. This
emphasises the importance of further
diversifying the Namibian economy.
APPRECIATION
On behalf of the entire board of directors,
we wish to express our gratitude to
William Turton for his contribution to the
performance of Nedbank Namibia during
his tenure as managing director.
Furthermore, Erastus Hoveka’s appointment
as deputy managing director in April 2007
and subsequently as managing director
with effect from 1 January 2008, has given
new impetus to grow our presence in the
Namibian banking environment.
In conclusion, I wish to extend my
appreciation to my fellow members of
the board of directors for their insights
and collective wisdom, as well as to the
management and staff for their hard work
and dedication. Your support throughout the
year has aptly demonstrated your willingness
to “Make Things Happen”.
Theo Frank
Chairman

14

15
Managing Director’s ReviewErastus T Hoveka
For NedNamibia Holdings and its
subsidiaries the past financial year was a
period of consolidation. The Group saw not
only an improved financial position but also
growth in the distribution network and client
base. Ultimately, our objective of creating a
strong platform for sustainable growth was
reinforced during 2007.
The 2007 financial year saw the Group
capitalising on the work of the past two
years, while consolidation improved financial
results. There is no doubt that our employees,
clients and shareholders are starting to reap
the benefits of this strategy.
During the past year we followed a
distribution strategy aimed at bringing our
services to more Namibians. Consequently
we opened five branches in the northern
regions and a Business Centre – the only
one in Namibia with drive-through banking
facilities – was established in Windhoek.
These developments augur well for the
Group as regards maintaining our presence
in the market and delivering our products
and services to our growing number of
customers.
The Bank was successful in securing the
NamPost tender, which could facilitate a
joint venture, offering Nedbank’s lending
products to the NamPost client base via the
entity’s 120 branch network.
A key initiative during the year was to
improve staff training and client service
levels. We have also seen a pleasing response
in our staff morale and values surveys.
FINANCIAL HIGHLIGHTS
The Group recorded a net income before
taxation of N$120,9 million compared
to N$64,1 million in 2006. Net income
attributable to the ordinary shareholder was
N$82,7 million, with shareholder’s funds at
N$472,7 million. Furthermore, the weighted
earnings per share improved from 57.03
cents per share to 117.46 cents per share.
The effect thereof was a return on ordinary
shareholder’s equity (“RoE”) of 19.7%.
Nedbank Namibia, the major operating
subsidiary of the Group, had a capital
adequacy ratio of 14.08%, which is above
the statutory requirement of 10%. Our
cost-to-income ratio improved from 72.6%
in 2006 to 64.3% in 2007. In 2006 the costs
incurred with respect to the BEE transaction
and the introduction of the new technology
platform resulted in a deteriorated cost-to-
income ratio.
The growth experienced is supported by
a growth of 14.9% in total assets, which
increased to N$5.47 billion.
RETAIL BANKING
The Retail Banking division increased its net
number of new clients for the first time in
three years. We achieved a net growth of
23% in retail client savings accounts, mainly
due to our branch expansion programme.
A concerted effort was made to expand
the Bank’s footprint to address a historic
under-investment in distribution as well as
strengthening our presence in new areas.
The expansion programme, which was
initiated in the second half of the financial
year, included the installation of eight new
ATMs (half of these earmarked for areas not
previously serviced) and the opening of five
new branches. We also increased point-of-
sale devices to 288 in a bid to improve client
service delivery.
A significant development for the retail
banking division over the last year was our
determination to be more price competitive.
One of the key focus areas of the Bank
over the last three years has been growing
non-interest revenue by generating larger
transactional volumes. Strategies have also
been developed to promote cross-selling
opportunities, client service and retention
pricing as well as group synergy benefits.

16
The specialised transactional banking teams
and fundamental philosophy of ‘personal
relationship’ bankers also contributed to the
growth in retail business.
CORPORATE AND BUSINESS BANKING
This division, which is segmented into
corporate and business banking teams,
focuses on large and mid-sized companies.
The opening of the Business Centre
and appointment of experienced staff
in Corporate banking were two of the
highlights for the year. Corporate banking
also gained a number of new clients, most
notably new business from the Public Sector.
The establishment of a close alliance with
NedCapital Namibia (Proprietary) Limited,
our investment bank, has seen a number of
joint initiatives.
The outlook for 2008 is positive for
Corporate and Business banking with the
division poised to benefit from Nedbank
Namibia’s competitive edge in this area.
TREASURY AND INTERNATIONAL
This division experienced a particularly
buoyant second half, and remains well
positioned for the 2008 financial year.
One of the major achievements was
improving unit performance, including
the foreign exchange desk and the control
environment. The division also saw greater
client interaction in a bid to improve service
delivery and drive business volumes.
RISK MANAGEMENT
Improved and diligent credit risk monitoring
curbed arrears and excesses, resulting
in a marked improvement in the Bank’s
non-performing loans (NPL) as well as
strengthened risk controls.
The division also attracted experienced and
competent staff after a restructuring of the
Risk Management division.
In anticipation of increased volumes in the
2008 financial year, we have automated
credit scoring in the retail environment
and implemented a new collections
management system.
As a subsidiary of Nedbank Group Limited,
incorporated in South Africa, we comply
with reporting in terms of Basel II to the
South African Reserve Bank. We have joined
the local task team established by the Bank
of Namibia to prepare for Basel II by July
2009. Staff have received training in the
areas of good corporate governance, anti-
money laundering as well as enterprise risk
and security.
SHARED SERVICES
The core objective of establishing a Shared
Services division was to consolidate all business
support units, which created a complete
partner support network to the Nedbank
Namibia business units. The division includes
Centralised Operations, Internal Support,
Security Information, Electronic Banking and
a newly established Project Office.
A significant achievement was the impor-
tant contribution to the development and
enhancement of our customer footprint
with the opening of the Business Centre,
new branches and ATMs.
MARKETING AND COMMUNICATIONS
In the past financial year we invested in
changing perceptions and re-positioning the
Nedbank Namibia brand as an accessible
and aspirational bank for all Namibians.
In 2008 the Marketing and Communication
division will continue to contribute to our
brand building goal to become the “bank of
choice for all Namibians”.

17
Managing Director’s Review (cont)
MARKETING AND COMMUNICATIONS (cont)
The brand building campaigns focused on
making Nedbank Namibia more relevant and
approachable, reflecting us as a group that
really understands its clients’ financial needs
and cares about the communities it serves.
We intensified our national advertising
campaigns around our brand expression,
‘Make Things Happen’.
Repositioning the brand extends beyond
just a marketing effort. It is part of a
broader strategy that includes pricing,
distribution and product innovation. The
campaign included internal and external
communications and public relations events.
Our presence at public and selected regional
events, shows, business representations and
social investment and sponsorship events
was maintained.
Nedbank Namibia also successfully partici-
pated in the inaugural annual Banking Week.
HUMAN RESOURCES
Efforts in the Human Resources department
focused on streamlining processes and
systems as well as enhancing appropriate
training for all employees.
A review and implementation of a revised
job grading system was also completed.
NEDLOANS (MICRO LENDING)
This micro lending initiative, in which
Nedbank Namibia is a major shareholder,
is one of the largest formally regulated
providers of micro-loans in Namibia. The
business progressed steadily during the
2007 financial year.
CHALLENGES
The past financial year, even though it
was challenging, saw Nedbank Namibia
achieving its objectives through the
dedication and commitment of all its
employees. This is clearly evident in the
enhancement of our client service and
relationships as well as the improvement in
our financial results.
Naturally, further increases in the interest
rate environment will mean increased
vigilance with regard to ongoing and
appropriate risk management controls and
the monitoring process.
Your bank – through the increased capital
investment and broader branch distribution
network - is well positioned to take
advantage of business opportunities and
challenges in 2008.
Before concluding, special thanks must
be made to all our BEE partners for their
continuous support and commitment to
the development and achievement of our
ongoing business goals. Our appreciation
and gratitude is also extended to every one
of our employees for their hard work and to
clients for their loyalty and support.
Finally, I wish to acknowledge the support
and guidance of the board of directors
throughout the year.
ErastusTHoveka
Managing Director

18

19
Value Added Statementfor the year ended 31 December 2007
2007 2006
N$’000 % N$’000 %
Value added
Value added is the wealth created by NedNamibia Holdings Limited
through the provision of services to clients
Interest income and non-interest revenue 707,251 589,728
Interest paid and other expenditure 458,724 418,303
248,527 171,425
Value allocated
Employees
Salaries, wages and other benefits 117,703 47% 96,484 56%
Government
Taxation 37,208 15% 23,930 14%
Shareholders
Dividends 0 0% 0 0%
Retentions for expansion and growth
93,616 38% 51,011 30%
Retained income 82,670 38,893
Depreciation 10,946 12,118
248,527 100% 171,425 100%

20
Corporate Governance Report
This governance and compliance report
covers mainly the governance and compliance
structures/functions of Nedbank Namibia,
being the main operational entity within the
NedNamibia Holdings Group.
The NedNamibia Holdings Group, as part of
the Nedbank Limited Group, has adopted an
enterprise governance framework that covers
both the corporate governance and business
governance aspects of an organisation. It
encompasses governance structures that
are strategically linked with performance
management, enabling companies to focus
on the key areas that drive their business.
Enterprise governance and compliance
constitute part of the entire accountability
framework of the organisation and require
a balance between accountability and
assurance (conformance) and value creation
and resource utilisation (performance).
Conformance includes corporate governance
and covers issues such as board structures
and roles. Performance includes business
governance and focuses on strategy and
value creation.
CORPORATE GOVERNANCE AND RISK MONITORING
Corporate governance can be defined as the
system in terms of which corporations are
directed and controlled. Good corporate
governance seeks to protect shareholders’
interests by balancing entrepreneurial
leadership with transparency and control
mechanisms, without compromising value
creation and efficient decision-making.
The board of directors continues to
advocate an integrated approach to
corporate governance and recognises that
good governance practices form an integral
part of developing and sustaining any
successful business.
FINANCIAL STATEMENTS
The directors are responsible for the annual
financial statements, which are prepared
in accordance with and comply with
International Financial Reporting Standards
(“IFRS”) adopted by the International
Accounting Standards Board (“IASB”),
and interpretations issued by the Inter-
national Financial Reporting Interpretations
Committee (“IFRIC”) of the IASB and the
Namibian Companies Act. The accounting
policies used are consistently applied,
appropriate and supported by reasonable
and prudent judgements and estimates. The
directors are responsible for ensuring that
the financial statements fairly present the
state of affairs of the Group at the financial
year-end and the results of its operations for
the year under review. The external auditors
are responsible for independently reviewing
and reporting on the fair presentation of
these financial statements.
BOARD OF DIRECTORS
The NedNamibia Holdings board comprises
one executive and eight non-executive
directors, five of whom are, in terms of the
Banking Institutions Act, independent non-
executive directors. The board’s diversity
and demographic mix comprises four white
and five black directors.
The Nedbank Namibia board comprises
one executive and eleven non-executive
directors, seven of whom are, in terms of
the Banking Institutions Act, independent
non-executive directors. The Nedbank
Namibia board’s diversity and demographic
mix comprises seven black directors, two of
whom are women, and five white directors.
Both boards are chaired by an independent
non-executive director. There is a clear
distinction between the roles of the
chairman of the board and the managing
director, who is in charge of day-to-day
operations and executive management.
Both boards meet quarterly, but additional
meetings may be held, when necessary.
The profiles of the members of the
NedNamibia Holdings board can be found
on pages 5 and 6 of this annual report.
The board has its own charter. The primary
objective of the board charter is to ensure that:
• all board members are aware of their
duties and responsibilities as members
of the board;
• applicable legislation and regulations
affecting directors’ conduct are clearly
understood; and
• sound principles of corporate governance
and ethical behaviour are applied in all
dealings on behalf of the Group.
The board is responsible to shareholders for
setting the direction of the Group through
the establishment of objectives, strategies
and key policies.

21
Corporate Governance Report (cont)
BOARD OF DIRECTORS (cont)
It monitors the implementation of its
strategies and policies through a structured
reporting approach, approves the annual
budget, accepts accountability and
recognises its responsibility for relationships
with various stakeholders. It ensures that
an effective enterprise-wide-risk framework
is established in the Group to properly
manage, control and mitigate risks.
The directors have a fiduciary duty to act
in good faith, with due diligence and care
and in the best interest of the Group and its
stakeholders.
BOARD APPOINTMENT
Board appointments are conducted in a
formal and transparent manner by the
board as a whole, assisted by the Directors’
Affairs committee.
In appointing directors, emphasis is placed on
retaining the balance of skills, knowledge and
experience necessary for achieving strategic
objectives. The non-executive directors are
actively involved in board deliberations and
discussions and bring independent judgement
to the board.
In general, directors are given no fixed
term of appointment. With the exception
of the managing director, who is subject
to short-term notice periods, all directors
retire by rotation and, if eligible for re-
election, submit their names for election at
the annual general meeting. The retirement
age for the managing director is 65, while a
non-executive director is required to retire
at age 70.
BOARD EFFECTIVENESS
A full assessment of the effectiveness of the
board and board committees has taken place
during 2007 to ensure constant refinement
of the Group’s governance structures and
the board’s responsibilities. Shortcomings
identified during the evaluation process
have been duly addressed by the board.
COMPANY SECRETARY
The board appoints the company secretary
who provides support and guidance to the
board in matters relating to governance
and statutory practices across the Group.
The company secretary assists the board
as a whole and directors individually with
detailed guidance on how to discharge
their responsibilities in the best interest
of the Group. All directors have access to
the advice and services of the company
secretary.
The company secretary plays a vital role in
the assessment process of the board and
board committees as well as board training.
In 2007 the directors’ training revolved
around Basel II and the Nedbank Limited
Group remuneration philosophy.
ATTENDANCE AT BOARD AND BOARD COMMITTEE MEETINGS FOR THE FINANCIAL YEAR ENDED 31 DECEMBER 2007
*Attended board committee meeting by invitation.
(1) Resigned 31/12/2007 (2) Resigned 3/10/2007
NEDNAMIBIA HOLDINGS LIMITEDBOARD OF DIRECTORS BOARD AUDIT COMMITTEE
Meetings held: 5 4
Attendance:
Frank T J 5 (Chairman)
Denya D 3 2
!Gawaxab J 0 1
Kankondi S I 3
Pearce C J 5 4
Peters R H 5 4 (Chairman)
Shipanga M K 2
*Turton W E (Managing Director)(1) 5 4
Weilert H M 3 1
Weston M R (2) 2

22
DIRECTORS’ INTEREST IN NEDNAMIBIA HOLDINGS AT 31 DECEMBER 2007
The successful implementation of the Scheme of Arrangement between
Nedbank Group Limited and the minority shareholders, resulted in Nedbank
Group Limited’s acquisition of the minority shareholders’ 6.11% shareholding in
NedNamibia Holdings and consequently the directors having no interest in the
share capital of NedNamibia Holdings.
DIRECTORS’ FEES
Directors’ and board committee fees are paid quarterly to local non-executive directors
only and the quarterly amounts payable are rounded up to the nearest N$500.
NedNamibia Holdings LimitedThe following directors’ fees were paid for the 2007 financial year:
Chairman N$22 500 per annum
Members N$15 000 per annum
NEDBANK NAMIBIA LIMITED
BOARD OF DIRECTORS BOARD AUDIT COMMITTEE RISK
COMMITTEE
REMUNERATION
NOMINATION,
EQUITY AND
SKILLS RETENTION
COMMITTEE
DIRECTORS’
AFFAIRS
COMMITTEE
Meetings held: 5 4 4 4 4
Attendance:
Frank T J 5 (Chairman) 4 4 (Chairman) 4 (Chairman)
Denya D 3 2 1 2 2
!Gawaxab J 3 4
Kankondi S I 3 2 2
Pearce C J 5 4 4 (Chairman)
Peters R H 5 4 (Chairman) 4
Shipanga M K 3
*Turton W E (Managing Director)(1) 5 4 4 4 4
Weilert H M 3 1 1 1 1
Weston M R (2) 2
*Attended board committee meetings by invitation.
(1) Resigned 31/12/2007 (2) Resigned 3/10/2007
NEDNAMIBIA HOLDINGS LIMITEDFEES PAID FOR THE 2007 FINANCIAL YEAR TO
INDIVIDUAL DIRECTORS
Name of directorN$ paid per
annum
Frank T J (Chairman) 24 000
Denya D NIL
!Gawaxab J 16 000
Kankondi S I 16 000
Pearce C J NIL
Peters R H 16 000
Shipanga M K 16 000
Turton W E (Managing Director) NIL
Weilert H M NIL
Weston M R NIL
23
Corporate Governance Report (cont)
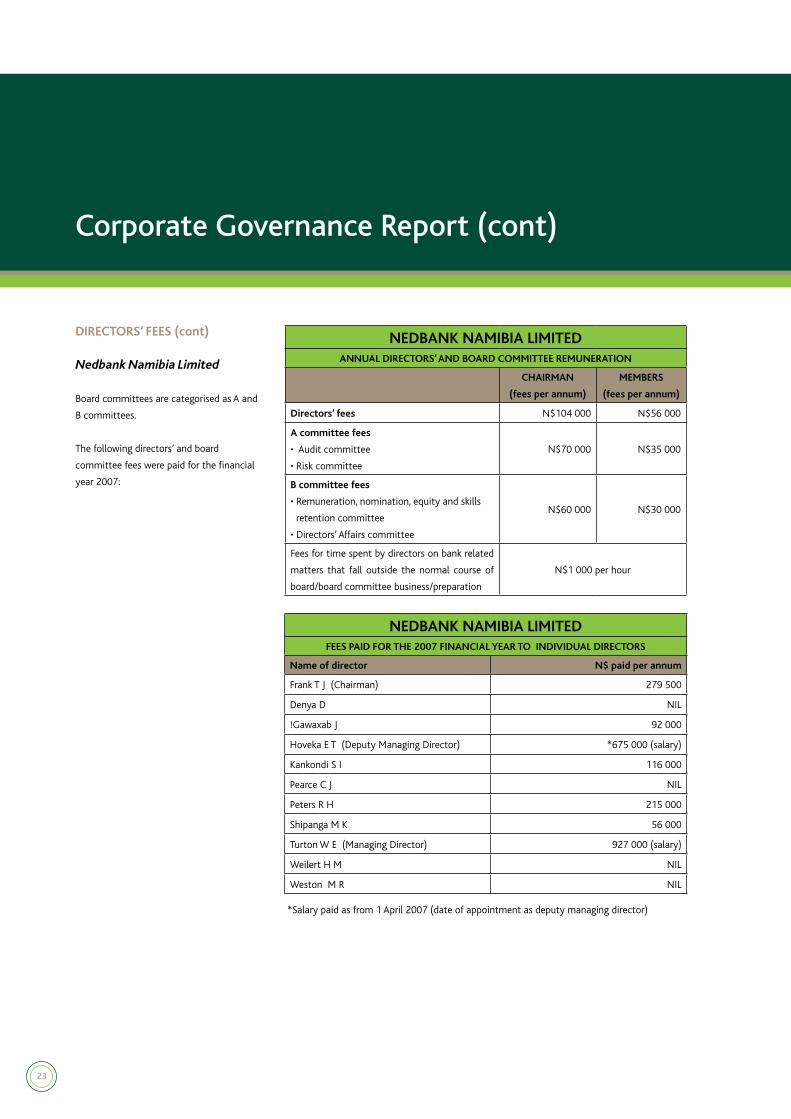
DIRECTORS’ FEES (cont)
Nedbank Namibia Limited
Board committees are categorised as A and
B committees.
The following directors’ and board
committee fees were paid for the financial
year 2007:
NEDBANK NAMIBIA LIMITEDANNUAL DIRECTORS’ AND BOARD COMMITTEE REMUNERATION
CHAIRMAN
(fees per annum)
MEMBERS
(fees per annum)
Directors’ fees N$104 000 N$56 000
A committee fees
• Audit committee
• Risk committee
N$70 000 N$35 000
B committee fees
• Remuneration, nomination, equity and skills
retention committee
• Directors’ Affairs committee
N$60 000 N$30 000
Fees for time spent by directors on bank related
matters that fall outside the normal course of
board/board committee business/preparation
N$1 000 per hour
NEDBANK NAMIBIA LIMITEDFEES PAID FOR THE 2007 FINANCIAL YEAR TO INDIVIDUAL DIRECTORS
Name of director N$ paid per annum
Frank T J (Chairman) 279 500
Denya D NIL
!Gawaxab J 92 000
Hoveka E T (Deputy Managing Director) *675 000 (salary)
Kankondi S I 116 000
Pearce C J NIL
Peters R H 215 000
Shipanga M K 56 000
Turton W E (Managing Director) 927 000 (salary)
Weilert H M NIL
Weston M R NIL
*Salary paid as from 1 April 2007 (date of appointment as deputy managing director)

24
DIRECTORS’ QUALIFICATIONS
Board members have the following academic qualifications:
DIRECTORS’ QUALIFICATIONSNames Academic Qualifications
Frank T J BA Law; LLB; Dip. Bus. Man.; Cert. Tax Law
Denya D BAcc (Hons); MBA (University of Zimbabwe); ACIS; CA(Z)
!Gawaxab J MBL; MA; BA; BCom; AMP (Harvard)
Hoveka E T (Deputy Managing Director)CPA (Illinois, USA); MBA (Bradley University, Peoria, Illinois USA); B.S.(Acc)
(Bradley University, Peoria, Illinois, USA)
Kankondi S I BTech (Unisa); Sen Man Prog (USB); Exec Dev Prog (USB); Market Man Prog (UCT);
Nat. Dip in Mech Eng (Peninsula Technikon)
Pearce C J BCom; CA (SA); AMP (Harvard)
Peters R H BCom; BCompt (Hons); CA (SA); CA (Namibia)
Shipanga M K BCom (Wits); MSc Public Policy and Administration (ISS); Leadership and Management
(University of Virginia); Exec Dev Prog (Harvard)
Turton W E (Managing Director)B.Tech (Bus Admin); MTech (Bus Admin) (Cape Technikon); EDP (USB); SMDP (Wits);
Certificated associate and elected fellow of Institute of Bankers SA
Weilert H M BCom; BCom (Hons); CA(SA); MCom; FII(SA)
Weston M R B.C.A.; CA (New Zealand); AMP (Harvard)
DECLARATION OF OUTSIDE INTERESTS
Directors disclose their outside interest
on a quarterly basis to the board via the
Directors’ Affairs committee. The board
through the Directors’ Affairs committee
addresses directors’ conflicts of interest
when these arise.
BOARD COMMITTEES
Board committees fulfill an essential role in
assisting the board in the performance of its
duties.
The current board committees are:
NedNamibia Holdings board
committees:
• Audit Committee
Nedbank Namibia board committees:
• Audit committee;
• Risk committee;
• Remuneration, nomination, equity and
skills retention committee; and
• Directors’ Affairs committee.
Each board committee has formal written
terms of reference that ensure effective
delegation in respect of certain of the
board’s responsibilities.
The board is responsible for the appointment
of board committee members. All members
retire after two years from appointment but
will be eligible for re-appointment.
All board committees meet quarterly and
the Bank’s board committees report to the
Nedbank Namibia board.

25
Corporate Governance Report (cont)
AUDIT COMMITTEES
A Group Audit committee has been
established in 2007, in addition to the Bank’s
Audit committee to attend to the matters
of all NedNamibia Holdings’ subsidiaries,
except for the Bank’s matters, which are
being attended to by the Bank’s Audit
committee. The Group Audit committee
reports into the NedNamibia Holdings
board, while the Bank’s Audit committee
reports into the Nedbank Namibia board.
Both the Group’s and the Bank’s Audit
committees comprise five non-executive
directors, the Chairman of both being the
same person and an independent non-
executive director. The internal and external
auditors have unrestricted access to the
chairman of the Audit committees. The
Group Audit committee’s primary objective
is to monitor that an effective internal
control, risk management and compliance
environment is created and maintained
throughout the Group and that the
necessary respect for these disciplines and
structures is demonstrated and stimulated
in the Group. The Bank’s Audit committee
has the same objective but it relates to the
Bank and its subsidiaries. Both committees
meet periodically, at least four times a year,
to review the annual financial statements
and accounting policies, interim results, the
effectiveness of management information
and assurances provided by management,
internal and external auditors on other
systems of internal control, including the
internal audit function, and to assess the
external auditors’ reports.
All non-audit services rendered by the
external auditors are approved by the
mandated level of authority and ratified by
the Audit committee.
INTERNAL AUDIT
The objective of the internal audit function
is to assist the managing director and the
Audit committees in the effective discharge
of their responsibilities by performing an
independent appraisal activity of the Group’s
management controls. The Bank’s chief
internal auditor has a direct reporting line
to the chairman of the Audit committees.
By virtue of its mandate any material or
significant control weakness is brought to
the attention of the managing director and
the Audit committee for consideration and
the necessary remedial action.
INTERNAL CONTROL
For the board to discharge its responsibilities
to ensure the accuracy and integrity of
the financial statements, management
has developed and continues to maintain
adequate accounting records and effective
systems of internal controls. The board has
ultimate responsibility for the systems of
internal control and reviews their operation
primarily through the Audit committees and
various other risk-monitoring committees.
As part of the systems of internal control,
the internal audit function conducts
operational, financial and specific audits
and coordinates audit coverage with the
external auditors.
The internal controls include risk-based systems
of internal accounting and administrative
controls, designed to provide reasonable,
but not absolute, assurance that assets are
safeguarded and that transactions are
executed and recorded in accordance with
generally accepted business practices and
the Bank’s policies and procedures. These
internal controls are based on established
and written policies and procedures and
are implemented by trained, skilled staff,
with an appropriate segregation of duties,
are monitored by management and include
a comprehensive budgeting and reporting
system, operating within strict deadlines
and an appropriate control framework that
has been developed in accordance with
the Bank’s activities. Internal control issues
are regularly discussed with the managing
director and at board level.
The board and board committees
continuously identify operational control
areas and implement suitable processes
and technology to further enhance this
important component of the operations of
the business.
RISK COMMITTEE
The Risk committee is a supporting committee
of the board and its primary objective is to
assist the board of directors in overseeing and
monitoring:
• the management of risk, including
operational risk, thereby ensuring the
overall effectiveness of the process of
corporate governance;
• all aspects of credit management,
including the quality of the Bank’s loan
portfolio;
• key risks managed by the asset and
liability (Alco) process;

26
• technology risk;
• compliance with regulatory require-
ments; and
• other risks brought to the attention of
the committee.
RISK MONITORING
Risk management in the financial services
industry is a fundamentally important
process in ensuring profitability, growth
and long-term sustainability. The board
acknowledges its responsibility for the
entire process of risk management and
the Risk committee assists the board in
reviewing the risk management process and
any significant risks facing the Bank.
In the normal course of business operations
the Group and in particular the Bank is
exposed to the following risks:
• credit risk;
• liquidity risk;
• market risk;
• interest rate risk;
• currency risk;
• solvency risk;
• operational risk;
• information technology risk;
• accounting and taxation risk;
• people risk; and
• reputational risk.
These risks are managed through a compre-
hensive enterprise-wide-risk management
framework, encompassing infrastructure,
policies and methods that support active
and effective control.
CHIEF RISK OFFICER
To enhance its enterprise-wide-risk frame-
work and aligning to international best
practice, the Bank has employed a chief
risk officer, whose primary function is to
monitor the risk environment of the Bank,
including credit risk, operational risk, legal
and compliance. The chief risk officer has
a dual reporting line to the managing direc-
tor of the Bank and the chief risk officer of
Nedbank Africa respectively.
ENTERPRISE-WIDE-RISK COMMITTEE (“ERCO”)
The Erco forms part of the Bank’s enterprise-
wide-risk governance structure and focuses
on creating awareness and identifying,
assessing, managing and monitoring all
risks in the Bank. The committee has a dual
reporting line, one into the Risk committee
and the other one into the Nedbank Africa
divisional Erco. The managing director is the
chairman of Erco.
FINANCIAL RISK MANAGEMENT
The most significant financial risks for the
Bank are credit risk, liquidity risk and market
risk. Market risk includes interest rate and
currency risk.
The Bank’s policies are designed to identify
the risks, to set appropriate risk limits and
controls and to continuously monitor these
risks and limits through effective information
systems.
High level risk policies for managing
financial risks are formulated and updated
regularly at Nedbank Group Limited level.
The financial risk policies of the Bank form
part of the Nedbank Group Limited’s overall
financial risk policies and fall within the
parameters of these policies. Those policies
are then aligned with local operations and
circumstances and implemented locally.
Credit Risk
Credit risk refers to the risk that a
counterparty will default on its contractual
obligations resulting in financial loss to the
Group.
Credit risk management
Objectives in managing risk
The long-term credit strategy is to maintain
the necessary balance between capital
preservation and capital optimisation.
The Group’s pursuit is for quality facilities,
soundly based, with good income returns for
the Group.
Exposure to risk and how it arises
The Group is exposed to credit risk through
granting of credit to clients, which can take
the form of one of many products offered by
the Group, including overdrafts, installment
sale facilities, home loans, commercial loans,
micro loans, letters of guarantee and certain
foreign exchange products such as letters of
credit and foreign exchange contracts.
As a result credit risk is managed within the
overall risk management framework of the
Group due to the importance thereof.

27
Corporate Governance Report (cont)
FINANCIAL RISK MANAGEMENT (cont)
Credit Risk (cont)
Credit risk management (cont)
Concentration of credit
The Group seeks to avoid significant
exposures in areas (of whatever nature)
which are inherently fraught with risk or
very sensitive to, for example, changes in
economy, politics, legislation, demographics,
climate, etc. Internal limits are set to limit
the Group’s exposure to concentration risk.
As a benchmark, the exposure to any one
specific industry should not exceed 20% of
the total lending book and in line with Bank
of Namibia regulations exposure to a single
client or a group of associated companies
should not exceed 30% of the Group’s
qualifying capital and the aggregate of
all large exposures (i.e. an exposure which
individually equals or exceeds 10% of the
Group’s qualifying capital) shall not exceed
800% of the Group’s qualifying capital.
Methods used to measure risk
Credit risk is measured during the credit
granting process by risk rating the potential
client in terms of the Group’s risk rating
criteria to enable the identification of a
realistic risk level at all times. The Group’s
policy requires that all obligators are rated
at inception, and re-rated once annually
thereafter. Currently the existing risk rating
model is based on the Moody’s model for
Business and Corporate Banking clients.
Mandates and authority levels
A mandate structure is in place with delegated
levels of lending authority. All facilities,
irrespective of amount, fall under the control
of the Group’s Credit committee. Maximum
levels of lending authority have been set for the
credit department and the Credit committee,
subject to risk rating, and with specific limits
for certain industries and product types.
Applications in excess of lending authorities are
referred to the next higher level for approval,
with excesses of the Credit committee being
referred to the Africa Credit Risk Monitoring
Committee (“AFCRAM”) for approval.
Monitoring
The Group has adequate systems of controls
in place for the monitoring of facilities. Diary
systems, which are monitored at a suitable
senior level, are in place in order to manage
the expiry of limits, revaluation of collateral,
continual review of risk categories, periodic
review of the terms and conditions of
approval, identification of any irregularities
in conduct of the account or utilisation of
the facility, monitoring systems of daily
usage and any other key events requiring
monitoring. Regular internal audits are
carried out to ensure the application of sound
lending principles as well as the adequate
administration of security documents and
key credit information.
Liquidity Risk
Liquidity risk is the risk that an entity will
encounter difficulty in meeting obligations
associated with financial liabilities.
Liquidityriskmanagement
The liquidity of the Group is subject to
the mix and liquidity preferences of both
borrowers and depositors as well as the
structure of the market in which the Group
operates. In most instances a Bank acts as a
liquidity transformer between the liquidity
needs of the borrowers and depositors.
The final responsibility for the management
of liquidity risk rests with the board of
directors who has delegated the day-to-
day accountability to the Asset and Liability
committee (“Alco”). Alco is responsible
for ensuring that the necessary policies,
frameworks and processes and procedures
to manage liquidity risk within the Group
are developed and implemented. It is also
responsible for monitoring the Group’s
compliance with the policy as well as the
agreed risk limits. Alco reports, as a sub-
committee of the Executive committee,
to the Risk committee. The board’s
responsibility with regards to adequate
liquidity management includes:
• the development and implementation
of a liquidity management policy that
clearly establishes the responsibilities
for managing liquidity;
• a comprehensive set of liquidity limits
that define acceptable levels of cash
outflow; and
• a liquidity contingency plan and
compliance with local legislation and
liquidity requirements.
Liquidity risk is measured using liquidity risk
gaps. A liquidity risk gap is generated using
the contractual cash in- and outflows for
each balance sheet item and placing these

28
flows into designated time buckets. The
contractual cash flows are then subjected to
behavioural adjustments dependant on the
liquidity risk scenario being modelled. The
liquidity risk gap is calculated by deducting
cash outflows from cash inflows in each
bucket and then calculating the cumulative
cash outflow. For liquidity risk management
purposes the liquidity gaps are calculated
using a sight to one week bucket and
monthly buckets from 1 to 12 months.
The Group’s liquidity risk management is
based on the following principles:
• management of cash flows, especially
in the sight to three month horizon;
• diversification of the depositor base;
and
• maintaining a stock of surplus liquefiable
assets.
Liquidity risk limits defines a set of cash
outflow limits for their cumulative net
cash flows in the sight to one week and
sight to one month buckets. Furthermore
the limits are set to prevent concentration
of deposits by customer. The liquidity risk
limits are approved by Alco and submitted
to the board for ratification. By monitoring
the maturity profile of the current balance
sheet as well as its expected future structure
Alco is proactively monitoring this risk and
is able to manage any potential mismatches
in accordance with best banking practice.
The Group manages its liquidity by
managing the liquidity of those components
of the balance sheet over which it has direct
control. The controllable components
consist of:
In the shorter term:
• the size and composition of the liquid
asset and prudential asset portfolios;
• the size and maturity structure of the
professional funding portfolio; and
• maintaining an effective liquidity buffer
consisting of high quality liquefiable
money market instruments.
In the medium term:
• by encouraging business units to broaden
the depositor base (especially retail type
deposits) and to increase the Group’s
share of transactional banking balances
(current and savings accounts).
In the longer term:
• the management of its operations
generally to ensure that there are no
unexpected large losses which could
give rise to liquidity stress;
• ongoing management of relationships
with major sources of liquidity;
• only accepting a prudent level of risk
and neutralising all excess risks in all
portfolios where possible;
• diversification of the depositor base
wherever possible; and
• developing the Group’s franchise to
improve both its reputation and
customer spread.
A comprehensive liquidity risk management
reporting system is in place which includes:
• daily reporting to executive and senior
management of the Group’s liquidity
risk position as well as reasons for any
significant changes in the liquidity risk
position;
• ongoing monthly reporting of the
liquidity risk and funding structure of
the Group including significant shifts
in the liquidity risk and explanations
thereof; and
• analysis of the long-term changes in
the liquidity risk and funding structure
of the Group with explanations and
plans to rectify any adverse change in
the composition of deposits.
The Group furthermore reports to Nedbank
Group Limited Alco on a monthly basis
the liquidity risk limit utilisation and an
assessment of the liquidity risk conditions.
The Bank of Namibia via a determination
requires the Group to maintain a statutory
liquidity based on liabilities to the public
reduced by monies on lent to other Namibian
banks. A portion of this buffer takes the
form of an interest free deposit with the
Bank of Namibia. To accommodate daily
liquidity flows and in order to participate
at the Bank of Namibia repurchase window,
a surplus buffer stock position of Namibian
government gilts is held. This also supports
the intra-day clearing requirements of the
National Payment System.
The Group also holds an additional liquidity
buffer at all times. This buffer may take the
form of any combination of the following:
• surplus liquid assets in excess of those
needed for normal intra-day and
statutory requirements;
• loans to other clearing banks in
Namibia;
• any other immediately liquefiable
instrument with the approval of Alco;
and

29
Corporate Governance Report (cont)
FINANCIAL RISK MANAGEMENT (cont)
Liquidity Risk (cont)
Liquidityriskmanagement(cont)
• the liquidity buffer will be reviewed and
confirmed at the monthly Alco meetings.
A liquidity risk contingency plan is in place
which includes procedures to be followed
and communication required when the plan
is triggered.
Market Risk
Market risk is the risk that the fair value or
future cash flows of a financial instrument
will fluctuate because of changes in the
market prices.
Market risk comprises three types of risk:
currency risk, interest rate risk and other
price risk. The Group is exposed to both
currency and interest rate risk.
Interest Rate Risk
Interest rate risk is the risk that the fair value
or future cash flows of a financial instrument
will fluctuate because of changes in market
interest rate.
Interestrateriskmanagement
The Group has identified the following four
sources of interest rate risk to which the
Group is exposed:
Change in the level of interest rates
This is the risk associated with a general
decline or increase in the level of interest
rates. All interest rates will move by
approximately the same amount – the so-
called “parallel shift” in interest rates.
Change in the slope of the yield curve
Under this risk there is a change in a certain
class of interest rates. For example all
short-term rates might change without any
change to long-term rates.
Basis or margin risk
This is the risk that interest rates with the
same or similar tenors do not move by the
same amount. An example would be a
change in short-term interest rates but no
change in the prime rate.
Embedded customer optionality in products
Under this risk the customer may have an
early termination option on a fixed rate
contract. The Group may be unable to
recover any penalty or the penalty is small
compared to the loss suffered should the
option be exercised. For example retail-
lending contracts are subject to the Credit
Agreements Act, which under certain
circumstances prevents the Group from
applying an early termination penalty.
Interest rate risks are measured using the
following two methodologies:
Interest rate re-pricing gap
All assets, liabilities and off-balance
sheet items at the measurement date are
analysed into predefined time buckets. The
bucket selected is the earlier of the maturity
or next re-pricing date for each item. A net
re-pricing balance (gap) for each bucket is
calculated as well as cumulative re-pricing
balances (cumulative gap). Limits on the
quantum of mismatch in a bucket are set to
manage the interest rate risk of the balance
sheet, in particular a cumulative limit for the
0 to 3 month bucket.
Sensitivity of forecast earnings to interest
rate shocks
Earnings for the next twelve months are
projected using a ‘base case’ interest rate
scenario. The earnings for the same period
are recalculated but with all interest rates
shocked by a standard 100 basis point (“bp”)
parallel increase in the yield curve and all
other rates. In addition other scenarios of
a 50bp increase at all durations on the yield
curve (3 months, 6 months, 12 months,
longer than 12 months) are undertaken.
The difference between the earnings figures
of the ‘base case’ and each shock scenario
is the earnings sensitivity to the selected
interest rate shock.
Interest rate risk management entails
identifying and quantifying the sensitivity
of the Group’s income to each of these
sources of risk. After the interest rate risks
have been quantified, strategies to manage
or immunise the Group from these risks are
implemented.
The final responsibility for the management
of interest rate risk rests with the board of
directors who has delegated the day-to-day
accountability to Alco. Alco is responsible
for ensuring that the necessary policies,

30
frameworks and processes and procedures
to manage interest rate risk within the
Group are developed and implemented. It is
also responsible for monitoring the Group’s
compliance with the policy as well as the
agreed risk limits. Alco, as a sub-committee
of the Executive committee, reports to the
Risk committee. The board’s responsibility
with regards to adequate interest rate risk
management includes the development
and implementation of an interest rate
management policy that clearly establishes
the responsibilities for managing interest
rate risk and complies with local legislation
and liquidity requirements.
Alco, as a sub-committee of the Executive
committee, reports on the Group’s interest
rate risk management. The report includes
current exposure to interest rate changes,
high-level strategies adopted to hedge
interest rate risk, major assumptions used
to derive the interest rate risk and major
process and policy issues or shortcomings
and plans for their elimination.
Alco is responsible for implementing this
framework throughout Nedbank Namibia
and for ensuring compliance by all operating
units with the limits and other provisions of
this framework.
Interest rate risk is assessed through the use
of traditional gap analysis techniques. Gap
analysis measures the volumes of assets and
liabilities subject to repricing within a given
period. For this purpose assets and liabilities
are classified according to their contractual
repricing characteristics. Through the use of
balance sheet stress testing and net interest
income scenarios the impact of interest rate
movements and risk concentrations can be
identified and measured. Strategies are then
developed for mitigating such risks.
Net Interest Margin (‘NIM’) is split into the
following components, each of which should
be separately managed and reported:
• Lending spread comprising the
difference between the incremental
cost of funds and the interest rate
earned on interest paying balances;
• Funding spread comprising the
difference between the interest rates
paid on liability balances and the
incremental cost of funds;
• Endowment spread comprising the
net interest paid or received at the
incremental cost of funds rate on the
net assets or liabilities not earning or
paying interest; and
• Mismatch spread being the difference
between the incremental cost of
funds on lending transactions and the
incremental cost of funds on deposits
raised and adjusted for strategies that
have been implemented.
The business units responsible for originating
transactions manage the lending, funding
and endowment spread. Staff having the
required skills and access to the necessary
resources analyse, report and manage
mismatch spread. All new products launched
by the Group are subject to an approval
process in order to ensure that the interest
rate risk has been correctly identified and
is being properly managed. No fixed rate
lending is performed unless it is fully hedged.
Maximum exposures to interest rate risk are
monitored by setting interest rate risk limits,
within which the Group must operate. Limits
are set for the net interest income impact of
parallel changes in interest rates, changes
in yield curve and basis risk. Reviewing
of interest rate risk limits are undertaken
periodically.
Currency Risk
Currency risk is the risk that the fair value or
future cash flows of a financial instrument
will fluctuate because of changes in the
foreign exchange rates.
Currencyriskmanagement
The Group undertakes a wide variety
of transactions denominated in foreign
currency resulting in exposure to exchange
rate fluctuations. Transactions that result in
currency risk include among others foreign
exchange cash dealing, proprietary trading
by foreign exchange dealers on the Bank’s
own account, transactions with foreign
banks, transactions on customer accounts
denominated in foreign currency and
forward exchange contracts. The revaluation
of asset or liability balances denominated
in foreign currencies at day end (referred
to as the net open position) also results in
exposure to changes in foreign exchange
rates. The main currencies to which the
Group is exposed are US Dollar, Euro and
British Pound.
Exposure to currency risk is measured as
follows:
• Intraday position, being the foreign
exchange risk exposure, in either single
currency or as a sum of all currencies,
which the Group incurs between the
opening and closing of business on the
same day; and

31
Corporate Governance Report (cont)
FINANCIAL RISK MANAGEMENT (cont)
Currency Risk (cont)
Currencyriskmanagement(cont)
• Net open position, being the net
balance between assets and liabilities
held in a foreign currency at close of
business each day.
The final responsibility for the management
of currency risk rests with the board
of directors who has delegated the
accountability to Alco. Alco has in turn
delegated the day-to-day accountability to
the Treasury department. Alco is responsible
for ensuring that the necessary policies,
frameworks, processes and procedures to
manage currency risk within the Group
are developed and implemented and that
the Group complies with local legislation
and regulations. It is also responsible for
monitoring the Group’s compliance with
the policy as well as the agreed risk limits.
Alco, as a sub-committee of the Executive
committee, reports to the Risk committee.
Exposure to currency risk is managed
through the setting of exposure limits
and monitoring of compliance to the set
exposure limits. These limits include:
Aggregate net open position limits
The aggregate net open spot position is
managed and monitored not to exceed
the limits as determined by the Bank of
Namibia regulations. These limits are set
not to expose the Group to single currency
risk in major currencies (US Dollar, Euro and
British Pound) exceeding 10% of capital
and reserves, single currency risk on other
currencies in excess of 5% of capital and
reserves and for overall foreign exchange
exposure, not to exceed 20% of the Bank’s
capital and reserves.
Limits on aggregate dealings with
counterparties
A limit has been set per counterparty and
dealers monitor exposure daily to ensure
that aggregate deals with a counterparty
does not exceed the set limit.
Limits on single day delivery by
counterparty
A limit is set and monitored for the
aggregate limit per counterparty which may
be utilised for a single day delivery.
Trading limits for dealers
The Executive: Treasury assigns a limit for
trading to each dealer authorised to deal in
foreign exchange. Dealers are only allowed
to trade with approved counterparty banks
and in amounts not exceeding the limits set
per counterparty and per currency.
Stop loss limits
Dealers leave a stop loss order for any open
position exceeding a set limit, thereby
limiting the potential losses from foreign
exchange rate fluctuations. Stop loss limits
are set for both the net open position at
close of each business day and for any intra-
day open position.
Dealers are only allowed to trade with
approved counterparty banks and in
amounts not exceeding the limits set per
counterparty and per currency.
DEFINITIONS OF OTHER SIGNIFICANT RISKS
Solvency Risk
Solvency risk is defined as the inability of
the Group to honour its debts in full. The
board and management, as well as banking
regulators, monitor this risk through the
assessment of the Bank’s capital adequacy.
The internal requirements of the Bank are
substantially more conservative than those
imposed by the regulatory authorities.
Operational Risk
Operational risk is the risk of direct or
indirect loss resulting from inadequate
or failed internal processes, people and
systems or from external events. Effective
operational risk management enhances
and protects shareholder value, specifically
against unexpected or unwanted events. The
management of operational risk is based on
a system of internal controls. This system
includes a documented organisational
structure, with policies, procedures and
reasonable segregation of duties that are
communicated throughout the Bank.
The corporate governance framework for
operational risk management includes
monitoring bodies such as the Audit
committees, the Internal Audit department,
the Risk committee as well as the Erco.
Operational risk is reported to the board
of directors via the Risk committee. Line

32
management is responsible for the day-to-
day management of individual operational
risks and holds collective responsibility for
all aspects of risk management, including
operational risk.
The internal controls in place are designed
to provide assurance that transactions,
records and management information are
complete, valid and accurate, and that
business objectives will be achieved.
Internal audit independently and continuously
monitors the adequacy, appropriateness and
effectiveness of these internal controls and
reports its findings to management and the
Audit committees.
Information Technology Risk
Information technology risk is the risk resulting
from system malfunction and unavailability,
security breaches and inadequate systems
investment, development, implementation,
support and capacity.
Accounting and Taxation Risk
Accounting risk is the risk that the integrity
of the financial statements and related
information cannot be upheld and that the
internal financial controls of accounting and
administration do not provide reasonable
assurance that assets are safeguarded and
that transactions are executed and recorded
in accordance with generally accepted
business practices and approved policies and
procedures.
Taxation risk is the risk that effective tax
planning, co-ordination and strategy,
compliance with tax laws and regulations,
proactive identification and management
of taxation risks are not enforced or a poor
relationship with revenue authorities exists,
resulting in financial loss due to excessive
tax liabilities, penalties or reputational
damage to the Group.
People Risk
People risk can be defined as possible
inadequacies in human capital. This may
stem from lack of adequate skills or
knowledge, lack of clear consequences of
not meeting performance standards, lack of
alignment with strategy or a reward system
that fails to motivate properly.
Policies for the development of human
capital are in place to ensure that the
required skills and experience are developed,
consistently and methodically retained and
enhanced to create value for the Group.
Reputational Risk
Reputational risk can be defined as the
risk that an activity, action or stance taken
by the Group or its officials will impair its
image in the community and the long-
term trust placed in the organisation by its
stakeholders, which will result in the loss of
business and/or threaten legal action.
CREDIT RISK MONITORING COMMITTEE (“MONITORING CRAM”)
The monitoring CRAM supports the Risk
committee in executing its responsibility.
The committee affords the opportunity to
monitor the efficiency of credit risk and
operational issues impacting on credit
risk on an in-depth level with reference
to accounts and units contributing on the
80/20-contribution principle to credit risk.
The committee also serves as a forum to
improve operational credit risk processes
and procedures in the Bank. The monitoring
CRAM is presently chaired by the chief risk
officer of Nedbank Africa and has a dual
reporting line into the Africa Credit committee
and the Risk committee, respectively.
ASSET AND LIABILITY MANAGEMENT
The primary objective of the Alco is to
ensure that the impact of the following risks,
including the impact of changes in either or
both the level of the market factors and/or
the volatility of the market factors are being
effectively managed in the Group:
• liquidity risk;
• interest rate risk both local and foreign;
• foreign exchange rate risk including
currency translation risk;
• trading market risk;
• investment risk; and
• capital risk.
Alco meets monthly, or more frequently
if necessary. The committee is chaired
by the managing director and reports to
the Executive committee and via the Risk
committee to the Bank’s board.
GOVERNANCE AND COMPLIANCE FUNCTION
In tandem with management of governance
issues, the compliance function ensures
compliance not only with regulatory laws
and standards, but also with internal policies.

33
Corporate Governance Report (cont)
GOVERNANCE AND COMPLIANCE FUNCTION (cont)
A strong network of business unit and branch
compliance champions work closely with the
Governance and Compliance department in
training, project implementation, monitoring
and the creation of an appropriate governance
and compliance culture.
The governance and compliance function is an
essential part of the Bank’s control structure,
having responsibility for the management of
regulatory and reputational risk.
The Governance and Compliance department
works closely with the company secretary
and various risk management functions in
promoting a culture of good governance
and compliance within the Bank.
The department’s key objectives are to:
• provide an independent assurance
function with regard to governance
and compliance issues to the board,
executive committee and the banking
business;
• implement and monitor good business
governance practices throughout the
organisation;
• internalise a culture of governance,
ethics and compliance through ongoing
training and development;
• set governance and compliance
frameworks that will be aligned with
applicable regulations and local and
international best practice;
• build and enhance relationships with
key internal partners (Risk, Internal
Audit, Legal, Company Secretariat, and
especially business unit and branch
compliance champions) and external
stakeholders; and
• inform the business of new and existing
regulatory requirements.
Compliance
Compliance risk is the potential that the
procedures implemented by the Bank to
ensure compliance with relevant statutory,
regulatory and supervisory requirements are
not adhered to and/or are inefficient and
ineffective.
The Bank is committed and requires all its
employees to display the highest standards
of integrity, professionalism and ethical
behaviour, and to comply with all relevant
laws, rules and standards when conducting
the business of the Bank.
The Bank’s compliance function is an
independent function that identifies,
evaluates, advises on, monitors and reports
on the Bank’s compliance risk. The Bank’s
compliance methodology is adapted from
the guidelines of the Compliance Institute
of South Africa as well as international best
practices.
The compliance function is assisted by
dedicated business unit and branch compliance
champions, who although not qualified
compliance officers, are staff members
located in the different business units
and/or branches to monitor and report on
compliance risk. The compliance function
is further assisted by other legal and risk
functions in the Bank. The governance and
compliance function assists all business
unit- and branch compliance champions
in the management of compliance risk, by
providing each of the Champions with the
following:
(i) a mandate: The mandate sets out the
reporting lines, responsibilities and
functions, authority and management
of divisional and branch compliance
meetings and reporting format and
obligations;
(ii) a business unit- and branch
compliance champions’ toolkit and
template for minutes of divisional/
branch meetings: The toolkit is
aligned with the reporting format
and requirements of the compliance
officers. The toolkit is utilised by all
champions to convene quarterly/
monthly divisional/branch compliance
meetings and escalate compliance
issues to the Compliance committee
on a quarterly basis;
(iii) a governance and compliance manual:
The manual sets out the complete
governance and compliance structure,
policy, procedures, purpose and
philosophy;
(iv) the compliance risk universe
of statutory requirements and
compliance risk rating methodology:
This spreadsheet serves to allocate
responsibility for compliance with
statutory requirements and enhance
awareness of statutory and regulatory
requirements; and
(v) an alphabetical list of acts and bills
applicable to Nedbank Namibia:
These lists serve to enhance awareness
of statutory requirements applicable
to the Bank.

34
These tools are increasingly integrated
into the Bank’s operating systems. The
Bank’s relationships with regulators are of
paramount importance, specifically the
relationship with the Bank supervision
department of the Bank of Namibia and
the South African Reserve Bank. The Bank
follows a policy of constructive engagement
with regulators.
The Bank manages compliance risk through
the following key activities:
• creating awareness through the training
of employees and other affected stake-
holders on the impact and responsibilities
related to legislative requirements;
• monitoring and reporting on the level of
compliance with legislative requirements;
• providing assurance that the risks
relating to regulatory requirements are
identified, understood and effectively
managed; and
• consulting with the business units and
providing compliance opinions with regard
to new business ventures and processes.
THE NEW BASEL CAPITAL ACCORD (“BASEL II”)
The new Basel II regulations aim to improve
the safety and soundness of the financial
system by aligning capital adequacy
assessment much more closely with the
underlying risks (and introducing a capital
charge for operational risk) in the banking
industry, providing a thorough supervisory
review process and enhancing market
discipline through significantly increased
risk disclosure.
Nedbank Namibia will apply the standardised
approach for both credit- and operational
risks. Compliance with reporting on these
formats will be effective 1 January 2008
with respect to the South African Reserve
Bank and 1 January 2009 with respect to
the Bank of Namibia.
SCHEDULE OF DELEGATED AUTHORITIES (“SODA”)
A schedule of delegated authorities, setting
out the mandates, powers and authority
levels that apply to the various decision
making bodies and officers who are
responsible for governance and management
of the Bank, is in place.
The board subscribes to the ‘four eye’
principle of management, in terms of which
no individual officer of the Bank (including
the managing director) acting alone, is
empowered to bind the Bank in relation to
material matters.
REMUNERATION, NOMINATION, EQUITY AND SKILLS RETENTION COMMITTEE
The committee operates in terms of a
mandate approved by the board and its
primary objectives are to ensure that:
• an environment is created and a human
resources philosophy maintained that
attract, retain, motivate and reward
staff to successfully implement the
Bank’s strategy and achieve the Group’s
objectives; and
• a competitive human resources strategy
is developed and implemented,
to comply with the guidelines provided
by the equity commissioner as well as
affirmative action initiatives, to support
superior business performance.
The committee comprises four non-
executive directors, one of whom is the
chairman. The managing director is not a
member of the committee, but attends all
meetings by invitation.
DIRECTORS’ AFFAIRS COMMITTEE
The primary objective of the committee is to
assist the board with its corporate governance
and related responsibilities and to deal with
directors’ affairs, i.e. the composition of the
board, the nomination of new directors,
directors’ fees, board evaluation, board
training, directors’ outside interests, etc. The
committee has no decision-making powers
but makes recommendations to the board
for approval. The committee comprises four
non-executive directors, one of whom is the
chairman.
MANAGEMENT COMMITTEES
Executive Committee (“Exco”)
The Exco comprises ten members and its
primary objective is to assist the managing
director in managing the business of the Bank
and to implement strategies approved by the
board. Exco is a management committee
and is chaired by the managing director.
The Bank’s board of directors appoints Exco
members in conjunction with the managing
director. Exco meets monthly but additional
meetings may be held when necessary.

35
Corporate Governance Report (cont)
MANAGEMENT COMMITTEES (cont)
Operational Committee (“Opco”)
The Opco has been established to create a
forum at which operational issues can be
discussed. Important operational matters are
channelled to the Exco for decision making.
The chief operating officer is the chairman of
the Opco, which meets monthly.
Distribution Committee
The primary objective of the Distribution
committee is to manage the Bank’s footprint
in terms of where it wants to be and to review
where it currently is, including geomapping,
leases and lease renewals.
Pricing Committee
The primary objective of the Pricing
committee is to assist the Exco in discharging
its responsibility to ensure that the Bank’s
pricing of the various components of non-
interest revenue are set in an objective,
disciplined and co-ordinated manner and
that they are properly implemented in
terms of systems changes, communication to
clients, timing and appropriately aligned to the
Bank’s strategy and budget imperatives. The
Pricing committee is accountable to the Exco.
Social Investment Committee
The Social Investment committee comprises
seven members. Its primary objective is
to manage the Bank’s corporate social
investment initiatives aimed at building
sustainable development in the fields of
entrepreneurship, education and health.
The committee is a management committee
and reports via the Exco to the board of
directors.
Compliance Committee
The Compliance committee is accountable
to the board, through the Erco committee,
which serves as a common platform for
the identifying, discussing, managing and
effectively monitoring all compliance risks
throughout the Bank.
Product Committee
The purpose of this committee is to
ensure, without unduly stifling innovation
and creativity, that the implementation
of new business initiatives by the Bank is
managed in a disciplined fashion so that all
significant risks are addressed prior to the
implementation thereof.
EMPLOYMENT EQUITY
The Bank has adopted an affirmative action
policy to achieve employment equity in the
workplace and to enhance competitiveness.
It is a carefully planned, managed and
monitored process, incorporating strategies
aimed at transforming the employment
environment within the Bank. These
mechanisms provide for the recruitment,
development and promotion of competent
individuals, especially those from previously
disadvantaged groups, to allow them to
gain access to opportunities based on their
suitability, while ensuring the maintenance
of core standards within the organisation. A
management committee has been established
to deal with employment equity matters.
CODE OF ETHICS
The Group is committed to organisational
integrity and high standards of ethical
behaviour in its dealings with all the Group’s
stakeholders. The board has approved the
code of ethics, focusing on internal behaviour
of staff. Training and awareness on the
code is ongoing. Failure to maintain ethical
standards may result in disciplinary action.
The board of directors is confident that
high ethical standards are maintained in
the Group and that business is conducted
in a manner, which, under all reasonable
circumstances, is beyond reproach.
CONFLICTS OF INTEREST
A policy for conflicts of interest has been
introduced in the Bank and all staff have
disclosed their outside interests and signed
a declaration form, confirming that they
have read and understood the contents of
the policy and that they agree to be bound
by the terms thereof. A structured process is
in place for the consideration and approval
of staff’s outside interests.
GOVERNANCE STRUCTURES WITHIN OTHER OPERATING SUBSIDIARIES
NedLoans (Proprietary) Limited (“NedLoans”)
NedLoans, an 80% subsidiary of Nedbank
Namibia, has established a management
committee comprising of only NedLoans
managers, the primary function of which
is to deal with operational issues. The

36
committee meets at least monthly and
the managing director of NedLoans is the
chairman of the committee.
A second management committee,
comprising managers of both NedLoans
and Nedbank Namibia exists to deal with
operational matters of mutual interest.
The committee reports into the Exco of
Nedbank Namibia.
As the Bank’s subsidiary, NedLoan’s internal
control-, risk management- and compliance
environments are monitored by the Bank’s
Audit- and Risk committees, which in turn
report into the Bank’s board of directors.
NedCapital Namibia (Proprietary) Limited (“NedCapital”)
NedCapital, a 100% owned subsidiary
of NedNamibia Holdings, has a matrix
reporting structure, whereby statutory
reporting is done to NedNamibia Holdings,
while Nedbank Capital South Africa
assumes responsibility for the technical
risk and compliance functions. The
NedNamibia Holdings Audit committee
monitors NedCapital’s internal control-, risk
management- and compliance environments
and reports into the NedNamibia Holdings
board of directors. NedCapital’s governance
and control structures are constantly being
refined.
NedCapital has outsourced the following
services to Nedbank Namibia and a service
level agreement between the two companies
is in place:
• Human resources (selected human
resources services);
• Accounting and financial management;
• Communications and marketing;
• Information technology; and
• Company secretarial services.
GOING CONCERN
The directors have no reason to doubt
that the Group has adequate resources to
continue in operational existence for the
foreseeable future. The going-concern basis
in preparing annual financial statements is
therefore considered appropriate.

37
NEDNAMIBIA HOLDINGS LTD BOARDOFDIRECTORS
Chair : T J FrankD Denya C J PearceJ !Gawaxab R H PetersE T Hoveka M K ShipangaS I Kankondi H M Weilert
RISK COMMITTEEChair : C J Pearce
D Denya R H Peters T J Frank H M Weilert
CREDIT RISK MONITORING COMMITTEE (CRAM)Chair : A Sorgdrager
E T Hoveka J Matthews A VenterM Lisse C Aspeling G GoldridgeE Wiss G Marais M Vivier P Gouws U Rapsch A Schunemann
Corporate Governance Report (cont)Corporate Governance Structure as at 29 February 2008
ENTERPRISE - WIDE-RISK COMMITTEE (ERCO)Chair : E T Hoveka
J Matthews M J Vivier G MaraisN Beckmann P Silcock J C JurgensG Goldridge E Haipinge M LisseJ Roets B Kauta M GousA Venter
COMPLIANCE COMMITTEE Chair : M Gous
S Wylie M Meiring Y CampherJ van Rensburg D Arendorf C JansenL Rossouw R Reed P MansE Haipinge P Gabriel R KrugerB Matthee J von Kunow H van WykM Lisse B Kauta C de Wet
OPERATIONAL COMMITTEE (OPCO)
Chair : J MatthewsK S Altmann C Aspeling W Boer A Botes G Brink W S Burger G de Klerk C de Wet F Eliphas P Gabriel M Gous P GouwsE Haihambo N Hamunyela I Hoebel H Hoffmann B Kauta R Keulder N Klazen R Kruger M Lisse P Mans B Matthee M MeiringU Rapsch R Reed E Schlecter A SchunemannD Smit H van Wyk J von Kunow D WaltherE Wiss
ASSET AND LIABILITY COMMITTEE (ALCO)
Chair : E T HovekaJ C Jurgens J Matthews A Venter G Marais M Vivier N BeckmannM Gous
NEDLOANS (PTY) LTD BOARD OF DIRECTORS
Chair : E T HovekaA Venter M D McLeanE N Hamunyela
NEDLOANS (PTY) LTD MANAGEMENT
COMMITTEEChair : E N Hamunyela
J Jacobs I HausesJ Nanyeni E HattinghM de Jager E HaipingeM Vivier M LisseA Venter K S AltmannM Meiring B KautaJ van Rensburg S Nel A de Necker

38
NEDBANKNAMIBIALTDBOARDOFDIRECTORS
Chair : T J FrankD Denya L M Muatunga J !Gawaxab A T M Gebhardt R H Peters C J PearceE T Hoveka M K Shipanga K WhitfieldS I Kankondi H M Weilert
DIRECTORS’ AFFAIRS COMMITTEE
Chair : T J FrankS I Kankondi D Denya H M Weilert
REMUNERATION, NOMINATION, EQUITY AND SKILLS RETENTION
COMMITTEE Chair : T J Frank
D Denya H M WeilertS I Kankondi
AUDIT COMMITTEE Chair : R H Peters
D Denya C J PearceJ !Gawaxab H M Weilert
NEDBANK NAMIBIA LTD EXECUTIVE COMMITTEE (EXCO)
Chair : E T HovekaG Goldridge E Haipinge J C JurgensP Silcock G Marais N BeckmannJ Matthews A Venter M Vivier
CREDIT COMMITTEEChair : A Struchtemeier
E T Hoveka M VivierE Wiss Y CampherN Hayward A VenterM Grobler P GouwsJ Damon H LinderG Marais A Schunemann
OPERATIONAL DISTRIBUTION
COMMITTEEChair : G Goldridge
G Marais A VenterM Vivier H HoffmannI Hoebel M Gous
PRICING COMMITTEEChair : J Matthews
J C Jurgens M VivierG Marais A VenterG Goldridge P SilcockE T Hoveka N Beckmann
SOCIAL INVESTMENT COMMITTEE
Chair : J C Jurgens E T Hoveka J MatthewsA Venter P SilcockE Haipinge G de Klerk
PRODUCT COMMITTEEChair : G Goldridge
J Matthews M VivierG Marais A VenterP Silcock N BeckmannM Lisse G BrinkJ C Jurgens
INFORMATION TECHNOLOGY
COMMITTEEChair : G Goldridge
J Matthews G BrinkA Venter A Hart
CUSTOMER SERVICECOMMITTEE
Chair : M VivierP Silcock G GoldridgeA Venter G Marais
GLOBUS PRIORITISATIONCOMMITTEE
Chair : G GoldridgeJ Matthews G BrinkA Venter J C JurgensM Lisse M VivierG Marais
39
Directors’ Responsibilityfor the year ended 31 December 2007
The directors are responsible for the integrity and fair presentation of the annual financial statements and related information included in this
annual report. The annual financial statements presented on pages 26 to 31 and 43 to 144 have been prepared in accordance with and comply
with International Financial Reporting Standards (“IFRS”) adopted by the International Accounting Standards Board (“IASB”), and interpretations
issued by the International Financial Reporting Interpretations Committee of the IASB and the Namibian Companies Act and include amounts
based on judgements and estimates made by management. The directors have also prepared the other information included in the annual report
and are responsible for both its accuracy and its consistency with the annual financial statements.
To enable the board to discharge its responsibilities management has developed and continues to maintain a system of internal financial control.
The board has ultimate responsibility for this system of internal control and reviews the effectiveness of its operation primarily through the Audit
and Risk Committees and other risk monitoring functions.
The internal financial controls include risk-based systems of accounting and administrative controls designed to provide reasonable, but not
absolute, assurance that assets are safeguarded and that transactions are executed and recorded in accordance with generally accepted business
practices and the Group’s written policies and procedures. These controls are implemented by trained, skilled staff, with clearly defined lines of
accountability and an appropriate segregation of duties. The controls are monitored by management and include a comprehensive budgeting
and reporting system operating within strict deadlines and an appropriate control framework. As part of the system of internal financial control
Nedbank Namibia’s internal audit function conducts operational, financial and specific audits and coordinates audit coverage with the external
auditors.
The annual financial statements have been audited by the independent auditors, Deloitte & Touche, who were given unrestricted access to all
financial records and related data, including minutes of all meetings of shareholders, the board of directors and committees of the board. The
directors believe that all representations made to the independent auditors during the audit are valid and appropriate.
The going-concern basis has been adopted in preparing the financial statements. The directors have no reason to believe that the Group or any
company within the Group will not be a going concern in the foreseeable future, based on forecasts and available cash resources. These annual
financial statements support the viability of the Company and the Group.
The audit report of the independent auditors is presented on page 40.
The annual financial statements were approved and authorised for issue by the board of directors on 20 May 2008 and are signed on its behalf
by:
T J Frank E T Hoveka
Chairman Managing Director

40
Independent Auditor’s Report to the members of NedNamibia Holdings Limited
We have audited the annual financial statements and group annual financial statements of NedNamibia Holdings Limited, which comprise
the report of the directors, the balance sheet and the consolidated balance sheet as at 31 December 2007, and the income statement and the
consolidated income statement, the statement of changes in equity and the consolidated statement of changes in equity, and cash flow statement
and the consolidated cash flow statement for the year then ended, and a summary of significant accounting policies and other explanatory notes,
as set out on pages 26 to 31 (section relating to financial risk management) and 43 to 144.
Directors’ responsibility for the financial statements
The NedNamibia Holdings Limited directors are responsible for the preparation and fair presentation of these financial statements in accordance
with International Financial Reporting Standards and in the manner required by the Companies Act in Namibia. This responsibility includes:
designing, implementing and maintaining internal control relevant to the preparation and fair presentation of financial statements that are
free from material misstatement, whether due to fraud or error; selecting and applying appropriate accounting policies; and making accounting
estimates that are reasonable in the circumstances.
Auditor’s responsibility
Our responsibility is to express an opinion on these financial statements based on our audit. We conducted our audit in accordance with
International Standards on Auditing. Those standards require that we comply with ethical requirements and plan and perform the audit to obtain
reasonable assurance about whether the financial statements are free of material misstatement.
An audit involves performing procedures to obtain audit evidence about the amounts and disclosures in the financial statements. The procedures
selected depend on the auditor’s judgement, including the assessment of the risks of material misstatement of the financial statements, whether due
to fraud or error. In making those risk assessments, the auditor considers internal control relevant to the entity’s preparation and fair presentation
of the financial statements in order to design audit procedures that are appropriate in the circumstances, but not for the purpose of expressing an
opinion on the effectiveness of the entity’s internal control. An audit also includes evaluating the appropriateness of accounting principles used
and reasonableness of accounting estimates made by the directors, as well as evaluating the overall financial statement presentation.
We believe that the audit evidence we have obtained is sufficient and appropriate to provide a basis for our audit opinion.
Opinion
In our opinion, the financial statements present fairly, in all material respects, the financial position of NedNamibia Holdings Limited and its
subsidiaries at 31 December 2007 and their financial performance and their cash flows for the year then ended in accordance with International
Financial Reporting Standards and in the manner required by the Companies Act in Namibia.
Deloitte & Touche
Registered Accountants and Auditors
Chartered Accountants (Namibia)
PerDJCilliers
Partner
Windhoek
20 May 2008

41
2007 2006
Notes N$’000 N$’000
Assets 2 6,211 7,912
Total assets per balance sheet 6,211 7,912
Liabilities 3,4 406 2,894
Actuarial value of policy liabilities 405 889
Current liabilities 1 2,005
Excess of assets over liabilities 5,805 5,018
Analysis of change in excess assets:
Excess assets as at end of reporting year 5,805 5,018
Excess assets as at beginning of reporting year 5,018 5,561
Change in excess assets over the reporting year 787 (543)
This change is due to the following factors:
Investment return on excess assets 441 431
Operating profit 414 1,097
Change in valuation methods or assumptions 5 - -
Taxation (68) (71)
Total earnings 787 1,457
Capital raised - -
Dividends paid - 2,000
Total change in excess assets 787 (543)
Reconciliation to reported earnings:
Total earnings as per the above table 787 1,457
Less: Surplus in life fund - -
Reported earnings in annual financial statements 787 1,457
NOTES
1. FINANCIAL SOUNDNESS BASIS/VALUATION PRINCIPLES
The assets and liabilities of Coversure Limited have been calculated in accordance with the Actuarial Society of South Africa’s guidelines and
in particular PGN103 and PGN104. However, no Capital Adequacy Requirement was calculated as this is not required in terms of Namibian
Law. The Financial Soundness Valuation, stipulated in PGN104, is a gross premium method of valuation. The liability has been based on cash
flow projections, on a per policy basis, using the assumptions contained in note 3 below.
2. VALUATION OF ASSETS
All assets have been taken at balance sheet values as described in the notes to the financial statements.
Statement of Actuarial Value of Assets and Liabilities of Coversure Limitedfor the year ended 31 December 2007

42
3. VALUATION OF POLICY LIABILITIES The valuation of the policy liabilities was conducted on a basis consistent with the valuation of the assets.The assumptions are based on best estimates of the expected experience. The main assumptions, before allowing for prescribed margins (see note 4 below), were as follows:
Investment return 7.25% per annum
Mortality SA85/90 Heavy (ULT) + 50% of AIDS extra mortality (High risk group males with 2 year progression)
Permanent disability CSI skilled lives x 1.25
Dread disease CSI 1997 dread disease x 1.25
Temporary disability CMIR12 inception rates (4 week deferred period) x 0.5, 6 months payment on average
Retrenchment 5% inception rate, 6 months payment on average
Withdrawals
Year 1 = 15%
Year 2 = 10%
Year 3+ = 5%
NAMFISA levy 0.15% of outstanding liability
Taxation 40% investment income is taxed at 35%. All investment income assumed to be taxable
• Negative reserves were eliminated such that no policy was treated as an asset – this is required in terms of Namibian law. However, there were no such negative reserves.• An incurred but not reported reserve of 2/12ths of the annual expected claims was established.• We were advised that the company will be closed to new business and therefore a separate expense reserve was established based on
the expected future expenses and remaining policy term. An expense inflation assumption of 5% p.a. was used. 4. PRESCRIBED MARGINS
Prescribed margins have been allowed for as outlined in the Actuarial Society of South Africa’s guidance note – PGN 104. There were no discretionary margins added.
5. CHANGES IN VALUATION BASISThere were no changes to the valuation assumptions since the previous valuation.
6. REPORT BY THE STATUTORY ACTUARY I hereby certify that:
• the valuation of Coversure Limited as at 31 December 2007, the results of which are summarised above, has been conducted in accordance with, and this statutory actuary’s report has been produced in accordance with, applicable Actuarial Society of South Africa Professional Guidance Notes;
• I have accepted that the annual financial statements comply with the requirements of the Namibian Companies Act and the Long-Term Insurance Act;
• my statutory actuary’s report, read together with the annual financial statements, fairly presents the financial position of the company; and• the company was financially sound as at the valuation date, and in my opinion is likely to remain financially sound for the foreseeable
future.
RD WILLIAMSStatutory Actuary Fellow of the Institute of ActuariesFellow of the Actuarial Society of South Africa24 January 2008

43
Report of the Directorsfor the year ended 31 December 2007
The directors have pleasure in submitting their report together with the annual financial statements of NedNamibia Holdings Limited and its
subsidiaries for the year ended 31 December 2007.
NATURE OF THE BUSINESSNedNamibia Holdings is a registered holding company that, through its subsidiaries, provides a wide range of financial services, including corporate
and retail banking, property and asset finance, private banking, micro lending, insurance and foreign exchange and securities trading. The Group’s
head office is in Windhoek and its operations are confined to Namibia.
HOLDING COMPANYThe holding company of NedNamibia Holdings is Nedbank Group Limited, a South African incorporated company that holds 100% of the issued
ordinary shares, and its ultimate controlling shareholder is Old Mutual plc, incorporated in England and Wales.
The group structure of NedNamibia Holdings is set out on page 3 of this report.
RESULTS FOR THE YEAR The financial results of the Company and the Group are fully set out in the annual financial statements.
The net income after taxation for the Group for the year amounted to N$83,7 million, compared with N$40,2 million for the previous year. Total
assets of the Group increased by 14,89% from N$4 756,8 million to N$5 465,1 million.
SHARE CAPITALAs a result of the successful implementation of a Scheme of Arrangement between Nedbank Group Limited and the minority shareholders,
the Company’s shareholding structure was reorganised into a unitary structure and Nedbank Group Limited became the sole shareholder of
NedNamibia Holdings.
NedNamibia Holdings has an authorised share capital of 80 000 000 ordinary shares of 25 cents each. The Company’s issued share capital
comprises 70 381 644 ordinary shares.
The shareholders have placed the unissued share capital of 9 618 356 ordinary shares under the control of the directors until the next annual
general meeting.
SPECIAL RESOLUTIONSNo special resolutions were passed during the year under review.
DIVIDENDSThe board resolved not to declare a dividend for the 2007 financial year (2006: nil).
ACCOUNTING TREATMENT OF LOANS AND ADVANCESThe accounting treatment of loans and advances disclosed in the annual financial statements complies with IFRS. The impairment determined
in compliance with the requirements of BID-2 (Determinations on the Classification of Loans and the Suspension of Interest on Non-Performing
Loans and the Provisions for Bad and Doubtful Debts) issued pursuant to Section 71(3) of the Banking Institutions Act, 1998 is recorded in the
returns to the Bank of Namibia. The excess impairment determined in compliance with BID-2 over the impairment determined based on IFRS is
recorded as a general risk reserve in the annual financial statements.

44
BOARD OF DIRECTORS AND SECRETARYMr William E Turton, who remained the managing director of both NedNamibia Holdings and Nedbank Namibia during the year under review
has tendered his resignation, which became effective 31 December 2007. Mr Erastus Hoveka succeeded Mr Turton as managing director of both
companies with effect from 1 January 2008, after having been appointed as deputy managing director of Nedbank Namibia on 1 April 2007.
Mr Mark R Weston resigned as director on 3 October 2007.
The following directors who retired by rotation in terms of the Articles of Association, were reappointed as directors on 29 June 2007.
Messrs: Theo J Frank
Sebulon I Kankondi
Martin K Shipanga
The following directors who were appointed prior to the annual general meeting, retired in terms of the Articles of Association of the Company and
were reappointed by the shareholders on 29 June 2007.
Messrs: Denys Denya
William E Turton
The Company’s board of directors currently comprises the following members:
Appointed Resigned
Frank Theo J (chairman) 11 February 2005
*Beyers Stanley H 15 November 2007
**Denya Denys 31 October 2006
!Gawaxab Johannes 11 February 2005
Hoveka Erastus T (managing director) 1 January 2008
Kankondi Sebulon I 11 February 2005
Turton William E (managing director) 1 July 2006 31 December 2007
***Pearce Christopher J 23 March 2000
****Peters Rolf H 11 February 2005
Shipanga Martin K 1 January 2004
***Weilert Heinz M 23 May 2006
*****Weston Mark R 13 May 2004 3 October 2007
* Alternate director to Denys Denya
** Zimbabwean
***South African
****German
*****New Zealander
The board conveys its appreciation to Messrs Turton and Weston for the valuable services rendered during their terms of office.

45
Report of the Directors (cont)for the year ended 31 December 2007
SECRETARY AND REGISTERED OFFICE
The secretary of the Company is Mrs Mechthild Meiring, whose business address as well as that of the registered office is 12-20 Dr Frans Indongo
Street, Windhoek. The postal address of the registered office is P O Box 1, Windhoek, and the Company’s registration number is 91/075.
TRANSFER SECRETARIES
Transfer Secretaries (Proprietary) Limited will remain the Company’s transfer secretaries until such time that most of the minority shareholders
have surrendered their original documents of title as defined in the Scheme of Arrangement that was concluded between Nedbank Group Limited
and the minority shareholders. Their business address is Shop 8, Kaiserkrone Centre, Post Street Mall, Windhoek, Namibia, P O Box 2401, Windhoek,
Namibia.
INTEREST OF DIRECTORS IN THE CAPITAL OF THE COMPANY
The successful implementation of the Scheme of Arrangement between Nedbank Group Limited and the minority shareholders resulted in Nedbank
Group Limited’s acquisition of the minority shareholders’ 6.11% shareholding in NedNamibia Holdings and consequently no directors having an
interest in the share capital of the Company.
INTEREST OF DIRECTORS IN CONTRACTS
Nedbank Namibia is presently leasing the premises on which the Oshikango and Outapi branches are located from Tusk Investments (Proprietary)
Limited. The sole shareholder of Tusk Investments (Proprietary) Limited is the M&N Shipanga Family Trust, of which Mr Martin Shipanga, a director
of Nedbank Namibia and of the Tusk Investments (Proprietary) Limited, is a trustee/beneficiary. Mr Shipanga has declared his interest in Tusk
Investments (Proprietary) Limited to the board of directors.

46
SUBSIDIARIES
NedNamibia Holdings has the following directly held subsidiaries:
NAME OF SUBSIDIARY TYPE OF BUSINESS ISSUED SHARE CAPITAL PROPORTION HELD
Nedbank Namibia Limited Commercial banking 67 758 596 ordinary shares 100%
NedCapital Namibia (Proprietary) Limited Specialised finance service 8 000 ordinary shares 100%
Coversure Limited Long-term insurance 4 000 000 ordinary shares 100%
NedPlan Insurance Brokers Namibia (Proprietary) Limited Insurance broker 100 ordinary shares 100%
Bellissima Investments Seventy Two (Proprietary) Limited Property holding company 100 ordinary shares 100%
More details on direct and indirect subsidiaries of the Group are set out in note 10 of the annual financial statements.
POST BALANCE SHEET EVENTS
The directors are not aware of any material post-balance sheet events that have occurred.
APPRECIATION
The board of directors extends its sincere appreciation to all the employees and esteemed clients of the Group and the Company for their loyalty
and continued support.
Its appreciation is also extended to the Ministry of Finance, the Bank of Namibia, the local authorities, the Namibia Financial Institutions Supervisory
Authority (“Namfisa”) and our attorneys and auditors for their assistance and co-operation.

47
Balance Sheetsas at 31 December 2007
Group Company
2007 2006 2007 2006
Notes N$’000 N$’000 N$’000 N$’000
ASSETS
Cash and balances with central bank 4 119,234 173,156 - -
Government and public sector securities 5 345,465 285,349 - -
Derivative financial instruments 6 1,668 1,062 - -
Other short-term securities 7 30,163 - - -
Due from other banks 8 403,848 276,285 - -
Loans and advances to customers 9 4,107,381 3,708,392 - -
Investment in subsidiaries, associates and listed investments 10 28,054 20,501 129,642 133,642
Goodwill 11 27,623 27,623 - -
Property and equipment 12 99,538 61,840 - -
Computer software and development cost 13 14,441 13,040 - -
Non-current assets classified as held for sale 14 31,496 21,369 4,000 -
Other assets 15 256,236 168,168 25 2,000
Total assets 5,465,147 4,756,785 133,667 135,642
LIABILITIES
Due to other banks 16 315,940 259,772 8,326 8,035
Other deposits 17 420,820 544,559 - -
Derivative financial instruments 6 901 690 - -
Due to customers 18 4,007,258 3,383,123 - -
Long-term subordinated debt instruments 19 1,487 1,320 - -
Policyholder liabilities under insurance contracts 20 405 889 - -
Deferred taxation 21 86,596 63,000 - -
Provision for post-retirement medical benefits 22 4,987 5,073 - -
Other liabilities 23 149,128 127,182 120 136
Total liabilities 4,987,522 4,385,608 8,446 8,171
SHAREHOLDER’S EQUITY
Share capital 24 17,595 17,595 17,595 17,595
Share premium 24 99,536 99,536 99,536 99,536
General risk reserve 25 23,074 - - -
Revaluation reserve 26 27,888 11,688 - -
Share-based payment reserve 27 17,609 16,735 - -
Available-for-sale reserve 28 5,952 - - -
Retained income 281,014 221,050 8,090 10,340
Shareholder’s interest 472,668 366,604 125,221 127,471
Minority interest 4,957 4,573 - -
Total shareholder’s equity and minority interest 477,625 371,177 125,221 127,471
Total equity and liabilities 5,465,147 4,756,785 133,667 135,642

48
Income Statementsfor the year ended 31 December 2007
Group Company
2007 2006 2007 2006
Notes N$’000 N$’000 N$’000 N$’000
Interest income 605,469 494,570 - -
Interest expense 334,971 251,007 1,358 730
Net interest income / (expense) 29 270,498 243,563 (1,358) (730)
Non-interest income 30 101,210 95,158 - 34,957
Share of profit from associate 10 572 - - -
Total income / (expenses) 372,280 338,721 (1,358) 34,227
Impairment of advances 31 12,124 28,823 - -
Net income / (loss) 360,156 309,898 (1,358) 34,227
Expenses 32 238,338 217,223 892 819
BEE transaction expenses 33 874 28,592 - -
Net income / (loss) before taxation 120,944 64,083 (2,250) 33,408
Taxation 34 37,208 23,930 - -
Net income / (loss) for the year 83,736 40,153 (2,250) 33,408
Attributable to:
Outside shareholders in subsidiaries 1,066 1,260
Equity holders of the parent 82,670 38,893 (2,250) 33,408
83,736 40,153 (2,250) 33,408
Earnings per share (cents) 36 117.46 57.03
Diluted earnings per share (cents) 36 117.46 57.03

49
Statements of Changes in Equityfor the year ended 31 December 2007
Share
capital
Share
premium
General
risk reserve
Revaluation
reserve
Share-based
payment
reserve
Available-for-
sale reserve
Retained
income
Total
shareholder’s
interest
Minority
interest Total
Notes N$’000 N$’000 N$’000 N$’000 N$’000 N$’000 N$’000 N$’000 N$’000 N$’000
GROUP
Balance at 1 January 2006 16,709 68,568 - 12,006 - - 214,784 312,067 4,167 316,234
Net income for the year - - - - - - 38,893 38,893 1,260 40,153
Other movements - - - - - - - - (854) (854)
Capitalisation award 886 30,968 - - - - (32,945) (1,091) - (1,091)
Share-based payment reserve movement - - - - 16,735 - - 16,735 - 16,735
Release of revaluation reserve - - - (318) - - 318 - - -
Balance at 31 December 2006 17,595 99,536 - 11,688 16,735 - 221,050 366,604 4,573 371,177
Net income for the year - - - - - - 82,670 82,670 1,066 83,736
Revaluation of property 26 - - - 16,568 - - - 16,568 - 16,568
Increase in general risk reserve 25 - - 23,074 - - - (23,074) - - -
Other movements - - - - - - - - (682) (682)
Disposal of revalued property 26 - - - (49) - - 49 - - -
Share-based payment reserve movement 27 - - - - 874 - - 874 - 874
Gain on available-for-sale investments 28 - - - - - 5,952 - 5,952 - 5,952
Release of revaluation reserve 26 - - - (319) - - 319 - - -
Balanceat31December2007 17,595 99,536 23,074 27,888 17,609 5,952 281,014 472,668 4,957 477,625
COMPANY
Balance at 1 January 2006 16,709 68,568 - - - - 9,877 95,154 - 95,154
Net income for the year - - - - - - 33,408 33,408 - 33,408
Capitalisation award 35 886 30,968 - - - - (32,945) (1,091) - (1,091)
Balance at 31 December 2006 17,595 99,536 - - - - 10,340 127,471 - 127,471
Net loss for the year - - - - - - (2,250) (2,250) - (2,250)
Balanceat31December2007 17,595 99,536 - - - - 8,090 125,221 - 125,221

50
Share
capital
Share
premium
General
risk reserve
Revaluation
reserve
Share-based
payment
reserve
Available-for-
sale reserve
Retained
income
Total
shareholder’s
interest
Minority
interest Total
Notes N$’000 N$’000 N$’000 N$’000 N$’000 N$’000 N$’000 N$’000 N$’000 N$’000
GROUP
Balance at 1 January 2006 16,709 68,568 - 12,006 - - 214,784 312,067 4,167 316,234
Net income for the year - - - - - - 38,893 38,893 1,260 40,153
Other movements - - - - - - - - (854) (854)
Capitalisation award 886 30,968 - - - - (32,945) (1,091) - (1,091)
Share-based payment reserve movement - - - - 16,735 - - 16,735 - 16,735
Release of revaluation reserve - - - (318) - - 318 - - -
Balance at 31 December 2006 17,595 99,536 - 11,688 16,735 - 221,050 366,604 4,573 371,177
Net income for the year - - - - - - 82,670 82,670 1,066 83,736
Revaluation of property 26 - - - 16,568 - - - 16,568 - 16,568
Increase in general risk reserve 25 - - 23,074 - - - (23,074) - - -
Other movements - - - - - - - - (682) (682)
Disposal of revalued property 26 - - - (49) - - 49 - - -
Share-based payment reserve movement 27 - - - - 874 - - 874 - 874
Gain on available-for-sale investments 28 - - - - - 5,952 - 5,952 - 5,952
Release of revaluation reserve 26 - - - (319) - - 319 - - -
Balanceat31December2007 17,595 99,536 23,074 27,888 17,609 5,952 281,014 472,668 4,957 477,625
COMPANY
Balance at 1 January 2006 16,709 68,568 - - - - 9,877 95,154 - 95,154
Net income for the year - - - - - - 33,408 33,408 - 33,408
Capitalisation award 35 886 30,968 - - - - (32,945) (1,091) - (1,091)
Balance at 31 December 2006 17,595 99,536 - - - - 10,340 127,471 - 127,471
Net loss for the year - - - - - - (2,250) (2,250) - (2,250)
Balanceat31December2007 17,595 99,536 - - - - 8,090 125,221 - 125,221

51
Cash Flow Statementsfor the year ended 31 December 2007
Group Company
2007 2006 2007 2006
Notes N$’000 N$’000 N$’000 N$’000
Cash generated by operating activities 37.1 199,453 368,974 - 4,000
Cash received from customers 37.2 705,090 568,927 - 12
Cash paid to customers 37.3 (330,638) (239,572) (1,358) (730)
Cash paid to employees and suppliers (217,721) (127,976) (892) (819)
Dividends received 2,187 4,476 - 2,000
Dividends paid 37.4 (682) (1,909) - (1,091)
Taxation paid 37.5 (24,743) (28,207) - -
Recoveries of loans previously written off 31 8,610 10,634 - -
Cash movements in advances and other accounts (512,350) (149,844) 1,975 (2,000)
Cash movements in operating liabilities 37.6 569,700 332,445 275 6,628
Cash flow to investment activities (125,812) (102,361) - (4,000)
Investment in property, equipment, computer software and
development costs (35,181) (45,054) - -
Proceeds on sale of property and equipment 677 230 - -
Acquisition of subsidiary 10.1 - (4,000) - (4,000)
Outflow on disposal of subsidiary 37.7 - (92) - -
Acquisition of investments in associates (1,029) (16,436) - -
Purchase of non-dealing securities 37.8 (90,279) (37,009) - -
Cash and short-term funds generated 73,641 266,613 - -
Cash and short-term funds at beginning of the year 449,441 182,828 - -
Cash and short-term funds at end of the year 37.9 523,082 449,441 - -

52
Notes to the Annual Financial Statementsfor the year ended 31 December 2007
1. BASIS OF PREPARATION
The consolidated financial statements of NedNamibia Holdings (“the Company”) and its subsidiaries (“the Group”) are prepared in
accordance with and comply with International Financial Reporting Standards (“IFRS”) adopted by the International Accounting Standards
Board (“IASB”), and interpretations issued by the International Financial Reporting Interpretations Committee (“IFRIC”) of the IASB and
the requirements of the Namibian Companies Act and the Namibian Banks Act.
The financial statements are presented in Namibian Dollars (“N$”) and are rounded to the nearest thousand Namibian Dollar. The
financial statements are prepared on the historical cost basis except that the following assets and liabilities are stated at their fair value:
- financial assets and financial liabilities designated at fair value through profit or loss;
- financial assets classified as available-for-sale; and
- owner-occupied properties.
Non-current assets and disposal groups held for sale are stated at the lower of their carrying amount and fair value less costs to sell.
The accounting policies set out below have been applied consistently to all years presented in these financial statements.
Criticalaccountingjudgementsandkeysourcesofestimationuncertainty
In the preparation of the consolidated financial statements the Group has recorded various assets and liabilities on the presumption that
the Group is an ongoing business and as such, certain key sources of estimation have been assumed:
Credit impairment
The Group applies an incurred loss approach to impairment. Impairment losses are incurred only if there is objective evidence of
impairment as a result of one or more past events that have occurred since initial recognition. This necessitates the establishment of
“impairment triggers” on the occurrence of which an impairment loss is recognised.
Credit impairment is based on discounted estimated future cash flows on an asset or group of assets, where such objective evidence of
impairment exists. The discount rate used to calculate the recoverable amount excludes consideration of any anticipated future credit
losses.
The Group has also raised an impairment for incurred but not reported (“IBNR”) losses. The purpose of the IBNR reserve is to allow for
latent losses on a portfolio of loans and advances that have not yet been individually evidenced. Generally, a period of time will elapse
between the incurrence of an impairment event and objective evidence of the impairment becoming evident, which is known as the
“emergence period”. The IBNR reserve is based on the probability that loans that are ostensibly performing at the calculation date are
impaired, and objective evidence of that impairment becomes evident during the emergence period.
Fair value of financial instruments
Directors anticipate that changing one or more of the assumptions used in the determination of fair value of financial instruments to
reasonably possible alternative assumptions will not change the fair value of these financial instruments significantly.

53
Notes to the Annual Financial Statements (cont)for the year ended 31 December 2007
2. ADOPTION OF NEW AND REVISED STANDARDS
Standards and interpretations effective in the current year
In the current year the Group has adopted IFRS 7: Financial Instruments: Disclosures and the consequential amendments to IAS 1:
Presentation of Financial Statements.
The impact of the adoption of IFRS 7 and the changes to IAS 1 has been to expand the disclosures provided in these financial statements
regarding the financial instruments and management of capital of the Group. Comparative figures have been restructured to enhance the
disclosure as required by IFRS 7. No restatements have been effected.
Four interpretations issued by the International Financial Reporting Interpretations Committee are effective for the current year. These are:
- IFRIC 7: Applying the Restatement Approach under IAS 29: Financial Reporting in Hyperinflationary Economies;
- IFRIC 8: Scope of IFRS 2;
- IFRIC 9: Reassessment of Embedded Derivatives; and
- IFRIC 10: Interim Financial Reporting and Impairment.
The adoption of these interpretations has not resulted in any changes in the Group’s accounting policies.
Changes in International Accounting Standards (“IAS”) and IFRS
The following table contains effective dates of IFRS’s and recently revised IAS’s, which have not been early adopted by the Group and that
might affect future financial periods:
New International Financial Reporting StandardsIssued/
revised
Effective for annual
periods beginning on
or after
IFRS 8 Operating Segments 2006 1 January 2009
Amendments to International Financial Reporting Standards
IFRS 2IFRS 2: Share-based Payment – Amendment relating to vesting conditions and
cancellations2008 1 January 2009
IFRS 3
Business Combinations: Comprehensive revision on applying the acquisition method and
consequential amendments to IAS 27: Consolidated and Separate Financial Statements,
IAS 28: Investments in Associates and IAS 31: Interest in Joint Ventures
2008 1 July 2009
Amendments to International Accounting Standards
IAS 1 Presentation of Financial Statements: Comprehensive revision including requiring a
statement of comprehensive income2007 1 January 2009
IAS 1 &
IAS 32
Presentation of Financial Statements: Amendment relating to disclosure of puttable
instruments and obligations arising on liquidation2008 1 January 2009
IAS 23 Borrowing Costs – comprehensive revision to prohibit immediate expensing 2007 1 January 2009
New International Financial Reporting Interpretations Committee Interpretations
IFRIC 12 Service Concession Arrangements 2006 1 January 2008
IFRIC 13 Customer Loyalty Programmes 2007 1 July 2008
IFRIC 14 IAS 19 – The limit on a Defined Benefit Asset, Minimum funding requirements and their
Interaction2007 1 January 2008

54
2. ADOPTION OF NEW AND REVISED STANDARDS (cont)
Changes in International Accounting Standards (“IAS”) and IFRS (cont)
A reliable estimate of the impact of the adoption of the recent amendments for the Group cannot yet be determined. Directors anticipate
that the adoption of the recent standards and interpretations will have no material impact on the financial statements in future periods,
except for disclosure to the annual financial statements.
Early adopted IFRIC
The Group has elected to adopt IFRIC 11, which is detailed in the table below, in advance of its effective date of 1 March 2007. The impact
of the new Interpretation has been to account for share-based transactions in accordance with the requirements of IFRS 2: Share-based
Payment as provided for in these financial statements.
New International Financial Reporting Interpretations Committee InterpretationsIssued/
revised
Effective for annual periods
beginning on or after
IFRIC 11 IFRS 2 – Group and Treasury Share Transactions 2006 1 March 2007
3. SIGNIFICANT ACCOUNTING POLICIES
The following significant accounting policies have been applied consistently in dealing with items that are considered material in relation
to the NedNamibia Holdings financial statements.
3.1 Basis of consolidation
The consolidated annual financial statements incorporate the annual financial statements of the Company and entities controlled by the
Company. Control is achieved where the Group has the power to govern the financial and operating policies of an entity so as to obtain
benefits from its activities. Control is presumed to exist when the Group owns directly or indirectly through its subsidiaries, more than
half of the voting power of an entity, unless, in exceptional circumstances, it can be clearly demonstrated that such ownership does not
constitute control. The Group considers the existence and effect of potential voting rights that are currently exercisable or convertible
when assessing whether it has control. Entities in which the Group holds half or less of the voting rights, but are controlled by the Group
by retaining the majority of risks or benefits, are also included in the consolidated financial statements.
Subsidiary undertakings include special-purpose entities (SPEs) that are created to accomplish a narrow, well-defined objective, and may
take the form of a company, corporation, trust, partnership or unincorporated entity. The assessment of control for SPEs is based on the
substance of the relationship between the Group and the SPE. SPEs in which the Group holds half or less of the voting rights, but which
are controlled by the Group by retaining the majority of risks or benefits, are also included in the Group financial statements
Acquisitions of subsidiaries and businesses are accounted for using the purchase method. The cost of the business combination is measured
as the aggregate of the fair values (at the date of exchange) of assets given, liabilities incurred or assumed, and equity instruments issued
by the Group in exchange for control of the acquiree, plus any costs directly attributable to the business combination. The acquiree’s
identifiable assets, liabilities and contingent liabilities that meet the conditions for recognition under IFRS 3: Business Combinations are
recognised at their fair values at the acquisition date, except for non-current assets (or disposal groups) that are classified as held for sale
in accordance with IFRS 5: Non-current Assets Held for Sale and Discontinued Operations, which are measured at fair value less cost to sell.
Goodwill arising on acquisition is recognised as an asset and initially measured at cost, being the excess of the cost of the business combination
over the Group’s interest in the fair value of the acquiree’s identifiable assets, liabilities and contingent liabilities recognised.

55
3. SIGNIFICANT ACCOUNTING POLICIES (cont)
3.1 Basis of consolidation (cont)
If, after reassessment, the Group’s interest in the fair value of the acquiree’s identifiable assets, liabilities and contingent liabilities exceeds
the costs of the business combination, the excess is immediately recognised in profit or loss.
The interest of minority shareholders in the acquiree is initially measured at the minority’s proportion of the net fair value of the assets,
liabilities and contingent liabilities recognised.
The Group consolidated financial statements include the assets, liabilities and results of NedNamibia Holdings Limited and its subsidiaries
(including SPEs) controlled by the Group. The results of subsidiaries acquired or disposed of during the year are included in the consolidated
income statement from the effective date of acquisition or up to the effective date of disposal, as appropriate.
Where necessary, adjustments are made to the annual financial statements of subsidiaries to bring their accounting policies into line
with those of the Group.
All intra-group transactions, balances, and profits and losses arising from intra-group transactions, are eliminated in the preparation of
the Group consolidated annual financial statements. Unrealised losses are not eliminated to the extent that they provide evidence of
impairment.
The difference between the proceeds from the disposal of a subsidiary and its carrying amount as of the date of disposal, including the
cumulative amount of any exchange differences that relate to the subsidiary in equity, is recognised in the Group income statement as
the gain or loss on the disposal of the subsidiary.
Minority interests in the net assets of consolidated subsidiaries are identified separately from the Group’s equity therein. Minority
interests consist of the amount of those interests at the date of the original business combination and the minority’s share of changes
in the equity since the date of the combination. Losses applicable to the minority in excess of the minority’s interest in the subsidiary’s
equity are allocated against the interest of the Group except to the extent that the minority has a binding obligation and is able to make
an additional investment to cover the losses.
3.1.1 Investment in associate
An associate is an entity, including an unincorporated entity such as a partnership, over which the Group has significant influence and
that is neither a subsidiary nor an interest in a joint venture. Significant influence is the power to participate in the financial and operating
policy decisions of the investee, but is not control or joint control over those policies.
The results and assets and liabilities of associates are incorporated in the Group financial statements using the equity method of accounting,
from the date significant influence commences until the date significant influence ceases. Under the equity method, investments in
associates are carried in the consolidated balance sheet at the cost as adjusted for post-acquisition changes in the Group’s share of the
net assets of the associate, less any impairment in the value of individual investments. Losses of an associate in excess of the Group’s
interest in that associate are not recognised. When the Group’s share of losses exceeds the carrying amount of the associate, the carrying
amount is reduced to nil, inclusive of any debt outstanding, and recognition of further losses is discontinued, except to the extent that
the Group has incurred or guaranteed obligations in respect of the associate.
Notes to the Annual Financial Statements (cont)for the year ended 31 December 2007

56
3. SIGNIFICANT ACCOUNTING POLICIES (cont)
3.1 Basis of consolidation (cont)
3.1.1 Investment in associate (cont)
Any excess of the cost of acquisition over the Group’s share of the net fair value of the identifiable assets, liabilities and contingent
liabilities of the associate recognised at the date of acquisition is recognised as goodwill. The goodwill is included within the carrying
amount of the investment and is assessed for impairment as part of the investment. Any excess of the Group’s share of the net fair value
of the identifiable assets, liabilities and contingent liabilities over the cost of acquisition, after reassessment, is recognised immediately
in profit or loss.
Where a Group entity transacts with an associate of the Group, unrealised profits and losses are eliminated to the extent of the Group’s
interest in the relevant associate.
3.1.2 Goodwill
Goodwill arises on the acquisition of subsidiaries and associates. Goodwill is measured at cost less accumulated impairment losses. In
respect of equity accounted investments, the carrying amount of goodwill is included in the carrying amount of the investment.
All business combinations are accounted for by applying the purchase method. At acquisition date, the Group recognises the fair value
of the acquiree’s identifiable assets, liabilities and contingent liabilities that satisfy the recognition criteria at their respective fair values.
The cost of a business combination is the fair value of purchase consideration due at date of acquisition plus any directly attributable
transaction costs. Any contingent purchase consideration is recognised to the extent that it is probable and can be measured reliably. Any
excess between the cost of the business combination and the Group’s interest in the net fair value of the identifiable assets, liabilities and
contingent liabilities acquired, is recognised as goodwill in the balance sheet. Goodwill is adjusted for any subsequent remeasurement of
contingent purchase consideration.
For the purpose of impairment testing, goodwill is allocated to each of the Group’s cash-generating units expected to benefit the
synergies of the combination. A cash-generating unit is the smallest identifiable group of assets that generates cash inflows that are
largely independent of the cash inflows from other assets or group of assets. Cash-generating units to which goodwill has been allocated
are tested for impairment annually, or more frequently when there is an indication that the unit may be impaired. If the recoverable
amount of the cash-generating unit is less than the carrying amount of the unit, the impairment loss is allocated first to reduce the
carrying amount of any goodwill allocated to the unit and then to the assets of the unit pro-rata on the basis of the carrying amount of
each asset in the unit.
The recoverable amount of a cash-generating unit is the higher of its fair value less cost to sell and its value in use. The fair value less cost
to sell is determined by ascertaining the current market value of an asset and deducting any costs related to the realisation of the asset. In
assessing value in use, the expected future cash flows from the cash-generating unit are discounted to their present value using a discount
rate that reflects current market assessments of the time value of money and the risks specific to the cash-generating unit. Impairment
losses relating to goodwill are not reversed in a subsequent period and all impairment losses are recognised in profit and loss.
On disposal of a subsidiary, the attributable amount of goodwill is included in the determination of the profit or loss on disposal.
The Group’s policy for goodwill arising on the acquisition of an associate is described under “Investment in associate” above.

57
Notes to the Annual Financial Statements (cont)for the year ended 31 December 2007
3. SIGNIFICANT ACCOUNTING POLICIES (cont)
3.2 Financial instruments
Financial instruments as reflected on the balance sheet include all assets and liabilities, including derivative instruments, but exclude
investments in subsidiaries, associate company, employee benefit plans, property and equipment, deferred taxation, taxation payable,
intangible assets and leases. Financial Instruments are accounted for under IAS 32: Financial Instruments: Presentation, IAS 39: Financial
Instruments: Recognition and Measurement and IFRS 7: Financial Instruments: Disclosures.
(i) Initial recognition
Financial assets are recognised on the balance sheet when the Group becomes a party to the contractual provisions of a financial
instrument. All purchases of financial assets that require delivery within the timeframe established by regulation or market convention
(“regular way” purchases) are recognised at trade date, which is the date on which the Group commits to purchase the asset.
Financial liabilities are recognised on trade date, which is when the Group becomes a party to the contractual provisions of the
financial instruments.
(ii) Initial measurement
Financial instruments are initially recognised at fair value plus, in the case of a financial asset or liability not at fair value through
profit and loss, transaction cost that are incremental to the Group and directly attributable to the acquisition or issue of the financial
asset or financial liability.
(iii) Subsequent measurement
Subsequent to initial measurement, financial instruments are either measured at fair value or amortised cost, depending on their
classification:
• Financialassetsandfinancialliabilitiesatfairvaluethroughprofitorloss
Financial instruments at fair value through profit or loss consist of trading instruments and instruments that the Group has elected,
on initial recognition date, to designate as fair value through profit or loss.
Trading instruments are financial assets or financial liabilities that were acquired or incurred principally for the purpose of sale or
repurchase in the near term, form part of a portfolio with a recent pattern of short-term profit-taking or are derivatives that do
not form part of a designated and effective hedging relationship. The Group’s derivative transactions include foreign exchange
contracts, forward rate agreements, currency and interest rate swaps.
Financial assets and financial liabilities that the Group has elected, on initial recognition date, to designate as at fair value through
profit or loss are those that meet any one of the following criteria:
- where the fair value through profit or loss designation eliminates or significantly reduces a measurement or recognition
inconsistency that would otherwise arise from using different bases to measure and recognise the gains and losses on financial
assets and financial liabilities; or
- the instrument forms part of a group of financial instruments that is managed, evaluated and reported on using a fair value
basis in accordance with a documented risk management or investment strategy; or
- the financial instrument contains an embedded derivative, which significantly modifies the cash flows of the host contract or
where the embedded derivative would clearly require separation.
Financial assets and financial liabilities at fair value through profit or loss are measured at fair value, with fair-value gains and
losses (excluding impairment losses, interest income and interest expense calculated on the amortised-cost basis relating to those
interest-bearing instruments that have been designated as at fair value through profit or loss) reported in non-interest revenue
as they arise. Impairment losses calculated on the amortised-cost basis are recognised in the income statement in impairment
losses on loans and advances. Interest income and interest expense calculated on the amortised-cost basis are reported in interest
income and expense.

58
3. SIGNIFICANT ACCOUNTING POLICIES (cont)
3.2 Financial instruments (cont)
(iii) Subsequent measurement (cont)
• Otherfinancialliabilities
All financial liabilities, other than those at fair value through profit and loss, are classified as other financial liabilities and are
measured at amortised cost. The carrying amounts are disclosed in the notes to the financial statements. The approximation of the
fair value of other financial liabilities have proven to be reasonably close to the carrying value of such instruments and in terms of
IFRS 7.29(a) the Group is not required to disclose the fair value of these instruments in the notes to the financial statements.
• Held-to-maturityfinancialassets
Held-to-maturity financial assets are non-derivative financial assets with fixed or determinable payments and fixed maturity
that the Group has the intent and ability to hold to maturity, other than those that meet the definition of loans and receivables
or those that were designated as at fair value through profit or loss or available-for-sale. Held-to-maturity financial assets are
measured at amortised cost, with interest income recognised in profit and loss.
• Loansandreceivables
Loans and receivables are non-derivative financial assets with fixed or determinable payments that are not quoted in an active
market, other than those classified by the Group as at fair value through profit or loss or available-for-sale. Financial assets
classified as loans and receivables are carried at amortised cost less any impairment, with interest income recognised in profit or
loss. The majority of the Group’s advances are included in the loans and receivables category. The carrying amounts are disclosed
in the notes to the financial statements. The approximation of the fair value of loans and receivables has proven to be reasonably
close to the carrying value of such instruments and in terms of IFRS 7.29(a) the Group is not required to disclose the fair value of
these instruments in the notes to the financial statements.
• Available-for-sale
Financial assets are classified as available-for-sale where the intention, origination and designation of the instrument do not fall
within the ambit of the other financial asset classifications. Available-for-sale instruments are typically assets that are held for a
longer period and in respect of which short-term fluctuations in value do not affect the Group’s hold or sell decision.
Available-for-sale financial assets are measured at fair value, with fair-value gains and losses recognised directly in equity along with
the associated deferred taxation. Any foreign currency translation gains and losses or interest revenue, measured on an effective-
yield basis, are recognised in the income statement as they arise. When available-for-sale equity instruments are determined to be
impaired to the extent that the fair value declines below its original cost, the resultant losses are recognised in profit or loss.
(iv) Embedded derivatives
An embedded derivative arises when derivatives are a component of a financial instrument in such a way that the cash flows in
respect of the instrument vary in a similar way to those in respect of a standalone derivative.
Where the value of embedded derivatives can be reliably measured, embedded derivatives are accounted for separately at their fair
value. Certain derivatives embedded in other financial and non-financial instruments, such as the conversion option in a convertible
bond, are treated as separate derivatives and recognised as such on a stand alone basis, when their risks and characteristics are not
closely related to those of the host contract and the host contract is not carried at fair value with unrealised gains and losses reported
in profit or loss.

59
3. SIGNIFICANT ACCOUNTING POLICIES (cont)
3.2 Financial instruments (cont)
(iv) Embedded derivatives (cont)
If it is not possible to determine the fair value of the embedded derivative, the entire hybrid instrument is categorised as fair value
through profit or loss and measured at fair value.
(v) Measurement basis of financial instruments
• Amortisedcost
Amortised cost financial assets and financial liabilities are measured at fair value on initial recognition, plus or minus the cumulative
amortisation using the effective interest rate method of any difference between that initial amount and the maturity amount, less
any cumulative impairment losses.
For financial assets, the effective interest rate method calculates the amortised cost of a financial asset and allocates the interest
income over the relevant period. The effective interest rate is the rate that exactly discounts estimated future cash receipts
through the expected life of the financial asset. Cash receipts include all fees that form an integral part of the effective interest
rate, transaction costs and other premiums or discounts.
For financial liabilities, the effective interest rate method calculates the amortised cost of a financial liability and allocating the
interest expense over the relevant period. The effective interest rate is the rate that exactly discounts estimated future cash
payments through the expected life of the financial liability.
• Fairvalue
Direct and incremental transaction costs are included in the initial fair value of financial assets and financial liabilities, other
than those at fair value through profit or loss. The best evidence of the fair value of a financial asset or financial liability at initial
recognition is the transaction price, unless the fair value of the instrument is evidenced by comparison with other current observable
market transactions in the same instrument or based on a valuation technique whose variables include market observable data.
Where quoted market prices are available, such market data is used to determine the fair value of financial assets and financial
liabilities that are measured at fair value. The bid price is used to measure financial assets held and the offer price is used to
measure the fair value of financial liabilities. Mid-market prices are used to measure fair value only to the extent that the Group
has assets and liabilities offsetting risk positions (refer to note 3.2 (ix)).
If quoted bid prices are unavailable, the fair value of the financial asset is estimated using pricing models or discounted cash
flow techniques. Where discounted cash flow techniques are used, estimated future cash flows are based on management’s best
estimates and the discount rate used is a market-related rate at the balance sheet date for an instrument with similar terms and
conditions. Where pricing models are used, inputs are based on market-related measures (prices from observable current market
transaction in the same instrument without modification or other observable market data) at the balance sheet date.
When market related measures are not available, observable market data is modified to incorporate relevant factors that a market
participant in an arm’s length exchange motivated by normal business considerations would consider in determining the fair
value of the financial instrument (non-observable market inputs). The International Private Equity and Venture Capital Valuation
Guidelines and industry practice, which have demonstrated the capability to provide reliable estimates of prices obtained in actual
market transactions, are used to determine the adjustments to observable market data. Consideration is given to the nature and
circumstances of the financial instrument in determining the appropriate non-observable market input.
Notes to the Annual Financial Statements (cont)for the year ended 31 December 2007

60
3. SIGNIFICANT ACCOUNTING POLICIES (cont)
3.2 Financial instruments (cont)
(v) Measurement basis of financial instruments (cont)
• Fairvalue(cont)
Non-observable market inputs are used to determine the fair values of, among others, private equity investments, management
buyouts and development capital. Valuation techniques applied by the Group and that incorporate non-observable market inputs
include, among others, earnings multiples, the price of recent investments, the value of the net assets of the underlying business
and discounted cashflows.
The fair value of a financial liability with a demand feature is not less than the amount payable on demand, discounted from the
first date on which the amount could be required to be paid. In cases where the fair value of financial liabilities cannot be reliably
determined, these liabilities are recorded at the amount due.
Investments in equity instruments that do not have a quoted market price in an active market and whose fair value cannot be
reliably measured, and derivatives that are linked to and have to be settled by delivery of such unquoted equity instruments, are
not measured at fair value but at cost. Fair value is considered reliably measured if:
- the variability in the range of reasonable fair value estimates is not significant for that instrument; or
- the probabilities of the various estimates within the range can be reasonably assessed and used in estimating fair value.
(vi) Derecognition
All financial assets and financial liabilities are derecognised on trade date, which is when the Group commits to selling a financial
asset or redeeming a financial liability.
The Group derecognises a financial asset when and only when:
• The contractual rights to the cash flows arising from the financial assets have expired or been forfeited by the Group; or
• It transfers the financial asset including substantially all the risks and rewards of ownership of the asset; or
• It transfers the financial asset, neither retaining nor transferring substantially all the risks and rewards of ownership of the
asset, but no longer retains control of the asset.
A financial liability (or part of a financial liability) is derecognised when and only when the liability is extinguished, that is, when the
oligation specified in the contract is discharged, cancelled or has expired.
The difference between the carrying amount of a financial liability (or part thereof) extinguished or transferred to another party and
the consideration paid, including any non-cash assets transferred or liabilities assumed, is recognised in profit or loss for the year.
The difference between the carrying amount of a financial asset (or part thereof) derecognised and the consideration received,
including any non-cash assets received or liabilities extinguished, is recognised in profit or loss for the year.
(vii) Impairment of financial assets
The Group assesses at each balance sheet date whether there is objective evidence that a financial asset or group of financial assets is impaired.
A financial asset or a group of financial assets is impaired and impairment losses are incurred if, and only if, there is objective evidence of
impairment as a result of one or more events that occurred after the initial recognition of the asset (a ‘loss event’) and that loss event (or events)
has an impact on the estimated future cash flows of the financial asset or group of financial assets that can be reliably estimated.

61
3. SIGNIFICANT ACCOUNTING POLICIES (cont)
3.2 Financial instruments (cont)
(vii) Impairment of financial assets (cont)
Objective evidence that a financial asset or group of assets is impaired includes observable data that comes to the attention of the
Group about the following loss events:
- significant financial difficulty of the issuer or obligor;
- a breach of contract, such as a default or delinquency in interest or principal payments;
- the Group, for economic or legal reasons relating to the borrower’s financial difficulty, a concession that the lender would not
otherwise consider;
- it becoming probable that the borrower will enter bankruptcy or other financial reorganisation;
- the disappearance of an active market for that financial asset because of financial difficulties; or
- observable data indicating that there is a measurable decrease in the estimated future cash flows from a group of financial assets
since the initial recognition of those assets, although the decrease cannot yet be identified with the individual financial assets in
the group, including:
• adverse changes in the payment status of borrowers in the group; or
• national or local economic conditions that correlate with defaults on the assets in the group.
• Assets carried at amortised cost
If there is objective evidence that an impairment loss on loans and receivables or held-to-maturity investments carried at
amortised cost has been incurred, the amount of the loss is measured as the difference between the asset’s carrying amount
and the present value of estimated future cash flows (excluding future credit losses that have not been incurred) discounted at
the financial asset’s original effective interest rate. The carrying amount of the asset is reduced through the use of an allowance
account and the amount of the loss is recognised in profit or loss.
The Group first assesses whether objective evidence of impairment exists individually for financial assets that are individually
significant, and individually or collectively for financial assets that are not individually significant. If the Group determines that no
objective evidence of impairment exists for an individually assessed financial asset, whether significant or not, it includes the asset
in a group of financial assets with similar credit risk characteristics and collectively assesses them for impairment.
If, in a subsequent year, the amount of the impairment loss decreases and the decrease can be related objectively to an event
occurring after the impairment was recognised (such as an improvement in the debtor’s credit rating), the previously recognised
impairment loss is reversed by adjusting the allowance account. The reversal does not result in a carrying amount of the financial
asset that exceeds what the amortised cost would have been had the impairment not been recognised at the date on which the
impairment is reversed. The amount of the reversal is recognised in profit or loss for the year.
• Financial assets carried at cost
If there is objective evidence that an impairment loss has been incurred on an unquoted equity instrument that is not carried
at fair value, because its fair value cannot be reliably measured, or on a derivative asset that is linked to and has to be settled by
delivery of such an unquoted equity instrument, the amount of the impairment loss is measured at the difference between the
carrying amount of the financial asset and the present value of estimated future cash flows discounted at the current market rate
of return for a similar financial asset. Such impairment losses are not reversed.
Notes to the Annual Financial Statements (cont)for the year ended 31 December 2007

62
3. SIGNIFICANT ACCOUNTING POLICIES (cont)
3.2 Financial instruments (cont)
(vii) Impairment of financial assets (cont)
• Available–for–sale financial assets
When a decline in the fair value of an available-for-sale financial asset has been recognised directly in equity and there is objective
evidence that the asset is impaired, the cumulative loss that has been recognised directly in equity is removed from equity and
recognised in profit or loss even though the financial asset has not been derecognised.
The amount of the cumulative loss that is removed from equity and recognised in profit or loss is the difference between the
acquisition cost (net of any principal repayment and amortisation) and current fair value, less any impairment loss on that
financial asset previously recognised in profit or loss. Impairment losses recognised in profit and loss for an investment in an equity
instrument classified as available-for-sale are not reversed through profit or loss.
If, in a subsequent period, the fair value of a debt instrument classified as available-for-sale increases and the increase can be
objectively related to an event occurring after the impairment loss was recognised in profit and loss, the impairment loss is
reversed, with the amount of the reversal recognised in profit or loss for the year.
• Maximum credit risk
Credit risk arises principally from loans and advances to clients, investment securities derivatives and irrevocable commitments
to provide facilities. The maximum credit risk is typically the gross carrying amount, net of any amounts offset and impairment
losses. The maximum credit exposure for loan commitments is the full amount of the commitment if the loan cannot be settled
net in cash or using another financial asset.
• Renegotiated financial assets
Financial assets are deemed as renegotiated financial assets when the terms of financial assets that would otherwise be past due
or impaired have been renegotiated and restructured in an effort to reduce the risk of the borrower defaulting and the Group
ultimately incurring a loss. Restructuring is done by granting a concession to the borrower, such as restructuring the repayment
terms or interest rate to improve the borrower’s cash flow position, and then obtaining further or better security, subsequently
reducing the risk of default.
Renegotiation of asset based finance accounts are only done in exceptional circumstances and after the asset has been inspected
and found to be in an acceptable condition.
An arrangement for repayment of arrears or legal collections matters, whether by means of an increased debit order against un-
adjusted instalment, or by means of a borrower’s transfer or deposit of additional funds into the account, does not constitute
as a restructuring. Only short term arrangements (i.e. arrears to be rectified within two to three months) are accepted on active
accounts in arrears.

63
Notes to the Annual Financial Statements (cont)for the year ended 31 December 2007
3. SIGNIFICANT ACCOUNTING POLICIES (cont)
3.2 Financial instruments (cont)
(vii) Impairment of financial assets (cont)
• Credit ratings
The grades and the description of the grades utilised by the Group in grading the loans and advances are detailed in the table below:
GRADE DESCRIPTION DESCRIPTIONOFRATINGQUALITY
Performing
No risk No risk (political grade) No risk
AAA Investment grade Extremely good creditworthiness
BBB- to BB+ Transition: Investment to subinvestment Satisfactory average creditworthiness
BB+ to BB Subinvestment grade Still satisfactory creditworthiness
BB Subinvestment grade Still satisfactory creditworthiness
BB- to B+ Subinvestment grade Still satisfactory creditworthiness
B+ Subinvestment grade Generally still sufficient creditworthiness
B+ to B Subinvestment grade Increased risk
B to B- Subinvestment grade Increased risk
B- to CCC Watchlist High risk
CCC Watchlist High risk
CCC to C Watchlist Default imminent
Non-performing
D Default Sub-standard to loss
(viii) Financial liabilities and equity instruments issued by the Group
Classification as debt or equity
Debt and equity instruments are classified as either financial liabilities or as equity in accordance with the substance of the
contractual arrangement.
Equity instruments
An equity instrument is any contract that evidences a residual interest in the assets of an entity after deducting all of its liabilities.
Equity instruments issued by the Group are recorded at the proceeds received, net of direct issue costs.
Compound instruments
The component parts of compound instruments issued by the Group are classified separately as financial liabilities and equity in
accordance with the substance of the contractual arrangement. At the date of issue, the fair value of the liability component is
estimated using the prevailing market interest rate for similar non-convertible instrument.
This amount is recorded as a liability on an amortised cost basis using the effective interest method until extinguished upon
conversion or at the instrument’s maturity date.

64
3. SIGNIFICANT ACCOUNTING POLICIES (cont)
3.2 Financial instruments (cont)
(viii) Financial liabilities and equity instruments issued by the Group (cont)
Compoundinstruments(cont)
The equity component is determined by deducting the amount of the liability component from the fair value of the compounded
instrument as a whole. This is recognised and included in equity, net of income taxation effects, and is not subsequently
remeasured.
(ix) Offsetting financial instruments and related income
Financial assets and liabilities are offset and the net amount reported in the balance sheet only when there is a legally enforceable
right to set off and there is intention to settle on a net basis or to realise the asset and settle the liability simultaneously.
Income and expense items are offset only to the extent that their related instruments have been offset in the balance sheet.
(x) Collateral
Financial and non-financial assets are held as collateral in respect of certain recognised financial assets. Such collateral is not
recognised by the Group, as the Group does not retain the risks and rewards of ownership, and is obliged to return such collateral
to counterparties on settlement of the related obligations. Should a counterparty be unable to settle its obligations, the Group
takes possession of collateral or calls on other credit enhancements as full or part settlement of such amounts. These assets are
recognised when the applicable recognition criteria under IFRS are met, and the Group’s accounting policies are applied from the
date of recognition (refer to note 45 of the annual financial statements).
Collateral is also given to counterparties under certain financial arrangements, but such assets are not derecognised where the
Group retains the risks and rewards of ownership. Such assets are at risk to the extent that the Group is unable to fulfil its
obligations to counterparties (refer to note 5 to the annual financial statements).
(xi) Acceptances
Acceptances comprise undertakings by the Group to pay bills of exchange drawn on clients. The Group expects most acceptances
to be settled simultaneously with the reimbursement from clients. Acceptances are disclosed as liabilities with the corresponding
asset recorded in the balance sheet.
(xii) Financial guarantee contracts
Financial guarantee contracts are recognised as insurance contracts. Liability adequacy testing is performed to ensure that the
carrying amount of the liability for financial guarantee contracts is sufficient.
3.3 Instalment transactions
Instalment credit agreements are regarded as financing transactions and the total instalments, less unearned finance charges, are included
in advances and other accounts. Finance charges are computed at the commencement of the contractual periods and are recognised in
income in proportion to the net cash investment capital balances outstanding. Unearned finance charges are carried forward as deferred
income and deducted from advances.

65
3. SIGNIFICANT ACCOUNTING POLICIES (cont)
3.4 Property and equipment
3.4.1 Initialrecognitionandsubsequentexpenditure
Items of owner-occupied property and equipment are initially recognised at cost if it is probable that any future economic benefits
associated with the items will flow to the Group and it has a cost that can be measured reliably.
Subsequent expenditure is capitalised when it is measurable and will result in probable future economic benefits. Expenditure incurred to
replace a component of an item of owner-occupied property or equipment is capitalised to the cost of the item of owner-occupied property
and equipment and the part replaced is derecognised. All other expenditure is recognised in profit or loss as an expense when incurred.
Certain items of owner-occupied property and equipment that had been revalued to fair value on 1 January 2004, the date of transition
to IFRSs, are measured on the basis of deemed cost, being the revalued amount at the date of that revaluation.
3.4.2 Measurementafterrecognition
Equipment
Subsequent to initial recognition, equipment, consisting principally computer equipment, motor vehicles, fixtures and furniture, are stated
at cost less accumulated depreciation and impairment losses.
Owner-occupiedproperty
Owner-occupied property, whose fair values can be reliably measured, are stated at revalued amounts, being fair value at the date of
revaluation less subsequent accumulated depreciation and accumulated impairment losses.
Revaluations are performed with sufficient regularity such that the carrying amounts do not differ materially from those that would be
determined using fair values at the balance sheet date. An external valuation is performed on average every three years on a rotation basis.
In the event of a material change in the market conditions between the valuation date and the balance sheet date an internal valuation
is performed and adjustments made to reflect any material changes in value.
An independent valuation of the Group’s land and buildings was performed during the current year under review to determine the fair
value of land and buildings. The effective date of the revaluation was 31 December 2007. The revaluation of the Group’s properties has
been done, where appropriate for the specific property being valued, with reference to one of the income capitalisation method or the
depreciated replacement cost method.
The fair value is dependent on the method of valuation and assumptions utilised by the independent valuator, being key sources of
estimation uncertainty. The valuation methodology adopted is dependent upon the nature of the property. Income generating assets are
valued using discounted cash flows. Vacant land, land holdings and residential flats are valued according to sales of comparable properties.
Near vacant properties are valued at land value less the estimated cost of demolition. Where neither of the income capitalisation method
or sales value of comparable properties is available or reasonable, the depreciated replacement cost method is utilised.
Significant assumptions used by the independent valuators under the income capitalisation method include a capitalisation rate of
11%, rental income of N$85 per m2 and total expenditure being 15% of rental income. Where the depreciated cost method was appropriate a
depreciation rate of between 20% to 65% was used depending on the specific property and the component of the building being evaluated.
Notes to the Annual Financial Statements (cont)for the year ended 31 December 2007

66
3. SIGNIFICANT ACCOUNTING POLICIES (cont)
3.4 Property and equipment (cont)
3.4.2 Measurementafterrecognition(cont)
Owner-occupiedproperty(cont)
When an individual property is revalued, any increase in its carrying amount (as a result of the revaluation) is transferred to a revaluation reserve,
except to the extent that it reverses a revaluation decrease of the same property previously recognised as an expense in profit or loss.
When the value of an individual property is decreased as a result of a revaluation, the decrease is charged against any related credit
balance in the revaluation reserve in respect of that property. However, to the extent that it exceeds any surplus, it is recognised as an
expense in profit or loss.
3.4.3 Reclassifications of property and equipment
Where properties are reclassified during the year from owner-occupied property and equipment to investment properties any revaluation
gain arising is initially recognised in profit or loss to the extent of previous charged impairment losses. Any residual excess is taken to the
revaluation reserve. Revaluation deficits are recognised in the revaluation reserve to the extent of previously recognised gains and any
residual deficit is accounted for in profit or loss.
Investment properties that are reclassified to owner-occupied property are revalued at the date of transfer, with any difference being
taken to profit or loss.
3.4.4 Depreciation
Each part of an item of owner-occupied property and equipment with a cost that is significant in relation to the total cost of the item is
depreciated separately. The depreciable amounts of property and equipment are charged to profit or loss on a straight-line basis over the
estimated useful lives of items of property and equipment, unless they are included in the carrying amount of another asset. Useful lives
and residual values are assessed on an annual basis.
In the case of owner-occupied property, on revaluation any accumulated depreciation at the date of the revaluation is eliminated against
the gross carrying amount of the property concerned and the net amount restated to the revalued amount. Subsequent depreciation
charges are adjusted based on the revalued amount for each property. Any difference between the depreciation charge on the revalued
amount and that which would have been charged under historic cost is transferred net of any related deferred tax, between the revaluation
reserve and retained earnings as the property is utilised.
Land is not depreciated.
The maximum estimated useful lives are as follows:
Years
Freehold land and buildings 50
Leasehold land and buildings 20
Furniture, fittings and equipment 10
Computer equipment 5

67
Notes to the Annual Financial Statements (cont)for the year ended 31 December 2007
3. SIGNIFICANT ACCOUNTING POLICIES (cont)
3.4 Property and equipment (cont)
3.4.5 Derecognition
Items of property and equipment are derecognised on disposal or when no future economic benefits are expected from their use or disposal.
On derecognition of an owner-occupied property, or equipment, any gain or loss on disposal, determined as the difference between the net
disposal proceeds and the carrying amount of the asset, is recognised in profit or loss in the period of the derecognition. In the case of owner-
occupied property, any surplus in the revaluation reserve in respect of the individual property is transferred directly to retained income.
Compensation from third parties for items of property and equipment that were impaired, lost or given up is included in profit or loss
when the compensation becomes receivable.
3.4.6 Investment properties
Investment properties comprise real estate held to earn rentals or for capital appreciation. This does not include real estate held for use
in the supply of services or for administrative purposes. Investment properties are initially measured at cost plus any directly attributable
expenses.
Investment properties are stated at fair value. Internal professional valuers perform valuations annually. External valuations are obtained
on average once every three years on a cyclical basis. In the event of a material change in market conditions between the valuation date
and balance sheet date an internal valuation is performed and adjustments made to reflect any material changes in value.
The valuation methodology adopted is dependent on the nature of the property. Income-generating assets are valued using discounted
cash flows. Vacant land, land holdings and residential flats are valued according to sales of comparable properties. Near-vacant properties
are valued at land value less the estimated cost of demolition.
Surpluses and deficits arising from changes in fair value are recognised in profit or loss for the year.
3.5 Impairment of assets
The Group assesses all assets, other than financial instruments and goodwill, for indications of an impairment loss or the reversal of a
previously recognised impairment at each balance sheet date. Should there be indications of impairment, the assets’ recoverable amounts
are estimated. These impairments (where the carrying value of the asset exceeds its recoverable amount) or the reversal of a previously
recognised impairment are recognised in profit or loss for the year.
Intangible assets not yet available for use are tested annually for impairment.
The recoverable amount of an asset is the higher of its fair value less cost to sell and its value in use. The fair value less cost to sell is
determined by ascertaining the current market value of an asset and deducting any costs related to the realisation of the asset.
In assessing value-in-use, the expected future cash flows from the asset are discounted to their present value using a pre-tax discount rate
that reflects current market assessments of the time value of money and the risks specific to the asset. For an asset whose cash flows are
largely dependent on those of other assets, the recoverable amount is determined for the cash-generating unit to which the asset belongs.
A previously recognised impairment loss will be reversed if the recoverable amount increases as a result of a change in the estimates
used previously to determine the recoverable amount, but not to an amount higher than the carrying amount that would have been
determined, net of depreciation or amortisation, had no impairment loss been recognised in prior periods.

68
3. SIGNIFICANT ACCOUNTING POLICIES (cont)
3.6 Leases
The Group as lessee
Leases where the lessor retains the risk and rewards of ownership of the underlying asset are classified as operating leases. Payments
made under operating leases (net of any incentives received from the lessor) are recognised in the income statement on a straight-line
basis over the term of the lease.
The Group as lessor
Rental income (net of any incentives given to lessees) from operating leases is recognised on a straight-line basis over the term of the
relevant lease.
Assets leased out under operating leases are included under property and equipment in the balance sheet. Initial direct costs incurred in
negotiating and arranging are added to the carrying amount of the leased asset and recognised as an expense over the lease term on the
same basis as the rental income. Leased assets are depreciated over their expected useful lives on a basis consistent with similar assets.
3.7 Taxation
Income taxation on the profit or loss for the year comprises current and deferred taxation. Income taxation is recognised in profit or loss
except to the extent that it relates to items recognised directly to equity, in which case it is recognised in equity.
3.7.1 Deferred taxation
Deferred taxation is provided using the balance sheet liability method, based on temporary differences. Temporary differences are
differences between the carrying amounts of assets and liabilities for financial reporting purposes and their tax base. The amount of
deferred taxation provided is based on the expected manner of realisation or settlement of the carrying amount of assets and liabilities
using taxation rates enacted or substantively enacted at the balance sheet date that are expected to be applied to temporary differences
when they reverse.
Deferred taxation is charged to profit or loss except to the extent that it relates to a transaction that is recognised directly in equity. The
effect on deferred taxation of any changes in taxation rates is recognised in profit or loss, except to the extent that it relates to items
previously charged or credited directly to equity.
Deferred tax liabilities are generally recognised for all taxable temporary differences, and deferred tax assets are generally recognised
for all deductible temporary differences to the extent that it is probable that taxable profits will be available against which those
deductible temporary differences can be utilised. Deferred taxation is not recognised where the initial recognition of assets or liabilities
in a transaction that is not a business combination affects neither accounting nor taxable profit.
A deferred taxation asset is recognised to the extent that it is probable that future taxable income will be available, against which the
unutilised tax losses and deductible temporary differences can be used. Deferred taxation assets are reviewed at each reporting date and
are reduced to the extent that it is no longer probable that the related taxation benefits will be realised.
Deferred taxation liabilities are recognised for taxable temporary differences arising on investments in subsidiaries and associates, except
where the Group is able to control the reversal of the temporary difference and it is probable that the temporary difference will not
reverse in the foreseeable future.

69
Notes to the Annual Financial Statements (cont)for the year ended 31 December 2007
3. SIGNIFICANT ACCOUNTING POLICIES (cont)
3.7 Taxation (cont)
3.7.2 Direct and indirect taxation
Direct taxation is the expected taxation payable on the taxable income for the year, as adjusted for items which are not taxable or
disallowed, using taxation rates enacted or substantively enacted in Namibia at the balance sheet date, and any adjustment to taxation
payable in respect of previous years.
Indirect taxation includes Value Added Taxation paid to central government and has been expensed in the income statement, to the extent
that it has not been claimed under the Value Added Taxation apportionment ratio.
3.8 Foreign currency transactions
Transactions in foreign currencies are converted into the functional currency at the rate of exchange ruling at the date of the transaction.
Monetary assets and liabilities in foreign currencies are translated into the functional currency of the Group at rates of exchange ruling
at the balance sheet date.
Non-monetary assets and liabilities denominated in foreign currencies that are stated at fair value are translated into the functional
currency of the Group at foreign exchange rates ruling at the date fair value is determined. Non-monetary assets and liabilities
denominated in foreign currencies, which are stated at cost, are converted into the functional currency of the Group at the rate of
exchange ruling at the date of the initial recognition and are not subsequently retranslated.
Exchange gains and losses on the translation and settlement during the year of foreign currency monetary assets and liabilities are
recognised in the income statement.
Exchange differences for non-monetary items, for example equity instruments, are recognised in equity when the changes in the fair value
of the non-monetary item is recognised in equity, and in profit or loss if the changes in fair value of the non-monetary item is recognised
in profit or loss.
Non-monetary assets and liabilities denominated in foreign currencies that are stated at cost are recorded in the functional currency at
the rate of exchange at the date of the initial recognition and are not subsequently retranslated.
3.9 Properties in possession
Unsold properties in possession are stated at the lower of the net outstanding amount at date of purchase and net realisable value.
3.10 Employee benefits
Short-term employee benefits
Short-term employee benefit obligations are measured on an undiscounted basis and are expensed as the related service is provided.
Defined contribution plan
Defined contribution plans have been established for eligible employees of the Group, with assets held in separate trustee-administered funds.
Contributions in respect of defined contribution schemes are recognised as an expense in profit or loss as incurred.

70
3. SIGNIFICANT ACCOUNTING POLICIES (cont)
3.10 Employee benefits (cont)
Post-retirement medical benefits
The Group provides post-retirement medical benefits to eligible employees. Non-pension post-retirement benefits are accounted for
according to their nature, either as defined contribution or defined benefit plans. The expected costs of post-retirement benefits that are
defined benefit plans are accounted for in accordance with IAS 19: Employee Benefits.
The projected unit credit method is used to determine the defined benefit obligations based on actuarial assessments, which incorporate
not only the post-retirement benefit obligations known on the balance sheet date, but also information relevant to their expected
future development. The expected costs of post-retirement benefits are accrued over the period of employment and are determined by
independent qualified actuaries. Actuarial gains and losses and service costs are immediately realised in the profit and loss when incurred
or received.
3.11 Provisions
Provisions are recognised when the Group has a present legal or constructive obligation as a result of past events, for which it is probable
that an outflow of economic benefits will occur and where a reliable estimate can be made of the amount of obligation.
The amount recognised as a provision is the reasonable estimate of the expenditure required to settle the obligation at the balance sheet
date. Where the effect of discounting is material, provisions are discounted. The discount rate reflects current market assessments of the
time value of money and, where appropriate, the risks specific to the liability. Gains from the expected disposal of assets are not taken
into account in measuring provisions. Provisions are reviewed at each balance sheet date and adjusted to reflect the current reasonable
estimate. If it is no longer probable that an outflow of resources will be required to settle the obligation, the provision is reversed.
3.12 Contingent liabilities
The Group discloses a contingent liability where:
- It is a possible obligation arising from past events, the existence of which will be confirmed only by the occurrence or non-occurrence
of one or more uncertain future events not wholly within the control of the enterprise; or
- It is not probable that an outflow of resources will be required to settle an obligation; or
- The amount of the obligation cannot be measured with sufficient reliability.
3.13 Borrowing costs
Borrowing costs directly attributable to the acquisition, construction and production of qualifying assets are capitalised as part of the
costs of these assets. Qualifying assets are assets that necessarily take a substantial period of time to prepare for their intended use or
sale. Capitalisation of borrowing costs continues up to the date when the assets are substantially ready for their use or sale.
All other borrowing costs are expensed in the period in which they are incurred.
Interest expense is recognised in profit or loss using the effective interest method taking into account the expected timing and amount
of cash flows. Interest expense includes the amortisation of any discount or premium or other differences between the initial carrying
amount of an interest-bearing instrument and its amount at maturity calculated on an effective interest rate basis.
3.14 Computer software and development cost
Expenditure on research activities, undertaken with the prospect of gaining technical knowledge are recognised in the income statement
as an expense incurred.

71
3. SIGNIFICANT ACCOUNTING POLICIES (cont)
3.14 Computer software and development cost (cont)
Expenditure on computer software and other development activities, whereby set procedures and processes are applied to a project for
the production of new or substantially improved products and processes, is capitalised if the computer software and other development
products or processes are technically and commercially feasible and the Group has sufficient resources to complete development.
The expenditure capitalised includes cost of materials, and directly attributable staff and other costs. Computer development expenditure
is amortised only once the relevant software has been commissioned. Capitalised software is stated at cost, less accumulated amortisation
and impairment losses. Computer development expenditure, which has not yet been commissioned, is stated at cost less impairment
losses.
Amortisation on computer software and development costs is charged to the income statement on a straight-line basis over the estimated
useful lives of these assets, not exceeding five years.
Subsequent expenditure relating to computer software is capitalised when it is probable that future economic benefits from the use of
assets will increase beyond its original assessed standard of performance. All other subsequent expenditure is recognised as an expense in
the period in which it is incurred. Surpluses or deficits on the disposal of computer software are recognised in the income statement. The
surplus or deficit is the difference between the net disposal proceeds and the carrying amount of the asset.
3.15 Revenue recognition
Revenue relates to banking activities and comprises net income from funds, dividends from investments, fees and commissions from
banking and related transactions and net income from exchange dealings.
Revenue is shown net of value added tax.
Interestincome
Interest income is recognised in profit or loss using the effective interest method taking into account the expected timing and amount of
cash flows. The effective interest method is a method of calculating the amortised cost of a financial asset and of allocating the interest
income over the relevant period. Interest income includes the amortisation of any discount or premium or other differences between the
initial carrying amount of an interest-bearing instrument and its amount at maturity calculated on an effective interest rate basis.
Non-interestrevenue
Dividend income
Dividend income from investments is recognised when the shareholder’s rights to receive payment have been established on the ex-
dividend date for equity instruments and is included in dividend income.
Fees and commissions
Fees and commissions are generally recognised on an accrual basis when the service has been provided, such as loan syndication fees.
Income earned from the provision of services is recognised as the service is rendered by reference to the stage of completion of the service.
Loan origination fees for loans that are probable of being drawn down, are deferred (together with related direct costs) and recognised as
an adjustment to the effective interest rate on the advance.
Notes to the Annual Financial Statements (cont)for the year ended 31 December 2007

72
3. SIGNIFICANT ACCOUNTING POLICIES (cont)
3.15 Revenue recognition (cont)
Non-interestrevenue(cont)
Feesandcommissions(cont)
Commission and fees arising from negotiating, or participating in the negotiation of a transaction for a third party, such as the acquisition
of loans, shares or other securities or the purchase or sale of businesses, are recognised on completion of the underlying transaction,
unless it forms an integral part of the effective interest rate of the underlying financial instruments.
Foreign exchange gains and losses
Foreign exchange gains and losses on monetary items arising from foreign currency transactions that have not been settled at the balance
sheet date are recognised in income in the year in which the exchange rate movement occurred. The premium or discount on forward
exchange contracts is amortised to income over the term of the forward exchange contract.
Rental income
The Group’s policy for recognition of revenue from operating leases is described in 3.6 above.
Other
Revenue other than interest, fees and commission, which includes exchange and securities trading income, dividends from investments
and net gains on the sale of investment banking assets, is recognised in profit or loss when the amount of revenue from the transaction
or service can be measured reliably, it is probable that the economic benefits of the transaction or service will flow to the Group and the
costs associated with the transaction or service can be measured reliably.
Fair value gains or losses on financial instruments at fair value through profit or loss, including derivatives are included in non-interest
revenue. These fair value gains or losses are determined after deducting the interest component, which is recognised separately in interest
income and expense.
Gains or losses on derecognition of any financial assets or financial liabilities are included in non-interest revenue.
3.16 Share-based payments
Equity-settled share-based payment transactions
The services received in an equity-settled share-based payment transaction with employees are measured at the fair value of the equity
instruments granted. The fair value of those equity instruments is measured at grant date.
If the equity instruments granted vest immediately and the employee is not required to complete a specified period of service before
becoming unconditionally entitled to those instruments, the services received are recognised in full on grant date in profit or loss for the
year, with a corresponding increase in equity.
Where the equity instruments do not vest until the employee has completed a specified period of service, it is assumed that the services
rendered by the employee, as consideration for those equity instruments, will be received in the future, during the vesting period. These
services are accounted for in profit or loss as they are rendered during the vesting period, with a corresponding increase in equity. Share-
based payment expenses are adjusted for non-market related performance conditions.
Where the equity instruments are no longer outstanding, the accumulated share-based payment reserve in respect of those equity
instruments is transferred to retained earnings.

73
Notes to the Annual Financial Statements (cont)for the year ended 31 December 2007
3. SIGNIFICANT ACCOUNTING POLICIES (cont)
3.16 Share-based payments (cont)
Cash-settled share-based payment transactions with employees
The services received in cash-settled share-based payment transactions with employees and the liability to pay for those services, are
recognised at fair value as the employee renders services. Until the liability is settled, the fair value of the liability is re-measured at each
reporting date and at the date of settlement, with any changes in fair value recognised in profit or loss for the year. Where the equity
instruments do not vest until the employee has completed a specified period of service, it is assumed that the services rendered by the
employee, as consideration for those equity instruments, will be received in the future, during the vesting period. These services are
accounted for in profit or loss as they are rendered during the vesting period, with a corresponding increase in the liability. Share-based
payment expenses are adjusted for non-market related performance conditions.
Measurement of fair value of equity instruments granted
The equity instruments granted by Nedbank Group Limited are measured at fair value at measurement date using standard option
pricing valuation models. The valuation technique is consistent with generally acceptable valuation methodologies for pricing financial
instruments, and incorporates all factors and assumptions that knowledgeable, willing market participants would consider in setting the
price of the equity instruments. Vesting conditions, other than market conditions, are not taken into account in determining fair value.
Vesting conditions are taken into account by adjusting the number of equity instruments included in the measurement of the transaction
amount.
Share-based payments with persons or entities other than employees
The transactions in which equity instruments are issued to historically disadvantaged individuals and organisations in Namibia are
accounted for as share-based payments. Where the Group has issued such shares and expects to receive services in return for equity
instruments, the share-based payments charge is spread over the relating vesting (i.e. service) period of these instruments. In instances
where such goods and services could not be identified the cost has been expensed with immediate effect. The valuation techniques are
consistent with those mentioned above.
3.17 Cash and cash equivalents
Cash and cash equivalents comprise balances with less than 90 days maturity from the date of acquisition including: cash and balances
with central banks, treasury bills and other eligible bills, amounts due from other banks and trading securities.
3.18 Share capital
Ordinary share capital, preference share capital or any financial instrument issued by the Group is classified as equity when:
- payment of cash, in the form of a dividend or redemption, is at the discretion of the Group;
- the instrument does not provide for the exchange of financial instruments under conditions that are potentially unfavourable to
the Group;
- settlement in the Group’s own equity instruments is for a fixed number of equity instruments at a fixed price; and
- the instrument represents a residual interest in the assets of the Group after deducting all of its liabilities.
The Group’s ordinary and preference share capital is classified as equity.
Share capital issued by the Group is recorded at the proceeds received, less incremental directly attributable issue costs (net of any related
income tax benefit).

74
3. SIGNIFICANT ACCOUNTING POLICIES (cont)
3.18 Share capital (cont)
Dividends are recognised as distributions within equity in the period in which they are approved by the shareholders. Dividends for the
year that are declared after the balance sheet date are disclosed in the notes.
3.19 Non-current assets held for sale
Non-current assets and disposal groups are classified as held for sale if their carrying amount will be recovered principally through the
sale transaction rather than through continuing use.
This condition is regarded as met only when the sale is highly probable and the asset (or disposal group) is available for immediate sale
in its present condition. Management must be committed to the sale, which should be expected to qualify as a complete sale within
one year from the date of classification. An active programme to find a buyer should be in place with appropriate level of management
approving the sale.
Immediately before classification as held-for-sale, all assets are remeasured in accordance with the Group’s accounting policies.
Non-current assets (or disposal groups) held for sale are measured at the lower of carrying amount and fair value less incremental
directly attributable cost to sell (excluding taxation and finance charges) and are not depreciated. Gains or losses recognised on initial
classification as held-for-sale and subsequent remeasurements are recognised in profit or loss, regardless of whether the assets were
previously measured at revalued amounts. The maximum gains that can be recognised are the cumulative impairment losses previously
recognised in profit or loss. A disposal group continues to be consolidated while held for sale. Income and expenses continue to be
recognised. However, assets are not depreciated or amortised. Non-current assets (or disposal groups) are reclassified from held-for-
sale to held-for-use if they no longer meet the held-for-sale criteria. On reclassification, the non-current asset (or disposal group) is
remeasured at the lower of its recoverable amount and the carrying amount that would have been recognised had the asset (or disposal
group) never been classified as held-for-sale.
Any gains or losses are recognised in profit or loss, unless the asset was carried at a revalued amount prior to classification as held-for-sale.
Gains or losses on such assets are recognised as revaluation increases or decreases.
3.20 Policyholders’ fund
The policyholders’ fund represents net revenue from life business for the current year as a reserve against future claims.
The policyholders’ fund provision has been computed using a gross premium valuation method. Provision has been made in accordance
with the Financial Soundness Valuation basis as set out in the guidelines issued by the Actuarial Society of South Africa in Prudential
Guidance Note (PGN) 104 (2001). Under this guideline, provisions are valued using realistic expectations of future experience.
3.21 Policyholder insurance contracts
Professional Guidance Notes (“PGNs”) issued by the Actuarial Society of South Africa (“ASSA”)
Coversure Limited is licensed as a long-term insurer in Namibia in accordance with the Long-Term Insurance Act of 1998 as amended
(“LTIA”). The LTIA requires the determination of assets, liabilities and capital adequacy requirements for statutory purposes in accordance
with PGNs issued by ASSA.

75
Notes to the Annual Financial Statements (cont)for the year ended 31 December 2007
3. SIGNIFICANT ACCOUNTING POLICIES (cont)
3.21 Policyholder insurance contracts (cont)
In terms of IFRS 4: Insurance Contracts, defined insurance liabilities are allowed to be measured under existing local practice. The Group
has adopted the PGNs to determine the liability in respect of insurance contracts issued in Namibia. The following PGNs are of relevance
to the determination of policyholder liabilities:
PGN 102 Life offices – HIV/AIDS
PGN 103 Report by the Statutory Actuary in the annual financial statements of South African Long-Term Insurers
PGN 104 Life Offices – Valuation of Long-Term Insurers
PGN 105 Recommended AIDS extra mortality bases
PGN 106 Actuaries and Long-Term Insurance in South Africa
PGN 110 Reserving for minimum investment return guarantees
Insurance contracts classification
The Group issues contracts that transfer insurance risk or financial risk or, in some cases, both.
An insurance contract is a contract under which the Group (“insurer”) accepts significant insurance risk from the policyholder by agreeing
to compensate the policyholder if a specified uncertain future event (“the insured event”) adversely affects the policyholder. Such
contracts may also transfer financial risk. The Group defines significant insurance risk as the possibility of having to pay benefits on the
occurrence of an insured event that are significantly more than the benefits payable if the insured event did not occur.
Insurance contracts measurement
These contracts are valued in terms of the Financial Soundness Valuation (“FSV”) basis, on a gross premium valuation methodology,
described in PGN 104 and the liability is reflected as Policyholders’ liabilities under insurance contracts.
The liability is based on assumptions of the best estimate of future experience, plus compulsory margins for prudent liabilities as required
in terms of PGN 104.
The liability assumptions are reviewed annually. Any changes in assumptions and/or other changes to the liability calculation are reflected
in the income statement as they occur.
Outstandingclaimsprovision
Provision is made in the policyholders’ liabilities under insurance contracts for the estimated cost of claims outstanding at the end of the year.
Liability adequacy test
At each balance sheet date, liability adequacy tests are performed to ensure the adequacy of the insurance contract liabilities net of
related intangible present value of acquired in-force business assets. The liability is calculated in terms of the FSV basis described in PGN
104. The FSV basis meets the minimum requirement of liability adequacy test.
Acquisition costs
Acquisition costs for insurance contracts represent commission that relate to the securing of new contracts.
The FSV method for valuing insurance contracts makes explicit allowance for the deferral of acquisition costs and hence no explicit
deferred acquisition cost asset is recognised in the balance sheet for insurance contracts.

76
Group Company
2007 2006 2007 2006
N$’000 N$’000 N$’000 N$’000
4. CASH AND BALANCES WITH CENTRAL BANK
Financialassetsclassification:Financial assets carried at fair
value through profit or loss - held for trading
Bank notes and coins 73,260 37,973 - -
Balances with central bank 45,974 135,183 - -
119,234 173,156 - -
Included under cash and balances with central bank are
mandatory reserve deposits with Bank of Namibia to the
value of N$41 million (2006: N$37 million).
5. GOVERNMENT AND PUBLIC SECTOR SECURITIES
5.1 Financial assets classification: Financial assets carried at fair
value through profit or loss - held for trading
Treasury bills 250,047 147,900 - -
Government registered stock 95,418 137,449 - -
345,465 285,349 - -
5.2 Expected maturity structure
One year or less 261,786 204,454 - -
Five years or less but over one year 74,944 5,541 - -
Over five years 8,735 75,354 - -
345,465 285,349 - -
5.3 Valuation
Unlisted
- Book value 345,791 287,528 - -
- Market valuation 345,465 285,349 - -
Treasury bills with a maturity value of N$188 million ( 2006: N$150 million) and government registered stock with a maturity value of
N$71.5 million ( 2006: N$128 million) have been encumbered to secure the current account with Bank of Namibia.
Banking institutions may overdraw their current account against certain pledged eligible securities to cover possible shortages. Overdrafts
are limited to 90% of the maturity or redemption value of the securities pledged. Daily interest is charged at the prevailing repo rate on
the amount received from Bank of Namibia (90% of the maturity value).
6. DERIVATIVE FINANCIAL INSTRUMENTS
These transactions have been entered into in the normal course of business and no material losses are anticipated other than those for which
provision has been made in the income statement. There are no commitments or contingent commitments under derivative instruments that
are settled otherwise than with cash. The principal types of derivative contracts into which the Group enters are described below.
Swaps
These are over-the-counter (“OTC”) agreements between two parties to exchange periodic payments of interest, or payment for the
change in value of a commodity, or related index, over a set period based on notional principal amounts. The Group enters into swap
transactions in several markets. Interest rate swaps exchange fixed rates for floating rates of interest based on notional amounts. Basis
swaps exchange floating or fixed interest calculated using different bases. Cross currency swaps are the exchange of interest based on
notional values of different currencies.

77
6. DERIVATIVE FINANCIAL INSTRUMENTS (cont)
Forwards
Forward contracts are OTC agreements and are principally dealt in by the Group in interest rates as forward rate agreements and in
currency as forward foreign exchange contracts.
Group Company
2007 2006 2007 2006
N$’000 N$’000 N$’000 N$’000
6.1 Total carrying amount of derivative financial instruments
Gross carrying amount of assets 1,668 1,062 - -
Gross carrying amount of liabilities (901) (690) - -
Net carrying amount 767 372 - -
A detailed breakdown of the carrying amount, notional principal and fair value of the various types of derivative financial instruments held
by the Group is presented in the following tables.
6.2 Notional principal of derivative financial instruments
This represents the gross notional amounts of all outstanding contracts at year-end for the Group. This gross notional amount is the sum
of the absolute amount of all purchases and sales of derivative instruments. The notional amounts do not represent amounts exchanged
by the parties and therefore represent only the measure of involvement by the Group in derivative contracts and not its exposure to
market or credit risks arising from such contracts. The amounts actually exchanged are calculated on the basis of the notional amounts
and other terms of the derivative, which relate to interest rates, exchange rates, securities’ prices or financial and other indices.
Notional
principal
Positive
value
Negative
value
Notional
principal
Positive
value
Negative
value
2007 2007 2007 2006 2006 2006
N$’000 N$’000 N$’000 N$’000 N$’000 N$’000
Group
Exchange rate contracts
Forwards 29,372 729 787 13,731 209 297
Spot 52,866 66 - 15,591 91 22
82,238 795 787 29,322 300 319
Interest rate contracts
Interest rate swaps 19,791 873 114 22,974 762 371
102,029 1,668 901 52,296 1,062 690
6.3 Carrying amount of derivative financial instruments
The amounts disclosed represent the value of all derivative instruments held at 31 December 2007. The fair value of a derivative financial
instrument is the amount as which it could be exchanged in a current transaction between willing parties, other than a forced liquidation
or sale. Fair values are obtained from quoted market prices, discounted cash flow models and market-accepted option-pricing models.
Notes to the Annual Financial Statements (cont)for the year ended 31 December 2007

78
Exchange rate contracts
Interest rate contracts Total
N$’000 N$’000 N$’000
6. DERIVATIVE FINANCIAL INSTRUMENTS (cont)
6.4 Analysis of derivative financial instruments
Group
Positive fair value of derivatives
2007
Maturity analysis
Under one year 795 - 795
One to five years - 873 873
Over five years - - -
795 873 1,668
2006
Maturity analysis
Under one year 300 - 300
One to five years - 762 762
Over five years - - -
300 762 1,062
Group
Negative fair value of derivatives
2007
Maturity analysis
Under one year 787 114 901
One to five years - - -
Over five years - - -
787 114 901
2006
Maturity analysis
Under one year 319 - 319
One to five years - 371 371
Over five years - - -
319 371 690
Group
Notional principal of derivatives
2007
Maturity analysis
Under one year 82,238 1,791 84,029
One to five years - 18,000 18,000
Over five years - - -
82,238 19,791 102,029
2006
Maturity analysis
Under one year 29,322 - 29,322
One to five years - 22,974 22,974
Over five years - - -
29,322 22,974 52,296

79
Notes to the Annual Financial Statements (cont)for the year ended 31 December 2007
Group Company
2007 2006 2007 2006
N$’000 N$’000 N$’000 N$’000
7. OTHER SHORT-TERM SECURITIES
7.1 Financial assets classification: Financial assets carried at fair value
through profit or loss - held for trading
Negotiable certificates of deposit 30,163 - - -
7.2 Maturity structure
One year or less 30,163 - - -
7.3 Valuation
The estimation of the fair value of the Negotiable certificates of
deposit has proven to be reasonably close to the carrying value of
such instruments.
8. DUE FROM OTHER BANKS
8.1 Financial assets classification: Loans and receivables
Placements with other banks 403,848 276,285 - -
9. LOANS AND ADVANCES TO CUSTOMERS
Financialassetsclassification: Loans and receivables
9.1 Category analysis
Home loans 1,452,137 1,232,040 - -
Other loans and overdrafts 1,724,929 1,556,890 - -
Preference share finance 46,200 46,200 - -
Leases and installment debtors 883,865 887,639 - -
Less: Unearned finance charges on leases and installment debtors (224,507) (225,032) - -
Micro loans 294,764 298,708 - -
4,177,388 3,796,445 - -
Impairment of advances (note 31) (70,007) (88,053) - -
4,107,381 3,708,392 - -

80
Group Company
2007 2006 2007 2006
N$’000 N$’000 N$’000 N$’000
9.
9.2
LOANS AND ADVANCES TO CUSTOMERS (cont)
Sectoral analysis
Individuals 2,209,969 2,001,735 - -
Manufacturing 95,242 88,766 - -
Wholesale and trade 23,106 146,961 - -
Retailers, catering and accommodation 267,569 183,248 - -
Agriculture, hunting, forestry and fishing 178,679 184,096 - -
Mining and quarrying 422,394 462,469 - -
Financial services, insurances and real estates 625,636 396,132 - -
Government and public sector 103,996 11,281 - -
Building and property development 74,017 64,326 - -
Transport, storage and communication 103,480 41,082 - -
Other services 73,300 216,349 - -
4,177,388 3,796,445 - -
9.3 Maturity structure
Three months or less but not repayable on demand or at short-term notice 135,701 465,522 - -
One year or less but over three months 721,267 864,696 - -
Five years or less but over one year 3,068,196 1,967,851 - -
Over five years 252,224 498,376 - -
4,177,388 3,796,445 - -
9.4 Geographical analysis
Namibia 4,177,388 3,796,445 - -

81
Notes to the Annual Financial Statements (cont)for the year ended 31 December 2007
Group Company
2007 2006 2007 2006
N$’000 N$’000 N$’000 N$’000
9. LOANS AND ADVANCES TO CUSTOMERS (cont)
9.5 Non-performing advances
9.5.1 Category analysis (included under note 9.1)
Home loans 36,068 34,842 - -
Other loans and overdrafts 23,585 12,953 - -
Preference share finance - - - -
Net leases and installment debtors 20,035 44,697 - -
Micro loans 17,251 20,084 - -
96,939 112,576 - -
9.5.2 Sectoral analysis (included under note 9.2)
Individuals 82,816 96,970 - -
Manufacturing 949 152 - -
Wholesale and trade 943 2,245 - -
Retailers, catering and accommodation 438 522 - -
Agriculture, hunting, forestry and fishing 1,358 298 - -
Mining and quarrying 179 140 - -
Financial services, insurances and real estates 5,241 1,765 - -
Government and public sector - - - -
Building and property development 1,888 8,583 - -
Transport, storage and communication 1,860 1,901 - -
Other services 1,267 - - -
96,939 112,576 - -

82
Group Company
2007 2006 2007 2006
Note N$’000 N$’000 N$’000 N$’000
10. INVESTMENT IN SUBSIDIARIES, ASSOCIATES
AND LISTED INVESTMENTS
Investment in subsidiary companies
- Carrying value at beginning of the year 133,642 96,697
- Acquisition of additional investment in subsidiary 10.1 - 4,000
- Capitalisation award - 32,945
- Transfer to non-current assets classified as held
for sale (4,000) -
- Carrying value at end of the year 129,642 133,642
Investment in associate
- Carrying value at beginning of the year 3,133 3,133 - -
- Purchase of additional shares issued 1,029 - - -
- Share of associate’s profit 572 - - -
- Carrying value at end of the year 4,734 3,133 - -
Listed investments 23,320 17,368 - -
28,054 20,501 129,642 133,642
Market valuation 28,054 20,501 129,642 133,642

83
Notes to the Annual Financial Statements (cont)for the year ended 31 December 2007
The Group has control over financial and operational decisions in both Ten Kaiser Wilhelm Strasse (Proprietary) Limited and Walvisbay
Land Syndicate (Proprietary) Limited by means of majority representation on the board of directors of these companies.
During 2006 the shares previously held in Namibia Executors and Trustees (Proprietary) Limited were sold for a consideration amount of
N$81 668. The loss made on the sale of the 750 shares is disclosed under non-interest income note 30.
The ordinary dividend declared and paid by Nedbank Namibia Limited in 2006 was a capitalisation award to the sole shareholder,
NedNamibia Holdings. NedNamibia Holdings was entitled to receive a cash dividend of 51.40 cents per ordinary share (“the cash
dividend alternative”). The number of capitalisation shares to which NedNamibia Holdings was entitled were determined in the ratio that
51.40 cents per ordinary share bears to N$8.99, being the value per ordinary share which has been determined by the Group’s advisors.
This equates to 5.717 new shares for every 100 ordinary shares held. The total number of shares awarded to NedNamibia Holdings
amounted to 3 664 627.
Nature of business Issued ordinary share capital and proportion held Shares at cost Indebtedness to subsidiary Aggregate profits after tax
of subsidiary
2007 2006 2007 2006 2007 2006 2007 2006 2007 2006
’000 ’000 % % N$’000 N$’000 N$’000 N$’000 N$’000 N$’000
10. INVESTMENT IN SUBSIDIARIES, ASSOCIATES AND LISTED INVESTMENTS (cont)
Company
Subsidiarycompanies
Bellissima Investments Seventy-Two (Proprietary) Limited Property company - - 100 100 4,000 4,000 - - (543) -
Coversure Limited Insurance company 4,000 4,000 100 100 4,000 4,000 - - 787 199
Nedbank Namibia Limited Banking company 67,759 67,759 100 100 125,634 125,634 - - 81,940 35,714
NedCapital Namibia (Proprietary) Limited Financing company 8 8 100 100 8 8 - - 3,065 3,442
NIB Mining Finance (Proprietary) Limited Financing company - - 100 100 - - - - (40) -
NedPlan Insurance Brokers Namibia (Proprietary) Limited Insurance broker - - 100 100 - - - - 54 7
133,642 133,642 - - 85,263 39,362
Included above is NedNamibia Holdings’ investment in Bellissima Investments Seventy-Two (Proprietary) Limited. The investment was
reclassified to non-current assets classified as held for sale due to NedNamibia Holdings’ intention to dispose of the subsidiary in the
next 12 months. Refer to note 14 for more detail on the reclassification.
Group
Subsidiarycompanies
CBN Nominees (Proprietary) Limited Dormant company - - 100 100 - - - - - -
NedLoans (Proprietary) Limited Administration
company
- - 80 80 2,250 2,250 - - 2,834 3,756
Ten Kaiser Wilhelm Strasse (Proprietary) Limited Property company
- Ordinary shares 582 582 50 50 291 291 - - 289 307
Walvis Bay Land Syndicate (Proprietary) Limited Property company
- Ordinary shares 3,000 3,000 50 50 1,500 1,500 - - 713 710
- Variable rate cumulative redeemable preference shares - 161 100 100 - 161 - - - -

84
Nature of business Issued ordinary share capital and proportion held Shares at cost Indebtedness to subsidiary Aggregate profits after tax
of subsidiary
2007 2006 2007 2006 2007 2006 2007 2006 2007 2006
’000 ’000 % % N$’000 N$’000 N$’000 N$’000 N$’000 N$’000
10. INVESTMENT IN SUBSIDIARIES, ASSOCIATES AND LISTED INVESTMENTS (cont)
Company
Subsidiarycompanies
Bellissima Investments Seventy-Two (Proprietary) Limited Property company - - 100 100 4,000 4,000 - - (543) -
Coversure Limited Insurance company 4,000 4,000 100 100 4,000 4,000 - - 787 199
Nedbank Namibia Limited Banking company 67,759 67,759 100 100 125,634 125,634 - - 81,940 35,714
NedCapital Namibia (Proprietary) Limited Financing company 8 8 100 100 8 8 - - 3,065 3,442
NIB Mining Finance (Proprietary) Limited Financing company - - 100 100 - - - - (40) -
NedPlan Insurance Brokers Namibia (Proprietary) Limited Insurance broker - - 100 100 - - - - 54 7
133,642 133,642 - - 85,263 39,362
Included above is NedNamibia Holdings’ investment in Bellissima Investments Seventy-Two (Proprietary) Limited. The investment was
reclassified to non-current assets classified as held for sale due to NedNamibia Holdings’ intention to dispose of the subsidiary in the
next 12 months. Refer to note 14 for more detail on the reclassification.
Group
Subsidiarycompanies
CBN Nominees (Proprietary) Limited Dormant company - - 100 100 - - - - - -
NedLoans (Proprietary) Limited Administration
company
- - 80 80 2,250 2,250 - - 2,834 3,756
Ten Kaiser Wilhelm Strasse (Proprietary) Limited Property company
- Ordinary shares 582 582 50 50 291 291 - - 289 307
Walvis Bay Land Syndicate (Proprietary) Limited Property company
- Ordinary shares 3,000 3,000 50 50 1,500 1,500 - - 713 710
- Variable rate cumulative redeemable preference shares - 161 100 100 - 161 - - - -

85
Un-audited Audited
31
December
31
December
2007 2006
N$’000 N$’000
23,660 17,292
5,387 7,771
18,273 9,521
4,734 -
Un-audited Audited
12months
ended
12 months
ended
31
December
31
December
2007 2006
N$’000 N$’000
19,409 17,693
4,640 2,846
1,326 712
(754) (712)
572 -
Notes to the Annual Financial Statements (cont)for the year ended 31 December 2007
Nature of business Issued share capital and proportion held Shares at cost Indebtedness by associate
2007 2006 2007 2006 2007 2006 2007 2006
’000 ’000 % % N$’000 N$’000 N$’000 N$’000
10. INVESTMENT IN SUBSIDIARIES, ASSOCIATES AND LISTED INVESTMENTS (cont)
Associate
Namclear (Proprietary) Limited Clearing agent 16 16 25 25 4,162 1 - 3,132
Due to the unavailability of audited annual financial statements of Namclear (Proprietary) Limited for the year ended 31 December
2007 at the time of approval of the Group’s 2007 annual financial statements, un-audited management accounts of Namclear have
been used to provide balance sheet and income statement information.
During 2007 one additional share with a nominal value of N$1 was purchased at a premium of N$1 029 099. The loan to Namclear
(Proprietary) Limited disclosed in the prior year of N$3 131 873 was converted to share capital via the issue of one additional share
with a nominal value of N$1 at a premium of N$3 131 872. The total number of shares held at 31 December 2007 is 1002 (2006: 1000)
with a nominal value of N$1 per share and a share premium of N$4 160 971 (2006: nil).
Summarised financial information in respect of Namclear (Proprietary) Limited:
Total assets
Total liabilities
Net assets
Group’s share of associate’s net assets
Total revenue
Total profit for the year
Share of associate’s profit for the year
Less previous years losses not consolidated
Share of associate’s profit
Indebtedness does not include loans and advances paid in the normal course of business. These amounts were included in advances.
Nature of business Issued ordinary shares and proportion held Shares at cost Fair value of shares
2007 2006 2007 2006 2007 2006 2007 2006
’000 ’000 % % N$’000 N$’000 N$’000 N$’000
Listedinvestments
Nedbank Group Limited Banking 172 172 0.02 0.02 17,368 17,368 23,320 17,368
The shares in Nedbank Group Limited are held by the BEE trusts, which are consolidated on Group level.

86
Nature of business Issued share capital and proportion held Shares at cost Indebtedness by associate
2007 2006 2007 2006 2007 2006 2007 2006
’000 ’000 % % N$’000 N$’000 N$’000 N$’000
10. INVESTMENT IN SUBSIDIARIES, ASSOCIATES AND LISTED INVESTMENTS (cont)
Associate
Namclear (Proprietary) Limited Clearing agent 16 16 25 25 4,162 1 - 3,132
Due to the unavailability of audited annual financial statements of Namclear (Proprietary) Limited for the year ended 31 December
2007 at the time of approval of the Group’s 2007 annual financial statements, un-audited management accounts of Namclear have
been used to provide balance sheet and income statement information.
During 2007 one additional share with a nominal value of N$1 was purchased at a premium of N$1 029 099. The loan to Namclear
(Proprietary) Limited disclosed in the prior year of N$3 131 873 was converted to share capital via the issue of one additional share
with a nominal value of N$1 at a premium of N$3 131 872. The total number of shares held at 31 December 2007 is 1002 (2006: 1000)
with a nominal value of N$1 per share and a share premium of N$4 160 971 (2006: nil).
Summarised financial information in respect of Namclear (Proprietary) Limited:
Total assets
Total liabilities
Net assets
Group’s share of associate’s net assets
Total revenue
Total profit for the year
Share of associate’s profit for the year
Less previous years losses not consolidated
Share of associate’s profit
Indebtedness does not include loans and advances paid in the normal course of business. These amounts were included in advances.
Nature of business Issued ordinary shares and proportion held Shares at cost Fair value of shares
2007 2006 2007 2006 2007 2006 2007 2006
’000 ’000 % % N$’000 N$’000 N$’000 N$’000
Listedinvestments
Nedbank Group Limited Banking 172 172 0.02 0.02 17,368 17,368 23,320 17,368
The shares in Nedbank Group Limited are held by the BEE trusts, which are consolidated on Group level.

87
Notes to the Annual Financial Statements (cont)for the year ended 31 December 2007
10.
10.1
INVESTMENT IN SUBSIDIARIES, ASSOCIATES AND LISTED INVESTMENTS (cont)
Acquisition of additional investment in subsidiary
2006
Effective 1 January 2006 NedNamibia Holdings acquired 100% of Bellissima Investments
Seventy-Two (Proprietary) Limited for a consideration of N$4 000 000.
Bellissima Investments Seventy-Two
(Proprietary) Limited
N$’000
Fair value of assets acquired
Property and equipment 4,000
Fair value of liabilities acquired -
Net assets acquired 4,000
Goodwill acquired -
Consideration paid: In cash 4,000
Consideration paid: Issue of share capital -
Consideration paid: Utilisation of share premium -
4,000
Group Company
2007 2006 2007 2006
N$’000 N$’000 N$’000 N$’000
11. GOODWILL
Carrying amount at beginning of year 27,623 27,623 - -
Arising on acquisitions - - - -
Carrying amount at end of year 27,623 27,623 - -
- Cost 27,623 27,623 - -
- Impairment losses - - - -

88
Freeholdland
Freeholdbuildings
Leaseholdbuildings
Furniture, fittings and equipment
Computer hardware Total
N$’000 N$’000 N$’000 N$’000 N$’000 N$’000
12. PROPERTY AND EQUIPMENT
Group
2007
Carrying amount at 1 January 2007 1,809 34,296 - 20,244 5,491 61,840
- at cost/valuation 1,809 38,484 1,500 43,697 26,974 112,464
- accumulated depreciation - (4,188) (1,500) (23,453) (21,483) (50,624)
Additions at cost - 1,369 - 17,263 6,445 25,077
Revaluation 1,543 17,908 - - - 19,451
Cost 1,543 13,007 - - - 14,550
Accumulated depreciation eliminated on
revaluation - 4,901 - - - 4,901
Transfers at net book value - - - (1,589) 4,790 3,201
Transfers at cost - - - (2,343) 1,701 (642)
Accumulated depreciation of transfers - - - 754 3,089 3,843
Disposals at net book value - (406) - (17) (47) (470)
Disposals at cost - (519) - (126) (84) (729)
Accumulated depreciation of disposals - 113 - 109 37 259
Depreciation for the year - (981) - (4,871) (3,709) (9,561)
Carrying amount at 31 December 2007 3,352 52,186 - 31,030 12,970 99,538
- at cost/valuation 3,352 52,341 1,500 58,491 35,036 150,720
- accumulated depreciation - (155) (1,500) (27,461) (22,066) (51,182)
2006
Carrying amount at 1 January 2006 1,809 34,336 - 12,106 1,774 50,025
- at cost/valuation 1,809 37,640 1,500 32,596 21,632 95,177
- accumulated depreciation - (3,304) (1,500) (20,490) (19,858) (45,152)
Additions at cost - 844 - 11,670 5,342 17,856
Disposals at net book value - - - (225) - (225)
Disposals at cost - - - (569) - (569)
Accumulated depreciation of disposals - - - 344 - 344
Depreciation for the year - (884) - (3,307) (1,625) (5,816)
Carrying amount at 31 December 2006 1,809 34,296 - 20,244 5,491 61,840
- at cost/valuation 1,809 38,484 1,500 43,697 26,974 112,464
- accumulated depreciation - (4,188) (1,500) (23,453) (21,483) (50,624)
Information regarding land and buildings required in terms of the Namibian Companies Act is available for inspection, by the shareholder or duly authorised agents, at the Group’s registered office.
Independent valuations of freehold land and buildings were performed by John S. Lofty-Eaton (National diploma: Property Valuation- UNISA, Member: SA Institute of Valuers) and P.J. Scholtz (National diploma: Property Valuation - Technikon SA). The effective date of the valuation is 31 December 2007. The previous valuation was performed on 1 January 2004. The revaluation of properties has been done, where appropriate for the specific property being valued, with reference to one of:- income capitalisation method using a capitalisation rate of 11%; and- the depreciated replacement cost method. The valuation conforms to International Valuation Standards.

89
Development cost Computer software Total
N$’000 N$’000 N$’000
13. COMPUTER SOFTWARE AND DEVELOPMENT COST
Group
2007
Carrying amount at 1 January 2007 196 12,844 13,040
- at cost 196 28,662 28,858
- accumulated amortisation - (15,818) (15,818)
Additions at cost - 3,553 3,553
Development cost incurred 2,434 - 2,434
Transfers to property and equipment - (3,201) (3,201)
Transfers at cost - 1,445 1,445
Accumulated amortisation of transfers - (4,646) (4,646)
Amortisation for the year - (1,385) (1,385)
Carrying amount at 31 December 2007 2,630 11,811 14,441
- at cost 2,630 33,660 36,290
- accumulated amortisation - (21,849) (21,849)
2006
Carrying amount at 1 January 2006 1,827 7,686 9,513
- at cost 1,827 17,202 19,029
- accumulated amortisation - (9,516) (9,516)
Additions at cost - 9,274 9,274
Development cost incurred 555 - 555
Transfers to computer software (2,186) 2,186 -
Amortisation for the year - (6,302) (6,302)
Carrying amount at 31 December 2006 196 12,844 13,040
- at cost 196 28,662 28,858
- accumulated amortisation - (15,818) (15,818)
Group Company
2007 2006 2007 2006
N$’000 N$’000 N$’000 N$’000
14. NON-CURRENT ASSETS CLASSIFIED AS HELD FOR SALE
Opening balance at the beginning of the year 21,369 - - -
Land held for sale 7,350 - - -
Building held for sale 14,019 - - -
Purchase of land - 3,350 - -
Construction of building 4,117 14,019 - -
Revaluation of land - 4,000 - -
Revaluation of building 6,010 - - -
Transfer from investments in subsidiaries 4,000
Closing balance at the end of the year 31,496 21,369 4,000 -
Land held for sale (i) 7,350 7,350 - -
Building held for sale (i) 24,146 14,019 - -
Investment in subsidiary (i) - - 4,000 -
(i) The Group intends to dispose of the land and the building in the next 12 months. The primary business of the Group is not to invest in property and a business decision has been taken to dispose of this property. In 2006 the search was underway for a buyer. At the end of 2006 a buyer was identified, but negotiations were not completed by year end. It is anticipated that the disposal will be completed by 31 December 2008. No impairment loss was recognised on the reclassification of the land as held for sale.
Notes to the Annual Financial Statements (cont)for the year ended 31 December 2007

90
Group Company
2007 2006 2007 2006
N$’000 N$’000 N$’000 N$’000
15. OTHER ASSETS
Financialassetsclassification: Loans and receivables
Remittances in transit 110,124 16,188 - -
Zero coupon bonds 75,283 65,266 - -
Sundry debtors and other accounts 38,340 60,542 25 -
Dividends receivable - - - 2,000
Non-financialinstruments
Deferred staff compensation 20,019 15,853 - -
Prepayments 1,344 - - -
Taxation 11,126 10,319 - -
256,236 168,168 25 2,000
16. DUE TO OTHER BANKS
Financialliabilitiesclassification:Other liabilities
Deposits and borrowings from other banks 315,940 259,772 8,326 8,035
17. OTHER DEPOSITS
Financialliabilitiesclassification: Other liabilities
Negotiable certificates of deposits 420,820 544,559 - -
18. DUE TO CUSTOMERS
Financialliabilitiesclassification: Other liabilities
18.1 Category analysis
Current accounts 847,231 825,816 - -
Savings accounts 149,638 138,991 - -
Other deposits and loan accounts 2,843,451 2,360,487 - -
Foreign currency liabilities 166,938 57,829 - -
4,007,258 3,383,123 - -
18.2 Sectoral analysis
Government and quasi government 490,200 168,697 - -
Insurance and pension funds 243,563 418,876 - -
Companies and close corporations 2,197,876 1,065,181 - -
Individuals and other 1,075,619 1,730,369 - -
4,007,258 3,383,123 - -
18.3 Maturity structure
Repayable on demand 579,028 473,594 - -
Three months or less but not repayable on demand 640,898 342,764 - -
One year or less but over three months 2,787,332 2,266,610 - -
Five years or less but over one year - 300,155 - -
4,007,258 3,383,123 - -
18.4 Geographical analysis
Namibia 4,006,111 3,083,843 - -
South Africa 1,147 299,280 - -
4,007,258 3,383,123 - -

91
Notes to the Annual Financial Statements (cont)for the year ended 31 December 2007
Group Company
2007 2006 2007 2006
N$’000 N$’000 N$’000 N$’000
19. LONG-TERM SUBORDINATED DEBT INSTRUMENTS
Financialliabilitiesclassification: Other liabilities
Unsecured, subordinated debentures, at issue price as adjusted
for amortised discount and the portion of the coupon
payments in excess of the effective interest expense. 1,487 1,320 - -
The debentures were issued at a discount on 15 September 1995 and are redeemable at their nominal value of N$40 million on 15 September 2030. Interest was payable on these debentures on a six-monthly basis at the rate of 17% per annum on nominal value until 15 September 2000.
Prior to 2001, these coupon payments are partially charged against income and partially against the capital value of the debentures. For the years 2001 to 2030 the effective interest expense is capitalised. The coupon holders are entitled, in the event of interest default, to put the coupon covering such interest payments to Nedbank Limited.
In the unlikely event of redemption prior to 15 September 2030, a contingent liability exists of N$27.8 million (2006: N$27.4 million).
20. POLICYHOLDER LIABILITIES UNDER INSURANCE
CONTRACTS
Balance at beginning of the year 889 2,148 - -
Amounts recognised in income (484) (1,259) - -
Balance at the end of the year 405 889 - -
An independent valuation was performed on the policyholder liability by QED Actuaries and Consultants as at 31 December 2007.
21. DEFERRED TAXATION
The movement on the deferred tax account is as follows:
Balance at beginning of the year 63,000 57,564 - -
Movements during the year
- Prior year adjustments 2,285 836 - -
- Temporary differences 12,418 4,600 - -
- Revaluation of property - movement through equity 8,893 - - -
Balance at end of the year 86,596 63,000 - -
The balance comprises:
Capital allowances 29,846 14,219 - -
Provisions (6,222) (9,687) - -
Debentures 13,479 13,538 - -
Prepaid expenses 21,668 15,908 - -
Suspensive sales 30,196 30,855 - -
Others (2,371) (1,833) - -
86,596 63,000 - -

92
Group Company
2007 2006 2007 2006
N$’000 N$’000 N$’000 N$’000
22. PROVISIONFORPOST-RETIREMENTMEDICALBENEFITS
The Group subsidises 50% of the medical aid contribution of
all employees who joined Nedbank Namibia between 1 April
2000 and 31 January 2003. The subsidy does not apply to any
employees who joined Nedbank Namibia on or after 1 February
2003. Provisions are made for these costs. The charge for the year
is included in the staff costs expense in the income statement.
Valuation method and assumptions:
The actuarial valuation method used to value the liabilities is the
Projected Unit Credit Method prescribed by IAS 19 Employee
Benefits. Future benefits valued are projected using specific
actuarial assumptions and the liability for in-service members is
accrued over expected working lifetime. The actuarial valuation is
obtained once every two years on a cyclical basis. The most recent
valuation was obtained for the year ended 31 December 2007.
The most significant assumptions used are:
Valuation interest rate: 8% per annum
Medical aid contribution inflation: 6.25% per annum
Reconciliationofnetliabilityinthebalancesheet:
Balance at beginning of the year 5,073 4,939 - -
Interest cost 413 391 - -
Current service cost 119 123 - -
Benefits paid (240) (223) - -
Actuarial gain (378) (157) - -
Balance at end of the year 4,987 5,073 - -
An independent actuarial valuation has been performed by Arthur Els & Associates Consulting Actuaries on 31 December 2007.

93
Notes to the Annual Financial Statements (cont)for the year ended 31 December 2007
Group Company
2007 2006 2007 2006
N$’000 N$’000 N$’000 N$’000
23. OTHER LIABILITIES
Financialliabilitiesclassification:Other liabilities
Creditors and other accounts 109,208 89,774 120 136
BEE - managerial cost - 6,892 - -
Managerial fees 25,926 17,625 - -
Non-financialinstruments
Taxation 107 1,538 - -
Deferred revenue 694 463 - -
Bonus provision 7,761 7,595 - -
- opening balance 7,595 7,105 - -
- utilised (12,210) (9,517) - -
- unutilised amounts reversed (914) - - -
- charge to income statement 13,290 10,007 - -
Fraud and self-insurance provision - 25 - -
- opening balance 25 499 - -
- utilised (25) (2,058) - -
- charge to income statement - 1,584 - -
Leave pay accrual 5,432 3,270 - -
- opening balance 3,270 2,700 - -
- utilised (926) (318) - -
- unutilised amounts reversed (2,344) (2,382) - -
- charge to income statement 5,432 3,270 - -
149,128 127,182 120 136
24. SHARE CAPITAL AND SHARE PREMIUM
Issued shares 2007 2006 2007 2006
Number of issued shares at the beginning of the year 70,381,644 66,834,526 70,381,644 66,834,526
Number of shares issued during the year (note 35) - 3,547,118 - 3,547,118
Number of issued shares at the end of the year 70,381,644 70,381,644 70,381,644 70,381,644
Group Company
2007 2006 2007 2006
N$’000 N$’000 N$’000 N$’000
Share capital and share premium
Ordinary shares 17,595 17,595 17,595 17,595
Share premium 99,536 99,536 99,536 99,536
Total 117,131 117,131 117,131 117,131
The total number of authorised shares at year end was 80 000 000 (2006: 80 000 000) ordinary shares of 25 cents (2006: 25 cents)
each. All issued shares are fully paid.
Subject to the restrictions of the Companies Act, the unissued shares are under the control of the directors until the forthcoming annual
general meeting.

94
Group Company
2007 2006 2007 2006
N$’000 N$’000 N$’000 N$’000
25. GENERAL RISK RESERVE
Balance at the beginning of the year - - - -
Movement during the year 23,074 - - -
Balance at the end of the year 23,074 - - -
The general risk reserve is created to comply with the requirements of
BID-2 of the Bank of Namibia regarding the general risk provision.
26. REVALUATION RESERVE
Balance at the beginning of the year 11,688 12,006 - -
Release of revaluation reserve (319) (318) - -
Disposal of land and buildings (49) - - -
Revaluation of land and buildings 16,568 - - -
Balance at the end of the year 27,888 11,688 - -
The revaluation reserve arises on the revaluation of land and buildings.
Where revalued land or buildings are sold or depreciated, the portion
of the property’s revaluation reserve that relates to that asset or
depreciation charge, and is effectively realised, is transferred directly to
retained income.
27. SHARE-BASED PAYMENT RESERVE
Balance at the beginning of the year 16,735 - - -
Movement during the year 874 16,735 - -
Balance at the end of the year 17,609 16,735 - -
The share-based payment reserve, is a contribution from the parent and
equals the amount at which the services from the employees are measured
that arises from the grants of share options and restricted shares issued to
employees under the BEE schemes detailed in note 41.
28. AVAILABLE-FOR-SALE RESERVE
Balance at the beginning of the year - - - -
Movement during the year 5,952 - - -
Balance at the end of the year 5,952 - - -
The available-for-sale reserve arises on revaluation of an available for sale
investment which is listed shares in the holding company, Nedbank Group
Limited, through the BEE scheme. Refer to note 10 and note 41.

95
Group Company
2007 2006 2007 2006
N$’000 N$’000 N$’000 N$’000
29. NET INTEREST INCOME
Interest and discount income
Financial assets classification: Loans and receivables 559,344 466,454 - -
Home loans 172,840 125,370 - -
Other loans and overdrafts 204,971 186,348 - -
Preference share finance 2,815 2,576 - -
Lease and installment debtors 87,606 75,906 - -
Micro loans 81,094 67,427 - -
Other assets 10,018 8,827 - -
Financial assets classification: Financial assets carried at fair
value through profit or loss - held for trading 46,125 28 116 - -
Cash and balances with central banks 18,256 5,990 - -
Government and public sector securities 27,706 15,450 - -
Short-term funds and securities 163 6,676 - -
Total interest and discount income 605,469 494,570 - -
Interest expense
Financial liabilities classification: Other liabilities
Deposit and loan accounts 179,053 111,078 - -
Current and savings accounts 67,816 53,017 1,358 730
Negotiable certificates of deposit 39,990 36,060 - -
Other liabilities 47,945 50,683 - -
Long-term debt instruments 167 169 - -
Total interest expense 334,971 251,007 1,358 730
Net interest income 270,498 243,563 (1,358) (730)
Notes to the Annual Financial Statements (cont)for the year ended 31 December 2007

96
Group Company
2007 2006 2007 2006
N$’000 N$’000 N$’000 N$’000
30. NON-INTEREST INCOME
Commission and fees 72,702 54,772 - -
Dividends 2,187 4,476 - 34,945
Exchange earnings 20,072 17,696 - -
Exchange commission 12,152 8,658 - -
Foreign exchange profit 7,920 9,038 - -
Profit on sale of property and equipment 207 5 - -
Sundry trading gains 3,076 4,892 - -
Change in fair value of: 410 (530) - -
- Financial assets and liabilities designated as fair value through
profit or loss - held for trading 410 (1,462) - -
- Listed investment - 932 - -
Loss on sale of investment in subsidiary - (26) - -
Transfer to policyholder liabilities under insurance contracts 484 1,259 - -
Other income 2,072 12,614 - 12
101,210 95,158 - 34,957

97
Notes to the Annual Financial Statements (cont)for the year ended 31 December 2007
Home loans
Other loans
and overdrafts
Leases and
installment
debtors Micro loans Total
N$’000 N$’000 N$’000 N$’000 N$’000
31. IMPAIRMENT OF ADVANCES
31.1 Movements
Group
2007
Balance at beginning of the year 6,908 18,243 36,342 26,560 88,053
- specific impairment 3,603 7,078 29,070 11,402 51,153
- portfolio impairment 3,305 11,165 7,272 15,158 36,900
Debts recovered 381 1,396 399 6,434 8,610
Debts written off (90) (6,407) (21,921) (10,362) (38,780)
Income statement charge 5,496 11,557 3,894 (8,823) 12,124
- specific impairment 6,620 9,076 9,144 483 25,323
- portfolio impairment (1,124) 2,481 (5,250) (9,306) (13,199)
Balance at end of the year (note 9) 12,695 24,789 18,714 13,809 70,007
- specific impairment 10,514 11,143 16,692 7,957 46,306
- portfolio impairment 2,181 13,646 2,022 5,852 23,701
2006
Balance at beginning of the year 15,443 18,655 11,070 21,821 66,989
- specific impairment 5,351 6,745 5,418 12,433 29,947
- portfolio impairment 10,092 11,910 5,652 9,388 37,042
Debts recovered - - 1,778 8,856 10,634
Debts written off (94) (4,311) (2,721) (11,267) (18,393)
Income statement charge (8,441) 3,899 26,215 7,150 28,823
- specific impairment (1,654) 4,644 24,595 1,380 28,965
- portfolio impairment (6,787) (745) 1,620 5,770 (142)
Balance at end of the year (note 9) 6,908 18,243 36,342 26,560 88,053
- specific impairment 3,603 7,078 29,070 11,402 51,153
- portfolio impairment 3,305 11,165 7,272 15,158 36,900
In 2006 a change in accounting estimate resulted in an additional N$5.4 million portfolio impairment in respect of Micro loans. In accordance with the Group’s accounting policies the Group also raises impairment for incurred but not reported (“IBNR”) losses. Due to more accurate information which has become available in the current year for the calculation of the IBNR losses, the estimate of the impairment was changed.
Included under the income statement charge for specific impairment is interest amounting to N$7.8 million (2006: N$6.2 million) and under the specific impairment balance is interest in suspense amounting to N$13.1 million (2006: N$13.1 million).

98
2007 2006
N$’000 N$’000
31.
31.2
IMPAIRMENT OF ADVANCES (cont)
Sectoral analysis
Specific impairments
Individuals 39,995 48,768
Manufacturing 409 41
Wholesale and trade 131 286
Retailers, catering and accommodation 267 37
Agriculture, forestry and fishing 547 388
Mining and quarrying 108 53
Financial services, insurance and real estate 3,046 58
Government and public sector - -
Building and property development 166 1,193
Transport, storage and communication 1,173 329
Other services 464 -
46,306 51,153
Portfolio impairments
Individuals 7,062 23,293
Manufacturing 952 887
Wholesale and trade 231 1,467
Retailers, catering and accommodation 2,676 1,832
Agriculture, forestry and fishing 1,787 1,360
Mining and quarrying 1,071 119
Financial services, insurance and real estate 6,396 3,942
Government and public sector 1,018 90
Building and property development 740 631
Transport, storage and communication 1,035 407
Other services 733 2,872
23,701 36,900

99
Notes to the Annual Financial Statements (cont)for the year ended 31 December 2007
Group Company
2007 2006 2007 2006
N$’000 N$’000 N$’000 N$’000
32. EXPENSES
Expenses include the following items which are separately
disclosable:
Auditors’ remuneration
- Audit fees - current year 2,104 1,853 235 -
- Audit fees - prior year 1,918 2,103 112 126
- Other services 812 152 - -
Post - retirement medical aid benefit
- Interest cost 413 391 - -
- Current service cost 119 123 - -
- Actuarial gain (378) (157) - -
Depreciation 9,561 5,816 - -
Amortisation of computer software 1,385 6,302 - -
Staff costs 114,637 96,484 345 311
Operating lease charges
- Fixed property 10,496 5,274 - -
- Other 170 1,746 - -
Remuneration other than to employees for :
- Managerial services 25,683 17,625 - -
Directors’ fees paid by the Group
- For services as directors 874 663 98 84
- Managerial services 3,066 407 - -
Key management
- Basic salary and other benefits 8,357 3,036 - -
- Employer pension contribution 602 262 - -
- Employer medical aid contribution 301 93 - -
Value-added tax charge in respect of current expenditure net
of input credits 2,271 1,600 - -
Other expenses 55,947 73,450 102 298
238,338 217,223 892 819
33. BEE TRANSACTION EXPENSES
- BEE share-based payment expenses 874 21,700 - -
- Consultation fees - 6,892 - -
874 28,592 - -
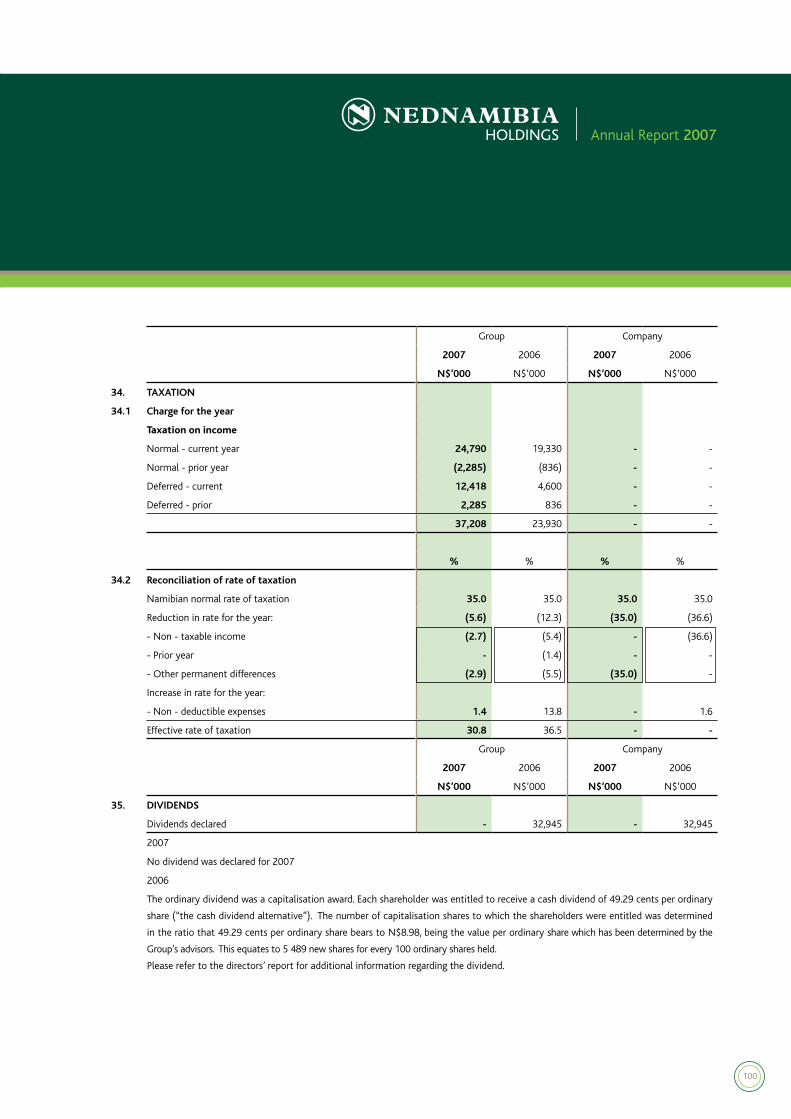
100
Group Company
2007 2006 2007 2006
N$’000 N$’000 N$’000 N$’000
34. TAXATION
34.1 Charge for the year
Taxationonincome
Normal - current year 24,790 19,330 - -
Normal - prior year (2,285) (836) - -
Deferred - current 12,418 4,600 - -
Deferred - prior 2,285 836 - -
37,208 23,930 - -
% % % %
34.2 Reconciliation of rate of taxation
Namibian normal rate of taxation 35.0 35.0 35.0 35.0
Reduction in rate for the year: (5.6) (12.3) (35.0) (36.6)
- Non - taxable income (2.7) (5.4) - (36.6)
- Prior year - (1.4) - -
- Other permanent differences (2.9) (5.5) (35.0) -
Increase in rate for the year:
- Non - deductible expenses 1.4 13.8 - 1.6
Effective rate of taxation 30.8 36.5 - -
Group Company
2007 2006 2007 2006
N$’000 N$’000 N$’000 N$’000
35. DIVIDENDS
Dividends declared - 32,945 - 32,945
2007
No dividend was declared for 2007
2006
The ordinary dividend was a capitalisation award. Each shareholder was entitled to receive a cash dividend of 49.29 cents per ordinary
share (“the cash dividend alternative”). The number of capitalisation shares to which the shareholders were entitled was determined
in the ratio that 49.29 cents per ordinary share bears to N$8.98, being the value per ordinary share which has been determined by the
Group’s advisors. This equates to 5 489 new shares for every 100 ordinary shares held.
Please refer to the directors’ report for additional information regarding the dividend.

101
Notes to the Annual Financial Statements (cont)for the year ended 31 December 2007
Group
2007 2006
Cents per share Cents per share
36. EARNINGS PER SHARE
Basic earnings per share 117.46 57.03
Diluted earnings per share 117.46 57.03
Group
2007 2006
N$’000 N$’000
Basicearningspershare
Earnings used in the calculation of basic earnings per share 82,670 38,893
Group
2007 2006
’000 ’000
Weighted average number of ordinary shares for the purpose of basic earnings per
share 70,382 68,195
Dilutedearningspershare
The earnings and the weighted average number of ordinary shares used in the calculation of all diluted earnings per share measures
are the same as those for the equivalent basic earnings per share measures, as outlined above.

102
Group Company
2007 2006 2007 2006
N$’000 N$’000 N$’000 N$’000
37. CASH FLOW INFORMATION
37.1 Reconciliation of net income before taxation to cash generated by operating activities
Net income / (loss) before taxation 120,944 64,083 (2,250) 33,408
Adjustments: 18,879 40,598 - (34,036)
- Interest accrued 9,691 1,379 - -
- Discount on government stock amortised (855) (1,869) - -
- Income from associates (572) - - -
- Capitalisation dividends - - - (32,945)
- Profit on disposal of fixed property and equipment (207) (5) - -
- Fair value adjustment to financial instruments (410) 1,462 - -
- Impairment of advances 12,124 28,823 - -
- Non-cash movement in provisions 11,781 8,408 - -
- Non-cash movement in leave pay accruals 3,088 888 - -
- Fair value movement in derivatives (395) (1,495) - -
- Non-cash movement in deferred staff compensation (4,166) (4,704) - -
- Fair value adjustment on listed investment - (932) - -
- Loss on sale of investment - 26 - -
- Share-based payment reserve movement 874 16,735 - -
- Depreciation 9,561 5,816 - -
- Computer software amortisation 1,385 6,302 - -
- Movement in long-term subordinated debt instruments 167 167 - -
- Current income tax charge (22,505) (18,494) - -
- Cash dividends (682) (1,909) - (1,091)
Movement in operating assets 59,630 264,293 2,250 4,628
- Deposit, current and other accounts 522,414 390,064 2,250 4,628
- Advances and other accounts (462,784) (125,771) - -
Cash flow from operating activities 199,453 368,974 - 4,000
37.2 Cash received from customers
Interest received 605,469 479,124 - -
Commission and fees received 76,671 59,059 - -
Other income received 22,950 30,744 - 12
705,090 568,927 - 12
37.3 Cash paid to customers
Interest paid on deposits (330,638) (239,572) (1,358) (730)
(330,638) (239,572) (1,358) (730)
37.4 Dividends paid
Amounts outstanding - beginning of year - - - -
Charge to income statement - (1,091) - (1,091)
Dividend to outside shareholders (682) (818) - -
Amounts outstanding - end of year - - - -
(682) (1,909) - (1,091)
The capitalisation award in respect of the dividend declared in 2006, N$31 854 000, is not reflected in the cash flow statement. 3 547 118 shares were issued in this regard.

103
Group Company
2007 2006 2007 2006
N$’000 N$’000 N$’000 N$’000
37. CASH FLOW INFORMATION (cont)
37.5 Taxation paid
Amounts prepaid / (outstanding) - beginning of year 8,781 (932) - -
Charge to income statement (22,505) (18,494) - -
Amounts prepaid - end of year (11,019) (8,781) - -
(24,743) (28,207) - -
37.6 Cash movements in operating liabilities
Current accounts 21,415 (3,265) 291 6,504
Savings deposits 10,647 11,610 - -
Other deposits and loan accounts 552,268 139,990 (16) 124
Foreign currency accounts 109,109 (3,476) - -
Negotiable certificates of deposit (123,739) 187,586 - -
569,700 332,445 275 6,628
37.7 Outflow on disposal of subsidiary
Assets - 3 - -
Liabilities - (34) - -
- (31) - -
Cash - 173 - -
- 142 - -
Minority - (35) - -
Total book value - 107 - -
Loss on sale of investment - (26) - -
Cash flow from acquisition - 81 - -
Bank balances - (173) - -
Total cash flow - (92) - -
37.8 Purchase of non-dealing securities
Other short-term securities (132,310) 66,236 - -
Government and public sector securities 42,031 (103,245) - -
(90,279) (37,009) - -
37.9 Cash and short-term funds
For the purpose of the cash flow statement, cash and short-
term funds comprises the following balances with less than
90 days maturity:
Bank notes and coins (note 4) 73,260 37,973 - -
Balances with central bank (note 4) 45,974 135,183 - -
Due from other banks (note 8) 403,848 276,285 - -
523,082 449,441 - -
Included under cash and balances with central bank are mandatory reserve deposits with Bank of Namibia to the value of N$41
million (2006: N$37 million).
Notes to the Annual Financial Statements (cont)for the year ended 31 December 2007

104
Group Company
2007 2006 2007 2006
N$’000 N$’000 N$’000 N$’000
38. COMMITMENTS
38.1 Capital expenditure
Not yet contracted
- Property and equipment 25,600 28,979 - -
- Intangible assets 19,500 2,164 - -
45,100 31,143 - -
Funds to meet capital expenditure will be provided from internal
resources.
38.2 Bond commitments
Bonds granted, not yet paid out 35,296 2,055 - -
38.3 Undrawn facilities
Original term of maturity of one year or less 383,023 408,711 - -
Interest and foreign exchange rate related items including swaps,
options and futures 871 1,762 - -
383,894 410,473 - -
38.4 Operating leases
Companies in the Group have entered into leases over fixed property
and other equipment for various periods. The charges will increase in
future in line with negotiated escalations and expansions.
The future minimum lease payments in respect of operating leases
are as follows:
Premises
2007 - 6,514 - -
2008 5,544 5,460 - -
2009 4,873 4,751 - -
2010 2,656 2,756 - -
2011 1,335 1,990 - -
2012 552 709 - -
Thereafter - - - -
14,960 22,180 - -

105
Group Company
2007 2006 2007 2006
N$’000 N$’000 N$’000 N$’000
39. PENSION FUND
All eligible employees are members of the Nedbank Namibia
Pension Fund and the Fined Pension Fund respectively,
being defined contribution plans registered in Namibia in
accordance with the requirements of the Pension Fund Act.
The funds are governed by the Pension Fund Act, 1956,
which requires an actuarial valuation every three years. The
findings of independent consulting actuaries, based on their
appraisal of the funds during January 2006, confirmed that
the funds were financially sound.
The total value of contributions to the pension funds during
the year amounted to:
Number of members 697 597 - -
Employer contributions 8,007 6,095 - -
Employee contributions 5,242 3,996 - -
40. CONTINGENT LIABILITIES
Confirmed letters of credit 17,931 1,825 - -
Liabilities under guarantees 230,518 175,350 - -
Legal actions against the Group 620 803 - -
249,069 177,978 - -
The major legal actions filed against the Group are detailed below:
A plea has been served and filed against Nedbank Namibia Limited by the NAMCO group in respect of damages suffered by TFDS
Offshore AS. The contingent liability was originally estimated at N$10 774 574. Nedbank Namibia Limited would have been held
accountable for their share of the participation agreement of 1.95%. Final settlement occurred in February 2007 determined at
USD 85 000 translated at a rate of 7.3843, totalling N$627 666. Nedbank Namibia Limited was only held accountable for N$12 220.
An ex-employee lodged a complaint of unfair dismissal with the District Labour Court of Oshakati and the relief claimed amounts to
N$620 000.
Notes to the Annual Financial Statements (cont)for the year ended 31 December 2007

106
41. SHARE-BASED PAYMENTS
Shares and share options are granted to employees as part of their remuneration package for services rendered, and in terms of the BEE
scheme to clients and partners as an incentive to retain business and develop growth within the Group. The following are share and
share options schemes that have been in place during the year. The BEE schemes will be treated as equity settled.
As the Group cannot estimate reliably the fair value of services received nor the value of additional business received, the Group rebuts
the presumption that such services and business can be measured reliably and, as such, measures their fair value by reference to the
fair value of the options or shares granted. The fair value of such options and shares is measured at the grant date utilising the Black-
Scholes model.
41.1 Description of arrangements
Scheme Trust Description Vesting requirements
Maximum
term
Black Economic Empowerment schemes - Business partners and affinity groups
Black Business Partner Scheme
(BBP)
Central Consortium SPV
Three Investments (Pty)
Ltd, Coastal Consortium
SPV Three Investments
(Pty) Ltd and Northern
Empowerment SPV Three
Investments (Pty) Ltd
Each SPV was issued an
equal number of restricted
shares at N$2.53 per share,
with notional funding over
a period of 10 years. The
beneficial ownership of
the shares resides with the
participants, including the
voting and dividend rights.
No dealing in the shares
during the 10-year no-
tional funding period.
10 years
Affinity Group Scheme (AG) Southern Consortium
SPV Three Investments
(Pty) Ltd and Eastern
Consortium SPV Three
Investments (Pty) Ltd
Each SPV was issued an
equal number of restricted
shares at N$1 per share,
with notional funding over
a period of 10 years. The
beneficial ownership of
the shares resides with the
participants, including the
voting and dividend rights.
No dealing in the shares
during the 10-year no-
tional funding period.
10 years
Benefit scheme in respect of
higher education (Education
Scheme)
The Old Mutual and
Nedbank Namibia
Education Trust
Each SPV was issued an
equal number of restricted
shares at N$1 per share,
with notional funding
over a period of 10 years.
The beneficial ownership
of the shares resides with
the participants, including
the voting and dividend
rights.
No dealing in the shares
during the 10-year
notional funding period.
10 years

107
Notes to the Annual Financial Statements (cont)for the year ended 31 December 2007
41.
41.1
SHARE-BASED PAYMENTS (cont)
Description of arrangements (cont)
Scheme Trust Description Vesting requirements
Maximum
term
Black Economic Empowerment schemes - Business partners and affinity groups (cont)
NedNamibia Discretionary
Scheme
NedNamibia Holdings
Discretionary Trust
Restricted shares were
granted to certain black
employees. The beneficial
ownership of the shares re-
sides with the participants,
including the voting and
dividend rights.
The trust shall hold the
scheme shares linked to
the respective Benefi-
ciary Participation Allo-
cations, for the benefit
of the Beneficiaries until
the Exercise Date.
10 years
Black Economic Empowerment schemes - Employees
Black Management Scheme (Black
Management)
Ofifiya Black
Management Trust
Restricted shares and share
options were granted to
certain black employees on
middle and senior manage-
ment level. The beneficial
ownership of the shares re-
sides with the participants,
including the voting and
dividend rights.
Participants must remain
in service for four, five
and six years, after each
of which 1/3 of the shares
become unrestricted and
1/3 of the options vest.
7 years
Broad-based Employee Scheme
(Broad-based)
Ofifiya Broad-based
Employee Trust
Restricted shares granted
to all qualifying employ-
ees who do not participate
in any other share incen-
tive scheme operating in
the group. The beneficial
ownership of the shares re-
sides with the participants,
including the voting and
dividend rights.
No dealing in the shares
during the restricted pe-
riod of 5 years.
5 years
NedNamibia Holdings Long-term
Incentive Scheme (LTIP)
NedNamibia Holdings
Long-term Incentive
Scheme Trust
Restricted shares and op-
tions awarded to all eligible
employees to promote the
continued growth of Ned-
Namibia Holdings Limited
and to attract and retain
suitably skilled and compe-
tent personnel. The benefi-
cial ownership of the shares
resides with the partici-
pants, including the voting
and dividend rights.
Participants must remain
in service of NedNamibia
Holdings Limited or any
one of its subsidiaries
to qualify as eligible
employees.
3 years

108
Share-based payments expense
Share-based payments liability/
reserve
2007 2006 2007 2006
N$’000 N$’000 N$’000 N$’000
41.
41.2
SHARE-BASED PAYMENTS (cont)
Effect on profit and financial position
Black Economic Empowerment schemes
Black Business Partners (BBP) - 8,997 8,997 8,997
Affinity Groups (AG) - 3,299 3,299 3,299
Education - 4,398 4,398 4,398
Discretionary - - - -
LTIP - - - -
Black Management 874 41 915 41
Broad-based - 4,965 - -
874 21,700 17,609 16,735
2007 2006
Number of
instruments
Weighted
average exercise
price
Number of
instruments
Weighted
average exercise
price
N$ N$
41.3 Black Economic Empowerment schemes
Black Business Partner Scheme
Outstanding at beginning of the year 199,929 278.98 - -
Granted - - 199,929 278.98
Forfeited - - - -
Exercised - - - -
Expired - - - -
Outstanding at end of year 199,929 278.98 199,929 278.98
Exercisable at end of year - - - -
Weighted average share price for options exercised (N$) - -
Affinity Group Scheme
Outstanding at beginning of the year 74,048 282.47 - -
Granted - - 74,048 282.47
Forfeited - - - -
Exercised - - - -
Expired - - - -
Outstanding at end of year 74,048 282.47 74,048 282.47
Exercisable at end of year - - - -
Weighted average share price for options exercised (N$) - -

109
2007 2006
Number of
instruments
Weighted
average exercise
price
Number of
instruments
Weighted
average exercise
price
N$ N$
41. SHARE-BASED PAYMENTS (cont)
41.3 Black Economic Empowerment schemes (cont)
Education Scheme
Outstanding at beginning of the year 98,730 282.47 - -
Granted - - 98,730 282.47
Forfeited - - - -
Exercised - - - -
Expired - - - -
Outstanding at end of year 98,730 282.47 98,730 282.47
Exercisable at end of year - - - -
Weighted average share price for options exercised (N$) - -
Discretionary Scheme
Outstanding at beginning of the year - 282.58 - -
Granted - - - 282.58
Forfeited - - - -
Exercised - - - -
Expired - - - -
Outstanding at end of year - 282.58 - 282.58
Exercisable at end of year - - - -
Weighted average share price for options exercised (N$) - -
LTIP Scheme
Outstanding at beginning of the year - 101.29 - -
Granted - - - 101.29
Forfeited - - - -
Exercised - - - -
Expired - - - -
Outstanding at end of year - 101.29 - 101.29
Exercisable at end of year - - - -
Weighted average share price for options exercised (N$) - -
Notes to the Annual Financial Statements (cont)for the year ended 31 December 2007

110
2007 2006
Number of
instruments
Weighted
average exercise
price
Number of
instruments
Weighted
average exercise
price
N$ N$
41. SHARE-BASED PAYMENTS (cont)
41.3 Black Economic Empowerment schemes (cont)
Black Management Scheme
Outstanding at beginning of the year 75,400 77.92 - -
Granted - - 75,400 77.92
Forfeited - - - -
Exercised - - - -
Expired - - - -
Outstanding at end of year 75,400 77.92 75,400 77.92
Exercisable at end of year - - - -
Weighted average share price for options exercised (N$) - -
Broad-based Scheme
Outstanding at beginning of the year 39,816 - - -
Granted - - 39,816 -
Forfeited - - - -
Exercised - - - -
Expired - - - -
Outstanding at end of year 39,816 - 39,816 -
Exercisable at end of year - - - -
Weighted average share price for options exercised (N$) - -

111
2007 2006
Number of
instruments
Weighted
average
remaining
contractual life
(years)
Number of
instruments
Weighted
average
remaining
contractual life
(years)
41.
41.4
SHARE-BASED PAYMENTS (cont)
Instruments outstanding at the end of the year by
exercise price
BlackBusinessPartnerScheme
278.98 199,929 9.00 199,929 10.00
199,929 9.00 199,929 10.00
AffinityGroupScheme
282.47 74,048 9.00 74,048 10.00
74,048 9.00 74,048 10.00
EducationScheme
282.47 98,730 9.00 98,730 10.00
98,730 9.00 98,730 10.00
DiscretionaryScheme
282.58 - 10.00 - 10.00
- 10.00 - 10.00
LTIPScheme
101.29 - 4.00 - 4.00
- 4.00 - 4.00
BlackManagementScheme
0.00 17,396 4.00 17,396 5.00
101.29 58,004 6.00 58,004 7.00
75,400 5.50 75,400 6.50
Broad-basedScheme
0.00 39,816 - 39,816 -
39,816 - 39,816 -
Notes to the Annual Financial Statements (cont)for the year ended 31 December 2007

112
41. SHARE-BASED PAYMENTS (cont)
41.5 Instruments granted during the year
The weighted average fair value has been calculated using the Black-Scholes option pricing model, using the following inputs and
assumptions:
Black Business Partner Scheme (BBP)
Affinty Group (AG)
Education Scheme
Discre-tionary Scheme
LTIP Scheme
Black Manage-
ment
Broad-based
Scheme
2007
Weighted average fair value per instrument
granted (N$) - - - - - - -
Number of instruments granted - - - - - - -
Weighted average share price (N$) - - - - - - -
Weighted average exercise price (N$) - - - - - - -
Weighted average expected volatility (%)* - - - - - - -
Weighted average life (years) - - - - - - -
Weighted average expected dividends (%) ** - - - - - - -
Weighted average risk-free interest rate (%) - - - - - - -
Number of participants - - - - - - -
Weighted average vesting period (years) - - - - - - -
Possibility of ceasing employment before
vesting (%) - - - - - - -
Expectation of meeting performance criteria (%) - - - - - - -
2006
Weighted average fair value per instrument
granted (N$) 45.00 44.55 44.55 44.55 41.50 59.76 124.70
Number of instruments granted 199,929 74,048 98,730 - - 75,400 39,816
Weighted average share price (N$) 124.00 124.00 124.00 124.00 124.00 124.70 124.70
Weighted average exercise price (N$) 278.98 282.47 282.47 282.58 101.29 77.92 -
Weighted average expected volatility (%) * 29.00% 29.00% 29.00% 29.00% 29.00% 27.90% -
Weighted average life (years) 10.00 10.00 10.00 10.00 4.00 5.80 -
Weighted average expected dividends (%) ** - - - - 4.08% 3.70% -
Weighted average risk-free interest rate (%) 8.10% 8.10% 8.10% 8.10% 8.43% 8.27% -
Number of participants 3 2 1 - - 29 504
Weighted average vesting period (years) 10.00 10.00 10.00 10.00 4.00 5.00 -
Possibility of ceasing employment before
vesting (%) - - - - - 5% -
Expectation of meeting performance criteria (%) - - - - - - -
* Volatility is determined using expected volatility for all shares listed on the JSE.
** The dividend yield used for the grants made has been based on forecast dividends.

113
Notes to the Annual Financial Statements (cont)for the year ended 31 December 2007
42. RELATED PARTY DISCLOSURE
42.1 Parent company
NedNamibia Holdings Limited’s majority shareholder is Nedbank Group Limited (100% ) (2006: 90.5%), which is incorporated in South Africa. The ultimate holding company is Old Mutual Plc. The subsidiaries and associates of these companies are also seen as related companies.
42.2 Identity of related parties with whom transactions have occurred
Subsidiaries and the associate of the group are identified in note 10. All of these entities are related parties. Transactions with directors and director controlled entities are related party transactions.
Group Company
2007 2006 2007 2006
Relationship Transaction type N$’000 N$’000 N$’000 N$’000
42.3 Related party transactions and balances
The following related party transactions have been entered into:
Related party
Interest income
Nedbank Group Limited Holding company Product balance 10,018 8,827 - -
Nedbank London branch Fellow subsidiary Product balance - 387 - -
NIB Holdings (Namibia) (Proprietary) Limited Fellow subsidiary Product balance - 13 - -
Other income
Old Mutual Namibia Limited Fellow subsidiary Other fees 32 180 - -
Old Mutual Namibia Limited Fellow subsidiary Commissions 2,006 2,067 - -
Interest expense
Nedbank Namibia Limited Subsidiary Product balance - - 1,358 730
Nedbank Namibia Pension Fund Pension fund Product balance 93 138 - -
Nedbank Group Limited Holding company Product balance 2,649 9,198 - -
Nedbank Lesotho Fellow subsidiary Product balance - 1,775 - -
NIB Holdings (Namibia) (Proprietary) Limited Fellow subsidiary Product balance 73 - - -
Nedcor Investments Limited Holding company Product balance 2,528 2,801 - -
Old Mutual Namibia Limited Fellow subsidiary Product balance 8,198 16,645 - -
Woodlands Investments Company (Proprietary) Limited
Fellow subsidiary Product balance 9,030 4,412 - -
Expenses
Nedbank Namibia Pension Fund Pension fund
Pension
contributions 7,522 5,753 - -
Nedbank Group Limited Holding company Management fee 25,683 17,625 - -
NedLoans Pension Fund Pension fund
Pension
contributions 485 342 - -
NIB Holdings (Namibia) (Proprietary) Limited Fellow subsidiary
Leases and
rentals 18,369 - - -
Transactions with directors (note 32) Directors
Services as
directors 874 663 98 84
Transactions with directors (note 32) Directors Other services 3,066 407 - -
Transactions with key management (note 32) Key management Staff cost 9,261 3,391 - -
Tusk Investments (Proprietary) Limited Directors Rent 368 118 - -

114
Group Company
2007 2006 2007 2006
Relationship Transaction type N$’000 N$’000 N$’000 N$’000
42. RELATED PARTY DISCLOSURE (cont)
42.3 Related party transactions and balances (cont)
Loans from related party
Nedbank London branch Fellow subsidiary Bank accounts 46 22 - -
Nedbank Namibia Pension Fund Pension fund Bank accounts 833 3,938 - -
Nedbank Treasury (Derivative instruments
included under note 6) Holding company
Derivative
instruments 77 114 - -
NIB Holdings (Namibia) (Proprietary)
Limited Fellow subsidiary Bank accounts 8,697 92 - -
NIB Holdings (Namibia) (Proprietary)
Limited Fellow subsidiary Loan - 587 - -
Old Mutual Namibia Limited Fellow subsidiary Product balance 291,122 191,674 - -
Nedcor Investments Limited Holding company Product balance 9,524 14,339 - -
Nedbank Group Limited Holding company Bank accounts 10,377 15,075 - -
Nedbank Group Limited Holding company Internal settlement - 2,513 - -
Nedbank Group Limited Holding company Structured loans 214,276 299,280 - -
Nedbank Group Limited Holding company Sundry creditor 25,926 17,625 - -
Nedbank Namibia Limited Subsidiary Bank accounts - - 8,326 8,035
Nedbank Namibia Limited Subsidiary Sundry debtor - - 120 136
Transactions with directors Directors Product balance 1,134 414 - -
Transactions with key management Key management Product balance 3 - - -
Woodlands Investments Company
(Proprietary) Limited Fellow subsidiary Bank accounts 111,640 73,505 - -
Loans to related party
Coversure Limited Subsidiary Dividends
receivable - - - 2,000
Nedbank Group Limited Holding company Product balance 81,078 74,166 25 -
Nedbank Group Limited Holding company Internal settlement 135,678 - - -
Nedbank Group Limited Holding company Product balance 750 - - -
Nedbank Treasury (Derivative instruments
included under note 6)
Holding company Dividends
receivable 1,059 1,030 - -
NIB Holdings (Namibia) (Proprietary)
Limited Fellow subsidiary Product balance 658 - - -
Transactions with directors Directors Mortage bonds 3,040 3,487 - -
Transactions with directors Directors Product balance 7,306 8,030 - -
Transactions with key management Key management Product balance 5,947 4,248 - -

115
Notes to the Annual Financial Statements (cont)for the year ended 31 December 2007
43. CAPITAL RISK MANAGEMENT
The capital adequacy is managed in terms with Banking Institutions Act, 1998 (“Act”). The aim of capital risk management is to ensure
that the Group’s major subsidiary, Nedbank Namibia Limited maintains a level of capital which:
(i) is adequate to protect its depositors and creditors;
(ii) is commensurate with the risk activities and profile of the Bank; and
(iii) promotes public confidence in the Bank and the banking system.
Capital is managed under the following definitions:
Tier1(core)capital
Tier 1 capital includes permanent shareholders’ equity (issued and fully paid-up ordinary shares and perpetual non-cumulative preference
shares) plus disclosed reserves (additional paid-in share premium plus retained earnings/undistributed profits) plus minority interests in
consolidated subsidiaries, less intangible assets (goodwill, equity funded through capitalisation of revaluation reserves).
Tier2(supplementary)capital
Tier 2 capital includes asset revaluation reserves; general loan loss provisions; subordinated debt; and hybrid (debt-equity) capital
instruments.
Totalqualifyingcapital
Total qualifying capital means the sum of Tier 1 capital and Tier 2 capital after the deduction of investments in and loans to unconsolidated
financial subsidiaries; investments in the capital of other financial institutions; encumbered assets (assets acquired using capital funds but
subsequently pledged to secure loans or that are no longer available to cover losses from operations); and reciprocal holdings of capital
instruments of banks.
Capitalmeasures
The ratios used for measuring capital adequacy are:
• Leverage (equity) capital ratio (i.e. Tier 1 capital divided by gross assets; for purposes herein, “gross assets” means total assets plus
general and specific provisions);
• Tier 1 risk-based capital ratio (i.e. Tier 1 capital divided by total risk-weighted assets); and
• Total risk-based capital ratio (i.e. total qualifying capital divided by total risk weighted assets).
Totalrisk-weightedcapital
Total risk-weighted capital is the total assets reported in financial returns required to be submitted to the Bank of Namibia, less intangible
assets and the excess of assets classified as loss but not fully provisioned for, after applying the different risk weights to the prescribed
category of assets as set forth in BID-5 of the Act.
Minimumrequirements
The following minimum ratios shall apply (unless higher ratios are set by the Bank for an individual bank based on criteria set forth below):
(a) Leverage Capital: the minimum leverage ratio shall be 6.0%. In accordance with the Act, if a bank is pursuing or experiencing significant
growth, has inadequate risk management systems, an inordinate level of risk, or less than satisfactory asset quality, management,
earnings or liquidity, a higher minimum may be required.

116
43. CAPITAL RISK MANAGEMENT (cont)
Minimumrequirements(cont)
(b) Tier 1 Risk-Based Capital: the minimum Tier 1 ratio shall be 7.0%. In accordance with the Act, if a bank is pursuing or experiencing
significant growth, has inadequate risk management systems, an inordinate level of risk, or less than satisfactory asset quality,
management, earnings or liquidity, a higher minimum may be required.
(c) Total Risk-Based Capital: the minimum total ratio shall be 10.0%. In accordance with the Act, if a bank is pursuing or experiencing
significant growth, has inadequate risk management systems, an inordinate level of risk, or less than satisfactory asset quality,
management, earnings or liquidity, a higher minimum may be required.
2007 2006
% %
Leverage capital 7.02 6.87
Tier 1 risk-based capital 11.29 9.85
Total risk-based capital 14.08 12.19

117
Notes to the Annual Financial Statements (cont)for the year ended 31 December 2007
Notes
At fair value
through
profit and
loss
Loans and
receivables
Financial
liabilities at
amortised
cost
Non-
financial
assets and
liabilities Total
N$’000 N$’000 N$’000 N$’000 N$’000
44. BALANCE SHEET - CATEGORIES OF FINANCIAL
INSTRUMENTS
Group
2007
ASSETS
Cash and balances with central bank 4 119,234 - - - 119,234
Government and public sector securities 5 345,465 - - - 345,465
Derivative financial instruments 6 1,668 - - - 1,668
Other short-term securities 7 30,163 - - - 30,163
Due from other banks 8 - 403,848 - - 403,848
Loans and advances to customers 9 - 4,107,381 - - 4,107,381
Investment in subsidiaries and associates 10 - - - 28,054 28,054
Goodwill 11 - - - 27,623 27,623
Property and equipment 12 - - - 99,538 99,538
Computer software and development cost 13 - - - 14,441 14,441
Non-current assets classified as held for sale 14 - - - 31,496 31,496
Other assets 15 - 223,747 - 32,489 256,236
Total assets 496,530 4,734,976 - 233,641 5,465,147
LIABILITIES
Due to other banks 16 - - 315,940 - 315,940
Other deposits 17 - - 420,820 - 420,820
Derivative financial instruments 6 901 - - - 901
Due to customers 18 - - 4,007,258 - 4,007,258
Long-term subordinated debt instruments 19 - - 1,487 - 1,487
Policyholder liabilities under insurance contracts 20 - - - 405 405
Deferred taxation 21 - - - 86,596 86,596
Provision for post-retirement medical benefits 22 - - - 4,987 4,987
Other liabilities 23 - - 135,134 13,994 149,128
Total liabilities 901 - 4,880,639 105,982 4,987,522

118
Notes
At fair value
through
profit and
loss
Loans and
receivables
Financial
liabilities at
amortised
cost
Non-
financial
assets and
liabilities Total
N$’000 N$’000 N$’000 N$’000 N$’000
44. BALANCE SHEET - CATEGORIES OF
FINANCIAL INSTRUMENTS (cont)
Group
2006
ASSETS
Cash and balances with central bank 4 173,156 - - - 173,156
Government and public sector securities 5 285,349 - - - 285,349
Derivative financial instruments 6 1,062 - - - 1,062
Other short-term securities 7 - - - - -
Due from other banks 8 - 276,285 - - 276,285
Loans and advances to customers 9 - 3,708,392 - - 3,708,392
Investment in subsidiaries and associates 10 - - - 20,501 20,501
Goodwill 11 - - - 27,623 27,623
Property and equipment 12 - - - 61,840 61,840
Computer software and development cost 13 - - - 13,040 13,040
Non-current assets classified as held for sale 14 - - - 21,369 21,369
Other assets 15 - 141,996 - 26,172 168,168
Total assets 459,567 4,126,673 - 170,545 4,756,785
LIABILITIES
Due to other banks 16 - - 259,772 - 259,772
Other deposits 17 - - 544,559 - 544,559
Derivative financial instruments 6 690 - - - 690
Due to customers 18 - - 3,383,123 - 3,383,123
Long-term subordinated debt instruments 19 - - 1,320 - 1,320
Policyholder liabilities under insurance contracts 20 - - - 889 889
Deferred taxation 21 - - - 63,000 63,000
Provision for post-retirement medical benefits 22 - - - 5,073 5,073
Other liabilities 23 - - 114,291 12,891 127,182
Total liabilities 690 - 4,303,065 81,853 4,385,608

119
Notes to the Annual Financial Statements (cont)for the year ended 31 December 2007
Notes
At fair value
through
profit and
loss
Loans and
receivables
Financial
liabilities at
amortised
cost
Non-
financial
assets and
liabilities Total
N$’000 N$’000 N$’000 N$’000 N$’000
44. BALANCE SHEET - CATEGORIES OF
FINANCIAL INSTRUMENTS (cont)
Company
2007
ASSETS
Cash and balances with central bank 4 - - - - -
Government and public sector securities 5 - - - - -
Derivative financial instruments 6 - - - - -
Other short-term securities 7 - - - - -
Due from other banks 8 - - - - -
Loans and advances to customers 9 - - - - -
Investment in subsidiaries and associates 10 - - - 129,642 129,642
Goodwill 11 - - - - -
Property and equipment 12 - - - - -
Computer software and development cost 13 - - - - -
Non-current assets classified as held for sale 14 - - - 4,000 4,000
Other assets 15 - 25 - - 25
Total assets - 25 - 133,642 133,667
LIABILITIES
Due to other banks 16 - - 8,326 - 8,326
Other deposits 17 - - - - -
Derivative financial instruments 6 - - - - -
Due to customers 18 - - - - -
Long-term subordinated debt instruments 19 - - - - -
Policyholder liabilities under insurance contracts 20 - - - - -
Deferred taxation 21 - - - - -
Provision for post-retirement medical benefits 22 - - - - -
Other liabilities 23 - - 120 - 120
Total liabilities - - 8,446 - 8,446

120
Notes
At fair value
through
profit and
loss
Loans and
receivables
Financial
liabilities at
amortised
cost
Non-
financial
assets and
liabilities Total
N$’000 N$’000 N$’000 N$’000 N$’000
44. BALANCE SHEET - CATEGORIES OF
FINANCIAL INSTRUMENTS (cont)
Company
2006
ASSETS
Cash and balances with central bank 4 - - - - -
Government and public sector securities 5 - - - - -
Derivative financial instruments 6 - - - - -
Other short-term securities 7 - - - - -
Due from other banks 8 - - - - -
Loans and advances to customers 9 - - - - -
Investment in subsidiaries and associates 10 - - - 133,642 133,642
Goodwill 11 - - - - -
Property and equipment 12 - - - - -
Computer software and development cost 13 - - - - -
Non-current assets classified as held for sale 14 - - - - -
Other assets 15 - 2,000 - - 2,000
Total assets - 2,000 - 133,642 135,642
LIABILITIES
Due to other banks 16 - - 8,035 - 8,035
Other deposits 17 - - - - -
Derivative financial instruments 6 - - - - -
Due to customers 18 - - - - -
Long-term subordinated debt instruments 19 - - - - -
Policyholder liabilities under insurance contracts 20 - - - - -
Deferred taxation 21 - - - - -
Provision for post-retirement medical benefits 22 - - - - -
Other liabilities 23 - - 136 - 136
Total liabilities - - 8,171 - 8,171

121
Notes to the Annual Financial Statements (cont)for the year ended 31 December 2007
45. CREDIT RISK
Credit risk refers to the risk that a counterparty will default on its contractual obligations resulting in financial loss to the Group.
45.1 Credit risk management
The Credit Department assesses all exposures and monitors the implementation of the Group’s credit policy to ensure that the exten-
sion, control and maintenance of credit, as well as the process of providing for and writing off of bad debts, are executed in a proper
way and within laid-down policy.
The Credit Committee approves all third - party risks, including sovereign and counterparty risks, within a prescribed limit, as delegated by the
Board of directors. All credit exposures in excess of the authorised limits of the Credit Committee are referred to the Nedbank Group Africa
Credit Committee for approval.
Refer to the section under the heading “Credit Risk” in the Corporate Governance report to the annual financial statements for more
detail on credit risk manangement.
Group Company
2007 2006 2007 2006
N$’000 N$’000 N$’000 N$’000
45.2.1 Credit risk: Maximum exposure
Assets
Cash and balances with central bank 119,234 173,156 - -
Government and public sector securities 345,465 285,349 - -
Derivative financial instruments 1,668 1,062 - -
Other short-term securities 30,163 - - -
Due from other banks 403,848 276,285 - -
Loans and advances to customers 4,177,388 3,796,445 - -
Investment in subsidiaries and associates - - - -
Goodwill - - - -
Property and equipment - - - -
Computer software and development cost - - - -
Non-current assets classified as held for sale - - - -
Other assets 223,747 141,996 25 2,000
Total maximum exposure 5,301,513 4,674,293 25 2,000

122
45.
45.2.2
CREDIT RISK (cont)
Credit risk: Collateral held in respect of 45.2.1
Collateral is only held in respect of loans and advances. Below follows a description of the type of collateral held per class of loans and
advances to customers:
Homeloans: Secured by commercial property mortgage, residential property mortgage, surety-ship, guarantees. Cession of life cover
and fire cover is not considered security but is recommended as an additional safety measure in the event of death or fire.
Otherloansandoverdrafts: Cession of life cover, secured by non-movable property, surety ship, guarantees, unsecured.
Preferencesharefinance:Put option for sale of preference shares, guarantees from foreign banks.
Leases and installment debtors: Secured by movable property under debt granted.
Microloans: Unsecured
Group Company
2007 2006 2007 2006
N$’000 N$’000 N$’000 N$’000
Assets
Cash and balances with central bank - - - -
Government and public sector securities - - - -
Derivative financial instruments - - - -
Other short-term securities - - - -
Due from other banks - - - -
Loans and advances to customers 4,107,382 3,265,353 - -
- Home loans 1,439,442 1,229,132 - -
- Other loans and overdrafts (including other loans and
overdrafts to subsidiary companies) 1,700,140 1,107,808 - -
- Preference share finance 46,200 30,000 - -
- Net leases and installment debtors 640,645 626,265 - -
- Micro loans 280,955 272,148 - -
Investment in subsidiaries and associates - - - -
Goodwill - - - -
Property and equipment - - - -
Computer software and development cost - - - -
Non-current assets classified as held for sale - - - -
Other assets - - - -
Total collateral held 4,107,382 3,265,353 - -

123
Notes to the Annual Financial Statements (cont)for the year ended 31 December 2007
45. CREDIT RISK (cont)
45.2.3 Credit risk: Fair value of collateral
The Group determines the fair value only on the following instances:
- on the date the loan or advance is initiated and / or
- when the loan or advance is being renegotiated or
- when a loan or advance has been transferred to the legal department of the Group for collection.
At reporting date the fair value of the collateral held has not been provided due to the impracticality thereof. The system currently
maintaining the collateral does not have the fair value readily available. The fair value of the collateral is determined by means of a
manual process and the volume of collateral held makes it impractical for the Group.

124
Group Company
2007 2006 2007 2006
N$’000 N$’000 N$’000 N$’000
45.
45.3
CREDIT RISK (cont)
Credit risk analysis
Classification:Impaired
Assets
Cash and balances with central bank - - - -
Government and public sector securities - - - -
Derivative financial instruments - - - -
Other short-term securities - - - -
Due from other banks - - - -
Loans and advances to customers 361,479 686,717 - -
- Home loans 120,573 178,369 - -
- Other loans and overdrafts (including other loans and
overdrafts to subsidiary companies) 163,682 285,950 - -
- Preference share finance - - - -
- Net leases and installment debtors 40,746 124,704 - -
- Micro loans 36,478 97,694 - -
Impairment of advances (note 31) (70,007) (88,053) - -
- Home loans (12,695) (6,908) - -
- Other loans and overdrafts (including other loans and
overdrafts to subsidiary companies) (24,789) (18,243) - -
- Preference share finance - - - -
- Net leases and installment debtors (18,714) (36,342) - -
- Micro loans (13,809) (26,560) - -
Investment in subsidiaries and associates - - - -
Goodwill - - - -
Property and equipment - - - -
Computer software and development cost - - - -
Non-current assets classified as held for sale - - - -
Other assets - - - -
Total impaired 291,472 598,664 - -
Impaired advances are all advances which are not current nor past due. Thus the advances above represent both general and specific
non-performing loans and advances.

125
Notes to the Annual Financial Statements (cont)for the year ended 31 December 2007
No risk AAABBB- to
BB+ BB+ to BB BB BB to BB- BB- to B+ B+ B+ to B B to B- B- to CCC CCC CCC to C DNon -IFRS7 Instruments Total
N$’000 N$’000 N$’000 N$’000 N$’000 N$’000 N$’000 N$’000 N$’000 N$’000 N$’000 N$’000 N$’000 N$’000 N$’000 N$’000
45. CREDIT RISK (cont)
45.3 Credit risk analysis (cont)
Classification: Neither past due nor impaired
Group
2007
Assets
Cash and balances with central bank 119,234 - - - - - - - - - - - - - - 119,234
Government and public sector securities - 345,465 - - - - - - - - - - - - - 345,465
Derivative financial instruments - - 1,668 - - - - - - - - - - - - 1,668
Other short-term securities - 30,163 - - - - - - - - - - - - - 30,163
Due from other banks 403,848 - - - - - - - - - - - - - - 403,848
Loans and advances to customers - - 16,415 103,800 93,395 42,308 58,451 51,666 415 958 - - 3,132,569 199 - 3,500,176
- Home loans - - - 3,860 4,777 2,856 1,002 2,871 - - - - 1,226,704 - - 1,242,070
- Other loans and overdrafts
(including other loans and overdrafts to subsidiary companies) - - 13,540 94,292 50,021 33,566 29,089 17,764 345 129 - - 1,144,261 199 - 1,383,206
- Preference share finance - - - - - - - 30,000 - - - - 16,200 - - 46,200
- Net leases and installment debtors - - 2,875 5,648 38,597 5,886 28,360 1,031 70 829 - - 522,570 - - 605,866
- Micro loans - - - - - - - - - - - - 222,834 - - 222,834
Investment in subsidiaries and associates - - - - - - - - - - - - - - 28,054 28,054
Goodwill - - - - - - - - - - - - - - 27,623 27,623
Property and equipment - - - - - - - - - - - - - - 99,538 99,538
Computer software and development cost - - - - - - - - - - - - - - 14,441 14,441
Non-current assets classified as held for sale - - - - - - - - - - - - - - 31,496 31,496
Other assets - 148,464 - - - - - 75,283 - - - - - - 32,489 256,236
Total neither past due nor impaired 523,082 524,092 18,083 103,800 93,395 42,308 58,451 126,949 415 958 - - 3,132,569 199 233,641 4,857,942
2006
Assets
Cash and balances with central bank 173,156 - - - - - - - - - - - - - - 173,156
Government and public sector securities - 285,349 - - - - - - - - - - - - - 285,349
Derivative financial instruments - - 1,062 - - - - - - - - - - - - 1,062
Other short-term securities - - - - - - - - - - - - - - - -
Due from other banks 276,285 - - - - - - - - - - - - - - 276,285
Loans and advances to customers - - 18,148 29,246 106,572 47,146 74,499 65,478 3,712 710 - - 1,375,168 - - 1,720,679
- Home loans - - - 3,364 3,104 926 118 1,621 - - - - 532,253 - - 541,386
- Other loans and overdrafts
(including other loans and overdrafts to subsidiary companies) - - 14,559 20,405 70,653 39,360 69,342 31,804 3,712 599 - - 319,583 - - 570,017
- Preference share finance - - - - - - - 30,000 - - - - - - - 30,000
- Net leases and installment debtors - - 3,589 5,477 32,815 6,860 5,039 2,053 - 111 - - 445,860 - - 501,804
- Micro loans - - - - - - - - - - - - 77,472 - - 77,472
Investment in subsidiaries and associates - - - - - - - - - - - - - - 20,501 20,501
Goodwill - - - - - - - - - - - - - - 27,623 27,623
Property and equipment - - - - - - - - - - - - - - 61,840 61,840
Computer software and development cost - - - - - - - - - - - - - - 13,040 13,040
Non-current assets classified as held for sale - - - - - - - - - - - - - - 21,369 21,369
Other assets - 76,730 - - - - - 65,266 - - - - - - 26,172 168,168
Total neither past due nor impaired 449,441 362,079 19,210 29,246 106,572 47,146 74,499 130,744 3,712 710 - - 1,375,168 - 170,545 2,769,072

126
No risk AAABBB- to
BB+ BB+ to BB BB BB to BB- BB- to B+ B+ B+ to B B to B- B- to CCC CCC CCC to C DNon -IFRS7 Instruments Total
N$’000 N$’000 N$’000 N$’000 N$’000 N$’000 N$’000 N$’000 N$’000 N$’000 N$’000 N$’000 N$’000 N$’000 N$’000 N$’000
45. CREDIT RISK (cont)
45.3 Credit risk analysis (cont)
Classification: Neither past due nor impaired
Group
2007
Assets
Cash and balances with central bank 119,234 - - - - - - - - - - - - - - 119,234
Government and public sector securities - 345,465 - - - - - - - - - - - - - 345,465
Derivative financial instruments - - 1,668 - - - - - - - - - - - - 1,668
Other short-term securities - 30,163 - - - - - - - - - - - - - 30,163
Due from other banks 403,848 - - - - - - - - - - - - - - 403,848
Loans and advances to customers - - 16,415 103,800 93,395 42,308 58,451 51,666 415 958 - - 3,132,569 199 - 3,500,176
- Home loans - - - 3,860 4,777 2,856 1,002 2,871 - - - - 1,226,704 - - 1,242,070
- Other loans and overdrafts
(including other loans and overdrafts to subsidiary companies) - - 13,540 94,292 50,021 33,566 29,089 17,764 345 129 - - 1,144,261 199 - 1,383,206
- Preference share finance - - - - - - - 30,000 - - - - 16,200 - - 46,200
- Net leases and installment debtors - - 2,875 5,648 38,597 5,886 28,360 1,031 70 829 - - 522,570 - - 605,866
- Micro loans - - - - - - - - - - - - 222,834 - - 222,834
Investment in subsidiaries and associates - - - - - - - - - - - - - - 28,054 28,054
Goodwill - - - - - - - - - - - - - - 27,623 27,623
Property and equipment - - - - - - - - - - - - - - 99,538 99,538
Computer software and development cost - - - - - - - - - - - - - - 14,441 14,441
Non-current assets classified as held for sale - - - - - - - - - - - - - - 31,496 31,496
Other assets - 148,464 - - - - - 75,283 - - - - - - 32,489 256,236
Total neither past due nor impaired 523,082 524,092 18,083 103,800 93,395 42,308 58,451 126,949 415 958 - - 3,132,569 199 233,641 4,857,942
2006
Assets
Cash and balances with central bank 173,156 - - - - - - - - - - - - - - 173,156
Government and public sector securities - 285,349 - - - - - - - - - - - - - 285,349
Derivative financial instruments - - 1,062 - - - - - - - - - - - - 1,062
Other short-term securities - - - - - - - - - - - - - - - -
Due from other banks 276,285 - - - - - - - - - - - - - - 276,285
Loans and advances to customers - - 18,148 29,246 106,572 47,146 74,499 65,478 3,712 710 - - 1,375,168 - - 1,720,679
- Home loans - - - 3,364 3,104 926 118 1,621 - - - - 532,253 - - 541,386
- Other loans and overdrafts
(including other loans and overdrafts to subsidiary companies) - - 14,559 20,405 70,653 39,360 69,342 31,804 3,712 599 - - 319,583 - - 570,017
- Preference share finance - - - - - - - 30,000 - - - - - - - 30,000
- Net leases and installment debtors - - 3,589 5,477 32,815 6,860 5,039 2,053 - 111 - - 445,860 - - 501,804
- Micro loans - - - - - - - - - - - - 77,472 - - 77,472
Investment in subsidiaries and associates - - - - - - - - - - - - - - 20,501 20,501
Goodwill - - - - - - - - - - - - - - 27,623 27,623
Property and equipment - - - - - - - - - - - - - - 61,840 61,840
Computer software and development cost - - - - - - - - - - - - - - 13,040 13,040
Non-current assets classified as held for sale - - - - - - - - - - - - - - 21,369 21,369
Other assets - 76,730 - - - - - 65,266 - - - - - - 26,172 168,168
Total neither past due nor impaired 449,441 362,079 19,210 29,246 106,572 47,146 74,499 130,744 3,712 710 - - 1,375,168 - 170,545 2,769,072

127
Group Company
2007 2006 2007 2006
N$’000 N$’000 N$’000 N$’000
Classification: Renegotiated
Assets
Cash and balances with central bank - - - -
Government and public sector securities - - - -
Derivative financial instruments - - - -
Other short-term securities - - - -
Due from other banks - - - -
Loans and advances to customers 6,507 458,342 - -
- Home loans 6,227 419,589 - -
- Other loans and overdrafts
(including other loans and overdrafts to subsidiary companies) 280 25,651 - -
- Preference share finance - - - -
- Net leases and installment debtors - 13,102 - -
- Micro loans - - - -
Investment in subsidiaries and associates - - - -
Goodwill - - - -
Property and equipment - - - -
Computer software and development cost - - - -
Non-current assets classified as held for sale - - - -
Other assets - - - -
Total renegotiated 6,507 458,342 - -
The renegotiated loans and advances were not readily available for the 2006 financial year due to system restraints. To obtain a com-parative figure each loan and advance for 2006 was evaluated for any change in terms, interest or installment. When either one of these variables changed without a corresponding change in the prime interest rate the loan or advance was considered to be renegotiated for IFRS 7 purposes. This might not reflect an actual renegotiation. In 2007 the new system allowed the Bank to use an indicator to track any renegotiated loans and advances.
Notes to the Annual Financial Statements (cont)for the year ended 31 December 2007
No risk AAABBB- to
BB+ BB+ to BB BB BB to BB- BB- to B+ B+ B+ to B B to B- B- to CCC CCC CCC to C DNon -IFRS7 Instruments Total
N$’000 N$’000 N$’000 N$’000 N$’000 N$’000 N$’000 N$’000 N$’000 N$’000 N$’000 N$’000 N$’000 N$’000 N$’000 N$’000
45. CREDIT RISK (cont)
45.3 Credit risk analysis (cont)
Classification: Neither past due nor impaired
Company
2007
Assets
Investment in subsidiaries and associates - - - - - - - - - - - - - - 129,642 129,642
Non-current assets classified as held for sale - - - - - - - - - - - - - - 4,000 4,000
Other assets - 25 - - - - - - - - - - - - - 25
Total neither past due nor impaired - 25 - - - - - - - - - - - - 133,642 133,667
2006
Assets
Investment in subsidiaries and associates - - - - - - - - - - - - - - 133,642 133,642
Other assets - 2,000 - - - - - - - - - - - - - 2,000
Total neither past due nor impaired - 2,000 - - - - - - - - - - - - 133,642 135,642

128
Group Company
2007 2006 2007 2006
N$’000 N$’000 N$’000 N$’000
<30 days <30 days <30days <30 days
Classification: Past due
Assets
Cash and balances with central bank - - - -
Government and public sector securities - - - -
Derivative financial instruments - - - -
Other short-term securities - - - -
Due from other banks - - - -
Loans and advances to customers 309,227 487,669 - -
- Home loans 83,267 96,696 - -
- Other loans and overdrafts
(including other loans and overdrafts to subsidiary companies) 177,761 244,432 - -
- Preference share finance - - - -
- Net leases and installment debtors 12,747 22,998 - -
- Micro loans 35,452 123,543 - -
Investment in subsidiaries and associates - - - -
Goodwill - - - -
Property and equipment - - - -
Computer software and development cost - - - -
Non-current assets classified as held for sale - - - -
Other assets - - - -
Total past due 309,227 487,669 - -
Past due: A financial asset is past due when a counterparty has failed to make a payment when contractually due.
No risk AAABBB- to
BB+ BB+ to BB BB BB to BB- BB- to B+ B+ B+ to B B to B- B- to CCC CCC CCC to C DNon -IFRS7 Instruments Total
N$’000 N$’000 N$’000 N$’000 N$’000 N$’000 N$’000 N$’000 N$’000 N$’000 N$’000 N$’000 N$’000 N$’000 N$’000 N$’000
45. CREDIT RISK (cont)
45.3 Credit risk analysis (cont)
Classification: Neither past due nor impaired
Company
2007
Assets
Investment in subsidiaries and associates - - - - - - - - - - - - - - 129,642 129,642
Non-current assets classified as held for sale - - - - - - - - - - - - - - 4,000 4,000
Other assets - 25 - - - - - - - - - - - - - 25
Total neither past due nor impaired - 25 - - - - - - - - - - - - 133,642 133,667
2006
Assets
Investment in subsidiaries and associates - - - - - - - - - - - - - - 133,642 133,642
Other assets - 2,000 - - - - - - - - - - - - - 2,000
Total neither past due nor impaired - 2,000 - - - - - - - - - - - - 133,642 135,642

129
Notes to the Annual Financial Statements (cont)for the year ended 31 December 2007
46. LIQUIDITY RISK
Liquidity risk is the risk that an entity will encounter difficulty in meeting obligations associated with financial liabilities.
46.1 Liquidityriskmanagement
By monitoring the maturity profile of the current balance sheet as well as its expected future structure Alco proactively monitors this risk and is able to manage any potential mismatches in accordance with best banking practice. Refer to the section under the heading “Liquidity Risk” in the Corporate Governance report to the annual financial statements for more detail on liquidity risk manangement.
Up to 3 months
3 - 6 months
6 - 12 months 1 - 5 years
Over 5 years
Equity/Non-determined Total
N$’000 N$’000 N$’000 N$’000 N$’000 N$’000 N$’000
46.2 Expectedliquidityrisk
Group
2007
ASSETS
Cash and balances with central bank 119,234 - - - - - 119,234
Government and public sector securities 153,521 39,138 69,127 74,944 8,735 - 345,465
Derivative financial instruments 795 - - 873 - - 1,668
Other short-term securities 30,163 - - - - - 30,163
Due from other banks 403,848 - - - - - 403,848
Loans and advances to customers 135,701 197,637 523,386 3,068,440 252,224 (70,007) 4,107,381
Investment in subsidiaries and associates - - - - - 28,054 28,054
Goodwill - - - - - 27,623 27,623
Property and equipment - - - - - 99,538 99,538
Computer software and development cost - - - - - 14,441 14,441
Non-current assets classified as held for sale - - 31,496 - - - 31,496
Other assets 170,003 - - 75,283 - 10,950 256,236
Totalassets 1,013,265 236,775 624,009 3,219,540 260,959 110,599 5,465,147
LIABILITIES
Due to other banks 100 534 42,084 273,222 - - 315,940
Other deposits 62,155 171,998 133,455 53,212 - - 420,820
Derivative financial instruments 114 - 787 - - - 901
Due to customers 702,638 1,144,020 1,357,963 802,637 - - 4,007,258
Long-term subordinated debt instruments - - - - 1,487 - 1,487
Policyholder liabilities under insurance contracts - - - - - 405 405
Deferred taxation - - - - - 86,596 86,596
Provision for post-retirement medical benefits - - - - 4,987 - 4,987
Other liabilities 149,128 - - - - - 149,128
Totalliabilities 914,135 1,316,552 1,534,289 1,129,071 6,474 87,001 4,987,522
SHAREHOLDER’SEQUITY
Share capital - - - - - 17,595 17,595
Share premium - - - - - 99,536 99,536
General risk reserve - - - - - 23,074 23,074
Revaluation reserve - - - - - 27,888 27,888
Share-based payment reserve - - - - - 17,609 17,609
Available-for-sale reserve - - - - - 5,952 5,952
Retained income - - - - - 281,014 281,014
Shareholder’s interest - - - - - 472,668 472,668
Minority interest - - - - - 4,957 4,957
Totalshareholder’sequityandminorityinterest - - - - - 477,625 477,625
Totalequityandliabilities 914,135 1,316,552 1,534,289 1,129,071 6,474 564,626 5,465,147
Netliquiditygap 99,130 (1,079,777) (910,280) 2,090,469 254,485 (454,027) -
Accumulativenetliquiditygap 99,130 (980,647) (1,890,927) 199,542 454,027 -

130
Up to 3 months
3 - 6 months
6 - 12 months 1 - 5 years
Over 5 years
Equity/Non-determined Total
N$’000 N$’000 N$’000 N$’000 N$’000 N$’000 N$’000
46.
46.2
LIQUIDITY RISK (cont)
Expectedliquidityrisk(cont)
Group
2006
ASSETS
Cash and balances with central bank 173,156 - - - - - 173,156
Government and public sector securities 23,978 66,762 113,714 78,319 2,576 - 285,349
Derivative financial instruments 300 - - 762 - - 1,062
Other short-term securities - - - - - - -
Due from other banks 276,285 - - - - - 276,285
Loans and advances to customers 1,435,712 266,332 598,364 909,608 586,429 (88,053) 3,708,392
Investment in subsidiaries and associates - - - - - 20,501 20,501
Goodwill - - - - - 27,623 27,623
Property and equipment - - - - - 61,840 61,840
Computer software and development cost - - - - - 13,040 13,040
Non-current assets classified as held for sale - - 21,369 - - - 21,369
Other assets 99,738 - - 68,430 - - 168,168
Totalassets 2,009,169 333,094 733,447 1,057,119 589,005 34,951 4,756,785
LIABILITIES
Due to other banks 257,360 534 440 1,438 - - 259,772
Other deposits 169,621 298,894 76,044 - - - 544,559
Derivative financial instruments 319 - - 371 - - 690
Due to customers 2,815,942 213,700 53,913 299,568 - - 3,383,123
Long-term subordinated debt instruments - - - - 1,320 - 1,320
Policyholder liabilities under insurance contracts - - - - - 889 889
Deferred taxation - - - - - 63,000 63,000
Provision for post-retirement medical benefits - - - - 5,073 - 5,073
Other liabilities 124,135 - 3,047 - - - 127,182
Totalliabilities 3,367,377 513,128 133,444 301,377 6,393 63,889 4,385,608
SHAREHOLDER’SEQUITY
Share capital - - - - - 17,595 17,595
Share premium - - - - - 99,536 99,536
General risk reserve - - - - - - -
Revaluation reserve - - - - - 11,688 11,688
Share-based payment reserve - - - - - 16,735 16,735
Available-for-sale reserve - - - - - - -
Retained income - - - - - 221,050 221,050
Shareholder’s interest - - - - - 366,604 366,604
Minority interest - - - - - 4,573 4,573
Totalshareholder’sequityandminority
interest - - - - - 371,177 371,177
Totalequityandliabilities 3,367,377 513,128 133,444 301,377 6,393 435,066 4,756,785
Netliquiditygap (1,358,208) (180,034) 600,003 755,742 582,612 (400,115) -
Accumulativenetliquiditygap (1,358,208) (1,538,242) (938,239) (182,497) 400,115 -

131
Notes to the Annual Financial Statements (cont)for the year ended 31 December 2007
Up to 3 months
3 - 6 months
6 - 12 months 1 - 5 years
Over 5 years
Equity/Non-determined Total
N$’000 N$’000 N$’000 N$’000 N$’000 N$’000 N$’000
46. LIQUIDITY RISK (cont)
46.2 Expectedliquidityrisk(cont)
Company
2007
ASSETS
Investment in subsidiaries and associates - - - - - 129,642 129,642
Non-current assets classified as held for sale - - - - - 4,000 4,000
Other assets - 25 - - - - 25
Totalassets - 25 - - - 133,642 133,667
LIABILITIES
Due to other banks - - 8,326 - - - 8,326
Other liabilities - 120 - - - - 120
Totalliabilities - 120 8,326 - - - 8,446
SHAREHOLDER’SEQUITY
Share capital - - - - - 17,595 17,595
Share premium - - - - - 99,536 99,536
Retained income - - - - - 8,090 8,090
Shareholder’s interest - - - - - 125,221 125,221
Totalequityandliabilities - 120 8,326 - - 125,221 133,667
Netliquiditygap - (95) (8,326) - - 8,421 -
Accumulativenetliquiditygap - (95) (8,421) (8,421) (8,421) -
2006
ASSETS
Investment in subsidiaries and associates - - - - - 133,642 133,642
Other assets - 2,000 - - - - 2,000
Totalassets - 2,000 - - - 133,642 135,642
LIABILITIES
Due to other banks - - 8,035 - - - 8,035
Other liabilities - 136 - - - - 136
Totalliabilities - 136 8,035 - - - 8,171
SHAREHOLDER’SEQUITY
Share capital - - - - - 17,595 17,595
Share premium - - - - - 99,536 99,536
Retained income - - - - - 10,340 10,340
Shareholder’s interest - - - - - 127,471 127,471
Totalequityandliabilities - 136 8,035 - - 127,471 135,642
Netliquiditygap - 1,864 (8,035) - - 6,171 -
Accumulativenetliquiditygap - 1,864 (6,171) (6,171) (6,171) -

132
On demand
Up to 3 months
3 - 6 months
6 - 12 months
1 - 5 years
Over 5 years
Equity / Non-determined Total
N$’000 N$’000 N$’000 N$’000 N$’000 N$’000 N$’000 N$’000
46. 46.3
LIQUIDITY RISK (cont)Contractualliquidityriskanalysisforfinancialliabilities
Group
2007
LIABILITIES
Due to other banks - 129 278 42,071 273,557 - - 316,035
Other deposits - 237,148 53,284 146,592 - - - 437,024
Derivative financial instruments - 114 - 787 - - - 901
Due to customers 2,732,392 798,071 515,518 163,364 418 - - 4,209,763
Long-term subordinated debt instruments - - - - - 40,000 - 40,000
Policyholder liabilities under insurance contracts - - - - - - 405 405
Deferred taxation - - - - - - 86,596 86,596
Provision for post-retirement medical benefits - - - - - - 4,987 4,987
Other liabilities 149,128 - - - - - - 149,128
Totalliabilities 2,881,520 1,035,462 569,080 352,814 273,975 40,000 91,988 5,244,839
2006
LIABILITIES
Due to other banks 257,260 141 825 736 1,130 - - 260,092
Other deposits - 334,040 198,812 23,039 - - - 555,891
Derivative financial instruments - 319 - - 371 - - 690
Due to customers 2,200,387 879,064 43,988 40,016 291,058 - - 3,454,513
Long-term subordinated debt instruments - - - - - 40,000 - 40,000
Policyholder liabilities under insurance contracts - - - - - - 889 889
Deferred taxation - - - - - - 63,000 63,000
Provision for post-retirement medical benefits - - - - - - 5,073 5,073
Other liabilities 127,182 - - - - - - 127,182
Totalliabilities 2,584,829 1,213,564 243,625 63,791 292,559 40,000 68,962 4,507,330
Company
2007
LIABILITIES
Due to other banks 8,326 - - - - - - 8,326
Other liabilities - 120 - - - - - 120
Totalliabilities 8,326 120 - - - - - 8,446
2006
LIABILITIES
Due to other banks 8,035 - - - - - - 8,035
Other liabilities - 136 - - - - - 136
Total liabilities 8,035 136 - - - - - 8,171
The maturity analysis detailed under the contractual liquidity risk analysis for financial liabilities includes future interest.

133
47. MARKETRISK
Market risk is the risk that the fair value or future cash flows of a financial instrument will fluctuate because of changes in the market
prices. Market risk comprises three types of risk: currency risk, interest rate risk and other price risk. The Group is exposed to both currency
and interest rate risk. Refer to note 48 and note 49 for disclosure regarding these risks.
48. CURRENCYRISK
Currency risk is the risk that the fair value or future cash flows of a financial instrument will fluctuate because of changes in the foreign
exchange rates.
48.1 CURRENCYRISKMANAGEMENT
Foreign exchange dealers monitor exchange rate movements on an ongoing basis and operate within pre-approved limits, based on their
knowledge, expertise and experience. The risk of money market/capital market instruments being repriced due to interest rate movements
are also monitored by dealers to remain within approved limits. Refer to the section under the heading “Currency Risk” in the Corporate
Governance report to the annual financial statements for more detail on currency risk manangement.
Notes to the Annual Financial Statements (cont)for the year ended 31 December 2007

134
N$ EUR US$ GBP Other Total
N$’000 N$’000 N$’000 N$’000 N$’000 N$’000
48.
48.2
CURRENCYRISK(cont)
Currencyriskprofile
Group
2007
ASSETS
Cash and balances with central bank 87,260 5,030 25,826 690 428 119,234
Government and public sector securities 345,465 - - - - 345,465
Derivative financial instruments 1,668 - - - - 1,668
Other short-term securities 30,163 - - - - 30,163
Due from other banks 273,525 4,494 125,334 121 374 403,848
Loans and advances to customers 4,099,432 3,990 3,959 - - 4,107,381
Investment in subsidiaries and associates 28,054 - - - - 28,054
Goodwill 27,623 - - - - 27,623
Property and equipment 99,538 - - - - 99,538
Computer software and development cost 14,441 - - - - 14,441
Non-current assets classified as held for sale 31,496 - - - - 31,496
Other assets 256,167 48 21 - - 256,236
Totalassets 5,294,832 13,562 155,140 811 802 5,465,147
LIABILITIES
Due to other banks 315,940 - - - - 315,940
Other deposits 420,820 - - - - 420,820
Derivative financial instruments 901 - - - - 901
Due to customers 3,840,282 8,318 157,662 595 401 4,007,258
Long-term subordinated debt instruments 1,487 - - - - 1,487
Policyholder liabilities under insurance contracts 405 - - - - 405
Deferred taxation 86,596 - - - - 86,596
Provision for post-retirement medical benefits 4,987 - - - - 4,987
Other liabilities 149,128 - - - - 149,128
Totalliabilities 4,820,546 8,318 157,662 595 401 4,987,522
SHAREHOLDER’SEQUITY
Share capital 17,595 - - - - 17,595
Share premium 99,536 - - - - 99,536
General risk reserve 23,074 - - - - 23,074
Revaluation reserve 27,888 - - - - 27,888
Share-based payment reserve 17,609 - - - - 17,609
Available-for-sale reserve 5,952 - - - - 5,952
Retained income 281,014 - - - - 281,014
Shareholder’s interest 472,668 - - - - 472,668
Minority interest 4,957 - - - - 4,957
Totalshareholder’sequityandminorityinterest 477,625 - - - - 477,625
Totalequityandliabilities 5,298,171 8,318 157,662 595 401 5,465,147
Netbalancesheetposition (3,339) 5,244 (2,522) 216 401 -
Offbalancesheetnetnotionalposition - - - - - -
Ratesofexchange 10.0322 6.8200 13.6622

135
Notes to the Annual Financial Statements (cont)for the year ended 31 December 2007
N$ EUR US$ GBP Other Total
N$’000 N$’000 N$’000 N$’000 N$’000 N$’000
48.48.2
CURRENCYRISK(cont)Currencyriskprofile(cont)
Group
2006
ASSETS
Cash and balances with central bank 170,033 560 2,344 148 71 173,156
Government and public sector securities 285,349 - - - - 285,349
Derivative financial instruments 1,062 - - - - 1,062
Other short-term securities - - - - - -
Due from other banks 249,554 131 26,600 - - 276,285
Loans and advances to customers 3,701,102 1,846 5,443 1 - 3,708,392
Investment in subsidiaries and associates 20,501 - - - - 20,501
Goodwill 27,623 - - - - 27,623
Property and equipment 61,840 - - - - 61,840
Computer software and development cost 13,040 - - - - 13,040
Non-current assets classified as held for sale 21,369 - - - - 21,369
Other assets 167,673 378 62 53 2 168,168
Totalassets 4,719,146 2,915 34,449 202 73 4,756,785
LIABILITIES
Due to other banks 259,772 - - - - 259,772
Other deposits 544,559 - - - - 544,559
Derivative financial instruments 690 - - - - 690
Due to customers 3,325,294 12,236 42,545 556 2,492 3,383,123
Long-term subordinated debt instruments 1,320 - - - - 1,320
Policyholder liabilities under insurance contracts 889 - - - - 889
Deferred taxation 63,000 - - - - 63,000
Provision for post-retirement medical benefits 5,073 - - - - 5,073
Other liabilities 127,182 - - - - 127,182
Totalliabilities 4,327,779 12,236 42,545 556 2,492 4,385,608
SHAREHOLDER’SEQUITY
Share capital 17,595 - - - - 17,595
Share premium 99,536 - - - - 99,536
General risk reserve - - - - - -
Revaluation reserve 11,688 - - - - 11,688
Share-based payment reserve 16,735 - - - - 16,735
Available-for-sale reserve - - - - - -
Retained income 221,050 - - - - 221,050
Shareholder’s interest 366,604 - - - - 366,604
Minority interest 4,573 - - - - 4,573
Totalshareholder’sequityandminorityinterest 371,177 - - - - 371,177
Totalequityandliabilities 4,698,956 12,236 42,545 556 2,492 4,756,785
Netbalancesheetposition 20,190 (9,321) (8,096) (354) (2,419) -
Offbalancesheetnetnotionalposition - - - - - -
Ratesofexchange 9.2176 7.0000 13.7312

136
N$ EUR US$ GBP Other Total
N$’000 N$’000 N$’000 N$’000 N$’000 N$’000
48.48.2
CURRENCYRISK(cont)Currencyriskprofile(cont)
Company
2007
ASSETS
Investment in subsidiaries and associates 129,642 - - - - 129,642
Non-current assets classified as held for sale 4,000 - - - - 4,000
Other assets 25 - - - - 25
Totalassets 133,667 - - - - 133,667
LIABILITIES
Due to other banks 8,326 - - - - 8,326
Other liabilities 120 - - - - 120
Totalliabilities 8,446 - - - - 8,446
SHAREHOLDER’SEQUITY
Share capital 17,595 - - - - 17,595
Share premium 99,536 - - - - 99,536
Retained income 8,090 - - - - 8,090
Shareholder’s interest 125,221 - - - - 125,221
Totalequityandliabilities 133,667 - - - - 133,667
Netbalancesheetposition - - - - - -
Offbalancesheetnetnotionalposition - - - - - -
Ratesofexchange 10.0322 6.8200 13.6622
2006
ASSETS
Investment in subsidiaries and associates 133,642 - - - - 133,642
Other assets 2,000 - - - - 2,000
Totalassets 135,642 - - - - 135,642
LIABILITIES
Due to other banks 8,035 - - - - 8,035
Other liabilities 136 - - - - 136
Totalliabilities 8,171 - - - - 8,171
SHAREHOLDER’SEQUITY
Share capital 17,595 - - - - 17,595
Share premium 99,536 - - - - 99,536
Retained income 10,340 - - - - 10,340
Shareholder’s interest 127,471 - - - - 127,471
Totalequityandliabilities 135,642 - - - - 135,642
Netbalancesheetposition - - - - - -
Offbalancesheetnetnotionalposition - - - - - -
Ratesofexchange 9.2176 7.0000 13.7312

137
Notes to the Annual Financial Statements (cont)for the year ended 31 December 2007
Reasonable possible change (increase/decrease)
Absolute possible income
statement effect * EUR US$ GBP Other
Balance as at reporting
date
N$’000 N$ N$ N$ N$ N$’000
48.
48.3
CURRENCYRISK(cont)
Currency risk sensitivity analysis
Group
2007
ASSETS
Cash and balances with central bank 3,890 1.08 0.87 1.07 - 119,234
Government and public sector securities - - - - - 345,465
Derivative financial instruments - - - - - 1,668
Other short-term securities - - - - - 30,163
Due from other banks 16,482 1.08 0.87 1.07 - 403,848
Loans and advances to customers 935 1.08 0.87 - - 4,107,381
Investment in subsidiaries and associates - - - - - 28,054
Goodwill - - - - - 27,623
Property and equipment - - - - - 99,538
Computer software and development cost - - - - - 14,441
Non-current assets classified as held for sale - - - - - 31,496
Other assets 8 1.08 0.87 - - 256,236
Totalassets 21,314 5,465,147
LIABILITIES
Due to other banks - - - - - 315,940
Other deposits - - - - - 420,820
Derivative financial instruments - - - - - 901
Due to customers 21,054 1.08 0.87 1.07 - 4,007,258
Long-term subordinated debt instruments - - - - - 1,487
Policyholder liabilities under insurance
contracts - - - - - 405
Deferred taxation - - - - - 86,596
Provision for post-retirement medical benefits - - - - - 4,987
Other liabilities - - - - - 149,128
Totalliabilities 21,054 4,987,522

138
Reasonable possible change (increase/decrease)
Absolute possible income
statement effect * EUR US$ GBP Other
Balance as at reporting
date
N$’000 N$ N$ N$ N$ N$’000
48.
48.3
CURRENCYRISK(cont)
Currency risk sensitivity analysis (cont)
Group
2006
ASSETS
Cash and balances with central bank 117 0.80 0.20 0.10 - 173,156
Government and public sector securities - - - - - 285,349
Derivative financial instruments - - - - - 1,062
Other short-term securities - - - - - -
Due from other banks 771 0.80 0.20 - - 276,285
Loans and advances to customers 316 0.80 0.20 0.10 - 3,708,392
Investment in subsidiaries and associates - - - - - 20,501
Goodwill - - - - - 27,623
Property and equipment - - - - - 61,840
Computer software and development cost - - - - - 13,040
Non-current assets classified as held for sale - - - - - 21,369
Other assets 35 0.80 0.20 0.10 - 168,168
Totalassets 1,239 4,756,785
LIABILITIES
Due to other banks - - - - - 259,772
Other deposits - - - - - 544,559
Derivative financial instruments - - - - - 690
Due to customers 2,282 0.80 0.20 0.10 1 3,383,123
Long-term subordinated debt instruments - - - - - 1,320
Policyholder liabilities under insurance contracts - - - - - 889
Deferred taxation - - - - - 63,000
Provision for post-retirement medical benefits - - - - - 5,073
Other liabilities - - - - - 127,182
Totalliabilities 2,282 4,385,608
* The possible income statement effect has been determined by applying the possible change in currency to the outstanding balance
reported at year end. The possible change in currency can be either positive or negative and the figures reflected above are in absolute
format. The possible change is based on forward rates for a 12 month period instrument by applying expectations determined by
Nedbank Group Limited.

139
Notes to the Annual Financial Statements (cont)for the year ended 31 December 2007
49. INTERESTRATERISK
Interest rate risk is the risk that the fair value or future cash flows of a financial instrument will fluctuate because of changes in market interest rate.
49.1 Interestrateriskmanagement
Interest rate risk is assessed through the use of traditional gap analysis techniques. Gap analysis measures the volumes of assets and liabilities subject to repricing within a given period. For this purpose assets and liabilities are classified according to their contractual repricing characteristics. Through the use of balance sheet stress testing and net interest income scenarios the impact of interest rate movements and risk concentrations can be identified and measured. Strategies are then developed for mitigating such risks. Refer to the section under the heading “Interest Rate Risk” in the Corporate Governance report to the annual financial statements for more detail on interest rate risk manangement.
Up to 3 months
3 - 6 months
6 - 12 months
1 - 5 years
Over 5 years
Non-interestsensitive Total
N$’000 N$’000 N$’000 N$’000 N$’000 N$’000 N$’000
49.2 Interestrateriskanalysis
Group
2007
ASSETS
Cash and balances with central bank - - - - - 119,234 119,234Government and public sector securities 153,521 39,139 69,127 74,943 8,735 - 345,465Derivative financial instruments - - - 873 - 795 1,668Other short-term securities 30,163 - - - - - 30,163Due from other banks 403,848 - - - - - 403,848Loans and advances to customers 4,079,963 - - - - 27,418 4,107,381Investment in subsidiaries and associates - - - - - 28,054 28,054Goodwill - - - - - 27,623 27,623Property and equipment - - - - - 99,538 99,538Computer software and development cost - - - - - 14,441 14,441Non-current assets classified as held for sale - - - - - 31,496 31,496Other assets - - - 75,283 - 180,953 256,236Totalassets 4,667,495 39,139 69,127 151,099 8,735 529,552 5,465,147LIABILITIES
Due to other banks 123 315,167 350 300 - - 315,940 Other deposits 62,155 171,998 133,455 53,212 - - 420,820 Derivative financial instruments - 114 - - - 787 901Due to customers 2,909,448 520,572 103,284 40,228 - 433,726 4,007,258Long-term subordinated debt instruments - - - - 1,487 - 1,487Policyholder liabilities under insurance contracts - - - - - 405 405Deferred taxation - - - - - 86,596 86,596Provision for post-retirement medical benefits - - - - 4,987 - 4,987Other liabilities - - - - - 149,128 149,128Totalliabilities 2,971,726 1,007,851 237,089 93,740 6,474 670,642 4,987,522SHAREHOLDER’SEQUITY
Share capital - - - - - 17,595 17,595Share premium - - - - - 99,536 99,536General risk reserve - - - - - 23,074 23,074Revaluation reserve - - - - - 27,888 27,888Share-based payment reserve - - - - - 17,609 17,609Available-for-sale reserve - - - - - 5,952 5,952Retained income - - - - - 281,014 281,014Shareholder’s interest - - - - - 472,668 472,668Minority interest - - - - - 4,957 4,957Totalshareholder’sequityandminorityinterest - - - - - 477,625 477,625Totalequityandliabilities 2,971,726 1,007,851 237,089 93,740 6,474 1,148,267 5,465,147Onbalancesheetinterestsensitivitygap 1,695,769 (968,712) (167,962) 57,359 2,261 (618,715) -Accumulativeonbalancesheetinterestsensitivitygap 1,695,769 727,057 559,095 616,454 618,715 -

140
Up to 3 months
3 - 6 months
6 - 12 months
1 - 5 years
Over 5 years
Non-interestsensitive Total
N$’000 N$’000 N$’000 N$’000 N$’000 N$’000 N$’000
49.
49.2
INTERESTRATERISK(cont)
Interestrateriskanalysis(cont)
Group
2006
ASSETS
Cash and balances with central bank - - - - - 173,156 173,156
Government and public sector securities 23,978 66,762 113,714 78,319 2,576 - 285,349
Derivative financial instruments 300 - - 762 - - 1,062
Other short-term securities - - - - - -
Due from other banks 227,380 - - - - 48,905 276,285
Loans and advances to customers 3,698,090 - - - - 10,302 3,708,392
Investment in subsidiaries and associates - - - - - 20,501 20,501
Goodwill - - - - - 27,623 27,623
Property and equipment - - - - - 61,840 61,840
Computer software and development cost - - - - - 13,040 13,040
Non-current assets classified as held for sale - - - - - 21,369 21,369
Other assets - - - - - 168,168 168,168
Totalassets 3,949,748 66,762 113,714 79,081 2,576 544,904 4,756,785
LIABILITIES
Due to other banks 153,659 534 440 1,438 - 103,701 259,772
Other deposits 169,621 298,894 76,044 - - - 544,559
Derivative financial instruments 319 - - 371 - - 690
Due to customers 3,115,222 213,700 53,913 288 - - 3,383,123
Long-term subordinated debt instruments - - - - 1,320 - 1,320
Policyholder liabilities under insurance contracts - - - - - 889 889
Deferred taxation - - - - - 63,000 63,000
Provision for post-retirement medical benefits - - - - 5,073 - 5,073
Other liabilities - - - - - 127,182 127,182
Totalliabilities 3,438,821 513,128 130,397 2,097 6,393 294,772 4,385,608
SHAREHOLDER’SEQUITY
Share capital - - - - - 17,595 17,595
Share premium - - - - - 99,536 99,536
General risk reserve - - - - - - -
Revaluation reserve - - - - - 11,688 11,688
Share-based payment reserve - - - - - 16,735 16,735
Available-for-sale reserve - - - - - - -
Retained income - - - - - 221,050 221,050
Shareholder’s interest - - - - - 366,604 366,604
Minority interest - - - - - 4,573 4,573
Totalshareholder’sequityandminorityinterest - - - - - 371,177 371,177
Totalequityandliabilities 3,438,821 513,128 130,397 2,097 6,393 665,949 4,756,785
Onbalancesheetinterestsensitivitygap 510,927 (446,366) (16,683) 76,984 (3,817) (121,045) -Accumulativeonbalancesheetinterestsensitivitygap 510,927 64,561 47,878 124,862 121,045 -

141
Notes to the Annual Financial Statements (cont)for the year ended 31 December 2007
Up to 3
months
3 - 6
months
6 - 12
months
1 - 5
years
Over 5
years
Non-
interest
sensitive Total
N$’000 N$’000 N$’000 N$’000 N$’000 N$’000 N$’000
49.
49.2
INTERESTRATERISK(cont)
Interestrateriskanalysis(cont)
Company
2007
ASSETS
Investment in subsidiaries and associates - - - - - 129,642 129,642
Non-current assets classified as held for sale - - - - - 4,000 4,000
Other assets - - - - - 25 25
Totalassets - - - - - 133,667 133,667
LIABILITIES
Due to other banks 8,326 - - - - - 8,326
Other liabilities - - - - - 120 120
Totalliabilities 8,326 - - - - 120 8,446
SHAREHOLDER’SEQUITY
Share capital - - - - - 17,595 17,595
Share premium - - - - - 99,536 99,536
Retained income - - - - - 8,090 8,090
Shareholder’s interest - - - - - 125,221 125,221
Totalequityandliabilities 8,326 - - - - 125,341 133,667
Onbalancesheetinterestsensitivitygap (8,326) - - - - 8,326 -
Accumulativeonbalancesheetinterest
sensitivitygap (8,326) (8,326) (8,326) (8,326) (8,326) -
2006
ASSETS
Investment in subsidiaries and associates - - - - - 133,642 133,642
Other assets - - - - - 2,000 2,000
Totalassets - - - - - 135,642 135,642
LIABILITIES
Due to other banks 8,035 - - - - - 8,035
Other liabilities - - - - - 136 136
Totalliabilities 8,035 - - - - 136 8,171
SHAREHOLDER’SEQUITY
Share capital - - - - - 17,595 17,595
Share premium - - - - - 99,536 99,536
Retained income - - - - - 10,340 10,340
Shareholder’s interest - - - - - 127,471 127,471
Totalequityandliabilities 8,035 - - - - 127,607 135,642
Onbalancesheetinterestsensitivitygap (8,035) - - - - 8,035 -
Accumulativeonbalancesheetinterest
sensitivitygap (8,035) (8,035) (8,035) (8,035) (8,035) -

142
Absolute
possible
income
statement
effect *
Reasonable
possible
change*
Rate
sensitive
Non-
interest
sensitive Fixed rate
Variable
rate
Balance
as at
reporting
date
N$’000 % N$’000 N$’000 N$’000 N$’000 N$’000
49.
49.3
INTERESTRATERISK(cont)
Interestraterisksensitivity
Group
2007
ASSETS
Cash and balances with central bank - - - 119,234 - - 119,234
Government and public sector securities 6,564 1.9 345,465 - 345,465 - 345,465
Derivative financial instruments 25 1.5 873 795 - 873 1,668
Other short-term securities 664 2.2 30,163 - 30,163 - 30,163
Due from other banks 6,461 1.6 403,848 - - 403,848 403,848
Loans and advances to customers 78,040 1.9 4,079,963 27,418 - 4,079,963 4,107,381
Investment in subsidiaries and associates - - - 28,054 - - 28,054
Goodwill - - - 27,623 - - 27,623
Property and equipment - - - 99,538 - - 99,538
Computer software and development cost - - - 14,441 - - 14,441
Non-current assets classified as held for sale - - - 31,496 - - 31,496
Other assets - - 75,283 180,953 75,283 - 256,236
Totalassets 91,754 4,935,595 529,552 450,911 4,484,684 5,465,147
LIABILITIES
Due to other banks - - 315,940 - 315,940 - 315,940
Other deposits 9,258 2.2 420,820 - 420,820 - 420,820
Derivative financial instruments 14 1.5 114 787 - 114 901
Due to customers 64,116 1.6 3,573,532 433,726 - 3,573,532 4,007,258
Long-term subordinated debt instruments - - 1,487 - 1,487 - 1,487
Policyholder liabilities under insurance
contracts - - - 405 - - 405
Deferred taxation - - - 86,596 - - 86,596
Provision for post-retirement medical
benefits 50 1 4,987 - - 4,987 4,987
Other liabilities - - - 149,128 - - 149,128
Totalliabilities 73,438 4,316,880 670,642 738,247 3,578,633 4,987,522

143
Absolute
possible
income
statement
effect *
Reasonable
possible
change*
Rate
sensitive
Non-
interest
sensitive Fixed rate
Variable
rate
Balance
as at
reporting
date
N$’000 % N$’000 N$’000 N$’000 N$’000 N$’000
49.
49.3
INTERESTRATERISK(cont)
Interestraterisksensitivity(cont)
Group
2006
ASSETS
Cash and balances with central bank - - - 173,156 - - 173,156
Government and public sector securities 5,707 2.0 285,349 - 285,349 - 285,349
Derivative financial instruments 21 2.0 1,062 - - 1,062 1,062
Other short-term securities - - - - - - -
Due from other banks 5,526 2.0 227,380 48,905 - 227,380 276,285
Loans and advances to customers 74,168 2.0 3,698,090 10,302 - 3,698,090 3,708,392
Investment in subsidiaries and associates - - - 20,501 - - 20,501
Goodwill - - - 27,623 - - 27,623
Property and equipment - - - 61,840 - - 61,840
Computer software and development cost - - - 13,040 - - 13,040
Non-current assets classified as held for sale - - - 21,369 - - 21,369
Other assets - - - 168,168 - - 168,168
Totalassets 85,422 4,211,881 544,904 285,349 3,926,532 4,756,785
LIABILITIES
Due to other banks - - 156,071 103,701 - 156,071 259,772
Other deposits 11,980 2.2 544,559 - 544,559 - 544,559
Derivative financial instruments 14 2.0 690 - - 690 690
Due to customers 67,663 2.0 3,383,123 - - 3,383,123 3,383,123
Long-term subordinated debt instruments - - 1,320 - 1,320 - 1,320
Policyholder liabilities under insurance
contracts - - - 889 - - 889
Deferred taxation - - - 63,000 - - 63,000
Provision for post-retirement medical
benefits - - - 5,073 - - 5,073
Other liabilities - - - 127,182 - - 127,182
Totalliabilities 79,657 4,085,763 299,845 545,879 3,539,884 4,385,608
Notes to the Annual Financial Statements (cont)for the year ended 31 December 2007

144
Absolute
possible
income
statement
effect *
Reasonable
possible
change*
Rate
sensitive
Non-
interest
sensitive Fixed rate
Variable
rate
Balance
as at
reporting
date
N$’000 % N$’000 N$’000 N$’000 N$’000 N$’000
49.
49.3
INTERESTRATERISK(cont)
Interestraterisksensitivity(cont)
Company
2007
ASSETS
Investment in subsidiaries and associates - - - 129,642 - - 129,642
Non-current assets classified as held for sale - - - 4,000 - - 4,000
Other assets - - - 25 - - 25
Totalassets - - 133,667 - - 133,667
LIABILITIES
Due to other banks 133 1.6 8,326 - - 8,326 8,326
Other liabilities - - - 120 - - 120
Totalliabilities 133 8,326 120 - 8,326 8,446
2006
ASSETS
Investment in subsidiaries and associates - - - 133,642 - - 133,642
Other assets - - - 2,000 - - 2,000
Totalassets - - 135,642 - - 135,642
LIABILITIES
Due to other banks 161 2.0 8,035 - - 8,035 8,035
Other liabilities - - - 136 - - 136
Totalliabilities 161 8,035 136 - 8,035 8,171
* The possible income statement effect has been determined by applying the possible change in interest rate to the outstanding bal-
ance reported at year end. The possible change in interest rate can be either positive or negative and the figures reflected above are
in absolute format. A linear risk relationship has been assumed to interest rate moves. Assumptions used in quantifying interest rate
risk are in line with those used by Nedbank Group Limited. The possible change in interest rate is determined by means of applying a
prime/call interest rate differential similar to those used in determining forward interest rates of a 12 month instrument.

145
Nedbank Namibia Limited
HEADOFFICE
12-20 Dr Frans Indongo Street
P.O. Box 1, Windhoek, Namibia
Tel (061) 295 9111
Fax (061) 295 2120
E-mail : [email protected]
WindhoekMainBranch
12-20 Dr Frans Indongo Street
P.O. Box 1, Windhoek, Namibia
Tel (061) 295 9111
Fax (061) 295 2230
WindhoekWernhil
Shop 36, Wernhil Park, Mandume Ndemufayo Avenue
P.O. Box 1, Windhoek, Namibia
Tel (061) 295 2582
Fax (061) 295 2585
WindhoekNorthernIndustrial
12 Ruhr Street
P.O. Box 1, Windhoek, Namibia
Tel (061) 26 1894
Fax (061) 26 2242
WindhoekSouth
16 Thorpe Street, Garthanri Park, Southern Industrial
P.O. Box 1, Windhoek, Namibia
Tel (061) 295 2422/24/25
Fax (061) 295 2227
WindhoekHidas
Ground Floor Hidas Centre, Nelson Mandela Avenue, Klein Windhoek
P.O. Box 1, Windhoek, Namibia
Tel (061) 295 2710
Fax (061) 295 2707
WindhoekIndependenceAvenue
Carl List House, 27 Independence Avenue
P.O. Box 1, Windhoek, Namibia
Tel (061) 295 2164
Fax (061) 295 2261
Contact Details
WindhoekKatutura
Independence Centre, Independence Avenue
P.O. Box 1, Windhoek, Namibia
Tel (061) 295 2777
Fax (061) 295 2757
MaeruaMall
Shop 38/39, Maerua Mall, Robert Mugabe Avenue
P.O. Box 1, Windhoek, Namibia
Tel (061) 295 2680
Fax (061) 2995 2681
NedbankBusinessCentre
55 Rehobother Road, Ausspannplatz
P.O. Box 1, Windhoek, Namibia
Tel (061) 295 2237
Fax (061) 295 2046
AssetFinanceCentre
Nedbank Business Centre, 55 Rehobother Road, Ausspannplatz
P.O. Box 1, Windhoek, Namibia
Tel (061) 295 2865/2237
Fax (061) 295 2846
Lüderitz
240 Bismarck Street
Private Bag 2031, Lüderitz
Tel (063) 20 2577/20 2923
Fax (063) 20 2566
Swakopmund
10 Sam Nujoma Avenue
P.O. Box 1471, Swakopmund
Tel (064) 41 4311
Fax (064) 41 4300
WalvisBay
c/o Sam Nujoma Avenue & 11th Road
P. O. Box 590, Walvis Bay
Tel (064) 21 6111
Fax (064) 21 6100

146
Grootfontein
c/o Hage Geingob Avenue & Okavango Road
Box 146, Grootfontein
Tel (067) 240 730/240 731
Fax (067) 240 732
Outapi
Main Road, Uutapi Tsandi Centre
Box 1604, Oshakati
Tel (065) 306 570
Fax (065) 306 571
NedCapital Namibia (Proprietary) Limited
55 Rehobother Road
Snyman Circle, Ausspannplatz
Box 25576, Windhoek
Tel (061) 227 950 / 249 816
Fax (061) 259 701
NedLoans (Proprietary) Limited
1st Floor, Zanlumor Building
Post Street Mall
Box 3140, Windhoek
Tel (061) 299 4200/299 4201
Fax (061) 299 4205
KuisebmondWalvisBay
Shop 3, The King’s Mall,
c/o 21st Avenue & Nathaniel Maxuilili Street
P.O. Box 590, Walvis Bay
Tel (064) 21 6180
Fax (064) 21 6181
Keetmanshoop
c/o 5th Avenue & Mittel Street
P.O. Box 166, Keetmanshoop
Tel (063) 22 3354/5
Fax (063) 22 3814
Oshakati
Game Centre, Okatana Road
P.O. Box 1604, Oshakati
Tel (065) 22 0062/22 0073
Fax (065) 22 0089
Ondangwa
Main Road, Erf 1231
P.O. Box 2374, Ondangwa
Tel (065) 24 1796/24 1798
Fax (065) 24 3706
Oshikango
Main Road, Erf 104
P.O. Box 2374, Ondangwa
Tel (065) 26 5091
Fax (065) 26 5094
Eenhana
c/o Sam Nujoma Drive & Dimo Hamaambo Street
Private Bag 88012, Eenhana
Tel (065) 26 3016
Fax (065) 26 3139
Katima
Shop 6B & 7, Main Road
Zambezi Shopping Centre
PO Box 2500, Ngwezi
Tel (066) 252 507/252 123
Fax (066) 252 598


