Download - New Electricity Distribution Models

Electricity In NSW Forum
New Electricity Distribution Models
27th November 2014

Long and Skinny – Challenges and Opportunities
2
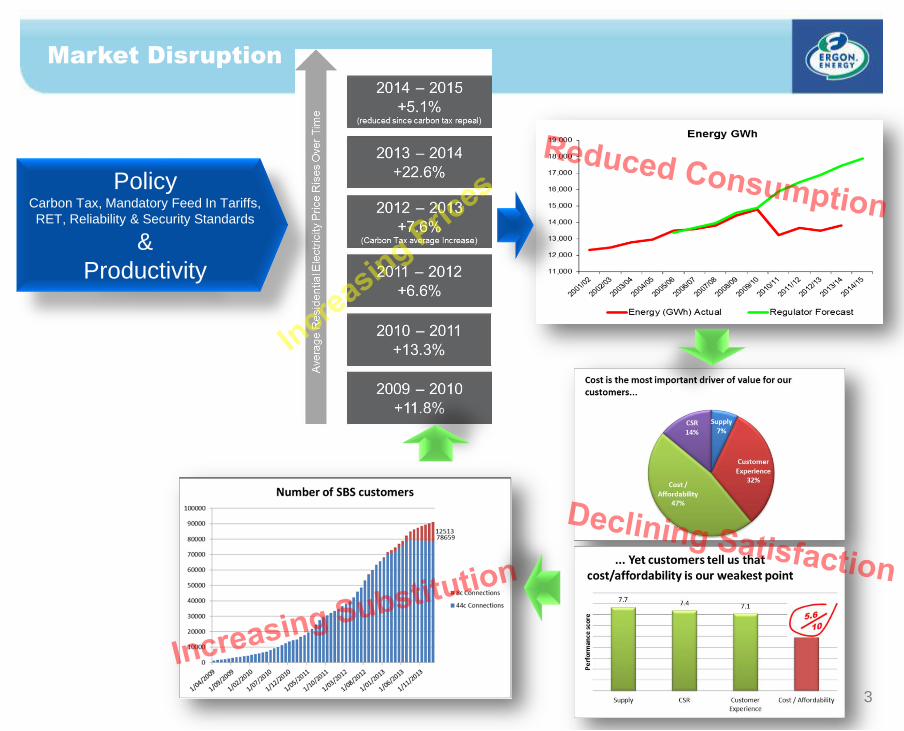
Market Disruption
3
Policy Carbon Tax, Mandatory Feed In Tariffs,
RET, Reliability & Security Standards
&
Productivity
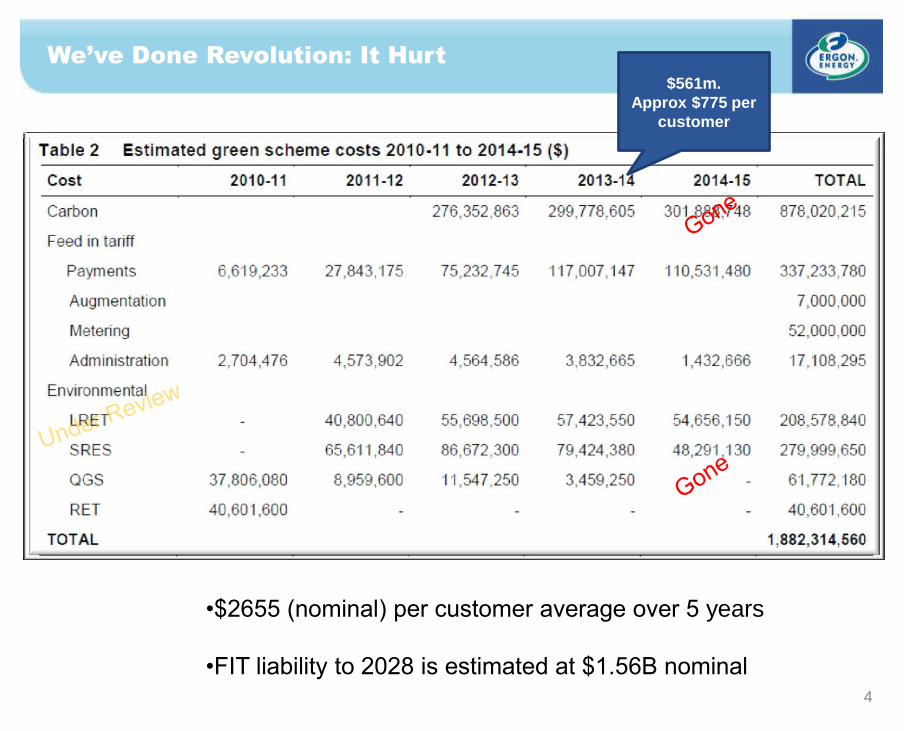
We’ve Done Revolution: It Hurt
4
•$2655 (nominal) per customer average over 5 years
•FIT liability to 2028 is estimated at $1.56B nominal
$561m.
Approx $775 per
customer

What Has and What Is Being Done
5

Ergon Energy: What needs to be achieved
6
We will power the Queensland Economy through –
Strategic Objectives
• Customer choice & control
• Average network price increases below inflation (2015-2020)
• Increased energy productivity
Key Strategic Enablers
• Effective market
• Prudent investment (present – future)
• Efficient service (adapting – EA)
Outcome
• Customer value
• More flexible work practices
• Strong Queensland economy

Capacity: Glass Half Empty or Half Full
7
Generation Transmission Distribution
With falling demand and
consumption combined with
greater distributed
generation there is an
excess of generation
capacity to leverage.
AEMO forecast no new
generation required for 10
years yet mandatory
renewable targets and
Feed In Tariffs still exist
Powerlink advise that
without further
augmentation, there is
sufficient capacity to
support additional load in
North Queensland
equivalent to the Townsville
area. The North West is not
part of the NEM.
Distribution Network is not
effectively utilised,
impacted by reduced
consumption, security &
reliability standards

Possible Futures: But Hybrids Are The In Thing

Reform: How
9
Our challenge is to transform the purpose and value proposition
of the grid in the eyes of our people, the owners, regulators,
financiers and our customers, without losing value.
Value &
Opportunity

Open & Equitable Access Platform: Driving An Effective
Market
• Our network will be an
open access platform
that enables an effective
market and customer
choice & control
• 96,000 roof top solar
systems connected at
the end of 2013/14
• Internet of power driving
energy productivity
• Edge Of Grid, Off Grid
• Supply & Demand
become commodities
• Supply vs Service

Reform: Townsville Energy Sense Community

Reform: Open Access Platform
12
Batteries are modular, mobile
and the energy deployable.

Adaption
13


