Welcome to the Meeting of the
NextGen Advisory Committee
October 4, 2017
United Airlines Headquarters
The Willis Tower
Chicago, IL
Welcome & Introductions

PUBLIC MEETING ANNOUNCEMENT
Read by: Designated Federal Official Dan Elwell
NextGen Advisory Committee
October 4, 2017
In accordance with the Federal Advisory Committee Act, this Advisory
Committee meeting is OPEN TO THE PUBLIC.
Notice of the meeting was Issued on September 14, 2017 and published in
the Federal Register on:
September 19, 2017
Members of the public may address the committee with PRIOR
APPROVAL of the Chairman. This should be arranged in advance.
Only appointed members of the Advisory Committee may vote on any
matter brought to a vote by the Chairman.
The public may present written material to the Advisory Committee at any
time.
3

Review and Approval of:
June 28, 2017 – Meeting Summary
Revised Terms of Reference

Chairman’s Report
David Bronczek, NAC Chair

FAA ReportNextGen Advisory Committee

SESAR DEPLOYMENTMaking SESAR a performing operational reality
NextGen Advisory Committee (NAC)
Chicago, 04 October 2017
Massimo Garbini
Managing Director
SESAR Deployment Manager

- ............

SESAR is the technological pillar of EU‘s
Single European Sky policy
SingleEuropean
Sky
Institutional
Performance, Functional Airspace
Blocks, NetworkManager
Human
Technological
DefinitionResearch andDevelopment
Deployment
safety

4
R&D INDUSTRIALISATION DEPLOYMENT
Large ScaleDemonstrations
Pre-implementation
Standardisation
Safety
European ATM Master Plan
SESAR = 2 entities, 1 project

SESAR Deployment Manager
• 11 Air Navigation Service Providers
• 4 major Airlines
• 24 Airports through a single European Interest Grouping, theSESAR Deployment related Airport Grouping
“By and for the ATM industry”

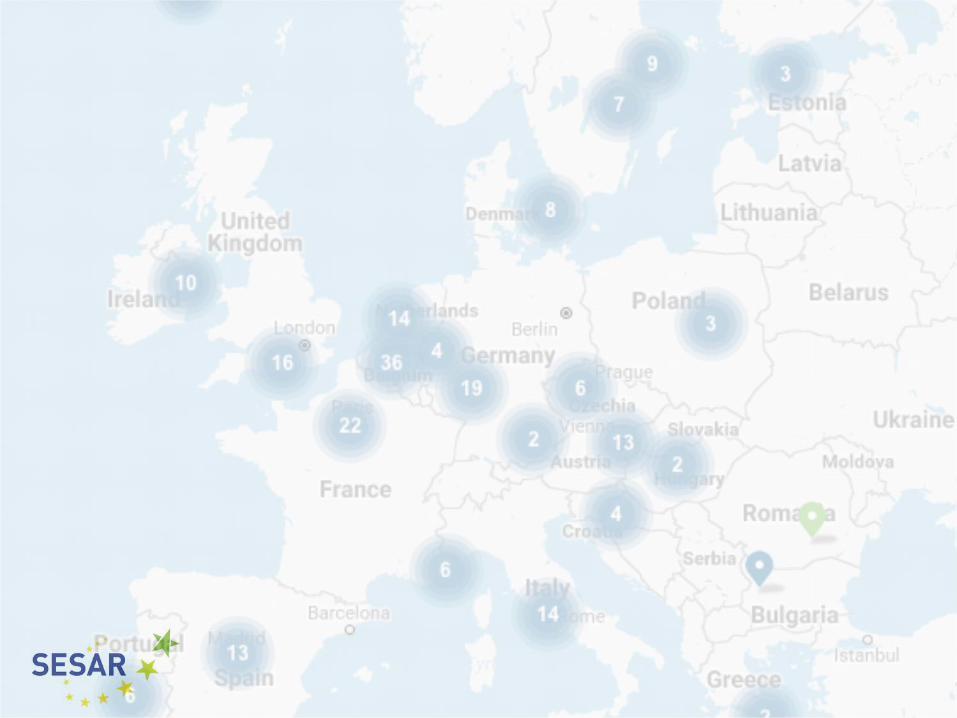
SESAR is delivering today
• 295 projects
• 86 implementing partners
• 34 involved countries
• 2,5 billion euro of investment
• including 1,4 billion euro of grants
by the European Union

SESAR is delivering today
• 42 projects completed today
• Over 70 completed by end 2017
• When all projects delivered by 2030:
• 275 million minutes less delays
• 10.000 km2 forrest saved
• 60% of the overall benefits
expected from PCP by 2030

Unique European partnership

Sample project: ATM Functionality 1
• X-MAN- Cross-centre arrival management
Lead by: DFS
Partners: DSNA, Eurocontrol, LVNL, ANS Czech Republic
• 4.826.020 euro investment

Sample project: ATM Functionality 2
• Enablers for Airport Surface Movement related toSafety Nets
Lead by: Aéroports De Paris
Partners: Aéroports de la Côte d’Azur, Air France, AmsterdamSchiphol, Brussels National, Copenhagen Airports, DSNA, Dublin, Frankfurt International, London Stansted, Manchester Ringway, Munich Franz Josef Strauss, Naviair, Roma Fiumicino, Swedavia
• 125.320.390 euro investment

Sample project: ATM Functionality 3
• Borealis Free Route Airspace (Part 1)
Lead by: Borealis Alliance
Partners: Avinor, EANS, Finavia, IAA, LFV, LGS, NATS, Naviair
• 12.891.905 euro investment
Sample project: ATM Functionality 4
• AOP-NOP Integration
Lead by: Eurocontrol / NM
Partners: Aeroports de Paris, Frankfurt International, London Heathrow
• 2.688.092 euro investment

Sample project: ATM Functionality 5
• NewPENS Stakeholders contribution for the procurement and deployment of NewPENS
Lead by: Eurocontrol / NM
Partners: Aeroports de Paris, Austrocontrol, Belgocontrol, DSNA, ENAIRE, Finavia, IAA, LFV, LVNL, M-NAV GOJSC, NATS, Naviair,NAV Portugal, Slovenia Control, SMATSA
• 9.393.366 euro investment

Sample project: ATM Functionality 6
• DLS Implementation Project - Path 1 "Ground" stakeholders (GND)
Lead by: ENAIRE
Partners: ARINC, Austrocontrol, Croatia Control, DFS, DSNA, EANS, ENAV, HCAA, Hungaro Control, LFV, LGS, MATS, NAVPortugal, Oro Navigacija, PANSA, SITA
• 37.748.444 euro investment

cooperation
interoperability
benefits
modernizing

More info:
www.sesar.eu
www.sesardeploymentmanager.eu
www.sesarju.eu
#SESAR
Thank you
Northeast Corridor NextGen
Integration Working Group Report
Warren Christie, JetBlue
Co-Chair, NEC NIWG
October 4, 2017

NEC NIWG Participation
12 meetings in 10 week time frame
30+ entities participating representing operator
community, airports, labor, FAA NextGen, FAA ATO with
input from field facilities
26
Industry Co Chairs
• Steve Brown, NBAA
• Warren Christie, JetBlue
Industry Lead SME
• Mark Hopkins, Delta
FAA Leads
• Rob Hunt, FAA
• Robert Novia, FAA
NIWG Process Leads
• Pamela Gomez, FAA
• Andy Cebula, RTCA

27
Goals/Metrics for NEC NIWG
NEC NIWG worked from Phase 1 near-term goals:
Improve execution of today’s operation
• Operate full operation
• Operate on time
• Operate predictably
Critical to address degradation during weather
Prioritized initiatives identified the benefits, metrics
to evaluate and linked back to Phase 1 goal
• Measurement plan will provide quantitative assessment

NEC NIWG Prioritized Initiatives
28
NEC NIWG working in three timeframes
• First 18-months, 18-36 months, 36+ months
Today’s Interim Report is for first 18-month timeframe
• Includes initial and ongoing coordination with facilities / industry
• Initial list 100; reduced to 24 feasible initiatives
• Final report in February 2018
Initiatives are more NowGen than NextGen
• Target improvement in Summer 2018
• Some complete in 18-months; others begin but complete after
• Include milestones for both FAA & Industry
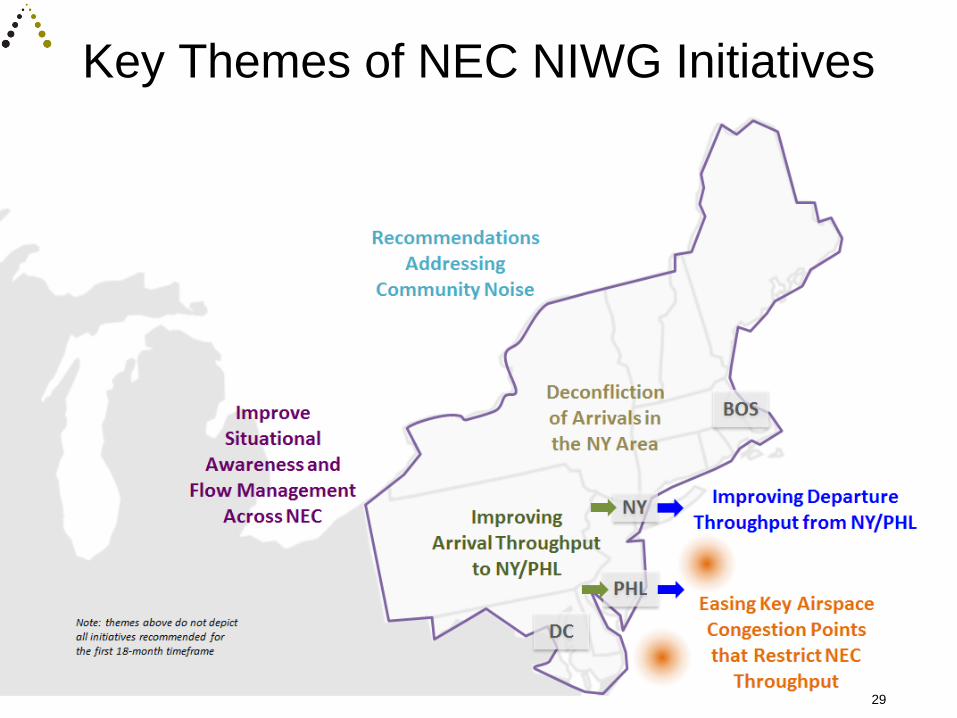
Key Themes of NEC NIWG Initiatives
29

Details of NEC NIWG Initiatives
30

Milestones
31
45 FAA & industry milestones identified for the 24
prioritized initiatives

Key Risks & Pacing Items
32
Controller, support and operator staffing and resources
Facility-level feedback, constraints and nuances that
may impact individual initiatives
Funding and budget priorities
Environmental – community issues and concerns
Cultural issues – i.e. controller, pilots, dispatcher
acceptance and implementation
Mixed equipage of aircraft/differing capabilities
Future NEC NIWG Effort
33
Two NextGen initiatives identified in this report
• Analyze and identify site(s) for new NextGen procedures –
RNAV and Required Navigation Performance procedures for
implementation beyond the initial time frame
• Assess concept to allow simultaneous operations at widely
spaced approaches to different airports
Reports for 18-36 month and 3+ year timeframes
expected to include more NextGen-focused initiatives

DISCUSSION
and
Consideration for approval of
Interim Report
34

BREAK
Joint Analysis Team
Co-Chairs:
Ilhan Ince, American Airlines
Dave Knorr, FAA

37
PRE-Study
Period
POST-Study
Period
Optimal Profile Descents in Boston
Level offs that typically occurred
at 11,000 feet in the past…
… now typically happen at
23,000 feet.

Impact of OPDs in BOS
For flights that reach cruise altitude outside 200 NM from Boston
• Vertical profiles improved through increased proportion of continuous
descent operations, and shorter time and distance in level flight
• Approximately 9.8 gallons fuel savings per flight attributable to OPDs
• Minimal change in flight time, and 0.2 to 0.6 nm increase in distance
For flights that do reach cruise altitude inside 200 NM (includes flights from New York area to Boston)
• Vertical profiles improved through shorter time / distance in level flight
• Approximately 6.5 to 8.1 gallons fuel savings per flight attributable to
OPDs
• Minimal change in flight time, and 0.7 to 1.1 nm decrease in distance
38

39
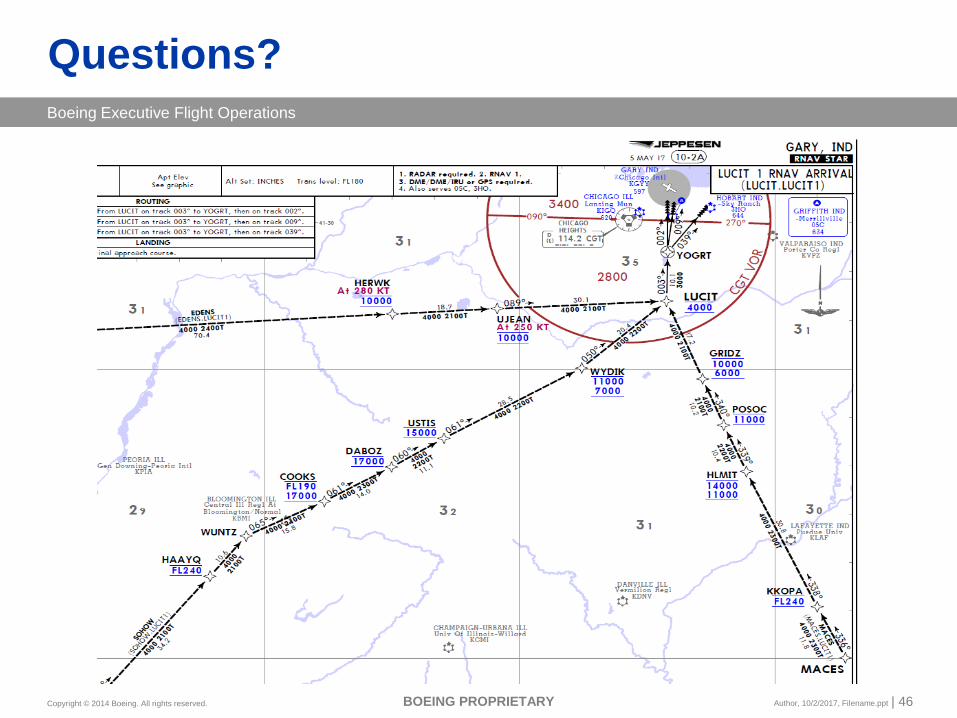
Impact of OPDs in Gary, IN
GYY
GYY
Safety benefits resulting from
reduced interaction of high
performance jets with VFR
traffic, and from reduced
interaction between Midway
and Gary-Indiana traffic flows
The JAT was unable to quantify
benefits because of the small
data sample; however, operator
reported savings in fuel burn

Operator Experience
with GYY OPDs
Brad Sunshine
Assistant Chief Pilot
Boeing Executive Flight Operations
40

Copyright © 2014 Boeing. All rights reserved.
Boeing Executive Flight Operations
Author, 10/2/2017, Filename.ppt | 41BOEING PROPRIETARY
Gary Airport LUCIT 1 STAR
Improving Safety; Enhancing Efficiency

Boeing Executive Flight Operations
Copyright © 2014 Boeing. All rights reserved.
Gary International Airport (KGYY)
Author, 10/2/2017, Filename.ppt | 42BOEING PROPRIETARY
Boeing Executive Flight Operations
Copyright © 2014 Boeing. All rights reserved.
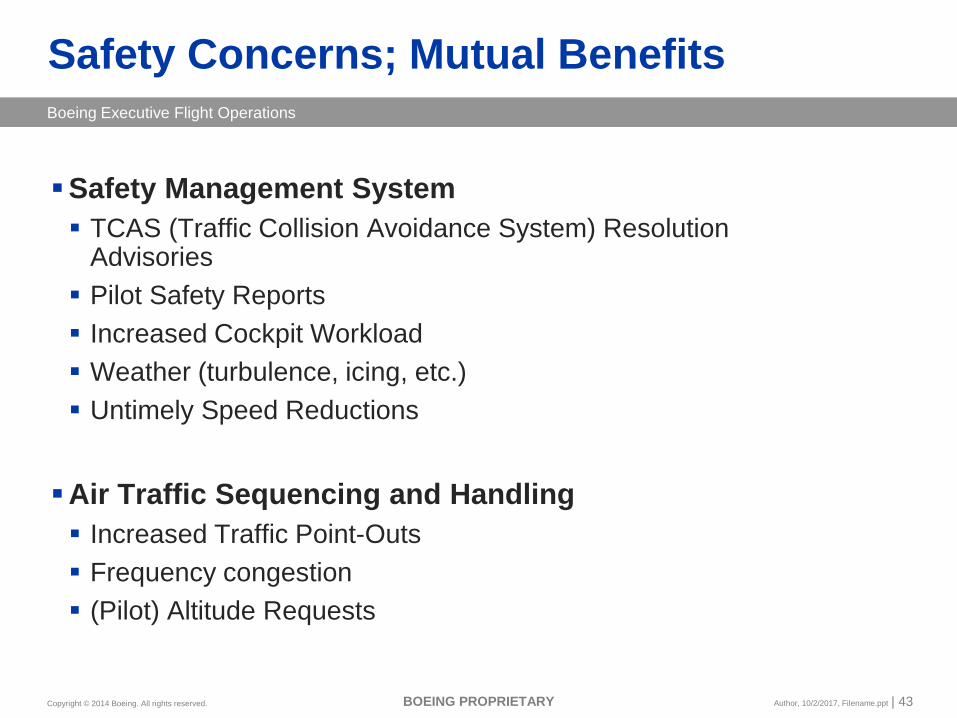
Safety Concerns; Mutual Benefits
▪Safety Management System
▪ TCAS (Traffic Collision Avoidance System) Resolution Advisories
▪ Pilot Safety Reports
▪ Increased Cockpit Workload
▪ Weather (turbulence, icing, etc.)
▪ Untimely Speed Reductions
Author, 10/2/2017, Filename.ppt | 43BOEING PROPRIETARY
▪Air Traffic Sequencing and Handling
▪ Increased Traffic Point-Outs
▪ Frequency congestion
▪ (Pilot) Altitude Requests

Boeing Executive Flight Operations
Copyright © 2014 Boeing. All rights reserved.
Collaboration and Informational Exchange
Author, 10/2/2017, Filename.ppt | 44BOEING PROPRIETARY
▪First Time Quality
▪Consistent Message During Approval Process
▪Mutual Education and Awareness
▪Airport Arrival Routes (AARs)

Boeing Executive Flight Operations
Copyright © 2014 Boeing. All rights reserved.
Findings and Future Innovations
▪Eradication of TCAS Events
▪Fuel Savings*
▪ Inconsistencies with “Descend Via Clearances”
▪New Transition?
▪ Connecting the LUCIT STAR with Gary Approaches
Author, 10/2/2017, Filename.ppt | 45BOEING PROPRIETARY
Boeing Executive Flight Operations
Copyright © 2014 Boeing. All rights reserved.
Questions?
Author, 10/2/2017, Filename.ppt | 46BOEING PROPRIETARY

Benefits from DataComm
Pre-departure Route Revision
Clearance
47

48
Time Event
20:30 UAL1600 (Voice) Clearance
20:43 UAL1600 (Voice) Revision
22:04 UAL1600 (Voice) Departure
Time Event
20:55 UAL751 (CPDLC) Clearance
21:06 UAL751 (CPDLC) Revision
21:31 UAL751 (CPDLC) Departure
Timetables and recorded scenario
DataComm Benefits: Pre-Dep ReroutesExample: Off-nominal Event at EWR on April 20, 2017
CPDLC flight pushes after voice flight, able to depart first
56 minute time savings for CPDLC flight compared to voice flight
UAL751
Revision
21:06
20:43
UAL1600
Revision
CPDLCUAL751 (20:55)
B752 – LAX
UAL751
Departs
21:31
22:04
UAL1600
Departs
VOICEUAL1600 (20:30)
B752 – LAX
25 minutes
81 minutes
Benefits:
Source: Harris Corp.
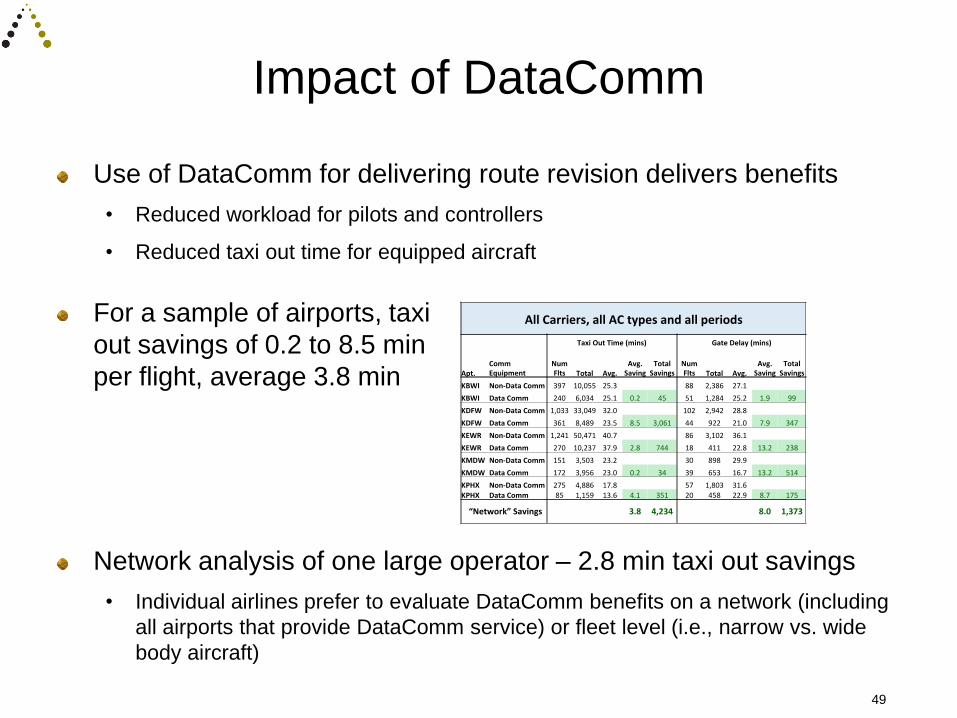
Impact of DataComm
49
AllCarriers,allACtypesandallperiods
TaxiOutTime(mins) GateDelay(mins)
Apt.CommEquipment
NumFlts Total Avg.
Avg.Saving
TotalSavings
NumFlts Total Avg.
Avg.Saving
TotalSavings
KBWI Non-DataComm 397 10,055 25.3 88 2,386 27.1
KBWI DataComm 240 6,034 25.1 0.2 45 51 1,284 25.2 1.9 99
KDFW Non-DataComm 1,03333,049 32.0 102 2,942 28.8
KDFW DataComm 361 8,489 23.5 8.5 3,061 44 922 21.0 7.9 347
KEWR Non-DataComm 1,24150,471 40.7 86 3,102 36.1
KEWR DataComm 270 10,237 37.9 2.8 744 18 411 22.8 13.2 238
KMDWNon-DataComm 151 3,503 23.2 30 898 29.9
KMDWDataComm 172 3,956 23.0 0.2 34 39 653 16.7 13.2 514
KPHX Non-DataComm 275 4,886 17.8 57 1,803 31.6
KPHX DataComm 85 1,159 13.6 4.1 351 20 458 22.9 8.7 175
“Network”Savings 3.8 4,234 8.0 1,373
Use of DataComm for delivering route revision delivers benefits
• Reduced workload for pilots and controllers
• Reduced taxi out time for equipped aircraft
For a sample of airports, taxi
out savings of 0.2 to 8.5 min
per flight, average 3.8 min
Network analysis of one large operator – 2.8 min taxi out savings
• Individual airlines prefer to evaluate DataComm benefits on a network (including
all airports that provide DataComm service) or fleet level (i.e., narrow vs. wide
body aircraft)

Data Comm BenefitsTaxi Out Analysis

SWA-Internal - May be protected from disclosure under 49 U.S.C., Section 40123 & 14 CFR Part 193
Page 51
First, why Data Comm you ask…..
➢Southwest Airlines believes in the importance of our commitment
to NextGen.
➢ Southwest views Data Comm as an enabler for more efficient
utilization of NAS capacity.
➢Data Comm allows system stakeholders to harness capacity that
may otherwise be left to spoil.
➢Data Comm gives us a greater chance of keeping our promises to
our Customers.
➢Data Comm leverages Next Generation capabilities and improves
the foundation for other elements of NextGen such as TBFM.

SWA-Internal - May be protected from disclosure under 49 U.S.C., Section 40123 & 14 CFR Part 193
Page 52
SWA Data Comm Transition Timeline
January 2014 We began activating aircraft with FANS
May 2015 A056 OpSpec submitted for CPDLC
operations
September 2017 We currently have 525 aircraft equipped
September 2018 All aircraft will have the FANS software
installed
December 2018 All aircraft will be equipped with the MK II+
CMU enabling the auto-tune capabilities

SWA-Internal - May be protected from disclosure under 49 U.S.C., Section 40123 & 14 CFR Part 193
Page 53
Harris Data Review
Data Comm
Flights
Non-Data
Comm Flights
Total
Flights
Data Comm
% of Total
1 MDW 14,614 7,311 21,925 66.7%
2 DEN 11,341 6,464 17,805 63.7%
3 LAS 11,275 7,311 18,586 60.7%
4 BWI 11,114 8,604 19,718 56.4%
5 PHX 9,171 5,962 15,133 60.6%
6 HOU 7,227 6,607 13,834 52.2%
7 DAL 7,104 8,363 15,467 46.0%
8 MCO 6,066 4,955 11,021 55.0%
9 LAX 5,874 4,880 10,754 54.6%
10 OAK 5,732 4,279 10,011 57.3%
Reporting period: May 1, 2017 – July 31, 2017
Data Comm Equipped Flights: 172,319 out of 305,017 (56.5%)
Top Data Comm Airports

SWA-Internal - May be protected from disclosure under 49 U.S.C., Section 40123 & 14 CFR Part 193
Page 54
Harris Data ReviewTop Airports for Route Revisions
Tot. Flts. w/
Revision
% of
Flts.
1 BWI 2,971 15.1%
2 LAS 2,068 11.1%
3 DAL 1,920 12.4%
4 OAK 1,816 18.1%
5 ABQ 1,575 52.9%
6 DEN 1,546 8.7%
7 PHX 1,445 10.0%
8 SJC 1,349 21.3%
9 LAX 1,314 12.2%
10 MDW 1,204 5.5%
• Data Comm equipped flights which received a Voice Route Revision were treated as non-equipped flights.
• For taxi-out benefit analysis only included flights which received a revision.
Data Comm
Revision
% of Revisions
1 BWI 1,635 55.0%
2 LAS 1,102 53.3%
3 OAK 1,006 55.4%
4 PHX 943 65.3%
5 DEN 893 57.8%
6 ABQ 874 56.5%
7 LAX 773 58.8%
8 MDW 767 63.7%
9 DAL 751 39.1%
10 SJC 735 54.5%
SWA-Internal - May be protected from disclosure under 49 U.S.C., Section 40123 & 14 CFR Part 193
Page 55
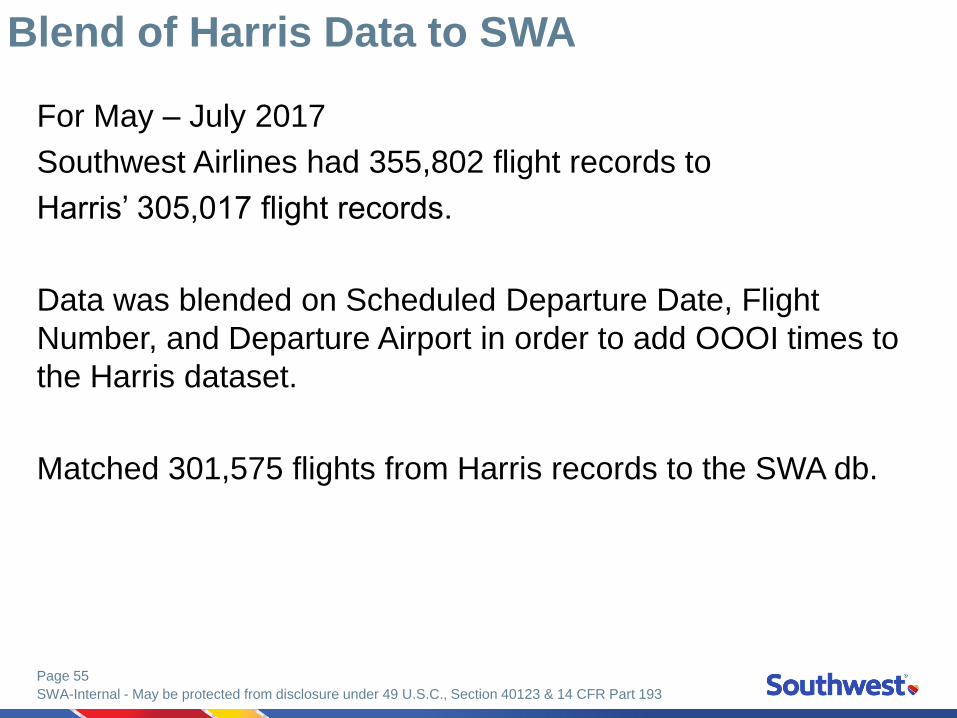
Blend of Harris Data to SWA
For May – July 2017
Southwest Airlines had 355,802 flight records to
Harris’ 305,017 flight records.
Data was blended on Scheduled Departure Date, Flight
Number, and Departure Airport in order to add OOOI times to
the Harris dataset.
Matched 301,575 flights from Harris records to the SWA db.

SWA-Internal - May be protected from disclosure under 49 U.S.C., Section 40123 & 14 CFR Part 193
Page 56
May 2017 June 2017 July 2017
Data Comm Voice Clearance Data Comm Voice Clearance Data Comm Voice Clearance
BWI17:00 17:11 15:56 16:03 18:43 19:17
492 437 543 409 580 462
LAS14:31 15:36 13:14 14:30 14:51 18:08
307 274 298 307 482 364
DAL12:46 14:29 16:43 19:22 13:26 14:32
192 294 295 447 248 402
OAK12:39 12:29 13:11 12:26 12:50 11:38
268 246 332 279 399 271
ABQ10:07 10:09 9:49 9:58 9:48 9:56
213 212 257 218 392 259
All
Airports
14:08 14:36 14:55 16:25 15:25 16:11
4,171 3,874 5,129 4,642 6,344 4,679
Data Comm vs. Voice Clearance Taxi Out Times-Rerouted flights only

SWA-Internal - May be protected from disclosure under 49 U.S.C., Section 40123 & 14 CFR Part 193
Page 57
Summary
➢Average Taxi Out times:
Data Comm = 14:55 mins
Non-Data Comm = 15:47 mins
➢Overall, flights receiving revised routings via Data Comm had a 52 second benefit
over Non-Data Comm flights.
➢As of 09/22/2017, CPDLC clearances are being received by an average of 5140
flights/day.
➢SWA flights are receiving on average 2,300 DCL clearances/day or ~45% of all
CPDLC clearances.
➢ A reduction of 13,725 taxi out mins measured in the Southwest Airlines operation
over just a 3 month period and that’s with only 73% of the fleet equipped.

SWA-Internal - May be protected from disclosure under 49 U.S.C., Section 40123 & 14 CFR Part 193
Page 58
Don’t forget…
➢Data Comm enhances safety and reduces Pilot and Controller workload by reducing human machine interface errors, reducing frequency congestion and errors inherent with voice communications.
➢Very perishable quantities of latent capacity are forfeited each day across the NAS.
➢The aggregated value of forfeited capacity is not yet known and won’t be without the leverage of hi-fidelity, robust data exchange such as provided by Data Comm.
➢Data Comm puts some of that capacity within our reach.
➢Since we are increasingly becoming a time-based system we are critically dependent upon the ability to utilize time efficiently.
➢This is success that can be built upon…..enroute capabilities are right around the corner. ☺

DISCUSSION
and
Consideration for approval of
Final Report
59

Regional Airline Equipage
Co-Chairs:
© 2017 The MITRE Corporation. All rights reserved.
Greg Tennille
October 4, 2017
Avionics Equipage

| 62 |
© 2017 The MITRE Corporation. All rights reserved.
Equipage – Benefit Relationship
▪ Individual Aircraft
– Enhanced route efficiency
– More flexible airspace use
▪ Clustered Aircraft
– Increased Departures
– Advantages of a common path
▪ Whole Fleet
– Trajectory predictability
– De-conflicted throughput
0%
Be
ne
fits
0% 100%Equipage
0%
Be
ne
fits
0% 100%Equipage
100%
100%
0%B
en
efits
0% 100%Equipage
100%
?

| 63 |
© 2017 The MITRE Corporation. All rights reserved.
PBN NIWG Survey Status
▪ Survey results continue to come in, we are working
with Operators to address data issues
▪Where we haven’t received updates, or there are open
issues, we are using our existing data
▪New data has not shown any significant change in
overall navigation equipage trends

| 64 |
© 2017 The MITRE Corporation. All rights reserved.
Operator PBN Equipage Update Status
| 65 |
© 2017 The MITRE Corporation. All rights reserved.
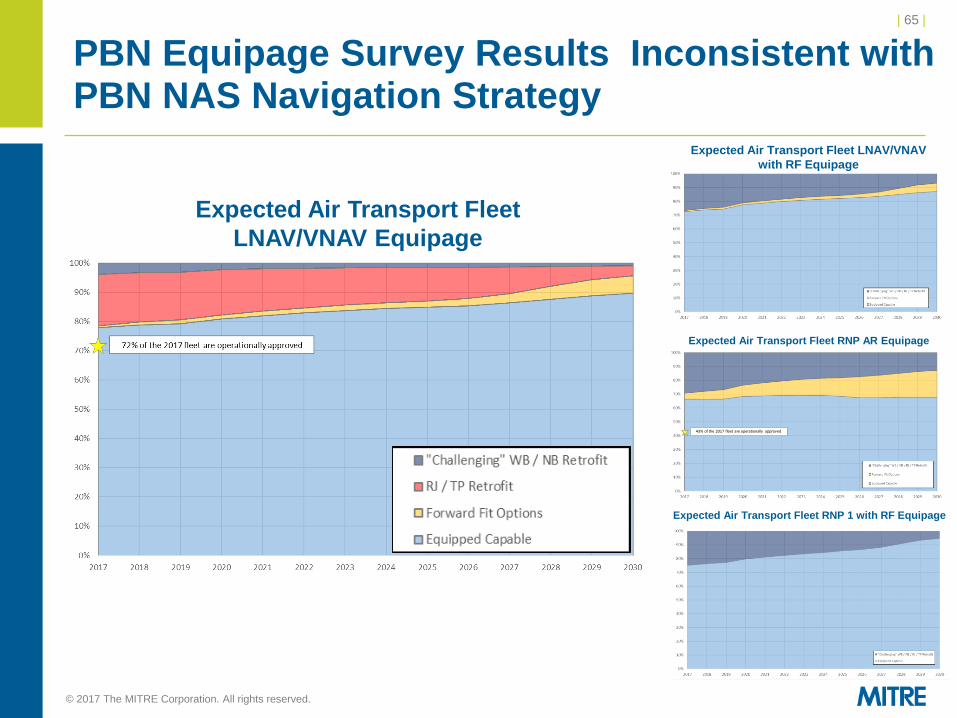
PBN Equipage Survey Results Inconsistent with PBN NAS Navigation Strategy
Expected Air Transport Fleet LNAV/VNAV
with RF Equipage
Expected Air Transport Fleet RNP 1 with RF Equipage
43%ofthe2017fleetareoperationallyapproved
Expected Air Transport Fleet RNP AR Equipage
Expected Air Transport Fleet
LNAV/VNAV Equipage
| 66 |
© 2017 The MITRE Corporation. All rights reserved.
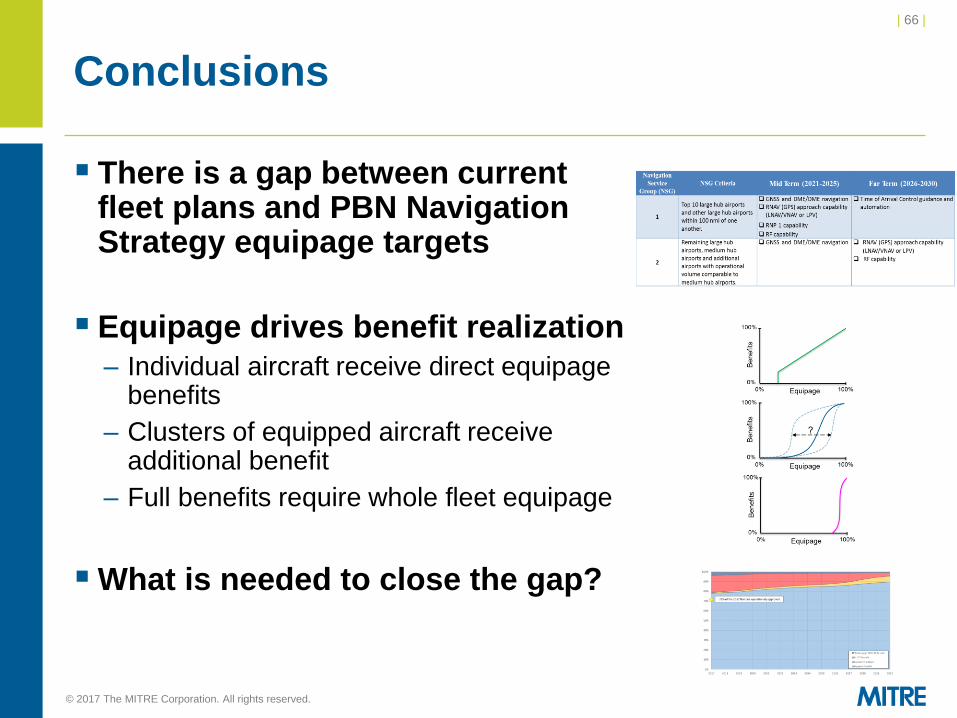
Conclusions
▪ There is a gap between current fleet plans and PBN Navigation Strategy equipage targets
▪ Equipage drives benefit realization
– Individual aircraft receive direct equipage benefits
– Clusters of equipped aircraft receive additional benefit
– Full benefits require whole fleet equipage
▪What is needed to close the gap?

| 67 |
© 2017 The MITRE Corporation. All rights reserved.
2016 PBN NAS Navigation StrategyEquipage Targets
▪ The minimum PBN avionics capabilities that support the
transition to a PBN-centric NAS at NSG 1 and 2 airports:
Navigation
Service
Group (NSG)
NSG Criteria Mid Term (2021-2025) Far Term (2026-2030)
1
Top 10 large hub airports and other large hub airports within 100 nmi of one another.
GNSS and DME/DME navigation RNAV (GPS) approach capability
(LNAV/VNAV or LPV)
RNP 1 capability
RF capability
Time of Arrival Control guidance andautomation
2
Remaining large hub airports, medium hub airports and additional airports with operational volume comparable to medium hub airports.
GNSS and DME/DME navigation RNAV (GPS) approach capability (LNAV/VNAV or LPV)
RF capability
▪ These capabilities represent the minimum set expected for
routine operation at the listed NSG airport
▪ Aircraft without these capabilities may not be able to efficiently
access the airport

| 68 |
© 2017 The MITRE Corporation. All rights reserved.
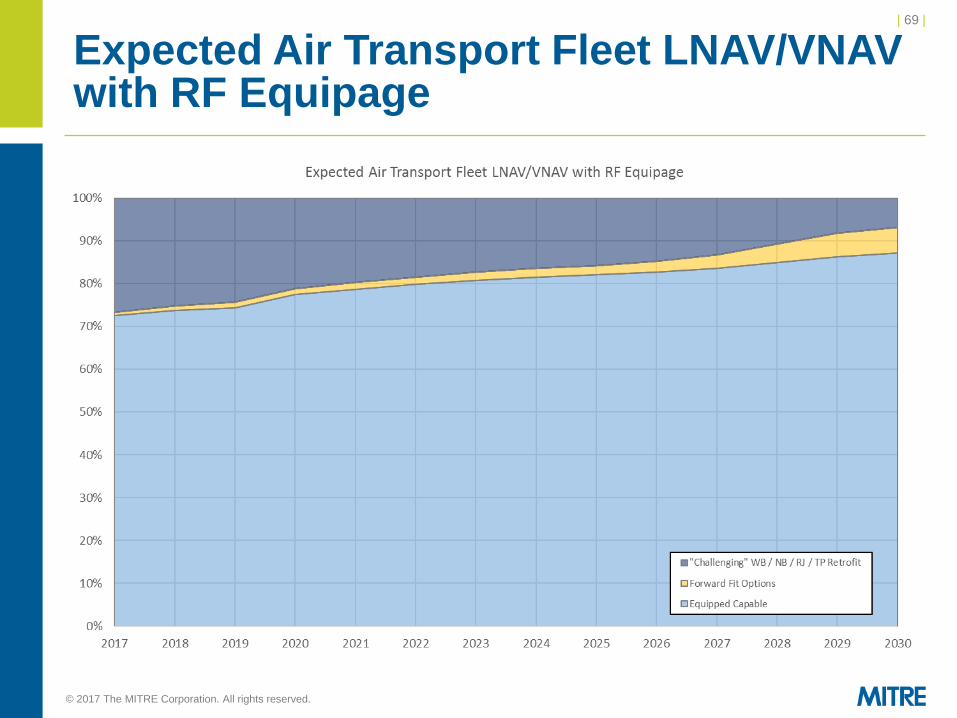
Expected Air Transport Fleet LNAV/VNAV Equipage
72% of the 2017 fleet are operationally approved
Expected Air Transport Fleet LNAV/VNAV Equipage
| 69 |
© 2017 The MITRE Corporation. All rights reserved.
Expected Air Transport Fleet LNAV/VNAV with RF Equipage

| 70 |
© 2017 The MITRE Corporation. All rights reserved.
Expected Air Transport Fleet RNP AR Equipage
43% of the 2017 fleet are operationally approved
| 71 |
© 2017 The MITRE Corporation. All rights reserved.
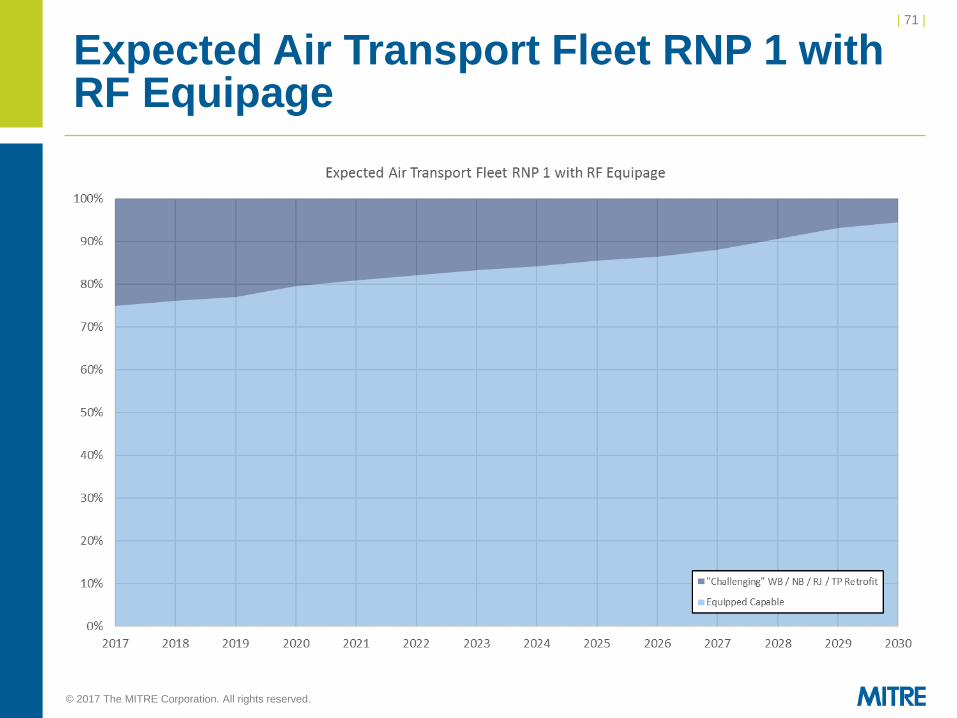
Expected Air Transport Fleet RNP 1 with RF Equipage

NextGen Integration Working Group
Priorities and Reporting Status
Co-Chairs:
Steve Dickson, Delta Air Lines
Melissa Rudinger, AOPA

NextGen Priorities
Performance Based Navigation Update
NextGen Advisory Committee
October 4, 2017

Key Issues PBN NIWG: Equipage
74
Aircraft equipage is a key enabler of many NextGen initiatives
Nearly 100% equipage rate may be necessary for measurable
benefits
Current discussion around PBN equipage includes Radius-to-Fix
(RF) capability and Vertical Navigation (VNAV)
2016 PBN NAS Navigation Strategy has agreement that operations
at our busiest airport are equipped with RF and VNAV by 2025
Inventory trends are not approaching those levels
• Industry discussing gap
Plan for identification of Causal Factors and next steps Oct 2017
NAC Meeting
Related Topics
• ATC Tools essential to Success
• Cultural issues of acceptance and application become more relevant as
capability is available

Activities
Recommendation for RF and TF sites in original NIWG
report (October 2014/Rolling Plan June 2016)
ALPA letter concern over VNAV (March 2017)
NAC discussion on equipage and associated request
(June 2017)
Inventory by MITRE (Summer/Fall 2017)
Developing understanding of VNAV concerns and
possible mitigations (Summer 2017)
Plan for identification of Causal Factors and next steps
Oct 2017 NAC Meeting
75
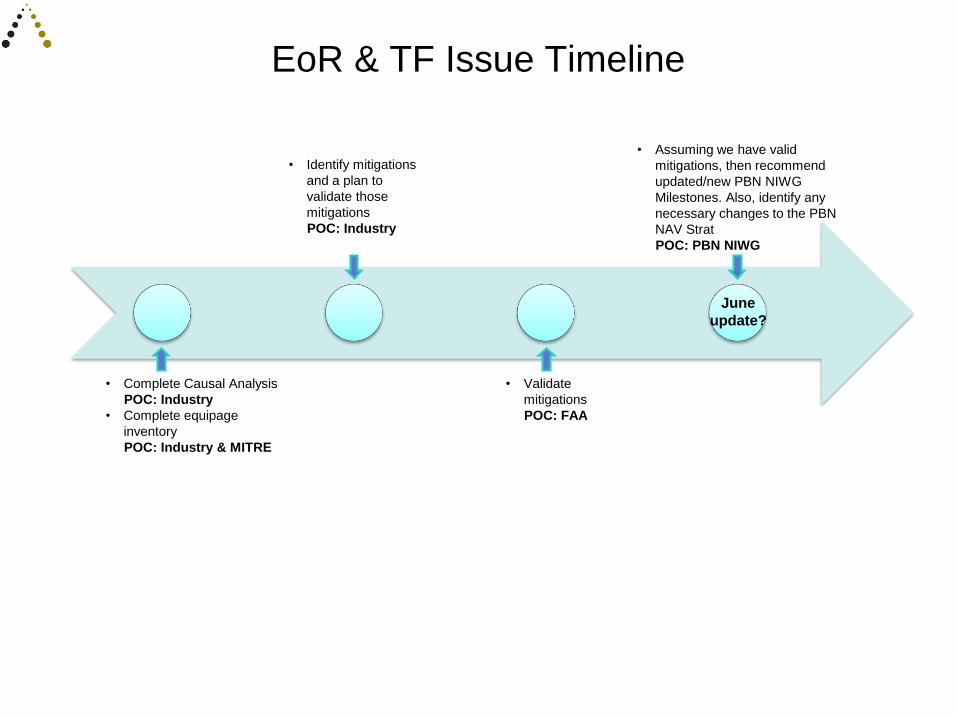
EoR & TF Issue Timeline
June
update?
• Complete Causal Analysis
POC: Industry
• Complete equipage
inventory
POC: Industry & MITRE
• Assuming we have valid
mitigations, then recommend
updated/new PBN NIWG
Milestones. Also, identify any
necessary changes to the PBN
NAV Strat
POC: PBN NIWG
• Identify mitigations
and a plan to
validate those
mitigations
POC: Industry
• Validate
mitigations
POC: FAA
76

NextGen Priorities
Data Comm Update
NextGen Advisory Committee
October 4, 2017

✓ Tower Services Waterfall – Q4 2016− Completed challenge waterfall in December 2016− Additional towers (RSW, CMH, CHS, BUF, RNO, ADW, and VNY) scheduled to all be operational by 2019
✓ Implementation Framework for non-VDL Mode 2 Media – Q1 2017 Moving forward with agreed to framework
• Initial Operating Capability (IOC) for Initial En Route Services at first Air Route Traffic Control Center (ARTCC) – Q3 2019
Started development, integration and test of Data Comm Initial En Route Services Conducting early operational evaluations and flight deck demos with stakeholders Working risk mitigation strategies to address challenges in ERAM and legacy avionics
• Airlines goal is to equip 1,900 aircraft – Q4 2019 3,205 Data Comm equipped aircraft as of September 7, 2017 (includes FANS/VDL Mode 2, FANS/VDL Mode
0, business jets, and international aircraft) 1,510 aircraft have been equipped through the equipage initiative
• Operational Summary Over 36,000 Data Comm ops per week – a 62% increase since the beginning of 2017 Participation from 12 mainline US carriers, 39 international carriers, 39 business jet operators, and general
aviation 49 different aircraft types using Data Comm
Data Comm – Update
78
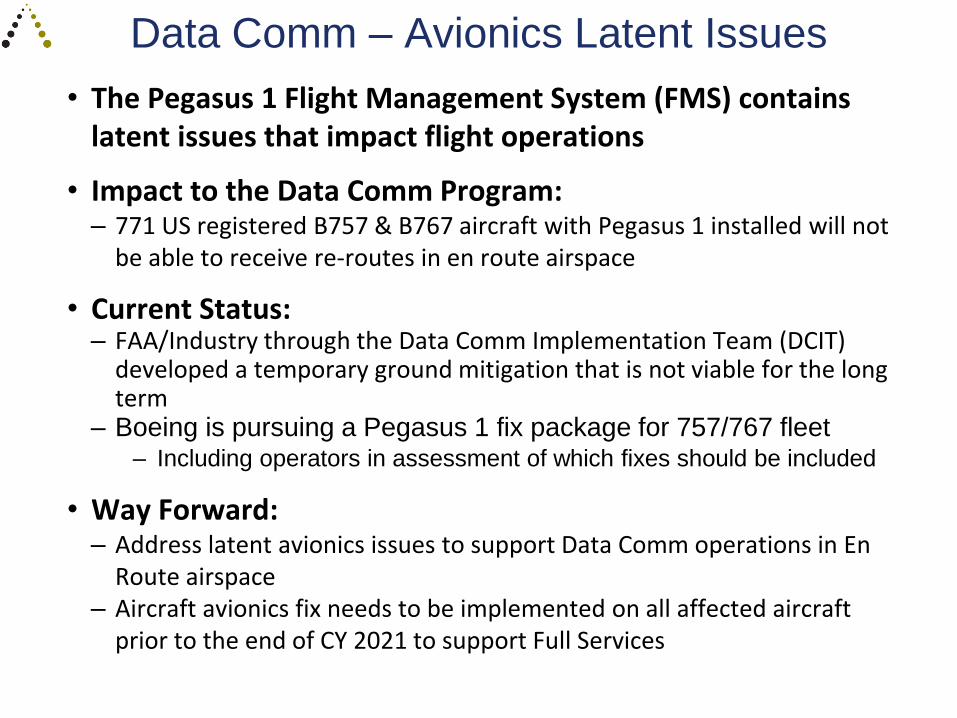
Data Comm – Avionics Latent Issues
• The Pegasus 1 Flight Management System (FMS) contains latent issues that impact flight operations
• Impact to the Data Comm Program: – 771 US registered B757 & B767 aircraft with Pegasus 1 installed will not
be able to receive re-routes in en route airspace
• Current Status: – FAA/Industry through the Data Comm Implementation Team (DCIT)
developed a temporary ground mitigation that is not viable for the long term
– Boeing is pursuing a Pegasus 1 fix package for 757/767 fleet– Including operators in assessment of which fixes should be included
• Way Forward:– Address latent avionics issues to support Data Comm operations in En
Route airspace– Aircraft avionics fix needs to be implemented on all affected aircraft
prior to the end of CY 2021 to support Full Services
NextGen Priorities
Multiple Runway Operations Update
NextGen Advisory Committee
October 4, 2017

Multiple Runway OperationsAccomplishments
81
• Wake RECAT Phase II implementation (PHL, MSP, MIA - 2017) Complete• PHL implementation completed two years earlier than original commitment and provides
benefit to NEC
• MSP implemented one quarter early; MIA implemented on time
• Dependent Stagger Reduction for 7110.308A (SFO - Q2 2017) Complete• 7110.308B Order approved on 6/30/17, and went into effect 7/25/17
• Wake RECAT Phase II benefits analysis (Q2 2017) Complete• FAA is reviewing results as part of broader RECAT strategy
• Simultaneous Independent Procedures (Trips at ATL & IAD – Q3 2017) Complete
• FAA has implemented at IAD and ATL
• Simultaneous Independent Procedures (VNAV requirements – Q3 2017) Removed Milestone
• VNAV commitment canceled per agreement at the June NAC

82
Multiple Runway Operations RECAT Issues for Potomac TRACON and future sites
• FAA is evaluating the current wake RECAT separation standards
• To accommodate the time needed to complete this evaluation, the FAA recommends moving the IAD, LAS, and PHX commitments to September 2018
• FAA is committed to wake RECAT and implementing IAD, PHX, and LAS as soon as the wake standard evaluation is complete
• Collaboration with Industry has been a tenet of this program and FAA will continue that collaboration
• FAA will work with MRO NIWG team outlining the FAA’s proposed direction for RECAT and an updated working schedule

NextGen Priorities
Surface Operations & Data Sharing Update
NextGen Advisory Committee
October 4, 2017

Surface Ops & Data Sharing Accomplishments (Completed Since June 2017)
FAA to Increase Data Sharing: provide raw sensor surface data in the non-movement area (Surface Surveillance Multilateration
Category 10 data) to Industry via SWIM – Q4 2017
✓ Complete – All 35 sites completed on July 28th
NASA Surface Departure Management Demonstration Charlotte (ATD-2) – Q4 2017
✓ Complete – NASA ATD-2 Phase 1 Demonstration started September 29th
84

Provision of Surface Data Elements-Status
• Airlines in various stages of completeness and development
• Other airspace users (i.e. business aviation, airports) discussions on-going
• Use of data in advance of Terminal Flight Data Manager (TFDM) considerations
continue
FAA to jointly work with industry to develop a SWIM “Data
Dictionary”
• February 2017 NAC Action - In Progress
• Functional description underway, defining and mapping data elements
• Airport Surface Movement Events Service
• Operational context through use case development effort kicked off in August
• Presented use cases on 1st data set to three airlines: American, Jet Blue,
and Alaska for review and feedback
85
Surface Ops & Data Sharing
Discussion Issue

NextGen Priorities
Plan Update
NextGen Advisory Committee
October 4, 2017
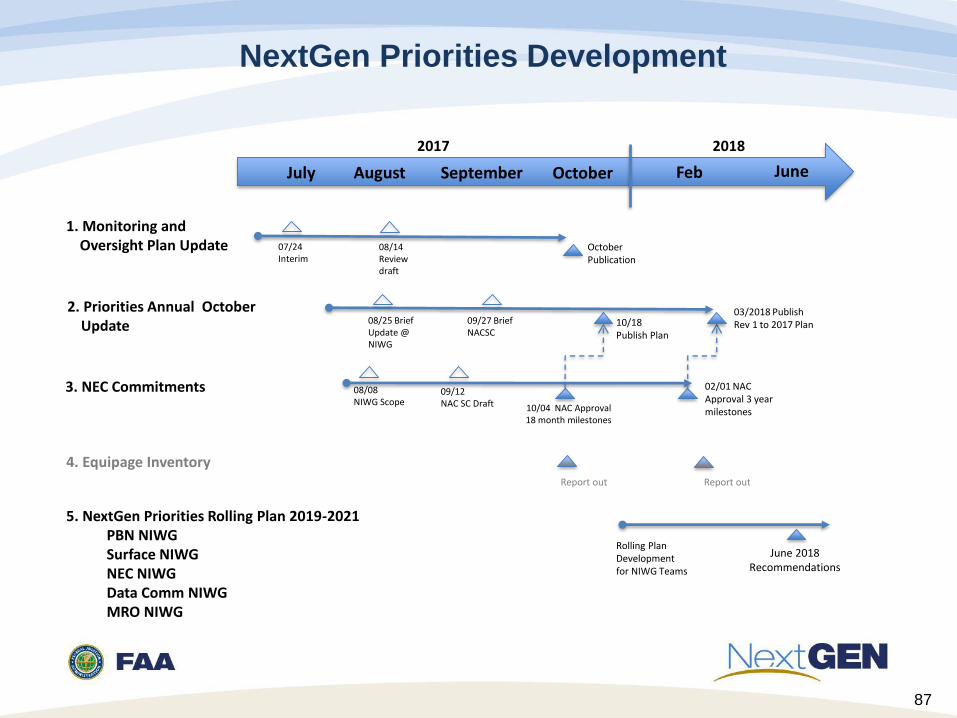
NextGen Priorities Development
3. NEC Commitments
July
1. Monitoring and Oversight Plan Update
August
2. Priorities Annual October Update
5. NextGen Priorities Rolling Plan 2019-2021 PBN NIWGSurface NIWGNEC NIWGData Comm NIWGMRO NIWG
September October
4. Equipage Inventory
Feb June
June 2018 Recommendations
07/24 Interim
08/14 Review draft
OctoberPublication
2017 2018
08/25 Brief Update @ NIWG
09/27 Brief NACSC
10/18 Publish Plan
Report out
10/04 NAC Approval 18 month milestones
08/08 NIWG Scope
09/12 NAC SC Draft
02/01 NAC Approval 3 year milestones
Rolling Plan Development for NIWG Teams
03/2018 Publish Rev 1 to 2017 Plan
87
Report out

NextGen Priorities Annual PlanFY17 Update
Important Dates
• Milestone changes approved by the NAC SC Oct. 27th
• Seeking NAC endorsement on Changes Oct. 4th
• Deliver to Congress late Oct. 2017
Plan Content
• Executive Summary
• Background of Priorities
• Successes – Documenting milestone operational outcomes
• Changes – Detailing changes to existing milestones
• NEC Rolling Plan (incorporate after NAC)
• Appendix A – Milestone completion to date
• Appendix B – Milestone changes
• Appendix C – Goals and Priorities for Improving Operations in the
Northeast Corridor Phase One
• Appendix D – Joint Implementation Commitments for Improving
Operations in the Northeast Corridor Phase Two - Interim Report
(incorporate after October 4th)
Copy of the updated annual plan can be found here post October 2017:https://www.faa.gov/nextgen/snapshots/priorities/
88
Focus
Area
# Implementation / *Preimplementation
Commitment
Original
Date
Change Date Rationale
Data
Comm
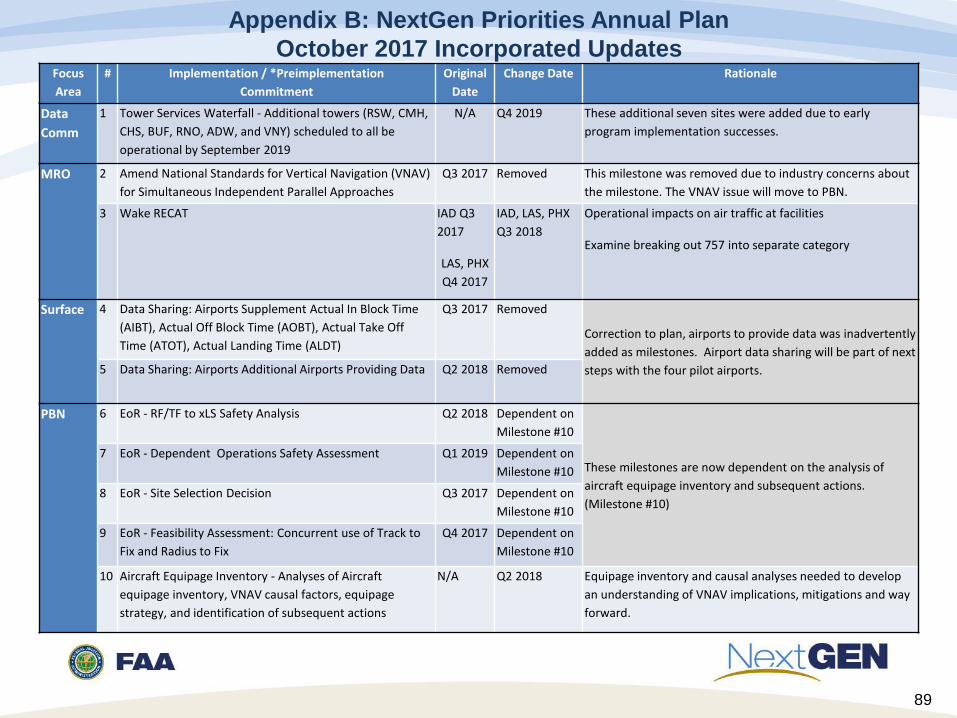
1 Tower Services Waterfall - Additional towers (RSW, CMH,
CHS, BUF, RNO, ADW, and VNY) scheduled to all be
operational by September 2019
N/A Q4 2019 These additional seven sites were added due to early
program implementation successes.
MRO 2 Amend National Standards for Vertical Navigation (VNAV)
for Simultaneous Independent Parallel Approaches
Q3 2017 Removed This milestone was removed due to industry concerns about
the milestone. The VNAV issue will move to PBN.
3 Wake RECAT IAD Q3
2017
LAS, PHX
Q4 2017
IAD, LAS, PHX
Q3 2018
Operational impacts on air traffic at facilities
Examine breaking out 757 into separate category
Surface 4 Data Sharing: Airports Supplement Actual In Block Time
(AIBT), Actual Off Block Time (AOBT), Actual Take Off
Time (ATOT), Actual Landing Time (ALDT)
Q3 2017 Removed
Correction to plan, airports to provide data was inadvertently
added as milestones. Airport data sharing will be part of next
steps with the four pilot airports.5 Data Sharing: Airports Additional Airports Providing Data Q2 2018 Removed
PBN 6 EoR - RF/TF to xLS Safety Analysis Q2 2018 Dependent on
Milestone #10
These milestones are now dependent on the analysis of
aircraft equipage inventory and subsequent actions.
(Milestone #10)
7 EoR - Dependent Operations Safety Assessment Q1 2019 Dependent on
Milestone #10
8 EoR - Site Selection Decision Q3 2017 Dependent on
Milestone #10
9 EoR - Feasibility Assessment: Concurrent use of Track to
Fix and Radius to Fix
Q4 2017 Dependent on
Milestone #10
10 Aircraft Equipage Inventory - Analyses of Aircraft
equipage inventory, VNAV causal factors, equipage
strategy, and identification of subsequent actions
N/A Q2 2018 Equipage inventory and causal analyses needed to develop
an understanding of VNAV implications, mitigations and way
forward.
Appendix B: NextGen Priorities Annual Plan
October 2017 Incorporated Updates
89

DISCUSSION
90
DISCUSSION
and
Consideration for approval of
Milestone Updates
91

LUNCH

Federal AviationAdministration
Automatic Dependent
Surveillance – Broadcast
(ADS-B)
FAA Update
Mark Steinbicker, FAA Flight Standards Service

94Federal AviationAdministration
Equip 2020
• Call to Action in 2014 - 90% of task areas closed
• Remaining items ongoing along with new efforts
• Outreach by FAA and Industry to operators and pilots
• Work to reduce the number of call sign mis-match (CSMM)
occurrences and non-performing emitters
• Security/privacy issues for U.S. Government & GA aircraft
• Identification of programmatic risk areas associated with ADS-B
installation and equipage
• Operational procedures and tools for service availability
prediction
95Federal AviationAdministration
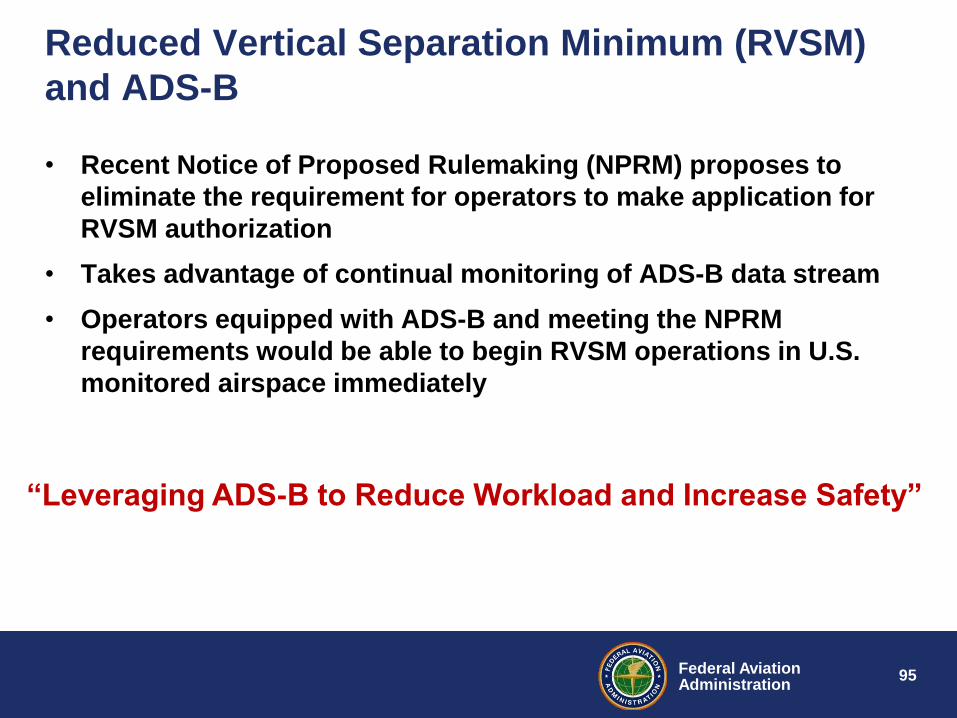
Reduced Vertical Separation Minimum (RVSM)
and ADS-B
• Recent Notice of Proposed Rulemaking (NPRM) proposes to
eliminate the requirement for operators to make application for
RVSM authorization
• Takes advantage of continual monitoring of ADS-B data stream
• Operators equipped with ADS-B and meeting the NPRM
requirements would be able to begin RVSM operations in U.S.
monitored airspace immediately
“Leveraging ADS-B to Reduce Workload and Increase Safety”

96Federal AviationAdministration
US Air Carrier Installation Plans and Observed
Installs
Federal AviationAdministration
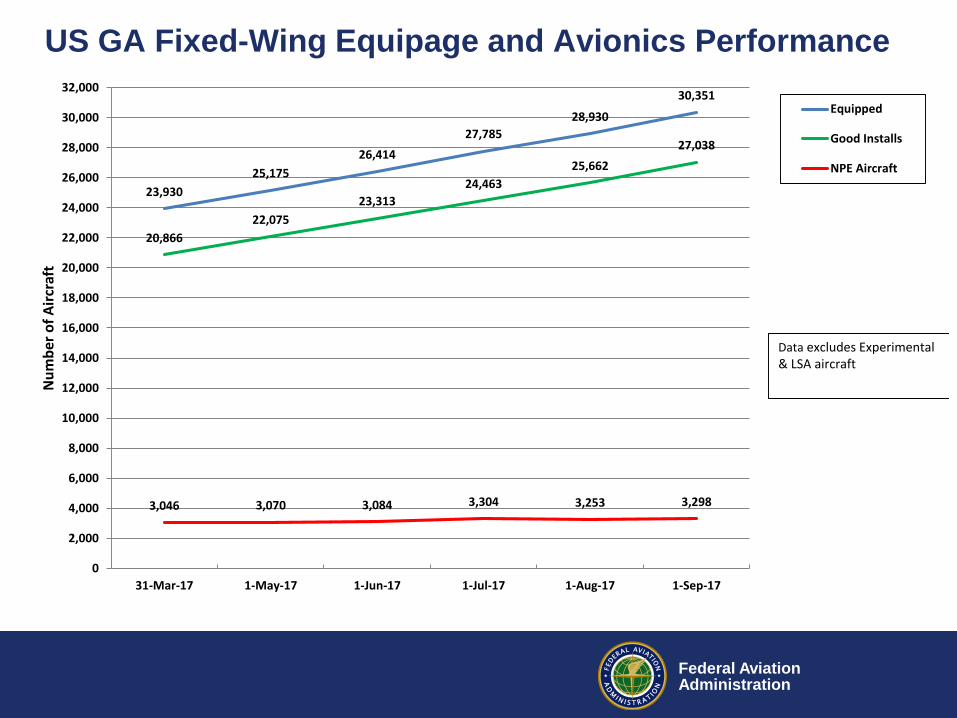
23,930
25,175
26,414
27,785
28,930
30,351
20,866
22,075
23,313
24,463
25,662
27,038
3,046 3,070 3,084 3,304 3,253 3,298
0
2,000
4,000
6,000
8,000
10,000
12,000
14,000
16,000
18,000
20,000
22,000
24,000
26,000
28,000
30,000
32,000
31-Mar-17 1-May-17 1-Jun-17 1-Jul-17 1-Aug-17 1-Sep-17
Nu
mb
er o
f A
ircr
aft
Equipped
Good Installs
NPE Aircraft
Data excludes Experimental & LSA aircraft
US GA Fixed-Wing Equipage and Avionics Performance

Federal AviationAdministration
General Aviation Rebate Program Status
(as of 9/19/17 – reservations now closed)
Rebate
Status
Weekly
Increase
Reserved 2689
Fly &
Validate197
Claim 188
Export for
Payment200

OTHER BUSINESS
Summary of Meeting and Next
Steps
DFO and NAC Chairman Closing
Comments

Action Items
TBD
101
Adjourn


