
NF VALIDATION ‐ Validation of alternative analysis methods Application to the food industry
Summary report according to the standard EN ISO 16140‐2:2016
Quantitative method
Bacillus Cereus Rapid Agar ‐ BACARA
Certificate # AES 10/10‐07/10
for the enumeration of Bacillus cereus in food and feed products
Expert laboratory: Laboratoire MICROSEPT ZA de la Sablonnière 15 rue Denis Papin 49220 LE LION D’ANGERS FRANCE
For: bioMérieux Chemin de l’Orme 69280 MARCY L’ETOILE FRANCE
This report contains 70 pages, including 40 pages of appendices. The reproduction of this document is only authorized in its entirety. The accreditation of the COFRAC (Section Laboratory) gives evidence of the expertise of the laboratory for the only tests covered by the accreditation that are specified by the symbol ().
Version 0 December 4th, 2018

Preamble
Protocols of validation :
‐ EN ISO 16140‐1 and NF EN ISO 16140‐2 (September 2016): Microbiology of the food chain — Method validation Part 1: Vocabulary. Part 2: Protocol for the validation of alternative (proprietary) methods against a reference method.
‐ Requirements regarding comparison and interlaboratory studies for implementation
of the standard EN ISO 16140‐2 (version 6).
Reference method:
‐ EN ISO 7932 (July 2005): Horizontal method for the enumeration of presumptive Bacillus cereus – Colony‐count technique at 30°C
Application scope:
‐ All human food products by a validation testing of a broad range of foods, including: ‐ meat products, fish products and seafood, ‐ dairy products, ‐ vegetables, ‐ eggs and pastries, ‐ baby foods
‐ Feeds.
Certification body:
‐ AFNOR Certification (https://nf‐validation.afnor.org/).
Microsept Summary report - v0 BACARA
2/70
December 2018

Definitions
Method comparison studyThe method comparison study is the part of the validation process that is performed in the expert laboratory. It consists of four parts:
‐ A comparative study of the results of the reference method to the results of the alternative method in a variety of different items (naturally and/or artificially) contaminated samples (so‐called relative trueness study). ‐ A comparative study of the results of the reference method to the results of the alternative method in artificially contaminated samples using replicates of a single item per category. The data are analyzed using the accuracy profile (AP) approach (so‐called AP study). ‐ An inclusivity/exclusivity study of the alternative method.
Relative trueness studyThe relative trueness study is a comparative study between the results obtained by the reference method and the results of the alternative method. The relative trueness is the degree of correspondence between the response obtained by the reference method and the response obtained by the alternative method on identical samples.
Accuracy profile studyThe accuracy profile study is a comparative study between the results obtained by the reference method and the results of the alternative method. The accuracy profile is the graphical representation of the capacity of measurement of the quantitative method, obtained by combining acceptability intervals and β‐expectation tolerance intervals, both reported to different levels of the reference value.
Inclusivity and exclusivity studyThe inclusivity study is a study involving pure target strains to be detected or enumerated by the alternative method. The exclusivity study is a study involving pure non‐target strains, which can be potentially cross‐reactive, but are not expected to be detected or enumerated by the alternative method.
Interlaboratory studyThe interlaboratory study is a study performed by multiple laboratories testing identical samples at the same time, the results of which are used to estimate alternative‐method performance parameters. The aim of an interlaboratory study is to determine the variability of the results obtained in different laboratories using identical samples.
Microsept Summary report - v0 BACARA 3/70 December 2018

Table of contents 1. Introduction .................................................................................................................................... 6
2. Protocols of the methods ............................................................................................................... 7
2.1. Alternative method ................................................................................................................. 7
2.1.1. Principle of the method ................................................................................................... 7
2.1.2. Protocol of the method ................................................................................................... 7
2.1.3. Restrictions ...................................................................................................................... 7
2.2. Reference method ................................................................................................................... 7
3. Methods comparison study ............................................................................................................ 8
3.1. Relative trueness study ........................................................................................................... 8
3.1.1. Number and nature of the samples ................................................................................. 8
3.1.2. Artificial contaminations .................................................................................................. 9
3.1.3. Protocols used during the study ...................................................................................... 9
3.1.4. Results .............................................................................................................................. 9
3.1.5. Calculation and interpretation of relative trueness study .............................................. 1
3.1.6. Conservation of the incubated BACARA Petri dishes at 5±3°C for 48 h .......................... 1
3.1.7. Conclusion ........................................................................................................................ 1
3.2. Accuracy profile study ............................................................................................................. 2
3.2.1. Protocols .......................................................................................................................... 2
3.2.2. Results .............................................................................................................................. 2
3.2.3. Conclusion ........................................................................................................................ 1
3.3. Specificity / selectivity ............................................................................................................. 1
3.3.1. Protocols .......................................................................................................................... 1
3.3.1.1. Initial validation study .................................................................................................. 1
3.3.1.2. Second renewal study .................................................................................................. 1
3.3.2. Results .............................................................................................................................. 1
3.3.2.1. Initial validation study .................................................................................................. 1
3.3.2.2. Second renewal study .................................................................................................. 2
3.3.3. Conclusion ........................................................................................................................ 2
3.4. Practicability ............................................................................................................................ 2
3.5. General conclusion for the methods comparison study ......................................................... 4
4. Interlaboratory study ...................................................................................................................... 5
4.1. Study organization................................................................................................................... 5
Microsept Summary report - v0 BACARA
4/70
December 2018

4.2. Control of experimental parameters ...................................................................................... 5
4.2.1. Contamination levels obtained after artificial contamination ........................................ 5
4.2.2. Strain stability during shipping ........................................................................................ 5
4.2.3. Shipping conditions .......................................................................................................... 5
4.2.4. Conclusion ........................................................................................................................ 6
4.3. Results ..................................................................................................................................... 6
4.3.1. Expert laboratory ............................................................................................................. 6
4.3.2. Results obtained by the collaborators ............................................................................. 7
4.3.3. Conclusion ........................................................................................................................ 7
4.4. Statistical interpretations and calculations ............................................................................. 8
4.4.1. Visual linearity checking ................................................................................................... 8
4.4.2. Calculation of the accuracy profile and interpretation ................................................... 8
4.5. General conclusion for the interlaboratory study ................................................................ 10
4.6. General conclusion ................................................................................................................ 11
Appendices
Appendix A: Protocol of the alternative method Appendix B: Protocol of the reference method Appendix C: Artificial contaminations Appendix D: Relative trueness study ‐ Raw results Appendix E: Relative trueness study ‐ Statistical calculations Appendix F: Accuracy profile study ‐ Raw results Appendix G: Selectivity ‐ Raw results Appendix H: Interlaboratory study ‐ Raw results
Microsept Summary report - v0 BACARA 5/70 December 2018

1. Introduction
The Bacillus cereus Rapid Agar (BACARA) is validated by AFNOR Certification under the NF Validation mark with the certification number AES 10/10–07/10 according to the standard ISO 16140/A1:2011. The method is intended for all human food products and feed products since its initial validation.
Table 1 summarizes the different steps of the validation that occurred since the initial validation.
Table 1: Steps of the validation AFNOR certification
Study Date Standard Expert
Laboratory Observation
Initial validation
July 2010 ISO 16140:2003 IPL Santé,
Environnement Durables Nord
/
First renewal
May 2014 ISO 16140/A1:2011 ADRIA
Développement No additional tests
Second renewal
July 2018 ISO 16140‐2:2016 Microsept Additional tests to perform
to fulfill the updated validation standard
The present document introduces the results for the AFNOR Certification validation studies of the BACARA method according to the standard ISO 16140‐2:2016 for a broad range of foods.
A part of the results set out in this report were produced during validation tests carried out by EUROFINS IPL Santé, Environnement Durables Nord as part of NF Validation, in accordance with prevailing requirements.
The remaining part of the results is constituted by the analyses performed by the Laboratory Microsept as part of the requirements of the updated validation standard.
Microsept Summary report - v0 BACARA 6/70 December 2018

2. Protocols of the methods
2.1. Alternative method
2.1.1. Principle of the method
BACARA agar is a selective chromogenic medium that allows the enumeration of Bacillus of the cereus group without confirmation. On BACARA, typical colonies of B. cereus show a pink / orangey color due to the metabolism of the chromogenic substrate and are surrounded with an opaque halo due to the phospholipase activity. The selectivity of BACARA agar has been especially optimized to prevent growth of interfering flora and thus to allow an easy interpretation of plates even when matrix highly contaminated with competitive flora are analyzed.
2.1.2. Protocol of the method
The diagram summarizing the method is shown in appendix A. From an initial suspension realized according to the prescriptions of the ISO 6887 standard, or directly from a liquid sample, BACARA plates are inoculated as described below:
‐ Spreading of 0.1 ml on the surface of one plate per dilution. Low numbers estimations can be performed by the inoculation of 1 ml on 3 plates to enumerate low contaminations of Bacillus cereus group, Or
‐ Pouring 1 ml into about 18 mL of BACARA agar maintained at 44‐47°C.
The inoculated plates are incubated at 30±1°C for 24±2 h. After incubation, the characteristic colonies of Bacillus cereus group (pink/orangey colonies with a halo of opacification) are enumerated as colonies of the Bacillus cereus group. No confirmation is necessary.
Notes: as part of the study of certification, confirmations according to the tests described in the reference method were realized. Moreover, during the accuracy test, plates were stored at 5±3°C for 48 hours and again interpreted, to verify that this preservation did not modify their performance.
2.1.3. Restrictions There are no restrictions on use for the BACARA method.
2.2. Reference method The EN ISO 7932:2005 standard, Horizontal method for the enumeration of presumptive Bacillus cereus – Colony‐count technique at 30°C, was used for the initial validation study, for the first renewal study and for the second renewal study. The workflow of the reference method is presented in Appendix B.
Microsept Summary report - v0 BACARA 7/70 December 2018

3. Methods comparison study The study was conducted on a variety of samples and strains representative of food products. This is not an exhaustive list of the various matrices included in the application scope. For any remark on the alternative method, you can contact AFNOR Certification by connecting to the Internet page http://nf‐validation.afnor.org/contact‐2/.
3.1. Relative trueness study
3.1.1. Number and nature of the samples
The distribution of the samples per category, type and inoculation technique is given in table 2. Table 2: number and nature of the samples analyzed for the relative trueness study
Category Type
Analyzed samples Exploited samples
Initial validation study
Second renewal study
Surface sprea‐ding
Pour plates
Meat products,
fish products and seafood
a Ready‐to‐cook products 5 2 5 5
b Ready‐to‐reheat products 5 1 5 5
c Sauces, soups 2 4 6 6
Total 12 7 16 16
Dairy products
a Raw milk products 10 0 6 6
b Pasteurized products 2 3 5 5
c Milk powders 2 3 5 5
Total 14 6 16 16
Vegetables
a Flours, spices, dehydrated veg. 5 4 5 5
b Pasta, rices 1 6 6 6
c Deli salads, vegetables preparations 9 1 7 7
Total 15 11 18 18
Eggs and pastries
a Pasteurized liquid eggs 0 5 5 5
b Egg powders 1 4 5 5
c Pastries, creams, desserts 10 0 8 9
Total 11 9 18 19
Baby foods
a Ingredients 0 7 5 5
b Infant formula without probiotics 0 5 5 5
c Infant formula with probiotics 0 6 5 5
Total 0 18 15 15
Feeds
a Dry pet foods 0 6 5 5
b Poultry and rabbit foods 6 2 5 5
c Livestock foods 5 2 5 5
Total 11 10 15 15
Total 63 61 98 99
Microsept Summary report - v0 BACARA
8/70
December 2018

Considering all the steps of the validation: ‐ 63 samples were analyzed during the initial validation study, ‐ 61 samples were analyzed during the second renewal study.
Overall, 124 samples were analyzed giving 98 exploitable results for the surface spreading technique modality and 99 exploitable results for the pour plate modality.
3.1.2. Artificial contaminations
Artificial contaminations were performed using spiking and seeding protocols. The strains used, and the contamination protocols are presented in Appendix C. Naturally contaminated samples were also used: 49 of them were analyzed that led to the obtention of 29 interpretable results (29.6% and 29.3% for respectively the surface spreading method and the pour plate method).
3.1.3. Protocols used during the study The two modalities of enumeration of the alternative method were tested: surface spreading and pour plates. The minimum incubation times of the Petri dishes was applied, namely 22 hours at 30±1°C. Confirmations of the alternative method was performed on 5 colonies per Petri dish by spotting on a sheep blood agar media to observe the presence of an haemolysis. A storage at 5±3°C for 3 days of the Petri dishes after incubation was performed. The Petri dishes were read again after this storage.
3.1.4. Results Samples were analyzed by the reference and the alternative method so as to obtain at least 15 interpretable results per category and at least 5 per type. As results were available in duplicates concerning the initial validation study, only the first replicate was considered as part of the calculations of the EN ISO 16140‐2:2016 standard. Raw results are shown in appendix D. Three kinds of results are not considered as part of the statistical calculations:
‐ Those expressed with less than 4 colonies per Petri dish for at least one method or inoculation modality,
‐ those lower or higher than the quantification limits, ‐ Undetermined results.
All results are presented in scatter plots per category and modality of inoculation in figures below:
‐ Figure 1: scatter plots for the surface spreading technique for each category, ‐ Figure 2: scatter plots for the pour plates method for each category, ‐ Figure 3: scatter plots for all categories.
On scatter plots:
‐ Each type of food is differentiated per type on individual category scatter plots: blue circle: type a / orange diamond: type b / green triangle: type c
Microsept Summary report - v0 BACARA
9/70
December 2018

‐ Results expressed with less than 4 colonies per Petri dish for at least one method are indicated by a yellow square,
‐ Results lower or higher than the quantification limits for one method are indicated by a red square. The value of these results is corrected according to the EN ISO 16140‐2:2016 requirements.
Microsept Summary report - v0 BACARA 10/70 December 2018

Figure 1: Two‐dimensional plots per category, using the surface spreading inoculation for BACARA
0,0
1,0
2,0
3,0
4,0
5,0
0,0 1,0 2,0 3,0 4,0 5,0
Alternative method (log CFU
/g)
Reference method (log CFU/g)
Meat & fish products‐ Surface spreading
0,0
1,0
2,0
3,0
4,0
5,0
0,0 1,0 2,0 3,0 4,0 5,0
Alternative method (log CFU
/g)
Reference method (log CFU/g)
Dairy products ‐ Surface spreading
0,0
1,0
2,0
3,0
4,0
5,0
0,0 1,0 2,0 3,0 4,0 5,0
Alternative method (log CFU
/g)
Reference method (log CFU/g)
Vegetables ‐ Surface spreading
0,0
1,0
2,0
3,0
4,0
5,0
0,0 1,0 2,0 3,0 4,0 5,0
Alternative method (log CFU
/g)
Reference method (log CFU/g)
Eggs and pastries ‐ Surface spreading
0,0
1,0
2,0
3,0
4,0
5,0
0,0 1,0 2,0 3,0 4,0 5,0
Alternative method (log CFU
/g)
Reference method (log CFU/g)
Baby foods ‐ Surface spreading
0,0
1,0
2,0
3,0
4,0
5,0
0,0 1,0 2,0 3,0 4,0 5,0
Alternative method (log CFU
/g)
Reference method (log CFU/g)
Feed ‐ Surface spreading
Microsept Summary report - v0 BACARA
11/70
December 2018

Figure 2: Two‐dimensional plots per category, using the pour plate inoculation for BACARA
0,0
1,0
2,0
3,0
4,0
5,0
0,0 1,0 2,0 3,0 4,0 5,0
Alternative method (log CFU
/g)
Reference method (log CFU/g)
Meat & fish products ‐ Pour plates
0,0
1,0
2,0
3,0
4,0
5,0
0,0 1,0 2,0 3,0 4,0 5,0
Alternative method (log CFU
/g)
Reference method (log CFU/g)
Dairy products ‐ Pour plates
0,0
1,0
2,0
3,0
4,0
5,0
0,0 1,0 2,0 3,0 4,0 5,0
Alternative method (log CFU
/g)
Reference method (log CFU/g)
Vegetables ‐ Pour plates
0,0
1,0
2,0
3,0
4,0
5,0
0,0 1,0 2,0 3,0 4,0 5,0
Alternative method (log CFU
/g)
Reference method (log CFU/g)
Eggs and pastries ‐ Pour plates
0,0
1,0
2,0
3,0
4,0
5,0
0,0 1,0 2,0 3,0 4,0 5,0
Alternative method (log CFU
/g)
Reference method (log CFU/g)
Baby foods ‐ Pour plates
0,0
1,0
2,0
3,0
4,0
5,0
0,0 1,0 2,0 3,0 4,0 5,0
Alternative method (log CFU
/g)
Reference method (log CFU/g)
Feed ‐ Pour plates
Microsept Summary report - v0 BACARA
12/70
December 2018

Figure 3: Two‐dimensional plots for all categories using the surface spreading inoculation for BACARA
Figure 4: Two‐dimensional plots for all categories using the pour plate inoculation for BACARA
0,0
1,0
2,0
3,0
4,0
5,0
6,0
0,0 1,0 2,0 3,0 4,0 5,0 6,0
Alternative method (log CFU
/g)
Reference method (log CFU/g)
All categories ‐ Surface spreading
Meat & fish products
Dairy products
Vegetables
Eggs & pastries
Baby foods
Feed
First bisecting line
Values <4 CFU/Petri dish
Corrected values
0,0
1,0
2,0
3,0
4,0
5,0
6,0
0,0 1,0 2,0 3,0 4,0 5,0 6,0
Alternative method (log CFU
/g)
Reference method (log CFU/g)
All categories ‐ Pour plates
Meat & fish products
Dairy products
Vegetables
Eggs & pastries
Baby foods
Feed
First bisecting line
Values <4 CFU/Petri dish
Corrected values
Microsept Summary report - v0 BACARA
13/70
December 2018

3.1.5. Calculation and interpretation of relative trueness study The results obtained are analyzed using the Bland‐Altman method. Statistical calculations are presented in Appendix E, as well as the results excluded from the statistical analysis per category, type and modality of inoculation. Table 3 presents the summary of the average differences and standard deviation differences per category and for all categories. Table 3: values for the Bland‐Altman difference plot
Inoculation Category n Average difference
Standard deviation differences
Bias Lower
Confidence Limit
Upper Confidence
Limit
Surface spreading
MFP 16 0.01 0.15 / / /
DP 16 ‐0.01 0.17 / / /
V 18 ‐0.11 0.23 / / /
E&P 18 ‐0.04 0.15 / / /
BF 15 0.06 0.11 / / /
F 15 0.12 0.22 / / /
All cat. 98 0.00 0.19 0.00 ‐0.37 0.37
Pour plate
MFP 16 0.02 0.12 / / /
DP 16 0.05 0.19 / / /
V 18 ‐0.11 0.23 / / /
E&P 19 ‐0.07 0.17 / / /
BF 15 ‐0.01 0.11 / / /
F 15 0.07 0.15 / / /
All cat. 99 ‐0.01 0.18 ‐0.01 ‐0.37 0.34
Overall, the average difference is equal to 0,00 (surface spreading method) and ‐0,01 (pour plate method, showing no bias between the BACARA method and the reference method. The average difference varies from ‐0.11 log CFU/g (vegetables) to 0.12 CFU/g (feed samples) for the surface spreading method and from ‐0.11 log CFU/g (vegetables) to 0.07 log CFU/g (feed samples) for the pour plate technique. Upper and lower 95% confidence interval limits are lower than 0.4 log showing a good correlation between the two methods. The Bland‐Altman difference plots are presented in figures 4 and 5 for all categories. As on scatter plots:
‐ Each category is differentiated by a specific colour, ‐ Results expressed with less than 4 colonies per Petri dish for at least one method are indicated
by a yellow square, ‐ Results lower or higher than the quantification limits for one method are indicated by a red
square. The value of these results is corrected according to the EN ISO 16140‐2:2016 requirements.
Microsept Summary report - v0 BACARA
14/70
December 2018

Figure 5: Bland‐Altman difference plot for all categories with the surface spreading technique
Figure 5: Bland‐Altman difference plot for all categories with the surface spreading technique
Observations: Samples for which the average difference is lower or higher than the confidence limits are listed in table 4.
‐1,5
‐1,0
‐0,5
0,0
0,5
1,0
0,0 1,0 2,0 3,0 4,0 5,0 6,0
Difference (alternative ‐reference)
Mean of log CFU/g
Meat & fish products
Dairy products
Vegetables
Eggs & pastries
Baby foods
Feed
Values <4 CFU/g
Corrected values
Bias
Lower confidence limit
Upper confidence limit
‐1,0
‐0,5
0,0
0,5
1,0
1,5
0,0 1,0 2,0 3,0 4,0 5,0 6,0
Difference (alternative ‐reference)
Mean of log CFU/g
Meat & fish products
Dairy products
Vegetables
Eggs & pastries
Baby foods
Feed
Values <4 CFU/g
Corrected values
Bias
Lower confidence limit
Upper confidence limit
Microsept Summary report - v0 BACARA
15/70
December 2018

Table 4: values outside the confidence limits on the Bland‐Altman difference plot (green cases: values <4 CFU/Petri dish, yellow cases: values lower and higher than the quantification limits, blue: values higher than the confidence limits, red: values lower than the quantification limits)
Inoculation Category Type Sample
#
Reference method value
(log)
Alternative method value
(log) Mean Difference
Surface spreading LCL: ‐0.37 UCL: 0.37
M&FP b B303 1.60 2.08 1.84 0.48
DP c B360 1.60 2.04 1.82 0.44
V b E2 2.90 2.08 2.49 ‐0.82
V b B312 2.18 1.78 1.98 ‐0.40
F b L2 2.20 2.92 2.56 0.71
M&FP a M2 3.48 4.00 3.74 0.52
V a D2 1.48 1.00 1.24 ‐0.48
V c A1 1.00 1.90 1.45 0.90
E & P c H1 3.11 2.30 2.71 ‐0.81
BF c B326 1.00 0.00 0.50 ‐1.00
F b J1 1.48 1.00 1.24 ‐0.48
Pour plate LCL: ‐0.37 UCL: 0.34
V b E2 2.90 2.11 2.51 ‐0.79
V c D5 3.23 2.85 3.04 ‐0.38
E & P c H1 3.11 2.70 2.91 ‐0.41
V c A1 1.00 1.95 1.48 0.95
F b K2 1.48 2.00 1.74 0.52
F b L1 1.00 2.15 1.57 1.15
F c J3 1.85 1.00 1.42 ‐0.85
Surface spreading method:Eleven samples are out of the confidence limits: 6 concern corrected values or samples with less than 4 CFU/Petri dish, 3 are higher than the upper confidence limit and 2 are lower than the lower confidence limit.
Pour plate technique:Seven samples are out of the confidence limits: 4 concern corrected values or samples with less than 4 CFU/Petri dish, and 3 are lower than the lower confidence limit.
3.1.6. Conservation of the incubated BACARA Petri dishes at 5±3°C for 48 h During the initial validation study and during the second renewal study, no evolution of the enumerations between the readings realized after 22 hours of incubation at 30°C and after conservation of the Petri dishes for 48 hours at 5±3°C was observed.
The conclusions of the observations are therefore the same than after the first reading of the Petri dishes.
3.1.7. Conclusion The relative trueness study of the alternative method is satisfactory.
Microsept Summary report - v0 BACARA 16/70 December 2018

3.2. Accuracy profile study
3.2.1. Protocols Six matrix‐strain couples were tested by both methods. Two batches of a matrix, representative of each category, were inoculated with a Bacillus cereus strain at three levels (low, medium and high). For each sample, 5 replicates, represented by 5 different test portions, were tested by each method. This represents a total of 30 analyses per method. The matrix‐strain couples are presented in table 5. Table 5: matrix‐strain couples for the RLoD study
Category Matrix Strain Strain code
Origin of the strain
Target contami‐nation
level (log CFU/g)
Meat and fish products
Pâté B. cereus gp II EAA229 Sandwich ham cheddar
2.0
3.5
5.0
Dairy products Raw milk B. cereus gp III CND844 Milk proteins
Vegetables Vegetables
purée B. pseudomycoides gp I
FFT320 Broccoli puree
Eggs and pastries
Custard B. cereus gp IV ANJ157 Potato starch
Baby foods Infant formula with probiotics
B. cereus gp VI GAR051 Cheesecake
Feeds Dry pet food B. cereus gp V LDG480 Pasteurized potatoes puree
3.2.2. Results Raw data are provided in appendix F. The statistical data and the accuracy profiles are shown in figures 7 and 8. Statistical calculations were done according to the Excel spreadsheet named AP calculation tool_MCS_(clause_6‐1‐3‐3_Calculation_and_interpretation_of_accuracy_profile_study) ver 27‐01‐2015.xlsx available at http://standards.iso.org/iso/16140. The probability for the tolerance interval is set at 80% and the central value is the median. The acceptability limit is set at AL = 0.5 log10 CFU/g or ml.
Microsept Summary report - v0 BACARA
17/70
December 2018

Figure 7: Accuracy profiles per category, using the surface spreading inoculation for BACARA
Sample NameReference
central valueBias Lower β-ETI Upper β-ETI
β-ETI compared to
AL=±0.5 Acceptable
β-ETI compared to
final AL Acceptable
B183-B187 1.70 0.000 -0.175 0.175 YES YESB188-B192 1.90 0.000 -0.175 0.175 YES YESB193-B197 3.53 -0.040 -0.215 0.135 YES YESB198-B202 3.54 -0.053 -0.227 0.122 YES YESB203-B207 5.36 0.070 -0.105 0.244 YES YESB208-B212 5.36 0.085 -0.089 0.260 YES YES
Reference method
Alternative method
SD Repeatability 0.126 0.121 +/- 0.500
(Food) Category Meat products, fish products, (Food) Type Pâté de campagne
SD repeatability of reference method <= 0.125
NO
Final AL
‐0.60
‐0.40
‐0.20
0.00
0.20
0.40
0.60
0.00 1.00 2.00 3.00 4.00 5.00 6.00 7.00
Bias
Reference Median
Pâté de campagne
Bias
β‐ETI
AL = +/‐ 0.5
Sample NameReference
Central valueBias Lower β-ETI Upper β-ETI
β-ETI compared to
AL=±0.5 Acceptable
β-ETI compared to
final AL Acceptable
B273-B277 1.78 0.125 -0.017 0.266 YES YESB278-B282 1.90 0.000 -0.141 0.141 YES YESB283-B287 3.74 0.008 -0.134 0.149 YES YESB288-B292 3.72 -0.063 -0.204 0.079 YES YESB293-B297 5.18 0.103 -0.039 0.244 YES YESB298-B302 5.26 -0.025 -0.166 0.117 YES YES
Reference method
Alternative method
SD Repeatability 0.102 0.098 +/- 0.500
(Food) Category(Food) Type
Dairy productsRaw milk
SD repeatability of reference method <= 0.125
YES
Final AL
‐0.60
‐0.40
‐0.20
0.00
0.20
0.40
0.60
0.00 1.00 2.00 3.00 4.00 5.00 6.00 7.00
Bias
Reference Median
Raw milk
Bias
β‐ETI
AL = +/‐ 0.5
Sample NameReference
Central valueBias Lower β-ETI Upper β-ETI
β-ETI compared to
AL=±0.5 Acceptable
β-ETI compared to
final AL Acceptable
B123-B127 2.23 -0.054 -0.202 0.093 YES YESB128-B132 2.32 -0.146 -0.293 0.001 YES YESB133-B137 3.00 -0.108 -0.255 0.039 YES YESB138-B142 3.00 -0.125 -0.272 0.022 YES YESB143-B147 5.61 -0.251 -0.398 -0.104 YES YESB148-B152 5.68 -0.339 -0.486 -0.192 YES YES
Reference method
Alternative method
SD Repeatability 0.081 0.102 +/- 0.500
Vegetables(Food) Category
SD repeatability of reference method <= 0.125
YES
(Food) Type Broccoli puree
Final AL
‐0.60
‐0.40
‐0.20
0.00
0.20
0.40
0.60
0.00 1.00 2.00 3.00 4.00 5.00 6.00 7.00
Bias
Reference Median
Broccoli puree
Bias
β‐ETI
AL = +/‐ 0.5
Sample NameReference
Central valueBias Lower β-ETI Upper β-ETI
β-ETI compared to
AL=±0.5 Acceptable
β-ETI compared to
final AL Acceptable
B153-B157 1.90 0.051 -0.089 0.191 YES YESB158-B162 2.00 -0.046 -0.186 0.094 YES YESB163-B167 3.59 0.052 -0.088 0.192 YES YESB168-B172 3.61 -0.022 -0.162 0.118 YES YESB173-B177 5.08 0.000 -0.140 0.140 YES YESB178-B182 5.08 0.000 -0.140 0.140 YES YES
Reference method
Alternative method
SD Repeatability 0.112 0.097 +/- 0.500
(Food) TypeEggs and pastries
Custard(Food) Category
YES
SD repeatability of reference method <= 0.125
Final AL
‐0.60
‐0.40
‐0.20
0.00
0.20
0.40
0.60
0.00 1.00 2.00 3.00 4.00 5.00 6.00
Bias
Reference Median
Custard
Bias
β‐ETI
AL = +/‐ 0.5
é
Sample NameReference
Central valueBias Lower β-ETI Upper β-ETI
β-ETI compared to
AL=±0.5 Acceptable
β-ETI compared to
final AL Acceptable
B243-B247 1.90 0.051 -0.132 0.234 YES YESB248-B252 2.00 -0.155 -0.338 0.028 YES YESB253-B257 3.56 -0.012 -0.196 0.171 YES YESB258-B262 3.49 0.065 -0.118 0.248 YES YESB263-B267 4.85 0.133 -0.051 0.316 YES YESB268-B272 4.89 0.048 -0.135 0.231 YES YES
Reference method
Alternative method
SD Repeatability 0.094 0.127 +/- 0.500YES
SD repeatability of reference method <= 0.125
Final AL
Baby foodsInfant formula with probiotics
(Food) Category(Food) Type
‐0.60
‐0.40
‐0.20
0.00
0.20
0.40
0.60
0.00 1.00 2.00 3.00 4.00 5.00 6.00
Bias
Reference Median
Infant formula with probiotics
Bias
β‐ETI
AL = +/‐ 0.5
Sample NameReference
Central valueBias Lower β-ETI Upper β-ETI
β-ETI compared to
AL=±0.5 Acceptable
β-ETI compared to
final AL Acceptable
B213-B217 1.90 0.000 -0.144 0.144 YES YESB218-B222 1.78 0.067 -0.077 0.211 YES YESB223-B227 3.59 0.187 0.043 0.331 YES YESB228-B232 3.78 0.000 -0.144 0.144 YES YESB233-B237 5.26 0.160 0.015 0.304 YES YESB238-B242 5.38 0.111 -0.033 0.256 YES YES
Reference method
Alternative method
SD Repeatability 0.123 0.100 +/- 0.500
(Food) Category Feeds(Food) Type Dry pet food for dog with
SD repeatability of reference method <= 0.125
YES
Final AL
‐0.60
‐0.40
‐0.20
0.00
0.20
0.40
0.60
0.00 1.00 2.00 3.00 4.00 5.00 6.00
Bias
Reference Median
Dry pet food for dog with probiotics
Bias
β‐ETI
AL = +/‐ 0.5
Microsept Summary report - v0 BACARA
18/70
December 2018

Figure 8: Accuracy profiles per category, using the pour plate inoculation for BACARA
Sample NameReference
central valueBias Lower β-ETI Upper β-ETI
β-ETI compared to
AL=±0.5 Acceptable
β-ETI compared to
final AL Acceptable
B183-B187 1.70 -0.097 -0.315 0.121 YES YESB188-B192 1.90 -0.204 -0.422 0.014 YES YESB193-B197 3.53 -0.276 -0.494 -0.058 YES YESB198-B202 3.54 -0.146 -0.364 0.072 YES YESB203-B207 5.36 -0.083 -0.301 0.135 YES YESB208-B212 5.36 -0.040 -0.257 0.178 YES YES
Reference method
Alternative method
SD Repeatability 0.126 0.151 +/- 0.500
SD repeatability of reference method <= 0.125
NO
Final AL
(Food) Category Meat products, fish products, (Food) Type Pâté de campagne
‐0.60
‐0.40
‐0.20
0.00
0.20
0.40
0.60
0.00 1.00 2.00 3.00 4.00 5.00 6.00 7.00
Bias
Reference Median
Pâté de campagne
Bias
β‐ETI
AL = +/‐ 0.5
Sample NameReference
Central valueBias Lower β-ETI Upper β-ETI
β-ETI compared to
AL=±0.5 Acceptable
β-ETI compared to
final AL Acceptable
B273-B277 1.78 0.067 -0.056 0.190 YES YESB278-B282 1.90 -0.204 -0.327 -0.081 YES YESB283-B287 3.74 0.000 -0.123 0.123 YES YESB288-B292 3.72 -0.063 -0.185 0.060 YES YESB293-B297 5.18 0.079 -0.044 0.202 YES YESB298-B302 5.26 -0.051 -0.174 0.072 YES YES
Reference method
Alternative method
SD Repeatability 0.102 0.085 +/- 0.500
SD repeatability of reference method <= 0.125
YES
Final AL
(Food) Category(Food) Type
Dairy productsRaw milk
‐0.60
‐0.40
‐0.20
0.00
0.20
0.40
0.60
0.00 1.00 2.00 3.00 4.00 5.00 6.00 7.00
Bias
Reference Median
Raw milk
Bias
β‐ETI
AL = +/‐ 0.5
Sample NameReference
Central valueBias Lower β-ETI Upper β-ETI
β-ETI compared to
AL=±0.5 Acceptable
β-ETI compared to
final AL Acceptable
B123-B127 2.23 -0.054 -0.161 0.052 YES YESB128-B132 2.32 -0.146 -0.253 -0.039 YES YESB133-B137 3.00 -0.149 -0.256 -0.042 YES YESB138-B142 3.00 -0.125 -0.232 -0.018 YES YESB143-B147 5.61 -0.136 -0.242 -0.029 YES YESB148-B152 5.68 -0.283 -0.390 -0.176 YES YES
Reference method
Alternative method
SD Repeatability 0.081 0.074 +/- 0.500
SD repeatability of reference method <= 0.125
YES
(Food) Type Broccoli puree
Final AL
Vegetables(Food) Category
‐0.60
‐0.40
‐0.20
0.00
0.20
0.40
0.60
0.00 1.00 2.00 3.00 4.00 5.00 6.00 7.00
Bias
Reference Median
Broccoli puree
Bias
β‐ETI
AL = +/‐ 0.5
Sample NameReference
Central valueBias Lower β-ETI Upper β-ETI
β-ETI compared to
AL=±0.5 Acceptable
β-ETI compared to
final AL Acceptable
B153-B157 1.90 0.138 -0.029 0.306 YES YESB158-B162 2.00 -0.046 -0.213 0.122 YES YESB163-B167 3.59 -0.035 -0.202 0.133 YES YESB168-B172 3.61 0.010 -0.157 0.178 YES YESB173-B177 5.08 -0.101 -0.269 0.066 YES YESB178-B182 5.08 0.097 -0.071 0.264 YES YES
Reference method
Alternative method
SD Repeatability 0.112 0.116 +/- 0.500
SD repeatability of reference method <= 0.125
Final AL
(Food) Category
YES
(Food) TypeEggs and pastries
Custard
‐0.60
‐0.40
‐0.20
0.00
0.20
0.40
0.60
0.00 1.00 2.00 3.00 4.00 5.00 6.00
Bias
Reference Median
Custard
Bias
β‐ETI
AL = +/‐ 0.5
é
Sample NameReference
Central valueBias Lower β-ETI Upper β-ETI
β-ETI compared to
AL=±0.5 Acceptable
β-ETI compared to
final AL Acceptable
B243-B247 1.90 -0.058 -0.240 0.124 YES YESB248-B252 2.00 -0.097 -0.279 0.085 YES YESB253-B257 3.56 -0.012 -0.194 0.170 YES YESB258-B262 3.49 0.000 -0.182 0.182 YES YESB263-B267 4.85 0.074 -0.108 0.256 YES YESB268-B272 4.89 0.022 -0.160 0.204 YES YES
Reference method
Alternative method
SD Repeatability 0.094 0.126 +/- 0.500
Baby foodsInfant formula with probiotics
(Food) Category(Food) Type
SD repeatability of reference method <= 0.125
Final AL
YES
‐0.60
‐0.40
‐0.20
0.00
0.20
0.40
0.60
0.00 1.00 2.00 3.00 4.00 5.00 6.00
Bias
Reference Median
Infant formula with probiotics
Bias
β‐ETI
AL = +/‐ 0.5
Sample NameReference
Central valueBias Lower β-ETI Upper β-ETI
β-ETI compared to
AL=±0.5 Acceptable
β-ETI compared to
final AL Acceptable
B213-B217 1.90 0.051 -0.106 0.209 YES YESB218-B222 1.78 0.000 -0.157 0.157 YES YESB223-B227 3.59 -0.047 -0.204 0.110 YES YESB228-B232 3.78 -0.222 -0.379 -0.064 YES YESB233-B237 5.26 -0.051 -0.209 0.106 YES YESB238-B242 5.38 -0.058 -0.215 0.099 YES YES
Reference method
Alternative method
SD Repeatability 0.123 0.109 +/- 0.500
(Food) Category Feeds(Food) Type Dry pet food for dog with
SD repeatability of reference method <= 0.125
YES
Final AL
‐0.60
‐0.40
‐0.20
0.00
0.20
0.40
0.60
0.00 1.00 2.00 3.00 4.00 5.00 6.00
Bias
Reference Median
Dry pet food for dog with probiotics
Bias
β‐ETI
AL = +/‐ 0.5
Microsept Summary report - v0 BACARA
19/70
December 2018

The tolerance intervals fall into the acceptability limits for all categories with the two modalities of inoculation.
3.2.3. Conclusion The alternative method is accepted as being equivalent to the reference method.
3.3. Specificity / selectivity The aim of this study is to check that all the strains of the Bacillus cereus group are detected, and that no cross‐reaction exists with other species of Bacillus or with strains from other genera. The inclusivity and the exclusivity of the method are defined by analysis, respectively of 50 positive strains and 30 negative strains.
3.3.1. Protocols
3.3.1.1. Initial validation study The strains were tested in duplicate according to two types of inoculation of BACARA medium: spreading or inclusion method. Thirty (30) target strains and twenty‐eight (28) non‐target strains were tested. The raw data are provided in Appendix G.
3.3.1.2. Second renewal study Tests for target microorganisms were performed once with the alternative method (by spreading and pour plate), the reference method and a non‐selective agar at an inoculation level sufficient to obtain a countable number of colonies on the plate. Twenty (20) target strains were tested. A pure culture of the strains was calibrated and diluted in 90 ml of buffered peptone water then enumerated to obtain a countable number of colonies on Petri dishes. Tests for non‐target microorganisms were performed once with the alternative method (by spreading and pour plate) and the reference method. Pure cultures were grown on a non‐selective broth for 24 hours and diluted at an appropriate level before testing. Two (2) non‐target strains were tested. A pure culture of the strains in Brain Heart Infusion Broth was performed at the optimal growth temperature of the strains then enumerated to obtain a countable number of colonies on Petri dishes.
3.3.2. Results
3.3.2.1. Initial validation study
Target strains The thirty strains of Bacillus cereus group gave typical colonies with an opaque halo.
Non‐target strains The twenty‐eight non‐target strains did not give characteristic aspect onto the BACARA medium:
‐ No growth for 25 strains, ‐ Growth on BACARA medium (pink colonies without halo) for 2 strains of Enterococcus faecalis, ‐ Growth on BACARA medium (small white colonies without halo) for a strain of Leuconostoc
citreum.
Microsept Summary report - v0 BACARA
20/70
December 2018
3.3.2.2. Second renewal study
Target strains Nineteen strains gave typical colonies on BACARA agar media: pink‐orangey colonies with an opaque halo. Among these strains, one (FFT320) needed the addition of milk powder in the initial suspension to be recovered on the BACARA agar media and to give typical colonies. One strain of the group VII (Bacillus cytotoxicus AF2 from INRA PACA UMR408 SQPOV, coded GGB821 by Laboratory Microsept) did not grow on the BACARA agar media even with the addition of milk powder in the initial suspension. This strain was able to grow on a surface Petri dish of BACARA only by direct streaking of an opalescent suspension of a pure culture, in the zone corresponding to the deposit point of a loop and after 48 h of incubation at 30±1°C. Furthermore, this strain is typical on the MYP agar medium and has a positive reaction to the haemolysis test.
Non‐target strains The two non‐target strains did not grow on the BACARA medium.
3.3.3. Conclusion The inclusivity and the exclusivity of the alternative method are satisfactory. Only one strain of Bacillus cereus (B. cytotoxicus, group VII) did not grow on the BACARA agar media after 22 hours of incubation at 30±1°C.
3.4. Practicability Practicability is studied as a function of the four criteria defined by the Technical Board in comparing the reference method EN ISO 7932 (2005) with the Bacillus cereus Rapid Agar (BACARA) method. The criteria defined are informed below:
Packaging Volume of reagents
Pre‐poured complete medium: - AEB520100: pack of 20 plates of Ø 90 mm, - AEB120102: pack of 10 plates of Ø 140 mm. Ready‐to‐use base medium:
- AEB620106: Kit BACARA base composed of 5 vials of 100 ml base medium and 2 vials of supplement (enrichment supplement and chromogenic selective supplement). Each supplement vial is planned for 500 ml of base medium.
Storage conditions and kit The plates of pre‐poured complete medium and Kit BACARA base must be kept between +2°C and +8°C. The expiry date is shown on each plate and each vial.
Microsept Summary report - v0 BACARA
21/70
December 2018

Use after opening of the kit The pre‐poured complete medium plates must be stored at 2‐8°C in their package until the expiry date, protected from light. The plates poured from flasks can be kept up to 2 weeks at 2‐8°C in a hermetically sealed package. After opening, the BACARA enrichment supplement can be used up to its expiry date if it was manipulated according to good laboratory practice (ie: use in aseptic conditions and storage between 2 and 8°C). After opening, the BACARA selective supplement can be used up to 15 days maximum if it was manipulated according to good laboratory practice. Warning: Do not flame the tube before closing it. This supplement contains a flammable solvent. For the mode of storage, refer to the standard EN ISO 7218.
Reagents Supplements have to be kept protected from light. For the medium in flask, liquefy the medium in a water bath at 100°C and cool to 44‐47°C. Per flask of 100 ml of BACARA medium, add aseptically 4 ml of BACARA enrichment supplement and 0.5 ml of BACARA selective supplement. Homogenize well the agar base and the supplements, avoiding the incorporation of air bubbles.
Time to result
Step Time required (Day) Time required (Day)
BACARA® method EN ISO 7932 standard
Realization of first dilution and decimal dilutions Media inoculation Plates reading, interpretation and calculation
D0 D0
D1
D0 D0
D1 and D2
Obtaining negative results if no characteristic colonv)
D1 D2
Hemolysis test from an isolated colony Hemolysis test after purification
/ /
D2 to D3 D3 to D4
Obtaining negative results (after negative confirmations if necessary)
D1 D2 to D4
Obtaining positive results: Confirmation by reference method test (including purification) Alternative method
/
D1
D2 to D4
/
Common step with reference method Preparation of initial suspension and decimal dilutions.
Microsept Summary report - v0 BACARA
22/70
December 2018

3.5. General conclusion for the methods comparison study The relative trueness study shows a good correlation between the alternative method and the reference method. The accuracy profile study illustrates that the performances of the alternative method are comparable to those of the reference method. The alternative method is specific and selective, although one strain of the group VII of Bacillus cereus was not detected by the method after 22 hours of incubation of the media at 30±1°C. Time‐to‐result is faster with the alternative method (one day) than with the reference method (two days), and the alternative method does not require confirmations.
Microsept Summary report - v0 BACARA
23/70
December 2018

4. Interlaboratory study
The aim of the interlaboratory study, as described in ISO 16140/A1:2011 standard, was to determine the variability of the results obtained in different laboratories using identical samples and to compare these results with those obtained during the methods comparison study.
4.1. Study organization Fourteen (14) collaborators took part in the interlaboratory study. Pasteurized milk was inoculated with a Bacillus cereus strain, isolated from a dairy product.
Eight samples were prepared per collaborator, representing 4 levels of contamination with 2 samples per level. Collaborators and Expert Laboratory carried out the analyses with the reference method and the alternative method (spreading method). It was asked to the collaborators to analyze samples from the initial suspension (dilution of the sample at 1/10th) to its third decimal dilution.
4.2. Control of experimental parameters
4.2.1. Contamination levels obtained after artificial contamination
The four contamination levels are detailed in the following table.
Table 6: Contamination levels of inoculated samples
Level Sample Targeted level (CFU/ml) Real level (CFU/ml)
Level 0 (L0) 1 and 2 0 0
Level 1 (L1) 3 and 4 100 101
Level 2 (L2) 7 and 8 1 000 975
Level 3 (L3) 5 and 6 10 000 9360
4.2.2. Strain stability during shipping ln order to evaluate the Bacillus cereus strain variability during shipping, bacterial counts of inoculated milk at different levels were checked at different times, during storage at 6°C. Enumeration results (CFU/ml) are reported in table 7.
Table 7: Stability of the Bacillus cereus strain at 6°C (*: day of the analysis)
Level Day 0 Day 1* Day 2
L1 101 72 <10
L2 975 510 380
L3 9360 4000 2700
An evolution of the enumeration was observed during storage at 6°C; the concentration of Bacillus cereus decreased in the samples over time.
4.2.3. Shipping conditions Temperatures registered by the temperature probe during shipping were between 1.6°C and 6.0°C. The temperatures at reception are recorded in the following table.
Microsept Summary report - v0 BACARA 24/70 December 2018

Table 8: temperatures at reception
Collaborator
Reception temperature (°C)
Comments Communicated by the collaborator
lndicated by the temperature probe
A 2.3 2.9 Delivery at Day 1 in the afternoon. Analyses at Day 2.
B 1.0 2.0 /
C 3.9 2.8 /
D 5.9 5.5 /
E 1.1 1.6 /
F 2.5 6.0 /
G 11.8 5.7 /
H 5.0 5.1 /
I 4.8 5.7 /
J 9.0 5.1 /
K 6.7 2.0 /
L 4.8 3.1 /
M 5.5 5.0 /
N 5.3 3.0 /
The 14 collaborators received their samples at Day 1. Collaborator A analyzed the samples at Day 2; their results were not kept for statistical interpretation. Collaborator G and Collaborator J indicated a reception temperature above 8°C; this was not confirmed by the temperature probe. Their results were exploited.
4.2.4. Conclusion The results of 13 laboratories were exploited.
4.3. Results
4.3.1. Expert laboratory Results obtained for the Expert Laboratory are presented in the table 9. Table 9: Results of the Expert Laboratory (in CFU/ml)
Level Reference method Alternative method
Duplicate 1 Duplicate 2 Duplicate 1 Duplicate 2
L0 <10 <10 <10 <10
L1 20 30 40 20
L2 340 430 340 300
L3 3000 5500 2900 2400
Results according to the EN ISO 7932 standard and according to the alternative method were in agreement.
Microsept Summary report - v0 BACARA
25/70
December 2018

4.3.2. Results obtained by the collaborators Detailed results of the 14 laboratories which realized the analysis are presented in Appendix H. The results are summarized in the table 10 for the low level L1, intermediate level L2 and high level L3. Table 10: Results in CFU/ml of the collaborators per level of contamination (RM: reference method, AM: alternative method, D: duplicate)
Collaborator
L1 L2 L3
RM AM RM AM RM AM
D1 D2 D1 D2 D1 D2 D1 D2 D1 D2 D1 D2
A <10 <10 10 10 250 310 280 200 1500 1300 1300 1500
B 20 30 30 10 440 420 410 320 2400 2800 2000 2200
C 30 70 30 20 310 440 260 340 1400 1500 1700 1500
D 90 10 80 <10 360 350 330 280 1500 1600 1400 1600
E 70 40 70 40 380 410 310 410 2100 1800 2000 1800
F 90 130 40 50 310 450 290 430 1300 1800 1500 1500
G 80 90 30 20 420 560 430 420 2000 1900 1700 1600
H 50 110 10 50 400 450 430 310 2100 1700 1700 1500
I 50 60 30 30 370 510 330 380 2400 2400 1800 2200
J 60 60 60 20 460 460 450 430 2300 2900 1900 2400
K 50 60 10 50 430 440 330 460 1800 2300 1800 1900
L 70 10 30 10 590 360 410 360 1500 1800 1400 1600
M 50 70 40 80 590 620 540 420 2200 2300 2300 2100
N 50 50 40 80 530 530 470 390 1700 2000 1700 1900
Two collaborators (A and D) showed results inferior to 10 CFU/g for one or the two replicates of the level L1. Consequently, the results of these collaborators are not considered in the statistical treatment of the data. Moreover, it’s important to note that a part of the results of the level L1 do not fulfill the requirements of the standard EN ISO 7218/A1:2013 for the low counts of colonies (§ 10.3.2.4.1). Because of the decrease of the concentration in Bacillus cereus after inoculation, some results are expressed despite of their concentration inferior to 40 CFU/g (less than 4 colonies on Petri dishes for the enumeration of the initial suspension) while they should be noted: “Microorganisms are present but less than 40 per ml”. Besides collaborators A and D, 4 results of the reference method and 13 results of the alternative method are concerned. After the presentation of the project of renewal study of the method in March 2018, the Technical Board agreed with the proposition of the Expert Laboratory to still interpret all the data of the level L1.
4.3.3. Conclusion Results of 12 laboratories were finally statistically exploited. The results obtained by the collaborators were in agreement with those of the Expert Laboratory.
Microsept Summary report - v0 BACARA
26/70
December 2018
4.4. Statistical interpretations and calculations
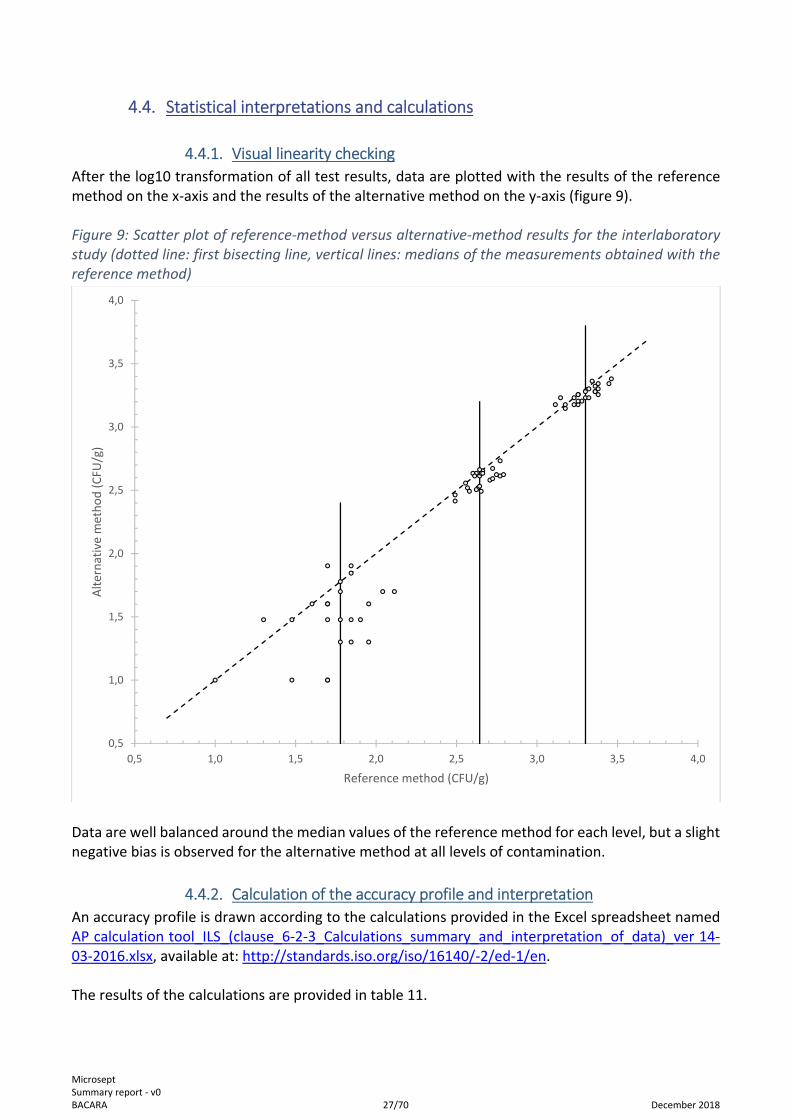
4.4.1. Visual linearity checking After the log10 transformation of all test results, data are plotted with the results of the reference method on the x‐axis and the results of the alternative method on the y‐axis (figure 9). Figure 9: Scatter plot of reference‐method versus alternative‐method results for the interlaboratory study (dotted line: first bisecting line, vertical lines: medians of the measurements obtained with the reference method)
Data are well balanced around the median values of the reference method for each level, but a slight negative bias is observed for the alternative method at all levels of contamination.
4.4.2. Calculation of the accuracy profile and interpretation An accuracy profile is drawn according to the calculations provided in the Excel spreadsheet named AP calculation tool_ILS_(clause_6‐2‐3_Calculations_summary_and_interpretation_of_data)_ver 14‐03‐2016.xlsx, available at: http://standards.iso.org/iso/16140/‐2/ed‐1/en. The results of the calculations are provided in table 11.
0,5
1,0
1,5
2,0
2,5
3,0
3,5
4,0
0,5 1,0 1,5 2,0 2,5 3,0 3,5 4,0
Alternative method (CFU
/g)
Reference method (CFU/g)
Microsept Summary report - v0 BACARA
27/70
December 2018

Table 11: Summary of the accuracy profile calculations (AL: acceptability limit, TI: tolerance interval, SD: standard deviation)
Tolerance probability (β): 80%
AL in log (λ) by default: 0.5
AL in log (λ) based on reference method pooled variance (3.3 x sR,ref): 0.51 Alternative method Reference method Levels Low Medium High Low Medium High Target value 1.730 2.649 3.296
Number of participants (K) 12 12 12 12 12 12
Average for alternative method 1.488 2.583 3.256 1.730 2.649 3.296
Repeatability SD (sr) 0.287 0.075 0.039 0.216 0.075 0.055
Between‐labs SD (sL) 0.000 0.014 0.053 0.103 0.031 0.074
Reproducibility SD (sR) 0.287 0.077 0.066 0.239 0.081 0.092
Corrected number of dof 22.957 22.857 15.464 21.863 22.228 15.602
Coverage factor 1.347 1.348 1.384
Interpolated Student t 1.320 1.320 1.339
Tolerance interval SD 0.2925 0.0783 0.0682
Lower TI limit 1.101 2.480 3.164
Upper TI limit 1.874 2.687 3.347
Bias ‐0.242 ‐0.066 ‐0.040
Relative Lower TI limit (β = 80%) ‐0.628 ‐0.169 ‐0.131
Relative Upper TI limit (β = 80%) 0.144 0.037 0.051
Lower Acceptability Limit ‐0.51 ‐0.51 ‐0.51
Upper Acceptability Limit 0.51 0.51 0.51
Pooled average reproducibility SD of the reference method (sR,ref) 0.155
Comments: As the lower tolerance interval limit of the low level of contamination (‐0.628) falls outside the acceptability limit usually (set by default at ±0.500), a new acceptability limit is defined based on the reference method pooled variance. This new limit set at ±0.51 is still above the lower tolerance interval limit of the low level of contamination (‐0.628). This observation probably results from the low counts used to calculate the concentration of the low level of contamination with the alternative method. As several results are expressed with colony counts between 1 and 3, their precision is too low. This leads to a high dispersion of the results. Associated with the slight negative bias observed on the scatter plot and determined by the calculations above, the lower tolerance interval limit falls below the recalculated acceptability limit. In conclusion, the bias introduced by the inclusion of the low counts of colonies at the low level of contamination leads to a bias for the interpretation of the accuracy profile. The graphical representation of the accuracy profile lies in figure 10.
Microsept Summary report - v0 BACARA
28/70
December 2018

Figure 10: Accuracy profile of the alternative method using β = 80% and λ = 0,51 log10 unit
As described above, the AL is not met only for the lower tolerance interval of the low level of contamination. This observation is most probably due to the low counts observed at this level. For the upper tolerance interval of the low level and for the two other levels, the tolerance interval limits of the alternative method are within the acceptability limits of 0.5 log CFU/g.
4.5. General conclusion for the interlaboratory study The control of experimental parameters showed a decrease of the concentration in Bacillus cereus over the time in the matrix. This decrease led to low counts of colonies with both methods at the low level of inoculation. Associated with a slight negative bias for the alternative method, the dispersion of the results implied by the low counts causes that the lower tolerance interval falls outside of the lower acceptability limit. The tolerance intervals of the other levels of contamination and the upper tolerance interval of the low level of contamination fall within the default acceptability limits (±0.5 log CFU/ml). Despite the bias observed for the low level of contamination, the alternative method is regarded as being equivalent to the reference method.
‐0,8
‐0,6
‐0,4
‐0,2
0,0
0,2
0,4
0,6
0,8
1,5 1,7 1,9 2,1 2,3 2,5 2,7 2,9 3,1 3,3 3,5
Accuracy (Difference of Log)
Levels Log (CFU/g)
Bias Relative Lower TI limit (beta = 80%)
Relative Upper TI limit (beta = 80%) Lower Acceptability Limit
Upper Acceptability Limit
Microsept Summary report - v0 BACARA
29/70
December 2018

4.6. General conclusion The data and the interpretation of the methods comparison study and of the interlaboratory study fulfill the requirements of the EN ISO 16140‐2:2016 standard. The BACARA method is considered as equivalent to the reference method described in the EN ISO 7932:2005 standard. Le Lion d’Angers, December 4th, 2018 François Le Nestour Head of the Methods Validation studies and R&D
Microsept Summary report - v0 BACARA
30/70
December 2018

APPENDICES
Microsept Summary report - v0 BACARA 31/70 December 2018

APPENDIX A
PROTOCOL OF THE BACARA METHOD
Diagram of the procedure as described in the user guide
Preparation and dilution of the sample according to the specifications of the standard EN ISO 6887
Surface method
1 ml on 3 BACARA plates+
0,1 ml on 1 BACARA plateRepeat this step with the following
successive decimal dilutions
Incubation at 30±1°C for 24±2 h
ReadingLarge pink / orangey colonies with an opaque halo
Enumeration of Petri dishes with less than 150 typical colonies
Pour plate method
1 ml on 1 sterile plateAddition of 18 ml of BACARA mediumRepeat this step with the following
successive decimal dilutions
Microsept Summary report - v0 BACARA 32/70 December 2018

APPENDIX A
PROTOCOL OF THE BACARA METHOD
Diagram of the procedure as applied by the Expert Laboratory
Preparation and dilution of the sample according to the specifications of the standard EN ISO 6887
10 g diluted at 1/10th in buffered peptone water
Surface method
1 ml on 3 BACARA plates+
0,1 ml on 1 BACARA plateRepeat this step with the followingsuccessive decimal dilutions in
peptone‐salt broth
Incubation at 30±1°C for 22 h
ReadingLarge pink / orangey colonies with an opaque halo
Enumeration of Petri dishes with less than 150 typical colonies
(Confirmation by streaking of 5 colonies per plate onto blood agar)
Pour plate method
1 ml on 1 sterile plateAddition of 18 ml of BACARA mediumRepeat this step with the followingsuccessive decimal dilutions in
peptone‐salt broth
Storage at 5±3°C for 2 days
New reading
Microsept Summary report - v0 BACARA 33/70 December 2018

APPENDIX BEN ISO 7932:2005
Diagram of the procedure as described in the standard
Preparation and dilution of the sample according to the specifications of the standard EN ISO 6887
1 ml on 3 MYP plates+
0,1 ml on 1 MYP plateRepeat this step with the following
successive decimal dilutions
Incubation at 30±1°C for 18 to 24 hIncubation for an additional 24 h if colonies are not clearly visible
ReadingLarge, pink colonies, generally surrounded by a zone of precipitation
Enumeration of Petri dishes with less than 150 typical colonies
ConfirmationStreak, stab or spot of 5 typical colonies on sheep blood agar from
each plate selected for the enumerationIncubation at 30±1°C for 24±2 h
Bacillus cereus show a positive reaction to the hemolysis test
Microsept Summary report - v0 BACARA
34/70
December 2018

Appendix C
Artificial contaminations
Microsept Summary report - v0 BACARA
35/70
December 2018

Code Name Origin
G1 Boar stew PCM BA10 Bacillus cereus Milk spores /
G2 Lobster bisque PCM BA14 Bacillus cereus Egg spores /
G3 Milk powder PL BA10 Bacillus cereus Milk spores /
G4 Strawberry bifidus yoghurt PL BA36 Bacillus cereus ATCC10876 spores /
G5 Potato flakes FL BA10 Bacillus cereus Milk spores /
G6 Spices for paella FL BA36 Bacillus cereus ATCC10876 spores /
G7 Sweets D BA14 Bacillus cereus Egg spores /
G8 Egg powder D BA36 Bacillus cereus ATCC10876 spores /
G9 Bone meal AA BA14 Bacillus cereus Egg spores /
G10 Chasseur sauce with mushrooms FL BA10 Bacillus cereus Milk spores /H1 Chocolate powder D BA19 Bacillus cereus Environment 20 min. at 48°C 0.65
H2 Seed mixture AA BA51 Bacillus mycoïdes cereus Red berries semolina pudding 20 min. at 48°C 0.5
H4 Sweets D BA51 Bacillus mycoïdes cereus Red berries semolina pudding 20 min. at 48°C 0.5
H6 Forêt noire cake D BA51 Bacillus mycoïdes cereus Red berries semolina pudding 20 min. at 48°C 0.5
H7 Pudding D BA19 Bacillus cereus Environment 20 min. at 48°C 0.65
H8 Chicken aiguillettes PCM BA51 Bacillus mycoïdes cereus Red berries semolina pudding 20 min. at 48°C 0.5
H9 Fish fillet PCM BA14 Bacillus cereus Egg spores /
H10 Breaded pork PCM BA36 Bacillus cereus ATCC10876 spores /
I5 Chocolate éclair D BA10 Bacillus cereus Milk spores /
I6 Chocolate cake D BA50 Bacillus cereus Milk 20 min. at 48°C 0.5
I7 Pastry cream cake D BA50 Bacillus cereus Milk 20 min. at 48°C 0.5
I8 Pasteurized milk PL BA50 Bacillus cereus Milk 20 min. at 48°C 0.5
I9 Raw milk PL BA10 Bacillus cereus Milk spores /
I10 Milk powder PL BA10 Bacillus cereus Milk spores /
L1 Pullet feed AA
L2 Turkey feed AA
L3 Horde feed AAM1 Brie cheese PL BA35 Bacillus cereus Milk powder 24h 4°C, 10 min. 50°C 0.58
M3 St Nectaire cheese PL BA65 Bacillus mycoïdes cereus Dairy product 24h 4°C, 10 min. 50°C 0.5
M4 Brie de Meaux cheese, aged PL BA65 Bacillus mycoïdes cereus Dairy product 24h 4°C, 10 min. 50°C 0.5
M5 Brie de Meaux cheese, aged PL BA65 Bacillus mycoïdes cereus Dairy product 24h 4°C, 10 min. 50°C 0.5
M6 Brie cheese PL BA35 Bacillus cereus Milk powder 24h 4°C, 10 min. 50°C 0.58
Contamination by mixture : 3 g of horse feed
Contamination by mixture : 4 g of horse feed
StrainStress type
Stress
intensity
Initial validation study
Code Sample name Category
Contamination by mixture : 2 g of horse feed
Microsept Summary report - v0 BACARA 36/70 December 2018

Code Origin
B306 Pasteurized milk cheese DP b CLC707 Bacillus cereus group III Three cheese pizza 2‐3 days at 5±3°C
B309 Coffee ice‐cream DP b CLC707 Bacillus cereus group III Three cheese pizza 2 weeks at ‐24°C
B320 Chocolate flavoured infant cereals BF a ANJ157 Bacillus cereus group IV Starch Spores
B321 Vanilla flavoured infant cereals BF a ANJ157 Bacillus cereus group IV Starch Spores
B324 Dehydrated meat‐based cooking ingredient M&FP c ANJ157 Bacillus cereus group IV Starch Spores
B325 Dehydrated fish‐based cooking ingredient M&FP c ANJ157 Bacillus cereus group IV Starch Spores
B326 Organic infant formula with probiotics BF c BMK053 Bacillus cereus group III Milk proteins Air‐dried culture ‐ 2 weeks at room temp.
B327 Infant food supplement multigrain BF a BMK053 Bacillus cereus group III Milk proteins Air‐dried culture ‐ 2 weeks at room temp.
B328 Infant formula 6 months ‐ 1 year with probiotics BF c BMK053 Bacillus cereus group III Milk proteins Air‐dried culture ‐ 2 weeks at room temp.
B329 Infant formula 6 months ‐ 1 year with probiotics BF c BMK053 Bacillus cereus group III Milk proteins Air‐dried culture ‐ 2 weeks at room temp.
B330 Semi‐skimmed milk powder DP c FEQ368 Bacillus cereus group IV Cheese with nuts Air‐dried culture ‐ 2 weeks at room temp.
B331 Infant formula 10‐36 months w/o probiotics BF b FEQ368 Bacillus cereus group IV Cheese with nuts Air‐dried culture ‐ 2 weeks at room temp.
B332 Infant formula 10 months ‐ 3 years w/o probiotics BF b FEQ368 Bacillus cereus group IV Cheese with nuts Air‐dried culture ‐ 2 weeks at room temp.
B333 Infant formula 0 ‐ 6 months w/o probiotics BF b FEQ368 Bacillus cereus group IV Cheese with nuts Air‐dried culture ‐ 2 weeks at room temp.
B334 Infant formula 10 months ‐ 3 years with probiotics BF c CND844 Bacillus cereus group III Milk proteins Air‐dried culture ‐ 2 weeks at room temp.
B335 Whole milk powder DP c CND844 Bacillus cereus group III Milk proteins Air‐dried culture ‐ 2 weeks at room temp.
B336 Puffed rice for animals F a GFF463 Bacillus cereus Common wheat Spores
B337 Pre‐cooked pasta V b GFF463 Bacillus cereus Common wheat 2‐3 days at 5±3°C
B338 Pre‐cooked rice V b GFF463 Bacillus cereus Common wheat 2‐3 days at 5±3°C
B339 Pasteurized egg yolk powder 1 E&P b REB947 Bacillus cereus group IV Crème brûlée with cranberries Air‐dried culture ‐ 2 weeks at room temp.
B340 Pasteurized egg yolk powder 2 E&P b REB947 Bacillus cereus group IV Crème brûlée with cranberries Air‐dried culture ‐ 2 weeks at room temp.
B341 Pasteurized liquid egg yolk E&P a KJL797 Bacillus cereus group V Ground 2‐3 days at 5±3°C
B342 Pasteurized liquid whole egg E&P a KJL797 Bacillus cereus group V Ground 2‐3 days at 5±3°C
B343 Liquid egg yolk (salt 11%) E&P a CBB622 Bacillus cereus group III Piémontaise 2‐3 days at 5±3°C
B344 Liquid whole egg (salt 9% ‐ sugar 10.9%) E&P a CBB622 Bacillus cereus group III Piémontaise 2‐3 days at 5±3°C
B345 Liquid egg yolk (sugar 30%) E&P a KJL797 Bacillus cereus group V Ground 2‐3 days at 5±3°C
B346 Pasteurized egg white powder E&P b DJQ279 Bacillus cereus group II Ground Air‐dried culture ‐ 2 weeks at room temp.
B347 Pasteurized whole egg powder 1 E&P b DJQ279 Bacillus cereus group II Ground Air‐dried culture ‐ 2 weeks at room temp.
B348 Dehydrated complementary food for cat F a NBB986 Bacillus cereus group III Pieces of pork muzzle Air‐dried culture ‐ 2 weeks at room temp.
B349 Dehydrated complementary food for dog F a NBB986 Bacillus cereus group III Pieces of pork muzzle Air‐dried culture ‐ 2 weeks at room temp.
B351 Broken rice for pets F a GFF463 Bacillus cereus Common wheat Spores
B352 Infant food supplement rice‐carots BF a HEK655 Bacillus cereus group VI Zucchini puree Spores
B353 Infant food supplement semolina‐vegetables BF a HEK655 Bacillus cereus group VI Zucchini puree Spores
B354 Infant formula 12 months ‐ 3 years w/o probiotics BF b GAR051 Bacillus cereus Cheesecake Air‐dried culture ‐ 2 weeks at room temp.
B355 Infant formula 6 ‐ 12 months w/o probiotics BF b GAR051 Bacillus cereus Cheesecake Air‐dried culture ‐ 2 weeks at room temp.
B356 Chocolate flavoured infant cereals BF a PCE867 Bacillus cereus group II Organic peppermint Spores
B357 Vanilla flavoured infant cereals BF a PCE867 Bacillus cereus group II Organic peppermint Spores
B358 Organic infant formula with probiotics BF c GAR051 Bacillus cereus Cheesecake Air‐dried culture ‐ 2 weeks at room temp.
B359 Organic Infant formula with probiotics BF c GAR051 Bacillus cereus Cheesecake Air‐dried culture ‐ 2 weeks at room temp.
B360 Organic skimmed milk powder DP c PCE867 Bacillus cereus group II Organic peppermint Spores
B361 Calf & kig goats feed F c DCA171 Bacillus cereus group III Environment Spores
B362 Rabbit feed F b DCA171 Bacillus cereus group III Environment Spores
B363 Rabbit feed F b DCA171 Bacillus cereus group III Environment Spores
Second renewal study
ContaminationName
Sample # Sample name Category TypeStrain
Microsept Summary report - v0 BACARA 37/70 December 2018

Appendix D
Relative trueness study – Raw results
Microsept Summary report - v0 BACARA 38/70 December 2018
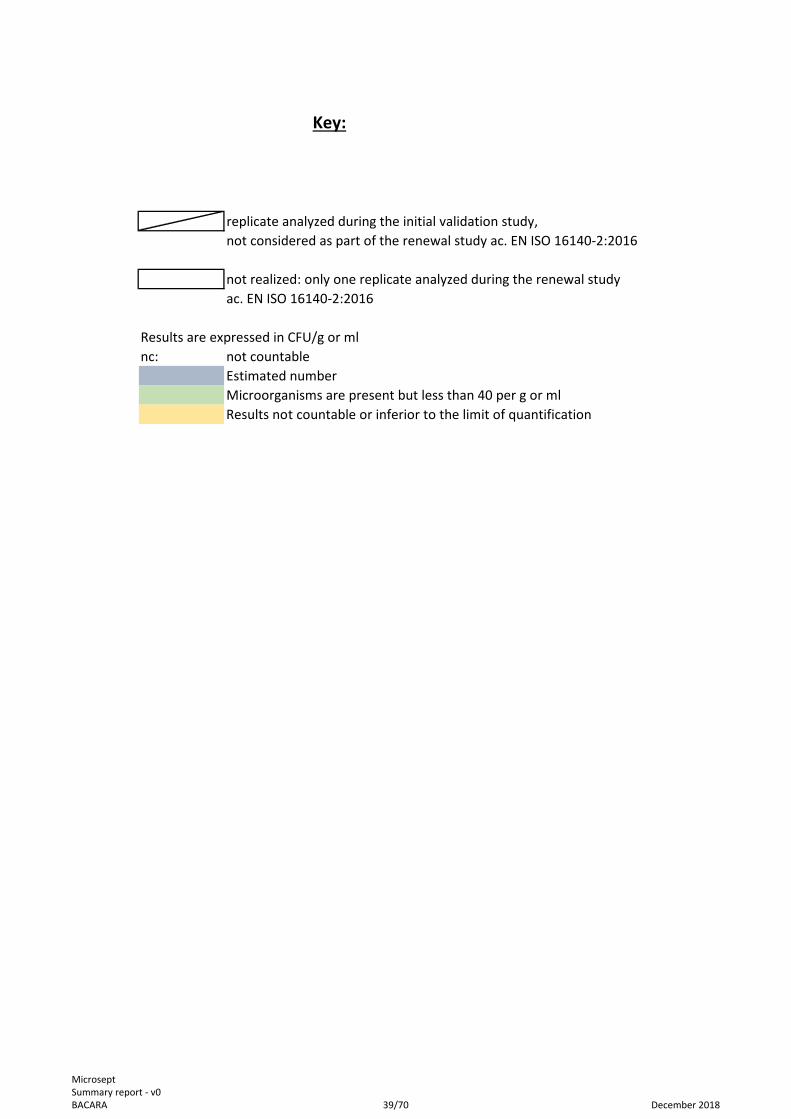
Key:
replicate analyzed during the initial validation study,
not considered as part of the renewal study ac. EN ISO 16140‐2:2016
not realized: only one replicate analyzed during the renewal study
ac. EN ISO 16140‐2:2016
Results are expressed in CFU/g or ml
nc: not countable
Estimated number
Microorganisms are present but less than 40 per g or ml
Results not countable or inferior to the limit of quantification
Microsept Summary report - v0 BACARA 39/70 December 2018

R1 R2 R1 R2 R1 R2
CFU Conf. CFU Conf. Result Result CFU Conf. CFU Conf. Result Result CFU Conf. CFU Conf. Result Result
‐1 0 / 0 / 0 / 0 / 0 / 0 /
‐2 0 / 0 / 0 / 0 / 0 / 0 /
‐1 nc / nc / 1 100% 1 100% >150 / >150 /
‐2 nc / nc / 0 / 0 / nc / nc /
‐2 108 100% 113 100% 116 100% 109 100% 102 100% 108 100%
‐3 10 100% 14 100% 12 100% 15 100% 9 100% 9 100%
‐2 114 100% 118 100% 126 100% 128 100% 98 100% 100 100%
‐3 12 100% 10 100% 14 100% 7 100% 10 100% 9 100%
‐2 98 100% 76 100% 96 100% 73 100% 120 100% 98 100%
‐3 13 100% 8 100% 12 100% 8 100% 11 100% 12 100%
‐2 80 100% 96 100% 51 100% 69 100% 80 100% 67 100%
‐3 10 100% 12 100% 7 100% 6 100% 6 100% 8 100%
‐2 120 100% 113 100% 128 100% 118 100% 124 100% 136 100%
‐3 16 100% 13 100% 16 100% 20 100% 13 100% 17 100%
‐2 69 100% 76 100% 68 100% 69 100% 69 100% 75 100%
‐3 12 100% 7 100% 7 100% 12 100% 17 100% 11 100%
‐1 49 100% 55 100% 35 100% 36 100% 60 100% 63 100%
‐2 3 100% 16 100% 4 100% 7 100% 4 100% 10 100%
‐1 24 100% 28 100% 22 100% 23 100% 18 100% 23 100%
‐2 5 100% 3 100% 3 100% 5 100% 3 100% 3 100%
‐1 69 100% 51 100% 45 100% 57 100% 66 100% 63 100%
‐2 10 100% 9 100% 11 100% 5 100% 17 100% 8 100%
‐1 63 100% 53 100% 72 100% 77 100% >150 / >150 /
‐2 9 100% 14 100% 10 100% 5 100% 13 100% 8 100%
‐1 4 100% 11 100% 7 100%
‐2 1 100% 2 100% 0 /
‐1 80 100% 87 100% 60 100%
‐2 4 100% 13 100% 7 100%
‐1 0 / 0 / 0 /
‐2 0 / 0 / 0 /
‐1 13 100% 10 100% 18 100%
‐2 1 100% 2 100% 1 100%
‐1 47 100% 52 100% 46 100%
‐2 6 100% 2 100% 3 100%
‐1 66 100% 64 100% 46 100%
‐2 13 100% 9 100% 7 100%
‐1 146 100% 155 100% 152 100%
‐2 28 100% 22 100% 19 100%B325
Dehydrated fish‐based cooking
ingredientYes c 1600 1600 1600
B324Dehydrated meat‐based cooking
ingredientYes c 720 660 480
B323Dehydrated poultry cream with
mushroomsNo c 480 490 450
B322 Fish soup thaï flavoured No c 130 110 170
B305 Raw minced veal No a <10 <10 <10
B304 Tuna fillet No a 760 910 610
Relative trueness study ‐ Meat products, fish products, seafood
B303 Shepherd's pie No b 40 120 70
Second ren
ewal study
1300 800
580 660
190 240
750 650
7800 6800
12000 14000
7800 7800
12000 10000
nc nc
10000 11000
9800 9900
BACARA ‐ Pour plate
R1 R2
<10 <10
No
a
b
b
c
c
a
a
a
b
b
b
a
Yes
Yes
No
No
No
650Minced raw pork meat
Initial validation study
EN ISO 7932:2005 BACARA ‐ Surface spreading
R1 R2 R1 R2
No
No
Yes
Yes
Yes
Yes
I2
I3
I4
Pâté de campagne
Thai style chicken with rice and
vegetables
Boar stew
Lobster bisque
Chasseur sauce with mushrooms
Chicken aiguillettes
Fish fillet
Breaded pork
Meat ready‐to‐reheat meal
Beef ready‐to‐reheat meal
Pork ready‐to‐reheat meal
G10
H8
H9
H10
I1
610 750 750
Study Sample
codeSample name AC Type Dil.
E1
E3
G1
G2
260 280 230 250
720 550 510 560
7400 7500 6800 7400
470 650 350 390
8200 9800 5300 6800
12000 11000 13000 13000
11000 12000 13000 12000
10000 7600 9800 7400
<10 <10 <10 <10
nc nc 10 10
11000 12000 12000 11000
Microsept Summary report - v0 BACARA 40/70 December 2018

R1 R2 R1 R2 R1 R2
CFU Conf. CFU Conf. Result Result CFU Conf. CFU Conf. Result Result CFU Conf. CFU Conf. Result Result
‐2 86 100% 96 100% 77 100% 97 100% 120 100% 126 100%
‐3 11 100% 11 100% 13 100% 13 100% 11 100% 11 100%
‐2 79 100% 91 100% 65 100% 92 100% 70 100% 76 100%
‐3 9 100% 11 100% 9 100% 11 100% 7 100% 8 100%
‐1 / / / / / / / / 140 100% 148 100%
‐2 25 100% 31 100% 19 100% 27 100% 12 100% 15 100%
‐3 4 100% 3 100% 2 100% 1 100% / / / /
‐2 nc / nc / 92 100% 71 100% 110 100% 83 100%
‐3 9 100% 7 100% 13 100% 12 100% 10 100% 9 100%
‐2 89 100% 67 100% 111 100% 95 100% 95 100% 97 100%
‐3 16 100% 15 100% 8 100% 15 100% 14 100% 21 100%
‐1 0 / 0 / 0 / 0 / 0 / 0 /
‐2 0 / 0 / 0 / 0 / 0 / 0 /
‐1 0 / 0 / 0 / 0 / 0 / 0 /
‐2 0 / 0 / 0 / 0 / 0 / 0 /
‐1 0 / 0 / 0 / 0 / 0 / 0 /
‐2 0 / 0 / 0 / 0 / 0 / 0 /
‐2 6 100% 6 100% 7 100% 5 100% 11 100% 7 100%
‐3 1 100% 0 / 1 100% 0 / 1 100% 0 /
‐3 3 100% 7 100% nc / 7 100% nc / nc /
‐4 0 / 0 / 1 100% 1 100% 1 100% 0 /
‐2 6 100% 4 100% 5 100% 10 100% 13 100% 10 100%
‐3 0 / 1 100% 2 100% 1 100% 1 100% 1 100%
‐2 14 100% 12 100% 23 100% 13 100% 20 100% 18 100%
‐3 1 100% 1 100% 2 100% 2 100% 1 100% 2 100%
‐2 16 100% 15 100% 18 100% 17 100% 21 100% 30 100%
‐3 1 100% 1 100% 1 100% 1 100% 3 100% 2 100%
‐2 16 100% 13 100% 11 100% 10 100% 8 100% 8 100%
‐3 2 100% 0 / 1 100% 0 / 1 100% 0 /
‐1 50 100% 48 100% 30 100%
‐2 6 100% 2 100% 4 100%
‐1 >150 / 143 100% >150 /
‐2 27 100% 15 100% 25 100%
‐3 1 100% 0 / 1 100%
‐1 10 100% 8 100% 10 100%
‐2 1 100% 0 100% 1 100%
‐2 18 100% 13 100% 31 100%
‐3 4 100% 1 100% 1 100%
‐2 68 100% 68 100% 75 100%
‐3 6 100% 4 100% 11 100%
‐1 4 100% 11 100% 7 100%
‐2 0 / 1 100% 0 /
Coffee ice‐cream Yes b 240014002500
B306 Pasteurized milk cheese Yes b 510 450 310
Yes c 2000 1300 2900
Relative trueness study ‐ Dairy products
B319 Goat pasteurized milk cheese No b 100 80 100
800 800
1300 1000
1900 1800
2200 2900
<10 <10
1100 700
B309
nc nc
11000
<10 <10
<10 <10
7000 7600
11000 8400
1400 1500
BACARA ‐ Pour plate
R1 R2
12000 12000
a
Initial validation study
Study
R1 R2R1 R2Sample
codeSample name AC Type Dil.
EN ISO 7932:2005 BACARA ‐ Surface spreading
M6 Brie cheese Yes
b
9900
a
c
a
a
a
a
a
a
a
a
M4 Aged Brie de Meaux cheese 1 Yes
M5 Aged Brie de Meaux cheese 2 Yes
M2 Raw milk Normandy cheese Yes
M3 Saint‐Nectaire cheese Yes
J6 Raw milk Coulommiers cheese No
M1 Brie cheese Yes
J4 Raw milk camembert cheese No
J5 Raw milk camembert cheese No
I9 Raw milk Yes
I10 Milk powder Yes
G4 Bifidus strawberry yoghurt Yes
1500 1500 1700 1600
1600 1200 1100 910
600 400 500 1000
1400 1200 2300 1400
3000 7000 700010000
<10 <10 <10 <10
<10 <10 <10 <10
600 600 700 500
9500 7500 11000 10000
<10 <10 <10 <10
9000 7000 9500 7500
8800 9700 8200 10000
8000 9300 6700 9400
I8 Pasteurized milk Yes b 1900 25002600 3100
G3 Milk powder Yes c
Second ren
ewal study
B360 Organic skimmed milk powder Yes c 40 110 70
B335 Whole milk powder Yes c 6700 6500 7800
B330 Semi‐skimmed milk powder
Microsept Summary report - v0 BACARA 41/70 December 2018

R1 R2 R1 R2 R1 R2
CFU Conf. CFU Conf. Result Result CFU Conf. CFU Conf. Result Result CFU Conf. CFU Conf. Result Result
‐1 nc / nc / 8 100% 13 100% 9 100% 10 100%
‐2 0 / 0 / 0 / 0 / 0 / 0 /
‐1 34 100% 20 100% 32 100% 29 100% 33 100% 36 100%
‐2 3 100% 8 100% 3 100% 0 / 3 100% 1 100%
‐1 11 100% 12 100% 11 100% 10 100% 9 100% 8 100%
‐2 1 100% 4 100% 1 100% 0 / 1 100% 0 /
‐1 0 / 0 / 2 100% 0 / 0 / 0 /
‐2 0 / 0 / 0 / 0 / 0 / 0 /
‐1 5 100% 4 100% 5 100% 3 100% 6 100% 7 100%
‐2 1 100% 0 / 0 / 0 / 0 / 2 100%
‐1 3 100% 2 100% 1 100% 3 100% 3 100% 3 100%
‐2 1 100% 1 100% 0 / 0 / 1 100% 0 /
‐1 0 / 3 100% 0 / 0 / 1 100% 0 /
‐2 0 / 0 / 0 / 0 / 0 / 0 /
‐1 nc / nc / 4 100% 4 100% 0 / 0 /
‐2 nc / nc / 1 100% 1 100% 0 / 0 /
‐1 174 100% 112 100% 175 100% 150 100% 71 100% 67 100%
‐2 14 100% 16 100% 7 100% 10 100% 7 100% 4 100%
‐1 nc / nc / 12 100% 9 100% 13 100% 11 100%
‐2 8 100% 4 100% 1 100% 1 100% 1 100% 0 /
‐1 nc / nc / 0 / 0 / >150 / 26 100%
‐2 nc / nc / 0 / 0 / >150 / 0 /
‐1 3 100% 2 100% 3 100% 3 100% 3 100% 6 100%
‐2 0 / 0 / 0 / 0 / 0 / 0 /
‐1 14 100% 5 100% 6 100% 4 100% 6 100% 11 100%
‐2 1 100% 1 100% 0 / 0 / 0 / 1 100%
‐1 7 100% 7 100% 4 100% 5 100% 4 100% 7 100%
‐2 0 / 1 100% 0 / 0 / 1 100% 1 100%
‐1 123 100% 136 100% 122 100% 121 100% 127 100% 139 100%
‐2 9 100% 15 100% 19 100% 14 100% 23 100% 21 100%
‐2 >150 / >150 / >150 / >150 / >150 / >150 /
‐3 20 100% 20 100% 18 100% 19 100% 17 100% 19 100%
‐2 110 100% 93 100% 108 100% 98 100% 108 100% 113 100%
‐3 14 100% 10 100% 15 100% 12 100% 8 100% 10 100%
‐2 nc / nc / 3 100% 2 100% 2 100% 4 100%
‐3 nc / nc / 0 / 0 / 0 / 0 /
Relative trueness study ‐ Vegetables
11000 11000
200 400
40 70
1400 1500
17000 19000
nc 240
30 60
60 110
<10 <10
710 650
130 100
60 70
30 30
10 <10
330 340
90 80
<10 <10
BACARA ‐ Pour plate
R1 R2
90 90
EN ISO 7932:2005 BACARA ‐ Surface spreading
R1 R2 R1 R2
c
c
a
a
aYes
Initial validation study
Soup
c
c
c
c
a
a
c
c
c
b
c
c
cNo
No
No
Yes
Yes
Spinach
Potato flakes
Paella spices
Spices mixture
No
No
No
No
No
No
No
No
No
No
No
No
Pasta salad with chicken
Tokyo salad
Nicoise salad
Spinach
Spinach
Potato flakes
Glass cup broccoli beetroot
F2
F3
G5
G6
H3
D5
E2
E4
F1
E5
B1
D1
D2
D3
D4
Dil.
A1 Tabbouleh
A2
A3
Potato salad
Ratatouille
Potato flakes
Tomato flat beans
Lentil salad
Study Sample
codeSample name AC Type
<100 <100 80 130
340 250 320 260
110 150 110 90
<10 <10 20 <10
50 40 50 30
30 20 10 30
<10 <10 <1030
40 40nc nc
1700 1200 1700 1500
800 400 120 90
nc nc <10 <10
30 20 30 30
50140 60 40
11000 9400 11000 10000
nc nc 300 200
70 70 40 50
1200 1400 1300 1200
20000 20000 18000 19000
Microsept Summary report - v0 BACARA
42/70
December 2018

R1 R2 R1 R2 R1 R2
CFU Conf. CFU Conf. Result Result CFU Conf. CFU Conf. Result Result CFU Conf. CFU Conf. Result Result
Relative trueness study ‐ Vegetables
BACARA ‐ Pour plate
R1 R2
EN ISO 7932:2005 BACARA ‐ Surface spreading
R1 R2 R1 R2Dil.
Study Sample
codeSample name AC Type
‐1 6 100% 5 100% 6 100%
‐2 0 / 0 / 0 /
‐1 15 100% 17 100% 19 100%
‐2 3 100% 1 100% 3 100%
‐1 15 100% 6 100% 12 100%
‐2 1 100% 1 100% 3 100%
‐1 0 / 0 / 0 /
‐2 0 / 0 / 0 /
‐1 9 100% 6 100% 4 100%
‐2 0 / 0 / 0 /
‐3 40 100% 47 100% 48 100%
‐4 3 100% 6 100% 5 100%
‐1 nc / nc / nc /
‐2 nc / nc / nc /
‐2 52 100% 55 100% 51 100%
‐3 4 100% 7 100% 10 100%
‐2 40 100% 47 100% 48 100%
‐3 3 100% 6 100% 5 100%
‐1 60 100% 85 100% 67 100%
‐2 10 100% 8 100% 3 100%
‐2 71 100% 67 100% 75 100%
‐3 13 100% 9 100% 10 100%
B312 Ready‐to cook pasta No b 150
7700Pre‐cooked rice 6900
B337 Yes b 640
B338 Yes b 7600
60
Pre‐cooked pasta 850 640
B315 Dehydrated black mushrooms No a 39000 48000 48000
140
B310 Common wheat No a 60 50 60
B314 Dehydrated onions No a 90 60 40
B313 Ready‐to cook pasta No b <10 <10 <10
No b 3900 4800 4800
B317 Salad potatoes, bacon, tomatoes No c 5100 5600 5500
Second renewal study
B316 Dandelions powder No a nc nc nc
B311 Ready‐to cook pasta No b 160 160 200
B318 Breadcrumbs
Microsept Summary report - v0 BACARA
43/70
December 2018

R1 R2 R1 R2 R1 R2
CFU Conf. CFU Conf. Result Result CFU Conf. CFU Conf. Result Result CFU Conf. CFU Conf. Result Result
‐1 23 100% 20 100% 24 100% 20 100% 21 100% 16 100%
‐2 3 100% 3 100% 5 100% 6 100% 1 100% 1 100%
‐2 96 100% 124 100% 98 100% 96 100% 116 100% 113 100%
‐3 11 100% 10 100% 10 100% 10 100% 12 100% 10 100%
‐2 98 100% 93 100% 108 100% 98 100% 93 100% 120 100%
‐3 16 100% 13 100% 15 100% 12 100% 9 100% 10 100%
‐2 13 100% 6 100% 2 100% 1 100% 5 100% 6 100%
‐3 1 100% 2 100% 0 / 0 / 0 / 2 100%
‐2 113 100% 98 100% 54 100% 49 100% 51 100% 50 100%
‐3 13 100% 8 100% 10 100% 3 100% 5 100% 8 100%
‐2 nc / nc / 6 100% 3 100% 13 100% 12 100%
‐3 nc / nc / 0 / 0 / 3 100% 2 100%
‐2 61 100% 48 100% 42 100% 45 100% 89 100% 50 100%
‐3 9 100% 13 100% 7 100% 11 100% 12 100% 6 100%
‐2 7 100% 6 100% 9 100% 8 100% 9 100% 2 100%
‐3 1 100% 1 100% 1 100% 1 100% 2 100% 0 /
‐2 83 100% 72 100% 83 100% 96 100% 125 100% 101 100%
‐3 9 100% 13 100% 9 100% 15 100% 13 100% 19 100%
‐1 / / / / / / / / >150 / 160 100%
‐2 29 100% 31 100% 23 100% 30 100% 21 100% 12 100%
‐3 3 100% 2 100% 2 100% 4 100% 2 100% 1 100%
‐1 / / / / / / / / >150 / >150 /
‐2 31 100% 32 100% 19 100% 26 100% 21 100% 12 100%
‐3 2 100% 1 100% 3 100% 4 100% / / / /
‐1 9 100% 4 100% 6 100%
‐2 0 / 0 / 0 /
‐1 40 100% 26 100% 38 100%
‐2 4 100% 2 100% 4 100%
‐1 6 100% 8 100% 5 100%
‐2 0 / 0 / 0 /
‐1 23 100% 36 100% 26 100%
‐2 1 100% 4 100% 1 100%
‐2 87 100% 91 100% 102 100%
‐3 10 100% 8 100% 10 100%
‐3 60 100% 53 100% 36 100%
‐4 5 100% 13 100% 2 100%
‐3 28 100% 28 100% 16 100%
‐4 1 100% 1 100% 1 100%
‐2 16 100% 22 100% 19 100%
‐3 2 100% 1 100% 1 100%
‐1 32 100% 27 100% 24 100%
‐2 5 100% 2 100% 3 100%
Relative trueness study ‐ Eggs and pastries
2100 1200
2100 1200
Initial validation study
BACARA ‐ Pour plate
R1 R2
200 150
12000 11000
9300 12000
500 600
5100 5300
1500 1300
Chocolate cake Yes c 3100
2000
c
c
c
c
c
c
100
11000 9600 5800 4700
nc nc 600 300
2700
9200 5100
900 200
13000 11000
I7 Chou à la crème Yes c 3000 3000
10000
6400 5500 4500 5100
700 600 900 800
2900 3000 2300
H4 Sweets Yes
H5 Profiteroles Yes
I6
I5 Chocolate éclair Yes
H6 Forêt noire cake Yes
H7 Pudding Yes
260
1300 600 200
G8 Egg powder Yes
H1 Chocolate powder Yes
c
c
b
Study Sample
codeSample name AC Type Dil.
EN ISO 7932:2005 BACARA ‐ Surface spreading
R1 R2 R1 R2
B342
B343 Liquid egg yolk (salt 11%) Yes
240
9700 12000 9800 9600
10000 9600 11000 10000
C1 Red berries semolina pudding No
G7 Sweets Yes
8400 7700 8400
240 210
90 40 60B339
B340 Pasteurized egg yolk powder 2 Yes b 380
Pasteurized liquid whole egg Yes a 220 360 250
250
B341 Pasteurized liquid egg yolk Yes a 60 80 50
15000
a 8800 9000 10000
B344Liquid whole egg (salt 9% ‐ sugar
10.9%)Yes a 59000 60000 35000
B346 Pasteurized egg white powder Yes b 1600 2100 1800
Second ren
ewal study
B347 Pasteurized whole egg powder 1 Yes b 340 260
B345 Liquid egg yolk (sugar 30%) Yes a 26000 26000
400 250
Pasteurized egg yolk powder 1 Yes b
Microsept Summary report - v0 BACARA
44/70
December 2018

R1 R1 R1
CFU Conf. Result CFU Conf. Result CFU Conf. Result
‐1 0 / 0 / 0 /
‐2 0 / 0 / 0 /
‐1 0 / 0 / 0 /
‐2 0 / 0 / 0 /
‐1 1 100% 0 / 2 100%
‐2 0 / 0 / 0 /
‐1 9 100% 9 100% 7 100%
‐2 0 / 0 / 0 /
‐3 77 100% 92 100% 60 100%
‐4 6 100% 7 100% 5 100%
‐2 41 100% 68 100% 56 100%
‐3 2 100% 6 100% 7 100%
‐1 68 100% 45 100% 88 100%
‐2 14 100% 5 100% 10 100%
‐1 124 100% 130 100% 82 100%
‐2 14 100% 13 100% 17 100%
‐3 32 100% 34 100% 31 100%
‐4 2 100% 3 100% 3 100%
‐2 22 100% 29 100% 27 100%
‐3 4 100% 5 100% 3 100%
‐3 28 100% 39 100% 24 100%
‐4 3 100% 6 100% 5 100%
‐1 104 100% 129 100% 88 100%
‐2 19 100% 16 100% 5 100%
‐1 52 100% 54 100% 44 100%
‐2 8 100% 10 100% 9 100%
‐2 33 100% 51 100% 48 100%
‐3 5 100% 9 100% 4 100%
‐1 6 100% 8 100% 9 100%
‐2 0 / 0 / 0 /
‐1 21 100% 18 100% 23 100%
‐2 1 100% 2 100% 1 100%
‐1 60 100% 58 100% 40 100%
‐2 7 100% 3 100% 5 100%
‐1 7 100% 9 100% 6 100%
‐2 0 / 0 / 1 /
220
B358Organic infant formula with
probioticsYes c 610
B357 Vanilla flavoured infant cereals Yes a 200 180
90 60B359 70
B356 Chocolate flavoured infant cereals Yes a 60 80 90
550 410
Organic Infant formula with
probioticsYes c
B355Infant formula 6 ‐ 12 months w/o
probioticsYes b 3500 5500 4700
B354Infant formula 12 months ‐ 3 years
w/o probioticsYes b 550 580 480
Infant formula 10 months ‐ 3 years
with probioticsYes c 2400 3100 2700
20
450 890
B332Infant formula 10 months ‐ 3 years
w/o probioticsYes b 1300 1300 900
70
59000
c 3900
B328Infant formula 6 months ‐ 1 year
with probiotics
<10
B321 Vanilla flavoured infant cereals Yes a <10
B320 Chocolate flavoured infant cereals Yes a <10
<10 <10
850
41000 26000
6700 5700
34000 31000
B352 Infant food supplement rice‐carots a 28000
B327 Infant food supplement multigrain a 90
Yes
Yes
Yes
B331Infant formula 10‐36 months w/o
probioticsYes b 750
B333Infant formula 0 ‐ 6 months w/o
probioticsYes b 31000
B334
B329Infant formula 6 months ‐ 1 year
with probiotics
Yes c 75000
R1 R1 R1
Relative trueness study ‐ Baby foodsStudy Sample
codeSample name AC Type Dil.
EN ISO 7932:2005 BACARA ‐ Surface spreading BACARA ‐ Pour plate
Second ren
ewal study
B326Organic infant formula with
probioticsYes c 10 <10
90000
B353Infant food supplement semolina‐
vegetablesa 1100
90
Yes 1300
<10
Microsept Summary report - v0 BACARA
45/70
December 2018

R1 R2 R1 R2 R1 R2
CFU Conf. CFU Conf. Result Result CFU Conf. CFU Conf. Result Result CFU Conf. CFU Conf. Result Result
‐2 99 100% 116 100% 116 100% 99 100% 92 100% 103 100%
‐3 11 100% 14 100% 12 100% 12 100% 9 100% 11 100%
‐2 55 100% 63 100% 57 100% 46 100% 62 100% 64 100%
‐3 5 100% 6 100% 10 100% 6 100% 7 100% 5 100%
‐1 3 100% 12 100% 1 100% 4 100% 2 100% 2 100%
‐2 1 100% 1 100% 1 100% 0 / 0 / 0 /
‐1 11 100% 13 100% 24 100% 5 100% 24 100% 11 100%
‐2 4 100% 2 100% 2 100% 1 100% 2 100% 1 100%
‐1 7 100% 8 100% 3 100% 4 100% 1 100% 2 100%
‐2 1 100% 2 100% 0 / 0 / 1 100% 0 /
‐1 0 / 0 / 0 / 0 / 0 / 0 /
‐2 0 / 0 / 0 / 0 / 0 / 0 /
‐1 3 100% 6 100% 4 100% 6 100% 10 100% 13 100%
‐2 1 100% 1 100% 1 100% 1 100% 1 100% 2 100%
‐1 26 100% 25 100% 33 100% 42 100% 26 100% 25 100%
‐2 4 100% 2 100% 3 100% 5 100% 2 100% 5 100%
‐1 1 100% 13 100% 2 100% 18 100% 13 100% 15 100%
‐2 0 / 1 100% 1 100% 1 100% 2 100% 3 100%
‐1 18 100% 15 100% 87 100% 21 100% 11 100% 9 100%
‐2 0 / 1 100% 4 100% 1 100% 1 100% 2 100%
‐1 9 100% 11 100% 22 100% 14 100% 19 100% 16 100%
‐2 5 100% 1 100% 1 100% 2 100% 2 100% 5 100%
‐1 82 100% 66 100% 73 100%
‐2 4 100% 4 100% 11 100%
‐1 8 100% 9 100% 6 100%
‐2 0 / 0 / 0 /
‐1 63 100% 78 100% 82 100%
‐2 10 100% 9 100% 8 100%
‐2 104 100% >150 / >150 /
‐3 17 100% 25 100% 24 100%
‐4 0 / 1 100% 2 100%
‐1 14 100% 12 100% 21 100%
‐2 1 100% 1 100% 1 100%
‐1 0 / 0 / 0 /
‐2 0 / 0 / 0 /
‐2 67 100% 75 100% 98 100%
‐3 4 100% 1 100% 15 100%
‐2 59 100% 46 100% 53 100%
‐3 6 100% 3 100% 6 100%
‐2 77 100% 61 100% 66 100%
‐3 9 100% 9 100% 9 100%
‐2 35 100% 45 100% 39 100%
‐3 1 100% 3 100% 4 100%
B350 Pasta & kibbles dog food No a <10 <10 <10
B351 Broken rice for pets Yes a 6500 6900 10000
Dehydrated complementary food
for catB348 Yes a 11000 24000 24000
B336 Puffed rice for animals Yes a 660 790 820
B308 Pasta dog food No a 80 90 60
B307 Cattle feed No c 780 640 760
B349Dehydrated complementary food
for dogYes a 140 120 200
BACARA ‐ Pour plate
R1 R2
6300 6300
9200 10000
EN ISO 7932:2005 BACARA ‐ Surface spreading
Dil.
5500 6300 6100 4700
10000 12000 12000 10000
Study Sample
codeSample name AC Type
H2 Seed mixture Yes
R1 R1 R2R2
L2 Turkey feed
K1 Cattle feed
K2 Rabbit feed
K3 Horse feed
J1 Laying hen feed
J2 Chicken feed
J3
<10
30 120 10 40
140 140 240 50
No
Yes
Yes
b
b
b
c
c
b
c
b
b
c
Yes
No
No
No
No
No
L1 Pullet feed
L3 Horse feed
Dairy cow feed
140 160
110 90
190 190
<10 <10
100 140
250 270
20 20
240 110
10 20
Yes
Yes
Yes
B361 Calf & kig goats feed c 5900 4500 5400
B362 Rabbit feed b 7800 6400 6800
B363 Rabbit feed b 3300 4400 3900
Second ren
ewal study
Relative trueness study ‐ FeedInitial validation study
G9 Bone meal Yes c
90 110 210 150
10 20130 170
160 150 830 200
30 60 40 60
270 250 330 430
70 80 30 40
<10 <10 <10
Microsept Summary report - v0 BACARA
46/70
December 2018

Appendix E
Relative trueness study – Statistical calculations
Microsept Summary report - v0 BACARA
47/70
December 2018

Category TypeSample
code
Reference
method
Alternative
methodMean Difference
H8 3.91 3.72 3.82 ‐0.19
H9 4.08 4.11 4.10 0.03
H10 3.87 3.83 3.85 ‐0.04
I4 2.81 2.88 2.84 0.06
B304 2.88 2.96 2.92 0.08
G1 4.04 4.08 4.06 0.04
I1 2.67 2.54 2.61 ‐0.13
I2 2.41 2.36 2.39 ‐0.05
I3 2.86 2.71 2.78 ‐0.15
B303 1.60 2.08 1.84 0.48
G2 4.04 4.11 4.08 0.07
G10 4.00 3.99 4.00 ‐0.01
B322 2.11 2.04 2.08 ‐0.07
B323 2.68 2.69 2.69 0.01
B324 2.86 2.82 2.84 ‐0.04
B325 3.20 3.20 3.20 0.00
0.01
0.15
I9 3.95 3.98 3.97 0.02
M1 2.78 2.85 2.81 0.07
M3 2.78 2.70 2.74 ‐0.08
M4 3.15 3.36 3.25 0.22
M5 3.18 3.23 3.20 0.05
M6 3.20 3.04 3.12 ‐0.16
G4 3.90 3.83 3.86 ‐0.08
I8 3.41 3.28 3.35 ‐0.14
B306 2.71 2.65 2.68 ‐0.05
B309 3.40 3.15 3.27 ‐0.25
B319 2.00 1.90 1.95 ‐0.10
G3 3.94 3.91 3.93 ‐0.03
I10 3.98 4.04 4.01 0.06
B330 3.30 3.11 3.21 ‐0.19
B335 3.83 3.81 3.82 ‐0.01
B360 1.60 2.04 1.82 0.44
‐0.01
0.17
Meat
products,
fish
products,
seafood
(MP)
a
b
c
Average difference of the category
Standard deviation of differences
Average difference
Standard deviation of differences
Dairy
products
(DP)
a
b
c
Results summary and statistical calculationsSurface spreading for BACARA
Microsept Summary report - v0 BACARA
48/70
December 2018

Category TypeSample
code
Reference
method
Alternative
methodMean Difference
Results summary and statistical calculationsSurface spreading for BACARA
D1 1.70 1.70 1.70 0.00
G5 4.30 4.26 4.28 ‐0.05
G6 4.04 4.04 4.04 0.00
B310 1.78 1.70 1.74 ‐0.08
B314 1.95 1.78 1.87 ‐0.18
E2 2.90 2.08 2.49 ‐0.82
B311 2.20 2.20 2.20 0.00
B312 2.18 1.78 1.98 ‐0.40
B318 3.59 3.68 3.64 0.09
B337 2.81 2.93 2.87 0.12
B338 3.88 3.84 3.86 ‐0.04
A2 2.53 2.51 2.52 ‐0.03
A3 2.04 2.04 2.04 0.00
D5 3.23 3.23 3.23 0.00
F1 2.15 1.78 1.96 ‐0.37
F2 1.85 1.60 1.72 ‐0.24
F3 3.08 3.11 3.10 0.03
B317 3.71 3.75 3.73 0.04
‐0.11
0.23
B341 1.78 1.90 1.84 0.12
B342 2.34 2.56 2.45 0.21
B343 3.94 3.95 3.95 0.01
B344 4.77 4.78 4.77 0.01
B345 4.41 4.41 4.41 0.00
G8 4.00 4.04 4.02 0.04
B339 1.95 1.60 1.78 ‐0.35
B340 2.60 2.40 2.50 ‐0.20
B346 3.20 3.32 3.26 0.12
B347 2.53 2.41 2.47 ‐0.12
C1 2.38 2.41 2.40 0.03
G7 3.99 3.99 3.99 0.00
H4 4.04 3.76 3.90 ‐0.28
H6 3.81 3.65 3.73 ‐0.15
H7 2.85 2.95 2.90 0.11
I5 3.92 3.92 3.92 0.00
I6 3.46 3.36 3.41 ‐0.10
I7 3.48 3.30 3.39 ‐0.18
‐0.04
0.15
Standard deviation of differences
Vegetables
(V)
a
b
c
Average difference
Eggs and
pastries
(E&P)
a
b
c
Average difference
Standard deviation of differences
Microsept Summary report - v0 BACARA
49/70
December 2018

Category TypeSample
code
Reference
method
Alternative
methodMean Difference
Results summary and statistical calculationsSurface spreading for BACARA
B327 1.95 1.95 1.95 0.00
B352 4.45 4.61 4.53 0.17
B353 3.04 3.11 3.08 0.07
B356 1.78 1.90 1.84 0.12
B357 2.30 2.26 2.28 ‐0.05
B331 2.88 2.65 2.76 ‐0.22
B332 3.11 3.11 3.11 0.00
B333 4.49 4.53 4.51 0.04
B354 2.74 2.76 2.75 0.02
B355 3.54 3.74 3.64 0.20
B328 4.88 4.95 4.91 0.08
B329 3.59 3.83 3.71 0.24
B334 3.38 3.49 3.44 0.11
B358 2.79 2.74 2.76 ‐0.04
B359 1.85 1.95 1.90 0.11
0.06
0.11
B308 1.90 1.95 1.93 0.05
B336 2.82 2.90 2.86 0.08
B348 4.04 4.38 4.21 0.34
B349 2.15 2.08 2.11 ‐0.07
B351 3.81 3.84 3.83 0.03
H2 3.74 3.79 3.76 0.04
J2 2.15 2.38 2.26 0.23
L2 2.20 2.92 2.56 0.71
B362 3.89 3.81 3.85 ‐0.09
B363 3.52 3.64 3.58 0.12
G9 4.00 4.08 4.04 0.08
K3 2.43 2.52 2.47 0.09
L3 1.95 2.32 2.14 0.37
B307 2.89 2.81 2.85 ‐0.09
B361 3.77 3.65 3.71 ‐0.12
0.12
0.22
Average difference
Feed (F)
a
b
c
Average difference
Standard deviation of differences
Standard deviation of differences
Baby foods
(BF)
a
b
c
Microsept Summary report - v0 BACARA
50/70
December 2018

Category TypeSample
code
Reference
method
Alternative
methodMean Difference
Results summary and statistical calculationsSurface spreading for BACARA
0.00
0.19
n = 98
β = 95%
T (0.025;97)= 1.98
Data not used for the calculations
Category TypeSample
code
Reference
method
Alternative
methodMean Difference
a E1 0.00 0.00 0.00 0.00
b E3 nc 1.00 / /
a B305 0.00 0.00 0.00 0.00
a M2 3.48 4.00 3.74 0.52
a J4 0.00 0.00 0.00 0.00
a J5 0.00 0.00 0.00 0.00
a J6 0.00 0.00 0.00 0.00
c A1 1.00 1.90 1.45 0.90
c B1 0.00 1.30 0.65 1.30
a D2 1.48 1.00 1.24 ‐0.48
c D3 0.00 0.00 0.00 0.00
c D4 nc 1.60 / /
c E4 nc 0.00 / /
c E5 1.48 1.48 1.48 0.00
a H3 nc 2.48 / /
b B313 0.00 0.00 0.00 0.00
a B316 nc nc / /
c H1 3.11 2.30 2.71 ‐0.81
c H5 nc 2.78 / /
a B320 0.00 0.00 0.00 0.00
a B321 0.00 0.00 0.00 0.00
c B326 1.00 0.00 0.50 ‐1.00
b J1 1.48 1.00 1.24 ‐0.48
c K1 0.00 0.00 0.00 0.00
b K2 1.48 1.60 1.54 0.12
b L1 1.00 1.30 1.15 0.30
c J3 1.85 1.48 1.66 ‐0.37
a B350 0.00 0.00 0.00 0.00
‐0.37 0.37
Upper confidence limit
Average difference all categories
Standard deviation of differences
Lower confidence limit
F
MP
DP
V
E&P
BF
Microsept Summary report - v0 BACARA
51/70
December 2018

Category Type Sample codeReference
method
Alternative
methodMean Difference
H8 3.91 3.89 3.90 ‐0.02
H9 4.08 4.08 4.08 0.00
H10 3.87 3.89 3.88 0.02
I4 2.81 3.11 2.96 0.30
B304 2.88 2.79 2.83 ‐0.10
G1 4.04 4.00 4.02 ‐0.04
I1 2.67 2.76 2.72 0.09
I2 2.41 2.28 2.35 ‐0.14
I3 2.86 2.88 2.87 0.02
B303 1.60 1.85 1.72 0.24
G2 4.04 3.99 4.02 ‐0.05
G10 4.00 4.08 4.04 0.08
B322 2.11 2.23 2.17 0.12
B323 2.68 2.65 2.67 ‐0.03
B324 2.86 2.68 2.77 ‐0.18
B325 3.20 3.20 3.20 0.00
0.02
0.12
I9 3.95 4.04 4.00 0.09
M1 2.78 3.04 2.91 0.26
M3 2.78 3.11 2.95 0.34
M4 3.15 3.28 3.21 0.13
M5 3.18 3.34 3.26 0.17
M6 3.20 2.90 3.05 ‐0.30
G4 3.90 3.85 3.87 ‐0.06
I8 3.41 3.15 3.28 ‐0.27
B306 2.71 2.49 2.60 ‐0.22
B309 3.40 3.38 3.39 ‐0.02
B319 2.00 2.00 2.00 0.00
G3 3.94 4.08 4.01 0.13
I10 3.98 4.00 3.99 0.02
B330 3.30 3.46 3.38 0.16
B335 3.83 3.89 3.86 0.07
B360 1.60 1.85 1.72 0.24
0.05
0.19
Average difference of the category
Standard deviation of differences
Meat
products,
fish
products,
seafood
(MP)
Dairy
products
(DP)
a
b
c
a
b
Average difference of the category
Standard deviation of differences
c
Results summary and statistical calculationsPour plates for BACARA
Microsept Summary report - v0 BACARA
52/70
December 2018

Category Type Sample codeReference
method
Alternative
methodMean Difference
Results summary and statistical calculationsPour plates for BACARA
D1 1.70 1.78 1.74 0.08
G5 4.30 4.23 4.27 ‐0.07
G6 4.04 4.04 4.04 0.00
B310 1.78 1.78 1.78 0.00
B314 1.95 1.60 1.78 ‐0.35
E2 2.90 2.11 2.51 ‐0.79
B311 2.20 2.30 2.25 0.10
B312 2.18 2.15 2.16 ‐0.03
B318 3.59 3.68 3.64 0.09
B337 2.81 2.81 2.81 0.00
B338 3.88 3.89 3.88 0.01
A2 2.53 2.52 2.52 ‐0.01
A3 2.04 1.95 2.00 ‐0.09
D5 3.23 2.85 3.04 ‐0.38
F1 2.15 1.78 1.96 ‐0.37
F2 1.85 1.60 1.72 ‐0.24
F3 3.08 3.15 3.11 0.07
B317 3.71 3.74 3.72 0.03
‐0.11
0.23
B341 1.78 1.70 1.74 ‐0.08
B342 2.34 2.40 2.37 0.06
B343 3.94 4.00 3.97 0.06
B344 4.77 4.54 4.66 ‐0.23
B345 4.41 4.18 4.30 ‐0.24
G8 4.00 3.97 3.98 ‐0.03
B339 1.95 1.78 1.87 ‐0.18
B340 2.60 2.58 2.59 ‐0.02
B346 3.20 3.26 3.23 0.05
B347 2.53 2.40 2.46 ‐0.13
C1 2.38 2.30 2.34 ‐0.08
G7 3.99 4.08 4.03 0.09
H1 3.11 2.70 2.91 ‐0.41
H4 4.04 3.71 3.87 ‐0.33
H6 3.81 3.96 3.88 0.16
H7 2.85 2.95 2.90 0.11
I5 3.92 4.11 4.02 0.19
I6 3.46 3.32 3.39 ‐0.14
I7 3.48 3.32 3.40 ‐0.15
‐0.07
0.17
Average difference of the category
Standard deviation of differences
a
b
c
a
b
c
Average difference of the category
Standard deviation of differences
Vegetables
(V)
Eggs and
pastries
(E&P)
Microsept Summary report - v0 BACARA
53/70
December 2018

Category Type Sample codeReference
method
Alternative
methodMean Difference
Results summary and statistical calculationsPour plates for BACARA
B327 1.95 1.85 1.90 ‐0.11
B352 4.45 4.41 4.43 ‐0.03
B353 3.04 2.93 2.99 ‐0.11
B356 1.78 1.95 1.87 0.18
B357 2.30 2.34 2.32 0.04
B331 2.88 2.95 2.91 0.07
B332 3.11 2.95 3.03 ‐0.16
B333 4.49 4.49 4.49 0.00
B354 2.74 2.68 2.71 ‐0.06
B355 3.54 3.67 3.61 0.13
B328 4.88 4.77 4.82 ‐0.10
B329 3.59 3.76 3.67 0.16
B334 3.38 3.43 3.41 0.05
B358 2.79 2.61 2.70 ‐0.17
B359 1.85 1.78 1.81 ‐0.07
‐0.01
0.11
B308 1.90 1.78 1.84 ‐0.12
B336 2.82 2.91 2.87 0.09
B348 4.04 4.38 4.21 0.34
B349 2.15 2.30 2.22 0.15
B351 3.81 4.00 3.91 0.19
H2 3.74 3.80 3.77 0.06
J2 2.15 2.38 2.26 0.23
L2 2.20 2.04 2.12 ‐0.16
B362 3.89 3.83 3.86 ‐0.06
B363 3.52 3.59 3.55 0.07
G9 4.00 3.96 3.98 ‐0.04
K3 2.43 2.40 2.41 ‐0.03
L3 1.95 2.28 2.12 0.32
B307 2.89 2.88 2.89 ‐0.01
B361 3.77 3.73 3.75 ‐0.04
0.07
0.15
Feed (F)
Average difference of the category
Standard deviation of differences
Baby foods
(BF)
Average difference of the category
Standard deviation of differences
a
b
c
a
b
c
Microsept Summary report - v0 BACARA
54/70
December 2018

Category Type Sample codeReference
method
Alternative
methodMean Difference
Results summary and statistical calculationsPour plates for BACARA
‐0.01
0.18
n = 99
β = 95%
T (0.025;97)= 1.98
Data not used for the calculations
Category Type Sample codeReference
method
Alternative
methodMean Difference
a E1 0.00 0.00 0.00 0.00
b E3 nc nc / /
a B305 0.00 0.00 0.00 0.00
a M2 3.48 nc / /
a J4 0.00 0.00 0.00 0.00
a J5 0.00 0.00 0.00 0.00
a J6 0.00 0.00 0.00 0.00
c A1 1.00 1.95 1.48 0.95
c B1 0.00 0.00 0.00 0.00
a D2 1.48 1.48 1.48 0.00
c D3 0.00 1.00 0.50 1.00
c D4 nc 0.00 / /
c E4 nc 0.00 / /
c E5 1.48 1.48 1.48 0.00
a H3 nc 2.30 / /
b B313 0.00 0.00 0.00 0.00
a B316 nc nc / /
E&P c H5 nc 3.18 / /
a B320 0.00 0.00 0.00 0.00
a B321 0.00 0.00 0.00 0.00
c B326 1.00 1.30 1.15 0.30
b J1 1.48 1.30 1.39 ‐0.18
c K1 0.00 0.00 0.00 0.00
b K2 1.48 2.00 1.74 0.52
b L1 1.00 2.15 1.58 1.15
c J3 1.85 1.00 1.42 ‐0.85
a B350 0.00 0.00 0.00 0.00
‐0.37 0.34
Average difference all categories
Standard deviation of differences
Lower confidence limit Upper confidence limit
MP
DP
V
BF
F
Microsept Summary report - v0 BACARA
55/70
December 2018

Appendix F
Accuracy profile study – Raw results
Microsept Summary report - v0 BACARA
56/70
December 2018

Matrix: pâté de campagne Strain: Bacillus cereus group II, EAA229
DilutionNumber
of CFU
Result
(CFU/g)Dilution
Number
of CFU
Result
(CFU/g)Dilution
Number
of CFU
Result
(CFU/g)Dilution
Number
of CFU
Result
(CFU/g)Dilution
Number
of CFU
Result
(CFU/g)Dilution
Number
of CFU
Result
(CFU/g)
‐1 6 ‐1 4 ‐1 4 ‐1 9 ‐1 4 ‐1 6
‐2 0 ‐2 0 ‐2 0 ‐2 0 ‐2 0 ‐2 0
‐1 5 ‐1 5 ‐1 7 ‐1 6 ‐1 5 ‐1 8
‐2 0 ‐2 0 ‐2 0 ‐2 0 ‐2 0 ‐2 0
‐1 5 ‐1 4 ‐1 5 ‐1 8 ‐1 6 ‐1 9
‐2 0 ‐2 0 ‐2 0 ‐2 0 ‐2 0 ‐2 0
‐1 5 ‐1 8 ‐1 7 ‐1 13 ‐1 9 ‐1 8
‐2 0 ‐2 0 ‐2 0 ‐2 1 ‐2 0 ‐2 0
‐1 7 ‐1 4 ‐1 4 ‐1 7 ‐1 4 ‐1 6
‐2 0 ‐2 0 ‐2 0 ‐2 0 ‐2 0 ‐2 0
‐2 36 ‐2 18 ‐2 31 ‐2 30 ‐2 43 ‐2 31
‐3 1 ‐3 2 ‐3 3 ‐3 1 ‐3 8 ‐3 4
‐2 37 ‐2 17 ‐2 22 ‐2 41 ‐2 21 ‐2 15
‐3 3 ‐3 1 ‐3 2 ‐3 2 ‐3 2 ‐3 2
‐2 36 ‐2 33 ‐2 30 ‐2 33 ‐2 35 ‐2 58
‐3 1 ‐3 5 ‐3 2 ‐3 5 ‐3 6 ‐3 4
‐2 50 ‐2 42 ‐2 45 ‐2 22 ‐2 27 ‐2 32
‐3 6 ‐3 6 ‐3 4 ‐3 8 ‐3 1 ‐3 1
‐2 33 ‐2 15 ‐2 33 ‐2 63 ‐2 20 ‐2 34
‐3 3 ‐3 2 ‐3 1 ‐3 0 ‐3 1 ‐3 0
‐4 55 ‐4 24 ‐4 24 ‐4 22 ‐4 16 ‐4 24
‐5 7 ‐5 3 ‐5 6 ‐5 3 ‐5 2 ‐5 7
‐4 17 ‐4 14 ‐4 26 ‐4 16 ‐4 17 ‐4 27
‐5 3 ‐5 5 ‐5 2 ‐5 3 ‐5 1 ‐5 7
‐4 23 ‐4 17 ‐4 21 ‐4 34 ‐4 24 ‐4 22
‐5 1 ‐5 4 ‐5 5 ‐5 2 ‐5 6 ‐5 6
‐4 23 ‐4 19 ‐4 30 ‐4 24 ‐4 20 ‐4 22
‐5 2 ‐5 2 ‐5 4 ‐5 1 ‐5 3 ‐5 4
‐4 29 ‐4 30 ‐4 39 ‐4 29 ‐4 31 ‐4 31
‐5 7 ‐5 2 ‐5 6 ‐5 5 ‐5 3 ‐5 5
EN ISO 7932:2005() BACARA pour plate BACARA spreading EN ISO 7932:2005() BACARA pour plate BACARA spreading
330000
Level 1
Level 2
Level 3
Batch 1 Batch 2
Enumeration of the microorganisms at 30°C: 1800000 CFU/g Enumeration of the microorganisms at 30°C: 810000 CFU/g
210000 240000
70 (NE) 40 (NE) 60 (NE)
5700 1900 3100
310000
90 (NE)
3500 3700 5600
330000 270000 250000
160000 280000
410000
230000
310000
130 90 (NE) 80 (NE)
2700 2500 3000
310000
190000 310000
70 (NE) 40 (NE) 40 (NE)
3300 1500 3100
50 (NE) 40 (NE) 50 (NE)
3100
560000
230000
180000 170000
3400 1800
90 (NE) 40 (NE) 60 (NE)
2800 4600 3200
50 (NE) 50 (NE) 70 (NE)
230000
60 (NE) 50 (NE) 80 (NE)
3900 2100 1500
170000 160000
80 (NE) 60 (NE)
60 (NE) 40 (NE) 40 (NE)
Accuracy profile ‐ Meat products, fish products, seafood
330000 290000
50 (NE) 80 (NE) 70 (NE)
5100 4400 4500
250000
3400 3500 2900
220000 190000 240000
250000 270000
3600 1600 2200
Microsept Summary report - v0 BACARA
57/70
December 2018

Matrix: raw milk Strain: Bacillus cereus group III, CND844
DilutionNumber
of CFU
Result
(CFU/g)Dilution
Number
of CFU
Result
(CFU/g)Dilution
Number
of CFU
Result
(CFU/g)Dilution
Number
of CFU
Result
(CFU/g)Dilution
Number
of CFU
Result
(CFU/g)Dilution
Number
of CFU
Result
(CFU/g)
‐1 6 ‐1 7 ‐1 6 ‐1 8 ‐1 4 ‐1 6
‐2 0 ‐2 0 ‐2 0 ‐2 0 ‐2 0 ‐2 0
‐1 8 ‐1 7 ‐1 8 ‐1 12 ‐1 5 ‐1 8
‐2 0 ‐2 0 ‐2 0 ‐2 1 ‐2 0 ‐2 0
‐1 6 ‐1 7 ‐1 6 ‐1 6 ‐1 6 ‐1 9
‐2 0 ‐2 0 ‐2 0 ‐2 0 ‐2 0 ‐2 0
‐1 7 ‐1 6 ‐1 11 ‐1 10 ‐1 9 ‐1 8
‐2 0 ‐2 0 ‐2 1 ‐2 1 ‐2 0 ‐2 0
‐1 4 ‐1 7 ‐1 11 ‐1 7 ‐1 4 ‐1 6
‐2 0 ‐2 0 ‐2 1 ‐2 0 ‐2 0 ‐2 0
‐2 56 ‐2 56 ‐2 57 ‐2 54 ‐2 41 ‐2 57
‐3 2 ‐3 5 ‐3 5 ‐3 11 ‐3 4 ‐3 4
‐2 55 ‐2 54 ‐2 50 ‐2 45 ‐2 36 ‐2 46
‐3 6 ‐3 7 ‐3 7 ‐3 5 ‐3 7 ‐3 3
‐2 61 ‐2 61 ‐2 62 ‐2 45 ‐2 54 ‐2 63
‐3 8 ‐3 6 ‐3 4 ‐3 5 ‐3 10 ‐3 11
‐2 56 ‐2 56 ‐2 54 ‐2 52 ‐2 51 ‐2 40
‐3 11 ‐3 5 ‐3 8 ‐3 8 ‐3 3 ‐3 2
‐2 49 ‐2 59 ‐2 45 ‐2 51 ‐2 41 ‐2 38
‐3 10 ‐3 11 ‐3 6 ‐3 6 ‐3 8 ‐3 2
‐4 14 ‐4 12 ‐4 22 ‐4 27 ‐4 13 ‐4 18
‐5 1 ‐5 1 ‐5 1 ‐5 1 ‐5 2 ‐5 1
‐4 15 ‐4 18 ‐4 19 ‐4 16 ‐4 15 ‐4 14
‐5 2 ‐5 2 ‐5 2 ‐5 3 ‐5 3 ‐5 2
‐4 23 ‐4 18 ‐4 15 ‐4 27 ‐4 21 ‐4 25
‐5 1 ‐5 2 ‐5 3 ‐5 2 ‐5 1 ‐5 3
‐4 28 ‐4 19 ‐4 28 ‐4 15 ‐4 17 ‐4 16
‐5 2 ‐5 1 ‐5 3 ‐5 3 ‐5 1 ‐5 1
‐4 12 ‐4 23 ‐4 20 ‐4 17 ‐4 20 ‐4 22
‐5 1 ‐5 1 ‐5 1 ‐5 3 ‐5 4 ‐5 3
250000
270000 180000 280000 160000 160000 150000
170000
150000 180000 190000 170000 160000 150000
Level 3
140000 120000 210000 250000 140000
220000 180000 160000 260000
120000 220000 190000 180000 220000 230000
200000
3600
5800 6700
6100 5500 5600 5500 4900 3800
Level 2
5300 5500 5600 5900 4100
6300 6100 6000 4500
5400 6400 4600 5200 4500
90 (NE)
70 (NE) 60 (NE) 110 100 90 (NE) 80 (NE)
5500
5500 5500 5200 4500 3900 4500
Level 1
60 (NE) 70 (NE) 60 (NE) 80 (NE) 40 (NE) 60 (NE)
80 (NE) 70 (NE) 80 (NE) 120 50 (NE) 80 (NE)
60 (NE) 70 (NE) 60 (NE) 60 (NE) 60 (NE)
40 (NE) 70 (NE) 110 70 (NE) 40 (NE) 60 (NE)
Accuracy profile ‐ Dairy products
Batch 1 Batch 2
Enumeration of the microorganisms at 30°C: 1800000 CFU/g Enumeration of the microorganisms at 30°C: 810000 CFU/g
EN ISO 7932:2005() BACARA pour plate BACARA spreading EN ISO 7932:2005() BACARA pour plate BACARA spreading
Microsept Summary report - v0 BACARA
58/70
December 2018

Matrix: broccoli puree Strain: Bacillus pseudomycoides group I, FFT320
DilutionNumber
of CFU
Result
(CFU/g)Dilution
Number
of CFU
Result
(CFU/g)Dilution
Number
of CFU
Result
(CFU/g)Dilution
Number
of CFU
Result
(CFU/g)Dilution
Number
of CFU
Result
(CFU/g)Dilution
Number
of CFU
Result
(CFU/g)
‐1 23 ‐1 14 ‐1 10 ‐1 23 ‐1 15 ‐1 14
‐2 4 ‐2 3 ‐2 2 ‐1 4 ‐2 1 ‐2 0
‐1 22 ‐1 13 ‐1 15 ‐1 28 ‐1 16 ‐1 15
‐2 3 ‐2 1 ‐2 1 ‐2 5 ‐2 1 ‐2 2
‐1 17 ‐1 17 ‐1 13 ‐1 16 ‐1 13 ‐1 9
‐2 2 ‐2 2 ‐2 3 ‐2 2 ‐2 1 ‐2 0
‐1 15 ‐1 10 ‐1 10 ‐1 20 ‐1 15 ‐1 20
‐2 1 ‐2 0 ‐2 1 ‐2 1 ‐2 2 ‐2 4
‐1 14 ‐1 14 ‐1 14 ‐1 22 ‐1 17 ‐1 20
‐2 1 ‐2 3 ‐2 3 ‐2 1 ‐2 3 ‐2 4
‐1 123 ‐1 82 ‐1 61 ‐1 99 ‐1 57 ‐1 60
‐2 21 ‐2 12 ‐2 6 ‐2 19 ‐2 9 ‐2 9
‐1 82 ‐1 69 ‐1 82 ‐1 99 ‐1 76 ‐1 76
‐2 10 ‐2 9 ‐2 6 ‐2 13 ‐2 15 ‐2 7
‐1 95 ‐1 62 ‐1 78 ‐1 95 ‐1 82 ‐1 69
‐2 18 ‐2 6 ‐2 8 ‐2 11 ‐2 12 ‐2 6
‐1 103 ‐1 76 ‐1 81 ‐1 113 ‐1 76 ‐1 89
‐2 21 ‐2 5 ‐2 12 ‐2 16 ‐2 7 ‐2 14
‐1 94 ‐1 59 ‐1 70 ‐1 104 ‐1 70 ‐1 86
‐2 12 ‐2 11 ‐2 11 ‐2 10 ‐2 6 ‐2 11
‐4 42 ‐4 26 ‐4 24 ‐4 51 ‐4 23 ‐4 31
‐5 7 ‐5 3 ‐5 1 ‐5 4 ‐5 2 ‐5 6
‐4 41 ‐4 31 ‐4 18 ‐4 43 ‐4 18 ‐4 25
‐5 4 ‐5 5 ‐5 3 ‐5 3 ‐5 2 ‐5 1
‐4 53 ‐4 32 ‐4 24 ‐4 53 ‐4 25 ‐4 19
‐5 4 ‐5 3 ‐5 4 ‐5 7 ‐5 2 ‐5 1
‐4 36 ‐4 21 ‐4 18 ‐4 50 ‐4 26 ‐4 21
‐5 4 ‐5 1 ‐5 3 ‐5 3 ‐5 1 ‐5 3
‐4 38 ‐4 31 ‐4 29 ‐4 34 ‐4 24 ‐4 19
‐5 5 ‐5 2 ‐5 6 ‐5 6 ‐5 5 ‐5 4
BACARA spreading EN ISO 7932:2005() BACARA pour plate BACARA spreading
Accuracy profile ‐ Vegetables
210000
Level 1
Level 2
Level 3
Batch 1 Batch 2
Enumeration of the microorganisms at 30°C: 9400 CFU/g Enumeration of the microorganisms at 30°C: 6800 CFU/g
EN ISO 7932:2005() BACARA pour plate
250000 220000
210 180 220
1000 690 880
320000
480000
160 130 90 (NE)
960 850 680
550000 250000 180000
230000 340000
360000 260000
190 150 220
1200 750 940
240000
200000 190000
140 150 150
960 640 740
170 170 150
610
450000
360000
330000
1300 850
250 150 130
1100 600 630
230 130 150
500000
300 150 150
1000 830 750
420000 180000
250 150 110
390000 300000
150 90 100
1100 740 850
190000
1000 620 780
520000 320000 250000
260000 230000
840 710 800
410000
Microsept Summary report - v0 BACARA
59/70
December 2018

Matrix: custard Strain: Bacillus cereus group IV, ANJ157
DilutionNumber
of CFU
Result
(CFU/g)Dilution
Number
of CFU
Result
(CFU/g)Dilution
Number
of CFU
Result
(CFU/g)Dilution
Number
of CFU
Result
(CFU/g)Dilution
Number
of CFU
Result
(CFU/g)Dilution
Number
of CFU
Result
(CFU/g)
‐1 16 ‐1 11 ‐1 8 ‐1 14 ‐1 10 ‐1 9
‐2 3 ‐2 1 ‐2 0 ‐2 1 ‐2 0 ‐2 0
‐1 5 ‐1 11 ‐1 9 ‐1 10 ‐1 13 ‐1 8
‐2 1 ‐2 2 ‐2 0 ‐2 2 ‐2 1 ‐2 1
‐1 8 ‐1 11 ‐1 10 ‐1 8 ‐1 12 ‐1 11
‐2 0 ‐2 1 ‐2 2 ‐2 0 ‐2 2 ‐2 0
‐1 8 ‐1 10 ‐1 7 ‐1 7 ‐1 6 ‐1 10
‐2 1 ‐2 2 ‐2 1 ‐2 0 ‐2 0 ‐2 1
‐1 11 ‐1 10 ‐1 14 ‐1 11 ‐1 9 ‐1 7
‐2 1 ‐2 2 ‐2 2 ‐2 0 ‐2 2 ‐2 0
‐2 39 ‐2 50 ‐2 44 ‐2 35 ‐2 38 ‐2 40
‐3 7 ‐3 4 ‐3 4 ‐3 3 ‐3 5 ‐3 2
‐2 37 ‐2 36 ‐2 40 ‐2 45 ‐2 59 ‐2 41
‐3 6 ‐3 4 ‐3 2 ‐3 9 ‐3 6 ‐3 3
‐2 32 ‐2 31 ‐2 39 ‐2 39 ‐2 44 ‐2 41
‐3 2 ‐3 3 ‐3 5 ‐3 7 ‐3 5 ‐3 2
‐2 49 ‐2 46 ‐2 46 ‐2 40 ‐2 41 ‐2 33
‐3 4 ‐3 4 ‐3 2 ‐3 5 ‐3 5 ‐3 2
‐2 38 ‐2 29 ‐2 41 ‐2 39 ‐2 39 ‐2 51
‐3 2 ‐3 6 ‐3 8 ‐3 6 ‐3 5 ‐3 3
‐3 137 ‐3 92 ‐3 119 ‐3 132 ‐3 96 ‐3 106
‐4 19 ‐4 1 ‐4 11 ‐4 29 ‐4 9 ‐4 10
‐3 117 ‐3 88 ‐4 22 ‐3 117 ‐4 19 ‐3 118
‐4 15 ‐4 17 ‐5 4 ‐4 20 ‐5 1 ‐4 19
‐3 136 ‐4 14 ‐3 121 ‐3 104 ‐4 13 ‐3 135
‐4 16 ‐5 3 ‐4 15 ‐4 19 ‐5 4 ‐4 18
‐3 108 ‐3 124 ‐3 81 ‐3 107 ‐4 10 ‐3 110
‐4 11 ‐4 18 ‐4 12 ‐4 21 ‐5 1 ‐4 9
‐3 93 ‐3 62 ‐3 114 ‐4 17 ‐4 21 ‐3 121
‐4 10 ‐4 10 ‐4 8 ‐5 4 ‐5 4 ‐4 11
110
110
90
130
130
60 (NE)
90 (NE)
90 (NE) 110
120000
150000 140000
110000 130000 85000 120000 100000 110000
Level 3
140000 85000 120000 150000 95000
140000 150000 120000 110000
94000 65000 110000 190000 230000
3900
4800 4500 4400 4100 4200 3200
110000
120000 95000 240000 120000 180000 120000
3800
3900 3600 3800 4900 5900 4000
Level 2
4200 4900 4400 3500 3900
3100 3100 4000 4200
3600 3200 4500 4100 4000 4900
4500
80 (NE)
80 (NE) 110 80 (NE)
BACARA pour plate BACARA spreading
Level 1
170 80 (NE) 140 90 (NE)
50 (NE)
110 150 100 70 (NE)
100
80 (NE) 70 (NE) 70 (NE) 100
110
120
110
Accuracy profile ‐ Eggs and pastries
Batch 1 Batch 2
Enumeration of the microorganisms at 30°C: <10 CFU/g Enumeration of the microorganisms at 30°C: <10 CFU/g
EN ISO 7932:2005() BACARA pour plate BACARA spreading EN ISO 7932:2005()
Microsept Summary report - v0 BACARA
60/70
December 2018
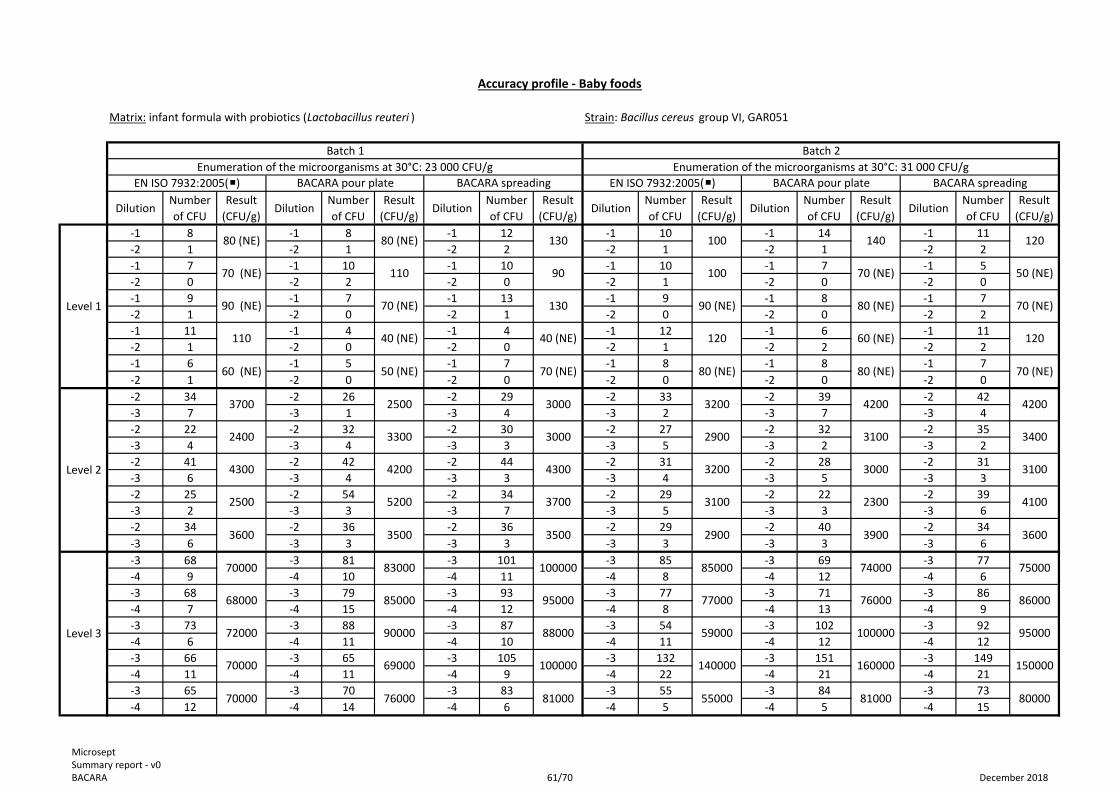
Matrix: infant formula with probiotics (Lactobacillus reuteri ) Strain: Bacillus cereus group VI, GAR051
DilutionNumber
of CFU
Result
(CFU/g)Dilution
Number
of CFU
Result
(CFU/g)Dilution
Number
of CFU
Result
(CFU/g)Dilution
Number
of CFU
Result
(CFU/g)Dilution
Number
of CFU
Result
(CFU/g)Dilution
Number
of CFU
Result
(CFU/g)
‐1 8 ‐1 8 ‐1 12 ‐1 10 ‐1 14 ‐1 11
‐2 1 ‐2 1 ‐2 2 ‐2 1 ‐2 1 ‐2 2
‐1 7 ‐1 10 ‐1 10 ‐1 10 ‐1 7 ‐1 5
‐2 0 ‐2 2 ‐2 0 ‐2 1 ‐2 0 ‐2 0
‐1 9 ‐1 7 ‐1 13 ‐1 9 ‐1 8 ‐1 7
‐2 1 ‐2 0 ‐2 1 ‐2 0 ‐2 0 ‐2 2
‐1 11 ‐1 4 ‐1 4 ‐1 12 ‐1 6 ‐1 11
‐2 1 ‐2 0 ‐2 0 ‐2 1 ‐2 2 ‐2 2
‐1 6 ‐1 5 ‐1 7 ‐1 8 ‐1 8 ‐1 7
‐2 1 ‐2 0 ‐2 0 ‐2 0 ‐2 0 ‐2 0
‐2 34 ‐2 26 ‐2 29 ‐2 33 ‐2 39 ‐2 42
‐3 7 ‐3 1 ‐3 4 ‐3 2 ‐3 7 ‐3 4
‐2 22 ‐2 32 ‐2 30 ‐2 27 ‐2 32 ‐2 35
‐3 4 ‐3 4 ‐3 3 ‐3 5 ‐3 2 ‐3 2
‐2 41 ‐2 42 ‐2 44 ‐2 31 ‐2 28 ‐2 31
‐3 6 ‐3 4 ‐3 3 ‐3 4 ‐3 5 ‐3 3
‐2 25 ‐2 54 ‐2 34 ‐2 29 ‐2 22 ‐2 39
‐3 2 ‐3 3 ‐3 7 ‐3 5 ‐3 3 ‐3 6
‐2 34 ‐2 36 ‐2 36 ‐2 29 ‐2 40 ‐2 34
‐3 6 ‐3 3 ‐3 3 ‐3 3 ‐3 3 ‐3 6
‐3 68 ‐3 81 ‐3 101 ‐3 85 ‐3 69 ‐3 77
‐4 9 ‐4 10 ‐4 11 ‐4 8 ‐4 12 ‐4 6
‐3 68 ‐3 79 ‐3 93 ‐3 77 ‐3 71 ‐3 86
‐4 7 ‐4 15 ‐4 12 ‐4 8 ‐4 13 ‐4 9
‐3 73 ‐3 88 ‐3 87 ‐3 54 ‐3 102 ‐3 92
‐4 6 ‐4 11 ‐4 10 ‐4 11 ‐4 12 ‐4 12
‐3 66 ‐3 65 ‐3 105 ‐3 132 ‐3 151 ‐3 149
‐4 11 ‐4 11 ‐4 9 ‐4 22 ‐4 21 ‐4 21
‐3 65 ‐3 70 ‐3 83 ‐3 55 ‐3 84 ‐3 73
‐4 12 ‐4 14 ‐4 6 ‐4 5 ‐4 5 ‐4 15
Batch 1 Batch 2
Accuracy profile ‐ Baby foods
Enumeration of the microorganisms at 30°C: 23 000 CFU/g Enumeration of the microorganisms at 30°C: 31 000 CFU/g
80000
EN ISO 7932:2005() BACARA pour plate BACARA spreading
Level 1
Level 2
Level 3
160000 150000
80 (NE) 80 (NE) 70 (NE)
2900 3900 3600
55000 81000
120 120
3100 2300 4100
86000
90 (NE) 80 (NE) 70 (NE)
3200 3000 3100
100 140 120
3200 4200 4200
69000 100000
85000
140000
59000 100000 95000
74000 75000
100 70 (NE) 50 (NE)
2900 3100 3400
77000 76000
60 (NE)
70000 76000
110 40 (NE) 40 (NE)
2500 5200 3700
95000
70000
81000
90 (NE) 70 (NE) 130
4300 4200 4300
72000 90000 88000
83000 100000
60 (NE) 50 (NE) 70 (NE)
3600 3500 3500
2400 3300 3000
68000 85000
3700 2500 3000
70000
80 (NE) 80 (NE) 130
EN ISO 7932:2005() BACARA pour plate BACARA spreading
70 (NE) 110 90
Microsept Summary report - v0 BACARA
61/70
December 2018

Matrix: dry pet food for dog with probiotics Strain: Bacillus cereus group V, LDG480
DilutionNumber
of CFU
Result
(CFU/g)Dilution
Number
of CFU
Result
(CFU/g)Dilution
Number
of CFU
Result
(CFU/g)Dilution
Number
of CFU
Result
(CFU/g)Dilution
Number
of CFU
Result
(CFU/g)Dilution
Number
of CFU
Result
(CFU/g)
‐1 8 ‐1 9 ‐1 7 ‐1 8 ‐1 5 ‐1 8
‐2 0 ‐2 0 ‐2 0 ‐2 1 ‐2 0 ‐2 1
‐1 8 ‐1 4 ‐1 5 ‐1 6 ‐1 4 ‐1 9
‐2 0 ‐2 0 ‐2 0 ‐2 0 ‐2 0 ‐2 0
‐1 6 ‐1 8 ‐1 9 ‐1 4 ‐1 6 ‐1 7
‐2 0 ‐2 0 ‐2 0 ‐2 0 ‐2 0 ‐2 2
‐1 9 ‐1 10 ‐1 9 ‐1 10 ‐1 9 ‐1 6
‐2 0 ‐2 1 ‐2 0 ‐2 1 ‐2 1 ‐2 1
‐1 10 ‐1 9 ‐1 8 ‐1 4 ‐1 7 ‐1 7
‐2 2 ‐2 0 ‐2 0 ‐2 0 ‐2 1 ‐2 0
‐2 49 ‐2 36 ‐2 59 ‐2 39 ‐2 36 ‐2 67
‐3 5 ‐3 3 ‐3 9 ‐3 4 ‐3 3 ‐3 6
‐2 41 ‐2 25 ‐2 56 ‐2 64 ‐2 38 ‐2 61
‐3 2 ‐3 3 ‐3 3 ‐3 10 ‐3 2 ‐3 5
‐2 42 ‐2 25 ‐2 44 ‐2 41 ‐2 35 ‐2 32
‐3 1 ‐3 5 ‐3 6 ‐3 6 ‐3 5 ‐3 2
‐2 48 ‐2 50 ‐2 58 ‐2 60 ‐2 37 ‐2 79
‐3 4 ‐3 5 ‐3 8 ‐3 6 ‐3 7 ‐3 5
‐2 37 ‐2 44 ‐2 81 ‐2 66 ‐2 36 ‐2 57
‐3 3 ‐3 6 ‐3 4 ‐3 7 ‐3 2 ‐3 7
‐4 22 ‐4 14 ‐4 18 ‐4 32 ‐4 20 ‐4 38
‐5 3 ‐5 2 ‐5 3 ‐5 2 ‐5 3 ‐5 4
‐4 16 ‐4 18 ‐4 29 ‐4 13 ‐4 19 ‐4 26
‐5 2 ‐5 3 ‐5 4 ‐5 1 ‐5 4 ‐5 2
‐4 14 ‐4 16 ‐4 34 ‐4 25 ‐4 17 ‐4 24
‐5 1 ‐5 1 ‐5 1 ‐5 1 ‐5 1 ‐5 2
‐4 23 ‐4 17 ‐4 23 ‐4 23 ‐4 14 ‐4 34
‐5 2 ‐5 1 ‐5 5 ‐5 2 ‐5 1 ‐5 3
‐4 17 ‐4 18 ‐4 25 ‐4 34 ‐4 20 ‐4 32
‐5 3 ‐5 1 ‐5 4 ‐5 2 ‐5 4 ‐5 2
Accuracy profile ‐ Feeds
Level 2
Level 3
Batch 1 Batch 2
Enumeration of the microorganisms at 30°C: 7900 CFU/g Enumeration of the microorganisms at 30°C: 3000 CFU/g
EN ISO 7932:2005() BACARA pour plate BACARA spreading
140000 340000
180000 170000 260000 330000 220000 310000
EN ISO 7932:2005() BACARA pour plate BACARA spreading
Level 1
230000
70 (NE)
4300 3600 3100
210000 380000
160000 250000 230000
40 (NE) 70 (NE) 70 (NE)
6600 3500 5800
240000 160000 240000
300000
60 (NE) 40 (NE) 90 (NE)
6700 3600 6000
130000 210000
80 (NE) 50 (NE) 80 (NE)
3900 3500 6600
310000
100 90 (NE) 60 (NE)
6000 4000 7600
250000
40 (NE) 60 (NE)
140000 150000 320000
150000 190000
110 90 (NE) 80 (NE)
3600 4500 7700
4700 5000 6000
160000 190000
4900 3500 6200
230000
60 (NE) 80 (NE) 90 (NE)
3900 2700 4500
90 (NE) 100 90 (NE)
80 (NE) 90 (NE) 70 (NE)
80 (NE) 40 (NE) 50 (NE)
3900 2500 5400
Microsept Summary report - v0 BACARA
62/70
December 2018

Appendix G
Selectivity study – Raw results
Microsept Summary report - v0 BACARA
63/70
December 2018

Result 1 Result 2 Result 1 Result 2 ColourPresence
of haloResult 1 Result 2 Colour
Presence
of haloResult 1 Result 2
1 BA1 Bacillus cereus Whole egg 89 62 76 95 red oui 149 91 red yes 150 65
2 BA10 Bacillus cereus Milk 83 112 93 176 red oui 80 172 red yes 81 158
3 BA14 Bacillus cereus Egg 10 42 36 54 red oui 102 56 red yes 43 46
4 BA15 Bacillus cereus Custard 14 10 17 30 red oui 14 10 red yes 18 25
5 BA19 Bacillus cereus Environment 20 48 68 21 red oui 17 35 red yes 40 28
6 BA21 Bacillus cereus Tabbouleh with poultry 16 21 21 31 red yes 23 21 red yes 25 30
7 BA34 Bacillus cereus / 18 18 19 23 red yes 23 17 red yes 13 12
8 BA41 Bacillus cereus Celery 28 28 33 30 red yes 32 27 red yes 28 23
9 BA45 Bacillus cereus Lamb's lettuce 42 27 38 41 red yes 17 20 red yes 46 31
10 BA50 Bacillus cereus Milk 19 14 27 13 red yes 8 4 red yes 14 9
11 BA35 Bacillus cereus Milk powder 30 32 38 27 red yes 24 35 red yes 28 18
12 BA44 Bacillus cereus ATCC 11778 16 16 21 29 red yes 23 27 red yes 14 10
13 BA36 Bacillus cereus ATCC 10876 16 11 19 19 red yes 16 25 red yes 13 14
14 BA33 Bacillus cereus ATCC 7004 17 4 20 16 red yes 11 13 red yes 10 8
15 BA61 Bacillus cereus CIP 5832 98 102 80 108 red yes (faint) 90 91 red yes (faint) 71 69
16 BA64 Bacillus cereus Medical collection 17 13 25 29 red yes 25 20 red yes 13 12
17 BA24 Bacillus mycoïdes Ground of potato workshop 7 17 45 34 red yes 8 33 red yes 5 17
18 BA30 Bacillus mycoïdes LMG 9680 55 70 44 66 red yes 53 57 red yes 98 79
19 BA39 Bacillus mycoïdes LMG12256 27 21 36 33 red yes 16 31 red yes 33 20
20 BA65 Bacillus mycoïdes cereus Dairy product 76 92 80 65 red yes 84 90 red yes 80 120
21 BA49 Bacillus pseudomycoïdes LMG 18993 8 6 16 13 red yes 12 4 red yes 7 14
22 BA40 Bacillus pseudomycoïdes Collection 22 10 26 22 red yes 19 16 red yes 21 14
23 BA38 Bacillus thuringiensis ATCC 10792 45 47 55 45 red yes 31 50 red yes 42 48
24 BA46 Bacillus thuringiensis LMG 12265 29 24 33 29 red yes 25 19 red yes 35 20
25 BA48 Bacillus thuringiensis LMG 12266 22 33 13 26 red yes 13 19 red yes 18 25
26 BA62 Bacillus thuringiensis LMG7138 12 18 26 24 red yes 14 13 red yes 6 7
27 BA54 Bacillus weihenstephanensis Collection 22 14 21 12 red yes 17 20 red yes 13 20
28 BA55 Bacillus weihenstephanensis Collection 77 72 98 105 red yes 136 113 red yes 90 40
29 BA56 Bacillus weihenstephanensis Collection 10 11 15 18 red yes 11 13 red yes 11 11
30 BA57 Bacillus weihenstephanensis Collection 7 10 12 8 red yes 13 6 red yes 8 8
#
Inclusivity ‐ Initial validation study (2010)
Colonies on BACARA ‐ Pour plate ‐
Incubation 24 h at 30°C
Alternative method
OriginStrain
Reference
Eurofins
IPL Nord
Number of CFU on
TSA agar medium
Number of CFU on
MYP agar mediumColonies on BACARA ‐ Surface
spreading ‐ Incubation 24 h at 30°C
Microsept Summary report - v0 BACARA
64/70
December 2018

Inoculum Colonies on BACARA ‐
Surface spreading ‐
Incubation 24 h at 30°C
Colonies on BACARA ‐
Pour plate ‐ Incubation
24 h at 30°C
Aspect on agar medium Aspect on agar medium
1 BA9 Bacillus amyloliquefaciens Potato flakes + no growth no growth /2 BA20 Bacillus amyloliquefaciens Tabbouleh with poultry + no growth no growth /3 BA47 Bacillus badius Environment + no growth no growth /4 BA18 Bacillus circulans Custard + no growth no growth /5 BA37 Bacillus coagulans ATCC 7050 + no growth no growth /6 BA16 Bacillus licheniformis Custard + no growth no growth /7 BA17 Bacillus pumilus Custard + no growth no growth /8 BA22 Bacillus pumilus Tabbouleh with poultry + no growth no growth /9 BA63 Bacillus firmus ATCC 7953 + no growth no growth /10 BA43 Bacillus subtilis ATCC 23059 + no growth no growth /11 BA32 Bacillus subtilis ATCC 27689 + no growth no growth /12 CIT23 Citrobacter freundii Celery + no growth no growth /
13 E1 Enterococcus faecalis Egg +Pink salmon CFU without
halo
Pink salmon CFU without
halo
No halo after 48 h
of incubation
14 E6 Enterococcus faecalisATCC 29212
+Pink salmon CFU without
halo
Pink salmon CFU without
halo
No halo after 48 h
of incubation15 E7 Enterococcus faecium CIP 5433 + no growth no growth /16 E10 Enterococcus durans Meat product + no growth no growth /
17 / Leuconostoc citreum / +Small white CFU without
halo
Small white CFU without
halo
No halo after 48 h
of incubation18 L156 Listeria monocytogenes Frozen fries + no growth no growth /19 L236 Listeria monocytogenes Meat product + no growth no growth /20 L133 Listeria ivanovii Roquefort cheese + no growth no growth /21 PRO EN43 Proteus mirabilis Meat product + no growth no growth /22 PS28 Pseudomonas fluorescens Dried herbs + no growth no growth /23 S122 Salmonella Enteritidis Liquid egg + no growth no growth /24 ST29 Staphylococcus aureus Pasta salad + no growth no growth /25 ST30 Staphylococcus aureus Country style toast + no growth no growth /26 ST13 Staphylococcus aureus ATCC 25923 + no growth no growth /27 ST3 Staphylococcus epidermidis Strawberry yoghurt + no growth no growth /28 ST20 Staphylococcus epidermidis Smoked salmon + no growth no growth /
#
Exclusivity ‐ Initial validation study (2010)
Comments
Reference
Eurofins
IPL Nord
Growth on
TSA (24 h ‐
30°C)
Alternative method
OriginStrain
Microsept Summary report - v0 BACARA
65/70
December 2018
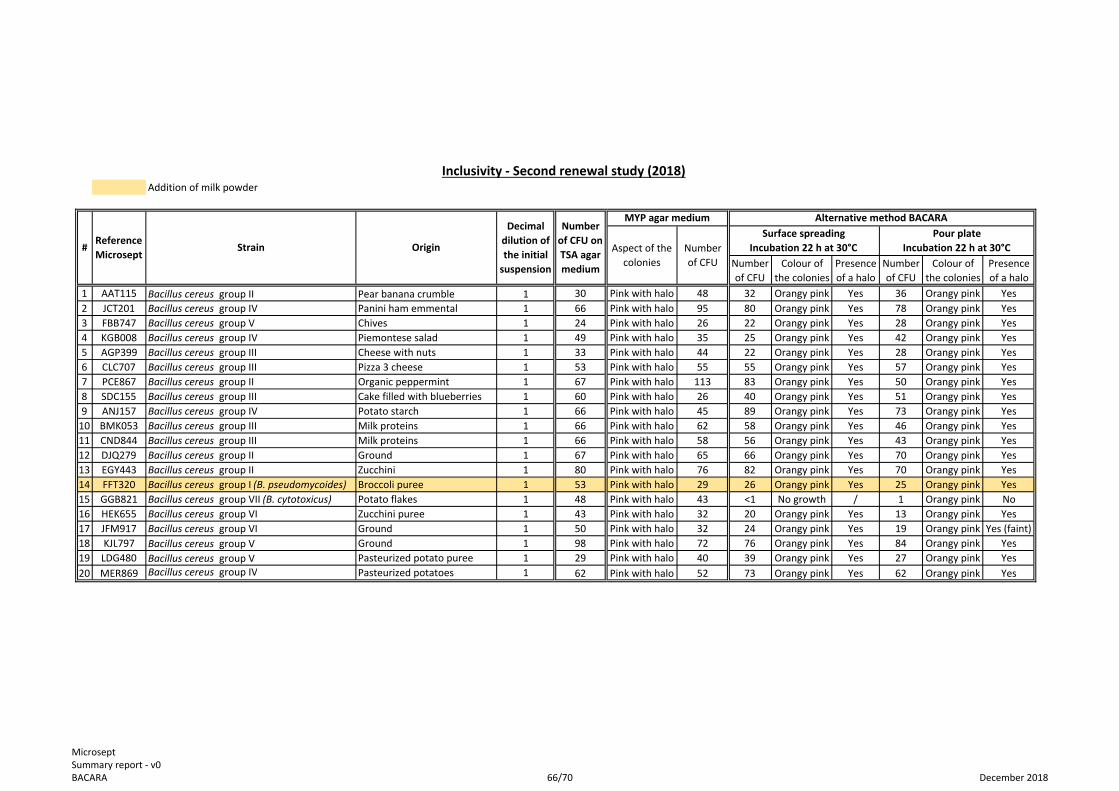
Addition of milk powder
Number
of CFU
Colour of
the colonies
Presence
of a halo
Number
of CFU
Colour of
the colonies
Presence
of a halo
1 AAT115 Bacillus cereus group II Pear banana crumble 1 30 Pink with halo 48 32 Orangy pink Yes 36 Orangy pink Yes
2 JCT201 Bacillus cereus group IV Panini ham emmental 1 66 Pink with halo 95 80 Orangy pink Yes 78 Orangy pink Yes
3 FBB747 Bacillus cereus group V Chives 1 24 Pink with halo 26 22 Orangy pink Yes 28 Orangy pink Yes
4 KGB008 Bacillus cereus group IV Piemontese salad 1 49 Pink with halo 35 25 Orangy pink Yes 42 Orangy pink Yes
5 AGP399 Bacillus cereus group III Cheese with nuts 1 33 Pink with halo 44 22 Orangy pink Yes 28 Orangy pink Yes
6 CLC707 Bacillus cereus group III Pizza 3 cheese 1 53 Pink with halo 55 55 Orangy pink Yes 57 Orangy pink Yes
7 PCE867 Bacillus cereus group II Organic peppermint 1 67 Pink with halo 113 83 Orangy pink Yes 50 Orangy pink Yes
8 SDC155 Bacillus cereus group III Cake filled with blueberries 1 60 Pink with halo 26 40 Orangy pink Yes 51 Orangy pink Yes
9 ANJ157 Bacillus cereus group IV Potato starch 1 66 Pink with halo 45 89 Orangy pink Yes 73 Orangy pink Yes
10 BMK053 Bacillus cereus group III Milk proteins 1 66 Pink with halo 62 58 Orangy pink Yes 46 Orangy pink Yes
11 CND844 Bacillus cereus group III Milk proteins 1 66 Pink with halo 58 56 Orangy pink Yes 43 Orangy pink Yes
12 DJQ279 Bacillus cereus group II Ground 1 67 Pink with halo 65 66 Orangy pink Yes 70 Orangy pink Yes
13 EGY443 Bacillus cereus group II Zucchini 1 80 Pink with halo 76 82 Orangy pink Yes 70 Orangy pink Yes
14 FFT320 Bacillus cereus group I (B. pseudomycoides) Broccoli puree 1 53 Pink with halo 29 26 Orangy pink Yes 25 Orangy pink Yes
15 GGB821 Bacillus cereus group VII (B. cytotoxicus) Potato flakes 1 48 Pink with halo 43 <1 No growth / 1 Orangy pink No
16 HEK655 Bacillus cereus group VI Zucchini puree 1 43 Pink with halo 32 20 Orangy pink Yes 13 Orangy pink Yes
17 JFM917 Bacillus cereus group VI Ground 1 50 Pink with halo 32 24 Orangy pink Yes 19 Orangy pink Yes (faint)
18 KJL797 Bacillus cereus group V Ground 1 98 Pink with halo 72 76 Orangy pink Yes 84 Orangy pink Yes
19 LDG480 Bacillus cereus group V Pasteurized potato puree 1 29 Pink with halo 40 39 Orangy pink Yes 27 Orangy pink Yes
20 MER869 Bacillus cereus group IV Pasteurized potatoes 1 62 Pink with halo 52 73 Orangy pink Yes 62 Orangy pink Yes
Inclusivity ‐ Second renewal study (2018)
#Reference
MicroseptStrain Origin
Alternative method BACARA
Surface spreading
Incubation 22 h at 30°C
Pour plate
Incubation 22 h at 30°C
Number
of CFU on
TSA agar
medium
MYP agar medium
Aspect of the
colonies
Number
of CFU
Decimal
dilution of
the initial
suspension
Microsept Summary report - v0 BACARA
66/70
December 2018

Number
of CFU
Colour of
the colonies
Presence
of a halo
Number
of CFU
Colour of
the colonies
Presence
of a halo
1 AER835 Carnobacterium divergens Salmon steak ‐6/‐7 24/1 / <1/<1 <1/<1 / / <1/<1 / /
2 EFG554 Corynebacterium callunae Calzone ‐6/‐7 79/8 / <1/<1 <1/<1 / / <1/<1 / /
Number
of CFU
Surface spreading ‐ Incubation
22 h at 30°C
Pour plate ‐ Incubation 22 h at
30°C
Exclusivity ‐ Second renewal study (2018)
#Reference
MicroseptStrain Origin
Decimal
dilutions of
the initial
suspension
Number
of CFU on
TSA agar
medium
MYP agar medium Alternative method BACARA
Aspect of the
colonies
Microsept Summary report - v0 BACARA
67/70
December 2018

Appendix H
Interlaboratory study – Raw results
Microsept Summary report - v0 BACARA
68/70
December 2018

Collaborator Results in CFUmlA <1B 20 en (presence<40)C <10D <10E <10F <10G 3 en (presence <40)H 20 en (presence <40)I <1J <1K 3 en (presence <40)L <1M <1N <1
Expert Laboratory 2 en (presence <40)
Results of the enumeration of the mesophilic aerobic flora
Microsept Summary report - v0 BACARA
69/70
December 2018

Raw data (CFU/g)
Résultat 1 Résultat 2 Résultat 1 Résultat 2 Résultat 1 Résultat 2 Résultat 1 Résultat 2 Résultat 1 Résultat 2 Résultat 1 Résultat 2B 20 30 30 10 440 420 410 320 2400 2800 2000 2200C 30 70 30 20 310 440 260 340 1400 1500 1700 1500D 90 10 80 0 360 350 330 280 1500 1600 1400 1600E 70 40 70 40 380 410 310 410 2100 1800 2000 1800F 90 130 40 50 310 450 290 430 1300 1800 1500 1500G 80 90 30 20 420 530 430 420 2000 1900 1700 1600H 50 110 10 50 400 450 430 310 2100 1700 1700 1500I 50 60 30 30 370 510 330 380 2400 2400 1800 2200J 60 60 60 20 460 460 450 430 2300 2900 1900 2400K 50 60 10 50 430 440 330 460 1800 2300 1800 1900L 70 10 30 10 590 360 410 360 1500 1800 1400 1600M 50 70 40 80 590 530 540 420 2200 2300 2300 2100N 50 50 40 50 530 530 470 390 1700 2000 1700 1900
Data converted in log (lof CFU/g)
Résultat 1 Résultat 2 Résultat 1 Résultat 2 Résultat 1 Résultat 2 Résultat 1 Résultat 2 Résultat 1 Résultat 2 Résultat 1 Résultat 2B 1,30 1,48 1,48 1,00 2,64 2,62 2,61 2,51 3,38 3,45 3,30 3,34C 1,48 1,85 1,48 1,30 2,49 2,64 2,41 2,53 3,15 3,18 3,23 3,18D 1,95 1,00 1,90 0,00 2,56 2,54 2,52 2,45 3,18 3,20 3,15 3,20E 1,85 1,60 1,85 1,60 2,58 2,61 2,49 2,61 3,32 3,26 3,30 3,26F 1,95 2,11 1,60 1,70 2,49 2,65 2,46 2,63 3,11 3,26 3,18 3,18G 1,90 1,95 1,48 1,30 2,62 2,72 2,63 2,62 3,30 3,28 3,23 3,20H 1,70 2,04 1,00 1,70 2,60 2,65 2,63 2,49 3,32 3,23 3,23 3,18I 1,70 1,78 1,48 1,48 2,57 2,71 2,52 2,58 3,38 3,38 3,26 3,34J 1,78 1,78 1,78 1,30 2,66 2,66 2,65 2,63 3,36 3,46 3,28 3,38K 1,70 1,78 1,00 1,70 2,63 2,64 2,52 2,66 3,26 3,36 3,26 3,28L 1,85 1,00 1,48 1,00 2,77 2,56 2,61 2,56 3,18 3,26 3,15 3,20M 1,70 1,85 1,60 1,90 2,77 2,72 2,73 2,62 3,34 3,36 3,36 3,32N 1,70 1,70 1,60 1,70 2,72 2,72 2,67 2,59 3,23 3,30 3,23 3,28
Summary of the interlaboratory results
LaboratoireNiveau 1 Niveau 2 Niveau 3
Méthode de référence Méthode alternative Méthode de référence Méthode alternative Méthode de référence Méthode alternative
LaboratoireNiveau 1 Niveau 2 Niveau 3
Méthode de référence Méthode alternative Méthode de référence Méthode alternative Méthode de référence Méthode alternative
Microsept Summary report - v0 BACARA
70/70
December 2018


