

Nishat Mills Limited
Company Information ................................................................................................................ 02Directors’ Report ......................................................................................................................... 04Unconsolidated Condensed Interim Balance Sheet ............................................................ 08Unconsolidated Condensed Interim Profit and Loss Account .......................................... 10Unconsolidated Condensed Interim Statement of Comprehensive Income .................. 11Unconsolidated Condensed Interim Cash Flow Statement ............................................... 12Unconsolidated Condensed Interim Statement of Changes in Equity ............................ 13Selected Notes to the Unconsolidated Condensed Interim Financial Information ...... 14
Nishat Mills Limited and its Subsidiary Companies
Consolidated Condensed Interim Balance Sheet ................................................................. 24Consolidated Condensed Interim Profit and Loss Account ............................................... 26Consolidated Condensed Interim Statement of Comprehensive Income ....................... 27Consolidated Condensed Interim Cash Flow Statement .................................................... 28Consolidated Condensed Interim Statement of Changes in Equity ................................. 29Selected Notes to the Consolidated Condensed Interim Financial Information ........... 30
Contents
2 Nishat Mills Limited
Board of Directors
Mian Umer Mansha
Chairman/CEO
Mian Hassan Mansha
Mr. Khalid Qadeer Qureshi
Syed Zahid Hussain
Mr. Muhammad Azam
Ms. Nabiha Shahnawaz Cheema
Mr. Maqsood Ahmad
Audit Committee
Mr. Khalid Qadeer Qureshi
Chairman/Member
Mr. Muhammad Azam
Member
Ms. Nabiha Shahnawaz Cheema
Member
Human Resource & Remuneration
(HR & R) Committee
Mian Hassan Mansha
Chairman/Member
Mian Umer Mansha
Member
Mr. Khalid Qadeer Qureshi
Member
Chief Financial Officer
Mr. Badar-ul-Hassan
Company Secretary
Mr. Khalid Mahmood Chohan
Auditors
Riaz Ahmad & Company
Chartered Accountants
Legal Advisor
Mr. M. Aurangzeb Khan, Advocate,
Chamber No. 6, District Court,
Faisalabad.
Company Information

3
Bankers to the Company
Albaraka Bank (Pakistan) Limited
Allied Bank Limited
Askari Bank Limited
Bank Alfalah Limited
Bank Islami Pakistan Limited
Barclays Bank PLC
Burj Bank Limited
Citibank N.A.
Deutsche Bank AG
Dubai Islamic Bank Pakistan Limited
Faysal Bank Limited
Habib Bank Limited
Habib Metropolitan Bank Limited
HSBC Bank Middle East Limited
JS Bank Limited
KASB Bank Limited
Meezan Bank Limited
National Bank of Pakistan
NIB Bank Limited
Pak Brunei Investment Company Limited
Pak Oman Investment Company Limited
Pakistan Kuwait Investment
Company (Private) Limited
Samba Bank Limited
Saudi Pak Industrial & Agricultural
Investment Company Limited
Silk Bank Limited
Soneri Bank Limited
Summit Bank Limited
Standard Chartered Bank (Pakistan)
Limited
The Bank of Punjab
United Bank Limited
Mills
Spinning units, Yarn Dyeing& Power plant
Nishatabad, Faisalabad.
Spinning unit & Power plant
20 K.M. Sheikhupura Faisalabad Road,Feroze Watwan.
Weaving units & Power plant
12 K.M. Faisalabad Road, Sheikhupura.
Weaving units, Dyeing & Finishing unit,Processing unit, Stitching unit andPower plant
5 K.M. Nishat Avenue Off 22 K.M. Ferozepur Road, Lahore.
Stitching unit
21 K.M. Ferozepur Road, Lahore.
Apparel Unit
7 K.M. Nishat Avenue Off 22 K.M. Ferozepur Road, Lahore.
Registered Office & Shares Department
Nishat House,53 - A, Lawrence Road, Lahore.Tel: 042-36360154, 042-111 113 333Fax: 042-36367414
Head Office
7, Main Gulberg, Lahore.Tel: 042-35716351-59,042-111 332 200Fax: 042-35716349-50E-mail: [email protected]: www.nishatmillsltd.com
Liaison Office
Ist Floor, Karachi Chambers,Hasrat Mohani Road, Karachi.Tel: 021-32414721-23Fax: 021-32412936

4 Nishat Mills Limited
Directors of Nishat Mills Limited (“the Company”) are pleased to present the Directors’ Report for the quarter ended 30 September 2013.
Operating Financial Results
The Company’s profit after tax increased significantly by 47.89% during the current quarter as compared to corresponding quarter of the last year. This was mainly on account of increase in sales by 4.81%. The productions efficiencies and better cost management curtailed the increase in cost of goods sold to 1.50%. Resultantly, gross profit margin increased from 15.74% in the corresponding quarter to 18.41% in the current quarter. Other major profitability measures that contributed to the bottom line were increased dividend income of Rs. 488.82 million and gain of Rs. 95 million mainly on sale of partial investment in Lalpir Power Limited.
Financial Highlights Quarter ended 30 September Increase/
2013 2012 (decrease) %
Net Sales (Rs. ‘000’) 13,579,060 12,955,361 4.81Gross Profit (Rs. ‘000’) 2,499,384 2,039,157 22.57Profit before tax (Rs. ‘000’) 1,752,941 1,195,804 46.59Profit after tax (Rs. ‘000’) 1,571,941 1,062,888 47.89Gross Profit (%) 18.41 15.74 Profit after tax (%) 11.58 8.20 Earnings per share – (Rs.) 4.47 3.02
Decrease in finance cost by 10.76% in the current quarter as compared to corresponding quarter in the last year through better working capital management and reduction in borrowing rates was also key contributor to the profitability.
General Market Review and Future Prospects
The future prospects for textile industry are bright considering the expected approval of the Generalized System of Preferences Plus (GSP-plus) status from the European Union (EU) in January 2014 which will further increase the textile exports to the EU. Moreover, higher cost of yarn production in China due to rising labor costs and manpower shortages has provided boost to the spinning business in Pakistan.
In this situation, the Company is committed and focused to exploit the opportunities by improving its strengths and developing strategies like utilizing alternate energy resources, product diversification, new market development and achievement of efficiency in production.
Spinning
The cotton prices remained somehow steady during the first month of the current quarter of financial year 2013-14. However, the prices inflated at the start of August, due to local weather conditions, news of shortage of cotton in international market and China’s decision to increase its cotton stocks. Anticipating this situation and to fulfill its spinning production requirements, the Company started buying raw cotton as soon as new crop arrived in the market. It is pertinent to mention that in comparison with the corresponding quarter last year, the cotton prices increased sharply during the quarter ended September 2013.
Cotton Quarter ended 30 September Increase / (Decrease)
2013 2012 Value % age
Purchase Rate / Maund 6,870 5,377 1,493 27.77
On the other hand, the increase in the prices of yarn was not in line with the increase in cotton prices observed during the quarter.
Directors’ Report

5
Yarn Quarter ended 30 September Increase / (Decrease)
2013 2012 Value % age
Sale – (Kgs ‘000’) 8,005 9,421 (1,416) (15.03)Rate / Kg 375.45 330.02 45.43 13.77Sale – (Rs. ‘000’) 3,005,499 3,109,160 (103,661) (3.33) Moreover, demand of the yarn also decreased significantly towards the end of the quarter. According to the previous trend, Hong Kong / China remained main markets for cotton yarn whereas demand was negligible in Europe & USA.
Weaving
The performance of the Weaving division was remarkable during the current quarter. Grey cloth sales, both in fashion and work-wear, boosted in European market, however a declining sales trend was recorded in Far Eastern market because of already available huge stocks with the customers. Overall bearish sentiments are prevailing in international and domestic markets as further decrease in yarn prices is expected. Resultantly, it is generating selling pressure especially in local market. Moreover, rising cost of energy is an additional burden on us.
However, the Company is committed to maintain its competitive edge through market and product diversification. We are trying to introduce specialized products such as fabric for tyre cord, sun protective fiber etc.
Grey Cloth Quarter ended 30 September Increase / (Decrease)
2013 2012 Value % age
Sale – (Meters ‘000’) 18,043 15,974 2,069 12.95 Rate / Meter 171.62 161.10 10.52 6.53 Sale – (Rs. ‘000’) 3,096,557 2,573,388 523,169 20.33
New 77 Picanol looms have arrived at our production facility at Bhikki out of which 35 are operational and remaining 42 will be in operation by the last week of October. These looms will increase our production and give us flexibility in scheduling the production of heavier qualities. The commercial production of our new unit comprising of 100 Airjet Toyota looms is also expected to commence in the last quarter of the current financial year.
Processing and Home Textile
The Processing division also performed well during the first quarter of the year despite the prevailing global economic crises. However, considering the stiff competition, sluggish demand of woven apparel in US and European markets, we anticipate rest of the year will be very tough and challenging for the textile industry.
Processed Cloth and Made-ups Quarter ended 30 September Increase / (Decrease)
2013 2012 Value % age
Sale – (Meters ‘000’) 16,266 19,697 (3,431) (17.42) Rate / Meter 306.11 261.66 44.45 16.99 Sale – (Rs. ‘000’) 4,979,118 5,153,876 (174,758) (3.39)
In the home textile division, our new business strategy to focus on value addition by establishing a healthy mix of fashion and basic products, engagement with leading brands and introduction of innovative manufacturing technologies has produced positive results for us. We have not only increased business volumes with existing customers but also increased our customer base.
6 Nishat Mills Limited
The digital machine which was installed in our production line last year received a positive response in fashion and home textile market. Consequently, we have planned to add one more machine by the end of second quarter.
All other machineries that were planned for expansion have arrived and are expected to be operational during next quarter. Once the planned expansion is completed, the production capacity of the home textile division will increase by approximately 25%. Some of this capacity has already been booked by international buyers. The additional five hundred thousand meters production capacity will also be available in the Processing unit at the start of next calendar year as a result of Balancing, Modernization and Replacement (BMR).
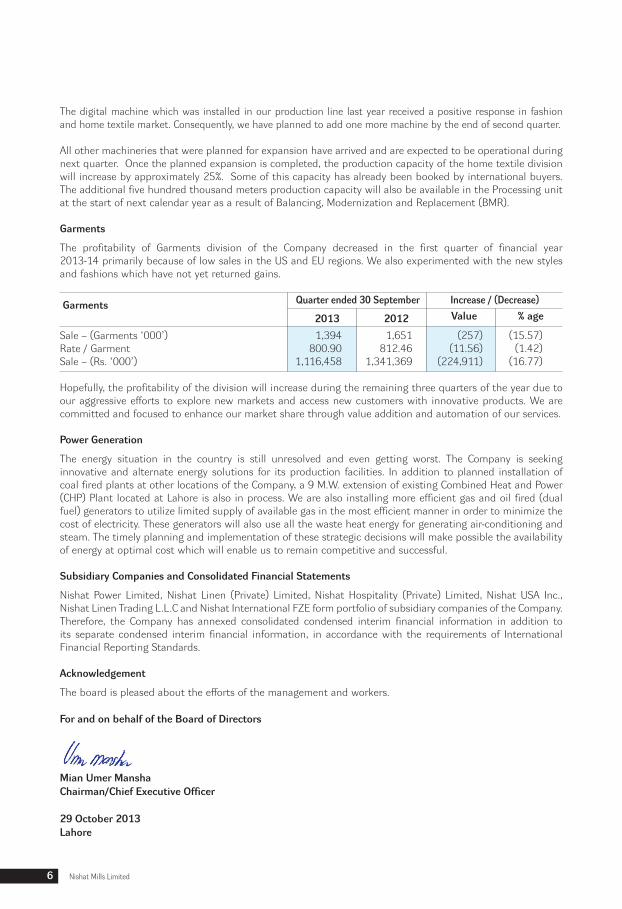
Garments
The profitability of Garments division of the Company decreased in the first quarter of financial year 2013-14 primarily because of low sales in the US and EU regions. We also experimented with the new styles and fashions which have not yet returned gains.
Garments Quarter ended 30 September Increase / (Decrease)
2013 2012 Value % age
Sale – (Garments ‘000’) 1,394 1,651 (257) (15.57)Rate / Garment 800.90 812.46 (11.56) (1.42)Sale – (Rs. ‘000’) 1,116,458 1,341,369 (224,911) (16.77)
Hopefully, the profitability of the division will increase during the remaining three quarters of the year due to our aggressive efforts to explore new markets and access new customers with innovative products. We are committed and focused to enhance our market share through value addition and automation of our services.
Power Generation
The energy situation in the country is still unresolved and even getting worst. The Company is seeking innovative and alternate energy solutions for its production facilities. In addition to planned installation of coal fired plants at other locations of the Company, a 9 M.W. extension of existing Combined Heat and Power (CHP) Plant located at Lahore is also in process. We are also installing more efficient gas and oil fired (dual fuel) generators to utilize limited supply of available gas in the most efficient manner in order to minimize the cost of electricity. These generators will also use all the waste heat energy for generating air-conditioning and steam. The timely planning and implementation of these strategic decisions will make possible the availability of energy at optimal cost which will enable us to remain competitive and successful.
Subsidiary Companies and Consolidated Financial Statements
Nishat Power Limited, Nishat Linen (Private) Limited, Nishat Hospitality (Private) Limited, Nishat USA Inc., Nishat Linen Trading L.L.C and Nishat International FZE form portfolio of subsidiary companies of the Company. Therefore, the Company has annexed consolidated condensed interim financial information in addition to its separate condensed interim financial information, in accordance with the requirements of International Financial Reporting Standards.
Acknowledgement
The board is pleased about the efforts of the management and workers.
For and on behalf of the Board of Directors
Mian Umer ManshaChairman/Chief Executive Officer
29 October 2013Lahore

7Unconsolidated Condensed Interim Financial Information
for the quarter ended 30 September 2013
Unconsolidated Condensed Interim
Financial InformationFor the quarter ended 30 September 2013

8 Nishat Mills Limited
Un-audited Audited 30 September 30 June 2013 2013 Note (Rupees in thousand)
EQUITY AND LIABILITIES
SHARE CAPITAL AND RESERVES
Authorized share capital 1,100,000,000 (30 June 2013: 1,100,000,000) ordinary shares of Rupees 10 each 11,000,000 11,000,000 Issued, subscribed and paid-up share capital 351,599,848 (30 June 2013: 351,599,848) ordinary shares of Rupees 10 each 3,515,999 3,515,999 Reserves 55,513,910 55,401,036 Total equity 59,029,909 58,917,035 LIABILITIES NON-CURRENT LIABILITIES
Long term financing- secured 5 3,008,086 3,083,410Liabilities against assets subject to finance lease 6 48,035 66,322Deferred income tax liability 499,415 499,415
3,555,536 3,649,147 CURRENT LIABILITIES
Trade and other payables 4,315,329 3,785,501Accrued mark-up 199,442 300,755Short term borrowings 10,875,143 11,939,028Current portion of non-current liabilities 1,263,226 1,310,769Provision for taxation 913,359 732,359
17,566,499 18,068,412
TOTAL LIABILITIES 21,122,035 21,717,559 CONTINGENCIES AND COMMITMENTS 7 TOTAL EQUITY AND LIABILITIES 80,151,944 80,634,594 The annexed notes form an integral part of this unconsolidated condensed interim financial information.
Unconsolidated Condensed Interim Balance SheetAs at 30 September 2013
Chief Executive Officer
9Unconsolidated Condensed Interim Financial Information
for the quarter ended 30 September 2013
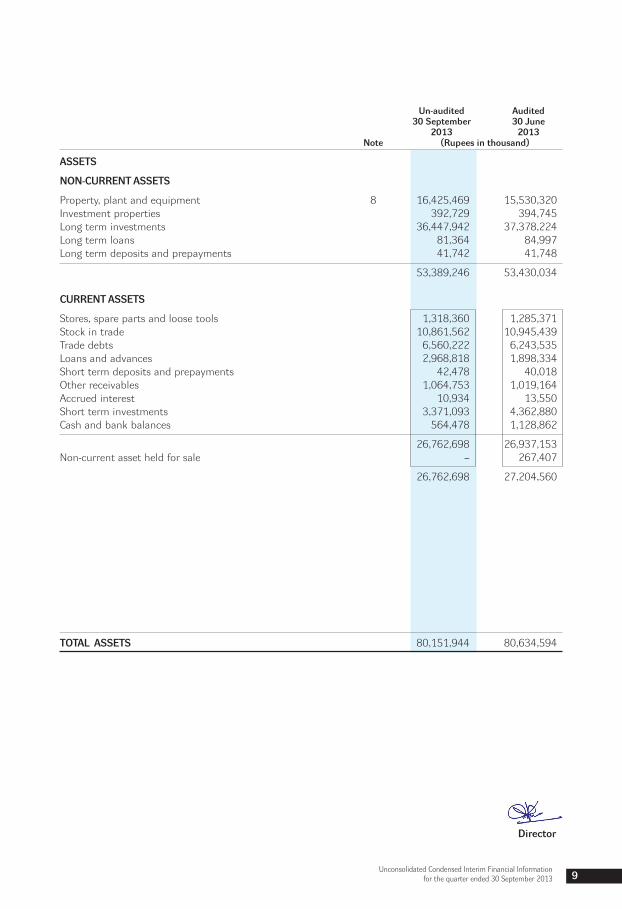
Un-audited Audited 30 September 30 June 2013 2013 Note (Rupees in thousand)
ASSETS
NON-CURRENT ASSETS
Property, plant and equipment 8 16,425,469 15,530,320Investment properties 392,729 394,745Long term investments 36,447,942 37,378,224Long term loans 81,364 84,997Long term deposits and prepayments 41,742 41,748
53,389,246 53,430,034
CURRENT ASSETS
Stores, spare parts and loose tools 1,318,360 1,285,371Stock in trade 10,861,562 10,945,439Trade debts 6,560,222 6,243,535Loans and advances 2,968,818 1,898,334Short term deposits and prepayments 42,478 40,018Other receivables 1,064,753 1,019,164Accrued interest 10,934 13,550Short term investments 3,371,093 4,362,880Cash and bank balances 564,478 1,128,862
26,762,698 26,937,153Non-current asset held for sale – 267,407
26,762,698 27,204,560
TOTAL ASSETS 80,151,944 80,634,594
Director
10 Nishat Mills Limited
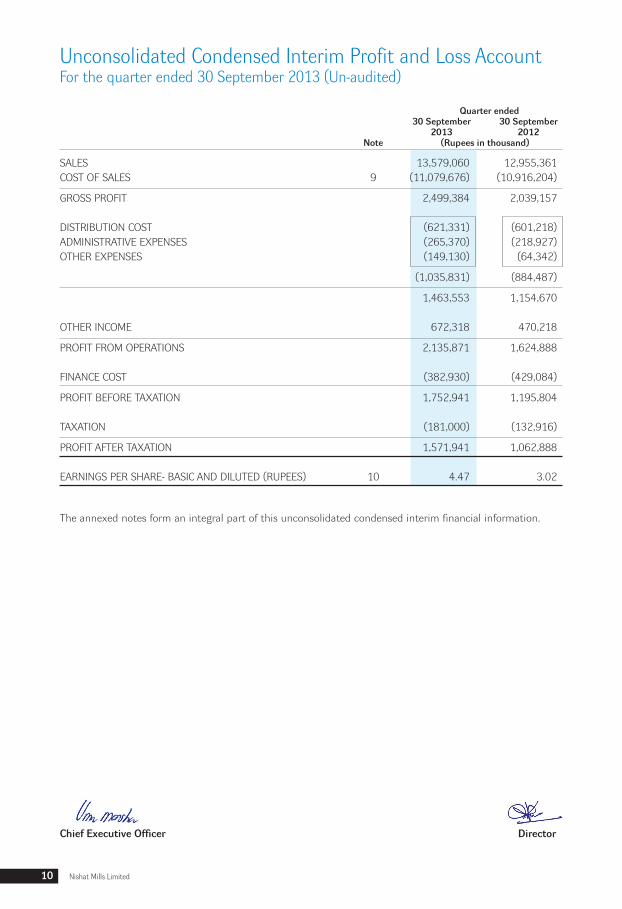
Unconsolidated Condensed Interim Profit and Loss AccountFor the quarter ended 30 September 2013 (Un-audited)
Quarter ended 30 September 30 September 2013 2012 Note (Rupees in thousand)
SALES 13,579,060 12,955,361COST OF SALES 9 (11,079,676) (10,916,204)
GROSS PROFIT 2,499,384 2,039,157 DISTRIBUTION COST (621,331) (601,218)ADMINISTRATIVE EXPENSES (265,370) (218,927)OTHER EXPENSES (149,130) (64,342)
(1,035,831) (884,487)
1,463,553 1,154,670 OTHER INCOME 672,318 470,218
PROFIT FROM OPERATIONS 2,135,871 1,624,888 FINANCE COST (382,930) (429,084)
PROFIT BEFORE TAXATION 1,752,941 1,195,804 TAXATION (181,000) (132,916)
PROFIT AFTER TAXATION 1,571,941 1,062,888 EARNINGS PER SHARE- BASIC AND DILUTED (RUPEES) 10 4.47 3.02 The annexed notes form an integral part of this unconsolidated condensed interim financial information.
DirectorChief Executive Officer

11Unconsolidated Condensed Interim Financial Information
for the quarter ended 30 September 2013
Unconsolidated Condensed Interim Statement of Comprehensive IncomeFor the quarter ended 30 September 2013 (Un-audited)
Quarter ended 30 September 30 September 2013 2012 (Rupees in thousand)
PROFIT AFTER TAXATION 1,571,941 1,062,888 OTHER COMPREHENSIVE INCOME
Items that will not be reclassified to profit or loss - -
Items that may be reclassified subsequently to profit or loss:
Surplus / (deficit) arising on remeasurement of available for sale investments to fair value (1,459,067) 3,324,364 TOTAL COMPREHENSIVE INCOME FOR THE PERIOD 112,874 4,387,252
The annexed notes form an integral part of this unconsolidated condensed interim financial information.
DirectorChief Executive Officer

12 Nishat Mills Limited
Quarter ended 30 September 30 September 2013 2012 Note (Rupees in thousand)
CASH FLOWS FROM OPERATING ACTIVITIES
Cash generated from operations 11 2,032,096 906,071 Finance cost paid (484,243) (514,465)Income tax paid (169,508) (121,923)Net exchange difference (paid) / received on forward exchange contracts (15,455) 12,815 Net (increase) / decrease in long term loans to employees 2,349 (3,468)Net (increase) / decrease in long term deposits and prepayments 6 (2,886)
Net cash generated from operating activities 1,365,245 276,144 CASH FLOWS FROM INVESTING ACTIVITIES Capital expenditure on property, plant and equipment (1,259,117) (462,895)Proceeds from sale of property, plant and equipment 27,291 11,982 Investments made (351,914) (60,160)Proceeds from sale of investment 1,177,704 - Loans and advances to subsidiary companies (1,958,426) (1,394,352)Repayment of loans from subsidiary companies 1,131,852 403,193 Interest received 19,263 14,026 Dividends received 488,824 286,898
Net cash used in investing activities (724,523) (1,201,308) CASH FLOWS FROM FINANCING ACTIVITIES Proceeds from long term financing 706,686 - Repayment of long term financing (830,634) (168,637)Repayment of liabilities against assets subject to finance lease (17,206) (15,904)Short term borrowings- net (1,063,885) 1,334,177 Dividend paid (67) (88)
Net cash from / (used in) financing activities (1,205,106) 1,149,548
Net increase / (decrease) in cash and cash equivalents (564,384) 224,384
Cash and cash equivalents at the beginning of the period 1,128,862 2,358,556
Cash and cash equivalents at the end of the period 564,478 2,582,940
The annexed notes form an integral part of this unconsolidated condensed interim financial information. .
Unconsolidated Condensed Interim Cash Flow StatementFor the quarter ended 30 September 2013 (Un-audited)
DirectorChief Executive Officer
13Unconsolidated Condensed Interim Financial Information
for the quarter ended 30 September 2013
(Rup
ees
in th
ousa
nd)
Re
serv
es
Capi
tal r
eser
ves
Reve
nue
rese
rves
Shar
e Pr
emiu
m o
n
Fair
valu
e Su
b to
tal
Gene
ral r
eser
ve U
napp
ropr
iate
d Su
b to
tal
Tota
l To
tal e
quity
capi
tal
issu
e of
re
serv
e
pr
ofit
rig
ht s
hare
s
Bala
nce
as a
t 30
June
201
2- (a
udite
d)
3,5
15,9
99
5,4
99,5
30
5,7
04,5
88
11,
204,
118
1
9,51
1,02
8
3,5
31,6
04
23,
042,
632
3
4,24
6,75
0
37,
762,
749
Profi
t for
the
perio
d -
-
-
-
-
1
,062
,888
1
,062
,888
1
,062
,888
1
,062
,888
Ot
her c
ompr
ehan
sive
inco
me
- -
3,32
4,36
4
3,3
24,3
64
-
-
-
3,3
24,3
64
3,3
24,3
64
Tota
l com
preh
ensiv
e in
com
e fo
r the
per
iod
-
-
3
,324
,364
3
,324
,364
-
1
,062
,888
1
,062
,888
4
,387
,252
4
,387
,252
Bala
nce
as a
t 30
Sept
embe
r 201
2- (u
n-au
dite
d)
3,5
15,9
99
5,4
99,5
30
9,0
28,9
52
14,
528,
482
1
9,51
1,02
8
4,5
94,4
92
24,
105,
520
3
8,63
4,00
2
42,
150,
001
Fina
l div
iden
d fo
r the
yea
r end
ed 3
0 Ju
ne 2
012
@
Rup
ees
3.50
per
sha
re
-
-
-
-
-
(1,2
30,5
99)
(1,2
30,5
99)
(1,2
30,5
99)
(1,2
30,5
99)
Tran
sfer
red
to g
ener
al re
serv
e -
-
-
-
2
,297
,000
(2
,297
,000
) -
-
-
Profi
t for
the
perio
d -
-
-
-
-
4
,783
,965
4
,783
,965
4
,783
,965
4
,783
,965
Ot
her c
ompr
ehan
sive
inco
me
- -
13,
213,
668
13
,213
,668
-
-
-
1
3,21
3,66
8
13,
213,
668
Tota
l com
preh
ensiv
e in
com
e fo
r the
per
iod
-
-
1
3,21
3,66
8
13,2
13,6
68
-
4,7
83,9
65
4,7
83,9
65
17,
997,
633
1
7,99
7,63
3
Bala
nce
as a
t 30
June
201
3- (a
udite
d)
3,5
15,9
99
5,4
99,5
30
22,
242,
620
27
,742
,150
2
1,80
8,02
8
5,8
50,8
58
27,
658,
886
5
5,40
1,03
6
58,
917,
035
Profi
t for
the
perio
d -
-
-
-
-
1
,571
,941
1
,571
,941
1
,571
,941
1
,571
,941
Ot
her c
ompr
ehan
sive
inco
me
- -
(1,4
59,0
67)
(1,4
59,0
67)
-
-
-
(1,4
59,0
67)
(1,4
59,0
67)
Tota
l com
preh
ensiv
e in
com
e fo
r the
per
iod
-
-
(1
,459
,067
) (1
,459
,067
) -
1
,571
,941
1
,571
,941
1
12,8
74
112
,874
Bala
nce
as a
t 30
Sept
embe
r 201
3- (u
n-au
dite
d)
3,5
15,9
99
5,4
99,5
30
20,
783,
553
26
,283
,083
2
1,80
8,02
8
7,4
22,7
99
29,
230,
827
5
5,51
3,91
0
59,
029,
909
The
anne
xed
note
s fo
rm a
n in
tegr
al p
art o
f thi
s un
cons
olid
ated
con
dens
ed in
terim
fina
ncia
l inf
orm
atio
n.
Dire
ctor
Chie
f Exe
cutiv
e O
ffice
r
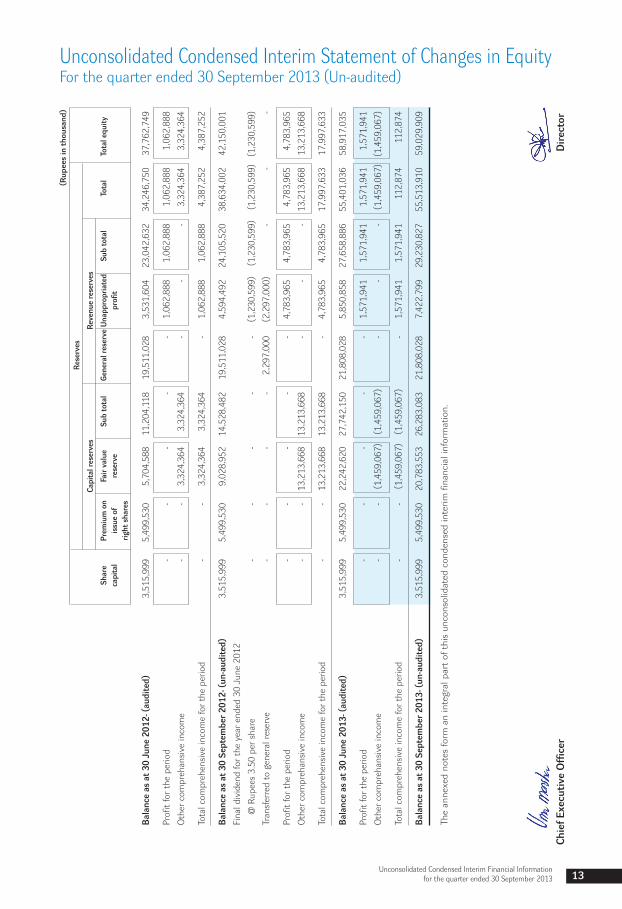
Unconsolidated Condensed Interim Statement of Changes in EquityFor the quarter ended 30 September 2013 (Un-audited)

14 Nishat Mills Limited
Un-audited Audited 30 September 30 June 2013 2013 (Rupees in thousand)
5 LONG TERM FINANCING- SECURED
Opening balance 4,323,909 4,331,178 Add: Obtained during the period / year 706,686 1,838,049 Less: Repaid during the period / year 830,634 1,845,318
4,199,961 4,323,909 Less: Current portion shown under current liabilities 1,191,875 1,240,499
3,008,086 3,083,410
1. THE COMPANY AND ITS OPERATIONS
Nishat Mills Limited is a public limited Company incorporated in Pakistan under the Companies Act, 1913 (Now Companies Ordinance, 1984) and listed on all Stock Exchanges in Pakistan. Its registered office is situated at 53-A, Lawrence Road, Lahore. The Company is engaged in the business of textile manufacturing and of spinning, combing, weaving, bleaching, dyeing, printing, stitching, apparel, buying, selling and otherwise dealing in yarn, linen, cloth and other goods and fabrics made from raw cotton, synthetic fibre and cloth, and to generate, accumulate, distribute, supply and sell electricity.
2 BASIS OF PREPARATION
This unconsolidated condensed interim financial information is un-audited and is being submitted to shareholders as required by section 245 of the Companies Ordinance. This unconsolidated condensed interim financial information of the Company for the quarter ended 30 September 2013 has been prepared in accordance with the requirements of International Accounting Standard 34 “Interim Financial Reporting” and provisions of and directives issued under the Companies Ordinance, 1984. In case where requirements differ, the provisions of or directives issued under the Companies Ordinance, 1984 have been followed. This unconsolidated condensed interim financial information should be read in conjunction with the preceding audited annual published financial statements of the Company for the year ended 30 June 2013.
3 ACCOUNTING POLICIES
The accounting policies and methods of computations adopted for the preparation of this unconsolidated condensed interim financial information are the same as applied in the preparation of the preceding audited annual published financial statements of the Company for the year ended 30 June 2013.
4 CRITICAL ACCOUNTING ESTIMATES AND JUDGEMENTS
The preparation of this unconsolidated condensed interim financial information in conformity with the approved accounting standards requires the use of certain critical accounting estimates. It also requires the management to exercise its judgment in the process of applying the Company’s accounting policies. Estimates and judgments are continually evaluated and are based on historical experience and other factors, including expectations of future events that are believed to be reasonable under the circumstances.
During preparation of this unconsolidated condensed interim financial information, the significant judgments made by the management in applying the Company’s accounting policies and the key sources of estimation and uncertainty were the same as those that applied in the preceding audited annual published financial statements of the Company for the year ended 30 June 2013.
Selected Notes to the Unconsolidated Condensed Interim Financial InformationFor the quarter ended 30 September 2013 (Un-audited)

15Unconsolidated Condensed Interim Financial Information
for the quarter ended 30 September 2013
Un-audited Audited 30 September 30 June 2013 2013 (Rupees in thousand)
6 LIABILITIES AGAINST ASSETS SUBJECT TO FINANCE LEASE
Future minimum lease payments 131,446 152,545 Less: Un-amortized finance charge 12,060 15,953
Present value of future minimum lease payments 119,386 136,592 Less: Current portion shown under current liabilities 71,351 70,270
48,035 66,322
6.1 This represents sale and leaseback arrangement with Pak Kuwait Investment Company (Private) Limited. According to the lease agreement, leasing company has contributed Rupees 150.047 million from its own sources and the remaining amount of Rupees 149.953 million has been financed under Long Term Finance Facility (LTFF) scheme of State Bank of Pakistan. Minimum lease payments have been discounted using implicit interest rate ranging from 9.70% to 11.09% (30 September 2012: 9.70% to 14.06%) per annum. Balance rentals are payable in quarterly installments. Taxes, repairs and insurance costs are borne by the Company. These are secured against the leased assets and demand promissory notes.
7 CONTINGENCIES AND COMMITMENTS
a) Contingencies
i) The Company is contingently liable for Rupees 0.631 million (30 June 2013: Rupees 0.631 million) on account of central excise duty not acknowledged as debt as the cases are pending before Court.
ii) Guarantees of Rupees 642.661 million (30 June 2013: Rupees 635.607 million) are given by
the banks of the Company to Sui Northern Gas Pipelines Limited against gas connections, Shell Pakistan Limited and Pakistan State Oil Limited against purchase of furnace oil and Director Excise and Taxation, Karachi against infrastructure cess and Pakistan Army against fulfillment of sales order.
iii) Post dated cheques of Rupees 1,691.822 million (30 June 2013: Rupees 1,816.775 million)
are issued to customs authorities in respect of duties on imported items availed on the basis of consumption and export plans. If documents of exports are not provided on due dates, cheques issued as security shall be encashable.
b) Commitments
i) Contracts for capital expenditure are approximately of Rupees 3,797.412 million (30 June 2013: Rupees 4,500.169 million).
ii) Letters of credit other than for capital expenditure are of Rupees 769.423 million (30 June
2013: Rupees 493.340 million). iii) Outstanding foreign currency forward contracts of Rupees 1,485.533 million (30 June 2013:
Rupees 827.520 million).
16 Nishat Mills Limited
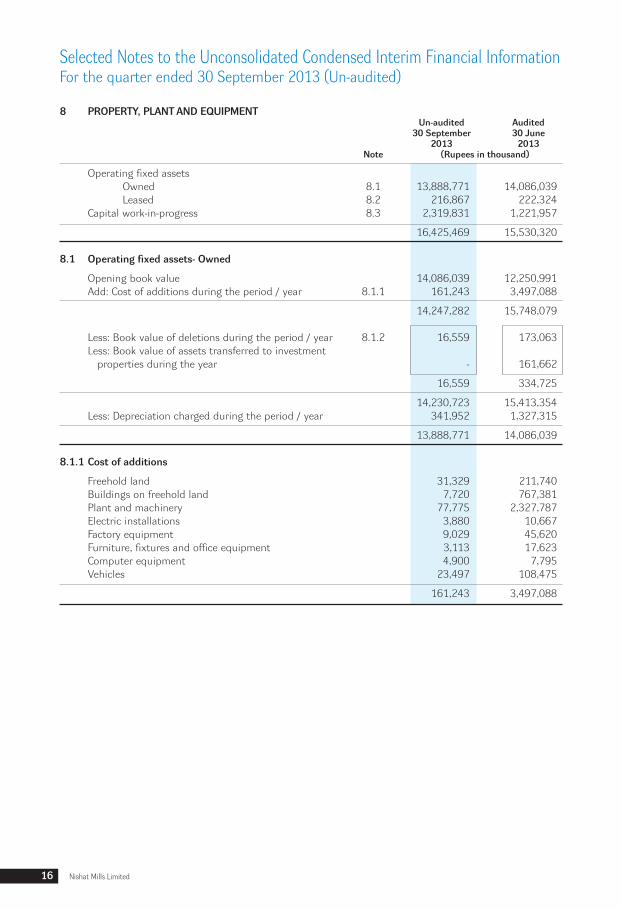
8 PROPERTY, PLANT AND EQUIPMENT Un-audited Audited 30 September 30 June 2013 2013 Note (Rupees in thousand)
Operating fixed assets Owned 8.1 13,888,771 14,086,039 Leased 8.2 216,867 222,324 Capital work-in-progress 8.3 2,319,831 1,221,957
16,425,469 15,530,320 8.1 Operating fixed assets- Owned
Opening book value 14,086,039 12,250,991 Add: Cost of additions during the period / year 8.1.1 161,243 3,497,088
14,247,282 15,748,079 Less: Book value of deletions during the period / year 8.1.2 16,559 173,063 Less: Book value of assets transferred to investment properties during the year - 161,662
16,559 334,725
14,230,723 15,413,354 Less: Depreciation charged during the period / year 341,952 1,327,315
13,888,771 14,086,039 8.1.1 Cost of additions
Freehold land 31,329 211,740 Buildings on freehold land 7,720 767,381 Plant and machinery 77,775 2,327,787 Electric installations 3,880 10,667 Factory equipment 9,029 45,620 Furniture, fixtures and office equipment 3,113 17,623 Computer equipment 4,900 7,795 Vehicles 23,497 108,475
161,243 3,497,088
Selected Notes to the Unconsolidated Condensed Interim Financial InformationFor the quarter ended 30 September 2013 (Un-audited)

17Unconsolidated Condensed Interim Financial Information
for the quarter ended 30 September 2013
Un-audited Audited 30 September 30 June 2013 2013 (Rupees in thousand)
8.1.2 Book value of deletions
Plant and machinery 10,207 158,131 Electric installations - 562 Factory equipment - 3 Furniture, fixtures and office equipment - 134 Computer equipment 56 69 Vehicles 6,296 14,164
16,559 173,063 8.2 Operating fixed assets- Leased
Opening book value 222,324 246,378 Less: Depreciation charged during the period / year 5,457 24,054
216,867 222,324 8.3 Capital work-in-progress
Buildings on freehold land 638,058 378,626 Plant and machinery 1,652,430 829,950 Unallocated expenditure 2,749 692 Letters of credit against machinery 7,492 7,522 Advances against furniture and office equipment 654 - Advances against vehicles 18,448 5,167
2,319,831 1,221,957
18 Nishat Mills Limited
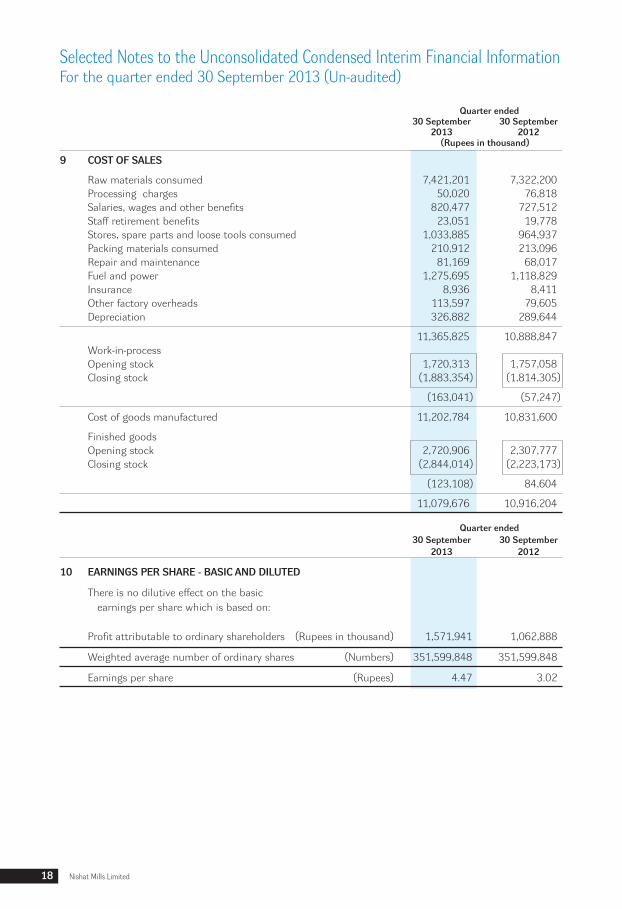
Quarter ended 30 September 30 September 2013 2012 (Rupees in thousand)
9 COST OF SALES
Raw materials consumed 7,421,201 7,322,200 Processing charges 50,020 76,818 Salaries, wages and other benefits 820,477 727,512 Staff retirement benefits 23,051 19,778 Stores, spare parts and loose tools consumed 1,033,885 964,937 Packing materials consumed 210,912 213,096 Repair and maintenance 81,169 68,017 Fuel and power 1,275,695 1,118,829 Insurance 8,936 8,411 Other factory overheads 113,597 79,605 Depreciation 326,882 289,644
11,365,825 10,888,847 Work-in-process Opening stock 1,720,313 1,757,058 Closing stock (1,883,354) (1,814,305)
(163,041) (57,247)
Cost of goods manufactured 11,202,784 10,831,600
Finished goods Opening stock 2,720,906 2,307,777 Closing stock (2,844,014) (2,223,173)
(123,108) 84,604
11,079,676 10,916,204
Quarter ended 30 September 30 September 2013 2012
10 EARNINGS PER SHARE - BASIC AND DILUTED
There is no dilutive effect on the basic earnings per share which is based on:
Profit attributable to ordinary shareholders (Rupees in thousand) 1,571,941 1,062,888
Weighted average number of ordinary shares (Numbers) 351,599,848 351,599,848
Earnings per share (Rupees) 4.47 3.02
Selected Notes to the Unconsolidated Condensed Interim Financial InformationFor the quarter ended 30 September 2013 (Un-audited)

19Unconsolidated Condensed Interim Financial Information
for the quarter ended 30 September 2013
Quarter ended 30 September 30 September 2013 2012 Note (Rupees in thousand)
11 CASH GENERATED FROM OPERATIONS
Profit before taxation 1,752,941 1,195,804 Adjustments for non-cash charges and other items: Depreciation 349,425 310,165 Gain on sale of property, plant and equipment (10,732) (2,177) Gain on sale of investments (95,381) - Dividend income (488,824) (286,898) Net exchange (gain) / loss on forward contracts 32,274 (60,552) Interest income on loans and advances to subsidiary companies (21,358) (21,880) Finance cost 382,930 429,084 Working capital changes 11.1 130,821 (657,475)
2,032,096 906,071
11.1 Working capital changes
(Increase) / decrease in current assets: - Stores, spare parts and loose tools (32,989) (280,768) - Stock in trade 83,877 1,913,472 - Trade debts (316,687) (2,104,264) - Loans and advances (73,118) 768 - Short term deposits and prepayments (2,460) 1,332 - Other receivables (40,878) (18,191)
(382,255) (487,651)
Increase / (decrease) in trade and other payables 513,076 (169,824)
130,821 (657,475)
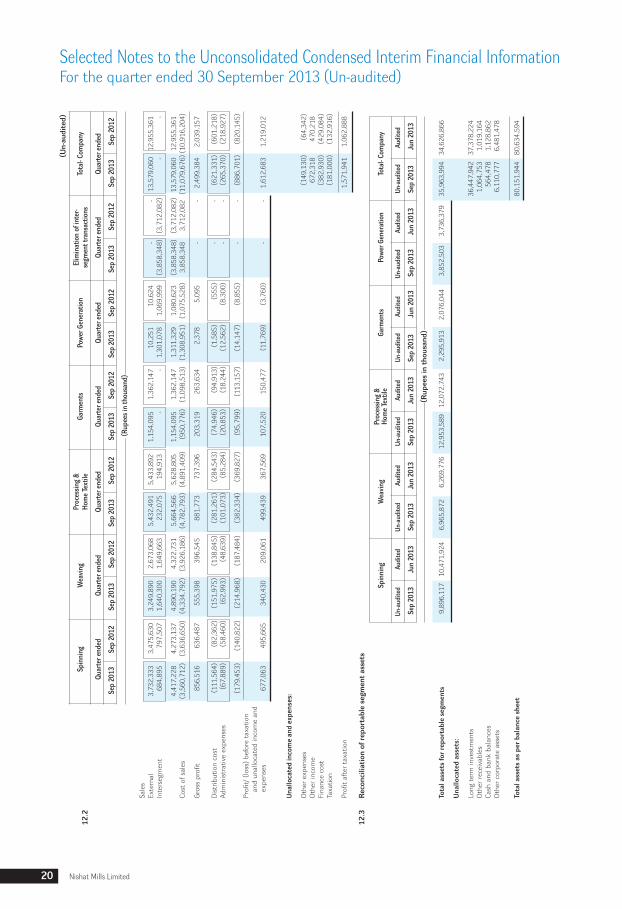
12 SEGMENT INFORMATION
12.1 The Company has five reportable business segments. The following summary describes the operation in each of the Company’s reportable segments:
Spinning: Production of different qualities of yarn using natural and artificial fibers. Weaving: Production of different qualities of greige fabric using yarn. Processing & Home Textile: Processing of greige fabric for production of printed and dyed fabric and its
further use in manufacturing variety of home textile articles.
Garments: Manufacturing of garments using processed fabric. Power Generation: Generation and distribution of power using gas, oil, steam, coal and biomass. Transactions among the business segments are recorded at cost basis. Intersegment sales and
purchases have been eliminated from the total.
20 Nishat Mills Limited
(Un-
audi
ted)
Spin
ning
W
eavin
g Pr
oces
sing
&
Garm
ents
Po
wer G
ener
atio
n El
imin
atio
n of
inte
r-
Tota
l- Co
mpa
ny12
.2
Ho
me T
extil
e
se
gmen
t tra
nsac
tions
Quar
ter e
nded
Qu
arte
r end
ed
Quar
ter e
nded
Qu
arte
r end
ed
Quar
ter e
nded
Qu
arte
r end
ed
Quar
ter e
nded
Sep
2013
Se
p 20
12
Sep
2013
Se
p 20
12
Sep
2013
Se
p 20
12
Sep
2013
Se
p 20
12
Sep
2013
Se
p 20
12
Sep
2013
Se
p 20
12
Sep
2013
Se
p 20
12
(Rup
ees i
n th
ousa
nd)
Sa
les
Exte
rnal
3
,732
,333
3
,475
,630
3
,249
,890
2
,673
,068
5
,432
,491
5
,433
,892
1
,154
,095
1
,362
,147
1
0,25
1
10,
624
-
-
13
,579
,060
12
,955
,361
Inte
rseg
men
t 6
84,8
95
797
,507
1
,640
,300
1
,649
,663
2
32,0
75
194
,913
-
-
1
,301
,078
1
,069
,999
(3
,858
,348
) (3
,712
,082
) -
-
4,4
17,2
28
4,2
73,1
37
4,8
90,1
90
4,3
22,7
31
5,6
64,5
66
5,6
28,8
05
1,1
54,0
95
1,3
62,1
47
1,3
11,3
29
1,0
80,6
23
(3,8
58,3
48)
(3,7
12,0
82)
13,
579,
060
12,
955,
361
Co
st o
f sal
es
(3,5
60,7
12)
(3,6
36,6
50)
(4,3
34,7
92)
(3,9
26,1
86)
(4,7
82,7
93)
(4,8
91,4
09)
(950
,776
) (1
,098
,513
) (1
,308
,951
) (1
,075
,528
) 3
,858
,348
3
,712
,082
(1
1,07
9,67
6) (1
0,91
6,20
4)
Gr
oss
profi
t 8
56,5
16
636
,487
5
55,3
98
396
,545
8
81,7
73
737
,396
2
03,3
19
263
,634
2
,378
5
,095
-
-
2
,499
,384
2
,039
,157
Dist
ribut
ion
cost
(1
11,5
64)
(82,
362)
(1
51,9
75)
(138
,845
) (2
81,2
61)
(284
,543
) (7
4,94
6)
(94,
913)
(1
,585
) (5
55)
-
-
(621
,331
) (6
01,2
18)
Ad
min
istr
ativ
e ex
pens
es
(67,
889)
(5
8,46
0)
(62,
993)
(4
8,63
9)
(101
,073
) (8
5,28
4)
(20,
853)
(1
8,24
4)
(12,
562)
(8
,300
) -
-
(2
65,3
70)
(218
,927
)
(179
,453
) (1
40,8
22)
(214
,968
) (1
87,4
84)
(382
,334
) (3
69,8
27)
(95,
799)
(1
13,1
57)
(14,
147)
(8
,855
) -
-
(8
86,7
01)
(820
,145
)
Profi
t/ (l
oss)
bef
ore
taxa
tion
and
unal
loca
ted
inco
me
and
expe
nses
6
77,0
63
495
,665
3
40,4
30
209
,061
4
99,4
39
367
,569
1
07,5
20
150
,477
(1
1,76
9)
(3,7
60)
-
-
1,6
12,6
83
1,2
19,0
12
Un
allo
cate
d in
com
e an
d ex
pens
es:
O
ther
exp
ense
s
(1
49,1
30)
(64,
342)
O
ther
inco
me
672
,318
4
70,2
18
Fi
nanc
e co
st
(382
,930
) (4
29,0
84)
Ta
xatio
n
(1
81,0
00)
(132
,916
)
Pr
ofit a
fter t
axat
ion
1,5
71,9
41
1,0
62,8
88
12.3
Re
conc
iliat
ion
of re
port
able
seg
men
t ass
ets
Sp
inni
ng
Wea
ving
Proc
essin
g &
Ga
rmen
ts
Powe
r Gen
erat
ion
Tota
l- Co
mpa
ny
Hom
e Tex
tile
Un-a
udite
d Au
dite
d U
n-au
dite
d Au
dite
d Un
-aud
ited
Audi
ted
Un-a
udite
d Au
dite
d Un
-aud
ited
Audi
ted
Un-a
udite
d Au
dite
d
Sep
2013
Ju
n 20
13
Sep
2013
Ju
n 20
13
Sep
2013
Ju
n 20
13
Sep
2013
Ju
n 20
13
Sep
2013
Ju
n 20
13
Sep
2013
Ju
n 20
13
(Ru
pees
in th
ousa
nd)
To
tal a
sset
s fo
r rep
orta
ble
segm
ents
9
,896
,117
10
,471
,924
6
,965
,872
6
,269
,776
1
2,95
3,58
9 1
2,07
2,74
3
2,2
95,9
13
2,0
76,0
44
3,8
52,5
03
3,7
36,3
79
35,
963,
994
34,
626,
866
U
nallo
cate
d as
sets
:
Lo
ng te
rm in
vest
men
ts
36,
447,
942
37,
378,
224
O
ther
rece
ivab
les
1,0
64,7
53
1,0
19,1
64
Ca
sh a
nd b
ank
bala
nces
5
64,4
78
1,1
28,8
62
O
ther
cor
pora
te a
sset
s
6
,110
,777
6
,481
,478
Tota
l ass
ets
as p
er b
alan
ce s
heet
8
0,15
1,94
4 8
0,63
4,59
4
Selected Notes to the Unconsolidated Condensed Interim Financial InformationFor the quarter ended 30 September 2013 (Un-audited)
21Unconsolidated Condensed Interim Financial Information
for the quarter ended 30 September 2013
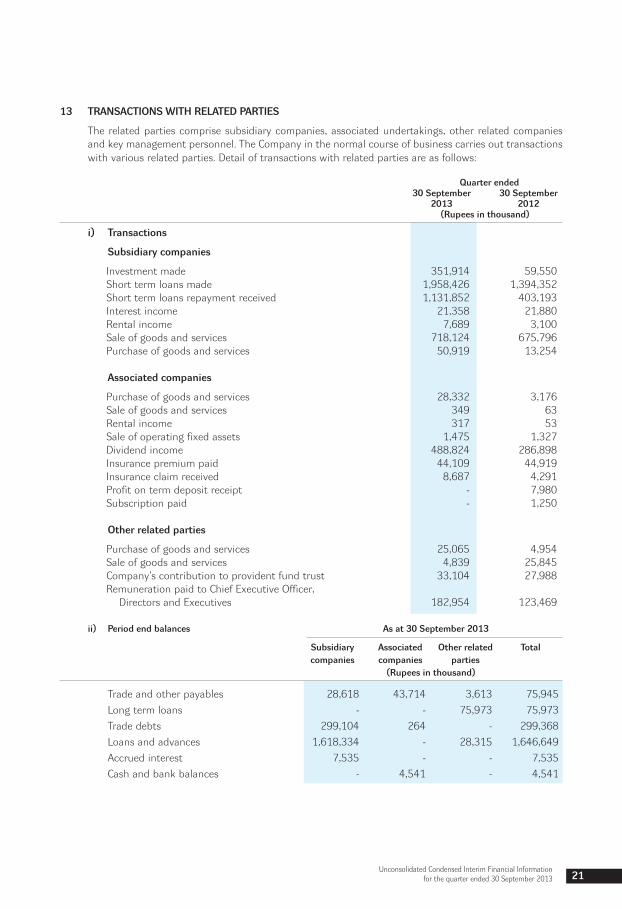
13 TRANSACTIONS WITH RELATED PARTIES
The related parties comprise subsidiary companies, associated undertakings, other related companies and key management personnel. The Company in the normal course of business carries out transactions with various related parties. Detail of transactions with related parties are as follows:
Quarter ended 30 September 30 September 2013 2012 (Rupees in thousand)
i) Transactions
Subsidiary companies
Investment made 351,914 59,550 Short term loans made 1,958,426 1,394,352 Short term loans repayment received 1,131,852 403,193 Interest income 21,358 21,880 Rental income 7,689 3,100 Sale of goods and services 718,124 675,796 Purchase of goods and services 50,919 13,254
Associated companies
Purchase of goods and services 28,332 3,176 Sale of goods and services 349 63 Rental income 317 53 Sale of operating fixed assets 1,475 1,327 Dividend income 488,824 286,898 Insurance premium paid 44,109 44,919 Insurance claim received 8,687 4,291 Profit on term deposit receipt - 7,980 Subscription paid - 1,250
Other related parties
Purchase of goods and services 25,065 4,954 Sale of goods and services 4,839 25,845 Company’s contribution to provident fund trust 33,104 27,988 Remuneration paid to Chief Executive Officer, Directors and Executives 182,954 123,469
ii) Period end balances As at 30 September 2013
Subsidiary Associated Other related Total companies companies parties (Rupees in thousand)
Trade and other payables 28,618 43,714 3,613 75,945 Long term loans - - 75,973 75,973 Trade debts 299,104 264 - 299,368 Loans and advances 1,618,334 - 28,315 1,646,649 Accrued interest 7,535 - - 7,535 Cash and bank balances - 4,541 - 4,541
22 Nishat Mills Limited
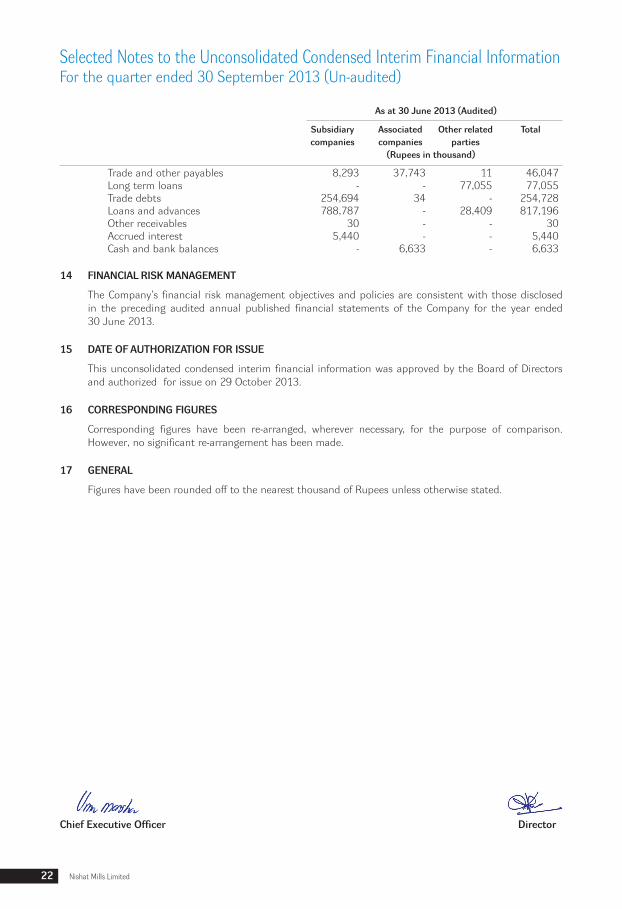
14 FINANCIAL RISK MANAGEMENT
The Company’s financial risk management objectives and policies are consistent with those disclosed in the preceding audited annual published financial statements of the Company for the year ended 30 June 2013.
15 DATE OF AUTHORIZATION FOR ISSUE
This unconsolidated condensed interim financial information was approved by the Board of Directors and authorized for issue on 29 October 2013.
16 CORRESPONDING FIGURES
Corresponding figures have been re-arranged, wherever necessary, for the purpose of comparison. However, no significant re-arrangement has been made.
17 GENERAL
Figures have been rounded off to the nearest thousand of Rupees unless otherwise stated.
As at 30 June 2013 (Audited)
Subsidiary Associated Other related Total companies companies parties (Rupees in thousand)
Trade and other payables 8,293 37,743 11 46,047 Long term loans - - 77,055 77,055 Trade debts 254,694 34 - 254,728 Loans and advances 788,787 - 28,409 817,196 Other receivables 30 - - 30 Accrued interest 5,440 - - 5,440 Cash and bank balances - 6,633 - 6,633
DirectorChief Executive Officer
Selected Notes to the Unconsolidated Condensed Interim Financial InformationFor the quarter ended 30 September 2013 (Un-audited)
Consolidated Condensed Interim
Financial InformationFor the quarter ended 30 September 2013
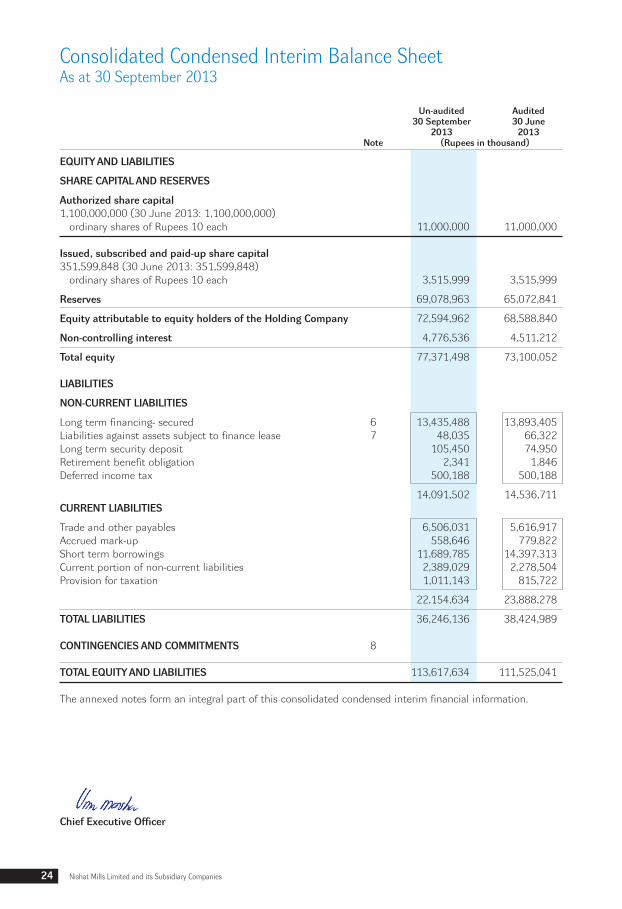
24 Nishat Mills Limited and its Subsidiary Companies
Un-audited Audited 30 September 30 June 2013 2013 Note (Rupees in thousand)
EQUITY AND LIABILITIES
SHARE CAPITAL AND RESERVES
Authorized share capital 1,100,000,000 (30 June 2013: 1,100,000,000) ordinary shares of Rupees 10 each 11,000,000 11,000,000 Issued, subscribed and paid-up share capital 351,599,848 (30 June 2013: 351,599,848) ordinary shares of Rupees 10 each 3,515,999 3,515,999
Reserves 69,078,963 65,072,841
Equity attributable to equity holders of the Holding Company 72,594,962 68,588,840
Non-controlling interest 4,776,536 4,511,212
Total equity 77,371,498 73,100,052 LIABILITIES
NON-CURRENT LIABILITIES
Long term financing- secured 6 13,435,488 13,893,405 Liabilities against assets subject to finance lease 7 48,035 66,322 Long term security deposit 105,450 74,950 Retirement benefit obligation 2,341 1,846 Deferred income tax 500,188 500,188
14,091,502 14,536,711 CURRENT LIABILITIES
Trade and other payables 6,506,031 5,616,917 Accrued mark-up 558,646 779,822 Short term borrowings 11,689,785 14,397,313 Current portion of non-current liabilities 2,389,029 2,278,504 Provision for taxation 1,011,143 815,722
22,154,634 23,888,278
TOTAL LIABILITIES 36,246,136 38,424,989 CONTINGENCIES AND COMMITMENTS 8 TOTAL EQUITY AND LIABILITIES 113,617,634 111,525,041 The annexed notes form an integral part of this consolidated condensed interim financial information.
Consolidated Condensed Interim Balance SheetAs at 30 September 2013
Chief Executive Officer

25Consolidated Condensed Interim Financial Information
for the quarter ended 30 September 2013
Un-audited Audited 30 September 30 June 2013 2013 Note (Rupees in thousand)
ASSETS
NON-CURRENT ASSETS
Property, plant and equipment 9 31,161,469 30,201,092 Investment properties 392,729 394,745 Long term investments 43,688,452 41,418,080 Long term loans 82,016 85,659 Long term deposits and prepayments 60,706 60,655
75,385,372 72,160,231 CURRENT ASSETS
Stores, spare parts and loose tools 1,913,027 1,815,361 Stock-in-trade 14,553,040 12,808,140 Trade debts 14,271,540 12,020,528 Loans and advances 1,776,345 1,527,570 Short term deposits and prepayments 106,937 85,603 Other receivables 1,480,757 1,265,896 Accrued interest 23,017 9,302 Short term investments 3,371,092 4,362,879 Cash and bank balances 736,507 5,202,124
38,232,262 39,097,403 Non-current asset held for sale - 267,407
38,232,262 39,364,810
TOTAL ASSETS 113,617,634 111,525,041
Director

26 Nishat Mills Limited and its Subsidiary Companies
Consolidated Condensed Interim Profit and Loss AccountFor the quarter ended 30 September 2013 (Un-audited)
Quarter ended 30 September 30 September 2013 2012 Note (Rupees in thousand)
SALES 20,988,515 18,590,095 COST OF SALES 10 (17,244,748) (15,238,397)
GROSS PROFIT 3,743,767 3,351,698 DISTRIBUTION COST (806,944) (671,657)ADMINISTRATIVE EXPENSES (345,454) (263,916)OTHER EXPENSES (155,741) (65,004)
(1,308,139) (1,000,577)
2,435,628 2,351,121
OTHER INCOME 367,738 457,186
PROFIT FROM OPERATIONS 2,803,366 2,808,307
FINANCE COST (754,609) (1,094,067)
2,048,757 1,714,240
SHARE OF PROFIT FROM ASSOCIATED COMPANIES 337,108 630,405
PROFIT BEFORE TAXATION 2,385,865 2,344,645
TAXATION (195,445) (140,448)
PROFIT AFTER TAXATION 2,190,420 2,204,197 SHARE OF PROFIT ATTRIBUTABLE TO:
EQUITY HOLDERS OF HOLDING COMPANY 1,925,096 1,954,804 NON-CONTROLLING INTEREST 265,324 249,393
2,190,420 2,204,197 EARNINGS PER SHARE- BASIC AND DILUTED (RUPEES) 11 5.48 5.56 The annexed notes form an integral part of this consolidated condensed interim financial information.
DirectorChief Executive Officer
27Consolidated Condensed Interim Financial Information
for the quarter ended 30 September 2013
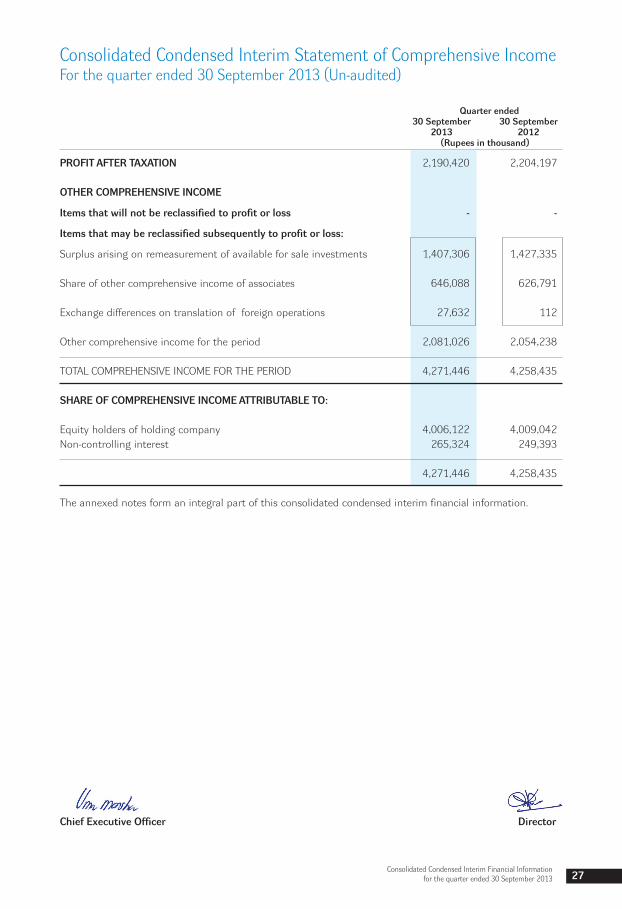
Consolidated Condensed Interim Statement of Comprehensive IncomeFor the quarter ended 30 September 2013 (Un-audited)
Quarter ended 30 September 30 September 2013 2012 (Rupees in thousand)
PROFIT AFTER TAXATION 2,190,420 2,204,197 OTHER COMPREHENSIVE INCOME
Items that will not be reclassified to profit or loss - -
Items that may be reclassified subsequently to profit or loss:
Surplus arising on remeasurement of available for sale investments 1,407,306 1,427,335 Share of other comprehensive income of associates 646,088 626,791 Exchange differences on translation of foreign operations 27,632 112 Other comprehensive income for the period 2,081,026 2,054,238 TOTAL COMPREHENSIVE INCOME FOR THE PERIOD 4,271,446 4,258,435 SHARE OF COMPREHENSIVE INCOME ATTRIBUTABLE TO: Equity holders of holding company 4,006,122 4,009,042 Non-controlling interest 265,324 249,393 4,271,446 4,258,435 The annexed notes form an integral part of this consolidated condensed interim financial information.
DirectorChief Executive Officer
28 Nishat Mills Limited and its Subsidiary Companies
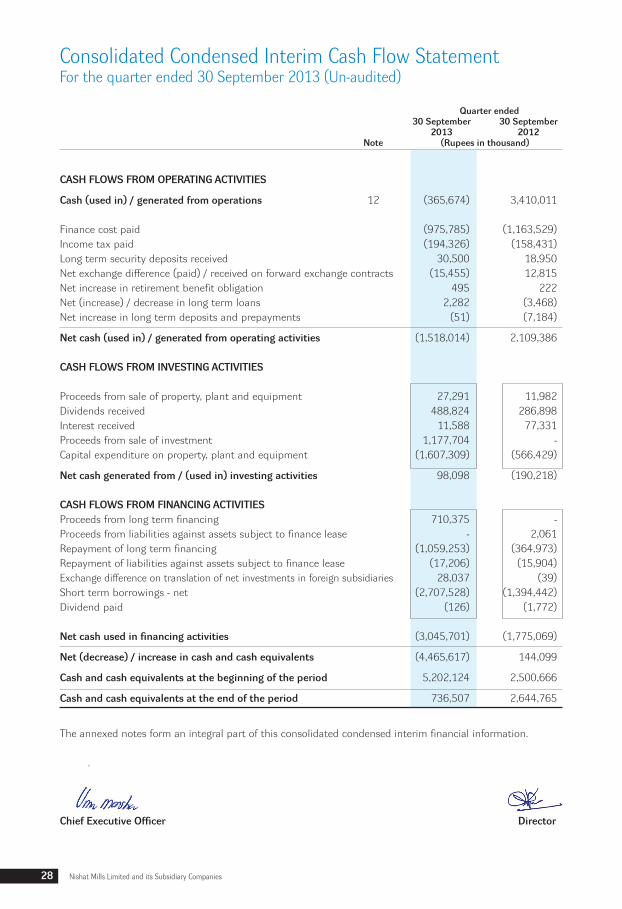
Consolidated Condensed Interim Cash Flow StatementFor the quarter ended 30 September 2013 (Un-audited)
Quarter ended 30 September 30 September 2013 2012 Note (Rupees in thousand)
CASH FLOWS FROM OPERATING ACTIVITIES
Cash (used in) / generated from operations 12 (365,674) 3,410,011
Finance cost paid (975,785) (1,163,529)Income tax paid (194,326) (158,431)Long term security deposits received 30,500 18,950 Net exchange difference (paid) / received on forward exchange contracts (15,455) 12,815 Net increase in retirement benefit obligation 495 222 Net (increase) / decrease in long term loans 2,282 (3,468)Net increase in long term deposits and prepayments (51) (7,184)
Net cash (used in) / generated from operating activities (1,518,014) 2,109,386 CASH FLOWS FROM INVESTING ACTIVITIES Proceeds from sale of property, plant and equipment 27,291 11,982 Dividends received 488,824 286,898 Interest received 11,588 77,331 Proceeds from sale of investment 1,177,704 - Capital expenditure on property, plant and equipment (1,607,309) (566,429)
Net cash generated from / (used in) investing activities 98,098 (190,218) CASH FLOWS FROM FINANCING ACTIVITIES Proceeds from long term financing 710,375 - Proceeds from liabilities against assets subject to finance lease - 2,061 Repayment of long term financing (1,059,253) (364,973)Repayment of liabilities against assets subject to finance lease (17,206) (15,904)Exchange difference on translation of net investments in foreign subsidiaries 28,037 (39)Short term borrowings - net (2,707,528) (1,394,442)Dividend paid (126) (1,772)
Net cash used in financing activities (3,045,701) (1,775,069)
Net (decrease) / increase in cash and cash equivalents (4,465,617) 144,099
Cash and cash equivalents at the beginning of the period 5,202,124 2,500,666
Cash and cash equivalents at the end of the period 736,507 2,644,765
The annexed notes form an integral part of this consolidated condensed interim financial information. .
DirectorChief Executive Officer

29Consolidated Condensed Interim Financial Information
for the quarter ended 30 September 2013
Consolidated Condensed Interim Statement of Changes in EquityFor the quarter ended 30 September 2013 (Un-audited)
Ba
lance
as at
30 Ju
ne 20
12- (
audi
ted)
3
,515,9
99
5,49
9,530
5
,287,2
98
3,49
0
111
,002
10
,901,3
20
30,9
04,88
2
4,38
1,306
3
5,286
,188
4
6,187
,508
4
9,703
,507
3
,516,0
83
53,2
19,59
0
Pr
ofit
for t
he p
erio
d -
-
-
-
-
-
-
1
,954,8
04
1,95
4,804
1
,954,8
04
1,95
4,804
2
49,39
3
2,20
4,197
Othe
r com
preh
ensiv
e in
com
e fo
r the
per
iod
-
-
2,05
4,126
1
12
-
2,05
4,238
-
-
-
2
,054,2
38
2,05
4,238
-
2
,054,2
38
To
tal c
ompr
ehen
sive
inco
me
for t
he p
erio
d
-
-
2,05
4,126
1
12
-
2,054
,238
-
1
,954,8
04
1,95
4,804
4
,009,0
42
4,00
9,042
2
49,39
3
4,25
8,435
Balan
ce as
at 30
Sept
embe
r 201
2- (u
n-au
dite
d)
3,51
5,999
5
,499,5
30
7,34
1,424
3
,602
1
11,00
2
12,9
55,55
8
30,9
04,88
2
6,33
6,110
3
7,240
,992
5
0,196
,550
5
3,712
,549
3
,765,4
76
57,4
78,02
5
Tr
ansa
ctio
n w
ith o
wne
rs- F
inal
divi
dend
for
t
he ye
ar e
nded
30
June
201
2 @
Rup
ees 3
.50
per s
hare
-
-
-
-
-
-
-
(1
,230,5
99)
(1,23
0,599
) (1
,230,5
99)
(1,23
0,599
) -
(1
,230,5
99)
Tr
ansf
erre
d to
gen
eral
rese
rve
-
-
-
-
-
-
3,00
5,000
(3
,005,0
00)
-
-
-
-
-
Tran
sact
ion
with
ow
ners
- Divi
dend
rela
ting
t
o 20
12 p
aid to
non
-con
trollin
g in
tere
st
-
-
-
-
-
-
-
-
-
-
-
(346
,910)
(3
46,91
0)
Prof
it fo
r the
per
iod
-
-
-
-
-
-
-
6,57
8,605
6
,578,6
05
6,57
8,605
6
,578,6
05
1,09
2,646
7
,671,2
51
Ot
her c
ompr
ehen
sive
inco
me
for t
he p
erio
d -
-
9
,541,9
14
(13,6
29)
-
9,528
,285
-
-
-
9
,528,2
85
9,52
8,285
-
9
,528,2
85
To
tal c
ompr
ehen
sive
inco
me
for t
he p
erio
d
-
-
9,54
1,914
(1
3,629
) -
9
,528,2
85
-
6,57
8,605
6
,578,6
05
16,1
06,89
0
16,1
06,89
0
1,09
2,646
1
7,199
,536
Ba
lance
as at
30 Ju
ne 20
13- (
audi
ted)
3
,515,9
99
5,49
9,530
1
6,883
,338
(1
0,027
) 1
11,00
2
22,48
3,843
3
3,909
,882
8
,679,1
16
42,5
88,99
8
65,0
72,84
1
68,5
88,84
0
4,51
1,212
7
3,100
,052
Pr
ofit
for t
he p
erio
d -
-
-
-
-
-
-
1,92
5,096
1
,925,0
96
1,92
5,096
1
,925,0
96
265
,324
2
,190,4
20
Ot
her c
ompr
ehen
sive
inco
me
for t
he p
erio
d -
-
2
,053,3
94
27,6
32
-
2,08
1,026
-
-
-
2
,081,0
26
2,08
1,026
-
2
,081,0
26
To
tal c
ompr
ehen
sive
inco
me
for t
he p
erio
d
-
-
2,05
3,394
2
7,632
-
2
,081,0
26
-
1,92
5,096
1
,925,0
96
4,00
6,122
4
,006,1
22
265
,324
4
,271,4
46
Ba
lance
as at
30 Se
ptem
ber 2
013-
(un-
audi
ted)
3
,515,9
99
5,49
9,530
1
8,936
,732
1
7,605
1
11,00
2
24,56
4,869
3
3,909
,882
1
0,604
,212
4
4,514
,094
6
9,078
,963
7
2,594
,962
4
,776,5
36
77,3
71,49
8
Th
e an
nexe
d no
tes
form
an
inte
gral
par
t of t
his
cons
olid
ated
con
dens
ed in
terim
fina
ncia
l inf
orm
atio
n.
Attri
buta
ble t
o equ
ity h
older
s of t
he h
oldin
g com
pany
(Rup
ees
in th
ousa
nd)
Capi
tal r
eser
ves
Reve
nue r
eser
ves
Shar
e ca
pita
lFa
ir va
lue
rese
rve
Tota
lre
serv
es
Tota
l eq
uity
Gene
ral
rese
rve
Unap
propri
ated
profi
tPr
emiu
m on
issue
ofrig
ht sh
ares
Share
holde
rs’eq
uity
Non-
cont
rollin
gin
tere
stCa
pita
lre
dem
ption
rese
rve f
und
Sub
tota
lSu
b to
tal
Exch
ange
trans
lation
rese
rve
Dire
ctor
Chie
f Exe
cutiv
e O
ffice
r

30 Nishat Mills Limited and its Subsidiary Companies
1 THE GROUP AND ITS OPERATIONS
The Group consists of: Holding Company
- Nishat Mills Limited Subsidiary Companies
-Nishat Power Limited -Nishat Linen (Private) Limited -Nishat Hospitality (Private) Limited -Nishat USA, Inc. -Nishat Linen Trading L.L.C -Nishat International FZE NISHAT MILLS LIMITED Nishat Mills Limited is a public limited Company incorporated in Pakistan under the Companies Act,
1913 (now Companies Ordinance, 1984) and listed on all Stock Exchanges in Pakistan. Its registered office is situated at 53-A, Lawrence Road, Lahore. The Company is engaged in the business of textile manufacturing and of spinning, combing, weaving, bleaching, dyeing, printing, stitching, apparel, buying, selling and otherwise dealing in yarn, linen, cloth and other goods and fabrics made from raw cotton, synthetic fibre and cloth and to generate, accumulate, distribute, supply and sell electricity.
NISHAT POWER LIMITED
Nishat Power Limited is a public limited Company incorporated in Pakistan under the Companies Ordinance, 1984 and listed on Karachi Stock Exchange Limited and Lahore Stock Exchange Limited in Pakistan. The Company is a subsidiary of Nishat Mills Limited. The principal activity of the Company is to build, own, operate and maintain a fuel fired power station having gross capacity of 200 MW ISO in Jamber Kalan, Tehsil Pattoki, District Kasur, Punjab, Pakistan. Its registered office is situated at 53-A, Lawrence Road, Lahore.
NISHAT LINEN (PRIVATE) LIMITED
Nishat Linen (Private) Limited, a wholly owned subsidiary of Nishat Mills Limited, is a private limited company incorporated in Pakistan under the Companies Ordinance, 1984 on 15 March 2011. The registered office of Nishat Linen (Private) Limited is situated at 3-Yahya Block Nishatabad, Faisalabad. The principal objects of the Company are to operate retail outlets for sale of textile and other products and to manufacture and to sale the textile products by processing the textile goods in own or outside manufacturing facility.
NISHAT HOSPITALITY (PRIVATE) LIMITED
Nishat Hospitality (Private) Limited, a wholly owned subsidiary of Nishat Mills Limited, is a private limited company incorporated in Pakistan under the Companies Ordinance, 1984 on 01 July 2011. The registered office of Nishat Hospitality (Private) Limited is situated at 1-B Aziz Avenue, Canal Bank, Gulberg-V, Lahore. The principal activity of the Company is to carry on the business of hotels, cafes, restaurants and lodging or apartment houses, bakers and confectioners in Pakistan and outside Pakistan.
NISHAT USA, INC. Nishat USA, Inc. is a foreign subsidiary incorporated under the Business Corporation Laws of the State
of New York. The registered office of Nishat USA, Inc. is situated at 676 Broadway, New York, NY 10012, U.S.A. The principal business of the Subsidiary Company is to provide marketing services to Nishat Mills Limited - Holding Company. Nishat Mills Limited acquired 100% shareholding of Nishat USA, Inc. on 01 October 2008.
Selected Notes to the Consolidated Condensed Interim Financial InformationFor the quarter ended 30 September 2013 (Un-audited)
31Consolidated Condensed Interim Financial Information
for the quarter ended 30 September 2013
NISHAT LINEN TRADING L.L.C
Nishat Linen Trading L.L.C is a limited liability company formed in pursuance to statutory provisions of the United Arab Emirates (UAE) Federal Law No. (8) of 1984 as amended and registered with the Department of Economic Development, Government of Dubai. Nishat Linen Trading L.L.C is a subsidiary of Nishat Mills Limited as Nishat Mills Limited, through the powers given to it under Article 11 of the Memorandum of Association, exercise full control on the management of Nishat Linen Trading L.L.C. Date of incorporation of the Company was 29 December 2010. The registered office of Nishat Linen Trading L.L.C is situated at P.O. Box 28189 Dubai, UAE. The principal business of the Company is to operate retail outlets in UAE for sale of textile and related products.
NISHAT INTERNATIONAL FZE
Nishat International FZE is incorporated as free zone establishment with limited liability in accordance with the Law No: 9 of 1992 and Licensed by the Registrar of Jabel Ali Free Zone Authority. Nishat International FZE is a wholly owned subsidiary of Nishat Mills Limited. Date of incorporation of the Company was 07 February 2013. The registered office of Nishat International FZE is situated at P.O. Box 114622, Jabel Ali Free Zone, Dubai. The principal business of the Company is trading in textile and related products.
2 BASIS OF PREPARATION
This consolidated condensed interim financial information is un-audited and is being submitted to shareholders as required by section 245 of the Companies Ordinance, 1984 and the listing regulations of the Islamabad, Karachi and Lahore stock exchanges. This consolidated condensed interim financial information has been prepared in accordance with the requirements of International Accounting Standard-34 “Interim Financial Reporting” and provisions of and directives issued under the Companies Ordinance, 1984. In case where requirements differ, the provisions of and directives issued under the Companies Ordinance, 1984 have been followed. This consolidated condensed interim financial information should be read in conjunction with the preceding audited annual published consolidated financial statements of the Group for the year ended 30 June 2013.
3 ACCOUNTING POLICIES
The accounting policies and methods of computations adopted for the preparation of this consolidated condensed interim financial information are the same as applied in the preparation of preceding audited annual published consolidated financial statements of the Group for the year ended 30 June 2013.
4 CONSOLIDATION
a) Subsidiaries
Subsidiaries are those entities in which Holding Company directly or indirectly controls, beneficially owns or holds more than 50% of the voting securities or otherwise has power to elect and appoint more than 50% of its directors. The condensed interim financial information of the subsidiary companies is included in this consolidated condensed interim financial information from the date control commences until the date that control ceases.
The assets and liabilities of Subsidiary Companies have been consolidated on a line by line basis and
carrying value of investments held by the Holding Company is eliminated against Holding Company’s share in paid up capital of the Subsidiary Companies.
Intragroup balances and transactions have been eliminated. Non-controlling interests are that part of net results of the operations and of net assets of Subsidiary
Companies attributable to interest which are not owned by the Holding Company. Non-controlling interests are presented as separate item in this consolidated condensed interim financial information.
32 Nishat Mills Limited and its Subsidiary Companies
b ) Associates
Associates are the entities over which the Group has significant influence but not control, generally accompanying a shareholding of between 20% and 50% of the voting rights. Investments in these associates are accounted for using the equity method of accounting and are initially recognized at cost. The Group’s investment in associate includes goodwill identified on acquisition, net of any accumulated impairment loss, if any.
The Group’s share of its associate’s post-acquisition profits or losses, movement in other comprehensive
income, and its share of post-acquisition movements in reserves is recognized in the consolidated profit and loss account, consolidated statement of comprehensive income and reserves respectively. The cumulative post-acquisition movements are adjusted against the carrying amount of the investment. Distributions received from an associate reduce the carrying amount of the investment.
5 CRITICAL ACCOUNTING ESTIMATES AND JUDGEMENTS
The preparation of this consolidated condensed interim financial information in conformity with the approved accounting standards requires the use of certain critical accounting estimates. It also requires the management to exercise its judgment in the process of applying accounting policies. Estimates and judgments are continually evaluated and are based on historical experience and other factors, including expectations of future events that are believed to be reasonable under the circumstances.
During preparation of this consolidated condensed interim financial information, the significant judgments
made by the management in applying the accounting policies and the key sources of estimation and uncertainty were the same as those that applied in the preceding audited annual published consolidated financial statements of the Group for the year ended 30 June 2013.
Selected Notes to the Consolidated Condensed Interim Financial InformationFor the quarter ended 30 September 2013 (Un-audited)
Un-audited Audited 30 September 30 June 2013 2013 (Rupees in thousand)
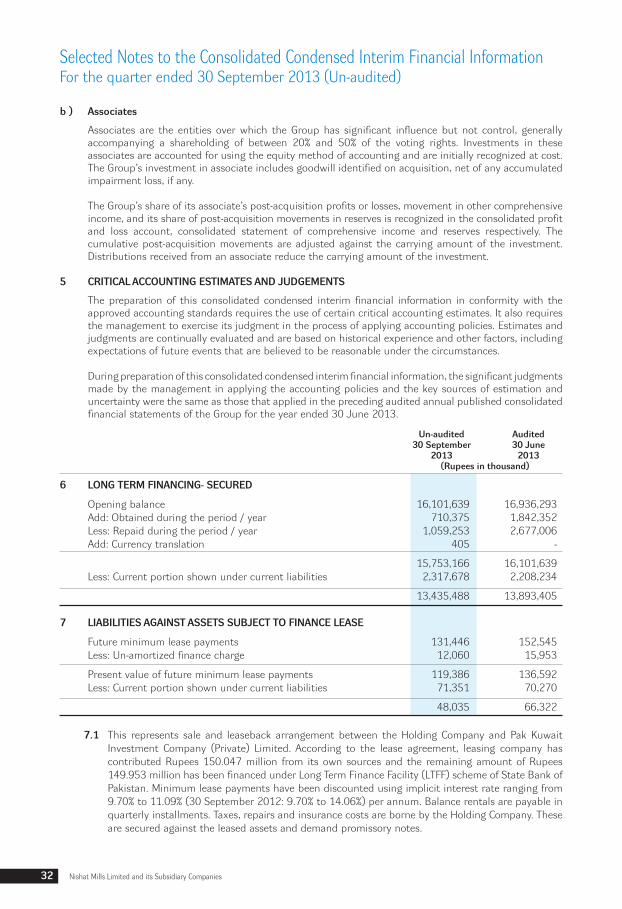
6 LONG TERM FINANCING- SECURED
Opening balance 16,101,639 16,936,293 Add: Obtained during the period / year 710,375 1,842,352 Less: Repaid during the period / year 1,059,253 2,677,006 Add: Currency translation 405 -
15,753,166 16,101,639 Less: Current portion shown under current liabilities 2,317,678 2,208,234
13,435,488 13,893,405
7 LIABILITIES AGAINST ASSETS SUBJECT TO FINANCE LEASE
Future minimum lease payments 131,446 152,545 Less: Un-amortized finance charge 12,060 15,953
Present value of future minimum lease payments 119,386 136,592 Less: Current portion shown under current liabilities 71,351 70,270
48,035 66,322
7.1 This represents sale and leaseback arrangement between the Holding Company and Pak Kuwait Investment Company (Private) Limited. According to the lease agreement, leasing company has contributed Rupees 150.047 million from its own sources and the remaining amount of Rupees 149.953 million has been financed under Long Term Finance Facility (LTFF) scheme of State Bank of Pakistan. Minimum lease payments have been discounted using implicit interest rate ranging from 9.70% to 11.09% (30 September 2012: 9.70% to 14.06%) per annum. Balance rentals are payable in quarterly installments. Taxes, repairs and insurance costs are borne by the Holding Company. These are secured against the leased assets and demand promissory notes.

33Consolidated Condensed Interim Financial Information
for the quarter ended 30 September 2013
8 CONTINGENCIES AND COMMITMENTS
a) Contingencies
i) Nishat Mills Limited - Holding Company is contingently liable for Rupees 0.631 million (30 June 2013: Rupees 0.631 million) on account of central excise duty not acknowledged as debt as the cases are pending before Court.
ii) Guarantees of Rupees 642.661 million (30 June 2013: Rupees 635.607 million) are given
by the banks of the Nishat Mills Limited - Holding Company to Sui Northern Gas Pipelines Limited against gas connections, Shell Pakistan Limited and Pakistan State Oil Limited against purchase of furnace oil, Director Excise and Taxation, Karachi against infrastructure cess and Pakistan Army against fulfillment of sales order.
iii) Post dated cheques of Rupees 1,691.822 million (30 June 2013: Rupees 1,816.775 million)
are issued by the Nishat Mills Limited - Holding Company to customs authorities in respect of duties on imported items availed on the basis of consumption and export plans. If documents of exports are not provided on due dates, cheques issued as security shall be encashable.
iv) Holding Company’s share in contingencies of associated companies’ accounted for under
equity method is Rupees 1,884 million (30 June 2013: Rupees 1,929 million). v) National Electric Power Regulatory Authority (NEPRA) issued an order dated 8 February
2013 to Nishat Power Limited - Subsidiary Company through which it has raised a demand of Rupees 290.423 million payable by the Subsidiary Company to National Transmission and Dispatch Company Limited (NTDCL) for the period upto 30 June 2011 in respect of Calorific Value (CV) adjustment on fuel consumed for power generation as per the terms of the Power Purchase Agreement (PPA) and various CV adjustment mechanisms prescribed by NEPRA. The first such CV adjustment mechanism was announced by NEPRA in March 2009 and as per this mechanism, the Subsidiary Company has already made a provision of Rupees 20.332 million in its financial statements for the above CV adjustment. In July 2011, NEPRA revised its CV adjustment mechanism and directed all IPPs to maintain consignment-wise CV record of the fuel received and consumed for power generation. Consequently, the Subsidiary Company started maintaining such CV record after such direction was received from NEPRA.
NEPRA directed the Subsidiary Company to submit consignment-wise record of CV for the
period upto 30 June 2011. The Subsidiary Company disputed such direction as it was not required to maintain consignment-wise record prior to July 2011. However, NEPRA computed retrospectively and determined Rupees 290.423 million payable by the Subsidiary Company to NTDCL for the period upto 30 June 2011 in respect of CV adjustment on the basis of the mechanism directed by it in July 2011. The Subsidiary Company filed a Motion for Leave for Review before NEPRA requesting it to reconsider its decision, which was decided against the Subsidiary Company. Consequently, the Subsidiary Company filed a writ petition before the Islamabad High Court against NEPRA’s decision on the grounds that change in CV adjustment mechanism in July 2011 cannot be applied retrospectively and credible information is also not available from any source upon which CV adjustment computations can be made. The case is pending adjudication before Islamabad High Court.
Based on the advice of the Subsidiary Company’s legal counsel, management of the
Subsidiary Company feels that there are meritorious grounds to support the Subsidiary Company’s stance and the aforesaid NEPRA’s decision is likely to be revoked. Under these circumstances, no provision of the balance amount of Rupees 270.092 million has been made in these consolidated financial statements.
vi) The bank of Nishat Power Limited - Subsidiary Company has issued an irrevocable standby
letter of credit on behalf of Subsidiary Company in favour of Wartsila Pakistan (Private) Limited for Rupees 45 million (30 June 2013: Rupees 45 million) as required under the terms of the Operation and Maintenance agreement.
34 Nishat Mills Limited and its Subsidiary Companies
Selected Notes to the Consolidated Condensed Interim Financial InformationFor the quarter ended 30 September 2013 (Un-audited)
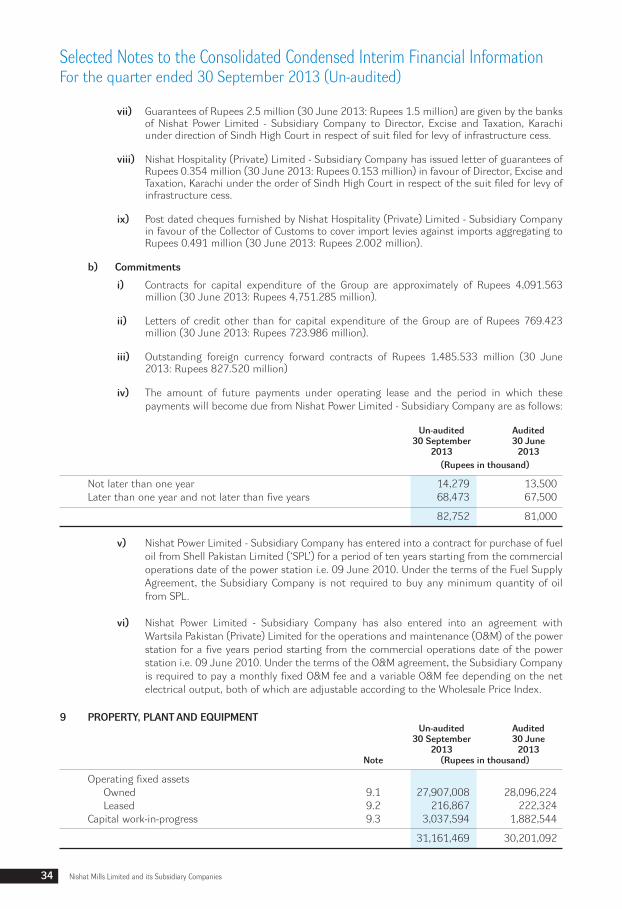
vii) Guarantees of Rupees 2.5 million (30 June 2013: Rupees 1.5 million) are given by the banks of Nishat Power Limited - Subsidiary Company to Director, Excise and Taxation, Karachi under direction of Sindh High Court in respect of suit filed for levy of infrastructure cess.
viii) Nishat Hospitality (Private) Limited - Subsidiary Company has issued letter of guarantees of
Rupees 0.354 million (30 June 2013: Rupees 0.153 million) in favour of Director, Excise and Taxation, Karachi under the order of Sindh High Court in respect of the suit filed for levy of infrastructure cess.
ix) Post dated cheques furnished by Nishat Hospitality (Private) Limited - Subsidiary Company
in favour of the Collector of Customs to cover import levies against imports aggregating to Rupees 0.491 million (30 June 2013: Rupees 2.002 million).
b) Commitments
i) Contracts for capital expenditure of the Group are approximately of Rupees 4,091.563 million (30 June 2013: Rupees 4,751.285 million).
ii) Letters of credit other than for capital expenditure of the Group are of Rupees 769.423
million (30 June 2013: Rupees 723.986 million). iii) Outstanding foreign currency forward contracts of Rupees 1,485.533 million (30 June
2013: Rupees 827.520 million) iv) The amount of future payments under operating lease and the period in which these
payments will become due from Nishat Power Limited - Subsidiary Company are as follows:
Un-audited Audited 30 September 30 June 2013 2013 (Rupees in thousand)
Not later than one year 14,279 13,500 Later than one year and not later than five years 68,473 67,500
82,752 81,000
v) Nishat Power Limited - Subsidiary Company has entered into a contract for purchase of fuel oil from Shell Pakistan Limited (‘SPL’) for a period of ten years starting from the commercial operations date of the power station i.e. 09 June 2010. Under the terms of the Fuel Supply Agreement, the Subsidiary Company is not required to buy any minimum quantity of oil from SPL.
vi) Nishat Power Limited - Subsidiary Company has also entered into an agreement with Wartsila Pakistan (Private) Limited for the operations and maintenance (O&M) of the power station for a five years period starting from the commercial operations date of the power station i.e. 09 June 2010. Under the terms of the O&M agreement, the Subsidiary Company is required to pay a monthly fixed O&M fee and a variable O&M fee depending on the net electrical output, both of which are adjustable according to the Wholesale Price Index.
9 PROPERTY, PLANT AND EQUIPMENT Un-audited Audited 30 September 30 June 2013 2013 Note (Rupees in thousand)
Operating fixed assets Owned 9.1 27,907,008 28,096,224 Leased 9.2 216,867 222,324 Capital work-in-progress 9.3 3,037,594 1,882,544
31,161,469 30,201,092

35Consolidated Condensed Interim Financial Information
for the quarter ended 30 September 2013
Un-audited Audited 30 September 30 June 2013 2013 Note (Rupees in thousand)
9.1 Operating fixed assets- Owned
Opening book value 28,096,224 27,187,410 Add: Cost of additions during the period / year 9.1.1 438,111 3,811,168
Less: Book value of deletions during the period / year 9.1.2 16,559 173,518 Less: Book value of assets transferred to investment properties during the year - 161,662
16,559 335,180
28,517,776 30,663,398
Less: Depreciation charged for the period / year 624,916 2,407,280 Less: Impairment charge - 162,601 Add: Currency translation 14,148 2,707
27,907,008 28,096,224
9.1.1 Cost of additions
Freehold land 31,329 257,461 Buildings on freehold land 8,199 872,570 Plant and machinery 343,231 2,459,082 Electric installations 3,880 11,582 Factory equipment 9,029 45,620 Furniture, fixtures and office equipment 5,579 30,194 Computer equipment 9,022 10,577 Vehicles 27,842 124,082
438,111 3,811,168 9.1.2 Book value of deletions
Plant and machinery 10,207 158,131 Electric installations - 562 Factory equipment - 3 Furniture, fixtures and office equipment - 134 Computer equipment 56 69 Vehicles 6,296 14,619
16,559 173,518
9.2 Operating fixed assets- Leased
Opening book value 222,324 246,378 Less: Depreciation charged during the period / year 5,457 24,054
216,867 222,324
9.3 Capital work-in-progress
Buildings on freehold land 1,063,733 726,231 Plant and machinery 1,730,995 1,025,001 Letters of credit against machinery 7,492 7,522 Advances against furniture and office equipment 654 - Advances against vehicles 18,448 5,167 Advances to contractors 208,165 114,613 Unallocated expenses 8,107 4,010
3,037,594 1,882,544

36 Nishat Mills Limited and its Subsidiary Companies
Selected Notes to the Consolidated Condensed Interim Financial InformationFor the quarter ended 30 September 2013 (Un-audited)
Quarter ended 30 September 30 September 2013 2012 (Rupees in thousand)
10 COST OF SALES
Raw material consumed 13,067,553 11,678,107 Processing charges 48,759 76,818 Salaries, wages and other benefits 834,152 737,593 Staff retirement benefits 23,051 19,778 Stores, spare parts and loose tools consumed 1,169,889 985,654 Packing materials consumed 210,912 213,096 Repair and maintenance 173,515 139,346 Fuel and power 1,275,785 1,118,966 Insurance 51,994 46,905 Other factory overheads 119,630 83,138 Depreciation 601,085 546,193
17,576,325 15,645,594 Work-in-process Opening stock 1,604,239 1,757,058 Closing stock (1,883,354) (1,614,305)
(279,115) 142,753
Cost of goods manufactured 17,297,210 15,788,347
Finished goods Opening stock 3,338,107 2,451,771 Closing stock (3,390,569) (3,001,721)
(52,462) (549,950)
17,244,748 15,238,397
Quarter ended 30 September 30 September 2013 2012
11 EARNINGS PER SHARE - BASIC AND DILUTED
There is no dilutive effect on the basic earnings per share which is based on:
Profit attributable to ordinary shareholders of Holding Company (Rupees in thousand) 1,925,096 1,954,804
Weighted average number of ordinary shares (Numbers) 351,599,848 351,599,848
Earnings per share (Rupees) 5.48 5.56
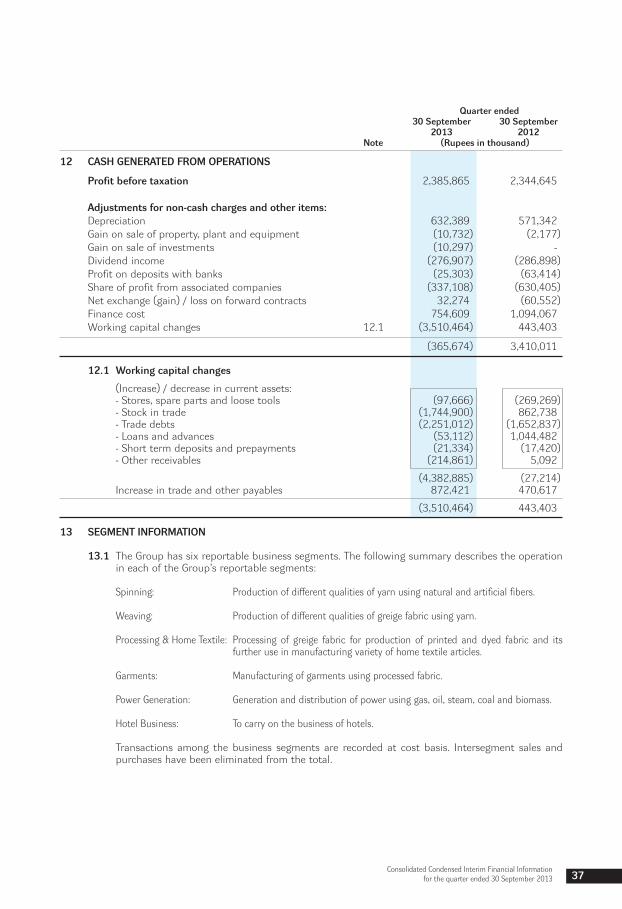
37Consolidated Condensed Interim Financial Information
for the quarter ended 30 September 2013
Quarter ended 30 September 30 September 2013 2012 Note (Rupees in thousand)
12 CASH GENERATED FROM OPERATIONS
Profit before taxation 2,385,865 2,344,645 Adjustments for non-cash charges and other items: Depreciation 632,389 571,342 Gain on sale of property, plant and equipment (10,732) (2,177) Gain on sale of investments (10,297) - Dividend income (276,907) (286,898) Profit on deposits with banks (25,303) (63,414) Share of profit from associated companies (337,108) (630,405) Net exchange (gain) / loss on forward contracts 32,274 (60,552) Finance cost 754,609 1,094,067 Working capital changes 12.1 (3,510,464) 443,403
(365,674) 3,410,011
12.1 Working capital changes
(Increase) / decrease in current assets: - Stores, spare parts and loose tools (97,666) (269,269) - Stock in trade (1,744,900) 862,738 - Trade debts (2,251,012) (1,652,837) - Loans and advances (53,112) 1,044,482 - Short term deposits and prepayments (21,334) (17,420) - Other receivables (214,861) 5,092
(4,382,885) (27,214) Increase in trade and other payables 872,421 470,617
(3,510,464) 443,403
13 SEGMENT INFORMATION
13.1 The Group has six reportable business segments. The following summary describes the operation in each of the Group’s reportable segments:
Spinning: Production of different qualities of yarn using natural and artificial fibers. Weaving: Production of different qualities of greige fabric using yarn. Processing & Home Textile: Processing of greige fabric for production of printed and dyed fabric and its
further use in manufacturing variety of home textile articles. Garments: Manufacturing of garments using processed fabric. Power Generation: Generation and distribution of power using gas, oil, steam, coal and biomass. Hotel Business: To carry on the business of hotels.
Transactions among the business segments are recorded at cost basis. Intersegment sales and purchases have been eliminated from the total.

38 Nishat Mills Limited and its Subsidiary Companies
Selected Notes to the Consolidated Condensed Interim Financial InformationFor the quarter ended 30 September 2013 (Un-audited)
Sales
Ex
tern
al
4,2
56,7
07
3,6
08,2
18
3,1
31,0
19
2,6
73,0
68
5,8
54,1
45
5,1
84,5
02
1,1
54,0
95
1,3
62,1
47
6,5
90,1
71
5,7
56,4
95
2,3
78
5,6
65
-
-
20,9
88,5
15
18,
590,
095
Inte
rseg
men
t 6
84,8
95
797
,507
1
,759
,171
1
,649
,663
2
32,0
75
194
,913
-
-
1
,301
,078
1
,069
,999
5
8
-
(3,9
77,2
77)
(3,7
12,0
82)
-
-
4
,941
,602
4
,405
,725
4
,890
,190
4
,322
,731
6
,086
,220
5
,379
,415
1
,154
,095
1
,362
,147
7
,891
,249
6
,826
,494
2
,436
5
,665
(3
,977
,277
) (3
,712
,082
) 2
0,98
8,51
5
18,5
90,0
95
Cost
of s
ales
(3
,993
,315
) (3
,740
,130
) (4
,334
,792
) (3
,926
,186
) (4
,976
,073
) (4
,561
,187
) (9
50,7
76)
(1,0
98,5
13)
(6,9
64,4
63)
(5,6
22,1
07)
(2,6
06)
(2,3
56)
3,9
77,2
77
3,7
12,0
82
(17,
244,
748)
(15
,238
,397
)
Gros
s pro
fit
948
,287
6
65,5
95
555
,398
3
96,5
45
1,1
10,1
47
818
,228
2
03,3
19
263
,634
9
26,7
86
1,2
04,3
87
(170
) 3
,309
-
-
3
,743
,767
3
,351
,698
Di
strib
utio
n co
st
(113
,359
) (8
2,47
2)
(151
,975
) (1
38,8
45)
(465
,079
) (3
54,8
72)
(74,
946)
(9
4,91
3)
(1,5
85)
(555
) -
-
-
-
(8
06,9
44)
(671
,657
)Ad
min
istra
tive
expe
nses
(6
8,49
2)
(58,
217)
(6
2,99
3)
(48,
639)
(1
48,7
93)
(101
,493
) (2
0,85
3)
(18,
244)
(4
2,12
5)
(36,
549)
(2
,198
) (7
74)
-
-
(345
,454
) (2
63,9
16)
(1
81,8
51)
(140
,689
) (2
14,9
68)
(187
,484
) (6
13,8
72)
(456
,365
) (9
5,79
9)
(113
,157
) (4
3,71
0)
(37,
104)
(2
,198
) (7
74)
-
-
(1,1
52,3
98)
(935
,573
) Pr
ofit b
efor
e ta
xatio
n an
d
unal
loca
ted
inco
me
and
expe
nses
7
66,4
36
524
,906
3
40,4
30
209
,061
4
96,2
75
361
,863
1
07,5
20
150
,477
8
83,0
76
1,1
67,2
83
(2,3
68)
2,5
35
-
-
2,5
91,3
69
2,4
16,1
25
Unal
loca
ted
inco
me
and
expe
nses
:
Othe
r exp
ense
s
(1
55,7
41)
(65,
004)
Othe
r inc
ome
367
,738
4
57,1
86
Fina
nce
cost
(7
54,6
09)
(1,0
94,0
67)
Shar
e of
pro
fit fr
om a
ssoc
iate
d co
mpa
nies
3
37,1
08
630
,405
Ta
xatio
n
(1
95,4
45)
(140
,448
)
Profi
t afte
r tax
atio
n
2
,190
,420
2
,204
,197
13.2
13.3
Re
conc
iliat
ion
of re
port
able
seg
men
t ass
ets
Tota
l ass
ets f
or re
port
able
segm
ents
10
,588
,918
1
0,60
9,89
2
6,9
32,3
46
6,2
44,7
41
14,
847,
671
13
,413
,578
2
,295
,913
2
,076
,043
2
7,71
5,75
3
25,0
20,9
52
738
,195
5
02,6
98
63,
118,
796
57
,867
,904
Un
allo
cate
d as
sets
: Lo
ng te
rm in
vest
men
ts
43,
688,
452
41
,418
,080
Ot
her r
eceiv
ables
1
,480
,757
1
,265
,896
Ca
sh a
nd b
ank
bala
nces
7
36,5
07
5,2
02,1
24
Othe
r cor
pora
te a
sset
s
4
,593
,122
5
,771
,037
To
tal a
sset
s as p
er b
alan
ce sh
eet
113,
617,
634
111
,525
,041
Spin
ning
W
eavin
g Pr
oces
sing &
Ga
rmen
ts Po
wer G
ener
ation
Ho
tel
Elim
inat
ion of
inte
r-
Tota
l- Gro
up
Ho
me T
extil
e
segm
ent t
rans
actio
ns
Quar
ter e
nded
Qu
arte
r end
ed
Quar
ter e
nded
Qu
arte
r end
ed
Quar
ter e
nded
Qu
arte
r end
ed
Quar
ter e
nded
Qu
arte
r end
ed
Sep
2013
Se
p 20
12
Sep
2013
Se
p 20
12
Sep
2013
Se
p 20
12
Sep
2013
Se
p 20
12
Sep
2013
Se
p 20
12
Sep
2013
Se
p 20
12
Sep
2013
Se
p 20
12
Sep
2013
Se
p 20
12
(Rup
ees i
n th
ousa
nd)
Sp
inni
ng
Wea
ving
Proc
essin
g &
Garm
ents
Powe
r Gen
erat
ion
Hote
l To
tal- G
roup
Ho
me T
extil
e
Un-au
dite
d Au
dite
d U
n-au
dite
d Au
dite
d Un
-audi
ted
Audi
ted
Un-au
dite
d Au
dite
d Un
-audi
ted
Audi
ted
Un-au
dite
d Au
dite
d Un
-audi
ted
Audi
ted
Sep
2013
Ju
n 20
13
Sep
2013
Ju
n 20
13
Sep
2013
Ju
n 20
13
Sep
2013
Ju
n 20
13
Sep
2013
Ju
n 20
13
Sep
2013
Ju
n 20
13
Sep
2013
Ju
n 20
13
(Rup
ees i
n th
ousa
nd)
(Un-
audi
ted)

39Consolidated Condensed Interim Financial Information
for the quarter ended 30 September 2013
14 TRANSACTIONS WITH RELATED PARTIES
The related parties comprise associated undertakings, other related companies and key management personnel. The Group in the normal course of business management carries out transactions with various related parties. Detail of transactions with related parties are as follows:
Quarter ended 30 September 30 September 2013 2012 (Rupees in thousand)
i) Transactions
Associated companies
Purchase of goods and services 34,315 3,176 Sale of goods and services 441 63 Rental income 317 53 Sale of operating fixed assets 1,475 1,327 Insurance premium paid 102,214 44,919 Insurance claim received 8,687 4,291 Profit on term deposit receipt - 7,980 Subscription paid - 1,250
Other related parties
Purchase of goods and services 25,065 4,954 Sale of goods and services 4,839 25,845 Group’s contribution to provident fund trust 34,658 28,815 Remuneration paid to Chief Executive Officer, Directors and Executives of the Holding Company 182,954 123,469
ii) Period end balances As at 30 September 2013
Associated Other related Total companies parties (Rupees in thousand)
Trade and other payables 50,516 3,613 54,129 Long term loans - 76,016 76,016 Trade debts 375 - 375 Loans and advances - 28,437 28,437 Cash and bank balances 4,541 - 4,541
As at 30 June 2013 (Audited)
Associated Other related Total companies parties (Rupees in thousand)
Trade and other payables 38,725 11 38,736 Long term loans - 77,096 77,096 Trade debts 201 - 201 Loans and advances - 28,792 28,792 Cash and bank balances 3,720,101 - 3,720,101
40 Nishat Mills Limited and its Subsidiary Companies
Selected Notes to the Consolidated Condensed Interim Financial InformationFor the quarter ended 30 September 2013 (Un-audited)
15 FINANCIAL RISK MANAGEMENT
The Group’s financial risk management objectives and policies are consistent with those disclosed in the preceding audited annual published consolidated financial statements of the Group for the year ended 30 June 2013.
16 DATE OF AUTHORIZATION FOR ISSUE
This consolidated condensed interim financial information was approved by the Board of Directors and authorized for issue on 29 October 2013.
17 CORRESPONDING FIGURES
Corresponding figures have been re-arranged, wherever necessary, for the purpose of comparison. However, no significant re-arrangement has been made.
18 GENERAL
Figures have been rounded off to the nearest thousand of Rupees unless otherwise stated.
DirectorChief Executive Officer