Normal and shear forces in the contact patch of a braked racing tyre Part 1: Results from a Finite Element model
Patrick Gruber*, Robin S Sharp, and Andrew D Crocombe Division of Mechanical, Medical, and Aerospace Engineering, Faculty of Engineering and Physical Sciences, University of Surrey, Guildford, United Kingdom *Corresponding author: Division of Mechanical, Medical, and Aerospace Engineering (A1), Faculty of Engineering and Physical Sciences, University of Surrey, Guildford, GU2 7XH, UK. email: [email protected] This is a preprint of an article whose final and definitive form has been published in Vehicle System Dynamics © 2012, copyright Taylor & Francis; Vehicle System Dynamics is available online at: www.tandfonline.com/10.1080/00423114.2011.586428.

1
Normal and shear forces in the contact patch of a braked racing tyre Part 1: Results from a Finite Element model
In this first part of a two-part article, a previously-described and validated finite-element model of a racing-car tyre is developed further to yield detailed information on carcass deflections and contact pressure and shear stress distributions for a steady-rolling, slipping and cambered tyre. Variations in running conditions simulated include loads of 1500, 3000 and 4500 N, camber angles of 0° and -3°, and longitudinal slips from 0 to -20%. Special attention is paid to heavy braking, in which context the aligning moment is of great interest. Results generated are in broad agreement with limited experimental results from the literature and they provide considerable insight into how the tyre deforms and how the contact stresses are distributed as functions of the running conditions. Generally, each rib of the tyre behaves differently from the others, especially when the wheel is cambered. The results form a basis for the development of a simpler physical tyre model, the purpose of which is to retain accuracy over the full operating range while demanding much less computational resource. The physical tyre model is the topic of the second part of the article.
Keywords: finite element, steady-state rolling, rolling radius, shear forces, contact patch, racing tyre
1. Introduction Modern radial tyres consist of several rubber compounds and reinforcement layers, forming a
highly anisotropic composite structure. On a running car, this complex ply system generates a
network of deformations which influence the distribution of the contact stresses at the
tread-road interface and, thus, the force generation capability of the whole tyre. A better
understanding of these contact patch characteristics is therefore key to enhancing knowledge
about the rolling behaviour of tyres. In connection with racing, insights into the
characteristics of the contact stress distribution are of particular interest as they are intimately
connected with the controllability and, hence, the performance of the entire vehicle.
For this study, a racing tyre is examined under one of the most severe operating
conditions – that is, heavy braking in a straight line. By making detailed observations of the
deformations and stresses, a braking manoeuvre allows valuable insights into many details of
a rolling tyre, ranging from complex interactions between structural characteristics and
contact stresses to overall tyre force and moment characteristics. For this kind of
investigation two main test methods are possible – experimental testing and virtual testing. In
2
practice, if the experimental tests are performed, many problems arise, as local measurements
on a rolling tyre are intricate and difficult. With virtual testing, the experimental difficulties
are avoided, but they are replaced by the need for a model that accurately replicates the
behaviour of the real tyre. Using the finite element (FE) method, the construction of such a
model was the subject of previous research. The created and validated full three-dimensional
FE model is described in detail in [1]. In line with current research in the field of tyre
simulations (e.g., [2, 3]), this virtual tyre is developed further for the work here, which
involves numerical tests of a braked tyre at different vertical loads, wheel camber angles and
longitudinal slip ratios. In contrast to the work of earlier researchers, the obtained results are
analysed and presented in novel ways, yielding new insights into tyre behaviour. Also,
numerical limitations of virtual testing of a rolling tyre are discussed.
Insights from this study form a basis for the development of a simpler physical tyre
model that retains accuracy over the full operating range while reducing computational
demand. The physical tyre model is the topic of the second part of the article.
2. Model setup This investigation makes use of the previously-described and validated full three-dimensional
FE model of a racing tyre (Figure 1). Results from the previous research on static stiffness
properties demonstrate that the virtual tyre captures real tyre behaviour in great detail. Close
examination of the contact patch allowed identification of complex interactions between the
deflection characteristics of the carcass and the shear stress distribution. In particular, at low
friction levels the racing tyre exhibits lateral sliding at the tread-road interface which leads to
“waisting” of the contact region.
As will be discussed below, the previously-described FE model is further developed
to allow simulation of steady-state rolling motion. All simulations are conducted with the
implicit commercial code Abaqus/Standard V6.7 (Dassault Systèmes, Paris, France). Within

3
the following discussion, the right-hand orthogonal ISO axis system is employed [4]. The
origin of this system is in the centre of the contact patch, which is defined as the intersection
of the wheel centre plane with the vertical projection of the wheel spin axis onto the road
plane. The x-axis is the intersection of the wheel centre plane with the road plane with a
positive direction taken for the tyre moving forward. The z-axis is perpendicular to the road
surface and points upwards. The y-axis is determined by the right-hand rule.
2.1. Overview of virtual testing The rolling motion of the tyre is simulated with the ‘Steady–State–Transport’ (SST)
capability of Abaqus, which employs a mixed Lagrangian-Eulerian simulation technique [5].
With this method, the reference frame for the mesh is fixed and the movement of the tyre is
simulated by transporting the material through the mesh. As a result, local mesh refinement in
the area of interest, i.e. the contact zone, is possible and the mesh of the virtual tyre model of
the previous work [1] can be used here.
The steady-state braking analysis is started from an inflated tyre that is mounted on a
rigid rim and pressed against a rigid, smooth surface at a selected normal load. The rolling
condition of the virtual tyre is set up and controlled by specifying a rotational speed and a
travelling ground velocity for the tyre-wheel assembly. Consequently, a braking simulation is
obtained when the product of the rolling radius (re) and the angular velocity of the tyre (Ω) is
smaller than the longitudinal travelling ground speed (VX). Under this condition a negative
longitudinal wheel slip arises (κ), which is given by [6]:
X e
X
V r
Vκ − Ω
= − (1)
where: re: rolling radius (see equation (2)) Ω: angular velocity of the tyre VX: longitudinal velocity of the tyre
4
The zero slip condition is reached when no longitudinal force is generated by the tyre.
Also, under this free-rolling condition, the rolling radius of the tyre can be calculated from:
0
Xe
Vr =
Ω (2)
where: Ω0: angular velocity of the free-rolling tyre
2.2. Model boundaries The FE model comprises two contact boundaries: first, the interface between the tyre and the
wheel rim, and, second, the interface between the tyre tread and the ground surface. The first
boundary remains unchanged from the previous work [1], that is, a constant friction
coefficient of 0.5 is used between the tyre and the rim surfaces. This friction coefficient value
was found to be suitable for the rolling analyses as only localised sliding between the two
surfaces (which does not affect the results obtained) was found to occur. The second contact
boundary is altered; instead of a constant friction coefficient an extended friction formulation
is employed to capture the fundamental tread-road interaction mechanisms within the contact
patch of a rolling tyre. Rubber friction varies with compound, road surface properties,
temperature, contact pressure and sliding velocity. The first three of these five factors are
considered to be constant and, thus, are excluded from this study. In particular, the rubber
compound is assumed to maintain its properties during the brake manoeuvre (i.e., the
compound does not age) and the road is treated as a continuous, rigid and smooth track
surface. Temperature is disregarded as recent research suggests that the particular studied
simulation results (see section 4) obtained from an ideal brake manoeuvre conducted under
constant and repeatable steady-state conditions are not influenced by thermal variations.
Specifically, the work by Durand-Gasselin et al. [7] shows that the thermal dependency of
tyres is related to the temperature of the entire tread and the entire carcass, rather than local
temperature effects. In other words, when the temperature varies through usage, the carcass
stiffness properties and the contact patch friction properties change. However, the

5
relationship between the carcass and the tread rubber – the characteristics which are of
interest here – do not change. Hence, a friction formulation that considers separate pressure
and velocity influences is used here [8], i.e.:
( ) ( ) ( ),z g z gp V p Vµ µ µ= (3)
The influence of normal pressure is included by a pressure-dependent friction
coefficient term, µ(pz), which decreases to a minimum value with increasing pressure. The
corresponding equation reads:
( ) ( )( )1 2 3 4expz zp d d d d pµ = + (4)
where: pz: contact pressure d1 to d4 : empirical constants
The velocity influence on the friction coefficient is considered by the second term,
µ(Vg), which reduces to a minimum value with rising sliding speed. It is given by:
( ) ( ) ( )25 6 5exp 1g gV d d V dµ = − + − (5)
with Vg: sliding velocity d5 and d6 : empirical constants
The friction model (equation (3)) is implemented with the generalised contact model
built into Abaqus. To avoid friction-related convergence difficulties, Abaqus/Standard
approximates the condition of stick by permitting small relative sliding between the tread and
the ground surface before the shear stresses at the interface reach the maximum available
frictional shear stresses, τcrit , which are given by the product of the friction coefficient, µ,
(calculated with equation (3)) and the prevailing contact pressure, pz, (see Figure 3).
Thus, for the condition of no relative motion, a “sticking” friction is introduced which
approximates the shear stresses created at the tyre-road interface by:
eq gVτ λ= (6)
where Vg is the sliding velocity and λ is the “stick viscosity”, which is given by:

6
,
crit
g critV
τλ = (7)
where: τcrit = µ pz and Vg, crit is the maximum allowable viscous sliding velocity.
The allowable viscous sliding velocity Vg, crit, in turn, is defined as:
, 2g crit fV F r= Ω (8)
where Ff: slip tolerance; Ω: angular velocity of the tyre; r: radius of the tyre
Abaqus allows control of the approximation of the stick condition by specifying the
slip tolerance (STOL) value, Ff. As will be discussed below, the STOL setting has some
bearing on the slip characteristics of the virtual tyre.
2.3. Friction model setting To assess the impact of the relaxation of the stick condition on virtual test results, the
longitudinal force-slip characteristics obtained from steady-state rolling analyses conducted
with two different STOL values are examined. The default value of 0.005 is compared with a
more relaxed value of 0.02 which corresponds to values found in the literature (e.g., [5, 9]).
Also, to investigate only the influence of the STOL setting, the friction coefficient at the
tread-road interface is set at a low constant value of 1.0. The specific simulation setup for the
rolling analysis is described in section 3.1.
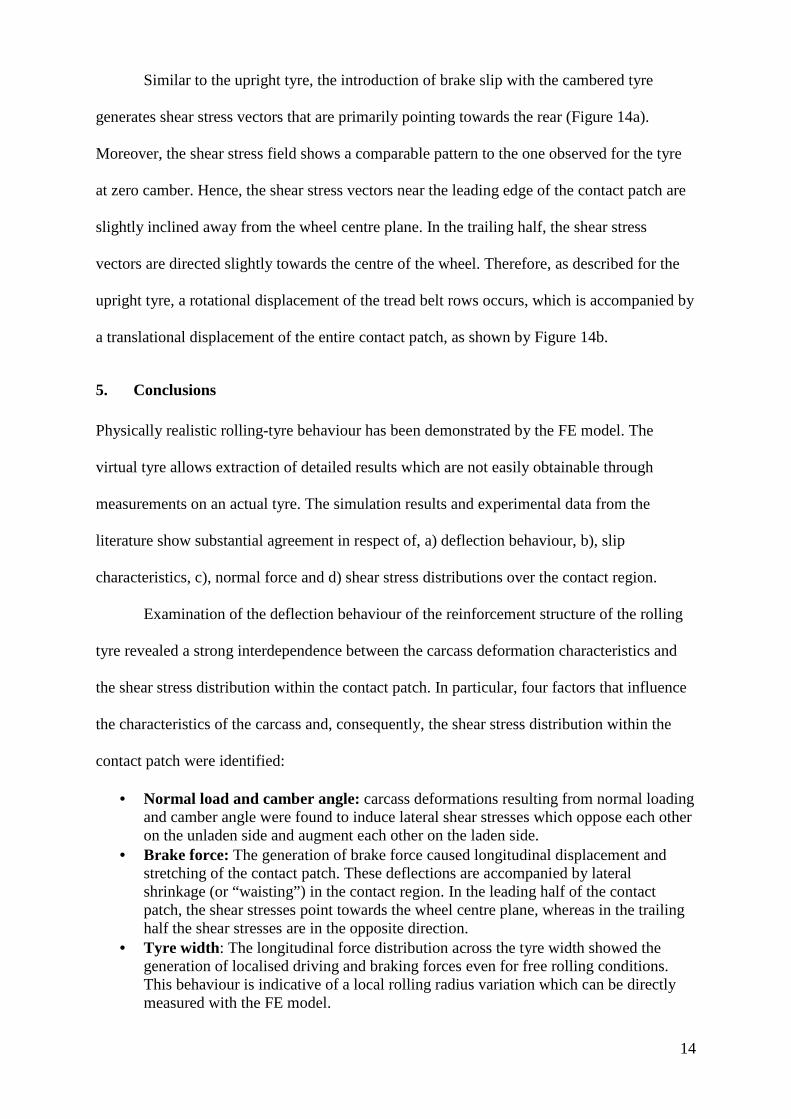
Results from this initial study (Figure 4) show that the relaxation of the stick
condition affects the slip characteristics of the virtual tyre. Owing to the nature of the
numerical approximation, the influence of the STOL setting is limited to low slip conditions
(0 to approximately -12%), when a significant part of the tyre contact patch adheres to the
ground. In particular, the rolling simulations set up with the default STOL value and normal
loads greater than 1500 N show complete convergence over a wide slip ratio range, however
experience numerical difficulties at about -2% and fail to converge for smaller brake slip ratio

7
values. With the relaxed friction model setting, a solution is found for all slip conditions, but
the approximation of the stick behaviour affects the slip curve characteristics. That is, the
virtual tyre with the higher STOL value requires a higher slip condition to generate the same
force as the model set up with the default value. As a consequence, the slip stiffness of the
tyre model varies with the friction model setting, i.e., higher STOL values lead to lower tyre
slip stiffnesses and vice versa. Moreover, as the tyre model is subjected to all possible brake
force states (although at different slip ratio values) irrespective of the STOL setting the
particular simulation results examined here (i.e., deflection behaviour of the reinforcement
structure) are unaffected.
In conclusion, the relaxation of the stick condition (STOL value of 0.02) is required to
run simulations successfully. The specific STOL setting has some bearing on the computed
slip stiffness of the tyres, but the specific results that are of interest here are valid and merit
closer investigation.
3. Virtual testing The racing tyre is investigated at three different normal loads (1500 N, 3000 N and 4500 N)
and two different camber angles (0° and -3°) for a sweep of slip ratios from 0% to -20%. All
rolling analyses are conducted at a constant wheel velocity of 19.4 m/s, which corresponds to
the typical speeds employed for in-door experimental tests [10]. At these low velocities
inertial effects can be considered negligible and will not be simulated in this study.
3.1. Procedure Starting with a tyre model that is mounted on a rigid rim, inflated, cambered and loaded
vertically, the steady-state rolling analysis itself is broken down into two steps. In the first
step, the straight-line rolling speed and the angular velocity of the wheel are increased
linearly from the stationary condition to the desired steady-state rolling condition. To guard
8
against convergence difficulties, the pressure- and velocity-dependent friction coefficient is
ramped up from zero to its final value during this step. In the second step, a sweep of slip
ratios is simulated by varying the angular velocity of the tyre-wheel assembly while
maintaining the longitudinal velocity constant.
3.2. Data extraction For the analysis of the steady-state braking manoeuvre five types of data are extracted from
the simulation results and post-processed with specially written Matlab scripts. The extracted
data include:
(1) overall tyre forces – obtained from reaction output variables “RF” and “RM” built into Abaqus
(2) absolute velocity distribution (magnitude and direction) – obtained from field output variable “V” available in Abaqus
(3) normal pressure distribution within the contact patch – obtained from the Abaqus surface output variable “CPRESS”
(4) shear stress distribution (in longitudinal and lateral directions) within the contact patch – obtained from surface output variable “CSHEAR” available in Abaqus
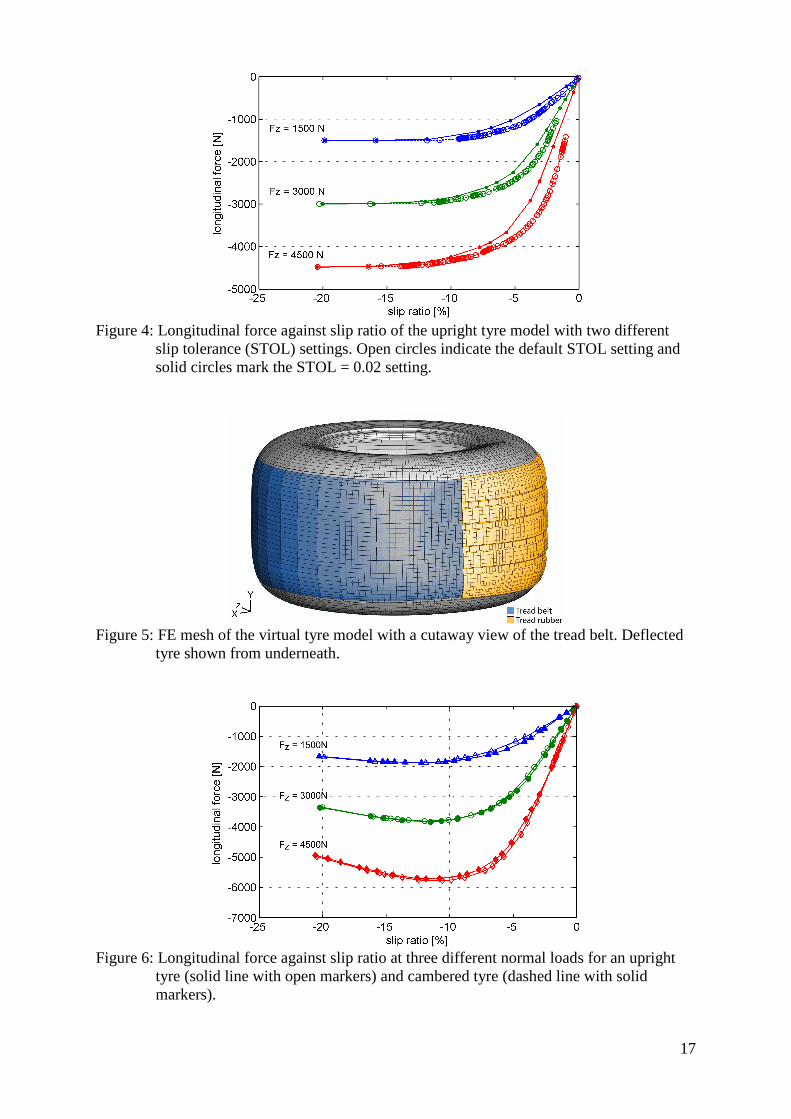
(5) tyre deformations in the contact zone – assessed by displacement of the mesh nodes of the tread belt (Figure 5) relative to a reference state; required data extracted from deformed nodal coordinates which are obtained from the Abaqus field output variable “COORD”
4. Results obtained Results of the longitudinal force against slip ratio characteristics, the contact pressure
distribution, the shear stress distributions in the contact region and the carcass (tread belt)
deflection are presented and discussed below. Data on the velocity distribution are employed
to investigate rolling radius effects within the contact patch as discussed further below.
4.1. Slip characteristics The longitudinal force (Fx) against slip ratio curves for both upright and cambered tyres
(Figure 6) exhibit the expected characteristics. At low slip values a nearly linear relationship
between Fx and slip ratio exists. With rising brake slip, a peak longitudinal force is reached
and a further increase of slip ratio causes a reduction of Fx due to the
9
sliding-velocity-dependent friction coefficient term (see equation (5)). Also, as expected, the
magnitude of the longitudinal force generated by the tyre rises with increasing normal load.
4.2. Contact pressure distribution The contact pressure distribution of the braked tyre model agrees well with the characteristics
found in published data (e.g., [11]). As indicated by the average contact pressure distribution
along the centre rib of the virtual tyre (Figure 7), the entire contact patch moves in the
direction of the braking force, i.e., towards the rear (right), with increasing brake slip of up to
-15%. Higher slip conditions lead to a drop of the generated brake force (see section 4.1) and,
hence, a reduction of the longitudinal displacement of the contact zone. The longitudinal shift
is accompanied by the formation of a high pressure region at the leading edge of the contact
patch, which is most pronounced at slip ratios greater than -10%.
4.3. Shear stresses and tyre deformation characteristics The consistency of the simulation results observed for the slip characteristics and the contact
pressure distribution is also seen in the shear stress distribution. In particular, the distribution
of the average longitudinal shear stress of the centre rib along the contact length at different
slip ratio values (Figure 8) agrees well with published results (e.g., [12]). Beginning at the
leading edge of the contact patch, the shear stresses progressively increase with contact
length, indicating an adhesion region. At some point in the contact zone (the exact position
depends on the prevailing slip ratio) the shear stresses reach the local value of the maximum
available frictional shear stress. Then, the tread rubber loses grip and starts to slide until
leaving the interface, forming a sliding zone. Accordingly, the shear stresses reduce. Also, as
will be explained further below, the positive shear stresses generated at zero slip imply a
variation of the local rolling radius within the contact region of the tyre.
Observation of the shear stress distribution throughout the entire contact patch of the
free rolling tyre (Figure 9a) reveals two particular shear stress characteristics which are

10
indicative of the deformation behaviour of the tyre structure: first, lateral contact patch
shrinkage (or waisting) and, second, ply-steer.
Lateral shrinkage of the contact region implies shear forces, which oppose the
contraction due to friction at the tread-road interface. This behaviour is reflected by the shear
stress vectors pointing laterally outwards (to the sides of the contact patch). As reported in the
previous work [1], contact patch waisting arises from the relaxation of the inflation-induced
pre-strains of the tyre cords in the contact region. This narrowing effect can be visualised by
plotting the lateral displacement of the nodal coordinates of the tread belt caused by
increasing the vertical load on a tyre rolling on a frictionless surface by 3000 N (with respect
to the inflated, unloaded tyre). Thus, as shown by Figure 9b, the lateral curvature of the
circumferential tread belt varies across the width of the tyre - from a high curvature at the
sides to zero curvature at the centre. Also, as waisting in the contact region leads to useless
sliding of rubber against the road surface, the rolling resistance of the tyre increases and
energy is consumed. This waste of energy can be reduced by making the tread band stiff and
the sidewalls flexible.
Ply-steer generates lateral shear stresses within the entire contact patch region that
point in the same direction and, thus, produce an overall side force. As the shear stresses
caused by ply-steer and waisting augment each other in one half of the contact patch and
oppose each other in the other half, the overall shear stress distribution at the tread-road
interface of the free rolling tyre becomes asymmetric about the wheel centre plane (Figure
9a). That is, the shear stresses on the right side of the contact patch (negative y-axis) are
greater than on the left side (positive y-axis). The presence of ply-steer is indicated by a slight
rotation of the entire belt about the vertical axis, as shown by Figure 9b.
In addition to these two effects, a ‘whirl’ of shear stress vectors near the trailing edge
of the outermost tread ribs can be observed (Figure 9a). This pattern results from local belt
11
deformations, which can be ascribed to the gradual ‘release’ of the contact condition between
the tread rubber and the road surface near the trailing edge.
At a slip ratio of -10%, the direction of the shear stresses is dominated by the
generation of the brake force (Figure 10a). Only a small inclination of the shear stress vectors
(primarily in the outermost tread rib) with respect to the x-axis can be observed. In the
leading half of the contact patch, the shear stress vectors are inclined away from the wheel
centre plane, whereas the stress vectors in the trailing half are pointing slightly towards the
centre of the wheel. This shear stress distribution implies a ‘rotation’ of the tread belt towards
the wheel centre plane. The particular belt deformation due to Fx is shown in Figure 10b,
which depicts the lateral displacement of the nodes of the tread belt mesh of a braked tyre
with respect to the free rolling condition. Hence, the rotational motion of the tread belt rows
is characterised by a lateral contraction in the leading half and a lateral expansion in the
trailing half of the contact patch. This behaviour can be attributed to a combined effect of
contact patch waisting and contact patch stretching induced by the frictional shear stresses
[11]. In addition, the contact patch as a whole is displaced relative to the condition of the
free-rolling tyre. As noted above, a longitudinal shift occurs due to the generation of the
brake force. The longitudinal displacement is accompanied by a small lateral shift which can
be ascribed to the lateral force induced by ply-steer.
In conclusion, the tread belt deformation due to Fx may be interpreted as a
combination of two motions: first, a translational displacement and, second, a rotational
displacement of the belt rows.
When the tyre is inclined at a camber angle of -3°, the shape of the tyre-road interface
becomes trapezoidal. With this setup, the shear stress distribution at zero slip rolling (Figure
11 a) indicates the influence of three superimposed shear stress characteristics, which are
induced by the deformation behaviour of the reinforcement structure of the tyre. These are:
12
ply-steer and contact patch waisting (as identified with the upright tyre), and belt
deformations caused by the inclination of the tyre.
As mentioned above, ply-steer influences the whole contact region. With the
cambered configuration, the effect of ply-steer is best examined by the shear stress vectors of
the centre rib, which point in the direction of the negative y-axis. The influence and the
behaviour of belt deflections caused by normal load (waisting) and camber angle can be
observed by the difference in the shear stress fields on the laden and unladen sides of the
contact patch. On the unladen side, the shear stresses are rather small and point in the
direction of the negative y-axis, whereas on the laden side, the shear stresses are significantly
greater and point in the direction of tyre inclination. This stress distribution implies that the
two deflection mechanisms oppose each other on the unladen side and augment each other on
the laden side.
The camber induced carcass deflection characteristics are directly examined by the
lateral deflection of the circumferential tread belt of the inclined tyre relative to an upright
tyre (Figure 11 b). To avoid frictional influences arising from tyre width effects (as will be
explained later), the lateral displacement of the tread belt caused by the camber angle is
investigated for a tyre rolling on a friction free surface. Hence, as shown by Figure 11 b,
inclining the tyre causes two ‘types’ of deflection of the tread belt. First, lateral bending of
the tread belt occurs (e.g., [13, 6]) which decreases from the contact patch sides towards the
wheel centre plane. Second, the whole tread belt is displaced laterally in the direction of the
negative y-axis.
In addition to the three factors described above, the considerable width of the virtual
tyre affects the shear stress distribution. The influence can be investigated from the shear
stresses within the contact patch of a cambered tyre at zero longitudinal slip (Figure 11a).
Although the tyre is rolling freely, the shear stresses in ribs 1 to 4 are slightly inclined
towards the front and, thus, are generating a driving force. In contrast, the shear stresses in
13
the outermost rib on the laden side (rib 5) point slightly towards the rear, and correspond to a
braking force. As a consequence, the rolling radius is not constant across the width of the tyre
and, thus, a local rolling radius [6, 12] may be defined. Based on the definition of the rolling
radius (equation (2)), the local rolling radius at any location in the tyre contact patch will be
described as the ratio of the forward velocity of the tread surface at the particular coordinate
and the wheel speed for the condition when no longitudinal force is generated. In general, this
ratio can be expressed as:
x xiei
V Vr
−=Ω
(9)
where Vx : longitudinal velocity of the wheel centre Vxi : local longitudinal velocity of the tread within the contact patch Ω : angular velocity of the wheel
As a tyre can only produce forces on friction surfaces, the local rolling radius within
the whole contact patch can be easily obtained from FE rolling simulations on a frictionless
surface. Results from this type of simulations are shown in Figure 12.
As expected, FE simulations with a cambered tyre (Figure 12 b) reveal that the rolling
radius is greater on the unladen side than on the laden side. However, owing to the complex
tyre deformations and changing longitudinal and lateral contact patch dimensions of the
inclined tyre, the variation of the rolling radius is not symmetric about the wheel centre plane,
rather about the centroid of the contact patch.
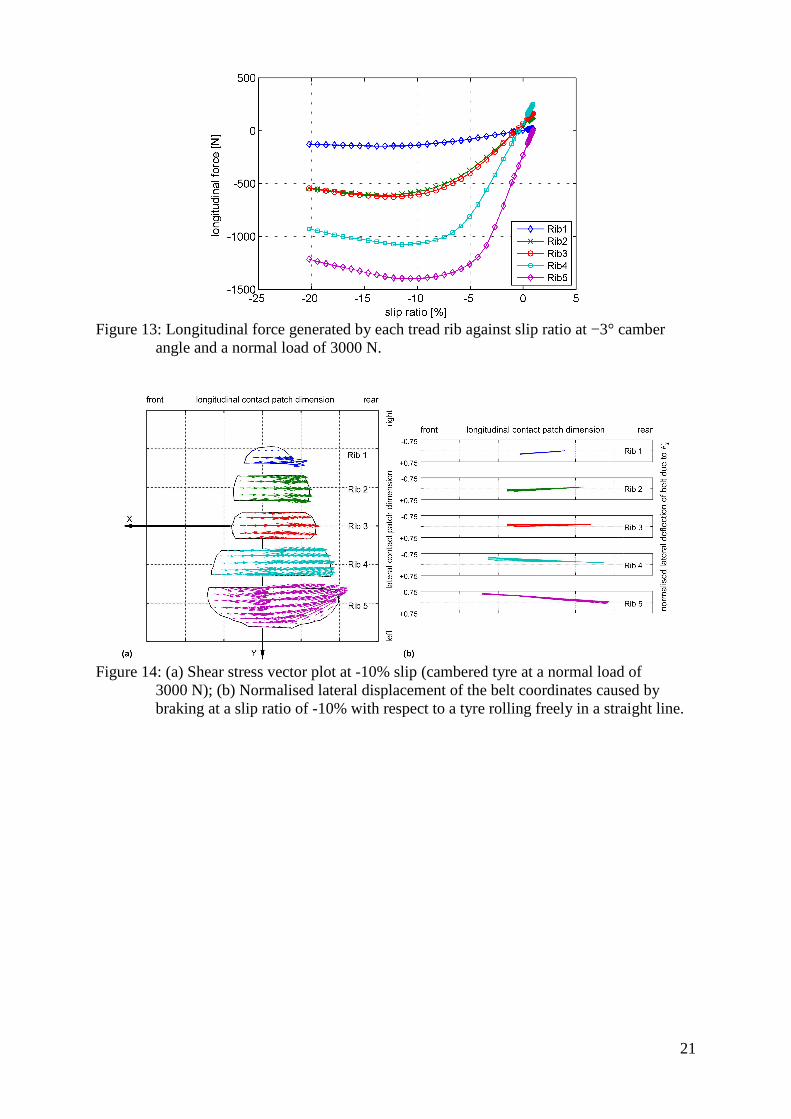
Plotting the longitudinal forces generated by the individual tread ribs against slip ratio
(Figure 13) highlights this tyre-width effect once more. At zero slip, rib 5 generates a braking
force that is balanced by the driving forces produced by the other ribs. At around -1% slip,
the driving forces vanish and all tread ribs start to generate brake forces. Also, the individual
contribution of the tread ribs to the overall tyre force corresponds to the uneven distribution
of the contacting area.
14
Similar to the upright tyre, the introduction of brake slip with the cambered tyre
generates shear stress vectors that are primarily pointing towards the rear (Figure 14a).
Moreover, the shear stress field shows a comparable pattern to the one observed for the tyre
at zero camber. Hence, the shear stress vectors near the leading edge of the contact patch are
slightly inclined away from the wheel centre plane. In the trailing half, the shear stress
vectors are directed slightly towards the centre of the wheel. Therefore, as described for the
upright tyre, a rotational displacement of the tread belt rows occurs, which is accompanied by
a translational displacement of the entire contact patch, as shown by Figure 14b.
5. Conclusions Physically realistic rolling-tyre behaviour has been demonstrated by the FE model. The
virtual tyre allows extraction of detailed results which are not easily obtainable through
measurements on an actual tyre. The simulation results and experimental data from the
literature show substantial agreement in respect of, a) deflection behaviour, b), slip
characteristics, c), normal force and d) shear stress distributions over the contact region.
Examination of the deflection behaviour of the reinforcement structure of the rolling
tyre revealed a strong interdependence between the carcass deformation characteristics and
the shear stress distribution within the contact patch. In particular, four factors that influence
the characteristics of the carcass and, consequently, the shear stress distribution within the
contact patch were identified:
• Normal load and camber angle: carcass deformations resulting from normal loading and camber angle were found to induce lateral shear stresses which oppose each other on the unladen side and augment each other on the laden side.
• Brake force: The generation of brake force caused longitudinal displacement and stretching of the contact patch. These deflections are accompanied by lateral shrinkage (or “waisting”) in the contact region. In the leading half of the contact patch, the shear stresses point towards the wheel centre plane, whereas in the trailing half the shear stresses are in the opposite direction.
• Tyre width: The longitudinal force distribution across the tyre width showed the generation of localised driving and braking forces even for free rolling conditions. This behaviour is indicative of a local rolling radius variation which can be directly measured with the FE model.

15
These results aid understanding of contact patch characteristics and allow insights on
the impact of tyre design / architecture on the behaviour of a rolling tyre. Also, the
information obtained here helps in the creation of dedicated tyre models as shown in the
second part of this two-part paper [14].
References [1] Gruber, P., Sharp, R. S. and Crocombe, A. D., Friction and camber influences on the
static stiffness properties of a racing tyre, Proc. IMechE 222, Part D: J. Automobile Engineering (2008), pp. 1965-1976.
[2] Trinko, M. J., Tire Stress Analysis, in The Pneumatic Tire, J.D. Walter and A.N. Gent, National Highway Traffic Safety Administration U. S. Department of Transportation, Washington DC, 2005, pp. 206-229.
[3] Rao, K. V. N., Kumar, R. K., Mukhopadhyay, R., Misra, V.K., A study of the relationship between Magic Formula coefficients and tyre design attributes through finite element analysis, Vehicle Syst. Dyn. 44(1) (2006), pp. 33-63.
[4] International Organization for Standardization (ISO), ISO 8855:1991 Road vehicles — Vehicle dynamics and road-holding ability — Vocabulary (1991), Geneva.
[5] Abaqus version 6.7 documentation, Dassault Systèmes, Simulia, Providence, Rhode Island, USA, 2007.
[6] Pacejka, H. B., Tyre and vehicle dynamics, 2nd Edition, Butterworth-Heinemann, Oxford, 2006.
[7] Durand-Gasselin, B., Dailliez, T., Moessner-Beigel, M., Knorr, S., Rauh, J., Assessing the Thermo-mechanical TameTire Model in Off-line Vehicle Simulation and Driving Simulator Tests, IAVSD 2009, Stockholm, 2009.
[8] Savkoor, A. R., Models of Friction, in Handbook of Materials Behavior Models, Volume 2 Failures of Materials, J. Lemaitre, Academic Press, London, 2001, pp. 700-759.
[9] Qi, J., Herron, J. R., Sansalone, K. H., Mars, W. V., Du, Z. Z., Snyman, M. and Surendranath, H., Validation of a Steady-State Transport Analysis for Rolling Treaded Tires, Tire Sci. Technol. 35(3) (2007), pp. 183-208.
[10] Arosio, D., Braghin, F., Cheli, F., Sabbioni, E., Identification of Pacejka’s scaling factors from full-scale experimental tests, Vehicle Syst. Dyn. Suppl. 43 (2005), pp. 457-474.
[11] Clark, S. K., Mechanics of Pneumatic Tires, 2nd edition, US Dept. of Transportation, National Highway Traffic Safety Administration, Washington, D.C, 1981.
[12] Pottinger, M. G., Contact Patch (Footprint) Phenomena, in The Pneumatic Tire, J.D. Walter and A.N. Gent, National Highway Traffic Safety Administration U. S. Department of Transportation, Washington DC, 2005, pp. 231-285.
[13] Fiala, E., Seitenkräfte am rollenden Luftreifen, VDI Zeitschrift 96(29) (1954), pp. 973–979.
[14] P. Gruber, R.S. Sharp, and A.D. Crocombe, Normal and shear forces in the contact patch of a braked racing tyre; Part 2: Development of a physical tyre model, Veh. Syst. Dyn. 50(3) (2012), pp.339-356.

16
Figure 1: Validated tyre model [1].
Figure 2: Cross-section of virtual tyre [1].
Figure 3: Schematic plot of the shear stress against sliding velocity relationship for sticking
and slipping friction.
17
Figure 4: Longitudinal force against slip ratio of the upright tyre model with two different
slip tolerance (STOL) settings. Open circles indicate the default STOL setting and solid circles mark the STOL = 0.02 setting.
Figure 5: FE mesh of the virtual tyre model with a cutaway view of the tread belt. Deflected
tyre shown from underneath.
Figure 6: Longitudinal force against slip ratio at three different normal loads for an upright
tyre (solid line with open markers) and cambered tyre (dashed line with solid markers).

18
Figure 7: Average contact pressure distribution of the centre tread rib against longitudinal
coordinate as a function of slip ratio (upright tyre at a normal load of 3000 N).
Figure 8: Average longitudinal shear stress distribution along the longitudinal direction of the
centre tread rib at different slip ratios (upright tyre at a normal load of 3000 N).

19
Figure 9: Upright tyre rolling at 0% slip: (a) shear stress vector plot at a normal load of
3000 N and (b) normalised lateral displacement of the belt coordinates caused by normal loading of 3000 N on a frictionless surface with respect to an unloaded, inflated tyre. Each line represents a longitudinal line of mesh nodes.
Figure 10: Upright tyre at a normal load of 3000 N rolling at -10% slip: (a) shear stress vector
plot and (b) normalised lateral displacement of the belt coordinates caused by braking at a slip ratio of -10% with respect to a tyre rolling freely in a straight line.

20
Figure 11: (a) Shear stress vector plot at 0% slip (cambered tyre at a normal load of 3000 N);
(b) Normalised lateral displacement of the belt coordinates with respect to an upright tyre caused by a camber angle of −3°. Tyre rolling on a frictionless surface.
Figure 12: Rolling radius within the contact patch of (a) the upright tyre and (b) the cambered
tyre (γ = −3°) rolling on a frictionless surface (FE simulations at a normal load of 3000 N).
21
Figure 13: Longitudinal force generated by each tread rib against slip ratio at −3° camber
angle and a normal load of 3000 N.
Figure 14: (a) Shear stress vector plot at -10% slip (cambered tyre at a normal load of
3000 N); (b) Normalised lateral displacement of the belt coordinates caused by braking at a slip ratio of -10% with respect to a tyre rolling freely in a straight line.


