NYSE: WMB
williams.com
WE MAKE ENERGY HAPPEN
Northwest Pipeline IntroductionGary Venz – Manager, Marketing Services
2© 2017 The Williams Companies, Inc. All rights reserved. WECC Gas/Electric Forum – May 21, 2019
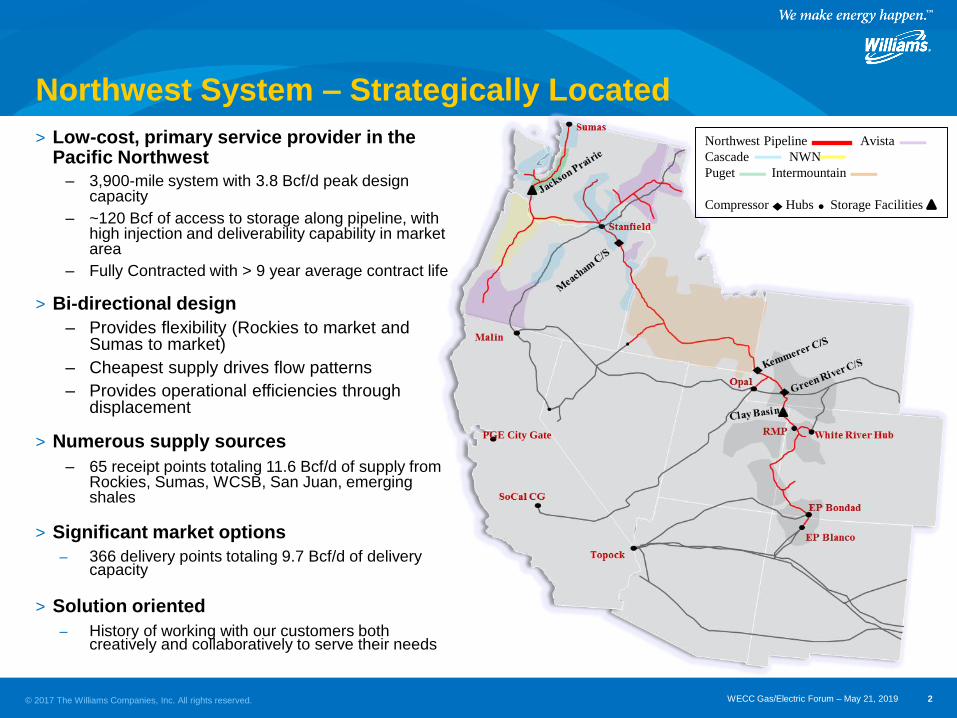
Northwest System – Strategically Located
> Low-cost, primary service provider in the Pacific Northwest
– 3,900-mile system with 3.8 Bcf/d peak design capacity
– ~120 Bcf of access to storage along pipeline, with high injection and deliverability capability in market area
– Fully Contracted with > 9 year average contract life
> Bi-directional design
– Provides flexibility (Rockies to market and Sumas to market)
– Cheapest supply drives flow patterns
– Provides operational efficiencies through displacement
> Numerous supply sources
– 65 receipt points totaling 11.6 Bcf/d of supply from Rockies, Sumas, WCSB, San Juan, emerging shales
> Significant market options
– 366 delivery points totaling 9.7 Bcf/d of delivery capacity
> Solution oriented
– History of working with our customers both creatively and collaboratively to serve their needs
PGE City Gate
Northwest Pipeline Avista
Cascade NWN
Puget Intermountain
Compressor Hubs Storage Facilities
3© 2017 The Williams Companies, Inc. All rights reserved. WECC Gas/Electric Forum – May 21, 2019
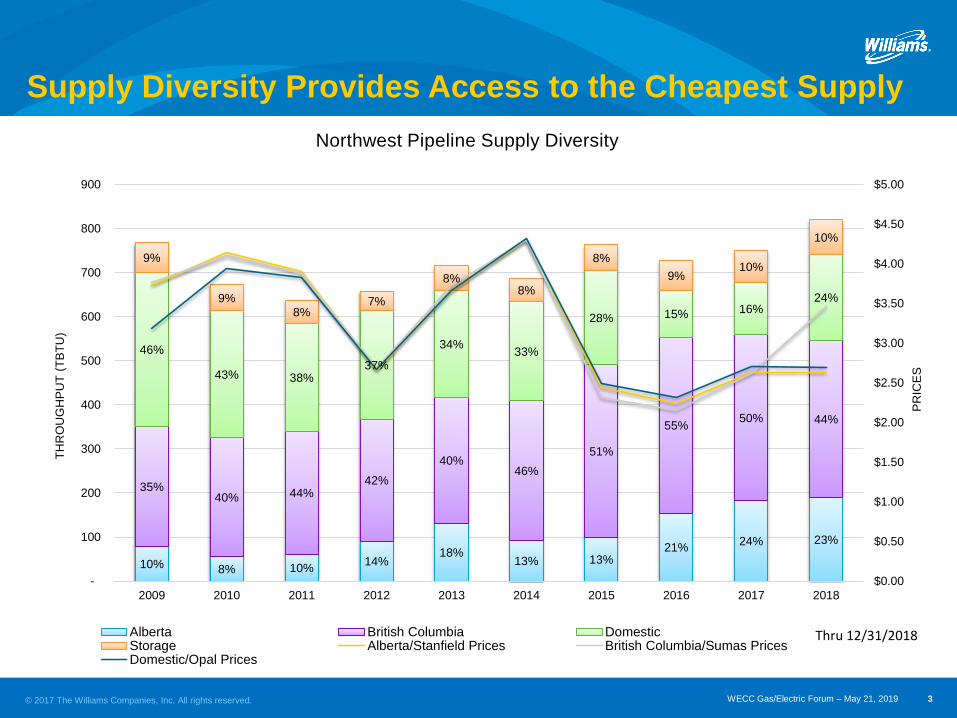
Supply Diversity Provides Access to the Cheapest Supply
10% 8% 10%14%
18%13% 13%
21%24% 23%
35%40% 44%
42%
40%46%
51%
55%50% 44%
46%
43% 38%37%
34%33%
28% 15% 16%24%
9%
9%
8%7%
8%8%
8%
9%10%
10%
$0.00
$0.50
$1.00
$1.50
$2.00
$2.50
$3.00
$3.50
$4.00
$4.50
$5.00
-
100
200
300
400
500
600
700
800
900
2009 2010 2011 2012 2013 2014 2015 2016 2017 2018
PR
ICE
S
TH
RO
UG
HP
UT
(T
BT
U)
Northwest Pipeline Supply Diversity
Alberta British Columbia DomesticStorage Alberta/Stanfield Prices British Columbia/Sumas PricesDomestic/Opal Prices
Thru 12/31/2018
4© 2017 The Williams Companies, Inc. All rights reserved. WECC Gas/Electric Forum – May 21, 2019
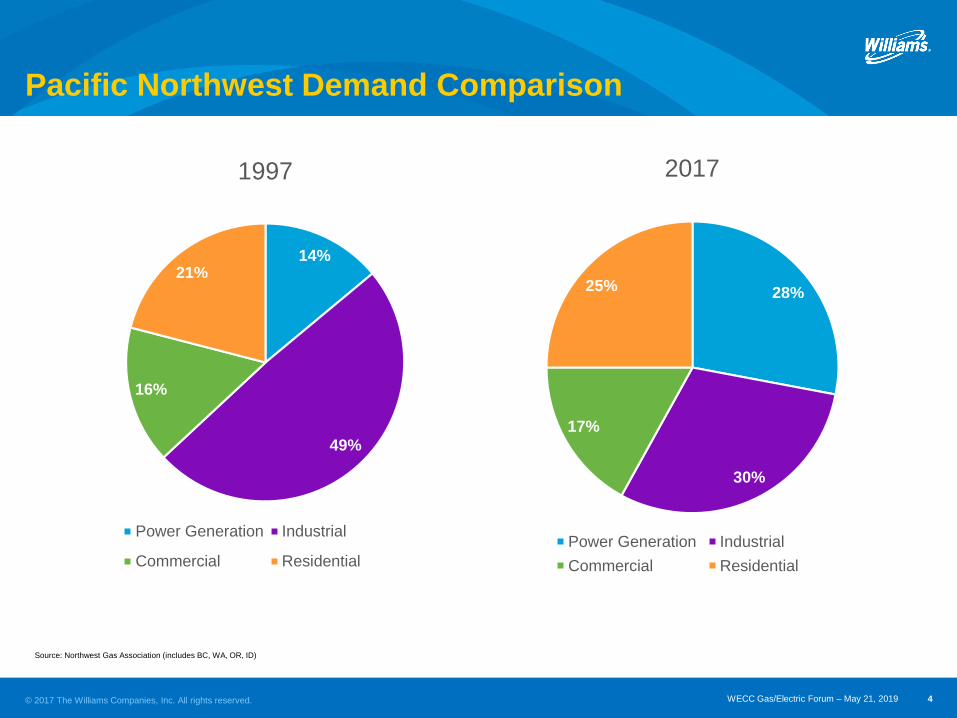
Source: Northwest Gas Association (includes BC, WA, OR, ID)
Pacific Northwest Demand Comparison
14%
49%
16%
21%
1997
Power Generation Industrial
Commercial Residential
28%
30%
17%
25%
2017
Power Generation Industrial
Commercial Residential
5© 2017 The Williams Companies, Inc. All rights reserved. WECC Gas/Electric Forum – May 21, 2019
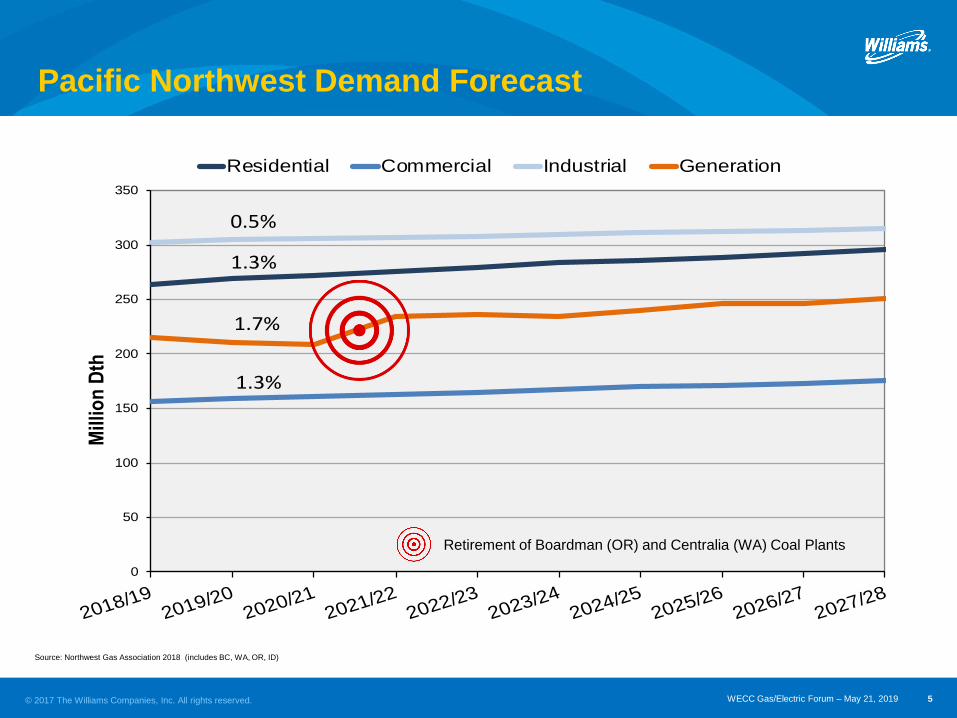
Pacific Northwest Demand Forecast
0
50
100
150
200
250
300
350
2018/192019/20
2020/212021/22
2022/232023/24
2024/252025/26
2026/272027/28
Mil
lio
n D
th
Residential Commercial Industrial Generation
0.5%
1.3%
1.7%
1.3%
Source: Northwest Gas Association 2018 (includes BC, WA, OR, ID)
Retirement of Boardman (OR) and Centralia (WA) Coal Plants

6© 2017 The Williams Companies, Inc. All rights reserved. WECC Gas/Electric Forum – May 21, 2019
Pacific Northwest Natural Gas Generation

7© 2017 The Williams Companies, Inc. All rights reserved. WECC Gas/Electric Forum – May 21, 2019
Aggregate of Northwest On-System Power Demand (Dth/d)

8© 2017 The Williams Companies, Inc. All rights reserved. WECC Gas/Electric Forum – May 21, 2019
Nexus Between Gas and Power on Northwest Pipeline
> Northwest Pipeline offers:
– Flexible balancing
– No uniform hourly takes
– Park and loan services
– Additional post day cycle for realignment purposes
> Northwest Pipeline takes a proactive role in:
– Customers Integrated Resource Planning to understand forecasted demand, peaks and
market drivers
– Participates in regional gas/electric coordination groups to maintain dialogue and education
on how the gas side works
– Mitigates maintenance, to the extent possible, not to impact customers business
> Northwest Pipeline has a history of expanding its system
– Requires long term customer commitment

9© 2017 The Williams Companies, Inc. All rights reserved. WECC Gas/Electric Forum – May 21, 2019
Thank You


