
NOTATION RULES APPLIED TO
BUSINESS INTELLIGENCE SYSTEMS
We think that even leading BI tools could improve their user interface if they would
apply our SUCCESS rules and the visualization concept of hi-notation –
see www.success.hichert.com and www.hi-notation.hichert.com.
Here I try to apply the concept to a screenshot of QlikView.
Regards
Rolf Hichert
[email protected] www.hichert.com © 2011 HICHERT+PARTNER AG
Practical Example: Qlikview from Qliktech

Important
If your browser does not allow to view this pdf file in full screen mode you must save the file on your computer first.
After opening the file you turn on full screen mode by clicking Ctrl+L (Windows) or Ctrl+Cmd+F (Mac).
Full screen mode is important to see and understand the many small steps in this presentation.
Wichtig
Wenn Ihr Browser diese pdf-Datei nicht imVollbild-Modus anzeigen kann, so müssen Siesie zunächst auf Ihrem Computer speichern.
Nach dem Öffnen der Datei können Sie den Vollbild-Modus mit Ctrl+L (Windows) oderCtrl+Cmd+F (Mac) starten.
Der Vollbild-Modus ist wichtig, um die vielenkleinen Schritte in dieser Präsentation zuerkennen.

Source: Qliktech

Source: Qliktech
This is the original screenshot

What are the units?
Source: Qliktech

What are the units?
What is the measure?
Source: Qliktech

What are the units?
What is the measure?
What is the measure?
Source: Qliktech

Time direction always from left to right
Source: Qliktech

Time direction always from left to right
Source: Qliktech
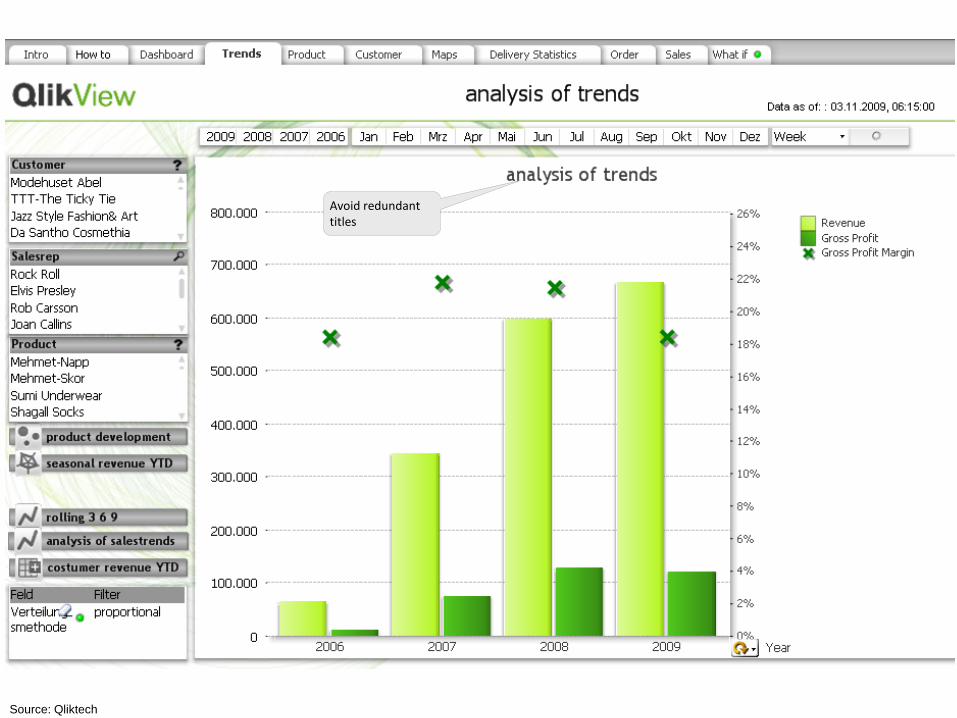
Avoid redundant titles
Source: Qliktech

Avoid redundant titles
Source: Qliktech
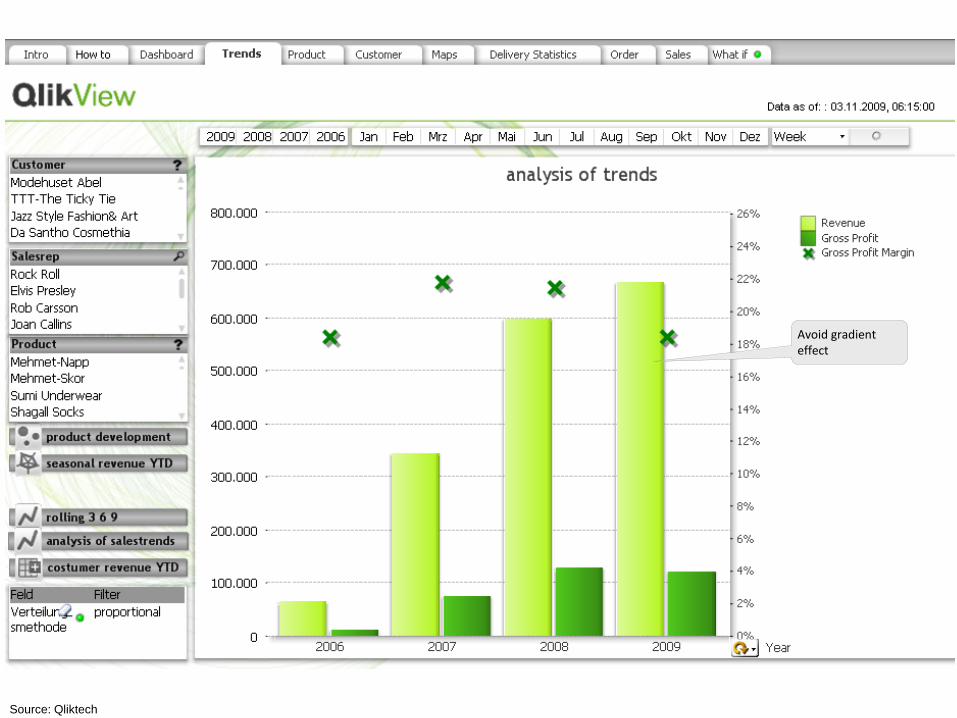
Avoid gradient effect
Source: Qliktech

Avoid gradient effect
Avoid colors without meaning
Source: Qliktech

Avoid gradient effect
Avoid colors without meaning
Source: Qliktech

0
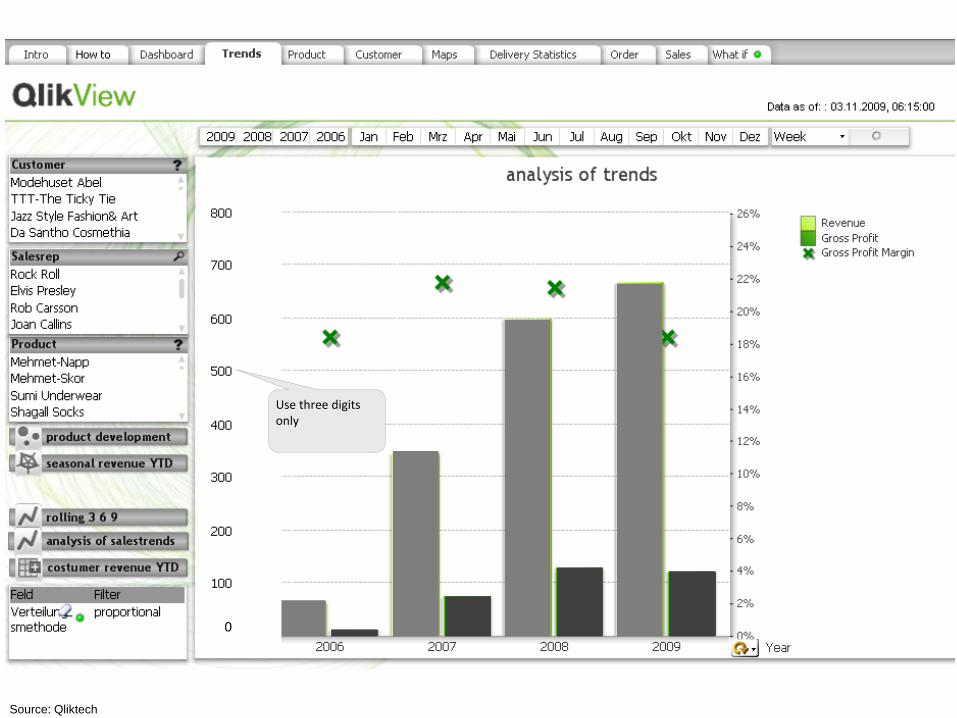
Use three digits only
Source: Qliktech
0
Use three digits only
Source: Qliktech

0
Use uniform concept for category axes
Source: Qliktech

Use uniform concept for category axes 0
Source: Qliktech

„Years“ or „months“ is self-evident
0
Source: Qliktech

0
Source: Qliktech

0
Use standard title concept
Source: Qliktech

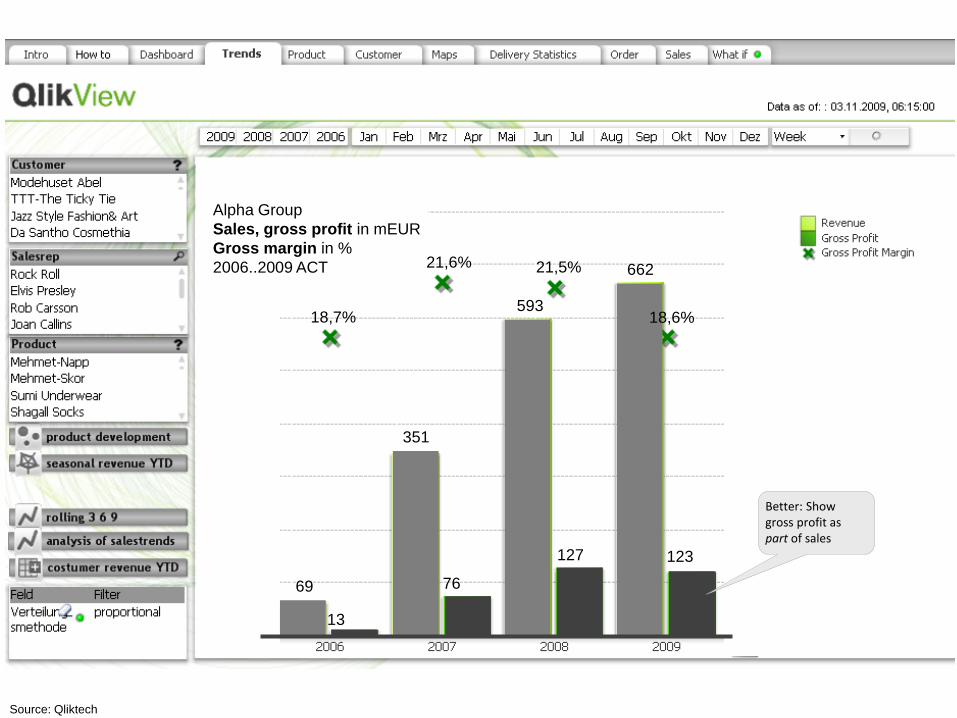
Alpha Group
Sales, gross profit in mEUR
Gross margin in %
2006..2009 ACT
Use standard title concept
0
Source: Qliktech
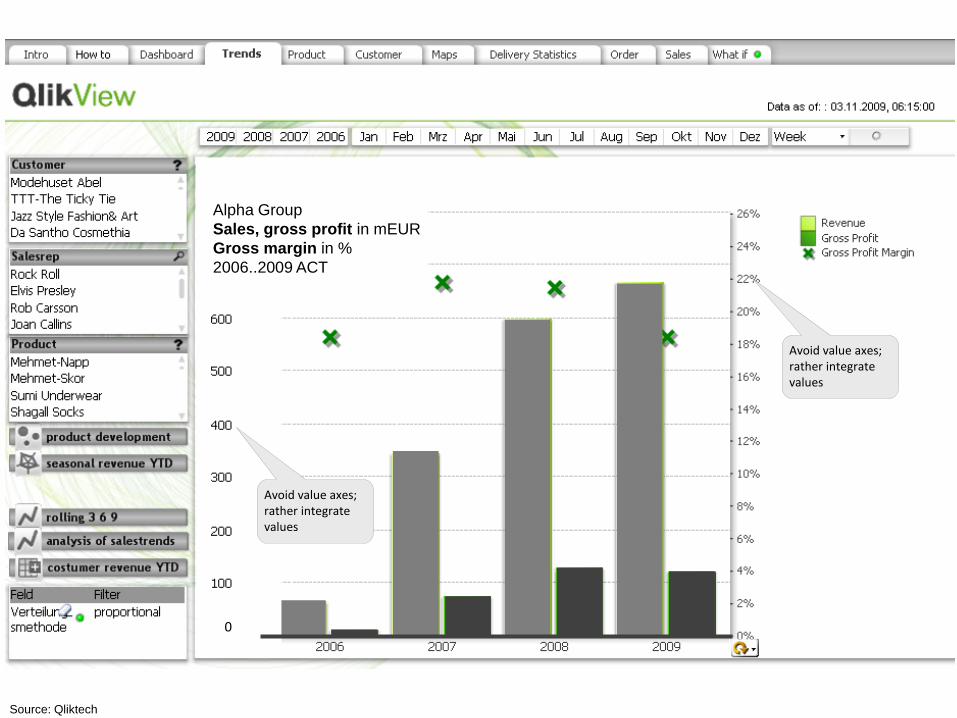
Avoid value axes; rather integrate values
Avoid value axes; rather integrate values
0
Alpha Group
Sales, gross profit in mEUR
Gross margin in %
2006..2009 ACT
Source: Qliktech

18,7%
69
21,5%
18,6%
351
593
662
13
76
127 123
Avoid value axes; rather integrate values
Avoid value axes; rather integrate values
Alpha Group
Sales, gross profit in mEUR
Gross margin in %
2006..2009 ACT 21,6%
Source: Qliktech
18,7%
69
21,5%
18,6%
351
593
662
13
76
127 123
Better: Show gross profit as part of sales
Alpha Group
Sales, gross profit in mEUR
Gross margin in %
2006..2009 ACT 21,6%
Source: Qliktech

18,7%
69
21,5%
18,6%
351
593
662
13
76
127 123
Better: Show gross profit as part of sales
Alpha Group
Sales, gross profit in mEUR
Gross margin in %
2006..2009 ACT 21,6%
Source: Qliktech

18,7%
69
21,5%
18,6%
351
593
662
13
76
127 123
Integrate legends
Alpha Group
Sales, gross profit in mEUR
Gross margin in %
2006..2009 ACT 21,6%
Source: Qliktech
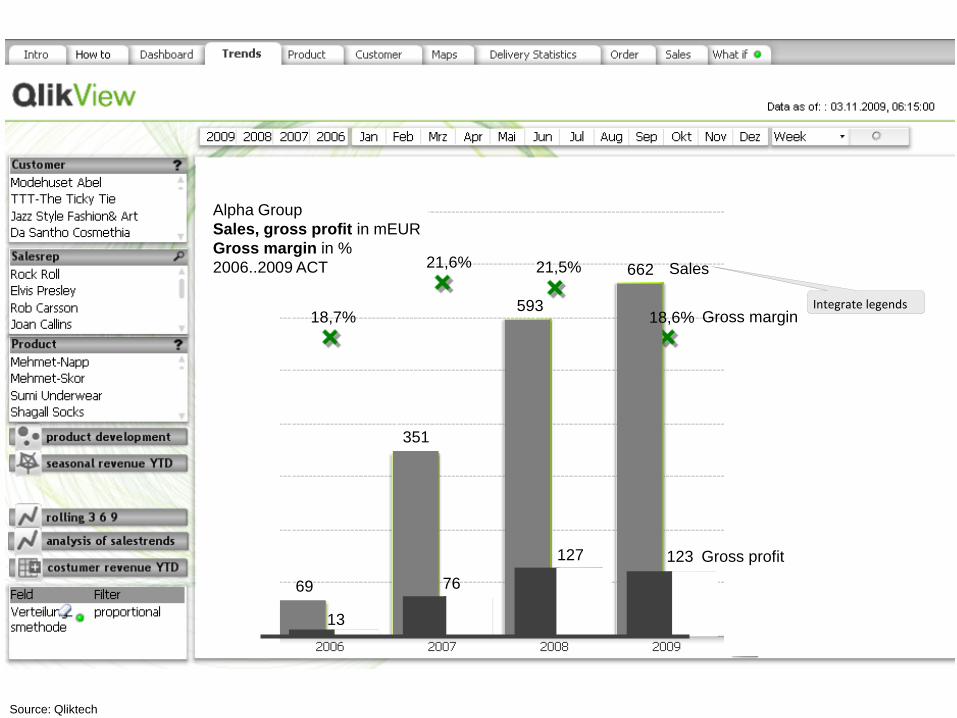
18,7%
69
21,5%
18,6%
351
593
662
13
76
127 123
Sales
Gross margin
Gross profit
Integrate legends
Alpha Group
Sales, gross profit in mEUR
Gross margin in %
2006..2009 ACT 21,6%
Source: Qliktech

18,7%
69
21,5%
18,6%
351
593
662
13
76
127 123
Sales
Gross margin
Gross profit
Avoid grid lines
Alpha Group
Sales, gross profit in mEUR
Gross margin in %
2006..2009 ACT 21,6%
Source: Qliktech

18,7%
69
21,5%
18,6%
351
593
662
13
76
127 123
Sales
Gross margin
Gross profit
Reduce noise: click away buttons
Alpha Group
Sales, gross profit in mEUR
Gross margin in %
2006..2009 ACT 21,6%
Source: Qliktech

18,7%
69
21,5%
18,6%
351
593
662
13
76
2006 2007 2008 2009
127 123
Sales
Gross margin
Gross profit
Reduce noise: click away buttons
Alpha Group
Sales, gross profit in mEUR
Gross margin in %
2006..2009 ACT 21,6%
© Rolf Hichert

18,7%
69
21,5%
18,6%
351
593
662
13
76
2006 2007 2008 2009
127 123
Sales
Gross margin
Gross profit
Use smaller scale (optional)
Alpha Group
Sales, gross profit in mEUR
Gross margin in %
2006..2009 ACT 21,6%
© Rolf Hichert
18,7%
69
21,6% 21,5%
18,6%
351
593
662
13
76
127 123
2006 2007 2008 2009
Sales
Gross margin
Gross profit
© Rolf Hichert
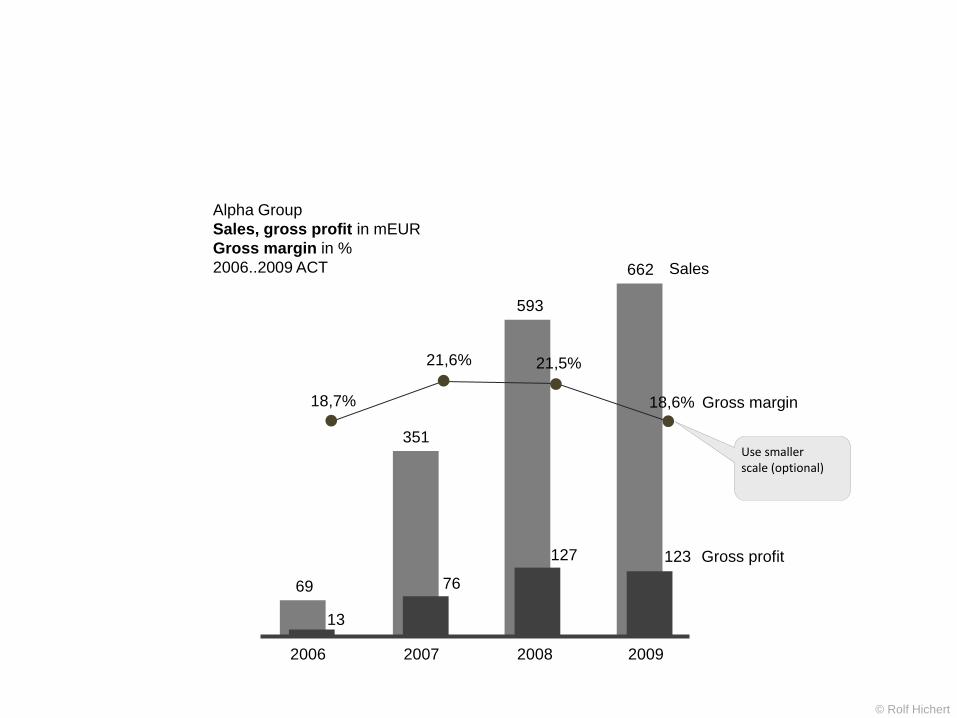
Alpha Group
Sales, gross profit in mEUR
Gross margin in %
2006..2009 ACT
Use smaller scale (optional)

18,7%
69
21,6% 21,5%
18,6%
351
593
662
13
76
127 123
2006 2007 2008 2009
Sales
Gross margin
Gross profit
© Rolf Hichert
Alpha Group
Sales, gross profit in mEUR
Gross margin in %
2006..2009 ACT
Use standard title position

18,7%
69
21,6% 21,5%
18,6%
351
593
662
13
76
127 123
2006 2007 2008 2009
Sales
Gross margin
Gross profit
Alpha Group
Sales, gross profit in mEUR
Gross margin in %
2006..2009 ACT
© Rolf Hichert
Use standard title position

18,7%
69
21,6% 21,5%
18,6%
351
593
662
13
76
127 123
2006 2007 2008 2009
Sales
Gross margin
Gross profit
Use standard font size
Alpha Group
Sales, gross profit in mEUR
Gross margin in %
2006..2009 ACT
© Rolf Hichert
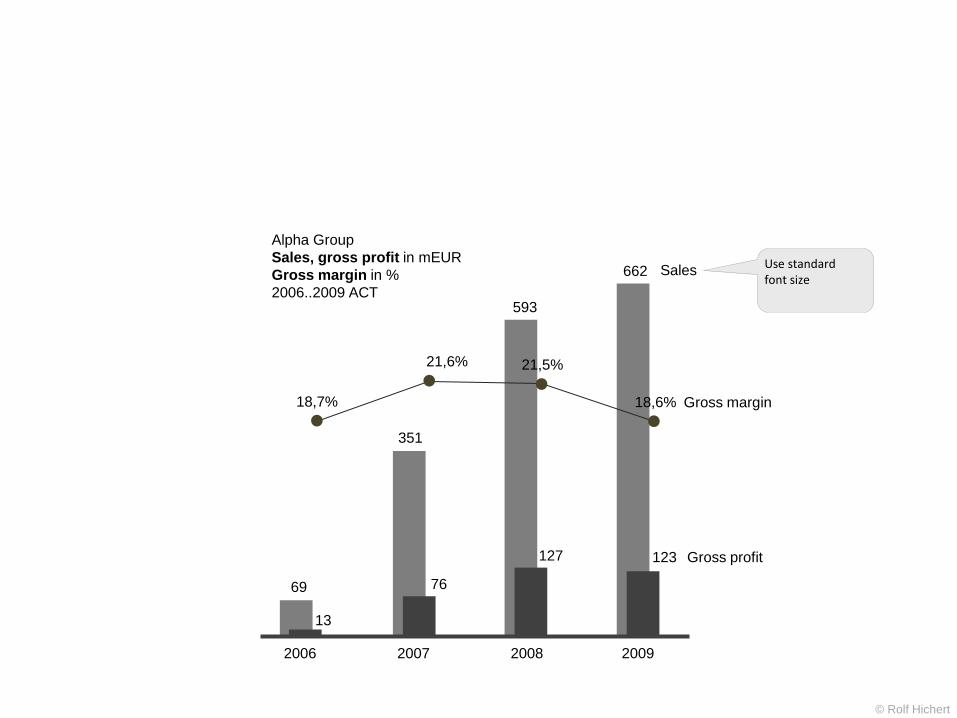
18,7%
69
21,6% 21,5%
18,6%
593
662
13
76
127 123
2006 2007 2008 2009
351
Alpha Group
Sales, gross profit in mEUR
Gross margin in %
2006..2009 ACT
Sales
Gross margin
Gross profit
Use standard font size
© Rolf Hichert

18,7%
69
21,6% 21,5%
18,6%
593
662
13
76
127 123
2006 2007 2008 2009
351
Sales
Gross margin
Gross profit
Alpha Group
Sales, gross profit in mEUR
Gross margin in %
2006..2009 ACT
© Rolf Hichert

18,7%
69
21,6% 21,5%
18,6%
593
662
13
76
127 123
2006 2007 2008 2009
351
Sales
Gross margin
Gross profit
Use axis grid size for years
Alpha Group
Sales, gross profit in mEUR
Gross margin in %
2006..2009 ACT
© Rolf Hichert

Alpha Group
Sales, gross profit in mEUR
Gross margin in %
2006..2009 ACT
18,7%
21,6%
13
69
2006
351
76
2007
127
2008
662
123
2009
21,5%
18,6%
Sales
Gross margin
Gross profit
Use axis grid size for years
593
© Rolf Hichert

Alpha Group
Sales, gross profit in mEUR
Gross margin in %
2006..2009 ACT
18,7%
21,6%
13
69
2006
351
76
2007
127
2008
662
123
2009
21,5%
18,6%
Sales
Gross margin
Gross profit
593
Use different notation for percent values
© Rolf Hichert

Alpha Group
Sales, gross profit in mEUR
Gross margin in %
2006..2009 ACT
18,7
21,6
13
69
2006
351
76
2007
127
2008
662
123
2009
21,5
18,6
Sales
Gross margin (%)
Gross profit
593
Use different notation for percent values
© Rolf Hichert

Alpha Group
Sales, gross profit in mEUR
Gross margin in %
2006..2009 ACT
18,7
21,6
13
69
2006
351
76
2007
127
2008
662
123
2009
21,5
18,6
Sales
Gross margin (%)
Gross profit
593
Compare to original layout
© Rolf Hichert

Compare to original layout
Source: Qliktech
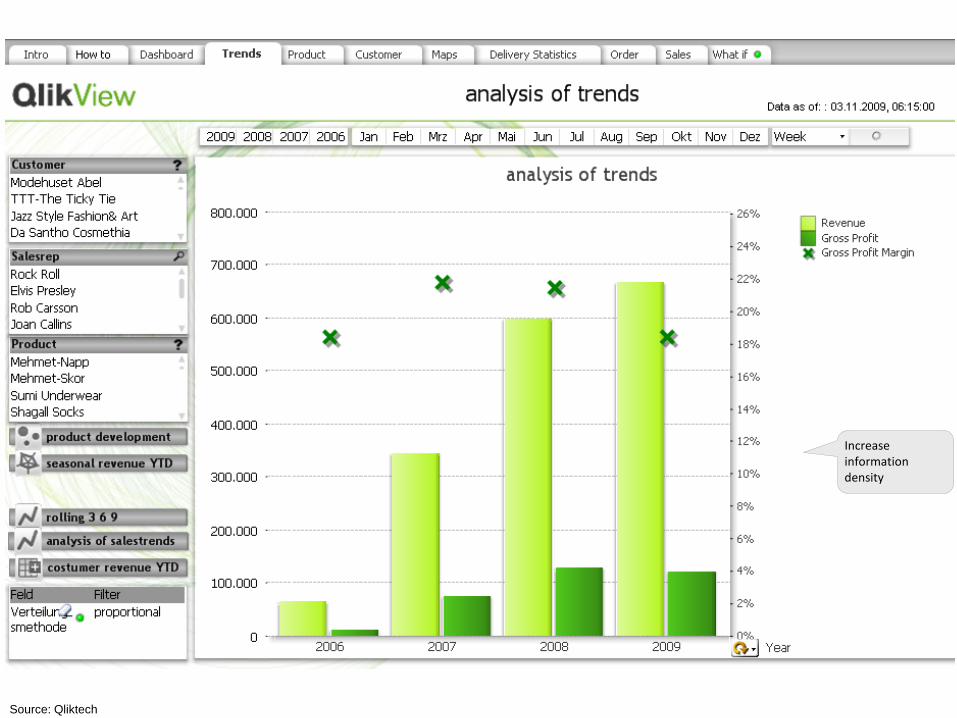
Increase information density
Source: Qliktech

Increase information density
Source: Qliktech

Alpha Group
Sales, gross profit in mEUR
Gross margin in %
2006..2009 ACT
13
69
2006
351
76
2007
593
127
2008
662
123
2009
18,6
Sales
Gross margin (%)
Gross profit
18,7
21,6 21,5
Increase information density
© Rolf Hichert

Alpha Group
Sales, gross profit in mEUR
Gross margin in %
2006..2009 ACT
13
69
2006
351
76
2007
593
127
2008
662
123
2009
18,6
Sales
Gross margin (%)
Gross profit
18,7
21,6 21,5
Increase information density
© Rolf Hichert

18,7
Alpha Group
Sales, gross profit in mEUR
Gross margin in %
2006..2013
21,6
13
69
2006
351
76
2007
593
127
2008
662
123
2009
21,5
18,6
649
2010 2011 2012 2013
Sales
Gross margin (%)
Gross profit
668
707
178
212 185 186
623 28,6
32,7
27,7 26,3
PL ACT
Increase information density
© Rolf Hichert

18,7
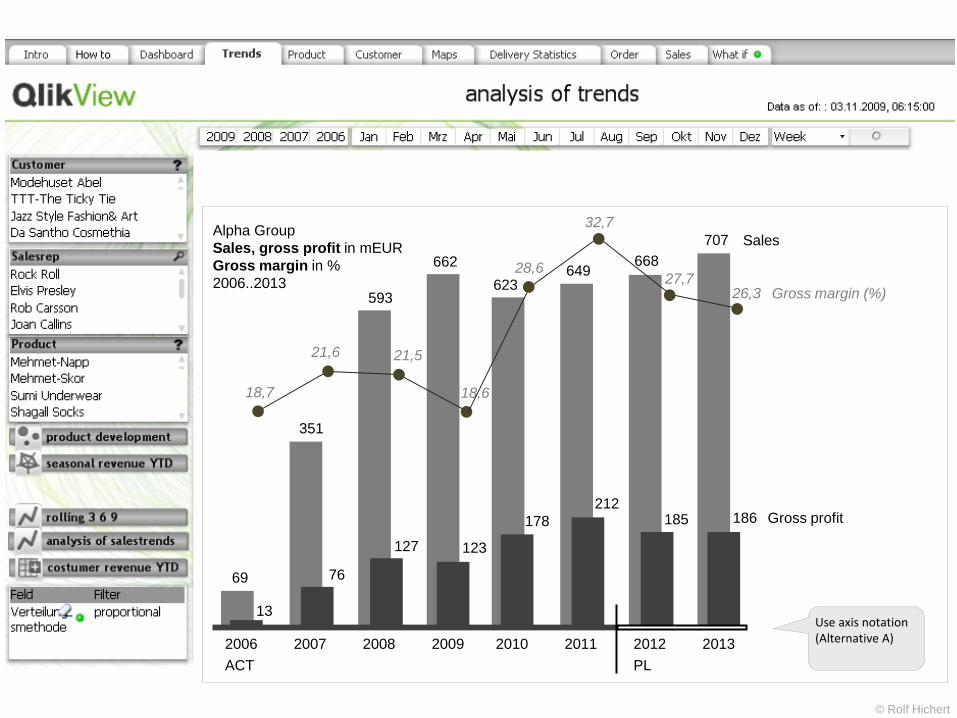
Alpha Group
Sales, gross profit in mEUR
Gross margin in %
2006..2013
21,6
13
69
2006
351
76
2007
593
127
2008
662
123
2009
21,5
18,6
649
2010 2011 2012 2013
Sales
Gross margin (%)
Gross profit
668
707
178
212 185 186
623 28,6
32,7
27,7 26,3
PL ACT
Use axis notation (Alternative A)
© Rolf Hichert
18,7
Alpha Group
Sales, gross profit in mEUR
Gross margin in %
2006..2013
21,6
13
69
2006
351
76
2007
593
127
2008
662
123
2009
21,5
18,6
649
2010 2011 2012 2013
Sales
Gross margin (%)
Gross profit
668
707
178
212 185 186
623 28,6
32,7
27,7 26,3
PL ACT
© Rolf Hichert
Use axis notation (Alternative A)
18,7
Alpha Group
Sales, gross profit in mEUR
Gross margin in %
2006..2013
21,6
13
69
2006
351
76
2007
593
127
2008
662
123
2009
21,5
18,6
649
2010 2011 2012 2013
Sales
Gross margin (%)
Gross profit
668
707
178
212 185 186
623 28,6
32,7
27,7 26,3
PL ACT
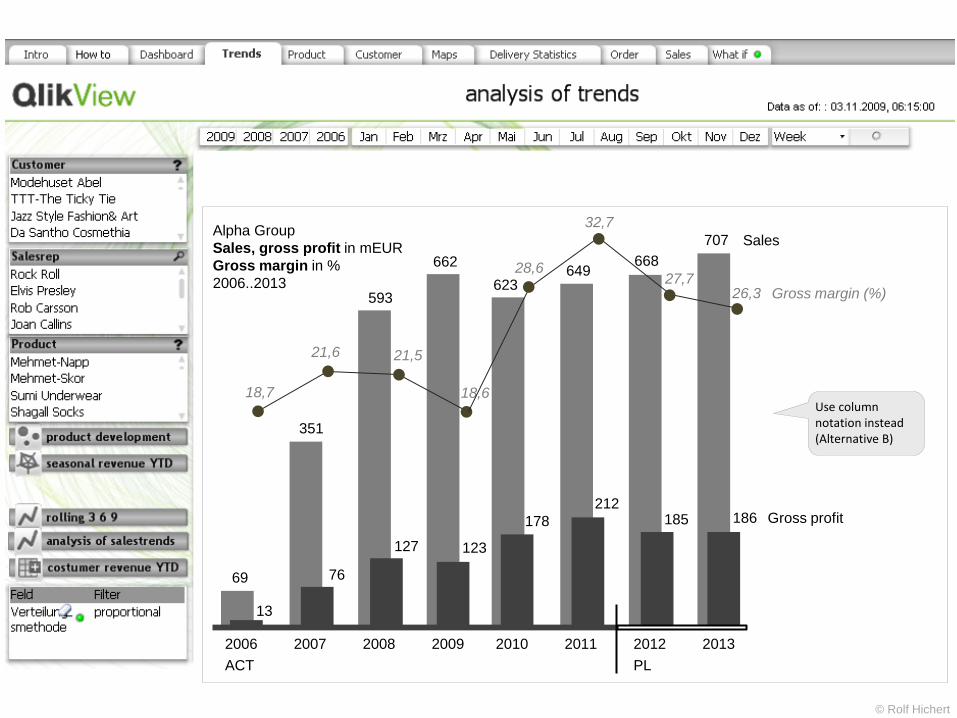
Use column notation instead (Alternative B)
© Rolf Hichert

623
18,7
Alpha Group
Sales, gross profit in mEUR
Gross margin in %
2006..2013
21,6
13
69
2006
351
76
2007
593
127
2008
662
123
2009
21,5
18,6
649
2010 2011 2012 2013
Sales
Gross margin (%)
Gross profit
668
707
178
212 185 186
28,6
32,7
27,7 26,3
PL ACT
© Rolf Hichert
Use column notation instead (Alternative B)

623
18,7
Alpha Group
Sales, gross profit in mEUR
Gross margin in %
2006..2013
21,6
13
69
2006
351
76
2007
593
127
2008
662
123
2009
21,5
18,6
649
2010 2011 2012 2013
Sales
Gross margin (%)
Gross profit
668
707
178
212 185 186
28,6
32,7
27,7 26,3
PL ACT
© Rolf Hichert
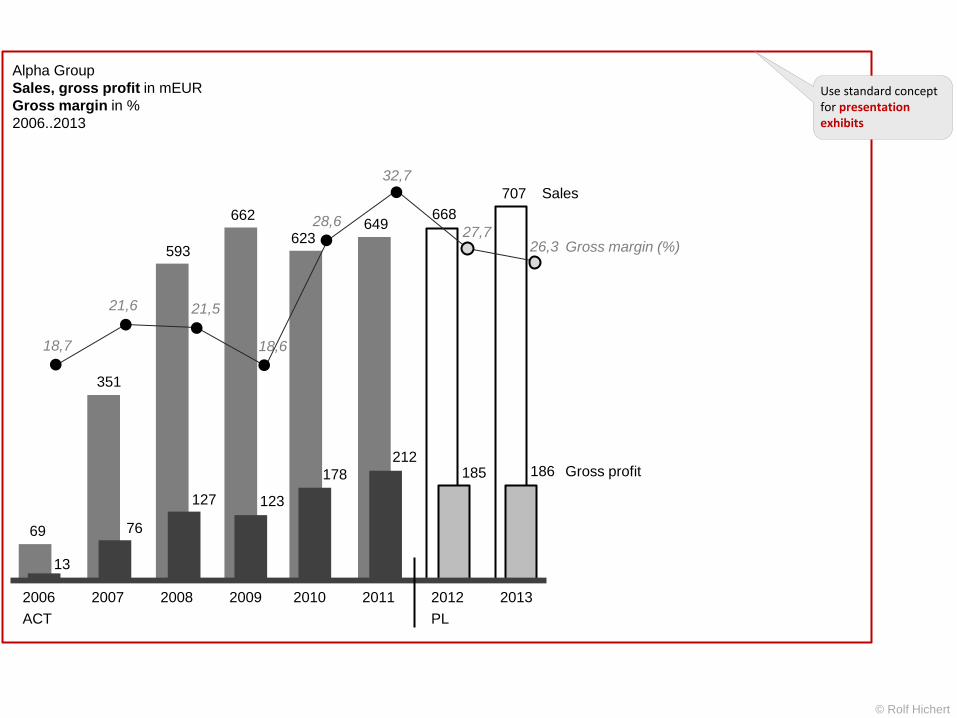
Use standard concept for presentation exhibits

623
18,7
Alpha Group
Sales, gross profit in mEUR
Gross margin in %
2006..2013
21,6
13
69
2006
351
76
2007
593
127
2008
662
123
2009
21,5
18,6
649
2010 2011 2012 2013
Sales
Gross margin (%)
Gross profit
668
707
178
212 185 186
28,6
32,7
27,7 26,3
PL ACT
© Rolf Hichert
Use standard concept for presentation exhibits
623
18,7
21,6
13
69
2006
351
76
2007
593
127
2008
662
123
2009
21,5
18,6
649
2010 2011 2012 2013
Gross margin (%)
Gross profit
668
178
212 185 186
28,6
32,7
27,7 26,3
PL ACT
Alpha Group
Sales, gross profit in mEUR
Gross margin in %
2006..2013
Sales 707
© Rolf Hichert
Use standard concept for presentation exhibits

623
18,7
21,6
13
69
2006
351
76
2007
593
127
2008
662
123
2009
21,5
18,6
649
2010 2011 2012 2013
Gross margin (%)
Gross profit
668
178
212 185 186
28,6
32,7
27,7 26,3
PL ACT
Alpha Group
Sales, gross profit in mEUR
Gross margin in %
2006..2013
Sales 707
© Rolf Hichert
Add message

623
18,7
21,6
13
69
2006
351
76
2007
593
127
2008
662
123
2009
21,5
18,6
649
2010 2011 2012 2013
Gross margin (%)
Gross profit
668
178
212 185 186
28,6
32,7
27,7 26,3
PL ACT
Alpha Group
Sales, gross profit in mEUR
Gross margin in %
2006..2013
Sales 707
Compared to 2009 gross margin
will increase by 7,7pp (from 18,6% to 26,3%) Add message
© Rolf Hichert

623
18,7
21,6
13
69
2006
351
76
2007
593
127
2008
662
123
2009
21,5
18,6
649
2010 2011 2012 2013
Gross margin (%)
Gross profit
668
178
212 185 186
28,6
32,7
27,7 26,3
PL ACT
Alpha Group
Sales, gross profit in mEUR
Gross margin in %
2006..2013
Sales 707
Compared to 2009 gross margin
will increase by 7,7pp (from 18,6% to 26,3%)
© Rolf Hichert
Highlight message

623
18,7
21,6
13
69
2006
351
76
2007
593
127
2008
662
123
2009
21,5
18,6
649
2010 2011 2012 2013
Gross margin (%)
Gross profit
668
178
212 185 186
28,6
32,7
27,7 26,3
PL ACT
Alpha Group
Sales, gross profit in mEUR
Gross margin in %
2006..2013
+7.7pp
Sales 707
Highlight message
Compared to 2009 gross margin
will increase by 7,7pp (from 18,6% to 26,3%)
© Rolf Hichert

623
18,7
21,6
13
69
2006
351
76
2007
593
127
2008
662
123
2009
21,5
18,6
649
2010 2011 2012 2013
Gross margin (%)
Gross profit
668
178
212 185 186
28,6
32,7
27,7 26,3
PL ACT
Alpha Group
Sales, gross profit in mEUR
Gross margin in %
2006..2013
+7.7pp
Sales 707
Compared to 2009 gross margin
will increase by 7,7pp (from 18,6% to 26,3%)
© Rolf Hichert

623
18,7
21,6
13
69
2006
351
76
2007
593
127
2008
662
123
2009
21,5
18,6
649
2010 2011 2012 2013
Gross margin (%)
Gross profit
668
178
212 185 186
28,6
32,7
27,7 26,3
PL ACT
Alpha Group
Sales, gross profit in mEUR
Gross margin in %
2006..2013
Sales 707
© Rolf Hichert
Compared to 2009 gross margin
will increase by 7,7pp (from 18,6% to 26,3%)
Change message

623
18,7
21,6
13
69
2006
351
76
2007
593
127
2008
662
123
2009
21,5
18,6
649
2010 2011 2012 2013
Gross margin (%)
Gross profit
668
178
212 185 186
28,6
32,7
27,7 26,3
PL ACT
Alpha Group
Sales, gross profit in mEUR
Gross margin in %
2006..2013
Sales 707
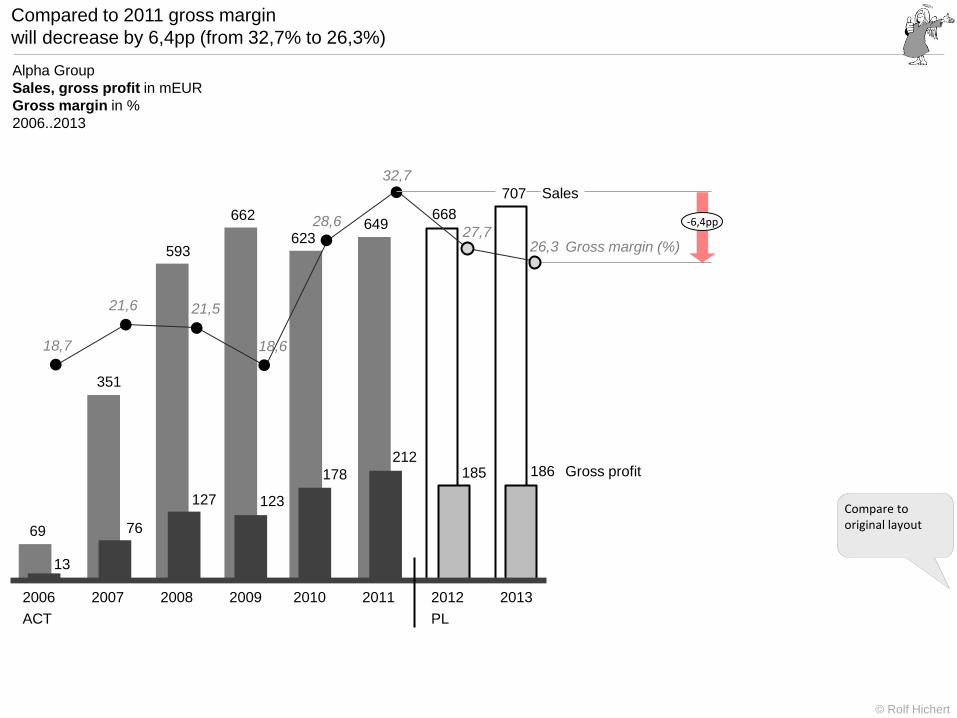
Compared to 2011 gross margin
will decrease by 6,4pp (from 32,7% to 26,3%)
© Rolf Hichert
Change message

623
18,7
21,6
13
69
2006
351
76
2007
593
127
2008
662
123
2009
21,5
18,6
649
2010 2011 2012 2013
Gross margin (%)
Gross profit
668
178
212 185 186
28,6
32,7
27,7 26,3
PL ACT
Alpha Group
Sales, gross profit in mEUR
Gross margin in %
2006..2013
Sales 707
Compared to 2011 gross margin
will decrease by 6,4pp (from 32,7% to 26,3%)
© Rolf Hichert
Highlight message

623
18,7
21,6
13
69
2006
351
76
2007
593
127
2008
662
123
2009
21,5
18,6
649
2010 2011 2012 2013
Gross margin (%)
Gross profit
668
178
212 185 186
28,6
32,7
27,7 26,3
PL ACT
Alpha Group
Sales, gross profit in mEUR
Gross margin in %
2006..2013
Sales 707
-6,4pp
Compared to 2011 gross margin
will decrease by 6,4pp (from 32,7% to 26,3%)
© Rolf Hichert
Compare to original layout

Compare to original layout
Source: Qliktech

If you want to see more visit us at www.hichert.com –
or directly at www.vorher-nachher.hichert.com
Regards
Rolf Hichert
www.hichert.com
© 2011 HICHERT+PARTNER AG


