Download - Notes - ESF | SUNY ESF

PPT Slide
file:///Volumes/Web/WWW/ce/conferences/GIS%20Present/testfarm/sld001.htm[4/6/11 9:39:52 AM]
Slide 1 of 32
Notes:
This presentaion will describe the background of establishing an agricultural district in Westchester County andhow GIS was used to map the district.

PPT Slide
file:///Volumes/Web/WWW/ce/conferences/GIS%20Present/testfarm/sld032.htm[4/6/11 9:40:01 AM]
Slide 32 of 32
Notes:
Adoption of District by County BOL November 2000
Preparation of an Agriculture & Farmland Protection Plan
Develop a program to preserve productive farmland through the Purchase of Development Rights
Apply for state and federal funding for Farmland Protection
Agriculture Environmental Management (AEM) in Croton Watershed
New GIS coverage allows for analysis with other county data
New source of information for Westchester County and the public to assist in decision making and problemsolving

PPT Slide
file:///Volumes/Web/WWW/ce/conferences/GIS%20Present/testfarm/sld031.htm[4/6/11 9:40:01 AM]
Slide 31 of 32
Notes:
Here, farms are displayed based on farm type

PPT Slide
file:///Volumes/Web/WWW/ce/conferences/GIS%20Present/testfarm/sld030.htm[4/6/11 9:40:01 AM]
Slide 30 of 32
Notes:
Provide Directions and a view of the property

PPT Slide
file:///Volumes/Web/WWW/ce/conferences/GIS%20Present/testfarm/sld029.htm[4/6/11 9:40:01 AM]
Slide 29 of 32
Notes:
The property is identified and the view extent is set to the selection
Functionality added to allow to obtain information on property acreage

PPT Slide
file:///Volumes/Web/WWW/ce/conferences/GIS%20Present/testfarm/sld028.htm[4/6/11 9:40:00 AM]
Slide 28 of 32

PPT Slide
file:///Volumes/Web/WWW/ce/conferences/GIS%20Present/testfarm/sld027.htm[4/6/11 9:40:00 AM]
Slide 27 of 32
Notes:
Displaying farm parcels for the Town of Bedford

PPT Slide
file:///Volumes/Web/WWW/ce/conferences/GIS%20Present/testfarm/sld026.htm[4/6/11 9:40:00 AM]
Slide 26 of 32
Notes:
Application created to allow users to make selections, display and get data on farms

PPT Slide
file:///Volumes/Web/WWW/ce/conferences/GIS%20Present/testfarm/sld025.htm[4/6/11 9:39:59 AM]
Slide 25 of 32
Notes:
Map showing individual farms in North Salem – Farm Enterprises occupy nearly half of the towns land area

PPT Slide
file:///Volumes/Web/WWW/ce/conferences/GIS%20Present/testfarm/sld024.htm[4/6/11 9:39:59 AM]
Slide 24 of 32
Notes:
Digitized data was then joined with previously created data to form one final dataset.

PPT Slide
file:///Volumes/Web/WWW/ce/conferences/GIS%20Present/testfarm/sld023.htm[4/6/11 9:39:59 AM]
Slide 23 of 32
Notes:
Data cleanup after digitizing from scanned tax map images

PPT Slide
file:///Volumes/Web/WWW/ce/conferences/GIS%20Present/testfarm/sld022.htm[4/6/11 9:39:58 AM]
Slide 22 of 32
Notes:
map sheets can be registered when properties span additional sheets

PPT Slide
file:///Volumes/Web/WWW/ce/conferences/GIS%20Present/testfarm/sld021.htm[4/6/11 9:39:58 AM]
Slide 21 of 32
Notes:
Parcel Boundaries are then digitized from a geo-referenced GRID

PPT Slide
file:///Volumes/Web/WWW/ce/conferences/GIS%20Present/testfarm/sld020.htm[4/6/11 9:39:58 AM]
Slide 20 of 32
Notes:
Using Arcview you can create a GRID from the tax map image which is than registered and projected with anin house extension
PPT Slide
file:///Volumes/Web/WWW/ce/conferences/GIS%20Present/testfarm/sld019.htm[4/6/11 9:39:58 AM]
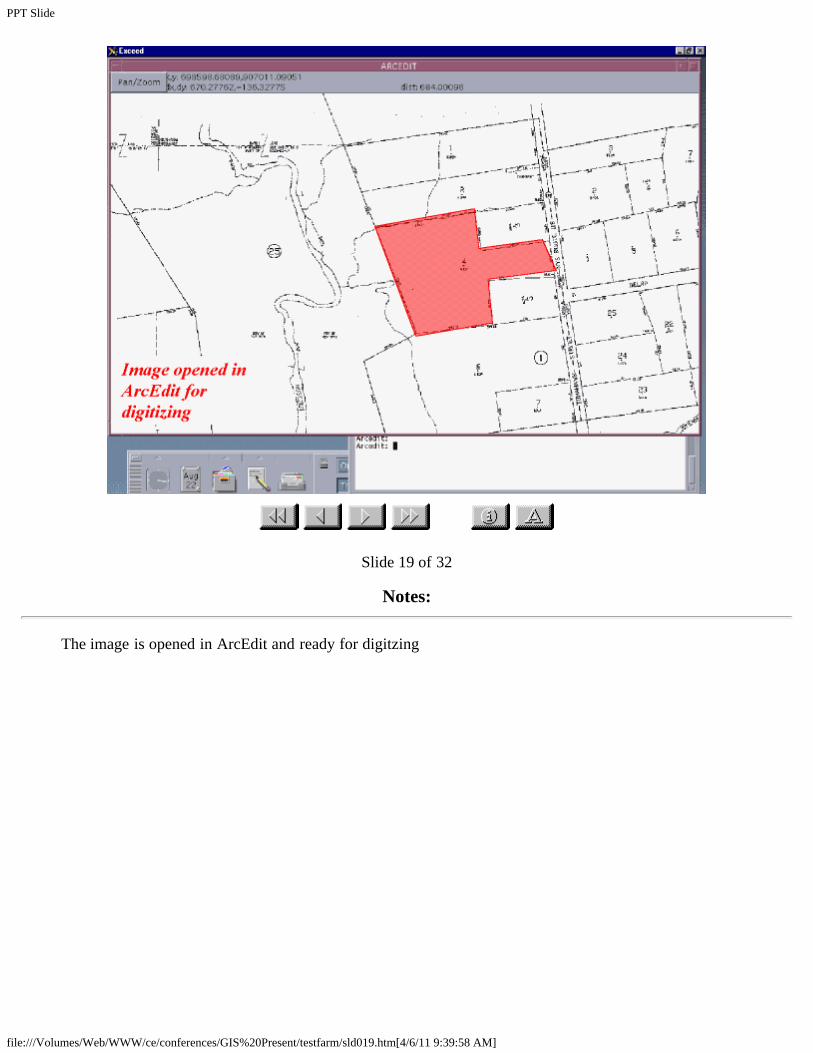
Slide 19 of 32
Notes:
The image is opened in ArcEdit and ready for digitzing

PPT Slide
file:///Volumes/Web/WWW/ce/conferences/GIS%20Present/testfarm/sld018.htm[4/6/11 9:39:57 AM]
Slide 18 of 32
Notes:
This slide illustrates our approach to digitizing where no digital parcel data is available. Using Pre-scanneddigital tax map images from WINData, we were able to register the image so it the boundaries could be digitizedin Arc/Info. Clicking on X Y registration and entering X Y coordinates.
PPT Slide
file:///Volumes/Web/WWW/ce/conferences/GIS%20Present/testfarm/sld017.htm[4/6/11 9:39:57 AM]
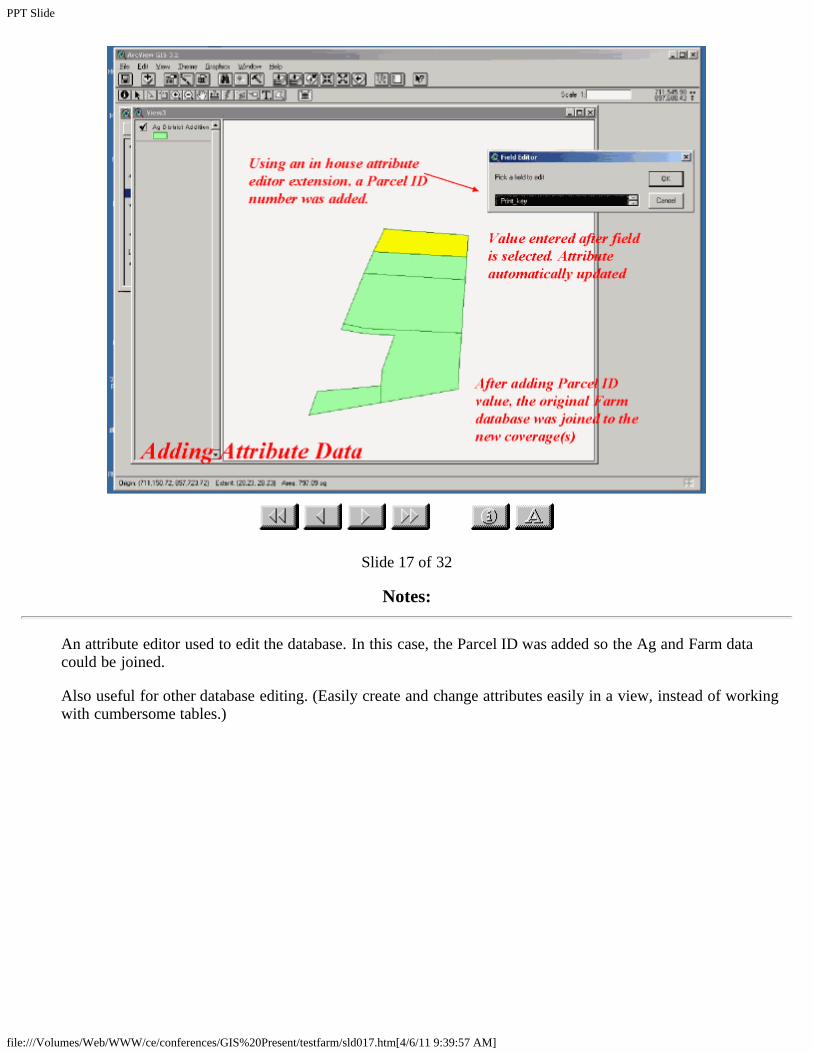
Slide 17 of 32
Notes:
An attribute editor used to edit the database. In this case, the Parcel ID was added so the Ag and Farm datacould be joined.
Also useful for other database editing. (Easily create and change attributes easily in a view, instead of workingwith cumbersome tables.)

PPT Slide
file:///Volumes/Web/WWW/ce/conferences/GIS%20Present/testfarm/sld016.htm[4/6/11 9:39:57 AM]
Slide 16 of 32
Notes:
For areas where only digital tax parcels were available without attribute data (or with bad SBL Data), scannedtax map images were used to visually identify tax lots, and the parcels were than taken from the digitalcoverage. 3-4 municipalities
PPT Slide
file:///Volumes/Web/WWW/ce/conferences/GIS%20Present/testfarm/sld015.htm[4/6/11 9:39:56 AM]
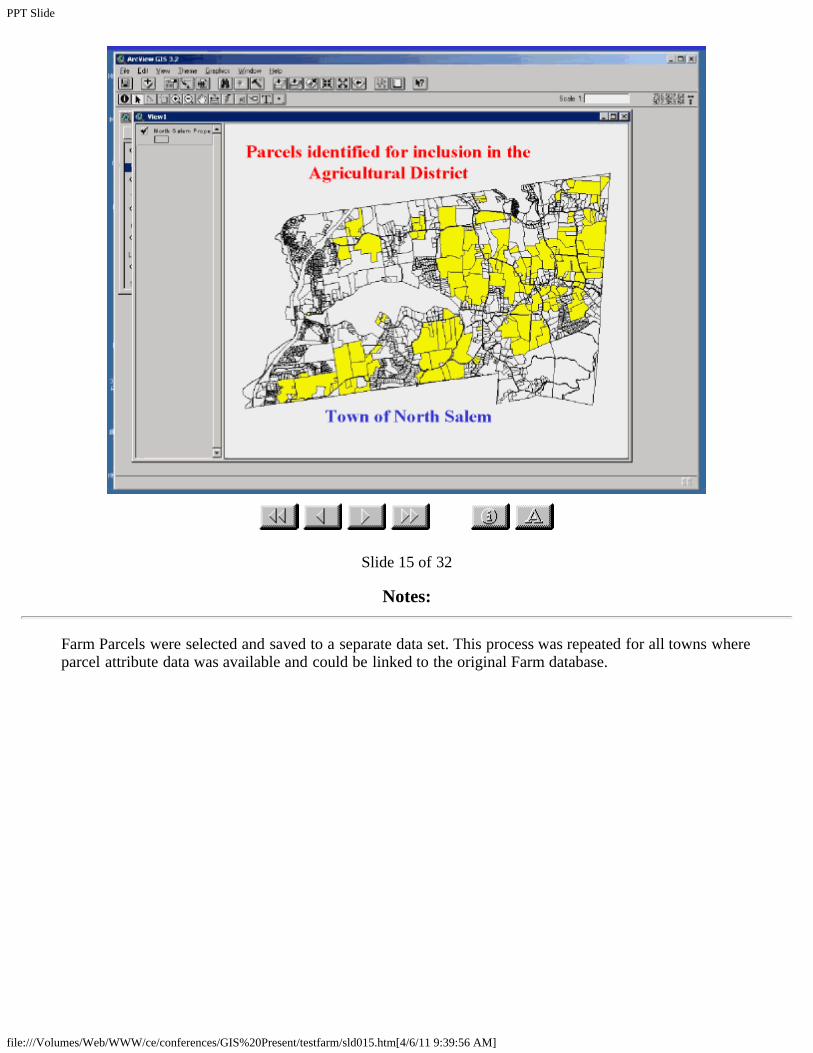
Slide 15 of 32
Notes:
Farm Parcels were selected and saved to a separate data set. This process was repeated for all towns whereparcel attribute data was available and could be linked to the original Farm database.

PPT Slide
file:///Volumes/Web/WWW/ce/conferences/GIS%20Present/testfarm/sld014.htm[4/6/11 9:39:56 AM]
Slide 14 of 32
Notes:
We started by joining the Farm database with tax databases for municipalities that provided digital tax parcelshaving attributes
to the parcel data enabled us to select parcels having a farm name?

PPT Slide
file:///Volumes/Web/WWW/ce/conferences/GIS%20Present/testfarm/sld013.htm[4/6/11 9:39:56 AM]
Slide 13 of 32
Notes:
Our main challenge was to reconcile the differences of source data for municipal tax parcels. Unlike most NYScounties, tax mapping in Westchester is done at the municipal, not county, level resulting in disparate data sets.Each municipality had different tax parcel issues.
This slide speaks to the dysfunctional disparity of digital data
For some communities we were able to work with complete tax parcel coverage with attribute data,
Others provided only digital linework with no attribute (tax ID) data.
Some watershed communites only provided digital coverage of areas in their towns within the NYC watershedonly.
Yet others had no digital data available.
Ag and Farmland Board database with Parcel ID and other attributes Tax map (parcel) data for somecommunities we could link database to by SBL Some parcel data with out attributes(geometry only) Prescannedimages of parcel data (not georeferenced) that could be used for areas with no parcel data
Methodology:

PPT Slide
file:///Volumes/Web/WWW/ce/conferences/GIS%20Present/testfarm/sld013.htm[4/6/11 9:39:56 AM]
Acquire parcels and attributes from existing Digital files by joining Ag database with Parcel data
Acquire parcel geometry from Digital files, create attributes
Create parcel boundaries by digitizing from existing images, then create attributes

PPT Slide
file:///Volumes/Web/WWW/ce/conferences/GIS%20Present/testfarm/sld012.htm[4/6/11 9:39:56 AM]
Slide 12 of 32
Notes:
County Executive Spano establishes Agricultural and Farmland Protection Board in 1999 and County Board ofLegislators appoints 11 members from Westchester’s farming community, including one member from thePlanning Department. The board in cooperation with the planning dept. identified and compiled a database ofnumerous and varied properties (listed by SBL) defined as “agricultural enterprises” which was the basis forcompiling the map.

PPT Slide
file:///Volumes/Web/WWW/ce/conferences/GIS%20Present/testfarm/sld011.htm[4/6/11 9:39:55 AM]
Slide 11 of 32

PPT Slide
file:///Volumes/Web/WWW/ce/conferences/GIS%20Present/testfarm/sld010.htm[4/6/11 9:39:55 AM]
Slide 10 of 32

PPT Slide
file:///Volumes/Web/WWW/ce/conferences/GIS%20Present/testfarm/sld009.htm[4/6/11 9:39:55 AM]
Slide 9 of 32

PPT Slide
file:///Volumes/Web/WWW/ce/conferences/GIS%20Present/testfarm/sld008.htm[4/6/11 9:39:54 AM]
Slide 8 of 32
Notes:
The reasons for protecting farmland in Westchester are many and varied and go beyond the obvious ones ofsimply food production. Among the top reasons being preservation of open space and rural character, protectionof watershed lands and agritourism - $108 million net economic benefit to county

PPT Slide
file:///Volumes/Web/WWW/ce/conferences/GIS%20Present/testfarm/sld007.htm[4/6/11 9:39:54 AM]
Slide 7 of 32
Notes:
“McMansions” of mammoth sizes have become a major cash crop and are sprouting up on developable land.Farms make very attractive development sites

PPT Slide
file:///Volumes/Web/WWW/ce/conferences/GIS%20Present/testfarm/sld006.htm[4/6/11 9:39:54 AM]
Slide 6 of 32
Notes:
Population has steadily grown and is creeping towards 1 million, making it larger than eight states. Acorresponding decrease in Farm acreage has also occurred with Westchester losing nearly 4000 acres, or 36% offarmland in the eleven years between 1983 and 1994.

PPT Slide
file:///Volumes/Web/WWW/ce/conferences/GIS%20Present/testfarm/sld005.htm[4/6/11 9:39:54 AM]
Slide 5 of 32

PPT Slide
file:///Volumes/Web/WWW/ce/conferences/GIS%20Present/testfarm/sld004.htm[4/6/11 9:39:53 AM]
Slide 4 of 32
Notes:
Density is kept low by zoning, lack of sewer and water infrastructure and NYC regs in the croton watershedarea, which encompasses over a third of the counties area. Most of the counties farms are in this area.
PPT Slide
file:///Volumes/Web/WWW/ce/conferences/GIS%20Present/testfarm/sld003.htm[4/6/11 9:39:53 AM]
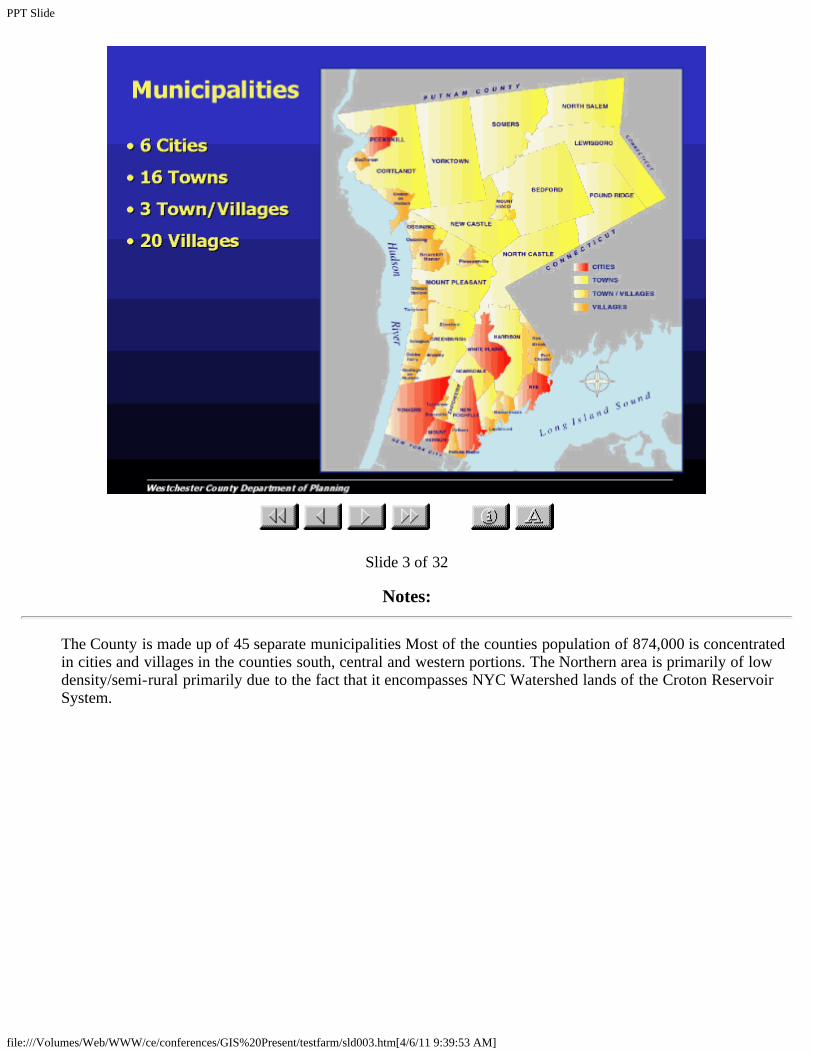
Slide 3 of 32
Notes:
The County is made up of 45 separate municipalities Most of the counties population of 874,000 is concentratedin cities and villages in the counties south, central and western portions. The Northern area is primarily of lowdensity/semi-rural primarily due to the fact that it encompasses NYC Watershed lands of the Croton ReservoirSystem.

PPT Slide
file:///Volumes/Web/WWW/ce/conferences/GIS%20Present/testfarm/sld002.htm[4/6/11 9:39:53 AM]
Slide 2 of 32
Notes:
Westchester is located immediately north of New York City – The County covers an area of 450 Square miles.Westchester is one of the last counties outside of NYC to undertake adoption of an Ag District.


