November 2, 2007
ASSOCIATION OF
DMIABRAZILIAN BEEF EXPORTERS

Meat Sector
Great Opportunities
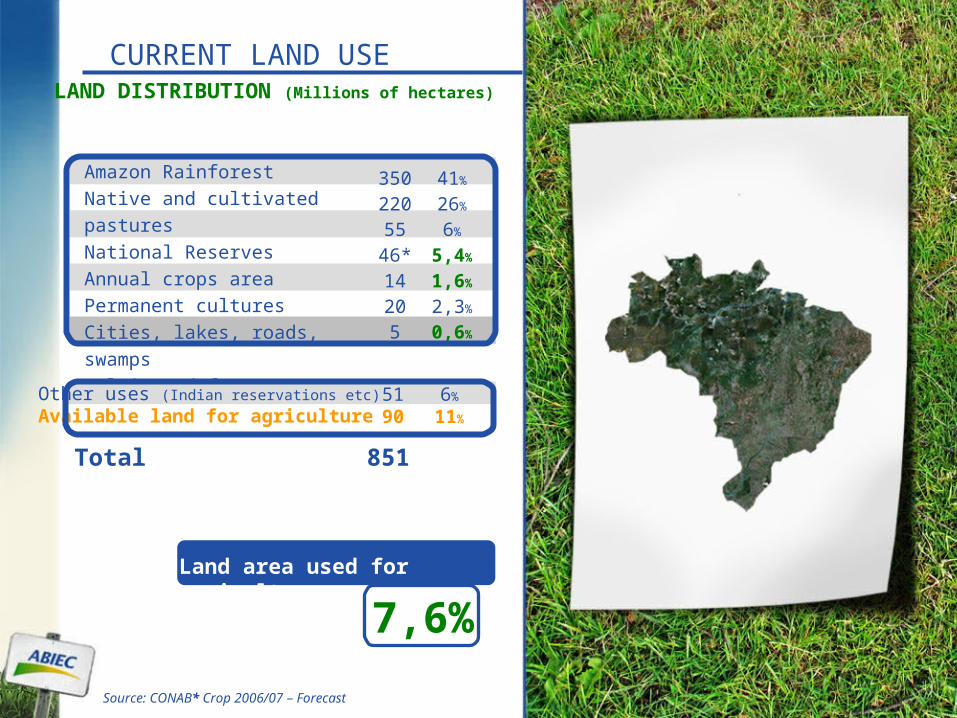
CURRENT LAND USELAND DISTRIBUTION (Millions of hectares)
Amazon Rainforest
Native and cultivated pastures
National Reserves
Annual crops area
Permanent cultures
Cities, lakes, roads, swamps
Cultivated forests
3502205546*14205
41%
26%
6%
5,4%
1,6%
2,3%
0,6%
851
Other uses (Indian reservations etc)
Available land for agriculture5190
6%
11%
Total
Source: CONAB* Crop 2006/07 – Forecast
7,6%Land area used for agriculture

AMAZON
Amazon Forest
“Cerrado”
VEGETATION
Legal Amazon (5 millions Km2) X Amazon Rainforest (3,5 millions Km2)
“Cerrado” (Savanna): Agriculture and Livestock Production
Preservation is a National Policy
Cattle raised in the Amazon region is for local consumption
Population: 19.676.745 inhab.Area: 5 millions Km2
3,9 inhab./Km2

BRAZILIAN BEEF IN THE GLOBAL MARKET, 2006
CATTLE HERD HEAD
ANNUAL SLAUGHTERING
BEEF PRODUCTION YEAR
BEEF EXPORTS
CONSUMPTION PER CAPITA
BEEF PROCESSING PLANTS
207 Millions
44 Millions
8,9 Million Tons CWE
2,4 Million Tons CWE
35 KG
1500
% of the world
21%
18%
16%
32%
Safe beef from the farm to the consumer’s table
1 out of every 3 Kg of beef traded worldwide is Brazilian
Source: IBGE, FNP, USDA, SECEX, CNPC


Grass fed animals
Lean and healthy beef
No hormones used
Traceability and animal welfare
BRAZIL, LAND OF “CHURRASCO”
BRAZILIAN BEEF
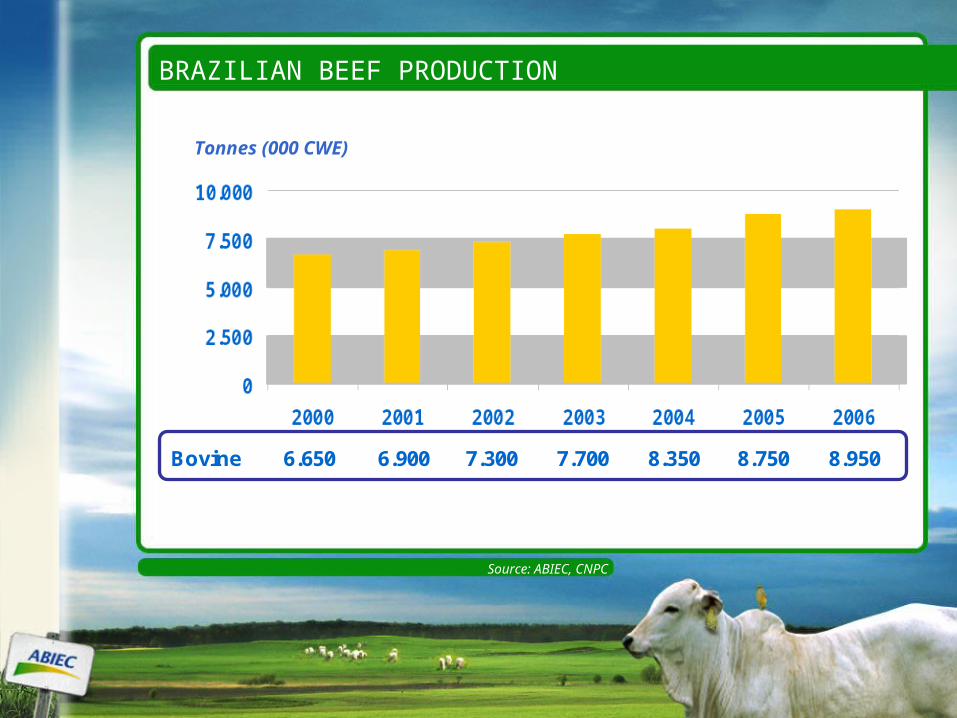
BRAZILIAN BEEF PRODUCTION
Source: ABIEC, CNPC
Bovine 6.650 6.900 7.300 7.700 8.350 8.750 8.950
Tonnes (000 CWE)
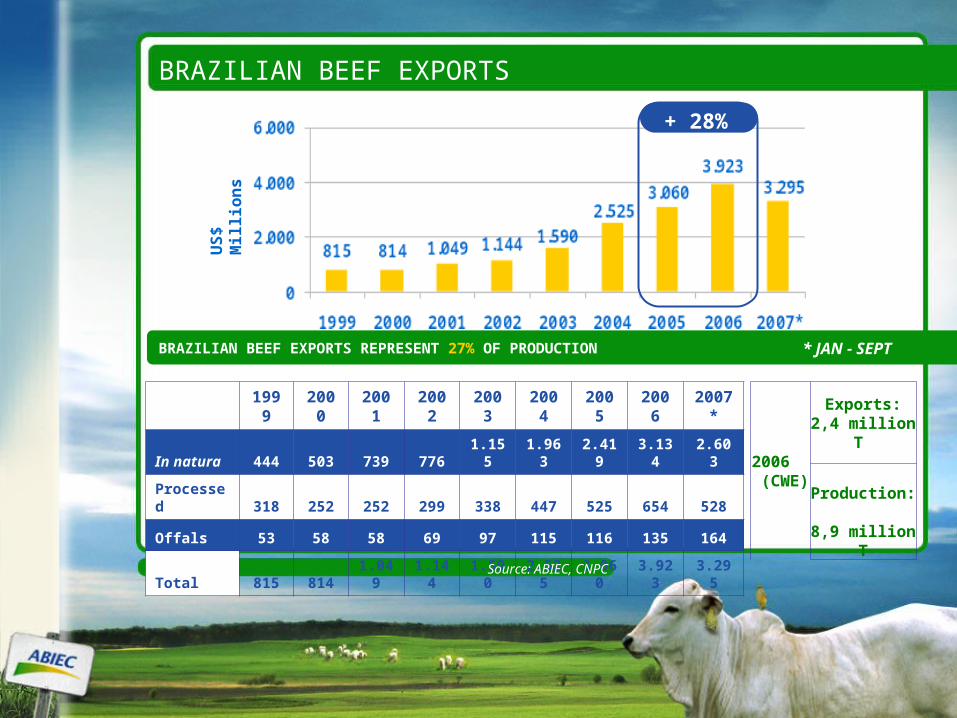
BRAZILIAN BEEF EXPORTS
US
$
Mil
lio
ns
+ 28%
2006 (CWE)
Exports: 2,4 million T
Production: 8,9 million T
BRAZILIAN BEEF EXPORTS REPRESENT 27% OF PRODUCTION
199
9200
0 2001 2002 2003 2004 2005 20062007
*
In natura 444 503 739 776 1.155 1.963 2.419 3.134 2.603
Processed 318 252 252 299 338 447 525 654 528
Offals 53 58 58 69 97 115 116 135 164
Total 815 814 1.049 1.144 1.590 2.525 3.060 3.923 3.295
Source: ABIEC, CNPC
* JAN - SEPT

N. Zeland8%
USA17%
Brazil16%
EU8%
Canada9%
Australia21%
Others21% Brazil
32%
Uruguay7%
USA7%
Others21%
Argentina7%
Australia19%
N. Zealand7%
WORLD BEEF TRADE - EXPORTS
Source: FAS/USDA
2002 2006

In natura
2006 2005 2004 % (06/04)EU-25 1.009.218 806.729 762.338 32,38Russia 743.187 555.273 239.107 210,82Egypt 364.185 252.714 161.853 125,01Algeria 101.707 75.693 61.434 65,55Bulgaria 101.562 69.424 27.336 271,53Saudi Arabia 80.983 57.686 72.867 11,14Israel 69.423 37.863 42.399 63,74Romania 48.921 37.832 12 -Switzerland 46.349 36.693 29.504 57,09
Source: MDIC
USD 000(Fresh/Chilled and Frozen)
BRAZILIAN BEEF: IMPORTANT MARKETS
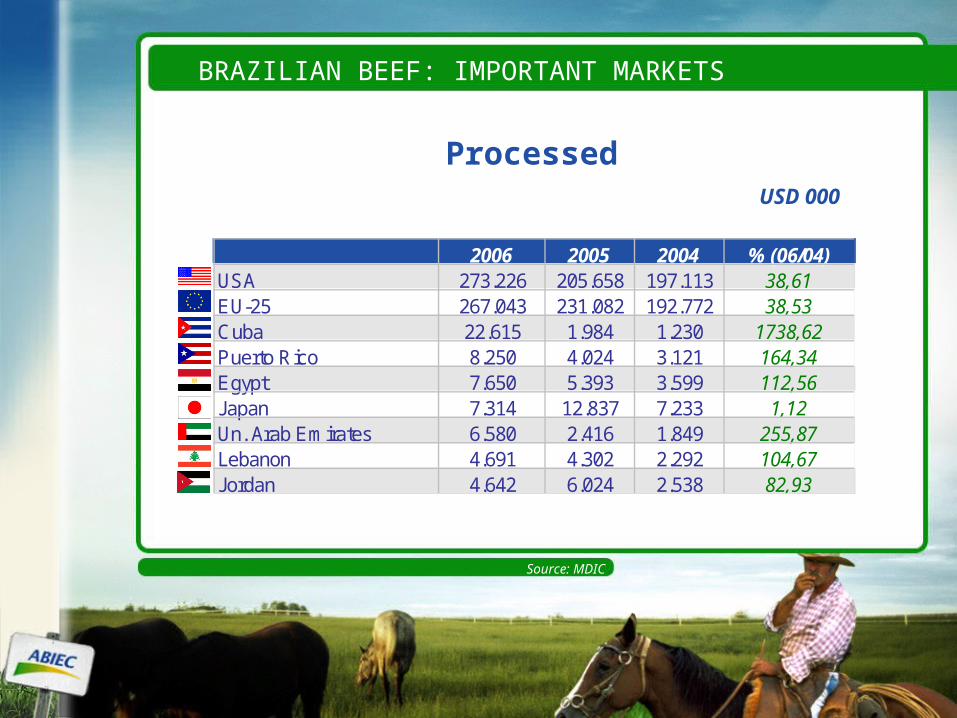
2006 2005 2004 % (06/04)USA 273.226 205.658 197.113 38,61EU-25 267.043 231.082 192.772 38,53Cuba 22.615 1.984 1.230 1738,62Puerto Rico 8.250 4.024 3.121 164,34Egypt 7.650 5.393 3.599 112,56Japan 7.314 12.837 7.233 1,12Un. Arab Emirates 6.580 2.416 1.849 255,87Lebanon 4.691 4.302 2.292 104,67Jordan 4.642 6.024 2.538 82,93
BRAZILIAN BEEF: IMPORTANT MARKETS
Processed
Source: MDIC
USD 000
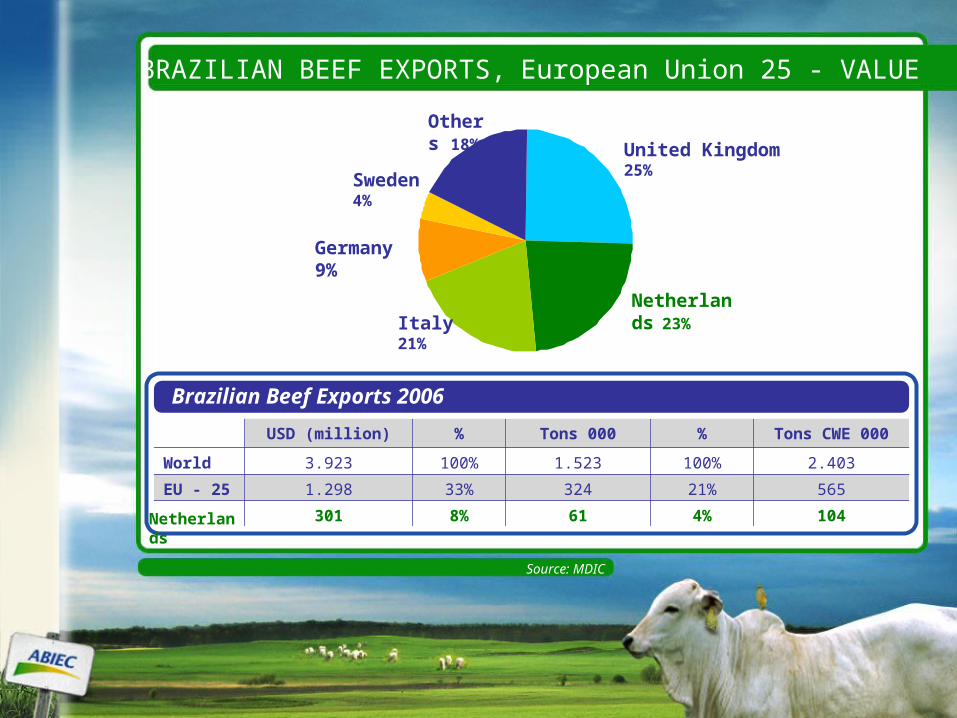
BRAZILIAN BEEF EXPORTS, European Union 25 - VALUE
USD (million) % Tons 000 % Tons CWE 000
World 3.923 100% 1.523 100% 2.403
EU - 25 1.298 33% 324 21% 565
301 8% 61 4% 104
Brazilian Beef Exports 2006
Sweden 4%
Netherlands
23%
Others 18% United Kingdom
25%
Germany 9%
Italy
21%
Source: MDIC
Netherlands
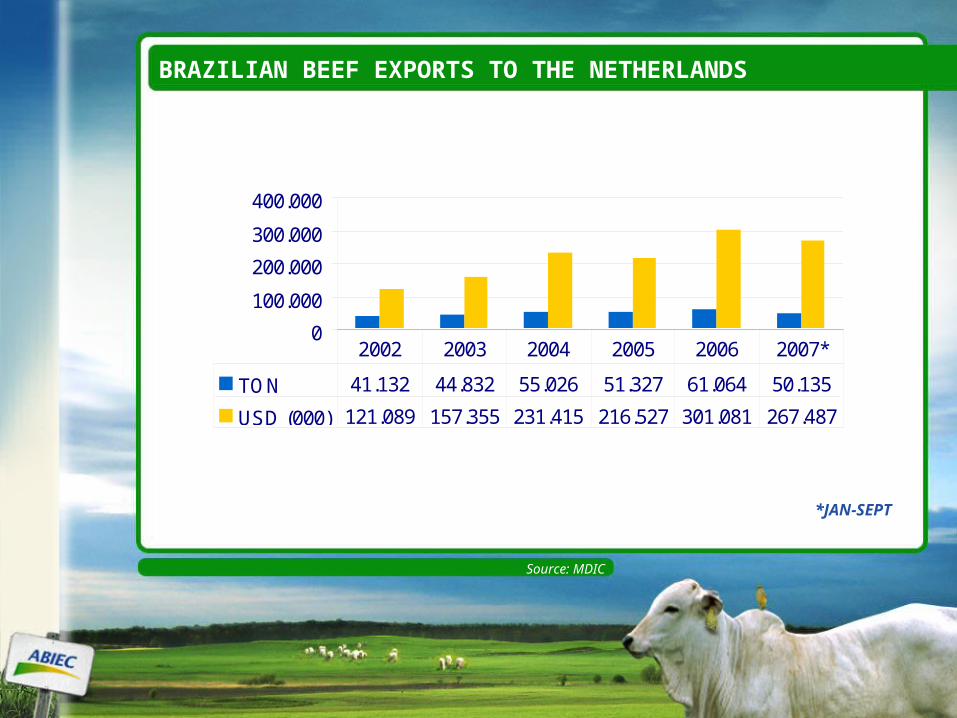
BRAZILIAN BEEF EXPORTS TO THE NETHERLANDS
Source: MDIC
*JAN-SEPT
0
100.000
200.000
300.000
400.000
TON 41.132 44.832 55.026 51.327 61.064 50.135
USD (000) 121.089 157.355 231.415 216.527 301.081 267.487
2002 2003 2004 2005 2006 2007*
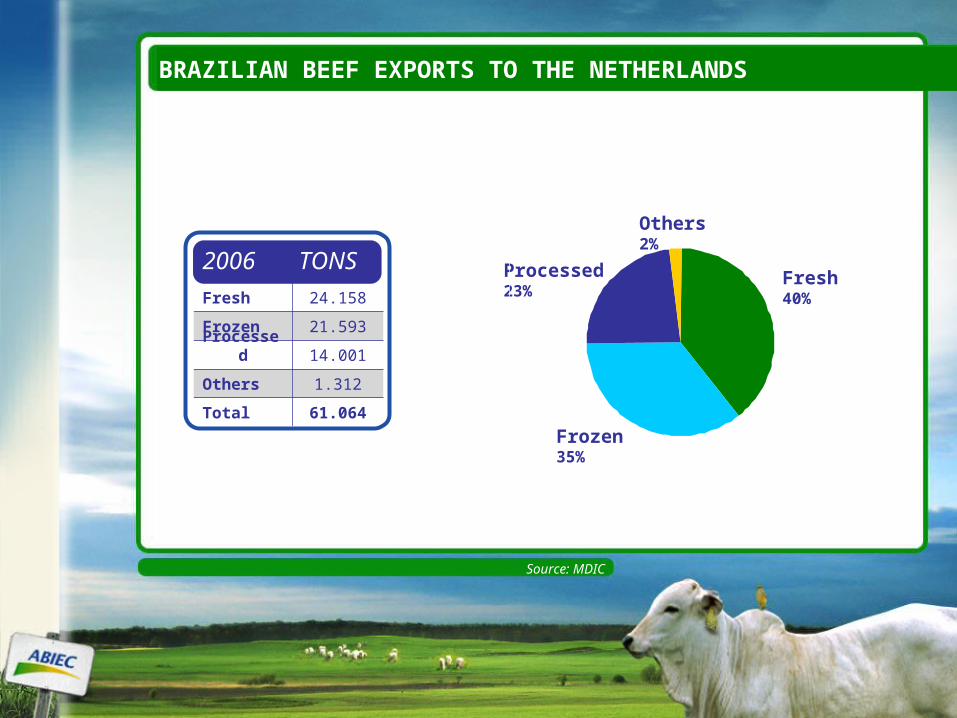
Others 2%
Fresh 40%
Frozen 35%
Processed 23%
Fresh 24.158
Frozen 21.593Processe
d 14.001
Others 1.312
Total 61.064
2006 TONS
Source: MDIC
BRAZILIAN BEEF EXPORTS TO THE NETHERLANDS

BRAZILIAN BEEF MARKETS 2006BRAZILIAN BEEF WAS EXPORTED TO OVER 180 COUNTRIES
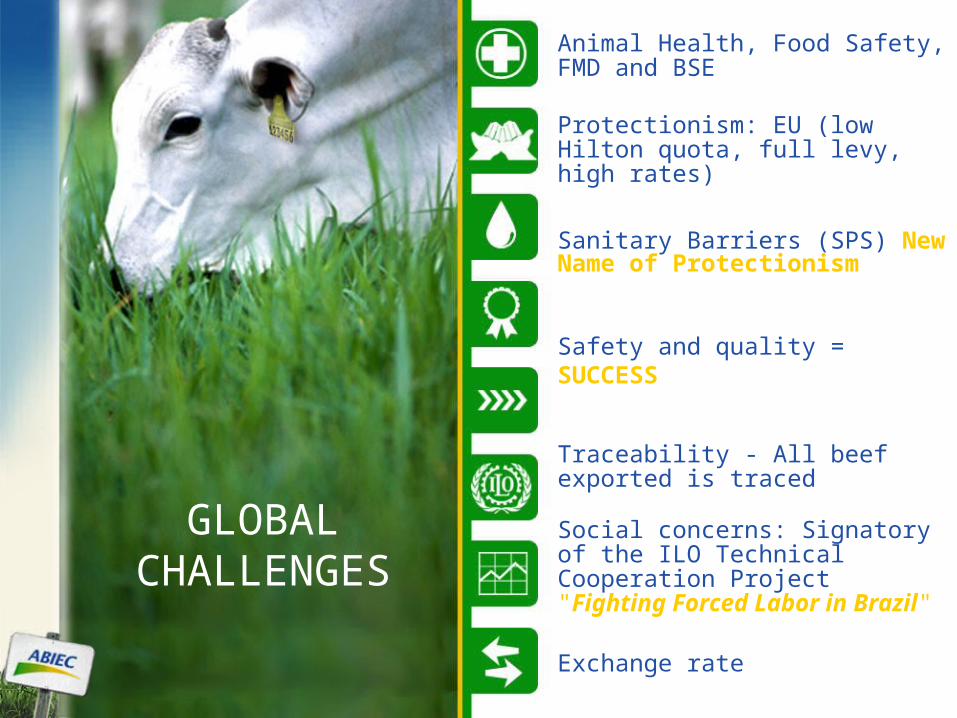
GLOBALCHALLENGES
Animal Health, Food Safety, FMD and BSE
Protectionism: EU (low Hilton quota, full levy, high rates)
Sanitary Barriers (SPS) New Name of Protectionism
Safety and quality = SUCCESS
Traceability - All beef exported is traced
Social concerns: Signatory of the ILO Technical Cooperation Project "Fighting Forced Labor in Brazil"
Exchange rate
Trade Negotiations: WTO
ABIEC’S ASSOCIATED COMPANIES
ASSOCIATION OF BRAZILIAN BEEF EXPORTERS
THANK YOU!
www.abiec.com.brwww.brazilianbeef.org.br
Marcus Vinicius Pratini de Moraes


