
NUMBER C 183 MARCH 2016 REPORT
/m3
Swedish sources and pathways for microplastics to the marine environment A review of existing data This report was revised in March 2017
Kerstin Magnusson, Karin Eliasson, Anna Fråne, Kalle Haikonen, Johan Hultén, Mikael Olshammar, Johanna Stadmark, Anais Voisin

Author: Kerstin Magnusson, Karin Eliasson, Anna Fråne, Kalle Haikonen, Johan Hultén, Mikael Olshammar, Johanna Stadmark, Anais Voisin, IVL Svenska Miljöinstitutet Funded by: Swedish Environmental Protection Agency Report number: C 183 Edition: Only available as PDF for individual printing Revision: This report was revised 2017-03-21 © IVL Swedish Environmental Research Institute 2016 IVL Swedish Environmental Research Institute Ltd., P.O Box 210 60, S-100 31 Stockholm, Sweden Phone: +46-(0)10-7886500 Fax: +46-(0)10-5886590 www.ivl.se This report has been reviewed and approved in accordance with IVL's audited and approved management system.

3
Table of Contents
Summary ....................................................................................................................................................................... 5
Sammanfattning ............................................................................................................................................................. 7
Abbreviations ................................................................................................................................................................. 9
1 Introduction ....................................................................................................................................................... 11
1.1 Background ............................................................................................................................................... 11
1.2 Aim and scope of the study ....................................................................................................................... 11
1.3 Definition of microplastic .......................................................................................................................... 12
1.3.1 Definitions of size and materials ....................................................................................................... 12
1.3.2 Primary and secondary microplastics ............................................................................................... 12
2 Plastic flows in Sweden ...................................................................................................................................... 14
3 Methodology ...................................................................................................................................................... 16
Selection of possible sources and pathways for marine microplastics ................................................................... 16
3.1 Data sources .............................................................................................................................................. 16
3.2 Handling of data ........................................................................................................................................ 16
4 Sources of microplastics in the marine environment ......................................................................................... 17
4.1 Intentionally produced microplastics ........................................................................................................ 17
4.1.1 Industrial production and handling of plastic pellets ........................................................................ 17
4.1.2 Abrasive blasting with plastic media ................................................................................................. 20
4.1.3 Pharmaceutical products .................................................................................................................. 21
4.1.4 Personal care products (PCPs) .......................................................................................................... 22
4.2 Emissions from indoor activities................................................................................................................ 24
4.2.1 Microplastics from dust .................................................................................................................... 24
4.2.2 Microplastics from laundry ............................................................................................................... 26
4.3 Emissions from outdoor activities on land ................................................................................................ 29
4.3.1 Building, maintenance and construction work ................................................................................. 29
4.3.2 Loss of microplastics from artificial turfs .......................................................................................... 31
4.3.3 Agricultural plastics ........................................................................................................................... 34
4.3.4 Road wear and abrasion of tyres ...................................................................................................... 35
4.4 Microplastics released from waste management and recycling ............................................................... 38
4.4.1 Landfills ............................................................................................................................................. 38
4.4.2 Plastic recycling facilities ................................................................................................................... 39
4.4.3 Organic waste treatment .................................................................................................................. 40

4
4.4.4 Other waste management ................................................................................................................ 43
4.5 Littering ..................................................................................................................................................... 43
4.6 Emissions from activities at sea ................................................................................................................. 47
4.6.1 Wear from boat hulls ........................................................................................................................ 47
4.6.2 Wear of fishing gear and floating devices ......................................................................................... 51
4.6.3 Microplastics from activities onboard ships ..................................................................................... 55
5 Summary of pathways for microplastics to the sea ........................................................................................... 56
5.1 Input from land based sources .................................................................................................................. 56
5.1.1 Wastewater treatment plants (WWTPs) ........................................................................................... 56
5.1.2 Spreading of sewage sludge .............................................................................................................. 59
5.1.3 Stormwater runoff ............................................................................................................................ 61
5.1.4 Snow disposal ................................................................................................................................... 62
5.1.5 Atmospheric deposition .................................................................................................................... 63
5.2 Input from sea-based sources ................................................................................................................... 64
5.2.1 Input directly to the sea .................................................................................................................... 64
5.2.2 Transportation by rivers and sea currents ........................................................................................ 65
6 Occurrence of microplastics in the Swedish marine environment..................................................................... 67
6.1 Microplastics in the marine environment ................................................................................................. 67
6.2 Polymer types represented among microplastics collected in the sea ..................................................... 74
7 Sources to marine microplastics in Sweden, general conclusions and knowledge gaps .................................... 74
7.1 Summary of all sources and pathways ...................................................................................................... 74
7.2 Concluding remarks ................................................................................................................................... 76
8 References ......................................................................................................................................................... 78
8.1 Scientific articles and reports .................................................................................................................... 78
8.2 Personal communication ........................................................................................................................... 88

IVL-rapport C 183 Swedish sources and pathways for microplastics to the marine environment
5
Summary This report is an updated version of “Swedish sources and pathways for microplastics to the marine environment – A
review of existing data” from 2016. The sections updated in this version consider the potential emissions of
microplastics originating from tyres, artificial turfs, paint from boats hulls, and laundry.
The Swedish Environmental Protection Agency has been assigned to identify important sources of microplastics in
the sea and to work for reducing the production and emission of microplastics from these sources. Within the scope
of this governmental assignment, IVL Swedish Environmental Research Institute has been funded by the Swedish
Environmental Protection Agency to review the sources of microplastics and the pathways microplastics take to
reach the sea.
A range of potential sources for microplastics and the pathways by which microplastics can reach the sea were
selected for the review. The sources included both intentionally produced plastic pellets and plastic particles
formed from fragmentation of larger plastic items. The pathways were primarily stormwater, wastewater and
atmospheric deposition. For sea-based sources particles are discharged directly to the sea. Information was
collected from scientific articles, reports and through personal communication with experts in relevant areas.
Where the available data allowed, calculations were done to quantify the amounts of microplastics.
For sea-based sources, like abrasion of fishing gear, jetties or boat hulls, all emitted microplastics will reach the sea.
However, to quantify land-based sources, data is needed on both emissions and on the pathways leading from the
emitting sources to the sea. One of the few sectors where published data on microplastics was available from both
source and pathway was the households. The yearly load of plastic particles from personal care products, synthetic
fibres from laundry and household dust that is discharged to Swedish municipal wastewater was estimated to 67-
927 tons. The major part of this is retained in the wastewater treatment plants and around 1.4–19 tons per year are
estimated to be released to the water recipient. Most of these particles were >300 µm and the fate of smaller
particles is less known, in particular for those <20 µm.
The most important emissions for microplastics were found to be from road wear and abrasion of tyres.
Approximately 7 670 tons of microplastics are released from tyres every year. Since data on microplastic content in
stormwater from roads is very scarce it is however uncertain how much of these particles that is transported to
water recipients and how much that is permanently deposited in the ground close to the road. The same is true for
artificial turfs where the estimated loss was 1 640 - 2 460 tons per year, but data on the load reaching the sea is
completely lacking. Loss of industrially produced plastic pellets in connection to manufacture and handling was
estimated to amount to between 300 and 530 tons per year, but also here the volumes discharged to the sea are
unknown.

IVL-rapport C 183 Swedish sources and pathways for microplastics to the marine environment
6
For several sources suspected to contribute with large amounts of microplastics to the sea, data is so scarce that no
estimations on emissions could be done. This is for example the case for important categories related to waste
management, recycling and littering.
In summary it can be concluded that Swedish coastal waters receive substantial amounts of microplastics from both
land-based and sea-based sources. Quantitative data is often scarce or completely lacking and it is not possible to
summarize the total Swedish discharge of microplastics to the sea. An attempt to rank the sources according to
their contribution was made but it should be kept in mind that data suffers from a large degree of uncertainty.
Additional studies are needed to improve the bases for further assessments, in particular on microplastics in
stormwater from different surfaces and sources.

IVL-rapport C 183 Swedish sources and pathways for microplastics to the marine environment
7
Sammanfattning Denna rapport är en uppdaterad version av rapporten “Swedish sources and pathways for microplastics to the
marine environment – A review of existing data” från 2016. De delar som har uppdaterats är de som rör möjliga
utsläpp av mikroplaster från däck, konstgräsplaner, båtbottenfärg och tvätt.
Naturvårdsverket har fått i uppdrag att identifiera betydelsefulla källor i Sverige till utsläpp av mikropartiklar av
plast i havet och verka för att reducera uppkomst och utsläpp av mikroplast från dessa källor. Inom ramen för
regeringsuppdraget har IVL Svenska Miljöinstitutet fått i uppdrag att kartlägga möjliga källor till och spridningsvägar
av mikroplast i havet.
Ett brett spann av potentiella mikroplastkällor och transportvägar för mikroplast från källan till havet valdes ut för
studien. Här inkluderades både källor för avsiktligt producerade plastpellets och källor där stora plastobjekt
fragmenteras till mikroskopiska partiklar. De transportvägar som är aktuella från landbaserade källor är framför allt
dagvatten, avloppsvatten och deposition från luft, och från havsbaserade källorna sker utsläpp direkt till havet.
Information samlades in från vetenskapliga artiklar, rapporter och genom muntlig kommunikation med experter
inom relevanta områden. När data tillåtit har det gjorts beräkningar av vilka kvantiteter av mikroplast det rör sig
om. Eftersom tillgången till data ofta var begränsad, och ibland till och med obefintlig, går det inte att ge någon
siffra på den totala mängden mikroplast som släpps ut i havet från svenska källor.
Mikroplaster som frigörs från havsbaserade källor t.ex. vid slitage av fiskeutrustning, flytbryggor eller båtskrov,
kommer förstås ut i havet. Men för att kvantifiera landbaserade källor behövs data både från utsläpp och från vad
som transporteras från utsläppskällan till havet. Ett av de få områden där det finns data från både källa och från
tillförselväg till havet är utsläpp från svenska hushåll. Den årliga tillförseln av plastpartiklar från hygienartiklar,
syntetiska fibrer från tvättmaskiner och hushållsdamm till kommunalt avloppsvatten beräknades 2012 uppgå till 67-
927 ton. Huvuddelen av detta kvarhålls dock i avloppsreningsverken och utsläpp till recipient var ca 1,4-19 ton per
år. De flesta av dessa partiklar är större än 300 µm, när det gäller mindre partiklar är osäkerheten stor, framför allt
för partiklar <20 µm.
De största utsläppen av mikropartiklar till miljön befanns komma från slitage av vägbanor och däck. Ungefär
7 670 ton plastpartiklar avgår årligen från däck. Eftersom det inte finns någon information om mikroplastinnehållet i
dagvatten från vägar går det dock inte att avgöra hur stor del av dessa som transporteras till vattenrecipienter och
hur stor del som permanent deponeras i marken nära utsläppspunkten. Detsamma gäller konstgräs; här är
utsläppen av plastpartiklar beräknade till 1 640 - 2 460 ton per år. Förlust av industriellt framställda plastpellets i
samband med tillverkning och hantering uppgick till 300-530 ton per år, men även här är det okänt hur mycket som
hamnar i havet.

IVL-rapport C 183 Swedish sources and pathways for microplastics to the marine environment
8
För flera källor som kan förväntas bidra med stora mängder mikroplast till havet finns det så lite data att det inte går
att kvantifiera vilka mängder det rör sig om. Detta gäller t.ex. viktiga områden relaterade till avfallshantering,
återvinning och nedskräpning.
Sammanfattningsvis kan man konstatera att svenska kustvatten tar emot avsevärda mängder mikroplast från både
land- och havsbaserade källor. Kvantitativ data är dock så bristfällig att det inte går att uppskatta den totala
mängden som härrör från svenska källor. I rapporten görs ett försök att rangordna källorna, men det måste påpekas
att här finns ett mycket stort mått av osäkerhet. Kompletterande undersökningar av framförallt mikroplast i
dagvatten från olika ytor och källor behöver utföras för att förbättra underlaget.
IVL-rapport C 183 Swedish sources and pathways for microplastics to the marine environment
9
Abbreviations ABS acrylonitrile butadiene styrene
AC acrylic
AKD alkyd
AM acryl monomer
BPA bisphenol A
DCPD dicyclopentadien
ENB etyliden norbornen
EPDM ethylene propylene diene EPS expanded polystyrene
EVA ethylene vinylacetate
HELCOM Helsinki Convention on the Protection of the Marine Environment of the Baltic Sea Area
IMO International Maritime Organization KemI Swedish Chemicals Agency KTF Swedish Union of Chemical Technical Suppliers MP microplastics
OSPAR Oslo-Paris Convention for the Protection of the Marine Environment of the North-East Atlantic
PA polyamide
PC polycarbonate
PCP personal care products
PE polyethylene
PES polyester
PET polyethylene terephthalate
PGA polyglycolic acid
PLA polylactic acid
IVL-rapport C 183 Swedish sources and pathways for microplastics to the marine environment
10
PLGA polylactic-co-glycolic acid
PMA poly methylacrylate
PMMA polymethyl methacrylate
POM polyoximethylene
PP polypropylene
PPF poly (propylene fumarate)
PS polystyrene
PUR polyurethane
PVA polyvinyl alcohol
PVC polyvinylchloride
PTFE polytetrafluoroethylene RAP Regional Action Plans SBR styrene butadiene rubber SEBS styrene ethylene butylene styrene copolymer SIS styrene isoprene styrene TPE thermoplastic elastomere VNB vinyl norbornen WWTP wastewater treatment plant

IVL-report C 183 Swedish sources and pathways for microplastics to the marine environment
11
1 Introduction
1.1 Background
The increased use of plastic in the society over the past half century has resulted in large amounts of plastic litter in
the environment. The problems associated with large plastic debris have received attention for many decades,
whereas those connected to marine microplastics were almost unnoticed until the early 2000s when findings of
plastic particles in zooplankton samples from the North Atlantic were reported (Thompson et al. 2004). Today it has
become a prioritized area among political organizations, agencies and NGOs around the world.
In a recent article by van Sebille et al. (2015) the accumulation of microplastics in the world’s oceans in 2014 was
estimated to 15-51·1012 particles with a weight between 93- 236·103 tons. This would correspond to approximately
1% of all plastic entering the ocean in 2014. Microplastics present in the sea derive from a range of both land- and
sea-based sources. They may consist of fabricated plastic pellets or fragments of larger plastic debris, come from
local sources or be transported over great distances with rivers or sea currents. Depending on the source they reach
the sea via different pathways. Some microplastics enter with stormwater and wastewater effluents whereas others
are created at sea through abrasion of fishing gear or constructions like aquaculture installations or jetties.
Microplastics are also washed into the sea as fragmented beach litter or have simply been dumped overboard from
ships.
In order to reduce the microplastics concentration in the Swedish coastal water, improved knowledge of the
relative importance of the different sources and pathways is necessary.
1.2 Aim and scope of the study
The aim of the report is to identify and quantify the most important land- and sea-based sources for microplastics
found in the marine environment. It is also part of the aim to identify and quantify the most important pathways by
which the microplastics reach the sea. The sources are graded according to the volume of microplastics they
produce and pathways to the volumes being released to the sea. The most important knowledge gaps for each
individual source are also described. The report focuses only on the quantities of microplastics released into the
environment. No analyses were done, neither on what plastic types that derives from the different sources, nor on
the effects they may have on the marine ecosystems.
The disposition of the report is to a great extent influenced by that of the Norwegian report “Sources of microplastic
pollution to the marine environment (Sundt et al. 2014) where the authors did a thorough work in identifying
verified and possible sources for marine microplastics. The content of the present report is based on Swedish

IVL-report C 183 Swedish sources and pathways for microplastics to the marine environment
12
conditions, it adds some new aspects of the problem compared to previous reports and the ranking of the sources is
as far as possible based on the most recent data available in the field.
1.3 Definition of microplastic
1.3.1 Definitions of size and materials
Microplastics have in the Marine Strategy Framework Directive (2008/56/EC) been pointed out as the most
important fraction of microlitter in the marine environment. In the process of identifying the sources it is however
important to have a clear definition of the term microplastics. Several reports on microplastic sources have been
released in different countries over the past couple of years and it is an advantage if the applied definitions are
similar enough to allow comparisons between countries.
Plastic is in this report given a broad definition that follows the same practice as in Sundt et al. (2014). It includes
man-made polymers, deriving from petroleum or petroleum by-products, but also non-synthetic polymers like
natural rubber and polymer modified bitumen. The term “particles” will be used in the report for all solid
particulates independent of shape, including e.g. flakes and fibers of plastics. The size range is set to particles
between 1 µm and 5 mm. However, industrial plastic pellets will be covered as a group although they may
sometimes be slightly larger than 5 mm. There is still no internationally accepted definition on the size limits for
microplastics, but an upper limit of 5 mm has a strong support in the scientific community (GESAMP 2015). The
lower size limit is however more debated and in many studies the decision has been pragmatic and simply
determined by the sampling device being used.
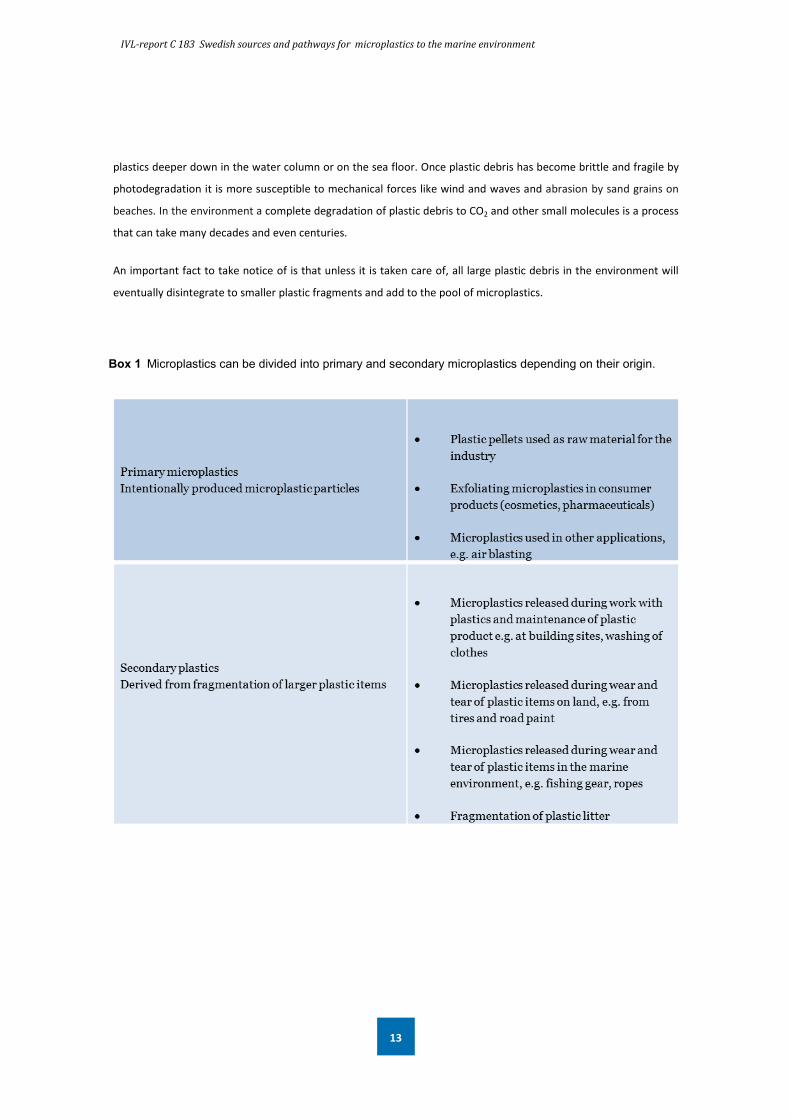
1.3.2 Primary and secondary microplastics
Microplastics can be categorized into those that are intentionally produced as plastic particles, primary
microplastics, and those deriving from large plastic debris fragmenting into smaller pieces, secondary microplastics
(GESAMP 2015)(Box 1). An important group of primary plastics is the plastic pellets being produced as raw material
for the plastic industry. Primary plastic particles are also used as abrasives in numerous applications e.g. cosmetics,
cleaning products, pharmaceuticals and air blasting media. Secondary microplastics can be formed during
construction work with plastics or when maintaining plastic items, e.g. at building sites or when washing synthetic
clothes. They may also be created during normal use of constructions and products of plastics, e.g. the road dust
derived from wear of tyres or road paint, or synthetic fibres shredded from fishing gear. An important group of
secondary microplastics is also those particles formed through fragmentation of plastic litter in the environment.
Solar UV radiation is the initial cause of fragmentation of plastic items in the environment (Andrady et al. 1998). The
UV degradation of plastics is more rapid at higher temperatures and since water has a cooling effect plastics floating
in surface waters degrade considerably slower than plastics exposed on a beach (Andrady 2011). In water the UV
light decreases rapidly with depth, so plastic debris floating on the sea surface is degraded much more rapidly than
IVL-report C 183 Swedish sources and pathways for microplastics to the marine environment
13
plastics deeper down in the water column or on the sea floor. Once plastic debris has become brittle and fragile by
photodegradation it is more susceptible to mechanical forces like wind and waves and abrasion by sand grains on
beaches. In the environment a complete degradation of plastic debris to CO2 and other small molecules is a process
that can take many decades and even centuries.
An important fact to take notice of is that unless it is taken care of, all large plastic debris in the environment will
eventually disintegrate to smaller plastic fragments and add to the pool of microplastics.
Box 1 Microplastics can be divided into primary and secondary microplastics depending on their origin.

IVL-report C 183 Swedish sources and pathways for microplastics to the marine environment
14
2 Plastic flows in Sweden The amount of wastes in the marine environment has increased substantially during the last century. Marine non-
natural debris or litter is defined as “any persistent, manufactured or processed solid material” present in marine or
coastal environment (Galgani et al. 2010). It can be metal, glass, paper, fabric or
plastic materials. Among them, plastic is considered to be the most persistent and problematic. Plastics can be used
in products with a wide range of applications due to their properties (inexpensive, lightweight and durable)
(Hopewell et al. 2009). The presence of microplastics in the ocean was first reported in the early 1970s (Carpenter
et al. 1972, Carpenter and Smith 1972).
Annual and global plastic production reached 311 million tons in 2014 and is estimated to increase by almost 6% per
year (PlasticsEurope 2015).
Table 1 Plastic utilization by activity sectors in Europe including Norway and Switzerland (PlasticsEurope 2015).
Sectors Percentage use
Packaging 39.5%
Building and construction 20.1%
Automotive 8.6%
Electrical and electronic 5.7%
Agriculture 3.4%
Other 22.7%
Plastics are mainly utilized in activity sectors such as packaging and building and construction, followed by
automotive, electrical and electronic, agricultural sectors (Table 1). The category “Other” in Table 1 includes sectors
as health, consumer and household appliances, furniture, safety and sport. A report from PlasticsEurope (2010)
showed that in this category there is most plastic in consumer household appliances (9%), furniture (3.5%) and
health (1.5%). The four most abundant plastic in Europe (PP, PE-LD/LDD, PE-HD/MD and PVC) represent around 60%
of the total plastic utilization (Table 2).

IVL-report C 183 Swedish sources and pathways for microplastics to the marine environment
15
Table 2 Different plastic types presence and utilization in Europe including Norway and Switzerland (PlasticsEurope 2015).
Plastic type Percentage of total plastic
consumption
Utilization
Polypropene (PP) 19.2% food packaging hinged caps, folders,
car bumper, etc.
Polyethylene low density (PE-LD, PE-LDD) 17.2% film for food packaging (PE-LDD),
reusable bags (PE-LD), etc.
Polyethylene, high density (PE-HD, PE-MD) 12.1% toys, milk bottles and pipes (PE-HD),
etc.
Polyvinylchloride (PVC) 10.3% window frames, flooring, pipes, etc.
Polyurethane (PUR) 7.5% mattresses, insulation panels, etc.
Polystyrene (PS, PS-E) 7% spectacles frames and plastic cup
(PS), packaging (PS-E), etc.
Polyethylene terephthalate (PET) 7% bottles, etc.
Other: polytetrafluoroethylene (PTFE),
acrylonitrile butadiene styrene (ABS),
polycarbonate (PC), etc.
19.7% teflon coated pans (PTFE), hub caps
(ABS), roofing sheets (PC), etc.
Estimated plastic waste flows in Sweden for 2010 are summarised in Figure 1 together with waste treatment for
each of the identified flows. Such overall statistics is not developed on a regular basis, but was produced in a project
conducted by SMED (Svenska MiljöEmissionsData) on commission from the Swedish EPA in 2012. However, plastic
packaging statistics is produced annually in order to follow-up the producer responsibility on packaging. According
to the latest official recycling statistics (from 2013), the recycling rate for plastic packaging was just above 40
percent (Fråne et al. 2015).

IVL-report C 183 Swedish sources and pathways for microplastics to the marine environment
16
Figure 1 Estimated plastic waste flows from different sectors in Sweden in 2010, and how the waste flows were treated (SMED 2012).
3 Methodology
Selection of possible sources and pathways for marine microplastics
A list of possible sources and pathways for marine microplastics was determined based on the author’s own
experiences from many years of research within the field, on the sources and pathways selected in other reports on
the same topic (Sundt et al. 2014, Essel et al. 2015, Lassen et al. 2015) and on recommendations from stakeholders
and experts at a workshop held by the Swedish Environmental Protection Agency in Stockholm in November 2015.
3.1 Data sources
The report is based on data from scientific peer-reviewed articles and from reports from national and international
organizations cited in the reference list (chapter 8). Direct contact has also been taken with experts on the different
kinds of sources and pathways. These personal communications are also listed in chapter 8.
3.2 Handling of data
As far as possible we have quantified the amount of microplastic deriving from each of the selected sources and the
amount passed on to the sea via the different pathways. The calculations are based on the best available and most
recent data. When possible, latest data from Sweden and Swedish conditions have been used.

IVL-report C 183 Swedish sources and pathways for microplastics to the marine environment
17
In several cases data is scarce and not very reliable. However, efforts have still been made to produce rough
estimates of the amount of microplastics from most sources and pathways so that future studies have some data to
relate to. The origin and reliability of the data applied for calculations is clearly stated under each source and each
pathway. When Swedish data has not been possible to find or when we have found newer data of better quality
elsewhere, we have used local activity data in combination with emission factors from other countries with similar
conditions to calculate the Swedish emissions.
4 Sources of microplastics in the marine environment
4.1 Intentionally produced microplastics
4.1.1 Industrial production and handling of plastic pellets
All plastic products are made either from virgin raw material, which by far is the most common source, or from
renewable raw material sources. Thermoset plastic resin is usually liquid, whereas the more common
thermoplastics are made from pellets, typically 2-5 mm in diameter, or powders. The pellets/powder may also
contain finer plastic dust from the handling, or pieces of scrap plastics from the production (Moore 2008, Cole et al.
2011). The pellets are called many things, such as nibs, nurdles or when washed ashore; mermaid tears.
Historically plastic pellets have been a major constituent of marine microplastics. However, during the last decades
decreasing amounts of pellets have been found in the oceans. A study by van Franeker and Law (2015) reports a
decrease of approximately 75% since the 1980s. Morét-Ferguson et al. (2010) reports a similar decrease but since
the 1990s. The measurements in the two studies were conducted in different parts of the North Atlantic but the
trends look similar. In spite of the decreasing trend, emissions of primary plastic pellets still continues, evident for
example by the very high concentration of pellets (one sample showed 102 000 per m3) in an industrial harbour
outside a large manufacturing plant in Sweden (Norén 2007). Manufacturing alone is thus not responsible for the
emissions. An example is the very large amounts of pellets that have been found on beaches and in Californian
rivers which most likely originated from the many plastic processors in the region (Moore 2008).
Industrial plastic pellets and powders are transported in different types of containers by train, truck or boat from
manufacturers to processors. Some material will be spilled while loading or reloading, during transport or at the
processing facilities. To tackle the problem with spills throughout the supply chain, the American industry initiative
“Operation Clean Sweep” was initiated in the 1990s and gained much support among the main organisations
representing the plastics industry. A similar initiative, “Zero Pellet Loss”, was founded by PlasticsEurope. These
programmes aim to raise awareness and spread good practice in order to minimize the loss of pellets or plastic
granulates, throughout the process chain. There is however no published data on the amounts of released pellets or
prevented release of pellets neither from the coordinating organizations nor from the individual companies (Essel et
al. 2015, Nilsson, pers. comm.). Much of the emissions from manufacturing plants should be possible to prevent

IVL-report C 183 Swedish sources and pathways for microplastics to the marine environment
18
with proper routines and filtration of effluents. Actions to reduce emissions are probably already taken at most
plants due to raised awareness of the problem during the last decade (Norén, pers. comm.). Improvements in
handling at the around 100 converting facilities in Sweden have also taken place over the last 5-10 years with
plugging of drainage in industrial facilities and better routines. Environmental concerns may not be the most
important reasons for these actions, but rather the price of raw material and demands for good working
environments (Nilsson, pers. comm.).
There is at present no available data on spills from Swedish manufacturers of plastic pellets and data is limited also
from other countries. An emission factor of 0.04% was used by Sundt et al. (2014) to estimate the pellet loss from
Norwegian plastic production plants. The factor was calculated from the emission of a brominated flame retardant
present as additive in the produced plastic pellets. Measurements were from a single plant, but it is the only
available estimation of pellet loss in connection to production and it is applied to estimate the losses also from
Swedish plants (Table 3). Sweden has a few large plastic producers with a combined annual output of around
744 000 tons of pellets (data from the two largest plants in 2014, the maximum allowed production from these
plants are 1 010 000 tons). If assuming that the emission factor of 0.04% is valid for Swedish conditions the loss of
plastic pellets in connection to production would hence amount to 298 tons per year (Table 3).
Table 3 Calculation of total emissions from pellet production using a factor from Sundt et al. (2014).
Emission factor (% of total production of plastic pellets) 0.04%
Spill during production ~298 tons per year
Emission of virgin plastic pellets to the environment may occur not only during the production, but also during
handling of the pellets. The risk of loss is presumed to be highest in connection to loading, reloading and
transportation of the pellets. A higher quantity of plastic pellets is handled within Sweden than is being produced. It
is not known how the import and export are related to the domestic production since these are two separate data
sets. The import of virgin plastics was slightly below 1 200 000 tons in 2014 and the export about as large. See Table
4 for the amounts of different virgin plastics of fossil origin. The statistics on import and export do not specify
whether these are pellets, powders, liquids or other. Assuming it is all pellets, some calculations about the handling
and use of pellets at converting facilities can be made.
Table 4 Swedish import and export of some plastic materials in 2014. It is assumed that the CN-categories below represent primary pellets. Numbers from Statistics Sweden, www.scb.se
Commodity
code (CN)
Explanation Import 2014
(tons)
Export 2014
(tons)
3901 Polymers of ethylene, in primary forms 441 147 599 229
3902 Polymers of propylene or of other olefins, in primary forms 199 517 46 356
3903 Polymers of styrene, in primary forms 90 955 75 184
3904 Polymers of vinyl chloride or of other halogenated olefins, in 71 055 217 951

IVL-report C 183 Swedish sources and pathways for microplastics to the marine environment
19
primary forms
3905 Polymers of vinyl acetate or of other vinyl esters, in primary forms; other vinyl polymers in primary forms
33 058 35 172
3906 Acrylic polymers in primary forms 101 727 45 976
3907 Polyacetals, other polyethers and epoxide resins, in primary forms; polycarbonates, alkyd resins, polyallyl esters and other polyesters, in primary forms
155 224 51 696
3908 Polyamides in primary forms 24 844 9 380
3909 Amino-resins, phenolic resins and polyurethanes, in primary forms 45 022 68 492
3910 Silicones in primary forms 8 013 1 123
3911 Petroleum resins, coumarone-indene resins, polyterpenes, polysulphides, polysulphones and other products specified in note 3 to this chapter, not elsewhere specified or included, in primary forms
21 231 3 883
Total 1 191 793 1 154 442
Two emission factors used for estimating the loss of plastic pellets during handling was found in the literature, one
based on measured losses in Danish plastic converting facilities and used to quantify losses in Denmark (Lassen et
al. 2015) and the other developed by USEPA and used to quantify Norwegian losses (Sundt et al. 2014). The Danish
emission factor has its origin in a survey carried out by the Danish Plastics Federation where data on spill of virgin
plastic pellets during handling were reported from eight of their member companies (referred to in Lassen et al.
2015). Only three of the eight companies claimed that there was a loss of plastic pellets to the drain during
handling, whereas the remaining five companies meant that all spill was taken care of. The facility releasing the
highest amount of pellets to the drain emitted 0.0013% of the total volume that was handled. The emission factor
from this single company was used by Lassen et al. (2015) to estimate the losses of plastic pellets to the drain by all
Danish companies in this sector. However, a safety span was applied and the average emissions were estimated to
be within a range of 0.0005% (approximately half of the emission from the highest reporting conversion facility) and
0.01% (ten times the emission at the highest reported facility.)
An emission factor of 0.5% designed by USEPA was used to calculate plastic pellet loss in Norway (OECD 2009a,
Sundt et al 2014). The factor was developed to estimate the loss of dust from solid powders during transportation
by using the EPA/OPPT Dust Emissions from Transferring Solids Model. Sources data derived from a variety of
industries including paint and varnish formulation, plastic manufacturing, printing ink formulation, rubber
manufacturing, and chemical manufacturing.
The emission span suggested by Lassen et al. was selected to estimate the emission of plastic pellets during
handling in Sweden since it was based specifically on data from the relevant sector and therefore considered to be
more suitable than the USEPA factor (Table 5). It could also be expected that handling routines in Denmark and
Sweden would be fairly similar. When applying these factors on the volume of virgin plastic pellets handled in

IVL-report C 183 Swedish sources and pathways for microplastics to the marine environment
20
Sweden the estimated emissions to the drain or the environment were found to be in the range of 12-235 tons per
year.
Table 5 Calculation of total emissions from pellet handling using emission factors proposed by Lassen
et al. (2015).The figures represent net values, i.e. emissions to the environment (including emission to the
drain).
Low High
Emission factor (% of total volume of handled plastic pellets)
0.0005% 0.01%
Emission to drain 12 tons 235 tons
The total emissions of virgin plastic pellets to environment from both production and handling would then be in the
range of 310-533 tons per year (Table 3 and Table 5).
There is no data on the amount of virgin plastic pellets transported to the sea. There are about 100 converting
facilities in Sweden (Nilsson, pers. comm.) and a few producers. Much is imported and exported, adding to the
extent of handling. Emissions may thereby occur at many locations, usually different industrial sites. The extent of
stormwater treatment or sewage treatment will vary, as will the recipient. From some facilities the outflow will be
to the sea, but at other places it will be to freshwater systems or municipal wastewater treatment plants.
Knowledge gaps
No data has been found on the actual release of virgin plastic pellets from Swedish facilities. Production plants may
be considerable point sources, but has only been assessed indirectly by measurements in the neighbouring sea.
Sweden’s largest production facility will during 2016 install a fine filter for all process and stormwater, which should
lower emissions and also show how much plastic material the water contains.
Other point sources are the many plastic converters, within the process or when handling and storing pellets.
Emissions could however occur throughout the supply chain and further studies could identify hot spots.
4.1.2 Abrasive blasting with plastic media
There are many different substances used in abrasive blasting and plastic is one of these. Plastic granules are used
to remove tenacious contaminants e.g. paint, plastics, rubber and adhesive from plastic tools and dies etc. Which
companies that are the main users have not been identified in present study. The underlying surface is normally not
affected by the blasting as the different plastic materials are somewhat softer than those made of minerals or
metal. The material of the granules varies depending on the wanted features; they may consist of poly methyl

IVL-report C 183 Swedish sources and pathways for microplastics to the marine environment
21
metacrylic polymer, melamine, urea formaldehyde, urea amino polymers or poly amino nylon type
(Blästerprodukter 2016, ESSKA 2016, Guyson 2016). The granulate size ranges from 0.15-2.5 mm and the relative
density is > 1000 kg/m3, indicating they will not float. At least two companies in Sweden market microplastics
abrasive media, however no numbers of quantities that have been sold in Sweden are openly accessible. According
to a safety data sheet of the plastic granulates (urea formaldehyde) (Blästerprodukter 2016) it is recommended that
larger quantities of spills should be collected and handled as hazardous waste and small spills should be swept up or
flushed with water. One should prevent the discharge of microplastic granulates to wastewater or waterways.
However, since there are no regulations in Sweden regarding the emission of microplastics, it is uncertain if such
spills are even documented. No data on either the use of plastic abrasive media in Sweden or emissions of
microplastics when performing the abrasion could be found. This was the case also for the authors of the report on
Norwegian sources to microplastics (Sundt et al. 2014). Here the authors concluded that the lack of data indicate
that use is limited. At Swedish shipyards abrasive blasting with any media is controlled and regulated (Ringnér, pers.
comm.). Therefore emissions should be very small from shipyards, whereas they are unknown from other facilities.
If used on a shipyard or otherwise by the seaside emissions could be directly into surface water. If plastic abrasive
media is used in industry there may be emissions to sewage. Industrial sites however often have some sort of
cleaning or filtering system as well as routines for hindering emissions directly to the drain. This will to some extent
hinder emissions before they reach surface water or sewage treatment plants
Knowledge gaps
It is not known to what extent plastic abrasive media is used or where. But there are retailers. Other media, such as
mineral or metal grits, is more common but there may be special applications where plastic media poses a risk of
emissions.
4.1.3 Pharmaceutical products
Microplastics are used as microspheres in medicines to administrate drugs to organs of humans and farmed animals
(terrestrial and aquatic) (Dalmo et al. 1995, Corbanie et al. 2006, Bergmann et al. 2015). Farmed animals often
receive oral vaccination with microspheres to decrease the stress of the animal (Dalmo et al. 1995). This method is
fast and inexpensive and increases absorption and decreases possible side effects (Corbanie et al. 2006, De Jong and
Borm 2008). In humans, microparticles are used mostly in drug delivery and vaccination (Buzea et al. 2007). Not all
microspheres used for drug administration are made of plastic polymers, but they may also consist of e.g. latex,
minerals, liposomes and sometimes even composite materials (Dalmo et al. 1995, Corbanie et al. 2006). Polymer
particles define all types of polymers from plastics to proteins and polysaccharide (Matsusaki et al. 2001, Elzoghby
2013). Plastic polymers can be composed mostly by thermoplastics assumed to be biodegradable such as
polymethyl methacrylate (PMMA), polylactic acid (PLA), polyglycolic acid (PGA), their copolymers poly(lactic-co-
glycolic acid) (PLGA) or poly (propylene fumarate) (PPF) (Dalmo et al. 1995, Matsusaki et al. 2001, Wang and Burgess

IVL-report C 183 Swedish sources and pathways for microplastics to the marine environment
22
2012). Nevertheless they can also be constituted of polycarbonate or polystyrene which are not biodegradable
(Corbanie et al. 2006, Kwon et al. 2014, Bergmann et al. 2015).
Knowledge gaps
There is no record of which drugs contain plastic particles, size of the particles, the quantities administrated and if
the particles remain in the body or are excreted (Bergmann et al. 2015). Some pharmaceuticals are under
investigation but the studies mainly concern the toxicity of the particles (De Jong and Borm 2008) and to our
knowledge no study has so far been done on the potential environmental impacts.
4.1.4 Personal care products (PCPs)
Microplastics in personal care products
Microplastic beads have been used in personal care products for the past 50 years. They are found in skin cleaning
products like liquid soap and shower gel, in hair care products, tooth paste and makeup products (powders,
concealers, rouge). The microplastic content in the products is reported to vary between 0.5 and 12% of the total
weight (Ziebarth 2015). Their functions in personal care products are e.g. to act as exfoliant scrubs, bulking agents
and hair fixatives. Depending on the application they are either meant to be rinsed off or to be left on the body.
Different plastic polymers are used for different applications. Polyethylene (PE) makes up over 90% of the plastic
polymers in skin cleaning formulates, which is the by volume largest category of personal care products (Gouin et al.
2015). Other polymers being used are polypropylene (PP), polyamide (PA), polymethyl methacrylate (PMMA),
polystyrene (PS), polyurethane (PUR), polytetrafluoroethylene (Teflon) and polyethylene terephthalate (PET),
(Naturskyddsföreningen 2013, Becker et al. 2014). The added microplastics may be in the shape of either smooth or
amorphous pellets. The size of plastic particles in consumer products varies. In liquid soap on the European market
70% of the microplastics were estimated to be >450 µm (Gouin et al. 2015). Other personal care products have
been found to contain smaller sized particles. In a Dutch study microplastic beads in tooth paste were mainly found
to be <10 µm and with a median size between 2 and 5 µm (Verschoor et al. 2014b).
The rinse-off products will be almost entirely transferred to the wastewater after use, whereas at least part of the
leave-in ones also will end up there. Wastewater from households and establishments like sports centres and spas
could hence be expected to receive a substantial part of the microplastics that were once added to consumer
products. The entrance route to the marine environment is via discharge of effluent water from wastewater
treatment plants (WWTPs). The discharge of treated wastewater may be directly to the sea or to other aquatic
environments from which the particles may be further transported to the coast via rivers and other waterways.
There are several studies carried out on microplastics in effluent wastewater but no real efforts have been made to
link specific particles detected in the water to personal care products (Leslie et al. 2013, Magnusson and Wahlberg
2014, Mintenig et al. 2014). Still, plastic particles of a size and shape indicating that they originated from personal

IVL-report C 183 Swedish sources and pathways for microplastics to the marine environment
23
care products have frequently been observed in effluent water from Swedish WWTPs, although they never were
found to be the dominating fraction (Magnusson, K., pers. obs.).
The use of microplastic pellets in personal care products has been seriously questioned over the past years. A law
against this use of microplastics was passed in the US 28 December 2015 (Microbead-Free Waters Act of 2015). In
Sweden the Swedish Chemicals Agency (KemI) has been assigned by the government to investigate whether a
similar ban should be enforced also in Sweden and their proposal was presented in a report in January 2016
(Kemikalieinspektionen 2016). In summary KemI proposes that the use of plastic microbeads in rinse-off cosmetic
products should be banned from the Swedish market from 1 January 2018. However, exemptions should be made
for biodegradable microplastics. Cosmetic Europe, an association representing over 4 000 member companies and
associations of different sizes in the cosmetics and personal care industry have recommended their members to
discontinue the use of plastic particles in the wash-off products (i.e. exfoliating and cleansing products) by 2020, if
alternative materials are available (Cosmetics Europe 2015). Also the Swedish Union of Chemical Technical Suppliers
(KTF) is positive to a voluntary phase-out of microplastics in cosmetic products. In addition to actions carried out on
a political level and recommendations presented by trade organizations several large cosmetic companies have
decided to phase out the use microplastics from their products. The contribution of primary microplastics to the
marine environment might therefore decrease over the coming years and figures on production volumes presented
in the literature become outdated.
Calculations of quantities of microplastics discharge from personal care products
It is difficult to get a complete overview on what personal care products contain microplastics beads, the amount of
plastic these products contain and what volumes that are being consumed. However, an assessment on the
microplastic content was done for liquid soaps, the by volume and weight dominating category of personal care
products on the European market (Gouin et al. 2015). In this assessment information on the total quantities of
microplastic beads used in liquid soap in the EU countries, Norway and Switzerland, in 2012 was obtained through a
survey by the Cosmetic Europe, the European Cosmetic Industry Association. The sales volumes for liquid soap the
same year were provided through Euromonitor International, a consumer products database (Gouin et al. 2015).
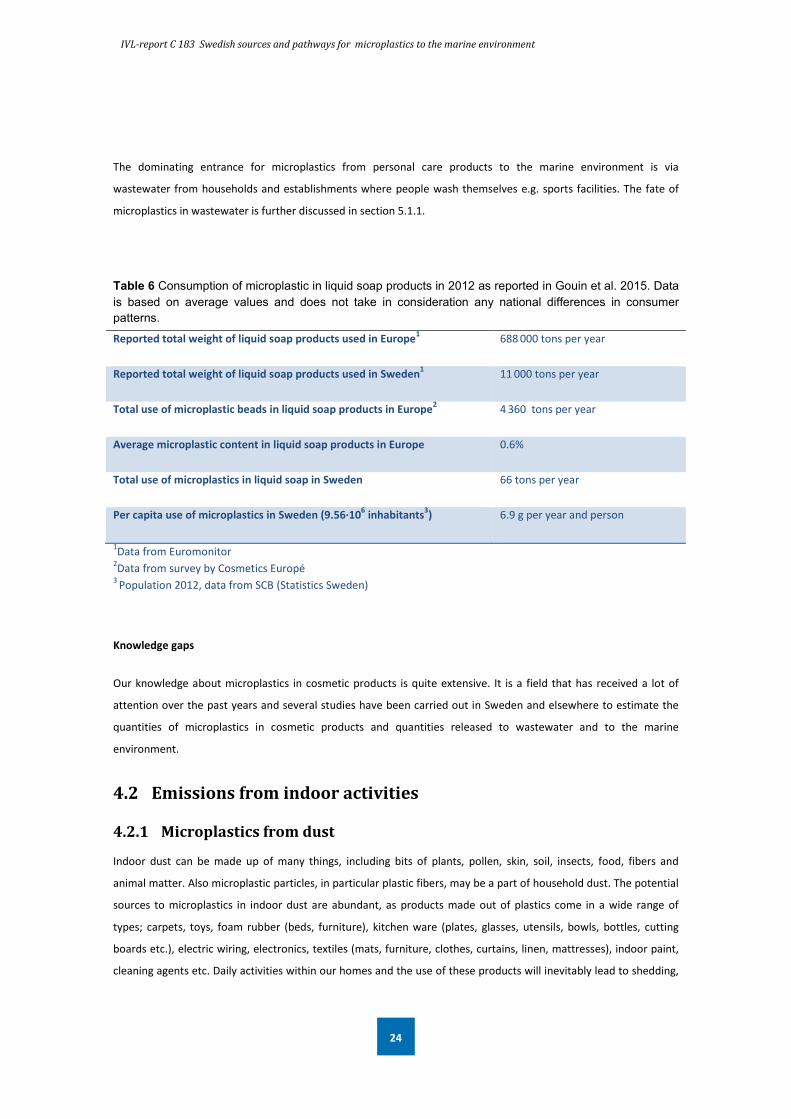
Data from the survey and the data base is presented in Table 6. The typical content of microplastic beads in
consumer products ranged between 0.05% and 12% and was estimated to be added to approximately 6% of the
products. However, when using the data to calculate an average microplastic content in all liquid soaps on the
European market in 2012, including both those that did and those that did not contain microplastics, the content
would be ~0.6% (on a weight bases). Using data on the Swedish consumption of liquid soap in 2012 the
consumption of microplastics in these products was estimated to 66 tons per year, and the Swedish per capita
consumption, 6.9 g per year. These figures are of course rough approximations that do not take in consideration any
differences in consumer patterns between countries but they still give general information on the importance of
consumer products as sources for microplastics.
IVL-report C 183 Swedish sources and pathways for microplastics to the marine environment
24
The dominating entrance for microplastics from personal care products to the marine environment is via
wastewater from households and establishments where people wash themselves e.g. sports facilities. The fate of
microplastics in wastewater is further discussed in section 5.1.1.
Table 6 Consumption of microplastic in liquid soap products in 2012 as reported in Gouin et al. 2015. Data is based on average values and does not take in consideration any national differences in consumer patterns. Reported total weight of liquid soap products used in Europe1 688 000 tons per year
Reported total weight of liquid soap products used in Sweden1 11 000 tons per year
Total use of microplastic beads in liquid soap products in Europe2 4 360 tons per year
Average microplastic content in liquid soap products in Europe 0.6%
Total use of microplastics in liquid soap in Sweden 66 tons per year
Per capita use of microplastics in Sweden (9.56·106 inhabitants3) 6.9 g per year and person
1Data from Euromonitor 2Data from survey by Cosmetics Europé 3 Population 2012, data from SCB (Statistics Sweden)
Knowledge gaps
Our knowledge about microplastics in cosmetic products is quite extensive. It is a field that has received a lot of
attention over the past years and several studies have been carried out in Sweden and elsewhere to estimate the
quantities of microplastics in cosmetic products and quantities released to wastewater and to the marine
environment.
4.2 Emissions from indoor activities
4.2.1 Microplastics from dust
Indoor dust can be made up of many things, including bits of plants, pollen, skin, soil, insects, food, fibers and
animal matter. Also microplastic particles, in particular plastic fibers, may be a part of household dust. The potential
sources to microplastics in indoor dust are abundant, as products made out of plastics come in a wide range of
types; carpets, toys, foam rubber (beds, furniture), kitchen ware (plates, glasses, utensils, bowls, bottles, cutting
boards etc.), electric wiring, electronics, textiles (mats, furniture, clothes, curtains, linen, mattresses), indoor paint,
cleaning agents etc. Daily activities within our homes and the use of these products will inevitably lead to shedding,

IVL-report C 183 Swedish sources and pathways for microplastics to the marine environment
25
abrasion, wear and tear of these items, which will contribute to release of microplastics that settle in the indoor
dust (Macher 2001, Gipp and Wietfeldt 2002, Webster et al. 2009). Also contributing to indoor dust is track-in dust
such as particles and dirt carried into the house on shoes.
The global production of synthetic fiber increased by about 850% between 1975 and 2014 (CIRFS 2016). In 2014 the
synthetic fiber production amounted to 60 million tons and accounted for approximately 65% of total fiber
(synthetic, cellulosic, wool and cotton) production (The Fiber Year 2015, CIRFS 2016). This gives an indication that
>50% of all the textiles used (clothes, mattresses, linens, carpets, curtains etc.) worldwide may at least to some
extent consist of synthetic polymers.
The amount of microplastics in the settled dust will vary from household to household, depending on factors such
as number of plastic objects, durability of the plastic objects, number of persons in the household and the age of
these, living habits, time of the year etc. Only those synthetic dust particles that end up in the wastewater are
considered to be a potential source to marine microplastics, and that would be those particles that are swept up
when wet cleaning the floor. To quantify the amount of microplastics Swedish households may emit to the sewage
water is very demanding task. However, rough estimations can be done if several factors are known. In order to
make estimations we need to have knowledge about four complex factors:
• Dust composition: amount of microplastics in the settled household dust
• The amount of plastics that settles on an certain area, e.g. per m2
• Total household area where dust settles
• Total household area that is wet mopped
A lot of research has been done on common household dust, however, most studies have focused on chemical
compounds associated to the dust particles, and there is very limited data on the qualitative and quantitative
composition of the particles themselves. The amount of microplastics in household dust has been poorly studied
and no studies regarding the composition of dust in Swedish households have been found. However, there are a
few available studies on the composition of office dust in Denmark and household dust in the U.S. The results from
these studies varied. In one study performed in one single home in the US the microplastic fraction in dust was
found to compose between 1 and 5% of the total volume (Webster et al. 2009). In another study on household dust,
based on in total 70 homes in seven different cities in the US, synthetic nylon fibers made up between 10–40% by
volume of the fibrous fraction (approx. 50% of total volume), and contributed with about 0.6% of the total dust
weight (Gipp and Wietfeldt 2002). In dust from an office the fiber content (all fibers) was less than 0.2-1.5% (weight)
of the bulk dust (Molhave et al. 2000). Measurements show that the amount of settled dust mass can vary by >50%
depending on season (Edwards et al. 1998) and that the character of the surface of the settling area is important. A
carpet can load up to 18 times more dust (mass per m2) in one week than a linoleum floor (Thatcher and Layton
1995). Data from the literature indicate that the average dust mass deposited on household surfaces is about 1-8
grams per m2 per year (Raunemaa et al. 1989, Edwards et al. 1998, Schneider 2008). To estimate the total Swedish
IVL-report C 183 Swedish sources and pathways for microplastics to the marine environment
26
household area where dust can settle is difficult since many factors are uncertain or unknown. One of these is the
“shelf factor”, objects that add to the settling surface (e.g. shelfs, tables, chairs, , lamps, paintings and window sills).
There is no data from Swedish households on the relation between the amount of dust that is dry removed (e.g.
vacuuming and sweeping) and the amount that is wet removed (wet mopping and wiping). Dry removing is a
popular choice of floor cleaning, so a large part of the indoor floor dust is likely to be vacuumed and end up with
garbage for incineration. The Stockholm Multimedia URban Fate (SMURF) model assumes that dry removal (e.g.
vacuuming) removes the covering loose dust from the horizontal surfaces at a rate equal to the deposition rate
minus the re-suspension rate, while wet removal is assumed to remove the bulk organic film from vertical and
horizontal surfaces. It is assumed that loose dust is continuously being removed by dry removal as the dust loading
is constant. Wet removal is used in parallel with the dry removal (Cousins 2012). However, dust on shelves and
other objects will probably only be cleaned away by wet removal.
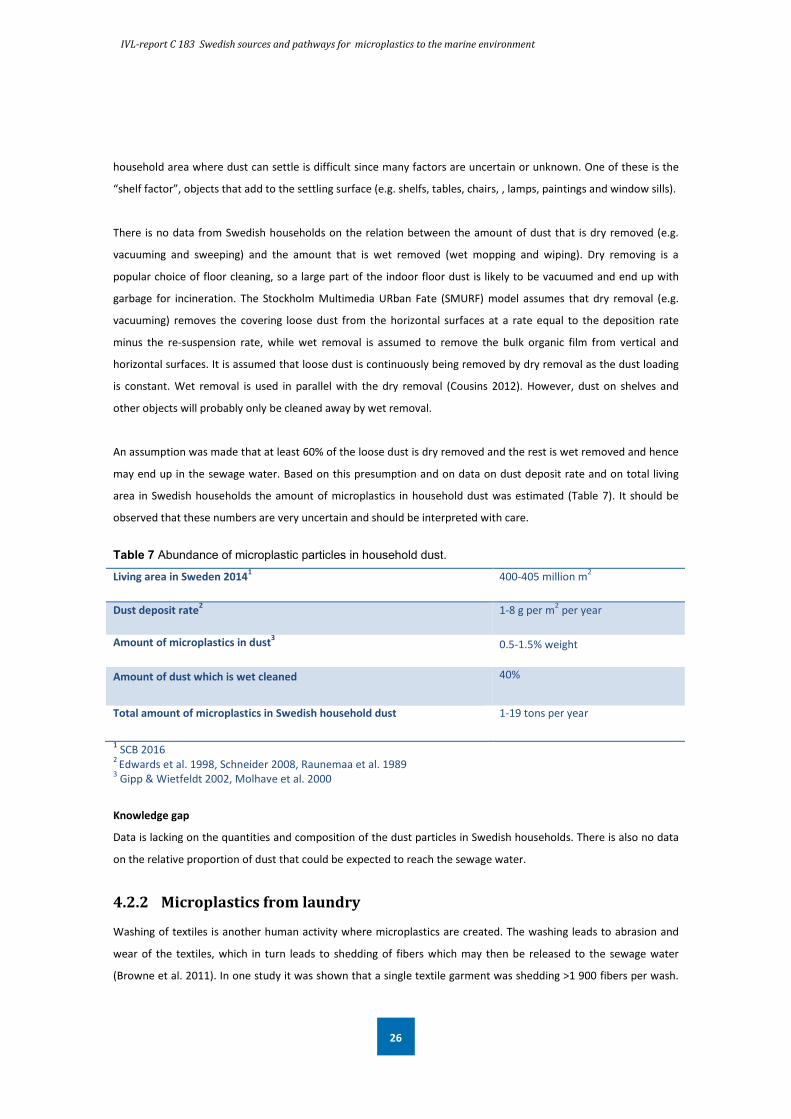
An assumption was made that at least 60% of the loose dust is dry removed and the rest is wet removed and hence
may end up in the sewage water. Based on this presumption and on data on dust deposit rate and on total living
area in Swedish households the amount of microplastics in household dust was estimated (Table 7). It should be
observed that these numbers are very uncertain and should be interpreted with care.
Table 7 Abundance of microplastic particles in household dust.
Living area in Sweden 20141 400-405 million m2
Dust deposit rate2 1-8 g per m2 per year
Amount of microplastics in dust3 0.5-1.5% weight
Amount of dust which is wet cleaned
40%
Total amount of microplastics in Swedish household dust 1-19 tons per year
1 SCB 2016 2 Edwards et al. 1998, Schneider 2008, Raunemaa et al. 1989 3 Gipp & Wietfeldt 2002, Molhave et al. 2000
Knowledge gap
Data is lacking on the quantities and composition of the dust particles in Swedish households. There is also no data
on the relative proportion of dust that could be expected to reach the sewage water.
4.2.2 Microplastics from laundry
Washing of textiles is another human activity where microplastics are created. The washing leads to abrasion and
wear of the textiles, which in turn leads to shedding of fibers which may then be released to the sewage water
(Browne et al. 2011). In one study it was shown that a single textile garment was shedding >1 900 fibers per wash.

IVL-report C 183 Swedish sources and pathways for microplastics to the marine environment
27
The same study showed that there was a difference in the amount of emitted fibers depending on the type of
textile. While >250 fibers per liter were found in the effluent of washing a fleece jacket, approximately 130 fibers
per liter were found in the effluent of washing a blanket. Another study showed that a brand new fleece shirt (100%
polyester) could lose >0.4% of its initial weight during the first four machine washes. However, it has been shown
that the microplastic fiber mass discharged from garments decrease with the increasing number of times that the
garment is washed (Folkö 2015, Napper and Thompson 2016). In 2016 a study showed that laundering 6 kg of
synthetic materials could release around 138 000 -729 000 fibers per wash. A study at three Swedish wastewater
treatment plants showed that the incoming water could contain >20 000 microplastic fibers per m3 (Magnusson and
Wahlberg 2014, Magnusson 2014b). Most of the fibers were found to be retained in the plants and the outgoing
water had concentrations between 150-3 300 microplastic fibers per m3 (Magnusson and Wahlberg 2014). The
proportions of polyester and acrylic fibers in sewage-effluent have been shown to resemble microplastics found
contaminating sediments worldwide (Browne et al. 2011). This could be interpreted as an indication that at least
part of the microplastic fibers in the marine environment comes from the washing of textiles, with sewage
treatment plants acting as pathways.
To estimate the mass of discharged microplastics induced by laundry is a difficult task, not only because there is
great variation in variables, e.g. amount of laundry per person, type of textiles washed, washing conditions and
season of the year, but also because there is very little data on the size (length and thickness) of discharged fibers
and on the amount of fibers that actually end up in the wastewater. Washing conditions have been shown to
change the discharge of silver ions from textiles to the effluent (Geranio et al. 2009), hence it is not unreasonable to
believe that factors such as temperature, centrifugation rpm, detergents and load size could affect the discharge of
microplastics as well. However, more research is needed to answer if washing conditions and season have any
significant effect on the discharge of microplastics to the sewage water. A review on worldwide electricity and
water consumption for laundry washing by washing machine indicates that the average Swede washes about 74
cycles á 3-4 kg/year (Pakula and Stamminger 2010). This equals to about 220-300 kg laundry per capita per year. As
expected and confirmed by literature the discharge rates (mg synthetic fibers per kg textile per wash) varies, surely
depending on textile and washing conditions (

IVL-report C 183 Swedish sources and pathways for microplastics to the marine environment
28
).
The calculations in Table 9 give us a variation between 8 - 960 tons of microplastic fiber emission to sewage water.
This corresponds to about 1 - 100 g synthetic fibers per capita per year. The higher number is based on the average
amount of fibers discharged from a brand new fleece shirt in third and fourth wash (Folkö 2015), the assumption
that 300 kg laundry is washed per capita per year and that 50% of all our textiles are synthetic. The lower number is
based on the findings in Napper and Thompson 2016 where the lowest fiber discharge rate from synthetic garments
was about 23 000 fibers per kg laundry, that all fibers have a mass of 0.53 µg, that 220 kg laundry is washed per
capita per year and that 30% of all our textiles are synthetic. To date there are no reliable data for how many fibers
that are discharged from an average Swedish household and there is no data about the size distribution of these
fibers. Hence the numbers presented in Table 9 are rough estimations based on the limited data available at the
moment. A similar calculation for Norway resulted in an estimation of 600 tons annually, corresponding to 120 g
per capita per year (Sundt et al. 2014).
Table 8 Discharge rates of synthetic fibers from washing of clothes (mg per kg textile per wash).
Study mg per kg textile per wash
Dubaish and Liebezeit 2013 ~ 330 - 420
Folkö 20151 ~ 640
Browne et al. 2011, Pakula and Stamminger 2010 2 ~ 26 – 105
Napper and Thompson 20163 ~ 12 – 260
1Based on the average discharge of microplastic fibers of brand new fleece shirt’s third and fourth wash (about 15 mg / wash). Amount of discharged fibers decreased with increasing number of washes of the textile. The two initial washes released about 70 mg micro plastic fibers 2 Based on a simplification that one garment (~250 g) discharges 200 fibers per liter (Browne et al. 2011), the wash effluent is 60 liters (Pakula and Stamminger 2010) and that all individual fibers have a mass between : 0.54 – 2.17 μg / fiber (length 5 mm, diameter 10 – 20 μm (Napper and Thompson 2016, Haikonen, K., pers. obs.) and density of 1.38g per cm3 (PET), which corresponds to a polyester monofil with decitex (g/10km) = 1.08 – 4.34. (http://www.swicofil.com/companyinfo/manualmonofilconversiontable.html 2016). 3 Based on the results in Napper and Thompson 2016 where the laundering 6 kg of synthetic materials could release between 137,951–728,789 fibers per wash and the assumption that the fibers have a mass between 0.54 – 2.17 μg / fiber.

IVL-report C 183 Swedish sources and pathways for microplastics to the marine environment
29
Table 9 Amount of annual microplastic discharge from laundry. The total annual mass discharge of microplastic fibers to the sewage water in Sweden was calculated from data on discharge rates of microplastic fibers (Browne et al. 2011, Dubaish and Liebezeit 2013, Folkö 2015, Napper and Thompson 2016) and Swedish washing habits. The calculations are based on the assumption that 30-50% of all textiles are synthetic. Total laundry/capita/year 220-300 kg Amount of synthetic textile 30 - 50%
Population 2015 9.85 million
Laundry per capita 220 – 300 kg
Discharge of microplastics per total laundry mass 12 - 640 mg per kg
Total annual synthetic fiber discharge per year 8 - 945 tons
Knowledge gaps
There is still a lack of dedicated studies on the release of synthetic fibers from washing of textiles. The few reports
available today have a poor experimental design and must therefore be considered as snapshot observations.
4.3 Emissions from outdoor activities on land
4.3.1 Building, maintenance and construction work
Construction dust
Three main plastics are used in construction work. Polyvinyl chloride (PVC) is used mostly for pipes, window frames,
floors and wall coverings. Polyethylene (PE) is also present in pipes and in cable insulation, and finally polystyrene
(PS) is mostly produced for insulation foam (PlasticsEurope 2012). Expanded polystyrene (EPS) foam is widely used
in Sweden for pipes, roof and wall insulation but also to build embankments and house foundations. However, EPS
foam breaks easily during manipulation and can be blown away because of it low density (Plast och Kemiföretagen
2010). Once released into the environment EPS foam breaks into smaller pieces. During construction or
maintenance work, like sawing, sanding and drilling of plastic surfaces, microplastic particles will be emitted to the
air. Indoor dust on construction sites during work is limited to a maximum of 10 mg per m3 for the workers’ comfort
(Christensson et al. 2012). To achieve this norm several tools are used to trap dust particles which limit the spread
of microplastics from indoor construction sites. No limits are set for outdoor dust and what is emitted here is
dispersed by wind and rain (Verschoor et al. 2014a).

IVL-report C 183 Swedish sources and pathways for microplastics to the marine environment
30
Rubber emission
The use of EPDM-rubber (ethylene-propylene-diene-rubber) for playgrounds, school grounds and sport facilities
(Zimmerman 2009) is increasing (see also 4.3.2). EPDM-rubber is used as protection layer on asphalt or concrete
and is often combined with shredded SBR-rubber (styrene-butadiene-rubber) as under layer for a better shock
absorption (Gabert 2012). It can also be present as roofing materials, rings and strips, belts, conveyor belts,
electrical insulation or pond liner (Verschoor et al. 2014a). No specific studies have been done on microparticles
release by abrasion of SBR and EPDM rubber. The material is so new that its evolution over time is still unknown.
Moreover the quality differs from different manufacturers which makes it even more difficult to estimate the
degradation of products (Gabert 2012).
Coatings emission
Thermoplastic polymers are often used in coatings as binders. The most common binders are cellulose ester,
thermoplastic alkyl resins, polyurethane, some derivatives of rubber and polyester resins but there are also other
types of resins used. Binders usually represent around 40% of the coatings and different types can be mixed
(Baumann and Muth 1995).
The total volume of protective coating sold on the European market amounted to 165 000 tons per year (OECD
2009b) for 450 million habitants in 2001. Assuming that the proportion per capita is the same for Sweden, the
market is 3 630–6 600 tons per year (Table 10). There are no specific OECD emission factors for protective coatings
but Sundt et al. (2014) argues that the factor used to estimate losses during maintenance and abrasive blasting of
ships could be applied. That report uses the double emission factor to account for emissions to water and soil, 6.4%,
as an assumption.
Table 10 Emission of microplastic from in protective coatings (sales volume from 2001, OECD, 2009b)
Protective coatings sold in Europe 165 000 tons per year
Protective coatings sold in Sweden, assuming the same per capita amount 3 630 tons per year
Fraction of polymeric binder in coating 40%
Emission factor 6.4%
Microplastic emissions from protective coatings 93 tons per year
According to the OECD sales figures exterior paints represent 7.4–10.3% of 3 465·103 tons in Europe in 2001 (OECD,
2009b). That corresponds to 0.6 -0.8 kg per capita. The Swedish population is around 9.85 million, and if the sales
volume has remained the same since 2001 it would give an outdoor decorative paint consumption of 5 910–
7 880 tons per year (OECD 2009, SCB 2016). The potential emission from these paints is estimated by OECD to be

IVL-report C 183 Swedish sources and pathways for microplastics to the marine environment
31
1.5% but that does not take into account the possible spill during maintenance or waste disposal. The Norwegian
report (Sundt et al. 2014) estimated the potential loss to 5% to account for cleaning of surfaces and some improper
waste management.
When applying the OECD derived emission factor of 1.5% the total spill of microplastics from coating of buildings
and structures into the environment would be 128 - 859 tons per year (Table 10 and Table 11). Most of these losses
would occur at surfaces exposed to precipitation that can lead the microparticles to the sea whereas other parts can
be washed away and end up directly in the wastewater treatment system.
Table 11 Emission of microplastics from decorative coatings (sales volume from 2001, OECD, 2009b)
Decorative coatings sold in Europe 0.6-0.8 kg per year and capita
Decorative coatings sold in Sweden, assuming the same per capita amount 5 910 – 7 880 tons per year
Fraction of polymeric binder in coating 40%
Emission factor 1.5-5%
Microplastic emissions from decorative coatings 35-158 tons per year
The total emission of microplastics from protective coatings and decorative paint would hence amount to 128-251 tons per year (Table 10 and Table 11).
4.3.2 Loss of microplastics from artificial turfs
Artificial turfs are used in football arenas and similar sport fields, tennis courts, playgrounds, golf courses, traffic
islands and roundabouts, public spaces in parks and outdoor fitness areas. The advantages of using artificial grass
instead of natural grass are several and consequently the reason for the growing market for artificial turfs over the
years. The use of artificial turf on football and sport fields extends the playing season since it provides a durable,
soft, even and stable surface with good shock absorbance in all weather conditions. The risk of injuries in sport
fields and playgrounds is also lowered due to the chock absorbance from the underlying rubber material.
An artificial turf area is constructed of the artificial grass straws intertwined to a carpet. The material in the carpet is
a mixture of polypropylene (PP), polyamide 6, polyolefiner, and/or polyurethan (PUR) (Wredh 2014). The length of
the straw is typically 3-6 cm (Klima- og Forurensningsdirektoratet 2012a). To make the straws stand up the carpet is
dressed with sand which in turn is dressed with rubber granulates. The rubber granulates can consist of various
materials, depending on the desired characteristics of the surface. Below the layer of grass straws and the rubber
dressing there is a rubber pad which is underlain by crushed stone. The use of the rubber pad reduces the need of
the uppermost rubber infill by about 50% and it is more common when using the more expensive granulates of
thermoplastic elastomer (TPE) and ethylene propylene diene (EPDM) since it reduces the costs. The layer of crushed
stone rests commonly on the natural soil. The infiltration capacity of artificial football fields are high and percolating
water is usually ending up in the stormwater system (Mårtensson 2012).
IVL-report C 183 Swedish sources and pathways for microplastics to the marine environment
32
The rubber infill can have different origins. The most commonly used, due to the lower costs and good properties,
are rubber from recycled tyres, so called styrene butadiene rubber (SBR-rubber). In Sweden 60-70% of all football
fields have SBR-infill at present, but due to health- and environmental concerns other materials are now becoming
more popular (Lundqvist, pers.comm.). Another kind of rubber infill is EPDM class M which is a non-recycled
coloured rubber granulate with high resistance to UV-light and heat (Wredh 2014). Usually, the diene used in EPDM
is dicyclopentadiene (DCPD), etyliden norbornen (ENB) and vinyl norbornen (VNB). There is also R-EPDM which is
constructed of recycled EPDM. Thermoplastic elastomer (TPE) is made of a mixture of plastic and rubber with high
elasticity.
The amount of rubber infill used for an artificial turf area differs depending on the use, type of granulate, and the
size of the surface (football, tennis, playground etc.). Football fields have usually the same measures and in a Life
Cycle Analysis of recycled tyres performed by IVL (IVL Svenska Miljöinstitutet 2012), calculations were made from
one football field of 7 881 m2, which corresponds to 51, 61 and 87 tons of the three different granulate materials;
tyre (SBR), EPDM, and TPE. Rubber granulates in an artificial turf field can make up as much as 140 tons (Wredh
2014). The company Saltex estimates about 59 ton (118 m3) of infill per football field (Näätsaari, pers. comm.).
Sweden has in total about 1 336 artificial football fields (in 2016) of which 697 are for teams of 11 players, 235 for 5,
7 or 9 players, 81 indoor arenas and 323 other sport fields, so-called Kulan fields (Lundqvist, pers.comm.) The total
area of artificial football fields is thus around 6 056 580m2, assuming that fields for 11 players measure 7 140m2 and
Kulan fields 800 m2 (Lundqvist, pers.comm.). The areas of the fields for indoor arenas and 5, 7 and 9 players differ,
but we have here assumed that they in average count to 2 600 m2 per field, that is a normal size of a field for 7
players (Lundqvist, pers.comm).
After a rapid development of artificial football fields in Sweden during the last decades the numbers of new large
fields are now declining, but many smaller fields are built and the numbers of Kulan fields are likely to be three
times as high as here reported, while there is no central registry for these fields.
It is more common with TPE in indoor arenas due to the more pure material and thus it is assumed to cause lesser
health effects. Ragnsells (Odén, pers.comm.) is the largest producer of SBR-granulates from recycled tyres in
Sweden. They produced about 10 000 tons of rubber granulates in 2015 and about 75% of this amount was used to
produce infill material for artificial turfs.
At artificialgrass.info the estimated life span of an artificial turf is 15 years while Månsson (2010) states that 8-10
years is a common life span. The life span of course depends on how frequently the surface is used and how well it
is maintained. In the study of Wredh (2014) it is mentioned that some artificial turf fields are moved to other
football grounds when it is time for replacement (after 8-15 years). In the report from Klima- og
forurensningsdirektoratet (2012b) is mentioned that there is a demand for used artificial turf areas for verandas,
playgrounds or smaller football areas. In other cases the material is used as fuel in heating plants and there is also a
plant in Denmark where artificial football field materials are recycled.

IVL-report C 183 Swedish sources and pathways for microplastics to the marine environment
33
For our study we would like to estimate the amount of rubber infill and grass straws that reach the stormwater
from an artificial turf surface. One way to measure this is to look at the maintenance. Regular maintenance of the
surface is needed since wear and tear causes loss of rubber infill. The rubber infill is removed via snow clearance,
with shoes and clothes and via drained and runoff water. The cleared snow is gathered around the field and when
the snow melts the rubber granulates are outside the field. The infill is either reused at the field or collected as
waste. The rubber infill on shoes and clothes is transported to homes and may end up in the vacuum cleaner or in
water from the washing machine. The company Unisport (www.unisport.se) recommends that about 3-5 tons of
rubber infill is used for refill every year to preserve the properties of the artificial turf. This number is for football
fields for eleven players (7 140 m2) (Andersson, pers.comm.). Contacts with a number of municipalities and
(Lundqvist, pers.comm) shows that most artificial football fields are not refilled according to recommendations and
a more realistic refill is 2-3 tons/year, even if it differs a lot due to type of field, snow conditions, use and
maintenance.
This data can be used to estimate the yearly loss of rubber infill from artificial football fields (Table 12). Thus,
assuming that there are about 1 255 outside artificial turf fields with a total area of 5 845 980 m2 in Sweden today
and that they lose around 0.28 to 0.42 kg rubber per m2 in average (2-3 tons/year of rubber infill per 7 140 m2),
means that a total of around 1 640 - 2 460 tons of rubber granulates per year will be added to football fields in
Sweden. There are at present no measurements on how much of this material that reaches the water environment.
Table 12 Estimated loss of rubber granulates from football fields based on data on actual infill from
Swedish municipalities and the Swedish Football Association. It is not known how large amounts that
actually reach waters.
Yearly infill of granulates per football field (7 140 m2) 2-3 tons per year
Yearly infill of granulates per m2 0.28-0.42 kg per m2
Number of football fields 1 336 of which 697 are for teams of 11 players,
235 for 5, 7 or 9 players, 81 indoor arenas and
323 other sports fields, so-called Kulan fields.
Total potential loss of granulates per year from football fields 1 638-2 456 tons per year (not including
potential loss from indoor arenas).
Knowledge gaps
The study would be more complete with studies of the actual spill of granulates to the stormwater system from
granulate based areas. Data on the spill from other artificial turf areas such as golf courses, playgrounds and riding

IVL-report C 183 Swedish sources and pathways for microplastics to the marine environment
34
paddocks are also needed. The combination of theoretical calculations and actual measurements in the stormwater
system would strengthen the knowledge of the loss of microplastic particles from artificial turf fields to the sea.
Not much is mentioned about the loss of the actual grass straws which are probably also a source of microplastics
from artificial turf surfaces. The carpet of grass straws has often been glued with latex. Since latex is water soluble
and consists of minced SBR it implies that rainwater could solute the latex causing spreading of substances from the
latex itself and from the grass-carpet.
Granulates added to the artificial turfs will be compacted and some of the additions will therefore not be lost to the
surroundings. This study has not found any data on the degree of compaction verses loss.
4.3.3 Agricultural plastics
Plastics are widely used in the agricultural sector, and found in applications such as silage bales, bags and
horticultural foil.
Svensk Ensilageplast Retur (SvepRetur), an industry association for manufacturers, importers and retailers of silage
film, plastic bags and horticultural foil, runs a collection and recycling system for agricultural plastics on a non-profit
basis. SvepRetur has set up a voluntary commitment to collect 70% of the plastics used in agriculture of which at
least 30% should be recycled (SvepRetur 2016a). In 2015, SvepRetur collected 17 800 tons of plastics from Swedish
farmers of which 90% was recycled and the remaining subject to energy recovery (SvepRetur 2016b). SvepRetur
collects six different plastic categories: big bags that previously contained fertilizer or seeds, silage film, foil, net,
spools and drums. Drums which contained pesticides or fertilizers are burned for energy recovery (SvepRetur
2016c).
As in any sector, there is some loss of material, in this case plastics. Weathering and abrasion might generate small
plastic particles from agricultural plastics in use. The particle may be lost to the soil environment or be transported
with the wind. According to Lassen et al. (2015) the most likely pathway of releases of plastics from the agricultural
sector is not generation of small plastic particles, but the loss of larger pieces of plastics. Such larger pieces might
fragment to smaller pieces in the environment. However, it has neither been possible to quantify the amount of
plastics released from the agricultural sector, nor the share of plastics from the agricultural sector ending up in the
marine environment.
Knowledge gaps
No data is available on the amounts of either large or microscopic plastics that are released from agricultural
activities.

IVL-report C 183 Swedish sources and pathways for microplastics to the marine environment
35
4.3.4 Road wear and abrasion of tyres
The Swedish road network is extensive and make up a total length of 579 567 km including 104 707 km state roads,
41 825 km municipal roads and 433 035 km private roads (SCB 2010). According to the Swedish Transport
Administration a large proportion of the private roads are however forest roads, which in many cases are not open
to the public. Only approximately 77 000 km of the private roads get government grants meaning they should be
open for public use. On public roads the traffic works is estimated for a number of vehicle classes in Table 13.
Table 13 Traffic works on Swedish roads year 2015 [million vehicle kilometer per year] (Trafikanalys 2016).
Motor
cycle
Car Bus Light trucks Heavy trucks
(total weight
3.5-16 ton)
Heavy
trucks
(total
weight 16-
26 ton)
Heavy
trucks
(total
weight >26
ton)
Total
664 65 854 983 8 573 357 929 3 354 80 714
The total abrasion of asphalt is estimated to 110 000 tons per year in Sweden (Gustavsson 2001). According to
studies in China on road dust particle sizes <50 µm only constitute about 1% of the mean mass. About 21% of the
weight constitutes of particles with a size between 50- 99 µm, 43% of the weight of particles with the size of 100-
249 µm and 33% of the weight of particles with the size of 250-1 000 µm but the mean mass varies among samples
(Li et al. 2005). The fractions of particles that can be airborne are between some nanometers to about 100 µm
(Thorpe and Harrison 2008).
Bitumen is the binder in asphalt. In the normal asphalt the binder content is typically about 5-6% by weight
corresponding to about 10% by volume (Arvidsson 2015). In order to improve the properties (viscosity) of asphalt,
polymers are added to some bitumen. The materials used are mainly SBR (styrene butadiene) and SEBS (styrene
ethylene butylene styrene copolymer/”SEBS Rubber”) (Sundt et al. 2014). The yearly Swedish use of asphalt is 5-7
106 ton, which is equivalent to about 330 000 tons of bitumen (Asfaltskolan 2016). About 5% of this bitumen is
modified with different polymers in a mix of 95% bitumen which indicate that 825 tons of polymers are used in
asphalt on the Swedish roads yearly (Norberg, pers. comm.). Assuming that the concentration of polymers is the
same in road wear as in new asphalt the emission of polymers from the Swedish road network is estimated to 15
tons per year.
Car tyres are made up of numerous different rubber compounds, many types of carbon black, fillers like clay and
silica, and chemicals, minerals added to allow or accelerate vulcanization. About 35% of the thread part of the tyre
consists of rubber polymers (LTU 2016). During their life, tyres lose small particles due to abrasion and these
particles are classified as microplastics under the definition used in this study. Approximately 20% of the weight of a

IVL-report C 183 Swedish sources and pathways for microplastics to the marine environment
36
tyre wears away during the life of a wheel (LTU 2016). Rubber emissions from tyres in Sweden have been evaluated
in a study for two vehicle classes and are presented in Table 14.
Table 14 Rubber emissions from tyres ([g per vehical kilometer] (Gustavsson 2001)).
Car Bus
0.05 0.7
Based on these emission factors and the traffic works presented in Table 13 the total rubber dust emitted annually
is estimated (Table 15).
Table 15 Rubber wear from different vehicle types.
Rubber wear
ton/year
Motor cycle 17 Emission factor as car/2
Car 3 293 Emission factor car
Bus 688 Emission factor bus
Light trucks 429 Emission factor as car
Heavy trucks 3 248 Emission factor as bus
Total 7 674
Another source of microplastics from roads is abrasion of road marking. These are partly thermoplastic, partly
polymer paints. The content of road marking is mainly fillers but the typical thermoplastic elastomer content is
about 1-5% (Sundt et al. 2014).
In 1996 13 800 tons of thermoplastic marking and about 200 m3 of paint was used on the Swedish roads
(Gustavsson 2001). The project has not been able to find newer information about the use and abrasion of road
marking paint in Sweden. We have therefore calculated the Swedish emissions of microplastics from road paint
based on Norwegian data (Sundt et al. 2014) given that the conditions in the two countries are similar (Table 16 and
Table 17). The length of the Swedish public road network is 1.58 times the length of the Norwegian (SCB 2010, NVF
2016).

IVL-report C 183 Swedish sources and pathways for microplastics to the marine environment
37
Table 16 Expected annual use of road marking material in Sweden, calculated from Norwegian data based on total public road length. Thermoplastic marking (white and yellow) 19 657 ton
Paint marking 1 679 ton
Table 17 Estimated annual polymer use in road marking in Sweden, calculated from Norwegian data based on total public road length. Plastic product/material Amount of emitted microplastics
SIS (styrene-isoprene-styrene) 134 tons
EVA (etylene-vinylacetat) 104 tons
PA (polyamide) 90 tons
AM (acryl-monomer) 176 tons
Total 504 tons
Table 18 Estimated emission of microplastics from road wear and abrasion of tyres.
Source Amount of emitted microplastics
Polymer modified bitumen 15 tons per year
Car tyres 7 674 tons per year
Road marking 504 tons per year
Total 8 193 tons per year
Road dust entering the sea through air and water will hence have a component of microplastics from road
materials, road marking and car tyres. Even if the total emission of microplastics from the Swedish road network
(Table 18) is based on relatively good information it is much harder to estimate how much of this load is actually
reaching the ocean which can be presumed to be mainly through air transport, stormwater and snow. In Sweden
about ten big cities have permission to dump snow directly into waters. Stockholm alone has permission to dump
800 000 m3 of snow per year (SvD 2012).
A recently published report shows that sediment in a stormwater pump station contained an average 1 100 asphalt
particles per kg dry weight indicating that stormwater is an important transport route for road particles (Norén et
al. 2016). In order to estimate the amount of road particles containing microplastics that reaches the sea through
stormwater more information is needed about particle composition and concentration in stormwater from different
land use classes but also information about stormwater treatment effects on microplastics.

IVL-report C 183 Swedish sources and pathways for microplastics to the marine environment
38
Knowledge gaps
More data is needed on the fate of traffic derived microplastics after they have been emitted from e.g. car tyres,
road surface or road marking paint. Virtually no data is available on the quantities of particles from these sources
that eventually are transported to the sea.
4.4 Microplastics released from waste management and recycling
4.4.1 Landfills
Landfilling is a waste treatment method used when other alternatives are scarce. Common types of waste sent to
landfill include inert construction and demolition waste, but also porcelain, tiles and ceramics. In 2014, around
1 432 000 tons of waste was sent to landfills at Swedish municipal landfill sites (Avfall Sverige 2015).
Several policy instruments to decrease landfilling of waste have been implemented over the years such as landfill
tax and bans on landfilling certain waste fractions. Since 2002, a ban on landfilling combustible waste is in place and
since 2005 also a ban on landfilling organic waste. There are however two main exemptions from the bans. If the
waste fraction contains less than 10 weight percent TOC (Total Organic Carbon) or less than 10 volume percent
combustible waste, landfilling is accepted according to regulations and general guidelines on management of
combustible waste and organic waste (NFS 2004:4). In this context plastic is regarded as both organic and
combustible. Due to these exceptions permission can be given to landfill problematic waste fractions such as
shredder light fraction from end-of-life vehicles containing plastics.
Even though policy instruments have effectively reduced the amount of waste to landfill in Sweden, the Swedish
landfills contain a significant amount of plastic waste. Frändegård et al. (2013) estimated that municipal landfills
contain around 30 106 tons of waste whereof 8% is made up by plastics.
Plastic additives, such as phthalates, and the plastic constitutional monomer bisphenol A (BPA), leach out from
plastics and end up in landfill leachates leading to introduction of plastic-derived contaminants in the environment
(Teuten et al. 2009). The extent of leaching depends on both the properties of the additives, and the properties of
the plastic polymer. Additives can be chemically or not chemically bound to the polymer, which impacts the
leaching behavior (Bejgarn et al. 2015). The migration potential also depends on pore size in the polymer and the
size of the additive molecule, as well as surrounding factors such as the temperature in the landfills and pH
(Kalmykova et al. 2013). In 2012, 14 million m3 leachate was produced at Swedish landfill sites (Naturvårdsverket
2014), and treated to a varying extent. However, older landfills, containing high concentrations of organic material,
are now to a large extent covered to minimize leachate formation.
In Norway, a compilation of landfill leachate data from 2002 to 2012 showed a median of 17 μg/L BPA (Morin et al.
2015). Leachate samples from four landfills in the Gothenburg region in Sweden contained 0.01 to 107 μg/L of BPA

IVL-report C 183 Swedish sources and pathways for microplastics to the marine environment
39
with a median value of 0.55 μg/L. The samples were both untreated leachate, and treated leachates (Kalmykova et
al. 2013).
In Morin et al. (2015) it was concluded that substantial amounts of BPA in landfill leachates come from plastic waste
fractions. Other sources of BPA exist such as thermal-paper coatings. The same study concluded that BPA leachate
concentrations are mainly freely dissolved and not bound to (plastic) colloids.
In Sundt et al. (2014) the amount of microplastics leaking from Norwegian landfill sites was estimated based on
content of phthalates measured in landfill leachates, i.e. that a certain content of phthalates was considered to
represent a certain amount of plastics. However, translating toxic substances to plastics has not been used as a
method when studying other potential sources of microplastics in this project, and would change its scope.
Knowledge gaps
Leaching of plastics additives is widely documented in literature, but no information has been found on content of
plastics (either micro or macro) in landfill leachates. Due to this lack of data it is not considered possible to estimate
the landfills’ role as a potential source of microplastics to the sea. The impact of landfill leachate treatment on
potential content of plastics in leachates is also unknown to us. Landfill leachate can be treated in municipal
wastewater treatment plants, but also in dedicated landfill leachate treatment processes. Other identified
knowledge gaps hampering the evaluation is the extent of plastic littering from landfill and waste management
sites. This potential source has not been possible to quantify.
4.4.2 Plastic recycling facilities
Plastic waste is collected for recycling from various locations, e.g. from municipal recycling centres, from recycling
stations for packaging waste, from reverse vending machines (PET bottles) and from private companies. Handling of
plastic waste can result in littering due to air drift and overloaded containers and bins. A share of the plastic litter
from this handling could end up in the sea by stormwater and air drift, but the yearly quantity has not been possible
to estimate. The same challenge applies to all handling and management of plastic waste, such as reloading
activities.
There are few plastic recycling facilities in Sweden, also depending on how you define plastic recycling. There is no
compiled statistics on the annual quantity of plastic waste recycled in Sweden (here meaning the amount of plastic
waste turned into secondary raw material to produce new plastic products), as this is not followed-up nationally.
The separately collected plastic waste fractions (such as plastic packaging waste) are for example both recycled in
Sweden and transported for recycling abroad. The biggest sorting facility for plastic packaging waste in the Nordic
countries, Swerec, is located in Lanna, Småland, where plastic packaging waste from households, and other plastic
waste fractions, are washed and sorted into different polymers to enable recycling. The plastic waste is washed in a
closed cleaning process, and the process water circulated. When the water no longer can be used it is treated as
IVL-report C 183 Swedish sources and pathways for microplastics to the marine environment
40
waste, and is not released to the municipal stormwater system or wastewater system. Water runoff from surfaces is
treated in a sedimentation basin before it is released onto the municipal stormwater system. The possible amount
of plastic particles in the water is unknown (Håkansson, pers. comm.). PET bottles collected from reverse vending
machines are processed into PET flakes by Cleanaway PET Svenska AB, a company specialised in bottle-to-bottle
recycling. Cleanaway’s process water is treated by high speed separators to eliminate plastic fines present in the
water. The water is thereafter released to the waste water system. The allowed of suspended material in the water
released to the waste water system is regulated in Cleanaway’s environmental permit (Ottosson, pers. comm.).
Knowledge gaps
There is today no available data on the emission of either plastics or microplastics from recycling facilities or
facilities handling plastic waste in any way.
4.4.3 Organic waste treatment
Food waste is separately collected in 190 municipalities in Sweden, but to a varying extent. The most common
collection system for source-separated food waste is to use separate containers although other types of collection
systems are in place such as multi-compartment bins and collection systems based on optical sorting techniques
(Avfall Sverige 2015).
Food waste is either biologically treated in anaerobic digestion plants producing biogas and digestate, or
composted. The biological treatment of food waste, excluding home compost, was almost 390 000 tons in 2014 of
which 275 000 tons were sent to anaerobic digestion in co-digestion plants, 62 000 tons to anaerobic digestion at
wastewater treatment plants, and 53 000 tons to composting (Avfall Sverige 2015).
Anaerobic digestion of food waste takes place in so-called co-digestion plants, where food waste is biologically
treated together with other types of substrate, e.g. manure and slaughterhouse waste. The aim of the digestion is
to produce biogas to be used in production of heat and electricity or as vehicle fuel. Anaerobic digestion also
produces digestate, a fertilizer with a high nutrient content (Avfall Sverige 2015). In 2014, 1.39 106 tons of digestate
(wet weight) was produced from co-digestion plants of which 99% were used as fertilizer on farmland
(Energimyndigheten 2015). The compost produced from composting food waste is mainly used in soil conditioners
and soil mixtures (Avfall Sverige 2016), such as for constructions of lawns, and plantations of trees and bushes
(Avfall Sverige 2016).
Potential content of plastics present in digestate from anaerobic digestion of food waste
Collected food waste contains some miss-sorted contaminants, for example plastic waste. An expert on waste
analyses of food waste roughly estimates that the share of plastics in food waste could be everything from 1-3% of
flexible plastic packaging waste, up to 1% of rigid plastic packaging waste and around 0.5% of other plastic items

IVL-report C 183 Swedish sources and pathways for microplastics to the marine environment
41
(Vukicevic, pers. comm.). Results from a high number of analyses of separately collected food waste showed that
the median values of the share of plastic packaging in food waste were 0.9% for single-family homes and 0.4% for
apartment buildings (Leander and Sernland 2011). Assuming a share of 0.5% plastics in separately collected food
waste sent to anaerobic treatment (275 000 tons in 2014) leads to a total amount of around 1 375 tons of plastics.
However, up-scaling should be made with precaution as the share of plastics in collected food waste differs
considerably.
The majority of plastics in the food waste will not end up in the digestate as anaerobic digestion plants include pre-
treatment processes. The purpose of pre-treatment is to improve the anaerobic digestion process, increase the
biogas yields, and the quality of the digestate. By physical pre-treatment processes contaminants can be removed
as well as bags for the collection of food waste, and the particle size can be reduced (Bernstad et al. 2013). Both
collection bags of paper and plastics are used depending on the municipality.
Many of the currently used pretreatment technologies separate the miss-sorted material based on density and
particle size. Large and heavy particles are commonly separated into a refuse fraction, but it means that heavier
fractions of food waste such as orange peels, bones etc. may accidently end up in the refuse fraction (Bernstad et al.
2013). The most common pretreatment methods in the Swedish co-digestion plants are to use so-called screw press
as well as sieves and screens (Malmquist 2012).
The separation of contaminants in the food waste is not perfect, no matter which pretreatment technique that is
used (Malmquist 2012). Even though different separation techniques remove the majority of the plastics present in
food waste, fragments of plastics may pass the separation stage and follow the substrate to the biogas production
stage. It is likely that the plastics do not degrade in the anaerobic digestion as the retention time is only 10-60 days
(Levén et al. 2012). There is also a theoretical risk that microplastics may be produced in the pretreatment
processes as they commonly involve grinding of the substrate (Levén et al. 2012). Plastic particles, both on micro
and macro scale, can by other words end up in the digestate. No data on separation efficiency of plastics in the
pretreatment processes have been found.
Levén et al. (2012) concludes that no independent information on separation efficiency of plastics in the pre-
treatment processes is available. This study comes to the same conclusion. Ideally, the plastics present in food
waste would be able to track all the way through the biological treatment processes by creating a mass balance. The
lack of information makes the assumption on separation efficiency of plastics so uncertain that it is not considered
possible to make.
Quality labelling of digestate
Anaerobic digestion plants or compost plants have the possibility to quality label their products (digestate and
compost) through a certification system. The certification system has been developed by Avfall Sverige in
consultation with the agricultural and food industries, compost and digestate producers, soil producers, public
IVL-report C 183 Swedish sources and pathways for microplastics to the marine environment
42
authorities and researchers. 82% of all digestate produced in co-digestion plants and used in agriculture in 2014,
was certified (Avfall Sverige 2015). The certification means that the digestate has to live up to certain quality
requirements in terms of content of metals, visible contaminants, content of dry matter etc. The requirement on
visible content is currently formulated as the total content of visible contaminants over 2 mm may not exceed 0.5
weight percent of the dry content of the digestate. This requirement will, however, change and be followed up by
using another method. No later than the last half of 2017 the certified plants have to demonstrate that they fulfill
the criterion of maximum 20 cm2 visible contaminants per kg digestate. In 2016, the older and the newer methods
are used in parallel (Steinwig, pers. comm.).
There is no available method for analyzing particles below 2 mm even though the issue is high on the agenda
according to Avfall Sverige (Steinwig, pers. comm.).
Avfall Sverige recently carried out an internal project to validate the new method of measuring visible
contaminants. Results on visible contaminants from 17 co-digestion plants, all certified to SPCR 120, showed that
visible contaminants on average represented 0.05 percent of the dry weight in the digestate. The results were
based on six samples (one sample a month) from the 17 plants. The average dry weight content was 3.8 percent.
The majority of the visible contaminants was plastics, and the size in general under 1 cm2. It must be noted that the
results are preliminary and based on a limited amount of samples under a limited time period. More accurate data
will be available in 2017 when the new method is fully implemented (Steinwig, pers. comm.).
Assuming a dry content of the digestate of 3.8% based on the preliminary results from the above mentioned project
makes a total of 52 440 tons of dry content in the digestate used as fertilizer on farmland in 2014. Roughly assuming
that the average content of visible contaminants present in the digestate from the 17 anaerobic digestion plants is
representative for the total amount of produced certified digestate leads to an estimation of 26 tons of plastics over
2 mm present in the digestate spread on farmland (Table 19). It is then assumed that the total amount of visible
contaminants consists of plastics.
As digestate is used on farmland as a fertilizer, the plastics can be added to the soil, and may leak out to recipients
and eventually to the sea. Little information has been found on the potential share of plastics staying in the soil, and
leaking out from the soil. The probability should speculatively increase the closer to a recipient the farmland is
located, and also be dependent on precipitation In the US, synthetic fibers from laundry have been found in
agricultural soil up to 15 years after the soil was fertilized with sludge from wastewater treatment (Zubris and
Richards 2005). It is unknown how much of the plastics present in digestate that reaches the sea.

IVL-report C 183 Swedish sources and pathways for microplastics to the marine environment
43
Table 19 Key assumptions for the estimation of plastics present in digestate from co-digestion plants used on farmland in 2014.
Amount of certified digestate from co-digestion plants used on farmland in 20141
1.38·106 tons
Assumed average dry weight content in the digestate2 3.8%
Total dry weight content in digestate from co-digestion plants used on farmland in 2014
52 440 tons
Average content of visible contaminants in digestate from internal project run by Avfall Sverige2
0.05% of dry weight
Estimated amount of plastics (over 2 mm) in total amount of digestate used on farmland 2014
26 tons
1 Energimyndigheten 2015 2 Steinwig, pers. comm.
Knowledge gaps
More information about separation efficiency of contaminants in the pretreatment processes of food waste would
facilitate the estimation, as well as data on microplastics content in the digestate. Another knowledge gap is about
to which extent plastics in digestate used on farmland reaches the sea, and the retention times. In addition, plastics
present in compost and manure is also unknown.
4.4.4 Other waste management
In addition to the possible release of microplastics from waste management and recycling described so far in this
chapter, all kinds of plastic waste handling can potentially result in release of microplastics. Such handling includes
for example air-drift of plastic waste due to overloaded containers and bins, and wear and tear of plastic waste
exposed to whether and wind. This is a risk when plastic waste is collected, re-loaded, processed etc. It has neither
been possible to quantify the amount of plastics released from these diverse sources, nor the share of plastics from
these sources ending up in the marine environment.
4.5 Littering
Disposal of items on the ground or in the aquatic environment is defined as littering. The items could be everything
from packaging, cigarette butts, and chewing gums to end-of-life vehicles and furniture. Insufficient waste
management and improper human behaviour are the main causes of littering (Mehlhart and Blepp 2012).
Behaviours causing littering are for example:
• Discard of waste in the streets or rivers by pedestrians
• Motorists discarding garbage out of windows
• Laziness, e.g. people that do not bother to pick litter up when it misses the waste bins

IVL-report C 183 Swedish sources and pathways for microplastics to the marine environment
44
• Bury of litter under sand at the beach
• Disposable mentality, relying that the garbage is collected
Land-based litter could eventually end up in the marine environment through various pathways, such as transport
by stormwater, winds and snow etc. (Håll Sverige Rent 2015a). The amount of litter reaching the sea depends on
numerous factors such as waste management infrastructure, which could vary substantially from country to country
(Jambeck et al. 2015). It is estimated that up to 10% of all newly produced plastics eventually will find its way to the
sea (Thompson 2006), and littering is one transfer route. According to Jambeck et al. (2015) 270 million tons of
plastic waste was generated in 192 coastal countries in 2010 where 4.8 -12.7 million tons entered the oceans.
Depending on where the plastic litter is located, the degradation rates differ. Plastic litter on beaches is exposed to
relatively high temperatures which increases the degradation rate. The degradation rate could double with a
temperature increase of 10 degrees (Andrady 2011). In addition, plastic litter exposed to sunlight can degrade due
to oxidation of the polymer matrix leading to bond cleavage caused by UV radiation. The degradation can result in
migration of additives from the plastics to the environment. Plastic litter on beaches is highly available to oxygen
and to direct exposure to sunlight causing the plastics to brittle and form cracks. Brittle plastics could more easily
fragment to smaller pieces due to abrasion, wave-action and turbulence. According to Andrady (2011) in situ
weathering of plastic litter in the beach environment is a likely mechanism for generation of a majority of
microplastics.
As detailed material flows of plastics are difficult to obtain, an alternative to estimate the pressure of litter for a
town, municipality or region is to use pressure indicators displaying the risk of marine littering of plastic waste. The
pressure indicators proposed by Mehlhart and Blepp (2012) are:
• Population density. This is a general indicator for land-sourced litter in particular. More people generate
more litter. However, the impact of the population density depends on mitigation measures, e.g. the
establishment of waste management systems.
• Tourism and recreation. Leisure activities and tourism contribute significantly to the amount of litter on
beaches and other tourist sites along coasts. A potential indicator for the potential pressure is the total
number of overnights.
• Port activities. The amount of goods annually loaded and unloaded in ports can be used as an indicator of
the potential pressure, but the potential pressure is difficult to estimate.
• Solid waste management. Several pressure indicators for waste management are possible: the level of
collection and treatment of municipal waste, management of waste from dump sites located near coasts
or riverbanks/rivers, management of plastic packaging waste, management of commercial and industrial
waste, and management of agricultural plastic waste.
• Wastewater treatment is mentioned as a pressure, but no indicator is proposed

IVL-report C 183 Swedish sources and pathways for microplastics to the marine environment
45
Beach litter monitoring
Beach litter monitoring is a common approach to measure litter in the marine environment. Results from litter
monitoring facilitate estimations of amounts, and types of litter and serve as valuable information in order to
prevent littering (Håll Sverige Rent 2015a). The method is considered relatively simple, and can be carried out at low
cost with low requirements on logistics (Cole et al. 2011). Historically, beach litter monitoring has been problematic
due to lack of a common method to enable comparison of different studies. Several other drawbacks of the method
are worth mentioning. One drawback is that microplastics too small to be observed are likely to go unnoticed
(Andrady 2011). A study of beach sediments at the Belgian coast (Van Cauwenberghe et al. 2013) estimated that
microplastics contribute between 8 and 40% of the plastic weight in beach sediments at the Belgian coast. This
means that microplastics represent a significant share of the total beach plastic litter. Another drawback is that
plastic litter along the coastline will constitute both litter from land and from sources at sea, which makes beach
litter monitoring insufficient in order to measure marine plastic litter (Andrady 2011). Both land-based and marine
sources of plastics are thus relevant in this project. Lebreton et al. (2012) thus suggests that litter from marine
sources is more likely to remain in circulation in the ocean compared to litter coming from land-based sources.
Besides, the distribution of litter on beaches is very patchy, and depends on currents and proximity to urban areas
and population densities (Barnes et al. 2009).
In 2009 UNEP (United Nations Environment Programme)/IOC (Intergovernmental Oceanographic Commission)
developed guidelines for monitoring of marine litter. The guidelines were adapted to Baltic Sea conditions by the
MARLIN project in cooperation with Statistics Sweden in 2011. 23 reference beaches in Sweden, Finland, Estonia
and Latvia were surveyed 138 times in MARLIN, between 2011 and 2013 (MARLIN 2014). According to the results
from the project, 56% of the litter items found when surveying beach litter on the 23 reference beaches constituted
of plastic (urban beaches 59%, rural beaches 50% and peri-urban beaches 53%). Foamed plastics included, the total
amount of plastic litter was 62% (urban beaches 67%, peri-urban beaches 58% and rural beaches 54%). Cigarette
butts were counted separately and are thus not included in the above mentioned figures, but were the most
common type of litter on urban beaches. The most common litter from MARLIN monitoring results, except cigarette
butts, were the small unidentified pieces of plastic, which consisted of 25.3% of all litter items (MARLIN 2014).
Sweden conducts beach litter monitoring on the Skagerrak coast in the west of Sweden within the OSPAR
programme where litter on six beaches are monitored several times every year using a specified sampling protocol
of 100 meter of beach length. The Skagerrak coast is one of the most littered areas in Europe due to water currents
bringing litter from the North Atlantic to the beaches of the Skagerrak coast. Average numbers of plastic litter per
quarter of a year and beach for the six reference beaches were 805 for winter and 629 for summer. The most
common type of litter found on the references beaches were unidentified plastic litter items below 50 cm, and nets
and ropes below 50 cm (Svärd 2013). Of the 3 m3 litter (12 377 litter items) sampled and analysed from beaches in
Strömstad, Göteborg and Helsingborg in 2014, 87 percent of the litter was represented by products of plastics and
expanded polystyrene (Håll Sverige Rent 2015a).

IVL-report C 183 Swedish sources and pathways for microplastics to the marine environment
46
The average number of litter per 100 meter beach in the Swedish HELCOM area (from Gothenburg to Haparanda) is
monitored to 88 pieces of litter by beach litter monitoring. The value of 88 litter items per 100 meter is an average
value for 2012, 2013 and 2014 for the ten reference beaches. The share of plastic litter is around 56% of total
amount of litter, i.e. 50 plastic litter items per 100 m (Håll Sverige Rent 2015b).
Litter monitoring of urban areas
The most common type of litter in urban environments (in 2014) is paper (38 %) and plastics (27%), excluding
cigarette butts. Håll Sverige Rent carries out litter monitoring in urban environments since 2009. Around 10
measurements per year have been conducted since the start in a total of 19 municipalities. Results from litter
monitoring in urban environments in Sweden show that each 10 m2 of urban area is littered with an average of 0.4
plastic items (rigid and flexible) (Håll Sverige Rent 2016).
Challenges to estimate annual litter load
It is tempting to try and upscale results from monitoring of litter in urban environment, and on beaches, to a
potential, annual load of plastic litter from land to sea based on the total length of coast, and on total area of urban
environment. There are several reasons why such upscaling is surrounded by severe uncertainties to the point that
it is not considered possible to make based on the findings in this project. A non-exhaustive list of uncertainties is
presented below:
• Monitoring of litter per 100 meter beach length or 10 m2 urban is spot checks on the litter situation at the
time of sampling. The litter situation before and after the monitoring is unknown why it is not possible to
estimate an annual litter load.
• The results from beach litter monitoring are expressed in number of litter per certain beach length, such
as per 100 meter beach. The results must therefore be translated into weight instead of items to be able
to calculate a litter load, which causes trouble as the litter items vary significantly in size.
• The litter amount estimated based on sampling of litter could be significantly underestimated due to high
turnover of litter caused by tide water and wind. Litter could also be buried in soil or sand, and not be
visible when sampling (Smith and Markic 2013).
• The magnitude of littering varies a lot along the Swedish coast. The upscaling to a total length of coast is
also complicated by the fact that the entire Swedish coast is not as available as the reference beaches why
the amounts of litter could be overestimated.
• It is uncertain how much of the plastic litter found on the beaches that originate from land. International
data, mainly based on beach litter monitoring, demonstrates that land-sourced litter represents 75-90% of
total marine litter items found on beaches. Results from the three European seas; the Baltic Sea, the
North Sea and the Mediterranean Sea partly differs from the global pattern as less plastic bags are
detected as percent of all collected items (Mehlhart and Blepp 2012).

IVL-report C 183 Swedish sources and pathways for microplastics to the marine environment
47
Despite the litter monitoring carried out in Sweden, the limitations and challenges described above make us come
to the conclusion that the annual plastic litter load ending up in the sea is not possible to estimate with the
available litter monitoring results.
4.6 Emissions from activities at sea
4.6.1 Wear from boat hulls
Microplastics can be formed from boat paint from commercial vessels and leisure boats, both from the paint used
for solid coating and the antifouling paint. Different types of plastics are used in the coatings: Polyurethane and
epoxy coatings are common but also vinyl, lacquers and others are common (OECD 2009b). The special properties
of antifouling paints are achieved by several different types of polymers, such as self-polishing copolymers.
Commercial vessels
Protective coatings are applied to all parts of vessels; hull, superstructure and equipment on deck, and contributes
to spreading of microplastics to the environment. According to OECD (2009b) it can be assumed that about 6% of
the solid coating content on ships is spilled directly to the sea during the lifetime of the coating. About 1.8% is
spilled during painting, 1% from weathering during use and 3.2% during maintenance and abrasive blasting. In
addition 5% is expected to be spread to soil at the shipyard. These factors however assume a recovery of 90% of the
produced particles when spray painting and abrasive blasting, which the report suggests is representative for
European shipyards. Sundt et al. (2014) assumed that the emission factors were twice as high for Norwegian
conditions, 12 % to water and 10 % to soil due to improper management at small and medium sized shipyards. The
management is however regulated in Sweden and systems for waste collection and effluent treatment is in place at
Swedish shipyards, according to their own business organization (Ringnér, pers. comm.) and the emission factors
presented by OECD have therefore been applied (Table 20). However, weathering from international shipping of
course occurs in Swedish waters, but ship maintenance is to a large extent performed abroad these days. Emission
factors based on consumed coatings in Sweden may therefore underestimate the total emissions to the sea
(including areas beyond Swedish coastal waters).
Apart from protective coatings, antifouling coatings are used on submerged surfaces to prevent biofouling. The
most important area of use for antifouling products is the use on ship hulls to avoid increased friction from
biofouling, for commercial vessels but also for leisure boats. Worldwide the demand for this use is approximately
95% of the total demand. There are several different kinds of antifouling paints regarding the function of the paint
matrix. In some kinds the matrix hydrolyses, in other it dissolves (OECD 2005). Sundt et al. (2014) noted that several
polymers are used in antifouling paints, but according to the paint industry they are mostly present in non-
particulate forms and the formation of microplastics should thereby be neglectable. Indeed, OECD’s report on

IVL-report C 183 Swedish sources and pathways for microplastics to the marine environment
48
emissions from antifouling paints by (OECD, 2005) only covers the release of biocides. Small flakes of antifouling
coating will however be released when boat hulls are cleaned or abrasive blasted at shipyards. In a Danish report on
sources to marine microplastics Lassen et al. (2015) regarded hydrolyses and degrading of antifoulants in use as
emissons of microplastics.
Leisure boats
Microplastic paint flakes will come off hulls of leisure boats during use but emissions in marinas may be high when
leisure boats are maintained by cleaning, scraping and painting. Guidelines for marinas was however formulated in
2012 (revised in 2015) (Havs- och vattenmyndigheten 2015) and will be implemented by municipalities the coming
years. All boats painted with antifouling paint will need to be cleaned on special surfaces with runoff treatment.
Other boats will be allowed to be cleaned by machine brushing while still in the water but in a sealed off waterbody
where paint flakes and biological growth is collected. If implemented by marinas this should reduce the emission of
microplastic particles from cleaning. Municipalities are also increasing the demands on marinas where boats are
scraped or abrasive blasted to remove paint. Dust and flakes should be collected by placing tarp under the boat and
if necessary protecting the boat from wind (Miljösamverkan Stockholms län 2015). The collected waste should then
be sent for proper waste treatment. According to Anneli Åstebro (pers. comm.), environmental inspector in
municipality of Järfälla, the new rules are being implemented fast and becoming common practice at most marinas.
Consequently, future emissions of microplastics from cleaning and scraping leisure boats should be lower than they
were just a few years ago thanks to proper safety measures and waste collection in marinas. Helena Martinell (pers.
comm.), environmental inspector in municipality of Gothenburg, states that it is difficult to persuade all boat
owners into using good practice when scraping off biofouling and coatings, but also points out that the availability
of proper wet abrasive blasting equipment at special surfaces with runoff treatment has reduced the need for
manual scraping. Hence, more paint flakes will end up in the marinas’ treatment facilities rather than in the soil.
The availability of proper facilities in marinas has differed historically between the two coasts and differences may
persist until national guidelines are implemented. Emissions of microplastics may be higher on the east than the
west coast today. This is a result of the geographical differences in the restrictions for use of antifouling paint,
stricter on the east coast than on the west coast. Marinas on the west coast therefore have elevated risk of soil
contamination by biocides when boats are cleaned or scraped, which in turn led to stricter regulations by local
authorities on the west coast to collect the scraped off fragments. This has not been the case on the east coast and
reports from two municipalities there; Järfälla (2007 and 2012) and Värmdö (2010) conclude that most east coast
marinas let boat owners clean their leisure boats on gravel surfaces with no runoff treatment. The main activity is
generally cleaning away algae and other growth, but the gravel surfaces may also be used for scraping away paint
before repainting boats. All marinas where leisure boats are cleaned and scraped are however emission hotspots,
on both coasts, as noted by Eklund and Eklund (2012). They compared soil samples from 34 marinas along the west
coast and southern part of the east coast and did not report any regional differences. Very high concentrations of
toxic metals and organic compounds were noted in most samples, which indicate release from antifouling coatings
but not necessarily emission of microplastics.
IVL-report C 183 Swedish sources and pathways for microplastics to the marine environment
49
Quantities of paint used on commercial ships and on leisure boats
To estimate the amount of paint on commercial ships and on leisure boats in Sweden data from Sundt et al. (2014)
for Norwegian vessels was adjusted to the number of commercial ships and leisure boats in Sweden. The number of
commercial ships larger than 100 GT are according to vesselfinder.com approximately five times larger in Norway
than in Sweden and due to the lack of better data, the amount of used maritime coatings (excluding antifouling
paint) assumed by Sundt et al. (2014) in the report on source to microplastics in Norway, was divided by five to
adjust the data to Swedish conditions. There are 881 000 seaworthy leisure boats in Sweden (unknown how many
are actually in use) (Transportstyrelsen 2010) compared to 750 000 in Norway of which about half are in use (Sundt
et al. 2014), so for leisure boats we assume the amount of coating to be the same in both countries. However, the
emission factors (=loss of paint) will be those presented by OECD (2009b) and not those used in the Norwegian
report. The amounts of coating paint used per year in Norway were estimated to 6 000 tons for commercial vessels
and 2 000 tons for leisure boats (Sundt et al. 2014), and here we therefore assume 1 200 tons for commercial
vessels and 2 000 tons for leisure boats in Sweden. Using the emission factors by OECD (2009b) and Lassen et al.
(2015) and assuming the full 55% solid content to be transformed into microplastics (actually a mix of plastics and
the other solids in flakes) as suggested in Lassen et al. (2015) (likely if it is mainly flakes coming off the hulls) result
in emissions of 40 tons of microplastics for commercial vessels and 110-550 tons for leisure boats (Table 20 and
Table 21).
The amount of antifouling paint used in this report is based on how much biocide that was sold in Sweden in 2014
(data retrieved from KemI by Dan Isaksson, I-Tech AB). 75.8 tons of biocide were sold to the industry and 55.8 tons
to the households. The biocide content in products to the industry is 30% and to the households 10%, which gives
us an estimate of 256 and 556 tons of antifouling paint respectively. Our calculations are based on a polymer
content of 10-50% and an emission factor of 6% for commercial vessels (OECD 2009b) and of 10-50% for leisure
boats (Lassen et al. 2015) during the lifetime of the paint.
The total emissions of paint fragments from leisure boats to the sea are estimated to be higher than that for
commercial vessels (Table 20 and Table 21). It is estimated that 90% of applied coatings on leisure boats in Norway
will be released into the sea and 10-50% in Denmark, due to different practices of collecting waste material. As
management practices are improving in Sweden, the Danish emission scenario seems more plausible.

IVL-report C 183 Swedish sources and pathways for microplastics to the marine environment
50
Table 20 - Emission of microplastics to water from maritime coatings and antifouling paint on commercial vessels.
Maritime coatings (excluding antifouling paint) used on commercial vessels 1 200 tons per year
Antifouling paint used on commercial vessel 252 tons per year
Assumed solid content of coatings forming microplastics 55%
Polymer content in antifouling paint 10-50%
Emission factor to water (% of the solid coating and antifouling paint) 6%
Emission of microplastics to water 40 tons from coatings
and
2-8 tons from
antifouling paint per
year
Table 201 Emission of microplastic to water from maritime coatings and antifouling paint on leisure boats.
Maritime coatings (excluding antifouling paint) used on leisure boats 2 000 tons per year
Antifouling paint used on leisure vessel 556 tons per year
Assumed solid content of coatings forming microplastics 55%
Polymer content in antifouling paint 10-50%
Emission factor to water (Lassen et al. 2015) 10-50%
Emission of microplastics to water 110-550 tons from
coatings and
6-139 tons from
antifouling paint per
year

IVL-report C 183 Swedish sources and pathways for microplastics to the marine environment
51
Using the available emission factors and assumptions on the use of coatings and antifouling paint, the total annual
emissions of microplastics from boat hulls (both commercial and leisure boats) in Sweden may be in the range of
158-737 tons directly to water.
Emissions from boat hulls submerged in water will be directly into the lake or sea. The same is true for much of the
emissions from maintenance in shipyards and marinas as they are located by the water. However, soil emissions
should be considerable at sites of maintenance (OECD 2009b). Concentration of toxic metals and organic
compounds are highest in the top soil of marinas, indicating considerable emissions in recent years (Eklund and
Eklund 2012). It may also indicate that much paint residues are washed into the recipient rather than percolating
deeper into the soil, but little is known of the exact transport processes (Eklund and Eklund 2012).
Knowledge gaps
It is possible to make assumptions on the ratio of emissions from maritime coatings and antifouling paint during the
product lifecycle, but without accurate statistics on the sales and use of different coatings and antifouling paint it is
not possible to make accurate assessments of the total emissions.
Little is known about the actual size distribution of particles coming of boat hulls and their fate, although it is
assumed to be in the range of microplastics by Sundt et al. (2014) (not concerning antifouling coatings). The
particles or single polymers may be in the nano- or microscale, the plastics coming from antifouling coatings during
use is probably smaller than microplastics and may also be designed to hydrolyse.
4.6.2 Wear of fishing gear and floating devices
Fishing gear made out of plastic is now used across the globe, mainly polyethylene (PE), polypropylene (PP) and
nylon. Floats are essential in fishing, aquaculture and marinas and are globally often made from expanded
polystyrene (EPS). As the equipment floats or is submerged in the water, formation of microplastics is probably very
low, although bottom trawling for instance should chafe the equipment. Several studies referred to in a review by
Andrady (2011) have compared the degradation of plastic material (shortening of the polymers) lying on beaches or
floating in the sea (see also 1.3.2 and 4.5). Degradation will lower the strength and usability of the equipment which
makes it likely that the equipment is replaced before too much microplastic has been formed. It is also argued by
Sundt et al. (2014), concerning sources of microplastics in Norway, that proper use of plastic fishing gear is not a
significant source of microplastics. The assumption is supported by information from the Danish company Plastix
A/S that recycles fishing nets. According to Anders Raft, purchasing manager at Plastix A/S (pers. comm.) most of
the discarded nets they receive are in fairly good condition. This is however only true when fishing and aquaculture
are managed properly.

IVL-report C 183 Swedish sources and pathways for microplastics to the marine environment
52
Some equipment will however be lost or discarded at sea, and this is a significant source of macroplastic in oceans
and seas (Andrady 2011). Long-time storage, dumping or abandoning by the seaside can also be seen as improper
management of fishery and aquaculture. In these cases, the equipment may degrade chemically and deteriorate
physically into microplastic. Arcadis (2014) states that professional fishing is responsible for 13% of the macroplastic
in the North Sea, whereas recreational fishing is responsible for 14% of the macroplastic in the Baltic Sea. KIMO
Baltic Sea and Håll Sverige Rent (2012) examined the amount of derelict fishing nets by dragging in a few locations
in the Swedish territory of the Baltic. They found on average 61 m of derelict nets per km2, mostly in areas with
stony bottoms which are appropriate for gill net fishing. The number of recovered nets was probably high because
the dragged areas were selected based on suspicion of present nets. Most nets found were approximately 15-20
years old, indicating that fewer nets are lost today and that they degrade very slowly. Brown and Macfadyen (2007)
provide a similar picture stating that many gillnets are lost but recovered, whereas around 0.1% are lost
permanently. International data can provide another picture, for example in South Korea over 30% of gillnets are
accounted as lost every year (Kim et al. 2014).
A notable exception regarding weathering of fishing equipment is the use of so called dolly ropes which are
attached to the bottom of trawls to protect them from abrasion from the sea floor. According to the Dutch research
consortium (DollyRopeFree) 10-25% of the material is lost during the use. It is in common use around the North Sea,
but to no indication of its use by Swedish fisheries has been found. It is assumed that dolly ropes are not causing
emissions from Swedish sources, but may be significant abroad.
Another significant source internationally is polystyrene (EPS) floats are common in marinas and aquaculture, as
they are sturdy and have very good floating abilities. They can be used as buoys or to support floating jetties. Areas
with intensive aquaculture may be severely affected by lost floating polystyrene macrodebris due to poor
management, which has been reported in Chile (Hinojosa and Thiel 2009) and South Korea (Lee et al. 2015). Also,
some species of crustaceans can form dense colonies on expanded polystyrene floats, boring in several centimeters
and severely reduce its functionality and making it easy to break. During the boring, microplastic particles are
formed. Davidson (2012) conducted laboratory studies and calculated the damage done by a colony of 100 000
isopods (an assumption of colony size made in the article) to 490–630 million plastic particles as they create one
burrow each. The extent of use and management of polystyrene floats is therefore important to assess as a
potential source of microplastics. Many different kinds of organisms bore into marine structures, weakening them
and causing damage, especially in wooden structures but also in polystyrene. A few of these are invasive species in
brackish waters (Davidson 2012) but no reports of these species in Swedish waters have been found. Still, there is a
risk of introduction as Baltic conditions may be feasible.
The extent of use and management of polystyrene floats is therefore important to assess as a potential source of
microplastics. What considerably lowers the risk of emissions from polystyrene floats in Sweden is the fact that
these are not as common in Sweden as in other countries. Aquaculture is not very common in Sweden, only 174
farms existed in 2014 with the majority located in freshwater lakes and some in ponds (Funcke 2015). Buoys and
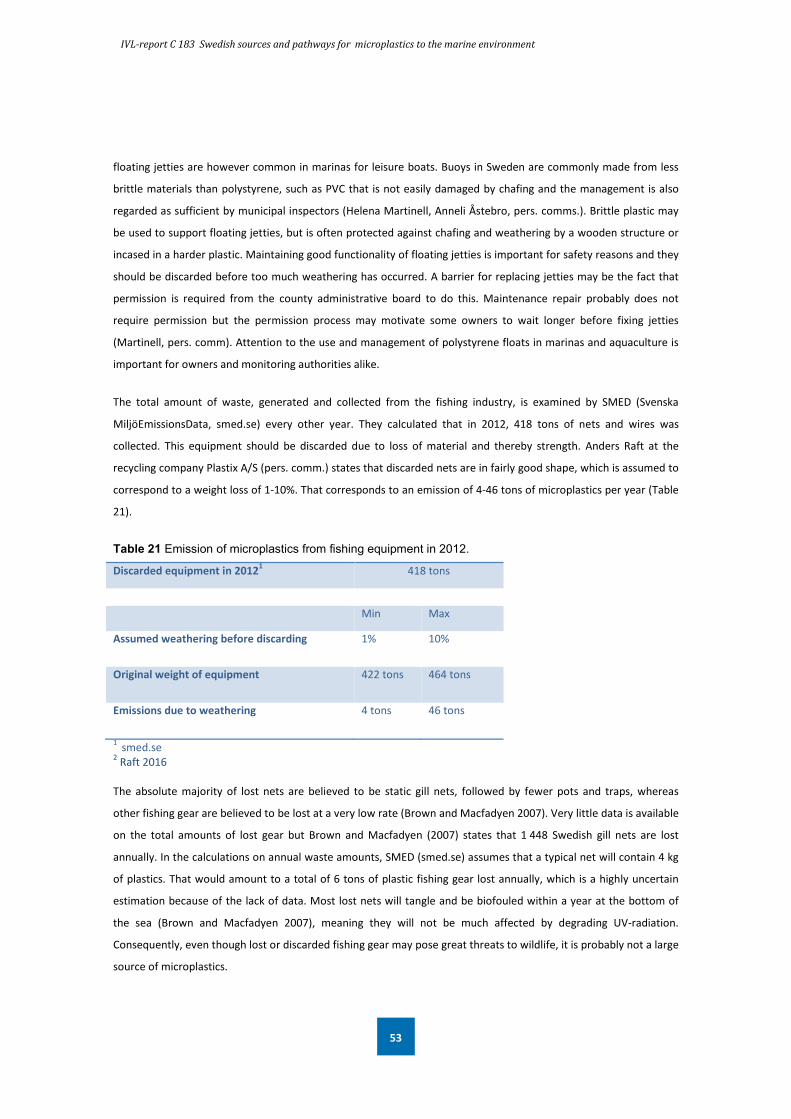
IVL-report C 183 Swedish sources and pathways for microplastics to the marine environment
53
floating jetties are however common in marinas for leisure boats. Buoys in Sweden are commonly made from less
brittle materials than polystyrene, such as PVC that is not easily damaged by chafing and the management is also
regarded as sufficient by municipal inspectors (Helena Martinell, Anneli Åstebro, pers. comms.). Brittle plastic may
be used to support floating jetties, but is often protected against chafing and weathering by a wooden structure or
incased in a harder plastic. Maintaining good functionality of floating jetties is important for safety reasons and they
should be discarded before too much weathering has occurred. A barrier for replacing jetties may be the fact that
permission is required from the county administrative board to do this. Maintenance repair probably does not
require permission but the permission process may motivate some owners to wait longer before fixing jetties
(Martinell, pers. comm). Attention to the use and management of polystyrene floats in marinas and aquaculture is
important for owners and monitoring authorities alike.
The total amount of waste, generated and collected from the fishing industry, is examined by SMED (Svenska
MiljöEmissionsData, smed.se) every other year. They calculated that in 2012, 418 tons of nets and wires was
collected. This equipment should be discarded due to loss of material and thereby strength. Anders Raft at the
recycling company Plastix A/S (pers. comm.) states that discarded nets are in fairly good shape, which is assumed to
correspond to a weight loss of 1-10%. That corresponds to an emission of 4-46 tons of microplastics per year (Table
21).
Table 21 Emission of microplastics from fishing equipment in 2012.
Discarded equipment in 20121 418 tons
Min Max
Assumed weathering before discarding 1% 10%
Original weight of equipment 422 tons 464 tons
Emissions due to weathering 4 tons 46 tons
1 smed.se 2 Raft 2016 The absolute majority of lost nets are believed to be static gill nets, followed by fewer pots and traps, whereas
other fishing gear are believed to be lost at a very low rate (Brown and Macfadyen 2007). Very little data is available
on the total amounts of lost gear but Brown and Macfadyen (2007) states that 1 448 Swedish gill nets are lost
annually. In the calculations on annual waste amounts, SMED (smed.se) assumes that a typical net will contain 4 kg
of plastics. That would amount to a total of 6 tons of plastic fishing gear lost annually, which is a highly uncertain
estimation because of the lack of data. Most lost nets will tangle and be biofouled within a year at the bottom of
the sea (Brown and Macfadyen 2007), meaning they will not be much affected by degrading UV-radiation.
Consequently, even though lost or discarded fishing gear may pose great threats to wildlife, it is probably not a large
source of microplastics.

IVL-report C 183 Swedish sources and pathways for microplastics to the marine environment
54
Buoys and floats are common in fishing and are included in calculations on discarded equipment above. They are
also used in aquaculture, when farming for example mussels. Swedish aquaculture is however a small sector and
the use of buoys and floats is most likely negligible compared to the use in marinas. Statistics on the amount and
type of floats used in Sweden is not available. Calculating the emissions of microplastics due to weathering and
chafing is possible, but several assumptions are needed. In 2010 there were 881 000 leisure boats (Sweboat 2015)
in Sweden and in 2014 there were 1 354 fishing boats (Ericson 2015). Many will use buoys and floating jetties for
mooring. It is difficult to assess the typical weight of the buoys but a guess would be 1-10 kg of floats of one kind or
the other per boat. This implies the total amount “installed” plastic used for these purposes to be 882-8 824 tons. It
is very difficult to assess the amount of material lost during the lifetime of the products but Swedish marinas will
typically not use floats made of EPS or other brittle material. The condition of floats in marinas is usually not
assessed by authorities (Martinell, Åstebro, pers. comms.). If the lifetime of buoys and floating elements is assumed
to be 10-20 years and weathered material when discarded is assumed to be 5-20% the total amount of weathered
material is in the range of 2-176 tons annually (Table 22).
Table 22 Emission of microplastics from floats in Swedish waters due to weathering.
Number of leisure boats 20101 881 000
Number of fishing boats2 1 354
Min Max
Floats per boat 1 kg 10 kg
Total plastic 882 tons 8 824 tons
Weathering when discarded 5% 20%
Lifetime 20 years 10 years
Weathering per year 2 tons per year 176 tons per year 1 Sweboat 2015 2 Ericson 2015 Most aquaculture in Sweden is located in freshwater. This means that the small amounts of microplastics that are
created from aquaculture equipment must be transported by streams to reach the sea or they may also be trapped
in lake sediments. Professional fishing and leisure boating are mostly done in the sea, creating direct emissions.
Knowledge gaps
Plastic debris and plastic products such as floats and fishing gear will in time degrade into microplastics when
submerged or laying by the waterside. Little is however known about the rate and to what extent this affects the
products, before they are properly discarded. An inventory of amount and the state of plastic equipment used in
the sea would be valuable for assessing the significance of this source. Development of emission factors would also
be helpful.

IVL-report C 183 Swedish sources and pathways for microplastics to the marine environment
55
Little data is available on the total amounts of fishing gear that is lost every year, but perhaps more importantly no
data have been found regarding loss of other products from fishing vessels such as EPS boxes. What is known
however is that this “other waste” may correspond to 13% of macroplastic in the North Sea (Arcadis 2014).
Regarding buoys, floating jetties and other floating devices no data is available of how much is currently in use or
how much that is annually lost as microplastic. Studies on how the types of floats used in Sweden are degraded
during normal use have not been conducted, but are necessary for concluding weather or not this is a significant
source of microplastics.
4.6.3 Microplastics from activities onboard ships
Garbage, wash water (water used for cleaning of deck and external surfaces) and wastewater discharged from ships
are possible sources for microplastics to the sea. The release of the different waste categories is regulated by
International Maritime organization (IMO) under the International Convention for the Prevention of Pollution from
Ships, 1973 as modified by the Protocol of 1978 (MARPOL 73/78). Disposal of plastics into the sea is prohibited
everywhere (MARPOL 73/78, Annex V). Grinded food waste may be discharged outside 3 nautical miles from the
coast in non-special areas and outside 12 nautical miles in “special areas” i.e. areas considered to be particularly
sensitive. The Baltic Sea, also including Kattegat, is considered as a “special area”. Wash water may be discharged
anywhere as long as it does not contain anything that could be harmful to the environment. As for the wastewater
there are at date no restrictions on the discharge of grey water (wastewater from e.g. showers, sinks and washing
machines). However, IMO has decided that discharge of untreated wastewater to the sea in the Baltic Sea should be
banned and that wastewater either should be treated on board or be discharged at port. The ban is put in place by
2016 for new ships and 2018 for existing ones and when sufficient port reception facilities are available. A special
working group will develop criteria for "adequate port reception facilities".
There are to our knowledge no analyses done on the microplastic content in garbage, wash water or wastewater or
on the volumes of these discharges from ships to Swedish coastal waters. The microplastic content in grey water
would derive from personal care products, washing of laundry etc., and should be correlated to the number of
persons on board the ship. Since the number of cruising ships in the Baltic Sea has increased dramatically over the
past years (Anderberg 2014), and many of these still release their untreated wastewater directly to the sea this
cannot be excluded as an important source of microplastics to the sea.
Knowledge gaps
The only discharge from ships that still is legal and that may involve a release of microplastics to the sea is the
discharge of untreated wastewater. There is however, no data on the microplastic content in the wastewater or on
the volumes of untreated wastewater that is discharged into Swedish waters.
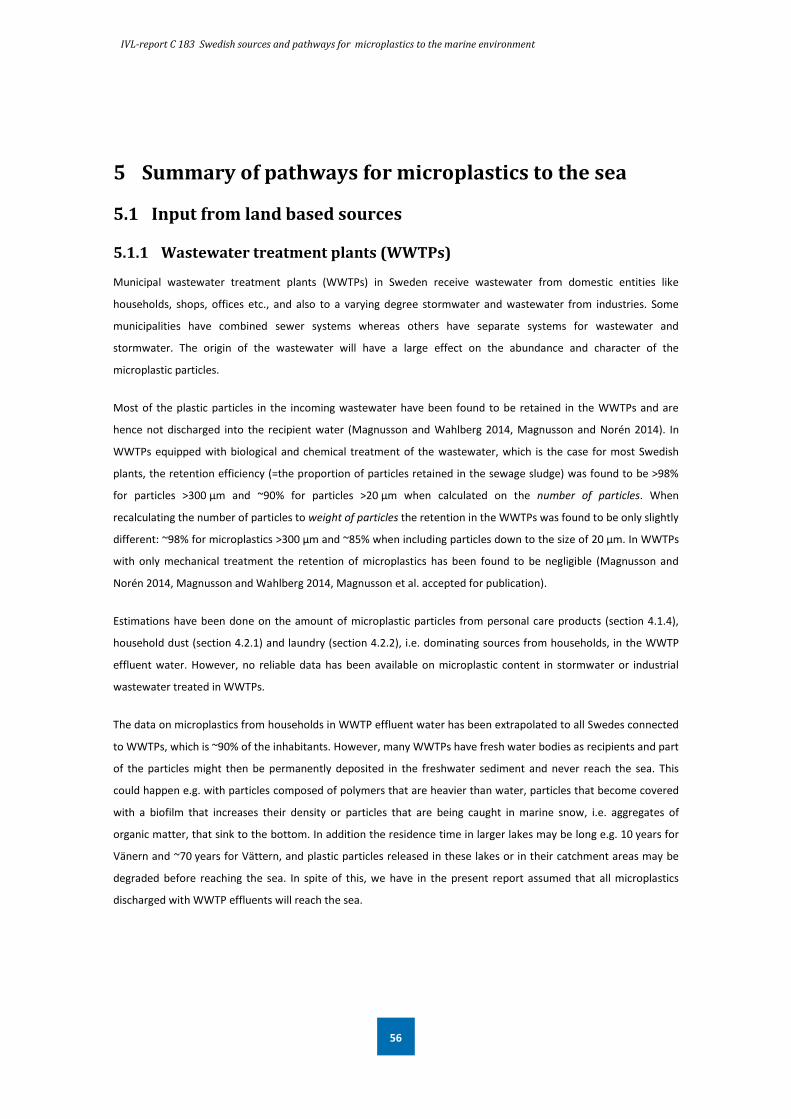
IVL-report C 183 Swedish sources and pathways for microplastics to the marine environment
56
5 Summary of pathways for microplastics to the sea
5.1 Input from land based sources
5.1.1 Wastewater treatment plants (WWTPs)
Municipal wastewater treatment plants (WWTPs) in Sweden receive wastewater from domestic entities like
households, shops, offices etc., and also to a varying degree stormwater and wastewater from industries. Some
municipalities have combined sewer systems whereas others have separate systems for wastewater and
stormwater. The origin of the wastewater will have a large effect on the abundance and character of the
microplastic particles.
Most of the plastic particles in the incoming wastewater have been found to be retained in the WWTPs and are
hence not discharged into the recipient water (Magnusson and Wahlberg 2014, Magnusson and Norén 2014). In
WWTPs equipped with biological and chemical treatment of the wastewater, which is the case for most Swedish
plants, the retention efficiency (=the proportion of particles retained in the sewage sludge) was found to be >98%
for particles >300 µm and ~90% for particles >20 µm when calculated on the number of particles. When
recalculating the number of particles to weight of particles the retention in the WWTPs was found to be only slightly
different: ~98% for microplastics >300 µm and ~85% when including particles down to the size of 20 µm. In WWTPs
with only mechanical treatment the retention of microplastics has been found to be negligible (Magnusson and
Norén 2014, Magnusson and Wahlberg 2014, Magnusson et al. accepted for publication).
Estimations have been done on the amount of microplastic particles from personal care products (section 4.1.4),
household dust (section 4.2.1) and laundry (section 4.2.2), i.e. dominating sources from households, in the WWTP
effluent water. However, no reliable data has been available on microplastic content in stormwater or industrial
wastewater treated in WWTPs.
The data on microplastics from households in WWTP effluent water has been extrapolated to all Swedes connected
to WWTPs, which is ~90% of the inhabitants. However, many WWTPs have fresh water bodies as recipients and part
of the particles might then be permanently deposited in the freshwater sediment and never reach the sea. This
could happen e.g. with particles composed of polymers that are heavier than water, particles that become covered
with a biofilm that increases their density or particles that are being caught in marine snow, i.e. aggregates of
organic matter, that sink to the bottom. In addition the residence time in larger lakes may be long e.g. 10 years for
Vänern and ~70 years for Vättern, and plastic particles released in these lakes or in their catchment areas may be
degraded before reaching the sea. In spite of this, we have in the present report assumed that all microplastics
discharged with WWTP effluents will reach the sea.

IVL-report C 183 Swedish sources and pathways for microplastics to the marine environment
57
Microplastics from households
In section 4.1.4 the mass of microplastics from liquid soaps (the by far largest of the rinse-off personal care
products) expected to end up in the wastewater was estimated to 66 tons in 2012. The figures were based on data
from Cosmetics Europe and Euromonitor (Gouin et al. 2015). With 90% of the Swedish population connected to
municipal WWTPs it would mean that ~59 tons of microplastics reached the WWTPs in 2012 from this source.
According to the Cosmetics Europe survey the majority of the microplastic particles in liquid soap are >450 µm, so a
retention efficiency of 98% could be used when calculating the mass of microplastics that could be expected to be
discharged with wastewater effluents. A 98% retention of 59 tons of microplastic means that a total of ~1.2 tons
would have been discharged to the recipient waters of Swedish municipal WWTPs in 2012 (Table 24). We have then
assumed that all microplastics in the products were rinsed off to the wastewater.
Although it seems like a major portion of plastic pellets in rinse-off products are around 450 µm, which is the
particle size used in the example in Table 6, other products may contain smaller sized particles. In a Dutch study
microplastic beads in tooth paste were mainly found to be <10 µm and with a median size between 2 and 5 µm
(Verschoor et al. 2014b). These plastic particles would be much more likely to pass through the WWTP without
being captured in the sludge.
The amount of microplastic particles in wastewater deriving from household dust in Swedish households was
estimated to 1–19 tons per year and the amount from laundry to 8-945 tons per year (sections 4.2.1 and 4.2.2).
Adjusting the data to the number of people connected to Swedish municipal WWTPs the load would be 0.9-17 tons
per year from household dust and 7.2-851 tons per year from laundry. There is no available data on the particles
size but we have assumed that most of them are ≥300 µm and that the retention in the WWTPs therefore would be
98%. The mass of microplastics from household dust in effluents from municipal WWTPs would hence amount to
0.02-0.34 tons per year for the entire Swedish population. The amount of microplastics from laundry (mainly plastic
fibres) transferred via Swedish WWTPs is estimated to 0.1-17 tons per year (Table 24).
The figures presented in Table 24 are also based on the assumption that all wastewater is passed through piping
systems and WWTPs with sufficient hydraulic capacity and well-functioning chemical and biological treatment. This
is however not always the case. During episodes of overflow, untreated or moderately treated wastewater is passed
on to recipient waters, which may occur for example in connection with heavy rain falls, the discharge of
microplastic will then temporarily be higher. In year 2006 the overflow of untreated wastewater in Sweden was
estimated to be 0.6% of the total wastewater volume in the piping system and 1.53% of the total wastewater
volume at the WWTPs (Länsstyrelsen Gävleborg 2009). If we assume that overflow in piping systems means no
reduction of microplastics and overflow at WWTPs 50% reduction, since the wastewater at WWTPs normally
undergo at least primary treatment even during overflow, the amount of microplastics in the overflow water can be
estimated. Given that the microplastics content in influent wastewater is ~67-927 tons per year ~1.1-14.8 tons per
year would be discharged to water recipients through overflow. This is in the same range as what is discharged with
the treated wastewater and demonstrates the importance of having wastewater systems dimensioned for taking

IVL-report C 183 Swedish sources and pathways for microplastics to the marine environment
58
care of all wastewater, also during episodes of high water discharge. With the global warming the precipitation in
Scandinavia is expected to increase and the impact of stormwater could thus be expected to increase if proper
management strategies are not implemented. The most efficient way to avoid overflow of wastewater is to manage
stormwater separately in duplicate systems and make sure the sewer systems are well maintained (tight) and that
drainage- and roof water are connected to stormwater systems.
About 10% of the Swedish population is not connected to municipal wastewater treatment systems, but to small-
scale on-site treatment facilities normally consisting of a septic tank (mechanical treatment) with or without further
treatment (Olshammar et al. 2015a). For the 26% of these having only septic tanks the reduction of microplastics is
considered to be moderate, while soil infiltration system are assumed to be efficient in reducing microplastics based
on the studies on large WWTPs presented previously and on their efficiency in reducing load of suspended solids in
general (Olshammar et al. 2015a).
The large proportion of microplastics, that were not discharged to the recipient water, 65.7-909 tons per year in all
Sweden in the example from 2012 (Table 23), would be retained in the sewage sludge. This sludge is frequently
used as fertilizer on agricultural farmland (see further section 5.1.2).
Table 23 The amount of microplastics (MP) from household related sources assumed to reach Swedish municipal wastewater treatment plants (WWTPs) and their recipient waters. Figures are based on data from the literature and it was assumed that 98% of the particles in the influent water were retained in the sewage sludge.
Source MP inflow, all WWTPs
(tons per year)
MP outflow, all WWTPs
(tons per year)
MPs in untreated wastewater from
overflow (1.6% per year) (tons per year)
Personal care products (PCPs)
59 1.2
Household dust 0.9-17
0.02-0.34
Laundry 7.2-851
0.14-17
Total amount of MPs from PCPs, household dust and laundry
~67-927
1.4–18.5
1.1 – 14.8
based on influent water to all WWTPs
Empirical data on microplastics in effluents from Swedish WWTPs
The calculated data on household microplastics in WWTP effluents was compared to empirical data on microplastics
in effluent water from three Swedish WWTP effluents (Magnusson and Wahlberg 2014). In this study data on

IVL-report C 183 Swedish sources and pathways for microplastics to the marine environment
59
microplastics was given as the number of particles per unit time leaving the WWTPs with effluent water. However,
since the size of all particles was determined during the analyses, and by assuming a density of 1, the number of
particles could be converted to an approximate weight of particles (Magnusson, K, unpublished data). When doing
this conversion and relating the emission to the number of people connected to each of the investigated WWTPs it
was found that effluent wastewater from Swedish municipal WWTPs released ~4.1 g microplastics per person and
year (Table 25). With a Swedish population of 9.8 million people and ~90% being connected to municipal WWTPs
~36 tons of microplastics per year would have been discharged via WWTP effluents to the recipient waters.
Table 24 Empirical data on the amount of microplastics (MPs) in effluent water from Swedish wastewater treatment plants (WWTPs) (Magnusson and Wahlberg 2014). Data is based on extrapolation of average values from three WWTPs.
Source MP outflow per capita (g per year)
MP outflow, all Swedish WWTPs (tons per year)
Swedish WWTPs (average from three plants)
4.1 36
The empirically based data on microplastics in effluent wastewater, 36 tons, was somewhat higher than the highest
figure estimated for the contribution from households (personal care products, household dust and laundry),
18 tons per year, but it should be remembered that there was a considerable uncertainty in the calculation of the
household figures. However, if the lower amount (0.2 tons per year) would be closest to the truth the amount of
particles deriving from other sources would be large.
Knowledge gaps
The only available data on microplastics in effluent water from municipal WWTPs is the contribution from
households and other entities producing grey and black water (shops, offices, sports centres etc.). The data on
microplastics from personal care products must be considered fairly reliable whereas data on the contribution from
house dust and laundry is less so. In spite of the large uncertainties there are indications that in particular washing
of laundry can contribute quite substantially to microplastics in wastewater and therefore deserves some more in
depth studies. House dust seems to be a less important source but also here further research is desirable. In this
study we have due to missing data not considered wastewater load of microplastics from households not connected
to a wastewater treatment plant but to an onsite wastewater treatment system, which in Sweden account for about
10% of all households.
5.1.2 Spreading of sewage sludge
In 2014 35 000 tons of sewage sludge (dry weight) was spread on farmland according to the Swedish sludge
certification system (Revaq 2014). No studies have been made to estimate the abundance of microplastics in soil
fertilized with sewage sludge but their presence has been verified in a few studies (Habib et al. 1998, Zubris and
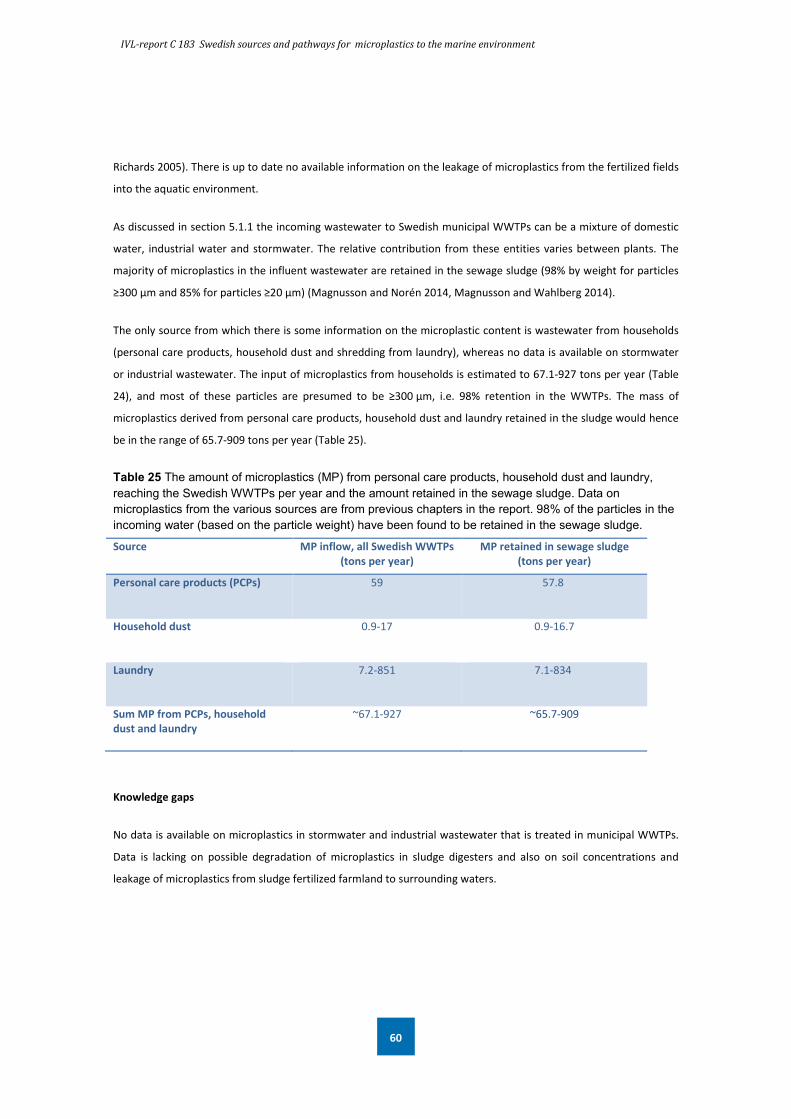
IVL-report C 183 Swedish sources and pathways for microplastics to the marine environment
60
Richards 2005). There is up to date no available information on the leakage of microplastics from the fertilized fields
into the aquatic environment.
As discussed in section 5.1.1 the incoming wastewater to Swedish municipal WWTPs can be a mixture of domestic
water, industrial water and stormwater. The relative contribution from these entities varies between plants. The
majority of microplastics in the influent wastewater are retained in the sewage sludge (98% by weight for particles
≥300 µm and 85% for particles ≥20 µm) (Magnusson and Norén 2014, Magnusson and Wahlberg 2014).
The only source from which there is some information on the microplastic content is wastewater from households
(personal care products, household dust and shredding from laundry), whereas no data is available on stormwater
or industrial wastewater. The input of microplastics from households is estimated to 67.1-927 tons per year (Table
24), and most of these particles are presumed to be ≥300 µm, i.e. 98% retention in the WWTPs. The mass of
microplastics derived from personal care products, household dust and laundry retained in the sludge would hence
be in the range of 65.7-909 tons per year (Table 25).
Table 25 The amount of microplastics (MP) from personal care products, household dust and laundry, reaching the Swedish WWTPs per year and the amount retained in the sewage sludge. Data on microplastics from the various sources are from previous chapters in the report. 98% of the particles in the incoming water (based on the particle weight) have been found to be retained in the sewage sludge.
Source MP inflow, all Swedish WWTPs (tons per year)
MP retained in sewage sludge (tons per year)
Personal care products (PCPs) 59 57.8
Household dust
0.9-17
0.9-16.7
Laundry
7.2-851 7.1-834
Sum MP from PCPs, household dust and laundry
~67.1-927 ~65.7-909
Knowledge gaps
No data is available on microplastics in stormwater and industrial wastewater that is treated in municipal WWTPs.
Data is lacking on possible degradation of microplastics in sludge digesters and also on soil concentrations and
leakage of microplastics from sludge fertilized farmland to surrounding waters.

IVL-report C 183 Swedish sources and pathways for microplastics to the marine environment
61
5.1.3 Stormwater runoff
Stormwater develops as precipitation such as rain or melting snow run off from paved surfaces. As paved surfaces
prevent water from infiltrating into the ground it is to large extent the amount of paved surfaces that regulate the
volume and quality of stormwater that is developed within a specific area.
Traditionally the main focus in stormwater management has been to prevent urban areas from flooding, but over
the past decades there has also been an increased awareness that stormwater is a pathway for pollutants, also
including anthropogenic particles, to the recipient waters. All outdoor activities that generate plastic debris are
potential sources to microplastics present in stormwater, e.g. construction and maintenance work, traffic (particles
from road surface and tyres) and littering. A substantial amount probably derives from large plastic debris that has
been crushed by traffic or pedestrians. Also larger plastic items being discharged to the water recipient may later be
degraded to microplastics in the aquatic environment.
Stormwater is either drained into the sewage system and treated in WWTPs as described in section 5.1.1
(“combined system”), or transported separately to the recipient with or without stormwater treatment. In Sweden
today combined systems make up only about 12% of the existing sewer systems (Olshammar and Baresel 2012)
meaning that most of the stormwater is not treated in WWTPs.
Extreme rains not only increase the volumes of stormwater, they also increase the forces by which microlitter
particles are washed off the paved surfaces, both factors leading to more microplastics being transported with the
stormwater to the water recipients.
The retention of suspended solids (SS) is about 80% in wet ponds, the most common stormwater treatment in
Sweden (Larm 2016). The size distribution of microplastics from roads in stormwater is not known and their ability
to settle depends on a range of factors in addition to particle grain size, notably particle density and shape, and
stormwater flow characteristics such as flow rate and turbulence. We cannot say how effective stormwater
treatment facilities are in retaining microplastics. According to a questionnaire sent to Swedish municipalities still
only 8% of the urban stormwater volume is treated, of which 4% in WWTP and 4% in stormwater treatment
facilities, meaning that most of the microplastics in stormwater will reach the local recipient (Olshammar et al.
2015b). Settable particles are likely to stay there, while parts of the suspended microplastics will sooner or later
reach the sea.
Calculations of quantities of microplastics discharge from stormwater
There is to our knowledge no available data on the microplastic abundance in stormwater, so it is not possible to
calculate the amount of microplastics in stormwater based on the gross load from different sources. Still, a top
down estimation was made, based on the average total volume of urban stormwater generated annually in Sweden,
and that is estimated to ~1·109 m3 per year from 5 084 km2 urban land (Olshammar et al. 2015b). In a recent study
IVL-report C 183 Swedish sources and pathways for microplastics to the marine environment
62
by (Norén et al. 2016) the concentration of microplastics ≥300 µm in the surface water in Malmö industrial harbour
was found to be ~70 particles per m3. We made an assumption that most of these plastics particles derived from
stormwater being discharged into the harbour water. Doing a rough approximation the microplastic concentration
in stormwater was estimated to have the same concentration of microplastics as the harbour basin surface water,
i.e. also ~70 particles per m3. This was then used as an average concentration for stormwater from urbanized areas
in all Sweden. There are of course numerous objections to this calculation e.g. no account has been taken to neither
the dilution of the stormwater in the recipient nor the fact that there always is a certain microplastics concentration
in the basin when a new flush of stormwater is discharged. Also the stormwater in a large industrial harbour area
can be assumed to contain a higher concentration of microplastics than stormwater from most other urbanized
areas. Still, this procedure was considered acceptable in order to obtain a figure on microplastic abundance to
relate to. So, given this assumption the total load of microplastics from stormwater was estimated to ~70·109
microplastic particles per year in all Sweden (Table 26).
Table 26 The amounts of microplastics (MP) in stormwater in Sweden. Data is based on particles ≥300 µm. NOTE: Most data is based on limited information and should be interpreted with care.
Total volume of stormwater generated in Sweden 1·109 m3 per year
Concentration of microplastics in the surface water in Malmö
industrial harbour ~ concentration of microplastics in stormwater
70 particles per m3
Total release of microplastics via stormwater ~70·109 particles per year
Weight of microplastics discharged with stormwater (assuming
average diameter 600 µm and density of 1 kg per dm3)
~8 tons per year
Knowledge gaps
In order to estimate the amounts of microplastic particles reaching the sea through stormwater from different
sources more information is needed about the particle composition and the concentration in stormwater from
different urban land use classes. The ongoing VINNOVA-project Green Nano will study this, but more research is
needed to get better statistics to support decision-making.
5.1.4 Snow disposal
Snow melting on land will become a part of the stormwater which may or may not be subjected to treatment to
reduce particulate matter before being discharged into a recipient. However, snow that is scraped off the ground
and dumped directly into the water recipient will be an even more efficient pathway for microparticles from the

IVL-report C 183 Swedish sources and pathways for microplastics to the marine environment
63
urban areas to the aquatic ecosystems. In Sweden dumping of polluted snow into lakes or the sea is forbidden by
law but permissions can be given by the County Administrative Boards.
Due to limited storage capacity several Swedish cities have permission to dump snow directly into waters.
Stockholm alone has permission to dump 800 000 m3 of snow per year (2012) meaning that all pollutants in the
snow are also reaching the water recipient (SvD 2012).
Knowledge gaps
There is to our knowledge no available information on the quantities of plastic debris/microplastics that reaches the
sea via dumping of snow. To assess whether this is an important transfer way for microplastics to the sea, data is
needed on both microplastics concentrations in snow and how much snow that is being dumped.
5.1.5 Atmospheric deposition
Atmospheric deposition as a pathway for microplastics is almost totally neglected in the scientific literature. Still it is
a well-known fact by everybody working with analyses of microplastics in environmental samples that
contamination of air-borne microplastic particles can be a great problem. The particles may derive from numerous
human activities.
The fractions of particles that can be airborne are between some nanometers to about 100 µm (Thorpe and
Harrison 2008). The atmospheric deposition of anthropogenic particles on one urban and one suburban site in Paris
was estimated to be between 29 and 280 particles per m2 and day (Dris et al. in press). More than 90% of the plastic
particles were fibers. Presuming that the fibres were 30 µm in diameter, 3 mm long and had a density of 1, the
weight would be ~2.1 µg per fiber. The microplastic deposition in the Paris samples would then be ~60-600 µg
per m2 and day. If it rained these particles could be caught in the stormwater and deposited in a water recipient.
Airborne microplastics could also be deposited on the surface of the sea, particularly in highly urbanized areas. The
deposition of microplastics from air and the fate of the deposited particles can be assumed to be highly dependent
on the prevailing weather conditions. The importance to the overall contribution of microplastics to the sea has not
been estimated.
Knowledge gaps
No data is to our knowledge available on the importance of air deposition to the total load of microplastics to the
sea. Quantification of microplastics in wet- and dry deposition is suggested to estimate the magnitude of this
pathway.

IVL-report C 183 Swedish sources and pathways for microplastics to the marine environment
64
5.2 Input from sea-based sources
5.2.1 Input directly to the sea
Emissions of microplastics directly into the sea occur through weathering or chafing of submerged plastic or when
these objects are maintained by the seaside. Microplastics may also be released through discharge of wastewater
from ships en route and they may be formed from large plastic debris that is illegally dumped from ships. Modelling
of the fate of particles in oceans predict that particles discharge directly to the sea are more likely to remain in
circulation in the ocean basins than particles derived from terrestrial input (Lebreton et al. 2012).
Floating devices and fishing equipment are degraded during use, as is boat hulls. The main emissions from boat
hulls however are during maintenance by the seaside, at shipyards or marinas. Although control measures are in
place, paint flakes will inevitable be washed or blown to the nearby sea.
During maintenance and painting of boats in shipyards, it is assumed that emissions are about as high to the soil as
to the sea. Emissions to soil are also evident at marinas. Some of these microplastics will inevitably be released into
the water through runoff. It is however not considered in the summary below (Table 28), as the emission sizes to
water are already very uncertain and the pathway from soil to water has not been studied.
The slow degradation of lost or discarded macrolitter from the sources above, such as ghost nets or shipwrecks, will
also release microplastics. It seems however that nets are nowadays seldom lost and that they will be covered by
biofoul and sink rather than degrade in the sunlight. Emissions of microplastics from derelict ships and equipment
are probably negligible although they may pose other environmental risks.
Boat traffic and fishing take place in the country’s lakes and rivers as well as in the sea. Floating jetties and buoys
are common there as well and aquaculture is most common in freshwater. Little is known of the retention time in
different freshwater systems, but it is not certain that all emissions from these activities will end up in the sea. Nor
is it known where the emissions from the listed sources above are distributed but a considerable amount of the
activities are performed in freshwater. In order not to make the results of this study too unclear, emissions to the
sea and to the freshwater systems are simply combined.
Since dumping of plastic garbage to the sea is illegal (MARPOL 73/78, Annex V) the only sources to plastic and
microplastic to the sea should be wastewater and wash water (the water from cleaning of external surfaces and
deck) (see section 4.6.3). Microplastics in wastewater discharged from ships probably derive from the same sources
as wastewater from households, e.g. personal care products, cleaning agents and synthetic fibres from washing of
laundry. This means that there should be a tight correlation between the number of people on board a ship and the
load of microplastics in the wastewater. IMO restrictions of discharge of untreated wastewater in Swedish coastal
waters should be implemented in a soon future, but still large volumes of untreated water enters the sea from all
categories of vessels. As the situation is today it could be expected that ships with many passengers, like ferries and

IVL-report C 183 Swedish sources and pathways for microplastics to the marine environment
65
cruising ships, contribute with more microplastics to the sea than commercial ships of other categories. However,
data has been too scarce to do quantitative estimations on the released amounts of microplastics.
Table 27 The amount of microplastics from sea-based sources (tons/year). No data was available of microplastics in waste being dumped from ships en route. NOTE: Most data is based on limited information and should be interpreted with care.
Source Inflow from sea-based source
Wear from boat hulls 158-737 tons per year
Other fishing gear 4-46 tons per year
Floating devices 2-176 tons per year
TOTAL amount of microplastics, sea-based sources 164-959 tons per year
There is no available information on the microplastics in wash water from ships so it is not possible to speculate
whether or not this could be a source to marine microplastics.
5.2.2 Transportation by rivers and sea currents
Plastic debris and microplastics do not reach a sea area only through direct discharge. Plastic litter may derive from
all freshwater bodies within its catchment basin and also be brought there by ocean currents from other areas. Data
on microplastics in Swedish fresh water systems is very limited so it is not possible to estimate the importance of
regional input via rivers. In one of the few studies microplastics ≥330 µm were analyzed in the river Göta älv where
it runs through Gothenburg and just before it reaches the sea. Sampling was done in summer on two occasions,
during a long period of dry weather and during a period of rain. The microplastic concentration was found to be
considerably lower during the dry period, 0.9 microplastics per m3, compared to when it rained, 2.9 microplastics
per m3 (Magnusson et al. accepted for publication).

IVL-report C 183 Swedish sources and pathways for microplastics to the marine environment
66
However, microplastics may also derive from rivers far away from the Swedish coasts. The Swedish west coast
continuously receives particulate matter transported with the Jutland Coastal Current from the eastern North Sea.
This northward going current goes from the southern North Sea along the west coast of Denmark and moves east
by Skagen towards the Swedish west coast. During a flooding event in 1995 of the Rhine River huge amounts of
sediment and soil particles were flushed out from the river delta into the German Bight and the particles could be
followed visually from the air on their way to the Swedish coast. In practice it means that all the large rivers that run
into the eastern North Sea may be pathways for microplastics to the Swedish Skagerrak and Kattegat coasts. At
least this goes for those particles made of plastic material with a low density that float on the sea surface or are
suspended in the water column. A global oceanic hydrodynamic model was constructed where virtual
microparticles were introduced in the flow field of known sea surface currents (Lebreton et al. 2012). According to
the model only around 2% of the litter found in the North Sea derive from external sea areas, and the remaining
98% comes from the North Sea area itself. So the litter found on the Swedish west coast is assumed to derive
almost exclusively from the North Sea region. For the Baltic Sea it is estimated that no litter derives from other sea
areas.
There are some studies on microplastics in rivers running into the eastern North Sea. Samples of surface water of
the River Rhine were taken at 11 locations over a stretch of 820 km, and the average concentration was found to be
~890 000 microplastics ≥300 µm per km2, with concentration peaks of 3.9 million microplastics per km2 (Mani et al.
2015). This was estimated to correspond to an average of 17 microplastics ≥300 µm per m3. The authors used the
data to make a rough estimate of the load of microplastics from the River Rhine to the North Sea and found it to be
around 190 million microplastics ≥300 µm per day. Assuming that the average microplastic is a spherical particle
with a diameter of 1,000 µm and a density of 1, the average weight would be 0.5 mg/particle. The Rhine would
hence discharge ~100 kg of microplastics per day or 36 tons per year to the North Sea.
It was however pointed out that this is probably an underestimation of the true contribution since the calculation
only included microplastics in the surface water of the river. Some microplastic data is available also from the Seine
in France, which ends in the Channel. Concentrations in the surface water where the river runs through Paris was
estimated to be 0.3-0.5 microplastics ≥330 µm per m3, and 3 -108 microplastics ≥80 µm per m3 (Dris et al. 2015).
Knowledge gaps
No data is available on the contribution of microplastics from Swedish rivers to the sea or on the amount of
microplastics being transported from other sea areas to Swedish coastal waters.
IVL-report C 183 Swedish sources and pathways for microplastics to the marine environment
67
6 Occurrence of microplastics in the Swedish marine environment
6.1 Microplastics in the marine environment
The distribution of microplastics in the marine environment is dependent on factors like the density of the particles,
location of sources and transportation with waves and sea currents and biological processes (Kukulka et al. 2012).
Our knowledge on the actual concentrations in the sea, in Swedish coastal waters and elsewhere, is still limited, and
this goes for the rest of the world as well. There is a large gap between the amounts of microplastics that through
calculations could be expected to be found in the sea and the amounts actually detected when doing extrapolations
from available field data (Cózar et al. 2014, Eriksen et al. 2014). So, to be able to use field data for making more
general conclusions about the total amount of microplastics in the sea the most important accumulation sites for
plastic particles in the marine environment have to be identified. A parallel could be drawn to estimations of
persistent organic pollutants (POPs) in the sea. POPs have a large affinity for organic surfaces and it is a well-
established fact that to get an overview of marine environmental concentrations analyses should be done on
sediment from accumulation bottoms. These are areas where fine organic particles settle on a permanent bases,
and hence also the locations with the highest concentrations of POP. However, our knowledge on microplastic
distribution in the marine environment is still limited and it is not likely that we will be able to localize a single
location where microplastics of all different kinds of plastic polymers would be expected to accumulate. A crucial
characteristic likely to influence the fate of individual plastic particles in the sea is their density. Particles with a
density lighter than water, e.g. PE (density 0.91-0.99 g per cm3) or PP (density 0.90–0.91 g per cm3), will be likely to
float on the surface, whereas heavier ones, e.g. PVC (density 1.39-1.43 g per cm3), would sink to the bottom. But in
the field the plastics might be covered with a biofilm so that also low density particles sink to the bottom due to the
extra weight. They may also be entangled in aggregates of sinking algae after an algae bloom (Long et al. 2015).
A variety of different methods have been used for sampling of microplastics in the sea. At present there is no
consensus on either how or where microplastics should be sampled and it is therefore difficult to compare results
between studies. When studying microplastics in the water column some kind of net has to be used, and the mesh
size of the net will inevitably affect the size and shape of the collected particles. When investigating microplastics in
sediments it is rather the analytical than the sampling procedure that decides the lower size limit of the analyzed
particles since sediment grab will, unlike sampling with a net, get all size fractions of particles. The amount of
microplastics may be reported as either number or mass of particles per volume of water or weight of sediment.
Both ways may be justified. The mass of microplastics is important as a measurement of the overall presence of
plastic waste on a regional and global scale, whereas the abundance of plastic particles (e.g. number per m3 water
or kg sediment) is of ecological importance when it comes to animal exposure on a local scale. An inter-European
project, BASEMAN, has been initiated by JPI Oceans which will run between 2016 and 2018 and where the aim is to
present standardized methods for sampling and analysing marine microplastics for monitoring purposes.

IVL-report C 183 Swedish sources and pathways for microplastics to the marine environment
68
Microplastic abundance in water and sediment reported from the Swedish coastal waters and also from other parts
of the North Sea and the Baltic Sea are presented in Table 29 and Table 30. Microplastic abundance in field
collected biota is presented in Table 31 and Table 32.
Table 28 Recent data on microplastic concentrations in the water column in the North Sea and the Baltic Sea region. Data is presented as mean values ±SD or (min – max value)
Location Microplastic concentration (number per m3)
Size of microplastic particles
Reference
Swedish west coast: Skagerrack (No fibres included)
2014: 13 000 (1 000– 68 000) 2013: 7 000 (400 – 20 000)
>10 µm
(Norén et al. 2014)
Swedish west coast River Göta älv, Göteborg harbour Gullmarfjord
0.9 (sampling during dry weather) 2.9 (sampling during rain) 0.41
≥330 µm
(Magnusson et al. accepted for publication)
Swedish westcoast (10 µm=microplastics and boat paint; no fibres)
4 400-94 000 0-1.5
≥10 µm ≥300 µm
(Norén et al. 2016)
Swedish coast, by the shore Kattegat The Sound The Baltic
1.08±0.22 4.0 0.56±0.40
≥300 µm
(Magnusson and Norén 2011)
Swedish west coast Industrial harbour of Stenungsund
~102 550 >80 µm (Norén 2007)
The Gulf of Finland Turku harbour Archipelago Off shore
0.73 0.25±0.07 0.48
≥300 µm
(Magnusson 2014a)
Danish coastal waters* North Sea Kattegat The Belt Sea *Plastic fibres not included
0.39±0.19 3.54 1.44
>100 µm
(Mintenig 2014)

IVL-report C 183 Swedish sources and pathways for microplastics to the marine environment
69
River Rhine (opens up into the southern North Sea)
~17 ≥300 µm (Mani et al. 2015)
Western English channel
0.27 ≥500 µm (Cole et al. 2014)
Northeast Atlantic 2.46 250 – 1 000 µm (Lusher et al. 2014)

IVL-report C 183 Swedish sources and pathways for microplastics to the marine environment
70
Table 29 Recent data on microplastic concentrations in sediment in the North Sea and the Baltic Sea.
Location Microplastic concentration (number per kg dry sediment and either min and max values or ±SD)
Size of microplastics
Reference
Swedish west coast River Göta älv, Göteborg harbour Gullmarfjord
810±210 150
≥100 µm
(Magnusson et al. accepted for publication)
Danish coastal waters North Sea & Skagerrak Kattegat Belt Sea Baltic Sea
100 (75 – 268) 120 (60 – 195) 380 (280 – 1 090) 335 (145 – 543)
>38 µm
(Strand et al. 2013)
Belgian coast Harbours Continental shelf Beaches
167±92 97±19 93±37
>38 μm
Claessens et al. 2011
German North Sea coast, Nordeney
1.3 – 2.3 Potential microplastics
>100 µm
(Dekiff et al. 2014)
Belgian beaches High-water mark Low-water mark
17.6±9.4 9.2±5.0
5 – 1 000 µm
(Van Cauwenberghe et al. 2013)
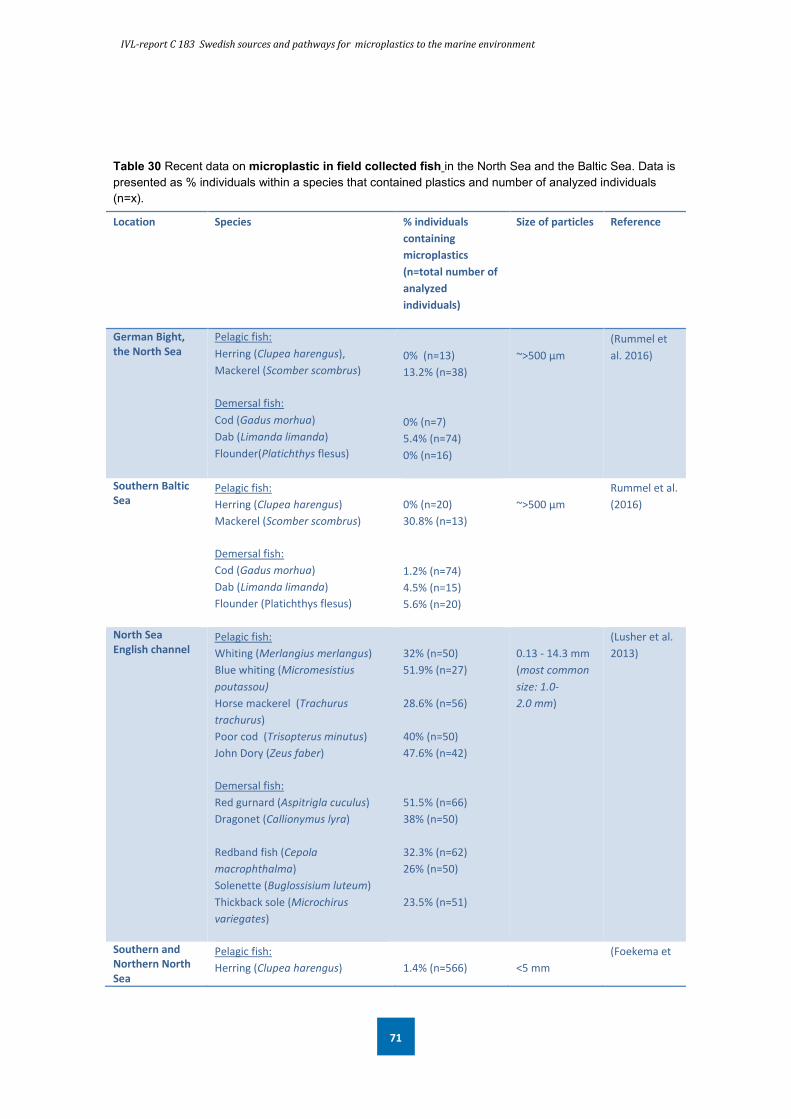
IVL-report C 183 Swedish sources and pathways for microplastics to the marine environment
71
Table 30 Recent data on microplastic in field collected fish in the North Sea and the Baltic Sea. Data is presented as % individuals within a species that contained plastics and number of analyzed individuals (n=x).
Location Species % individuals containing microplastics (n=total number of analyzed individuals)
Size of particles Reference
German Bight, the North Sea
Pelagic fish: Herring (Clupea harengus), Mackerel (Scomber scombrus)
Demersal fish: Cod (Gadus morhua) Dab (Limanda limanda) Flounder(Platichthys flesus)
0% (n=13) 13.2% (n=38) 0% (n=7) 5.4% (n=74) 0% (n=16)
~>500 µm
(Rummel et al. 2016)
Southern Baltic Sea
Pelagic fish: Herring (Clupea harengus) Mackerel (Scomber scombrus)
Demersal fish: Cod (Gadus morhua) Dab (Limanda limanda) Flounder (Platichthys flesus)
0% (n=20) 30.8% (n=13) 1.2% (n=74) 4.5% (n=15) 5.6% (n=20)
~>500 µm
Rummel et al. (2016)
North Sea English channel
Pelagic fish: Whiting (Merlangius merlangus) Blue whiting (Micromesistius poutassou) Horse mackerel (Trachurus trachurus) Poor cod (Trisopterus minutus) John Dory (Zeus faber)
Demersal fish: Red gurnard (Aspitrigla cuculus) Dragonet (Callionymus lyra) Redband fish (Cepola macrophthalma) Solenette (Buglossisium luteum) Thickback sole (Microchirus variegates)
32% (n=50) 51.9% (n=27) 28.6% (n=56) 40% (n=50) 47.6% (n=42)
51.5% (n=66) 38% (n=50) 32.3% (n=62) 26% (n=50) 23.5% (n=51)
0.13 - 14.3 mm (most common size: 1.0-2.0 mm)
(Lusher et al. 2013)
Southern and Northern North Sea
Pelagic fish: Herring (Clupea harengus)
1.4% (n=566)
<5 mm
(Foekema et
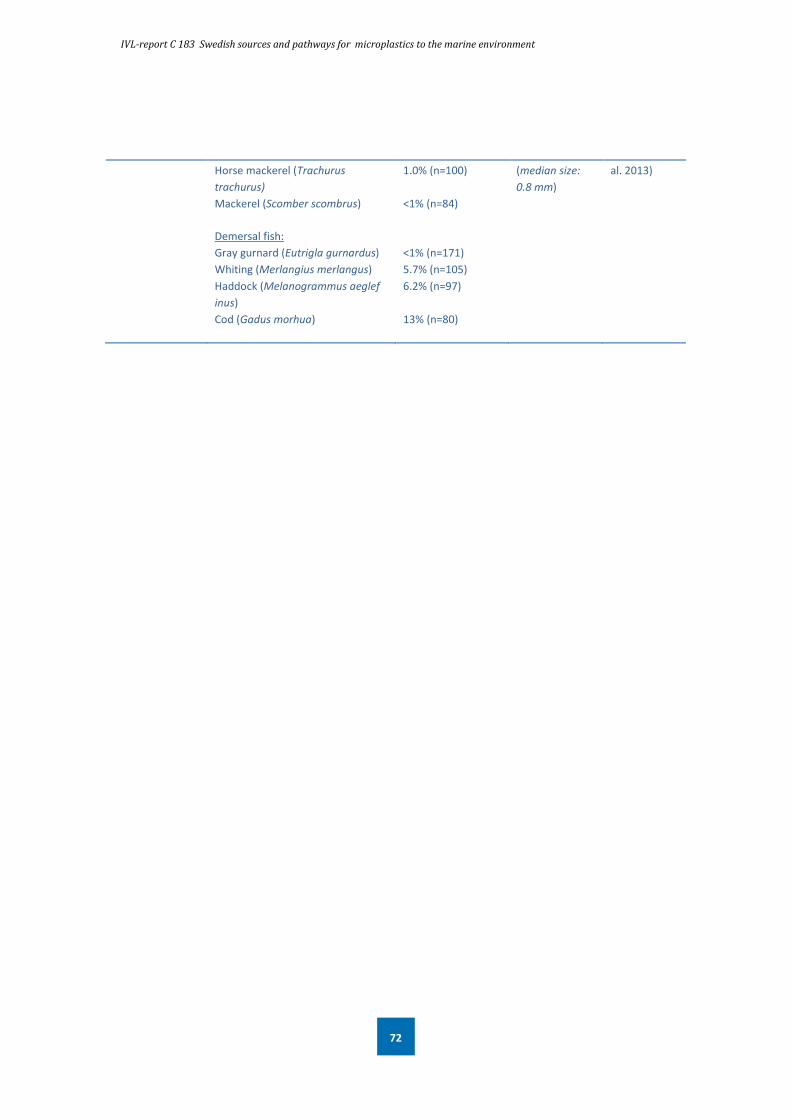
IVL-report C 183 Swedish sources and pathways for microplastics to the marine environment
72
Horse mackerel (Trachurus trachurus) Mackerel (Scomber scombrus)
Demersal fish: Gray gurnard (Eutrigla gurnardus) Whiting (Merlangius merlangus) Haddock (Melanogrammus aeglef inus) Cod (Gadus morhua)
1.0% (n=100) <1% (n=84)
<1% (n=171) 5.7% (n=105) 6.2% (n=97) 13% (n=80)
(median size: 0.8 mm)
al. 2013)

IVL-report C 183 Swedish sources and pathways for microplastics to the marine environment
73
Table 31 Recent data on microplastic in field collected marine biota (not fish) in the North Sea and the Baltic Sea. Data is presented as concentrations of microplastics per g wet weight±SD.
Location Species Concentration of microplastics no per g tissue (wet weight) ±SD
Size of microplastics particles
Reference
Swedish west coast Göta älv, Gothenburg harbour Gullmarfjord
Blue mussel (Mytilus edulis)
0.80±0.20 0.13±0.05
≥100 µm
(Magnusson et al. accepted for publication)
Southern North Sea /the Channel area Netherlands Belgium France the UK
European brown shrimp (Crangon crangon)
0.40±0.56 0.75±0.47 1.21±1.75 1.76±1.64
~10-20 µm
(Devriese et al. 2015)
Southern North Sea
Blue mussel (Mytilus edulis) Lugworm (Arenicola marina)
0.2±0.3 1.2±2.8
≥5 µm (Van Cauwenberghe et al. 2015)
German North Sea coast (from aquaculture)
Blue mussels (Mytilus edulis) Pacific oyster (Crassostrea gigas)
0.36±0.07 0.47±0.16
≥5 µm (Van Cauwenberghe and Janssen 2014)
Southern North Sea
Blue mussel (Mytilus edulis)
0.26-0.51
≥20 µm (De Witte et al. 2014)

IVL-report C 183 Swedish sources and pathways for microplastics to the marine environment
74
6.2 Polymer types represented among microplastics collected in the sea
No systematic characterization has been done on marine microplastics in Scandinavian waters, but analyses indicate
that PE, PP and PUR are the dominating types of plastic polymers in the water column. In a Finnish WWTP recipient
PP, PE, PUR, polyacrylic, polyvinyl alcohol (PVA) and polyester (PES) were the most common polymers (Magnusson
et al. accepted for publication). Mintenig (2014) took samples in surface water along the coastline from the German
North sea coast to the German Baltic coast and found that all the collected plastics ≥500 µm were made of PP, PE or
PUR. The same polymer types where found among microplastics <500 µm, but here also particles of polystyrene
(PS) and PA were detected. Beach sediment from the island Norderney at the German North Sea coast was found to
contain microplastics of PP. PE, PET, PVC, PS and PA (DeKiff et al. 2014).
In a summary of 42 international scientific studies the most common plastic polymers in marine microplastics were
found to be PE, PP, and PS followed by polyamide (PA), PES), acrylic (AC), polyoximethylene (POM), PVA,
polyvinylchloride (PVC), poly methylacrylate (PMA), PET, alkyd (AKD) and PUR (Hildago-Ruz et al. 2012).
7 Sources to marine microplastics in Sweden, general conclusions and knowledge gaps
7.1 Summary of all sources and pathways
A summary of the quantitative data on microplastics emitted from the different sources and transferred to the sea
via the different pathways is presented in Table 33. All data derives from calculations explained in the previous
sections of the report. Values are either presented as one value or as a range where the latter indicates the lowest
and the highest values for microplastic emissions that were obtained from the available data. A wide range hence
means that there has been a large uncertainty in the underlying information. Data is presented in a ranking table
where the sources are listed according to the highest estimated emissions of microplastics. However, for several
sources (littering, plastic recycling facilities, landfills, agricultural activities, abrasive blasting and pharmaceuticals)
no emission data was available. It is of vital importance that this is kept in mind when interpreting the results, in
particular since some of the sources for which data is lacking e.g. littering, could be expected to be of major
importance.
Of the sources from which data was available more microplastics seemed to be emitted from the land-based than
from the sea-based ones. The largest emissions were found to derive from traffic (abrasion of roads and tyres)
followed by artificial turfs. However, it is not necessarily the sources with the largest microplastic emissions that
contribute the most to the microplastic load in the sea. In order to get the full picture data has to be available both
on the quantities that are emitted from a source and the proportion of the emitted particles that actually reach the

IVL-report C 183 Swedish sources and pathways for microplastics to the marine environment
75
sea. Microplastics from both traffic and artificial turfs are likely to be transported to the sea mainly via stormwater,
but since there is no available data on microplastics in stormwater it was not possible to determine to what extent
these two sources contribute to the pool of marine microplastics.
The important difference between microplastic emitted to the environment and microplastic actually reaching the
sea when ranking sources to marine microplastics also becomes clear when comparing e.g. the contributions from
household laundry and emissions from boat hulls. The estimated emissions from these two sources were found to
be in the same range, but the input of particles to the sea is presumed to be considerably larger from boat hulls
since up to 98% of the microplastics in wastewater from washing machines may be retained in the sewage sludge of
the WWTPs. The sludge formed in municipal WWTPs is of course a trap for microplastics from other household
related sources e.g. personal care products and dust. And in those cases where stormwater and industrial
wastewater is treated in WWTPs also these microplastics will be retained.
Table 32 Summary table of all sources of microplastics covered in this report, including pathways to the sea and the estimated amounts reaching the sea. The range presented for some sources and pathways indicates the span between the lowest and the highest emissions that were obtained from the available data. MP=microplastic, WWTP=wastewater treatment plant (data >100 rounded to the nearest ten).
Source MP produced from the source (tons per year)
Pathway to the sea MP reaching the sea (tons per year)
Road wear and abrasion of tyres 8 190 Stormwater and wind transport
No data
Artificial turfs 1 640-2 460 Stormwater and WWTP No data
Wear from boat hulls 160-740 Directly emitted to the water
160-740
Laundry 8-950 WWTP 0.2-19
Industrial production and handling of plastics pellets
310-530 Industrial wastewater to recipient or WWTP, stormwater
No data
Protective and decorative coatings on buildings etc
130-250 Stormwater, some to WWTP
No data
Wear from floating devices 2-180 Directly emitted to the water
2-180
Personal care products 66 WWTP
Effluent water: 1.3 Sewage sludge: no data:
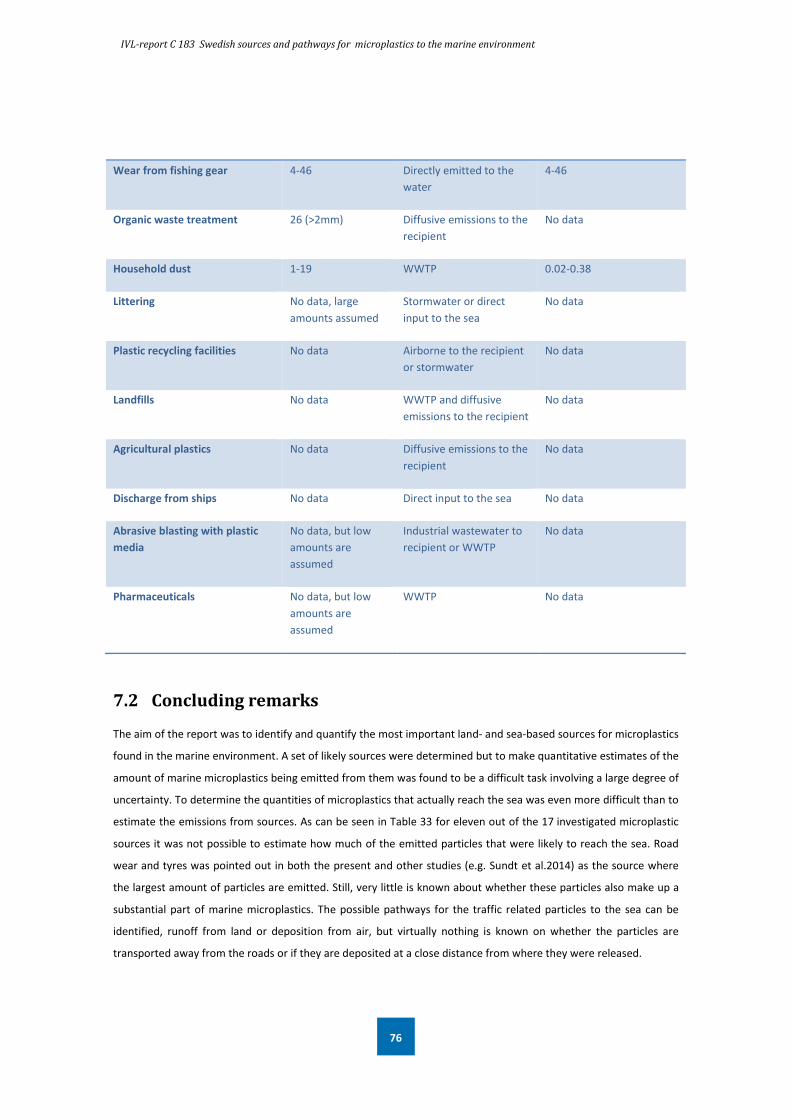
IVL-report C 183 Swedish sources and pathways for microplastics to the marine environment
76
Wear from fishing gear 4-46 Directly emitted to the water
4-46
Organic waste treatment 26 (>2mm) Diffusive emissions to the recipient
No data
Household dust 1-19 WWTP 0.02-0.38
Littering No data, large amounts assumed
Stormwater or direct input to the sea
No data
Plastic recycling facilities No data Airborne to the recipient or stormwater
No data
Landfills No data WWTP and diffusive emissions to the recipient
No data
Agricultural plastics No data Diffusive emissions to the recipient
No data
Discharge from ships No data Direct input to the sea No data
Abrasive blasting with plastic media
No data, but low amounts are assumed
Industrial wastewater to recipient or WWTP
No data
Pharmaceuticals No data, but low amounts are assumed
WWTP No data
7.2 Concluding remarks
The aim of the report was to identify and quantify the most important land- and sea-based sources for microplastics
found in the marine environment. A set of likely sources were determined but to make quantitative estimates of the
amount of marine microplastics being emitted from them was found to be a difficult task involving a large degree of
uncertainty. To determine the quantities of microplastics that actually reach the sea was even more difficult than to
estimate the emissions from sources. As can be seen in Table 33 for eleven out of the 17 investigated microplastic
sources it was not possible to estimate how much of the emitted particles that were likely to reach the sea. Road
wear and tyres was pointed out in both the present and other studies (e.g. Sundt et al.2014) as the source where
the largest amount of particles are emitted. Still, very little is known about whether these particles also make up a
substantial part of marine microplastics. The possible pathways for the traffic related particles to the sea can be
identified, runoff from land or deposition from air, but virtually nothing is known on whether the particles are
transported away from the roads or if they are deposited at a close distance from where they were released.
IVL-report C 183 Swedish sources and pathways for microplastics to the marine environment
77
For a few microplastic sources the estimations of both emissions of particles and the transfer to the sea are fairly
straight forward. An example is microplastics in personal care products. Data on the microplastic content in relevant
products are fairly accessible, and since the plastic particles are found in products that are almost entirely washed
out into the wastewater, most of the particles will be transported to municipal WWTPs. The fate of microplastics in
WWTPs has been investigated in several studies over the past years. The proportion between microplastics that are
retained in the plant and those being released to the recipient is therefore quite well-documented and the
discharge to the recipient can hence be calculated. With the same reasoning it should be fairly easy to get more
certain data on the contribution from synthetic fibres from washing of clothes to marine microplastics since all
synthetic fibres released from the garments during washing could be expected to end up in the wastewater and be
transported to the WWTPs.
It is however important to note that very little is known about the smallest microplastics in the used definition,
particles between 1 and 5 µm. They could be found in personal care products, probably passes the WWTP to a
higher degree, and can be expected to have an ecological impact.
To quantify microplastics originating from fragmentation of large plastic items on land or in the sea is particularly
complicated since it requires data from a range of factors that are very difficult to control, e.g. the input rate of
larger plastic items to the environment, the rate by which these plastic items fragment into microscopic pieces and
estimations of how much of the plastic fragments that will reach the sea. A conservative way of handling this task
could however be to assume that in time all macroplastic items that are left in the environment will fragment into
microscopic plastic particles.
It could be concluded that more reliable data is needed on the emission of microplastic particles from several of the
sources included in this report, in particular from those related to waste handling and littering, and to outdoor
construction and maintenance work on land and at sea. The importance of urban stormwater as a pathway for
microplastic from a range of sources should also receive more attention.

IVL-report C 183 Swedish sources and pathways for microplastics to the marine environment
78
8 References
8.1 Scientific articles and reports
Anderberg, S. (2014). Hamnarna rustas för fartygens avloppsvatten, In: Sjöfarten kring Sverige och dess påverkan på havsmiljön, Eds.T. Johansen Lilja and E.-L. Sundblad, Göteborg: Havsmiljöinstitutet, pp. 10-11. Andrady, A. L. (2011). Microplastics in the marine environment. Marine Pollution Bulletin 62: 1596-1605. Andrady, A. L., S. H. Hamid, X. Hu and A. Torikai (1998). Effects of increased solar ultraviolet radiation on materials. Journal of Photochemistry and Photobiology B: Biology 46: 96-103. Arcadis (2014). Marine Litter study to support the establishment of an initial quantitative headline reduction target - SFRA0025. Arvidsson H. (2015). Bindemedel, http://www.vti.se/sv/forskningsomraden/vag--och-banteknik/bindemedel/. Retrieved 2015-12-16. Asfaltskolan (2016). Hur mycket asfalt tillverkas i Sverige?, http://www.asfaltskolan.se/Allmantomasfalt.htm. Retrieved 2016-01-14. Avfall Sverige (2015). Swedish Waste Management. Avfall Sverige (2016). Kompost. http://www.avfallsverige.se/avfallshantering/biologisk-aatervinning/kompostering/kompost/. Retrieved 2016-01-14. Barnes, D. K., F. Galgani, R. C. Thompson and M. Barlaz (2009). Accumulation and fragmentation of plastic debris in global environments. Philos Trans R Soc Lond B Biol Sci 364(1526): 1985-1998. Baumann, W. and A. Muth (1995). Untersuchung zur Erfassung der Umweltexposition von Chemikalien der Farben- und Lackindustrie, Endbericht zum Forschungsvorhaben 106 04 124. Institut fuer Umweltschutz, Universitaet Dortmund im Auftrag des Umwelt Bundesamts, 7/1995. Becker, L. C., W. F. Bergfeld, D. V. Belsito, R. A. Hill, C. D. Klaassen, D. C. Liebler, J. G. Marks Jr, R. C. Shank, T. J. Slaga, P. W. Snyder and F. A. Anderson (2014). "Safety assessment of modified terephthalate polymers as used inn cosmetics." International Journal of Toxicology 33 (supplement 3): 36S-47S. Bejgarn, S., M. MacLeod, C. Bogdal and M. Breitholtz (2015). Toxicity of leachate from weathering plastics: An exploratory screening study with Nitocra spinipes. Chemosphere 132: 114-119. Bergmann, M., L. Gutow and M. Klages (2015). Marine Anthropogenic Litter, Springer. Bernstad, A., L. Malmquist, J. Truedsson and L. la Cour Jansen (2013). Need for improvements in physical pretreatment of source-separated household food waste. Waste Management 33: 746-754. Blästerprodukter (2016). , from http://www.blasterprodukter.se/. Retrieved 2016-01-24. Brown, J. and G. Macfadyen (2007). Ghost fishing in European waters: Impacts and management responses. Marine Policy 31(4): 488-504.

IVL-report C 183 Swedish sources and pathways for microplastics to the marine environment
79
Browne, M. A., P. Crump, S. J. Niven, E. Teuten, A. Tonkin, T. Galloway and R. Thompson (2011). Accumulation of microplastic on shorelines woldwide: sources and sinks. Environ Sci Technol 45(21): 9175-9179. Buzea, C., I.I. Pacheco and K. Robbie (2007). Nanomaterials and nanoparticles: sources and toxicity. Biointerphases 2: MR17. Carpenter, E. J., S.J. Anderson, G.R. Harvey, H.P. Miklas and B.B Peck (1972). Polystyrene spherules in coastal waters. Science (178): 749-750. Carpenter, E. J. and K. Smith (1972). Plastics on the Sargasso Sea surface. Science 175: 1240-1241. Christensson, B., G. Östlund, E. Alvarez and A.B. Antonsson (2012). Effektiva åtgärder mot damm på byggarbetsplatser, IVL Svenska Miljöinstitutet. CIRFS European Man-made Fiber Association (2016). http://www.cirfs.org/KeyStatistics/WorldManMadeFibresProduction.aspx. Retrieved 2016-01-11. Claessens, M., S. De Meester, L. Van Landuyt, K. De Clerck and C.R. Janssen (2011). Occurrence and distribution of microplastics in marine sediments along the Belgian coast. Marine Pollution Bulletin 62, 2199e2204. Cole, M., P. Lindeque, C. Halsband and T. S. Galloway (2011). Microplastics as contaminants in the marine environment: a review. Marine Pollution Bulletin 62(12): 2588-2597. Cole, M., H. Webb, P. K. Lindeque, E. S. Fileman, C. Halsband and T. S. Galloway (2014). Isolation of microplastics in biota-rich seawater samples and marine organisms. Scientific Reports 4: 4528. Corbanie, E. A., M.G. Matthijs, J.H. Van Eck, J.P. Remon, W.J. Landman and C. Vervaet (2006). Deposition of differently sized airborne microspheres in the respiratory tract of chickens. Avian Pathology 35: 474-485. Cosmetics Europe (2015). Cosmetics Europe issues a recommendation on solid plastic particles (plastic micro particles). Retrieved 2016-01-20. Cousins A. P. (2012). The effect of the indoor environment on the fate of organic chemicals in the urban landscape.
Science of the Total Environment 438: 233–241
Cózar, A., F. Echevarríaa, J. I. González-Gordilloa, X. Irigoienb, B. Úbedaa, S. Hernández-Leónd, A. T. T. Palmae, S. Navarrof, J. García-de-Lomasa, A. Ruizg, M. L. Fernández-de-Puellesh and C. M. Duartei (2014). Plastic debris in the open ocean. PNAS. 06/2014; 111(28). DOI: 10.1073/pnas.1314705111. Dalmo, R. A., R.M. Leifson and J. Bøgwald (1995). Microspheres as antigen carriers: studies on intestinal absorption and tissue localization of polystyrene microspheres in Atlantic salmon, Salmo salar L. Journal of Fish Diseases 18: 87-91. Davidson, T. M. (2012). Boring crustaceans damage polystyrene floats under docks polluting marine waters with microplastic. Marine Pollution Bulletin 64(9): 1821-1828. De Jong, W. H. and P.J. Borm (2008). Drug delivery and nanoparticles: applications and hazards. International journal of nanomedicine 3: 133-149.

IVL-report C 183 Swedish sources and pathways for microplastics to the marine environment
80
De Witte, B., L. Devriese, K. Bekaert, S. Hoffman, G. Vandermeersch, K. Cooreman and J. Robbens (2014). Quality assessment of the blue mussel (Mytilus edulis): Comparison between commercial and wild types. Marine Pollution Bulletin 85: 146-155. Dekiff, J. H., D. Remy, J. Klasmeier and E. Fries (2014). Occurrence and spatial distribution of microplastics in sediments from Norderney. Environmental Pollution 186: 248-256. Devriese, L. I., M. D. van der Meulen, T. Maes, K. Bekaert, I. Paul-Pont, L. Frere, J. Robbens and A. D. Vethaak (2015). Microplastic contamination in brown shrimp (Crangon crangon, Linnaeus 1758) from coastal waters of the Southern North Sea and Channel area. Marine Pollution Bulletin 98(1-2): 179-187. DollyRopeFree http://www.dollyropefree.com/the_use_of_dolly_rope_by_fishermen. Retrieved 2016-01-16 Dris, R., J. Gasperi, V. Rocher, M. Saad, N. Renault and B. Tassin (2015). Microplastic contamination in an urban area: a case study in Greater Paris. Environmental Chemistry 12: 592-599. Dris, R., J. Gasperi, M. Saad, C. Mirande and B. Tassin (in press (2016)). Synthetic fibers in atmospheric fallout: A source of microplastics in the environment? Marine Pollution Bulletin. Dubaish, F. and Liebezeit, G. (2013). Suspended Microplastics and Black Carbon Particles in the Jade System, Southern North Sea. Water, Air, & Soil Pollution 224: 1352. Edwards, R. D., E.J. Yurkowb and P.J. Lioy (1998). Seasonal deposition of house dusts onto household surfaces. The Science of the Total Environment 224: 69-80. Eklund, D. and B. Eklund (2012). Förorening av båtuppläggningsplatser – en sammanställning av utförda undersökningar i svenska kustkommuner, Institute of Applied Environmental Research, Stockholm University. ITM rapport 208. Elzoghby, A. O. (2013). Gelatin-based nanoparticles as drug and gene delivery systems: Reviewing three decades of research. Journal of Controlled Release 172: 1075-1091. Energimyndigheten (2015). Produktion och användning av biogas och rötrester år 2014. Ericson, J. (2015). Swedish sea-fisheries during 2014. Definitive data. Eriksen, M., L. C. M. Lebreton, H. S. Carson, M. Thiel, C. J. Moore, J. C. Borerro, F. Galgani, P. G. Ryan and J. Reisser (2014). Plastic pollution in the world’s oceans: more than 5 trillion plastic pieces weighing over 250,000 tons afloat at sea. PLoS ONE. doi: 10.1371/journal.pone.0111913 Essel, R., L. Engel, M. Carus and R. H. Ahrens (2015). Sources of microplastics relevant to marine protection in Germany. TEXTE 64/2015 Project No. 31969 Report No. (UBA-FB) 002147/E, On behalf of the Federal Environment Agency (Germany). ESSKA.se (2016). https://www.esska.se/esska_se_s/Blaestring/Blaestermedel.html. Retrieved 2016-01-24.
Foekema, E. M., C. De Gruijter, M. T. Mergia, J. A. van Franeker, A. T. J. Murk and A. A. Koelmans (2013). Plastic in North Sea fish. Environmental Science and Technology 47: 8818−8824. Folkö, A. (2015). Quantification and characterization of fibers emitted from common synthetic materials during washing. Examensarbete i miljö- och hälsoskydd. Stockholms Universitet och Käppalaförbundet.

IVL-report C 183 Swedish sources and pathways for microplastics to the marine environment
81
Fråne A., L. Schmidt, J. Sjöström, S. Vukicevic, M. Tapper (2015). Kunskapsunderlag för ökad källsortering av plastförpackningar. IVL Rapport B2247. Frändegård, P., K.. Joakim, N. Svensson and M. Eklund (2013). Resource and Climate Implications of Landfill Mining A Case Study of Sweden. Journal of Industrial Ecology 17(5): 742-755. Funcke, O. (2015). Vattenbruk 2014. Serie Jordbruk, skogsbruk och fiske. Gabert, K. (2012). EPDM-gummigranulat som material, egenskaper och möjligheter, Självständigt arbete, Sveriges Lantbruksuniversitet. Galgani, F., N. Zampoukas, D. Fleet, J. v. Franeker, S. Katsanevakis, T. Maes, J. Mouat, L. Oosterbaan, I. Poitou and G. Hanke (2010). Marine Strategy Framework Directive: Task Group 10 Report Marine Litter. Office for Official Publications of the European Communities. Geranio, L., M. Heuberger and B. Nowack (2009). The behavior of silver nanotextiles during washing. Environmental Science and Technology 43: 8113-8118. GESAMP (2015). Sources, fate and effects of microplastics in the marine environment: a global assessment. (IMO/FAO/UNESCO-IOC/UNIDO/WMO/IAEA/UN/UNEP/UNDP Joint Group of Experts on the Scientific Aspects of Marine Environmental Protection). Rep. Stud. P. J. Kershaw, ed. GESAMP No 90: 96. Gipp, M. and J. Wietfeldt (2002). Artificial dust composition and method of manufacture, Patent WO 2007079027 A2. Gouin, T., J. Avalos, I. Brunning, K. Brzuska, J. de Graaf, J. Kaumanns, T. Koning, M. Meyberg, K. Rettinger, H. Schlatter, J. Thomas, R. van Welie and T. Wolf (2015). Use of micro-plastic beads in cosmetic products in Europe and their estimated emissions to the North Sea Environment. SOFW Journal 141(3): 40-46. Gustavsson, M. (2001). Icke-avgasrelaterade partiklar i vägmiljön.VTI meddelande 910. Guyson (2016). http://www.guyson.co.uk/aftersales/plastic-blast-media. Retrieved 2016-01-14. Habib, D., D. Locke and L. J. Cannone (1998). Synthetic fibers as indicators of municipal sewge sludge, sludge products, and sewage treatment plant effluents. Water, Air and Soil Pollution 103: 1-8. Havs- och vattenmyndigheten (2015). Båtbottentvättning av fritidsbåtar - Riktlinjer, reviderad upplaga 2015. Hildago-Ruz, V., L. Gutow, R. C. Thompson and M. Thiel (2012). Microplastics in the marine environment: a review of the methods used for identification and quantification. Environmental Science and Technology 46(6): 3060-3075. Hinojosa, I. A. and M. Thiel (2009). Floating marine debris in fjords, gulfs and channels of southern Chile. Marine Pollution Bulletin 58(3): 341-350. Hopewell, J., R. Dvorak and E. Kosior (2009). Plastics recycling: challenges and opportunities. Philos Trans R Soc Lond B Biol Sci 364(1526): 2115-2126. http://www.swicofil.com/companyinfo/manualmonofilconversiontable.html. (2016). Retrieved 2016-02-03. Håll Sverige Rent (2015a). Skräprapporten 2015: Nedskräpningen i Sverige.

IVL-report C 183 Swedish sources and pathways for microplastics to the marine environment
82
Håll Sverige Rent (2015b). Rikssnitt 2012-2014. http://www.hsr.se/fakta/statistikportal/skrapmatningar-pa-strander/rikssnitt-2012-2014. Retrieved 2015-12-18.
Håll Sverige Rent (2016). Skräpmätningar i stadsmiljö. http://www.hsr.se/fakta/statistikportal/skrapmatningar-i-stadsmiljo. Retrieved 2016-02-02. IVL Svenska Miljöinstitutet (2012). Uppdragsrapport för SDAB, Livscykelanalys på återvinning av däck, Jämförelser mellan däckmaterial och alternativa material i konstgräsplaner, dräneringslager och ridbanor, rapportnummer U3891. Jambeck, J., R. Geyer, R., C. Wilcox, T.R. Siegler, M. Perryman, A. Andrady, R. Narayan and K.L. Law (2015). Plastic waste inputs from land into the ocean. Science 347 (768-771). Järfälla (2007). Tjänsteskrivelse: Rapport tillsyn på båtklubbar i Järfälla kommun. Järfälla (2012). Tillsyn båtklubbar 2012. Järfälla kommun. Kalmykova, Y., K. Bjorklund, A.-M. Stromvall, and L. Blom (2013). Partitioning of polycyclic aromatic hydrocarbons, alkylphenols, bisphenol A and phthalates in landfill leachates and stormwater. Water Research 47. Kemikalieinspektionen (2016). Förslag till nationellt förbud mot mikrokorn av plast i kosmetiska produkter. Rapport från ett regeringsuppdrag. Rapport 2/16: 43. Kim, S.-G., W.-I. L. Lee and M. Yuseok (2014). The estimation of derelict fishing gear in the coastal waters of South Korea: Trap and gill-net fisheries. Marine Policy 46: 119-122. KIMO Baltic Sea and Håll Sverige Rent (2012). Varför spökar det i Östersjön? En studie av förekomsten av spökgarn i Östersjön baserat på draggningar i Sydkustens och Gotlands fiskeområden sommaren 2012. Klima- og Forurensningsdirektoratet (2012a). Bruksområder og framtidig bruk av gummigranulat basert på bildekk og ny gummigranulatdekk, delraport 1 av potensialet for og omfanget av utslipp av miljøgifter fra bruksfasen ved gjenvinningsformer som bruker gummigranulat fra kasserte bildekk. Klima- og Forurensningsdirektoratet (2012b). Avfallsbehandling av gummigranulat, delrapport 3 av potensialet for og omfanget av utslipp av miljøgifter fra bruksfasen ved gjenvinningsformer som bruker gummigranulat fra kasserte bildekk. Kukulka, T., G. Proskurowski, S. Morét-Ferguson, D. W. Meyer and K. L. Law (2012). The effect of wind mixing on the vertical distribution of buoyant plastic debris. Geophysical Research Letters 39(L07601, doi:10.1029/2012GL051116): 6 pp. Kwon, B. G., K. Saido, K. Koizumi, H. Sato, N. Ogawa, S.Y. Chung and K. Kogure (2014). Regional distribution of styrene analogues generated from polystyrene degradation along the coastlines of the North-East Pacific Ocean and Hawaii. Environmental Pollution 188: 45-49. Larm, T. (2016). StormTac database. from http://www.stormtac.com/index.php. Retrieved 2016-02-05. Lassen, C., S. Foss Hansen, K. Magnusson, F. Norén, N. I. Bloch Hartmann, P. Rehne Jensen, T. Gissel Nielsen and A. Brinch (2015). Microplastics - Occurrence, effects and sources of releases to the environment in Denmark.

IVL-report C 183 Swedish sources and pathways for microplastics to the marine environment
83
Environmental project No. 1793, Danish Ministry of the Environment–Environmental Protection Agency (Denmark): 204. Leander, J. and M. Sernland (2011). Nationell kartläggning av plockanalyser av hushållens kärl- och säckavfall. Avfall Sverige report U2011:04. Lebreton, L. C.-M., S.D. Greer and J.C. Borrero (2012). Numerical modelling of floating debris in the world’s oceans. Marine Pollution Bulletin 64(3): 653-661. Lee, J., S. Hong, Y. C. Jang, M. J. Lee, D. Kang and W. J. Shim (2015). Finding solutions for the styrofoam buoy debris problem through participatory workshops. Marine Policy 51: 182-189. Leslie, H. A., van Velzen, M.J.M., et.al. (2013). Microplastic Survey of the Dutch Environment. Novel Data Set of Microplastics in North Sea Sediments, Treated Wastewater Effluents and Marine Biota” Amsterdam: Institute for Environmental Studies, VU University.: 30. Levén, L., U. Nordberg, J. Yngvesson, G. Henriksson and J. Enebro (2012). Mikroplaster i biogasprocessen – Förstudie. Waste Refinery Report 48. Li, Y., S. Lau, M. Kayhanian and M. Stenstrom (2005). Particle size distribution in highway runoff. Journal of Environmental Engineering 131(9): 1267-1276. Long, M., B. Moriceau, M. Gallinari, C. Lambert, A. Huvet, J. Raffray and P. Soudant (2015). Interactions between microplastics and phytoplankton aggregates: Impact on their respective fates. Marine Chemistry 175: 39-46. LTU (2016). Materialåtervinning av uttjänta däck. http://www.ltu.se/research/subjects/Geotechnical-engineering/Dackatervinningsportalen/Materialatervinning. Retrieved 2016-02-05. Lusher, A. L., A. Burke, I. O'Connor and R. Officer (2014). Microplastic pollution in the Northeast Atlantic Ocean: validated and opportunistic sampling. Marine Pollution Bulletin 88(1-2): 325-333. Lusher, A. L., M. McHugh and R. C. Thompson (2013). Occurrence of microplastics in the gastrointestinal tract of pelagic and demersal fish from the English Channel. Marine Pollution Bulletin 67: 94-99. Länstyrelsen Gävleborg (2009). Bräddning av avloppsvatten i Sverige och Gävleborgs län. Rapport 2009:1. Macher, J. M. (2001). Review of Methods to Collect Settled Dust and Isolate Culturable Microorganisms. Indoor Air 11: 99-110. Magnusson, K. (2014a). Microlitter and other microscopic anthropogenic particles in the sea area off Raunma and Turku, Finland, IVL Swedish Environmental Research Institute: 18. Magnusson, K. (2014b). Mikroskräp i avloppsvatten från tre norska avloppsreningsverk, IVL Swedish Environmental Research Institute. Rapport C71. Magnusson, K., H. Jörundsdóttir , H. Lloyd, F. Norén, M. Lehtiniemi, J. Talvitie and O. Setälä (accepted for publication). Sewage treatment plants as pathways for microlitter to the marine environment– a study from three Nordic countries. TemaNord report, Nordic Council of Ministers.

IVL-report C 183 Swedish sources and pathways for microplastics to the marine environment
84
Magnusson, K. and F. Norén (2011). Microscopic litter in the sea - development of a monitoring method (in Swedish: Mikroskopiskt skräp i havet - metodutveckling för miljöövervakning). Rapport till Naturvårdsverket, Swedish Environmental Protection Agency: 22. Magnusson, K. and F. Norén (2014). Screening of microplastic particles in and down-stream a wastewater treatment plant; Report C 55, IVL Swedish Environmental Research Institute: 19. Magnusson, K. and C. Wahlberg (2014). Mikroskopiska skräppartiklar i vatten från avloppsreningsverk (Microscopic litter particles in water from WWTPs) in Swedish, IVL Swedish Environmental Research Institute. Report B 2208: 30. Magnusson, S. (2015). Systemanalys av konstgräsplaner, Miljö- och kostnadsaspekter, Teknisk rapport, Luleå tekniska universitet, ISBN 978-91-7583-502-0. Malmquist, L. (2012). Utvärdering av förbehandlingsprocessen på biogasanläggningen vid Kungsängens gård i Uppsala. , Vattenförsörjnings- och Avloppsteknik. Institutionen för kemiteknik, LTH Examensarbete 2011. Mani, T., A. Hauk, U. Walter and P. Burkhardt-Holm (2015). Microplastics profile along the Rhine River. Scientific Reports 5: 17988. MARLIN (2014). Final report of Baltic Marine Litter Project MARLIN – Litter monitoring and raising awareness. 2011-2013. Matsusaki, M., A. Kishida, N. Stainton, C.W.G. Ansell and M. Akashi (2001). Synthesis and characterisation of novel biodegradable polymers composed of hydroxycinnamic acid and D, L-lactic acid. Journal of Applied Polymer Science 82: 2357-2364. Mehlhart, G. and M. Blepp (2012). Study on land-sourced litter (LSL) in the marine environment. Review of sources and literature. Öko-Institut e.V. Microbead-Free Waters Act of 2015, H. R. (H.R. 1321), amending Section 301 of the Federal Food, Drug, and Cosmetic Act (21 U.S.C. 331). Miljösamverkan Stockholms län (2015). Tillsyn av underhåll av fritidsbåtar - Handläggarstöd. Mintenig, S. (2014). Microplastic in plankton of the North- and Baltic Sea , Master thesis, Universität Oldenburg, ICBM Mintenig, S. (2014). Planktonic Microplastic in the North Sea. A new extraction method for the detection by Fourier Transform Infrared Spectroscopy (FTIR). Mintenig, S., I. Int-Veen, M. Löder and G. Gerdts (2014). Mikroplastik in ausgewählten Kläranlagen des Oldenburgisch- Ostfriesischen Wasserverbandes (OOWV) in Niedersachsen Probenanalyse mittels Mikro-FTIR Spektroskopie, Alfred-Wegener-Institut, Helmholtz-Zentrum für Polar- und Meeresforschung (AWI), Biologische Anstalt Helgoland: 41. Molhave, L., T. Schneider, S.K. Kjaergaard, L. Larsen, S. Norn and O. Jorgensen (2000). House dust in seven Danish offices. Atmospheric Environment 34: 4767-4779. Moore, C. J. (2008). Synthetic polymers in the marine environment: A rapidly increasing, long-term threat. Environmental Research 108(2): 131-139.
IVL-report C 183 Swedish sources and pathways for microplastics to the marine environment
85
Morét-Ferguson, S., K. L. Law, G. Proskurowski, E. K. Murphy, E. E. Peacock and C. M. Reddy (2010). The size, mass, and composition of plastic debris in the western North Atlantic Ocean. Marine Pollution Bulletin 60(10): 1873-1878. Morin, N., H.P.H. Arp and S.E. Hale (2015). Bisphenol A in Solid Waste Materials, Leachate Water, and Air Particles from Norwegian Waste-Handling Facilities: Presence and Partitioning Behavior. Environmental Science and Technology 49(13): 7675-7683. DOI: 10.1021/acs.est.5b01307 Månsson, C. (2010). Gräsligt eller gräslikt- En jämförelse mellan naturgräs och konstgräs på svenska idrottsarenor, Självständigt arbete vid LTJ-fakulteten, SLU, Landskapsingenjörsprogrammet, Alnarp. Mårtensson, C. (2012). Överbyggnadskonstruktioner för fotbollsplaner av konstgräs (Ground construction for soccer fields with artificial turf), Självständigt arbete/Examensarbete 15hp, Landskapsingenjörsprogrammet, Självständigt arbete vid LTJ-fakulteten, SLU Alnarp 2012. Napper I. E. and Thompson R. C. Release of synthetic microplastic plastic fibres from domestic washing machines: Effects of fabric type and washing conditions. Marine Pollution Bulletin 112 (2016) 39–45. Naturskyddsföreningen (2013). Raklödder till fiskarna. Om skräp i havet -källor, problem och lösningar: 32. Naturvårdsverket (2014). Avfall i Sverige 2012. Naturvårdsverket Report 6619. Norén, F. (2007). Mikroskopiska plastpartiklar i Västerhavet, en pilotstudie över förekomst. K. i. m. (KIMO), Local Authorities International Environmental Organization (KIMO): 10. Norén, F. and F. Naustvoll (2010). Survey of microscopic anthropogenic particles in Skagerrak. Report commissioned by Klima-og Forurensningsdirektoratet. Norén, F., K. Norén and K. Magnusson (2014). Marint mikroskopiskt skräp. Undersökning längs svenska västkusten 2013 & 2014. Länsstyrelsen rapporter. Göteborg: 23. IVL-rapport 2014:52. (in Swedish) Norén, K., K. Magnusson and F. Norén (2016). Mikroskräp i inkommande och utgående renat avloppsvatten vid Arvidstorps reningsverk i Trolhättans kommun. Report B2255. NVF (2016). Facts about Road Transport in Norway. http://www.nvfnorden.org/. Retrieved 2016-02-05. OECD (2005). OECD series on emission scenario documents. Number 13. Emission Scenario Document on antifouling products. OECD (2009a). OECD series on emission scenario documents Number. 20. Emission scenario document on adhesive formulation. OECD (2009b). OECD series on emission scenario documents. Number 22. Emission scenario documents on coating industry (Paints, Lacquers and Varnishes). Olshammar, M. and C. Baresel (2012). Vattenskador orsakade av baktryck i avloppssystemet-Erfarenheter, regler, hantering och tekniska lösningar, Stockholm: IVL Svenska Miljöinstitutet. Olshammar, M., M. Ek, L. Rosenquist,H. Ejhed, A. Sidvall and S. Svanström (2015a) Uppdatering av kunskapsläget och statistik för små avloppsanläggningar, SMED Rapport Nr 166 2015 Olshammar M., J. Mietala and M. Ek (2015b) Underlagsrapport för C-anläggningar och dagvatten till FUT-rapporteringen 2011, SMED-rapport Nr. 165.
IVL-report C 183 Swedish sources and pathways for microplastics to the marine environment
86
Pakula, C. and R. Stamminger (2010). Electricity and water consumption for laundry washing by washing machine worldwide. Energy Efficiency 3(4): 365-382. Plast och Kemiföretagen (2010). EPS i Grund och Mark. EPS bygg. PlasticsEurope (2010). plasticeurope.org. Retrieved 2015-12-15. PlasticsEurope (2012). Plastics - Architects of modern and sustainable buildings. PlasticsEurope (2015). Plastics – The Facts, 2015, An analysis of European plastics production, demand and waste data from 2014. Raunemaa, T., M. Kulmala, H. Saari, M. Olin and M.H. Kulmala (1989). Indoor Air Aerosol Model: Transport Indoors and Deposition of Fine and Coarse Particles. Aerosol Science and Technology 11(1): 11-25. Revaq. Årsberättelse 2014.
Rummel, C. D., M. G. J. Löder, N. F. Fricke, T. Lang, G. E-M, M. Janke and G. Gerdts (2016). Plastic ingestion by pelagic and demersal fish from the North Sea and Baltic Sea. Marine Pollution Bulletin 102: 134-141. SCB (2010). The statistics database. 2016 http://www.statistikdatabasen.scb.se. SCB (2016). http://www.scb.se/en_/finding-statistics/statistics-by-subject-area/population/population-composition/population-statistics/ Retrieved 2016-01-11. Schneider, T. (2008). Dust and fibers as a cause of indoor environment problems. SJWEH Suppl 4: 10-17. SMED (2012). Kartläggning avplastavfallströmmar i Sverige 2010, SMED Rapport Nr 108 2012. Smith, S. D. A. and A. Markic (2013). Estimates of Marine Debris Accumulation on Beaches Are Strongly Affected by the Temporal Scale of Sampling. PLoS ONE 8(12). Statistics Sweden (2010). Varannan svensk bor nära havet. Retrieved 2016-02-02, from http://www.scb.se/sv_/Hitta-statistik/Artiklar/Varannan-svensk-bor-nara-havet/. Strand, J., P. Lassen, Y. Shashoua and J. H. Andersen (2013). Microplastic particles in sediments from Danish waters. ICES Annual Science Conference, 23 – 27 September 2013. Reykjavík, Iceland. Sundt, P., P.-E. Schulze and F. Syversen (2014). Sources of microplastic pollution to the marine environment, Mepex for the Norwegian Environment Agency (Miljødirektoratet): 86. SvD (2012). Oren snö dumpas i sjö och hav. Svenska Dagbladet 15 december 2012. Svenska Fotbollsförbundet (2015). Konstgräsplaner och hallar i Sverige. http://d01.fogis.se/svenskfotboll.se/ImageVault/Images/id_116110/scope_0/ImageVaultHandler.aspx151106133140-uq SvepRetur (2016a). Branschorganisation och materialbolag. http://svepretur.se/om-svepretur/. Retrieved 2016-02-01. SvepRetur (2016b). Återvinn med SvepRetur. http://svepretur.se/tjanster/. Retrieved 2016-02-01.

IVL-report C 183 Swedish sources and pathways for microplastics to the marine environment
87
SvepRetur (2016c). Lantbrukets återvinning steg för steg. http://svepretur.se/tjanster/sa-har-gor-du/. Retrieved 2016-02-01. Svärd, B. (2013). Analys Av Data Från OSPAR:s Referensstränder Åren 2001-2011. Ren Kust Bohuslän. Sweboat (2015). Retrieved 2016-02-02, from http://www.sweboat.se/statistik-2015.aspx Teuten, E. et al. (2009). Transport and release of chemicals from plastics to the environment and to wildlife. Phil. Trans. R. Soc. B 364: 2027-2045. DOI:10.1098/rstb.2008.0284 Thatcher, T.L. and D.W. Layton (1995). Deposition, resuspension, and penetration of particles within a residence. Atmospheric Environment 29(13): 1487-1497. The Fiber Year 2015 (2014). World Survey on Textiles & Nonwoven. Thompson, R.C., Y. Olsen, R.P. Mitchell, A. Davis, S.J. Rowland, A.W.G. John, D. McGonigle, A.E. Russell (2004) Lost at sea: Where is all the plastic? Science 304, 838. Thompson, R. C. (2006). Plastic debris in the marine environment: consequences and solutions. In: Krause, J.C., Nordheim, H., Bräger, S. (Eds.), Marine Nature Conservation in Europe. Thorpe, A. and R.M. Harrison (2008). Sources and properties of non-exhaust particulate matter from road traffic: a review. Science of the total environment 400(1): 270-282. Trafikanalys (2016). Trafikarbete på svenska vägar 2015 , http://www.trafa.se/vagtrafik/trafikarbete. Transportstyrelsen, 2010. Båtlivsundersökningen 2010. En undersökning om svenska fritidsbåtar och hur de används. , p. 91. Van Cauwenberghe, L., M. Claessens, M. B. Vandegehuchte and C. R. Janssen (2015). Microplastics are taken up by mussels (Mytilus edulis) and lugworms (Arenicola marina) living in natural habitats. Environmental Pollution 199: 10-17. Van Cauwenberghe, L., M. Claessens, M. B. Vandegehuchte, J. Mees and C. R. Janssen (2013). Assessment of marine debris on the Belgian Continental Shelf. Marine Pollution Bulletin 73: 161-169. Van Cauwenberghe, L. and C. R. Janssen (2014). Microplastics in bivalves cultured for human consumption. Environmental Pollution 193: 65-70. van Franeker, J. A. and K. L. Law (2015). Seabirds, gyres and global trends in plastic pollution. Environmental Pollution 203: 89-96.
van Sebille, E., C. Wilcox, L. Lebreton, N. Maximenko, B.D. Hardesty, J.A. van Franeker, M. Eriksen, D. Siegel, F. Galgani and K.L. Law (2015). A global inventory of small floating plastic debris. Environmental Research Letters 10: 124006. doi:10.1088/1748-9326/10/12/124006 Värmdö (2010). Hållbart Båtliv - Förstudie utförd av bygg- och miljökontoret under 2010. Värmdö kommun. Verschoor, A., L. de Poorter, E. Roex and B. Bellert (2014a). Quick scan and prioritization of microplastic sources and emissions. RIVM Report 2014-0156. National Institute for Public Health and the Environment.

IVL-report C 183 Swedish sources and pathways for microplastics to the marine environment
88
Verschoor, A., J. Herremans, W. Peijnenburg and R. Peters (2014b). Size and amount of microplastics in toothpastes. Plastic particles in toothpaste were 100x smaller than microbeads in facial scrubs. C. p. b. N. I. f. P. H. a. t. E. Netherlands. Wang, Y. and D.J. Burgess (2012). Long Acting Injection and Implants. Chapter 10 Microsphere technologies. Advances in Delivery Science and Technology: 167-194. Webster, T.F., S. Harrad, J.R. Millette, R.D. Holbrook, J.M. Davies, H.M. Stapleton, J.G Allen, M.D. McClean, C. Ibarra, M.A. Abdallah and A. Covaci (2009). Identifying Transfer Mechanisms and Sources of Decabromodiphenyl Ether (BDE 209) in Indoor Environments Using Environmental Forensic Microscopy. Environmental Science & Technology. 43(9): 3067-3072. Wredh, G. (2014). Miljö- och hälsorisker med konstgräsplaner, Examensarbete avancerad nivå Miljö- och hälsoskydd, 15 hp 2014, Institutionen för naturgeografi och kvartärgeologi, Stockholms Universitet. Ziebarth, N. (2015). Mikroplastik die unsichtbare gefahr, Der BUND-Einkaufsratgeber. Zimmerman, A. (2009). Constructing landscape: materials, techniques, structural components., Basel: Birkhäuser. Zubris, K. A. V. and B. K. Richards (2005). Synthetic fibers as an indicator of land application of sludge. Environmental Pollution 138: 201-211.
8.2 Personal communication
Anders Raft, Plastix A/S Anneli Åstebro, Municipality of Järfälla Arto Näätsaari, Saltex Caroline Steinwig, Avfall Sverige Christian Andersson, Unisport Dan Isaksson, I-Tech AB Fredrik Norén, Researcher, N-research Helena Martinell, City of Gothenburg Johan Norberg, Trafikverket Leif Nilsson, Chairman, Swedish Plastics Industry Association (SPIF) Magnus Ringnér, Association of Swedish Shipyards, Föreningen Sveriges Varv Peter Håkansson, Swerec AB Pär Odén, Ragnsells Ronni Lundqvist, Facilities Development Manager, Swedish Football Association, Svenska Fotbollförbundet Sanita Vukicevic, Envir AB Thomas Ottosson, Cleanaway PET Svenska AB
IVL Swedish Environmental Research Institute Ltd., P.O. Box 210 60, S-100 31 Stockholm, Sweden
Phone: +46-(0)10-7886500 Fax: +46-(0)10-7886590 www.ivl.se


