RESEARCH ARTICLE
Numerical modeling and verification of a
sonobioreactor and its application on two
model microorganisms
Nasim Najjarzadeh1, Adolf KrigeID1, Taraka R. K. PamidiID
2, Orjan Johansson2,
Josefine Enman1, Leonidas Matsakas1, Ulrika Rova1, Paul ChristakopoulosID1*
1 Division of Chemical Engineering, Biochemical Process Engineering, Department of Civil, Environmental
and Natural Resources Engineering, LuleåUniversity of Technology, Luleå, Sweden, 2 Division of Operation,
Engineering Acoustics, Maintenance and Acoustics, Department of Civil, Environmental and Natural
Resources Engineering, LuleåUniversity of Technology, Luleå, Sweden
These authors contributed equally to this work.
Abstract
Ultrasound has many uses, such as in medical imaging, monitoring of crystallization, char-
acterization of emulsions and suspensions, and disruption of cell membranes in the food
industry. It can also affect microbial cells by promoting or slowing their growth and increas-
ing the production of some metabolites. However, the exact mechanism explaining the
effect of ultrasound has not been identified yet. Most equipment employed to study the effect
of ultrasound on microorganisms has been designed for other applications and then only
slightly modified. This results in limited control over ultrasound frequency and input power,
or pressure distribution in the reactor. The present study aimed to obtain a well-defined reac-
tor by simulating the pressure distribution of a sonobioreactor. Specifically, we optimized a
sonotrode to match the bottle frequency and compared it to measured results to verify the
accuracy of the simulation. The measured pressure distribution spectrum presented the
same overall trend as the simulated spectrum. However, the peaks were much less intense,
likely due to non-linear events such as the collapse of cavitation bubbles. To test the applica-
tion of the sonobioreactor in biological systems, two biotechnologically interesting microor-
ganisms were assessed: an electroactive bacterium, Geobacter sulfurreducens, and a
lignocellulose-degrading fungus, Fusarium oxysporum. Sonication resulted in increased
malate production by G. sulfurreducens, but no major effect on growth. In comparison, mor-
phology and growth of F. oxysporum were more sensitive to ultrasound intensity. Despite
considerable morphological changes at 4 W input power, the growth rate was not adversely
affected; however, at 12 W, growth was nearly halted. The above findings indicate that the
novel sonobioreactor provides an effective tool for studying the impact of ultrasound on
microorganisms.
PLOS ONE
PLOS ONE | https://doi.org/10.1371/journal.pone.0229738 March 11, 2020 1 / 19
a1111111111
a1111111111
a1111111111
a1111111111
a1111111111
OPEN ACCESS
Citation: Najjarzadeh N, Krige A, Pamidi TRK,
Johansson O, Enman J, Matsakas L, et al. (2020)
Numerical modeling and verification of a
sonobioreactor and its application on two model
microorganisms. PLoS ONE 15(3): e0229738.
https://doi.org/10.1371/journal.pone.0229738
Editor: Vijai Gupta, Tallinn University of
Technology, ESTONIA
Received: October 9, 2019
Accepted: February 12, 2020
Published: March 11, 2020
Copyright: © 2020 Najjarzadeh et al. This is an
open access article distributed under the terms of
the Creative Commons Attribution License, which
permits unrestricted use, distribution, and
reproduction in any medium, provided the original
author and source are credited.
Data Availability Statement: All relevant data are
within the manuscript and its Supporting
Information files.
Funding: The work was funded by the Swedish
research council (VR; https://www.vr.se/english.
html) project number 2014-05906. The funders
had no role in study design, data collection and
analysis, decision to publish, or preparation of the
manuscript.
Competing interests: The authors have declared
that no competing interests exist.

Introduction
Ultrasound, which comprises sound at frequencies above 20 kHz, has many uses in various
industries. For example, high-frequency (1–10 MHz) low-energy diagnostic ultrasound is rou-
tinely used for ultrasound imaging in the medical field to evaluate the state of internal tissue
structures without changing the physicochemical properties of the tissue [1]. Low-power ultra-
sound with frequencies of 0.1–1 MHz is used extensively in several food science applications,
such as the monitoring of crystallization or the characterization of emulsions and suspensions
[2]. The low-power levels required by these applications do not induce changes in the material.
On the opposite end, high-intensity ultrasound at lower frequencies (20–100 kHz) can be used
as an invasive technique to purposely alter the properties of materials. High-power (10–10 000
W/cm2) acoustic waves induce the formation of cavities as they travel through a medium, result-
ing in physicochemical changes to the material [1]. For example, ultrasound is commonly used
to disrupt cells and release intracellular products [3]. In one study, ultrasound was successfully
used in lab scale to prevent algal blooms in the lakes or rivers with the removal rate of 86.4% [4].
Intense ultrasound is even known to damage macromolecules such as enzymes [5]. Moreover,
ultrasound was successfully used as an eco-friendly pretreatment method of lignocellulosic and
waste material [6–7].
Microbial cells can vary substantially with regard to how they are affected by continuous or
intermittent ultrasonication. For example, the cyanobacterium Anabaena flos-aquae exhibited
enhanced growth rate and a 46% increase in biomass yield when intermittently sonicated (5
min/day, 20 kHz, 50 W pulse) [8,9]. In contrast, the same treatment slowed the growth of the
microalgae Selenastrum capricornutum [10]. Stimulation of Panax ginseng suspended plant
cells with low doses of ultrasound (0.5–6.0 min, 38.5 kHz, power100 kW/m3) induced sec-
ondary metabolite production and affected cross-membrane ion fluxes within 2 min of expo-
sure [11]. Based on the research, we can also use ultrasound to improve the fermentation yield
[12]. Studies have also shown enhanced rates of enzyme-catalyzed reactions when using ultra-
sonication [13]. Improved mass transfer (including increased permeability of the cell mem-
brane toward nutrients, oxygen, and cell products) and cell retention (for high-density
cultures) have often been cited as possible mechanisms responsible for the ultrasonic enhance-
ment of a culture’s metabolism. However, the exact mechanism has not been clearly identified
and more work is required in this sense [10].
To study the effect of sound waves on microbial activity, different types of ultrasound
equipment have been developed over the past few decades. However, such equipment is usu-
ally obtained by simply combining a standard ultrasound device (such as an ultrasound horn
or an ultrasound bath) with common bacterial growth reactors [14–15]. One of the most com-
mon methods is to submerge a flask or bottle into the liquid of an ultrasonic cleaning bath.
This strategy relies heavily on the functionality of the bath itself and is affected by factors, such
as uniformity of sound distribution, placement of the sonotrodes, and temperature. Further-
more, ultrasound intensity itself is strongly dependent on the location of the flask in the bath
[16,17]. This could impact the repeatability of experiments if the flasks are not placed in the
exact same location. Finally, the frequency and sometimes the power are typically fixed and
not necessarily optimized for sonobioreactors. Therefore, most sonobioreactors are batch-type
reactors with no control over ultrasound intensity inside the batch volume. Although the effect
of ultrasound can be studied in this way, it fails to take into account the pressure distribution
along the reactor volume. Finally, many studies rely only on the rated power of the ultrasound
equipment, rather than the effective power transmitted into the reactor [18,19].
Here, we describe creating a novel reactor, in which ultrasound can be precisely controlled
to properly study its effect on biological systems. An effective sonobioreactor is characterized
PLOS ONE Novel sonobioreactor design for biological studies
PLOS ONE | https://doi.org/10.1371/journal.pone.0229738 March 11, 2020 2 / 19

by a powerful pressure response, whose resonance frequency has a symmetrical mode shape
and an even intensity distribution. An adequate reactor is designed in such way that the struc-
ture’s vibrations have a good coupling to the fluid volume. The best coupling is achieved when
the bending wave length matches the wave length in the fluid. The excitation points need to be
located at the antinode of structural vibrations. For a specific reactor structure with a complex
geometry, a multiphysics simulation model is necessary to define the vibration response and
optimum excitation point that allows for a homogenous and strong pressure response in the
fluid. The excitation is created by attaching a sonotrode directly to the vessel. A sonotrode is
composed of a set of piezoelectric transducers and resonant metal rods used as an exciter of
ultrasonic waves. However, to finalize the design of a sonobioreactor, experimental tuning
and verification are required. For this purpose, we chose to test the novel equipment on two
biotechnologically interesting microorganisms, the electroactive bacterium Geobacter sulfurre-ducens, and the lignocellulose-degrading fungus Fusarium oxysporum. Electroactive bacteria
can generate electrical power through extracellular electron transfer, converting the chemical
energy found in chemical bonds of organic compounds [20]. These bacterial systems have
shown promise in various applications, including wastewater treatment, bioremediation or
even as an alternative renewable energy source in remote areas [21–22]. Gram-negative G.
sulfurreducens are known biofilm-forming electroactive bacteria [23]. In the absence of an
electrode, fumarate and acetate are used as electron acceptor and donor, respectively, produc-
ing malate and succinate. F. oxysporum is a soil-dwelling filamentous fungus and one of the
most important plant pathogens [24]. Its ability to produce several cellulases [25] and xylanase
[26], as well as its ability to efficiently convert cellulose to ethanol in one step [27,28] makes it
a promising microorganism for bioethanol production. In this study, the effect of ultrasound
on the growth of these organisms and their metabolite production was investigated at different
powers and resonating frequency of the proposed sonobioreactor.
Material and methods
Sonobioreactor design and construction
The design of the sonobioreactor comprised several steps. In the first step, a standard labora-
tory bottle was selected (250 mL, Duran GL 45 bottle) and a CAD geometry was converted to a
finite element model. The eigenfrequencies were determined in a COMSOL simulation, and
the corresponding eigenmodes of the pressure waves were visualized. The bottle had an eigen-
mode with a symmetric and centered pressure distribution within the bottle volume at a fre-
quency of around 40 kHz. The accuracy of the model was then tested by tapping on the wall of
a fluid-filled bottle and measuring the pressure spectrum inside the bottle. A strong response
at the target frequency of around 40 kHz confirmed the accuracy of the model.
In the second step, to match the eigenfrequency of the bottle, the sonotrodes were designed
to operate at around 40 kHz. This was done by modeling a sonotrode in COMSOL and opti-
mizing the length of the masses. The designed sonotrode consisted of two piezoelectric discs
(PZ 27, Ferroperm Piezoceramics) sandwiched between two stainless steel rod masses at the
front and back (each steel mass was 24-mm long with an outer diameter of 10 mm). The mas-
ses were connected with a 7-mm long M4 screw. Each piezo disc had an outer diameter of 10
mm, an inner diameter of 4 mm, and a thickness of 2 mm.
In the third step, the sonotrode and the reactor bottle models were combined into a full
sonobioreactor model to visualize the pressure distribution in the bottles. When the bottle was
excited to vibrate at the resonance frequency, its structure was deformed and coupled to spe-
cific pressure modes. As a result, the model allowed us to estimate the frequency and mode
shape in the bottle. The sonotrode was attached in a position that efficiently excited the mode
PLOS ONE Novel sonobioreactor design for biological studies
PLOS ONE | https://doi.org/10.1371/journal.pone.0229738 March 11, 2020 3 / 19

shapes, with the pressure distributed evenly along the symmetry line of the bottle. The vibra-
tion in the bottle wall was transferred to the contained liquid as sound.
The physical sonobioreactors were then constructed by gluing sonotrodes to the walls of
standard laboratory bottles at the pre-determined position. The sonobioreactors were powered
by an amplifier (MAC2.2 2-channel power amplifier) with its voltage boosted by a transformer
(gain of 8.9×). The input sound signal (pure sine) was generated using a PC-based software
and hardware system (CLIO 12, Audiomatica), as illustrated in Fig 1.
Finally, the physical sonobioreactor was evaluated in terms of frequency responses and
sound pressure. The CLIO system was used to measure the pressure response over time and
frequency at a 192 kHz sampling rate. A signal conditioning amplifier (NEXUS 2692, Bruel &
Kjaer) was used to connect a pressure sensor (2200V1, Dytran) and a miniature shock-type
accelerometer (353M15, PCB) to the measuring system. The pressure transducer had a fre-
quency range of 1 Hz to 100 kHz and higher. Both the CLIO output and input signals were
controlled by an external CLIO-FFT interface.
Modeling and quantification
The numerical model comprised a glass bottle structure and a sonotrode attached to the bottle
wall. The vibration pattern and pressure distribution of the bottle were simulated using COM-
SOL Multiphysics software (version 5.3a). The simulation included three different modules:
pressure acoustics, solid mechanics, and electrostatic. Each module was governed by its own
equations as discussed hereafter.
In the simulation, the following assumptions were made: 1) some isotropic energy was lost
due to piezoelectric effects or transmission of mechanical energy from the sonotrode; 2) the
acoustic pressure distribution in the bottle was symmetric while damping of ultrasonic waves
was negligible; and 3) the effect of cavitation bubbles generated in the bottle was also
negligible.
Considering that the bottle material had a sufficiently high acoustic impedance, it was
assumed to cause almost no absorption of incident ultrasonic waves. The displacement at the
joint between the piezoelectric material and the stainless steel sonotrode was set to the same
value. The default temperature was 293 K. The input information of the materials is summa-
rized in S1 Table [29].
The pressure acoustics module was used to simulate ultrasound propagation in water. The
acoustic wave equation was as follows [30, 31]:
r 1
rrP þ q
þo2Prc2¼ 0
Where ρ is the density of water (kg/m3), c is the speed of ultrasound propagation in water
(m/s), P is the acoustic pressure (Pa), P = PAcos(ωt) PA is the maximum acoustic pressure, ω is
angular frequency (rad/s), t is time (s), and q is the dipole source (m/s2) which is optional. In
our setup, there was no polarization (q = 0) for the longitudinal ultrasonic waves [36].
The boundary conditions set to couple the three modules followed COMSOL guidelines
[32,33] and were based on previous simulation studies [8–9]. A structure-acoustic boundary
was set to the interface between the structure of the bottle and water. Specifically, the vibra-
tions of the bottle and the surrounding solution were coupled at the interface:
n 1
rsrP þ q
¼ an
PLOS ONE Novel sonobioreactor design for biological studies
PLOS ONE | https://doi.org/10.1371/journal.pone.0229738 March 11, 2020 4 / 19

Where n is the normal unit vector, ρs is the density of the vibrating structure (kg/m3), and
an is the normal acceleration of the fluid (m/s2).
The experimental part included testing the piezoelectric sonotrode before and after mount-
ing it on a bottle. Experiments were conducted to determine impedance and transfer func-
tions, resonance frequencies, pressure, and ultrasound intensity inside the bottle. The
experimental procedures were carried out to define:
• The bottle frequency response by FFT measurements;
• The electrical power fed to the bottle;
• Power consumption by the liquid using the calorimetric method.
All of these aspects were monitored at various excitation frequencies and under controlled
conditions of input power. Simulations were also performed in parallel. Finally, to verify the
intensity distribution in the sonobioreactor the average pressure response was determined by
pressure measurements at ten different positions.
Fig 1. Schematic diagram of the experimental setup of the sonobioreactor.
https://doi.org/10.1371/journal.pone.0229738.g001
PLOS ONE Novel sonobioreactor design for biological studies
PLOS ONE | https://doi.org/10.1371/journal.pone.0229738 March 11, 2020 5 / 19

Microbes, media, and inoculation
G. sulfurreducens PCA (ATCC 51573, DSMZ 12127) obtained from Dr. Ashley Franks, La
Trobe University, Bundoora, Australia, was used in all Geobacter studies. The G. sulfurreducensinoculum was grown in a slightly modified NBAF medium (pH 6.8), with acetate (20 mM)
and fumarate (40 mM) as electron donor and acceptor, respectively, as described previously
[34, 20]. A simpler medium, called “freshwater medium” (FWAF), containing 20 mM acetate
and 40 mM fumarate was used in the sonobioreactor, as described previously [35]. The reac-
tors were autoclaved, filled with FWAF in an anaerobic hood to ensure anaerobic conditions,
and inoculated with 5% of NBAF inoculum.
F. oxysporum f. sp. lycopersici (CBS 123668) was purchased from Centraal bureau voor
Schimmelcultures (CBS), Utrecht, The Netherlands, and kept on a PDA plate. The inoculum
was prepared in yeast and malt extract medium (5 g/L and 20 g/L, respectively) and grown at
29 ˚C for 2 days. Then, a 6% v/v inoculum was used in a 250-mL flask containing 200 mL of
0.2 M sodium phosphate buffer, 0.3 g/L MgSO47H2O, 1 g/L KH2PO4, 10 g/L (NH4)2HPO4,
and 1% w/v sucrose as carbon source.
The sonobioreactors were then placed in a temperature-controlled box (37 ˚C and 29 ˚C
for bacteria and fungi, respectively) on a magnetic stir plate (200 rpm). Finally, the sonotrodes
were connected to the amplifier and sonication was initiated at the desired intensity.
Analytical methods
Biomass concentration of G. sulfurreducens was determined by measuring optical density at
600 nm. The concentrations of organic acids and sugars were determined using a Perkin-
Elmer high-performance liquid chromatography (HPLC) system with a Series 200 refractive
index detector, as previously described [36].
The biomass of F. oxysporum was determined by a combination of dry mass measurements
up to day 3, as well as online biomass measurements using a Cell Growth Quantifier (CGQ;
Aquila Biolabs). The pH of all samples was measured at the end of the experiment and com-
pared with a control sample. Morphological changes due to ultrasonication were investigated
by microscopic studies of platinum-coated ultrasound-treated and control samples by scan-
ning electron microscopy (SEM) on a Magellan 400 instrument (Nanolab Technologies).
Results and discussion
COMSOL simulation
COMSOL simulations were conducted to estimate the sound pressure distribution and the
high-pressure zones in the sonobioreactor volume. Numerically simulated results and verifica-
tion of the physical sonobioreactor are described below.
Simulation and verification of the sonotrodes’ response
The longitudinal displacement amplitude of the sonotrode model was calculated in the fre-
quency range of 35–45 kHz. The length was adjusted to match the targeted resonance of the
bioreactor at 40 kHz. Fig 2 shows the simulated displacement response and measured sono-
trodes impedance as a function of frequency. The sonotrodes resonance in free field corre-
sponded to the impedance minimum and occurred at a frequency of 40580 Hz. The minimum
impedance of the sonotrode was 371 Ω.
PLOS ONE Novel sonobioreactor design for biological studies
PLOS ONE | https://doi.org/10.1371/journal.pone.0229738 March 11, 2020 6 / 19

Simulated vibration pattern and pressure mode shapes
The vibration response of the sonobioreactor model was evaluated in the frequency range of
35–46 kHz. The expectation was to couple the bending wave of the reactor wall to the sono-
trode’s standing wave pattern. Numerous resonances were detected in the frequency range of
interest. Each resonance was linked to a specific mode shape of the system. Low output pres-
sure or very high displacements in the reactor were not desirable.
Fig 3 shows the averaged sound pressure level within the fluid volume of the sonobioreac-
tor. The highest intensity was found at 39.8 kHz, where it was 10 times higher (+10 dB) than
in the other modes. Fig 4 displays the displacement mode of the reactor at the highest intensity
peak of 39.8 kHz. The reason that this frequency was chosen is that the model exhibited both a
maximum pressure response at this frequency and an even pressure-distribution across the
reactor volume.
The 3D-mode shapes of the whole setup provided a clear picture of the pressure distribu-
tion inside the simulated setup. To be useful, mode shapes should have the maximum pressure
along the center of the reactor, whereas the walls of the reactor have lower pressure [37,38].
Mode shapes were evaluated for each peak in the specific frequency range to decide which
one was useful.
The presence of multiple resonance frequencies is not surprising because of local phenom-
ena guiding the reactor’s response. The resonance peak between 39 and 42 kHz was expected
to provide the best coupling to the contained fluid. Amplitude peaks at different frequencies
originated from interactions between other modes of the reactor. The simulated pressure
response was determined by assuming that the water volume in the beaker behaved linearly.
In practice, various aspects of the bottle, fluid, and sonotrode caused a nonlinear pressure
response (such as cavitation bubble collapse), which was seen as a harmonic frequency
response. Because of this nonlinear response, the peaks of the resulting pressure response
tended to be less drastic (Fig 4).
Comparison between the model and the real system. In the experimental measurement,
the peak response was observed at 39.5 kHz, which was close to the simulated resonance fre-
quency (39.8 kHz). However, there were also noticeable differences at several frequencies (Fig
5). The smoothed characteristics of measurement response were due to a combination of non-
linear effects, low sampling resolution, and the averaging process.
Fig 2. (a) Calculated displacement of sonotrodes from the model as a function of frequency. (b) Measured impedance of the physical sonotrodes in free
field at a low input power.
https://doi.org/10.1371/journal.pone.0229738.g002
PLOS ONE Novel sonobioreactor design for biological studies
PLOS ONE | https://doi.org/10.1371/journal.pone.0229738 March 11, 2020 7 / 19

Fig 3. Average sound pressure distribution following excitation of the sonobioreactor with point force of 1 N.
https://doi.org/10.1371/journal.pone.0229738.g003
Fig 4. (a) Vibration pattern of the sonobioreactor and sonotrodes at 39.8 kHz. (b) Acoustic pressure distribution in the
sonobioreactor at 39.8 kHz.
https://doi.org/10.1371/journal.pone.0229738.g004
PLOS ONE Novel sonobioreactor design for biological studies
PLOS ONE | https://doi.org/10.1371/journal.pone.0229738 March 11, 2020 8 / 19

The best match occurred near a well-defined impedance minimum, and coincided with the
maximum pressure response in the reactor. The peak amplitude of the current signal’s fre-
quency spectrum gave a good indication of when the maximum pressure response occurred.
The current peak frequency represented an equivalent and simpler indicator than the imped-
ance minimum. As a result, the frequency response could be determined without measuring
pressure. At maximum response, current and voltage were slightly out of phase. The input
electrical power corresponded to the product of the root mean square values of current and
voltage, as well as the phase angle. With the system in operation, the "loss factor" (the energy
lost during the transfer of sound waves) increased due to energy being transferred to the reac-
tor, in the form of cavitation, energy transfer to the microorganisms, and frictional losses
derived from the sonobioreactor’s structure.
Calorimetric measurements
Calorimetric measurements were performed to further characterize the final energy input into
the sonobioreactors. To this end, bottles filled with 220 mL deionized water were allowed to
reach room temperature and then insulated well before temperature measurements were
taken for several minutes. The increase in temperature was due to the energy absorbed by the
water directly, which was related to the energy input into the sonobioreactor. The power input
varied significantly depending on the resonance frequency of the specific bottle (Fig 6).
Fig 5. Simulated and measured frequency responses. The green line represents the average sound pressure measured by a pressure
sensor at 10 different positions in the sonobioreactor filled with water (220 mL). The blue line represents the averaged simulated
sound pressure level in the fluid volume.
https://doi.org/10.1371/journal.pone.0229738.g005
PLOS ONE Novel sonobioreactor design for biological studies
PLOS ONE | https://doi.org/10.1371/journal.pone.0229738 March 11, 2020 9 / 19

Testing the sonobioreactors in biological systems
Effect of ultrasound on G. sulfurreducens. To determine the level at which ultrasound
had an observable impact on the growth rate, cultures were grown at different power levels (4–
14 W). The higher power levels caused the temperature in the bottles to increase; however,
given that G. sulfurreducens is a thermotolerant species and does not lose viability when incu-
bated at up to 40 ˚C, growth was not negatively affected [39]. Moreover, the growth rate of G.
sulfurreducens was not significantly affected (Fig 7) even at higher power levels (12–14 W).
The pH of the cultures did not change significantly during growth, with fumarate being the
limiting factor for growth.
During fermentation, malate is formed from fumarate and is then consumed, along with
acetate, while succinate is produced. Fumarate and acetate consumption were similar in both
the sonicated and non-sonicated fermentations, with the sonicated samples exhibiting a
slightly increased rate during the first 5 h of fermentation. In contrast, succinate production
was nearly identical for both types of samples (Fig 7). At high power inputs, however, a signifi-
cantly higher malate concentration was obtained (11 mmol vs. 5 mmol) (Fig 8). This difference
was not recorded at lower power levels. Currently, the reason for this change is not clear but
could be ascribed to either a stress response related to a higher production of fumarase, or to
an increase in membrane permeability, which enhances the excretion of malate. Several studies
have shown an increase in permeability in a variety of cells resulting, for example, in higher
fermentation efficiency or improved efficacy of antibacterial substances [40 –41].
Effect of ultrasound on F. oxysporum. CGQ measurements at different input power lev-
els (0–12 W) indicated that, unlike G. sulfurreducens, growth and morphology of F. oxysporumwere more affected by ultrasonication. More specifically, input of 2–4 W did not affect fungal
growth, but input energy8 W had a negative effect on growth (Fig 9). This result was con-
firmed by measuring the dry cell weight (DCW) (S1 Fig), and calculating the specific growth
rate and doubling time (Fig 10).
Fig 6. Calorimetric measurements of different bottles, showing the linear relationship between temperature
increase and power level.
https://doi.org/10.1371/journal.pone.0229738.g006
PLOS ONE Novel sonobioreactor design for biological studies
PLOS ONE | https://doi.org/10.1371/journal.pone.0229738 March 11, 2020 10 / 19

Fig 7. Metabolic profile and growth of G. sulfurreducens grown in the presence of ultrasound at 14 W power input (dashed lines) or in its absence
(solid lines). Error bars represent standard deviations.
https://doi.org/10.1371/journal.pone.0229738.g007
Fig 8. Malate profile of G. sulfurreducens grown in the presence of ultrasound at 14 W power input (dashed lines) or in its absence (solid lines).
Error bars represent standard deviations.
https://doi.org/10.1371/journal.pone.0229738.g008
PLOS ONE Novel sonobioreactor design for biological studies
PLOS ONE | https://doi.org/10.1371/journal.pone.0229738 March 11, 2020 11 / 19
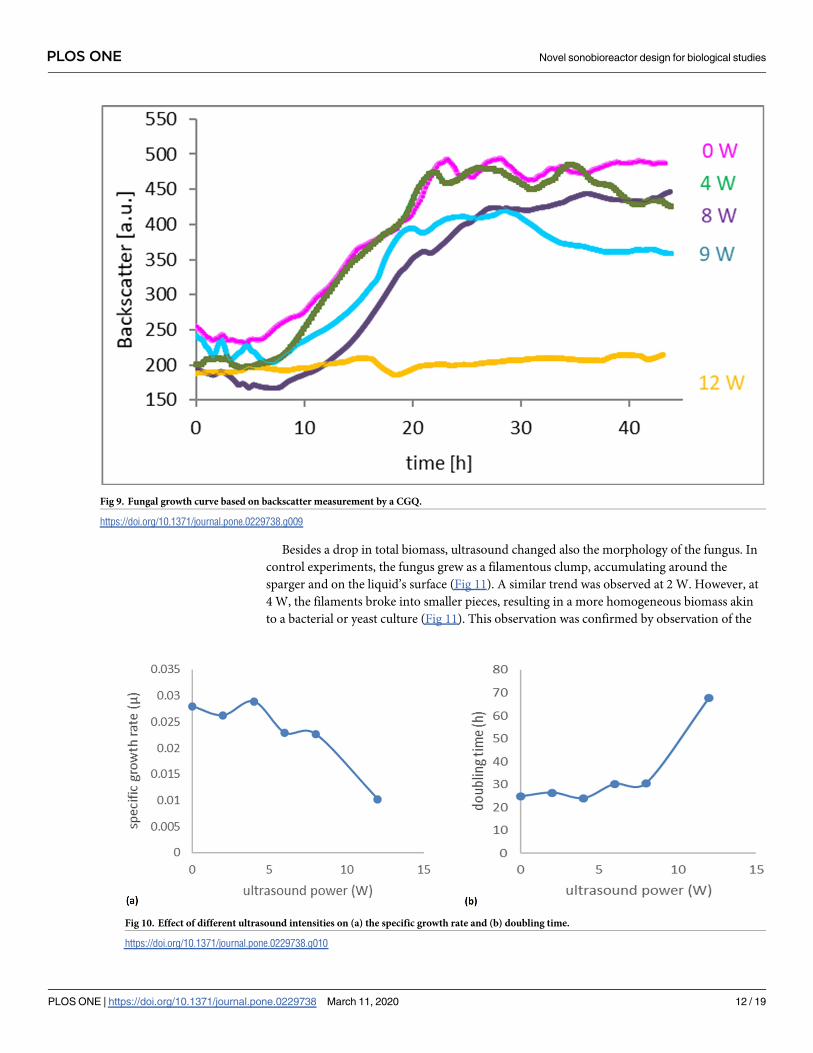
Besides a drop in total biomass, ultrasound changed also the morphology of the fungus. In
control experiments, the fungus grew as a filamentous clump, accumulating around the
sparger and on the liquid’s surface (Fig 11). A similar trend was observed at 2 W. However, at
4 W, the filaments broke into smaller pieces, resulting in a more homogeneous biomass akin
to a bacterial or yeast culture (Fig 11). This observation was confirmed by observation of the
Fig 9. Fungal growth curve based on backscatter measurement by a CGQ.
https://doi.org/10.1371/journal.pone.0229738.g009
Fig 10. Effect of different ultrasound intensities on (a) the specific growth rate and (b) doubling time.
https://doi.org/10.1371/journal.pone.0229738.g010
PLOS ONE Novel sonobioreactor design for biological studies
PLOS ONE | https://doi.org/10.1371/journal.pone.0229738 March 11, 2020 12 / 19

cells in a microscope (Fig 12). Furthermore, SEM revealed the mycelia to be disrupted and the
hyphae to be broken (Fig 13). These changes could be attributed to thermal and mechanical
effects. More specifically, during ultrasound exposure, small bubbles may be formed and col-
lapse as single bubbles or in a cloud, causing both an increase in temperature and shock waves
that disintegrate the mycelium [42]. Moreover, rapid changes in the spatial gradient of acoustic
intensity may create a radiation force that contributes to mycelial disintegration [43].
The observed morphological changes support the potential use of ultrasound as a morphol-
ogy-modifying factor without decreasing biomass yield, which can be of interest in submerged
fermentation where certain morphology types may interfere with bioreactor performance. Fil-
amentous fungi can be grown either as individual filaments or as pellets [44]. In the latter case,
the broth demonstrates Newtonian behavior, has lower viscosity, and allows better mass trans-
fer that improves oxygenation [45]. However, large pellets can also limit internal mass transfer,
decreasing product yield and promoting autolysis of cells in the central part of the pellet
[44,46,47]. We believe that ultrasound may limit autolysis by decreasing the size of the pellets
and improving nutrient and oxygen transfer. A correlation between fungal productivity and
certain morphological states has been documented for citric acid [48] and penicillin [49]. For
example, Trcihoderma ressei cellulase activity is controlled by the size of the mycelium and
amount of biomass [50]; whereas pellets of Aspergillus niger possess increased glucoamylase
activity and lower protease activity compared to the filamentous form [45]. Accordingly,
Fig 11. Morphological changes to F. oxysporum cultures resulting from increased ultrasound power.
https://doi.org/10.1371/journal.pone.0229738.g011
PLOS ONE Novel sonobioreactor design for biological studies
PLOS ONE | https://doi.org/10.1371/journal.pone.0229738 March 11, 2020 13 / 19

Fig 12. Micrographs of F. oxysporum at 100× magnification. (a) Control samples; (b) input power of 2 W; (c) input power of 4 W.
https://doi.org/10.1371/journal.pone.0229738.g012
PLOS ONE Novel sonobioreactor design for biological studies
PLOS ONE | https://doi.org/10.1371/journal.pone.0229738 March 11, 2020 14 / 19

besides optimizing medium composition, inoculum size, and agitation rate, controlled ultraso-
nication can serve to regulate cell morphology and production of desired products. In general,
ultrasound waves create a stressful environment for microbial cells, which can respond by pro-
ducing secondary metabolites of industrial importance. Previous studies have shown that low-
intensity ultrasound could help increase biomass, because it produces steady cavitation and
therefore forces microorganisms to actively produce the material required to repair damaged
Fig 13. SEM images of (a) untreated and (b) ultrasound-treated (4 W) F. oxysporum biomass at different magnifications.
https://doi.org/10.1371/journal.pone.0229738.g013
PLOS ONE Novel sonobioreactor design for biological studies
PLOS ONE | https://doi.org/10.1371/journal.pone.0229738 March 11, 2020 15 / 19

cells and continue proliferating [51]. However, higher ultrasound intensities lead to damage
that cannot be repaired and may cause microbial death [51]. Here, increasing the input power
to>8 W led to morphological changes and slower growth, which became even more profound
at 12 W. Both thermal and mechanical effects can explain deformation and death. Online tem-
perature curve analysis by CGQ at different power levels indicated an increase at 12 W (S2 Fig).
Ultrasonic waves can also be used to alter the physical properties of the environment and
favor growth of the microorganism. For example, ultrasonication can efficiently decrease the
size of hydrophobic substrates and increase their miscibility in the medium. This will make the
substrate more accessible to the microorganism [52].
Conclusion
In this study, a sonobioreactor was modeled, designed, and assembled. A sonotrode was opti-
mized, using a numerical model, to match the resonance frequency of a standard laboratory
bottle. This resulted in a sonobioreactor with a resonance frequency of approximately 40 kHz,
which was confirmed by physical models. The pressure in the sonobioreactor was symmetric
and centered along the bottle volume. Preliminary tests on two industrially important micro-
organisms showed that ultrasound intensity of the sonobioreactor could be controlled to alter
microbial growth and morphology. Sonication resulted in increased malate production by G.
sulfurreducens, but without affecting growth. In comparison, the morphology and growth of F.
oxysporum were more sensitive to ultrasound intensity. Despite considerable morphological
changes observed at 4 W input power, the growth was not adversely affected; however, at 12
W, growth was nearly halted. The designed sonobioreactor can be used in the future as a
sonoreactor to modify enzymatic reactions or substrate hydrophobicity.
Supporting information
S1 Table. Material properties of the bottle and sonotrode.
(TIF)
S1 Fig. Effect of ultrasound input power on growth of F. oxysporum measured in terms of
dry biomass. Error bars indicate the standard deviation.
(TIF)
S2 Fig. Online temperature measurement by CGQ in the presence of different ultrasound
input powers.
(TIF)
Author Contributions
Conceptualization: Orjan Johansson, Ulrika Rova, Paul Christakopoulos.
Data curation: Nasim Najjarzadeh, Adolf Krige, Taraka R. K. Pamidi.
Investigation: Nasim Najjarzadeh, Adolf Krige, Taraka R. K. Pamidi, Josefine Enman, Leoni-
das Matsakas.
Methodology: Paul Christakopoulos.
Supervision: Orjan Johansson, Josefine Enman, Leonidas Matsakas, Ulrika Rova, Paul
Christakopoulos.
Writing – original draft: Nasim Najjarzadeh, Adolf Krige, Taraka R. K. Pamidi.
Writing – review & editing: Leonidas Matsakas.
PLOS ONE Novel sonobioreactor design for biological studies
PLOS ONE | https://doi.org/10.1371/journal.pone.0229738 March 11, 2020 16 / 19

References1. Martini S, Martini S. Sonocrystallization of Fats. Sonocrystallization of Fats. New York, NY: Springer
New York; 2013. pp. 41–62. https://doi.org/10.1007/978-1-4614-7693-1_6
2. Mougin P, Wilkinson D, Roberts KJ, Tweedie R. Characterization of particle size and its distribution dur-
ing the crystallization of organic fine chemical products as measured in situ using ultrasonic attenuation
spectroscopy. J Acoust Soc Am. 2001; 109: 274–282. https://doi.org/10.1121/1.1331113
3. Erriu M, Blus C, Szmukler-Moncler S, Buogo S, Levi R, Barbato G, et al. Microbial biofilm modulation by
ultrasound: Current concepts and controversies. Ultrason Sonochem. 2014; 21: 15–22. https://doi.org/
10.1016/j.ultsonch.2013.05.011 PMID: 23751458
4. Kong Y, Peng Y, Zhang Z, Zhang M, Zhou Y, Duan Z. Removal of Microcystis aeruginosa by ultra-
sound: Inactivation mechanism and release of algal organic matter. Ultrason Sonochem. 2019; 56:
447–457. https://doi.org/10.1016/j.ultsonch.2019.04.017 PMID: 31101283
5. Mett H, Schacher B, Wegmann L. Ultrasonic disintegration of bacteria may lead to irreversible inactiva-
tion of β-lactamase. J Antimicrob Chemother. 1988; 22: 293–298. https://doi.org/10.1093/jac/22.3.293
PMID: 3141345
6. Bundhoo ZMA, Mohee R. Ultrasound-assisted biological conversion of biomass and waste materials to
biofuels: A review. Ultrason Sonochem. 2018; 40: 298–313. https://doi.org/10.1016/j.ultsonch.2017.07.
025 PMID: 28946428
7. Yang X, Li Y, Li S, Oladejo AO, Wang Y, Huang S, et al. Effects of ultrasound-assisted α-amylase deg-
radation treatment with multiple modes on the extraction of rice protein. Ultrason Sonochem. 2018; 40:
890–899. https://doi.org/10.1016/j.ultsonch.2017.08.028 PMID: 28946500
8. Francko DA, Al-Hamdani S, Joo GJ. Enhancement of nitrogen fixation in Anabaena flos-aquae (Cyano-
bacteria) via low-dose ultrasonic treatment. Journal of Applied Phycology. Kluwer Academic Publishers;
1994. https://doi.org/10.1007/BF02182398
9. Francko DA, Taylor S, Thomas B, Mclntosh Taylor DS, Kaw S. Kffectoflow-Dose Ultrasonic Treatment
on Physiological Variab[~S in Anabaena Flos-Aquae and Selenastrum Capricornutum [Internet]. Bio-
technology Letters. 1990. https://link.springer.com/content/pdf/10.1007%2FBF01026803
10. Chisti Y. Sonobioreactors: Using ultrasound for enhanced microbial productivity. Trends Biotechnol.
2003; 21: 89–93. https://doi.org/10.1016/s0167-7799(02)00033-1 PMID: 12573858
11. Wu J, Lin L. Elicitor-like effects of low-energy ultrasound on plant (Panax ginseng) cells: Induction of
plant defense responses and secondary metabolite production. Appl Microbiol Biotechnol. 2002; 59:
51–57. https://doi.org/10.1007/s00253-002-0971-2 PMID: 12073131
12. Batghare AH, Singh N, Moholkar VS. Bioresource Technology Investigations in ultrasound–induced
enhancement of astaxanthin production by wild strain Pha ffi a rhodozyma MTCC 7536. Bioresour
Technol. 2018; 254: 166–173. https://doi.org/10.1016/j.biortech.2018.01.073 PMID: 29413919
13. Vulfson EN, Sarney DB, Law BA. Enhancement of subtilisin-catalysed interesterification in organic sol-
vents by ultrasound irradiation. Enzyme Microb Technol. 1991; 13: 123–126. https://doi.org/10.1016/
0141-0229(91)90166-8
14. Almasi A, Mosavi A, Mohammadi M, Azemnia S, Godini K, Zarei A, et al. Efficiency of integrated ultra-
sonic and anaerobic digestion of oil refinery wastewater sludge. Glob Nest J. 2016; 18: 771–777.
15. Duan X, Zhou J, Qiao S, Wei H. Application of low intensity ultrasound to enhance the activity of ana-
mmox microbial consortium for nitrogen removal. Bioresour Technol. 2011; 102: 4290–4293. https://
doi.org/10.1016/j.biortech.2010.12.050 PMID: 21232945
16. Moholkar VS, Rekveld S, Warmoeskerken MMCG. Modeling of the acoustic pressure fields and the dis-
tribution of the cavitation phenomena in a dual frequency sonic processor. Ultrasonics. 2000; 38: 666–
670. https://doi.org/10.1016/s0041-624x(99)00204-8 PMID: 10829749
17. Kulkarni VM, Rathod VK. Mapping of an ultrasonic bath for ultrasound assisted extraction of mangiferin
from Mangifera indica leaves. Ultrason Sonochem. 2014; 21: 606–611. https://doi.org/10.1016/j.
ultsonch.2013.08.021 PMID: 24103364
18. Song A-X, Mao Y-H, Siu K-C, Wu J-Y. Bifidogenic effects of Cordyceps sinensis fungal exopolysacchar-
ide and konjac glucomannan after ultrasound and acid degradation. Int J Biol Macromol. 2018; 111:
587–594. https://doi.org/10.1016/j.ijbiomac.2018.01.052 PMID: 29339281
19. Racioppo A, Corbo MR, Piccoli C, Sinigaglia M, Speranza B, Bevilacqua A. Ultrasound attenuation of
lactobacilli and bifidobacteria: Effect on some technological and probiotic properties. Int J Food Micro-
biol. 2017; 243: 78–83. https://doi.org/10.1016/j.ijfoodmicro.2016.12.011 PMID: 28038333
20. Krige A, Sjoblom M, Ramser K, Christakopoulos P, Rova U. On-Line Raman Spectroscopic Study of
Cytochromes’ Redox State of Biofilms in Microbial Fuel Cells. Molecules. 2019; 24: 646. https://doi.org/
10.3390/molecules24030646 PMID: 30759821
PLOS ONE Novel sonobioreactor design for biological studies
PLOS ONE | https://doi.org/10.1371/journal.pone.0229738 March 11, 2020 17 / 19

21. Castro CJ, Goodwill JE, Rogers B, Henderson M, Butler CS. Deployment of the microbial fuel cell latrine
in Ghana for decentralized sanitation. J Water, Sanit Hyg Dev. 2014; 4: 663–671. https://doi.org/10.
2166/washdev.2014.020
22. Rosenbaum M a., Franks AE. Microbial catalysis in bioelectrochemical technologies: Status quo, chal-
lenges and perspectives. Appl Microbiol Biotechnol. 2014; 98: 509–518. https://doi.org/10.1007/
s00253-013-5396-6 PMID: 24270896
23. Jain A, Gazzola G, Panzera A, Zanoni M, Marsili E. Visible spectroelectrochemical characterization of
Geobacter sulfurreducens biofilms on optically transparent indium tin oxide electrode. Electrochim
Acta. 2011; 56: 10776–10785. https://doi.org/10.1016/J.ELECTACTA.2011.02.073
24. Mostert D, Molina AB, Daniells J, Fourie G, Hermanto C, Chao CP, et al. The distribution and host
range of the banana Fusarium wilt fungus, Fusarium oxysporum F. Sp. Cubense, in Asia. PLoS One.
2017; 12: 1–24. https://doi.org/10.1371/journal.pone.0181630 PMID: 28719631
25. Christakopoulos P, Kekos D, Kolisis FN, Macris BJ. Controlling simultaneous production of endogluca-
nase and beta-glucosidase by Fusarium oxysporum in submerged culture. Biotechnology Letters.
1995. https://doi.org/10.1007/BF00129023
26. Christakopoulos P, Mamma D, Nerinckx W, Kekos D, Macris B, Claeyssens M. Production and partial
characterization of xylanase from Fusarium oxysporum. Bioresour Technol. 1996; 58: 115–119. https://
doi.org/10.1016/S0960-8524(96)00091-0
27. Deshpande V, Keskar S, Mishra C, Rao M. Direct conversion of cellulose/hemicellulose to ethanol by Neu-
rospora crassa. Enzyme Microb Technol. 1986; 8: 149–152. https://doi.org/10.1016/0141-0229(86)90103-1
28. Mishra C, Keskar S, Rao M. Production and properties of extracellular endoxylanase from Neurospora
crassa. Applied and Environmental Microbiology. 1984.
29. COMSOL Multiphysics. Material Library. Manual. 2012; 66.
30. Kinsler Lawrence E., Frey Austin R., Alan B. Coppens JV sander. Fundamentals of acoustics. 4th Edi-
tio. John Wiley & Sons Inc. New York, United States; 2000.
31. Ikeda T. Fundamentals of piezoelectricity. Oxford University Press; 1990.
32. Comsol Ab. Acoustics Module. Interfaces (Providence). 2010; 214.
33. Comsol. Comsol Multiphysics User’s Guide. Equation-Based Model. 2012; 803–879, Equation-Based
Modeling.
34. Coppi M V, Leang C, Sandler SJ, Lovley DR. Development of a genetic system for Geobacter sulfurre-
ducens. Appl Environ Microbiol. 2001; 67: 3180–7. https://doi.org/10.1128/AEM.67.7.3180-3187.2001
PMID: 11425739
35. Reguera G, Nevin KP, Nicoll JS, Covalla SF, Woodard TL, Lovley DR. Biofilm and nanowire production
leads to increased current in Geobacter sulfurreducens fuel cells. Appl Environ Microbiol. 2006; 72:
7345–7348. https://doi.org/10.1128/AEM.01444-06 PMID: 16936064
36. Sjoblom M, Matsakas L, Christakopoulos P, Rova U. Production of butyric acid by Clostridium tyrobutyr-
icum (ATCC25755) using sweet sorghum stalks and beet molasses. Ind Crops Prod. 2015; 74: 535–
544. https://doi.org/10.1016/j.indcrop.2015.05.041
37. Horst C, Gogate PR, Pandit AB. Ultrasound Reactors. Modeling of Process Intensification. Weinheim,
Germany: Wiley-VCH Verlag GmbH & Co. KGaA; pp. 193–277. https://doi.org/10.1002/
9783527610600.ch8
38. Hussain MN, Janajreh I. Acousto-chemical analysis in multi-transducer sonochemical reactors for bio-
diesel production. Ultrason Sonochem. 2018; 40: 184–193. https://doi.org/10.1016/j.ultsonch.2017.07.
009 PMID: 28946413
39. Ragoonanan V, Malsam J, Bond DR, Aksan A. Roles of membrane structure and phase transition on
the hyperosmotic stress survival of Geobacter sulfurreducens. Biochim Biophys Acta—Biomembr.
2008; 1778: 2283–2290. https://doi.org/10.1016/j.bbamem.2008.06.006 PMID: 18602362
40. Moghimi R, Ghaderi L, Rafati H, Aliahmadi A, Mcclements DJ. Superior antibacterial activity of nanoe-
mulsion of Thymus daenensis essential oil against E. coli. Food Chem. 2016; 194: 410–415. https://doi.
org/10.1016/j.foodchem.2015.07.139 PMID: 26471573
41. Dai C, Xiong F, He R, Zhang W, Ma H. Effects of low-intensity ultrasound on the growth, cell membrane
permeability and ethanol tolerance of Saccharomyces cerevisiae. Ultrason Sonochem. 2017; 36: 191–
197. https://doi.org/10.1016/j.ultsonch.2016.11.035 PMID: 28069200
42. Ashokkumar M. The characterization of acoustic cavitation bubbles—An overview. Ultrason Sonochem.
2011; 18: 864–872. https://doi.org/10.1016/j.ultsonch.2010.11.016 PMID: 21172736
43. Sarvazyan AP, Rudenko O V, Nyborg WL. Biomedical Applications of Radiation Force of Ultrasound:
Historical Roots and Physical Basis. Ultrasound Med Biol. 2010; 36: 1379–1394. https://doi.org/10.
1016/j.ultrasmedbio.2010.05.015 PMID: 20800165
PLOS ONE Novel sonobioreactor design for biological studies
PLOS ONE | https://doi.org/10.1371/journal.pone.0229738 March 11, 2020 18 / 19

44. Zhang ZY, Jin B, Kelly JM. Production of lactic acid from renewable materials by Rhizopus fungi. Bio-
chem Eng J. 2007; 35: 251–263. https://doi.org/10.1016/j.bej.2007.01.028
45. Papagianni M, Moo-Young M. Protease secretion in glucoamylase producer Aspergillus niger cultures:
Fungal morphology and inoculum effects. Process Biochem. 2002; 37: 1271–1278. https://doi.org/10.
1016/S0032-9592(02)00002-X
46. CLARK DS. Submerged citric acid fermentation of ferrocyanide-treated beet molasses: morphology of
pellets of Aspergillus niger. Can J Microbiol. 1962; 8: 133–136. https://doi.org/10.1139/m62-017 PMID:
13879678
47. Pazouki M, Panda T. Understanding the morphology of fungi. Bioprocess Eng. 2000; 22: 127–143.
48. Bakhiet SEA, Al-Mokhtar EAI. Production of citric acid by Aspergillus niger using sugarcane molasses
as substrate. Jordan J Biol Sci. 2015; 8: 211–215.
49. Grosse HH. C. T. Calam, Process Development in Antibiotic Fermentations (Cambridge Studies in Bio-
technology 4) IX + 217 S., 44 Abb., 39 Tab. Cambridge–New–York–New Rochelle–Melbourne–Sydney
1987. Cambridge University Press. £ 30.00. ISBN: 0521304903. J Basic Microbiol. 1989; 29: 654–654.
https://doi.org/10.1002/jobm.3620291003
50. Ahamed A, Vermette P. Effect of culture medium composition on Trichoderma reesei’s morphology and
cellulase production. Bioresour Technol. 2009; 100: 5979–5987. https://doi.org/10.1016/j.biortech.
2009.02.070 PMID: 19592237
51. Huang G, Chen S, Dai C, Sun L, Sun W, Tang Y, et al. Effects of ultrasound on microbial growth and
enzyme activity. Ultrason Sonochem. 2017; 37: 144–149. https://doi.org/10.1016/j.ultsonch.2016.12.
018 PMID: 28427617
52. Patel A, Matsakas L. A comparative study on de novo and ex novo lipid fermentation by oleaginous
yeast using glucose and sonicated waste cooking oil. Ultrason Sonochem. 2019; 52: 364–374. https://
doi.org/10.1016/j.ultsonch.2018.12.010 PMID: 30559080
PLOS ONE Novel sonobioreactor design for biological studies
PLOS ONE | https://doi.org/10.1371/journal.pone.0229738 March 11, 2020 19 / 19


