
NUTRITIONAL POTENTIAL OF
PULP AND THE
ON SOME BIOCHEMICAL PARAMETERS IN ALBINO RATS
i
NKWOCHA, CHINELO (PG/Ph.D/10/57218)
NUTRITIONAL POTENTIAL OF SYNSEPALUM DULCIFICUM
PULP AND THE EFFECTOF THE METHANOLIC EXTRACT
ON SOME BIOCHEMICAL PARAMETERS IN ALBINO RATS
FACULTYL OF BIOLOGICAL SCIENCE
DEPARTMENT OF BIOCHEMISTRY
Omeje Ebere Digitally Signed by: Content manager’s Name DN : CN = Webmaster’s name O= University of Nigeria, Nsukka OU = Innovation Centre
SYNSEPALUM DULCIFICUM
OF THE METHANOLIC EXTRACT
ON SOME BIOCHEMICAL PARAMETERS IN ALBINO RATS
SCIENCE
DEPARTMENT OF BIOCHEMISTRY
Digitally Signed by: Content manager’s Name
DN : CN = Webmaster’s name
O= University of Nigeria, Nsukka
ii
NUTRITIONAL POTENTIAL OF SYNSEPALUM
DULCIFICUM PULP AND THE EFFECTOF THE
METHANOLIC EXTRACT ON SOME BIOCHEMICAL
PARAMETERS IN ALBINO RATS
A THESIS SUBMITTED IN PARTIAL FULFILMENT OF THE REQUIREMENTS FOR THE AWARD OF DEGREE OF DOCTOR OF PHILOSOPHY (Ph.D) IN NUTRITIONAL
BIOCHEMISTRY, UNIVERSITY OF NIGERIA, NSUKKA
BY
NKWOCHA, CHINELO (PG/Ph.D/10/57218)
DEPARTMENT OF BIOCHEMISTRY UNIVERSITY OF NIGERIA
NSUKKA
SUPERVISOR: PROF. OBI U. NJOKU
SEPTEMBER, 2014

iii
CERTIFICATION
Nkwocha, Chinelo, postgraduate student of the Department of Biochemistry with the Reg. No
PG/Ph.D/10/57218, has satisfactorily completed her requirements for research work for the
degree of Doctor of Philosophy (Ph.D) in Nutritional Biochemistry. The work embodied in this
project (thesis) is original and has not been submitted in part or full for any other diploma or
degree of this or any other university.
PROF. OBI U. NJOKU PROF. O. F. C. NWODO (Supervisor) (Head of Department) EXAMINER

iv
DEDICATION To the glory of God, this work is dedicated to my friend and husband, Dr Austine Akodinobi Nkwocha. May God continue to bless you.

v
ACKNOWLEDGEMENT
There is no duty as urgent as that of returning thanks. My utmost appreciation first of all
goes to the Almighty God, the creator of the universe who has shown me so much mercy and
favourthat I cannot just fathom. I acknowledged Him even before I started this work and He has
indeed directed my path towards the successful completion of this work. To Him be all the glory
now and ever, Amen.
I cannot fail to express my indebtedness to my friend and husband, Dr. Austine
Akodinobi Nkwocha. This acknowledgement can never be complete without a glowing tribute to
him. Your support and assistance cannot be over quantified. You were readily available to assist
and encourage me from the start to the finish, you were always a pillar of support. May God
continue to show you favour in all that you do. I will not be able to thank enough my sweet and
wonderful children, Esom and Chimdi, they cannot be left out in this acknowledgement. You
have added a lot of sunshine and glow to my life and have brought immeasurable pleasantness to
our home. And to my sister- in- law, Udoka who always took care of my children while I was
away doing this work, may you never lack helpers in your own time of need. I am sincerely
grateful.
My parents cannot be appreciated enough, Mr and Mrs N.E. Edokwe. You sacrificed so
much of your comfort and pleasure to ensure that I became someone in life. I can never, ever
forget your labour love. My siblings-Zigi, Luti and Facey and their spouses, Ifeatu, Amaka and
Doyin have been quite inspirational, caring and supportive. I owe a lot to your unparalled care
and love.
This project would never have been accomplished without the encouragement,
participation and advice of my hardworking supervisor, Prof. Obi U. Njoku. You were not only a
supervisor, you were a father and a mentor. You perfectly understood my peculiar situations and
did all within your reach to make my study a smooth one. There is no way I can thank you
enough for all your contributions towards the successful completion of this work. Your fatherly
interest and concern for my well-being, your encouragement, your openness and prompt
response to my problems and ever useful suggestions and most of all, understanding spirit, which
are worthy of emulation shall remain a landmark in my academic life.

vi
Well acknowledged is Prof. O.F.C. Nwodo, the Head Department of Biochemistry. Your
advice, assistance and interest were significant in this work and a motivating factor. You greatly
helped in moulding me and I owe the success of this work to you. Sir, may the good Lord whom
I serve always be with you.
At various stages of this work, the suggestions and contributions of Prof I.N.E. Onwurah,
Prof. L. U. S. Ezeanyika, Prof. F. C. Chilaka, Prof. P. N. Uzoegwu, Prof. E. O. Alumanah, Prof.
H. A. Onwuibiko, Dr. B.C. Nwanguma, Dr. S. O. Eze, Mr P. A. C. Egbuna, Dr. C. O. Enechi,
Dr. V. N. Ogugua, Dr. C. S. Ubani, Dr (Mrs) Chioma Anosike, Mrs U. O. Njoku, Dr. V. E.
Ozougwu and Mr O. E. Ikwuagwu were extremely valuable.
As I begin to remember some people whose assistance was significant in this work the
list keeps growing on and on.Worthy of mention is my lecturer and friend, Dr Parker Elijah
Joshua. It is only that great rewarder that will pay you for your assistance to me.
I will not conclude this expression of indebtedness without mentioning the assistance I
got from my friend and colleague, Mr Micheal Nwankwo who assisted me in obtaining the fruit I
used for this analysis from his village and Mr Alfred Ozioko who helped in identifying the plant.
I also appreciate my cousin Ekene Edokwe who was always in touch with me throughout the
programme.
To you all, I say, thank you and God bless

vii
ABSTRACT The nutritive and antinutritive compositions of S. dulcificum pulp were analysed to augment the available information on the anti-diabetic effect of the plant. Biochemical parameters like liver function enzymes (ALT, AST, ALP) and bilirubin concentrations,serum total protein, serum albumin and globulin, kidney function parameters (creatinine and urea concentrations), blood glucose, serum lipid profile and lipid peroxidation were determined in rats that were administered different concentrations of the methanolic extract to ascertain their effects. The internal organs (liver and kidney) were also removed and used for histopathological studies. From the result of the study, the proximate composition shows that S. dulcificum contains 7.75% protein, 59.55% moisture content, 4.36% ash, 6.24% crude fibre, 3.26% fat and 18.84% carbohydrate.The result of the mineral analysis shows that S.dulcificum pulp contains 100 mg/g calcium, 24.20 mg/g iron, 9.49 mg/g zinc, 6.22 mg/g copper, 0.01 mg/g chromium and 0.01 mg/g cobalt. Vitamin analyses shows that the S. dulcificum pulp contains 0.04% vitamin A, 22.69% vitamin C, 0.01% vitamin D and 0.02% vitamin K. Antinutrient analyses of the pulp show 5.67% oxalate, 0.03% phytates and 0.02% hemagglutanin. Amino acid profile shows that S.dulcificum pulp contains 8.055% tryptophan, 1.35% phenylalanine, 0.7% isoleucine, 0.5% tyrosine, 1.05% methionine, 0.4% proline, 0.69% valine, 1.1% threonine, 0.4% histidine, 0.5% alanine, 1.02% glutamine, 1.6% glutamic acid, 0.7% glycine, 0.3% serine, 1% arginine, 0.1% aspartic acid, 1.23% asparagine, 0.6% lysine and 0.6% leucine. Quantitative phytochemical analysis shows that the pulp contains 3.45% saponins, 57.01%`flavonoids, 7.12% tannins, 0.0001% alkaloids, 0.0001% glycosides, 0.0003% resins, 0.0002% terpenoids, 0.0001% steroids and 0.0003% cyanogenic glycosides.The results of the acute toxicity show that the methanol extract is not toxic to the mice at concentrations up to 5000mg/kg body weight. From the results obtained, the animals receiving 100mg/kg b.w of the methanolic extract showed significantly reduced (p<0.05) serum levels of glucose, bilirubin, low density lipoprotein cholesterol and ALT after the 14 day study compared to the 28 day study. However, no significant difference (p>0.05) was also observed across the groups in their serum ALP, AST, creatinine, urea, cholesterol, TAG, albumin and globulin levels on the 14th day compared with the 28th day. A significant difference (p<0.05) was observed in the malondaldehyde and serum protein concentrations in the 500mg/kg b.w test group while glucose concentration decreased significantly (p<0.05) in the 100mg/kg b.w and 500mg/kg b.w test group after the 14 day study compared with the 28 day study. High density lipoprotein cholesterol level significantly increased (p<0.05) in the 200mg/kg b.w test group. Histopathological examination shows normal liver architecture across the groups at 100mg/kg b.w, 200mg/kg b.w and 500mg/kg b.w. Kidney sections of rats showing normal glomerulus (G) and renal tubules (arrow) at same concentrations.
viii
TABLE OF CONTENTS
PAGE Title Page .. .. .. .. .. .. .. .. .. .. i Certification .. .. .. .. .. .. .. .. .. .. ii Dedication .. .. .. .. .. .. .. .. .. .. iii Acknowledgement .. .. .. .. .. .. .. .. .. iv Abstract .. .. .. .. .. .. .. .. .. .. vi Table of Contents .. .. .. .. .. .. .. .. .. vii List of Figures .. .. .. .. ... .. .. .. .. .. xiv List of Tables .. .. .. .. .. .. .. .. .. .. xvi List of Abbreviations .. .. .. .. .. .. .. .. .. xvii

ix
CHAPTER ONE: INTRODUCTION
1.1 Sweeteners … … … … … … … … … 2
1.1.1 Common Sweeteners and Their Production … … … … … 3
1.1.1.2 Natural Sweeteners … … … … … … … … 4
1.1.1.2.1 Honey … … … … … … … … … 4
1.1.1.2.2 Maple Syrup … … … … … … … … 5
1.1.1.2.3 Molasses … … … … … … … … … 5
1.1.1.2.4 Stevia … … … … … … … … … 5
1.1.1.2.5 Sucrose … … … … … … … … … 6
1.1.1.3 Artificial Sweeteners … … … … … … … … 7
1.2 Synsepalum dulcificum … … … … … … … 8
1.3 Nutrients … … … … … … … … … 11
1.3.1 Carbohydrates … … … … … … … … … 11
1.3.2 Proteins … … … … … … … … … 11
1.3.3 Fats … … … … … … … … … … 11
1.4 Phytochemicals … … … … … … … … 12
1.5 Antinutrients … … … … … … … … … 13
1.6 Vitamins … … … … … … … … … 14
1.6.1 VitaminA … … … … … … … … … 14
1.6.2 Vitamin C … … … … … … … … … 15
1.6.3 Vitamin D … … … … … … … … … 16
1.6.4 Vitamin E … … … … … … … … … 16
1.6.5 Vitamin K … … … … … … … … … 17
1.7 Antioxidant … … … … … … … … … 17
1.8 Some Minerals and Their Biological Functions … … … 18
1.8.1 Calcium (Ca) … … … … … … … … … 18
1.8.1.1 Metabolic Functions and Deficiency Symptoms of Calcium … ... … 18
1.8.2 Magnesium (Mg) … … … … … … … … 19
1.8.2.1 Metabolic Functions and Deficiency Symptoms of Magnesium … … 19
1.8.3 Zinc (Zn) … … … … … … … … … 19

x
1.8.3.1 Metabolic Functions and Deficiency Symptoms of Zinc … … … 19
1.8.4 Iron (Fe) … … … … … … … … … 20
1.8.4.1 Metabolic Functions and Deficiency Symptoms of Iron … … … 20
1.8.5 Copper (Cu) … … … … … … … … … 20
1.8.5.1 Metabolic Functions and Deficiency Symptoms of Copper … … … 21
1.9 Blood Glucose … … … … … … … … … 21
1.9.1 Blood Glucose Regulation … … … … … … … 22
1.10 Lipids … … … … … … … … … … 23
1.10.1 Lipoproteins: Types and Functions … … … … … … 23
1.10.1.1 Chylomicrons … … … … … … … … 24
1.10.1.2 Very Low Density Lipoprotein (VLDL) … … … … … 25
1.10.1.3 Low Density Lipoprotein (LDL) … … … … … … 25
1.10.1.3.1 Metabolism of Low Density Lipoprotein via LDL Receptor … … 25
1.10.1.3.2 Regulation of LDL Receptor … … … … … … 25
1.10.1.4 High Density Lipoprotein (HDL) … … … … … … 26
1.11 Total Cholesterol andCholesterol Balance in Tissues … … … 27
1.11.1 Diet and Cholesterol Regulation … … … … … … 29
1.12 Liver Function Biomarkers … … … … … … … 30
1.12.1 Alanine Aminotransferase … … … … … … … 30
1.12.2 Aspartate Aminotransferase … … … … … … … 31
1.12.3 Alkaline Phosphatase … … … … … … … … 32
1.12.4 Clinical and Diagnostic Significance of Liver Function Enzymes … … 32
1.12.5 Bilirubin … … … … … … … … … 33
1.12.6 Serum Protein… … … … … … … … … 34
1.12.7 Serum Albumin … … … … … … … … 35
1.13 Renal Function Biomarkers … … … … … … … 35
1.13.1 Blood Urea Nitrogen (BUN) … … … … … … … 35
1.13.2 Creatinine … … … … … … … … … 36
1.14 Lipid Peroxidation … … … … … … … … 36
1.14.1 Initiation … … … … … … … … … 37
1.14.2 Propagation … … … … … … … … … 37

xi
1.14.3 Termination … … … … … … … … … 38
1.14.4 Types of Lipid Peroxidation … … … … … … … 38
1.14.4.1 Non- Enzymatic Lipid Peroxidation … … … … … … 38
1.14.4.2 Enzymatic Lipid Peroxidation … … … … … … 41
1.15 Research Objectives … … … … … … … … 41
1.15.1 General Objectives … … … … … … … … 41
1.15.2 Specific Objectives … … … … … … … … 41

xii
CHAPTER TWO : MATERIALS AND METHODS
2.1 Materials … … … … … … … … … … 43
2.1.1 Plant materials … … … … … … … … … 43
2.1.2 Animals … … … … … … … … … … 43
2.1.3 Chemicals and Reagents … … … … … … … 43
2.1.4 Equipment /Instruments … … … … … … … 43
2.2 Methods … … … … … … … … … … 44
2.2.1 Experimental Design … … … … … … … … 44
2.2.2 Extraction of Plant Material … … … … … … … 44
2.2.3 Determination of the Extract Yield … … … … … … 45
2.2.4 Toxicological studies … … … … … … … … 45
2.2.4.1 Acute Toxicity Studies and Lethal Dose (LD50) Test … … … 45
2.2.5 Proximate Analysis … … … … … … … … 45
2.2.5.1 Moisture … … … … … … … … … 45
2.2.5.2 Crude Protein … … … … … … … … … 46
2.2.5.3 Crude Fat … … … … … … … … … 47
2.2.5.4 Crude Fibre … … … … … … … … … 48
2.2.5.5 Ash/Mineral Matter … … … … … … … 48
2.2.5.6 Carbohydrate or Nitrogen Free Extract (NFE) … … … … 49
2.2.6 Estimation of Vitamins … … … … … … … … 49
2.2.6.1 Determination of Vitamin A … … … … … … … 49
2.2.6.2 Determination of Vitamin C … … … … … … … 50
2.2.6.3 Determination of Vitamin D … … … … … … … 50
2.2.6.4 Determination of Vitamin E … … … … … … 51
2.2.6.5 Determination of Vitamin K … … … … … … … 51`
2.2.7 Determination of Mineral Content of S. dulcificum Pulp … … …… 51
2.2.7.1 Determination of Phosphorus … … … … … … … 52
2.2.8 Determination of Amino Acid Profile… … … … … … 52
2.2.8.1 Defatting of the Pulp … … … … … … … … 52
2.2.8.2 Hydrolysis of the Pulp … … … … … … … 53
xiii
2.2.8.3 Nitrogen Determination … … … … … … … 53
2.2.8.4 Loading of the Hydrolysate into TSM Analyzer… … … … … 54
2.2.8.5 Method of Calculating Amino Acid values using Chromatogram Peaks… … 54
2.2.9 Qualitative Phytochemical Studies on Synsepalum dulcificum Pulp … … 54
2.2.9.1 Test for Alkaloids … … … … … … … … 55
2.2.9.2 Test for Glycosides … … … … … … … … 55
2.2.9.3 Test for Cyanogenic Glycosides … … … … … … 55
2.2.9.4 Test for Tannins … … … … … … … … 55
2.2.9.5 Test for Saponins … … … … … … … … 55
2.2.9.6 Test for Flavonoids … … … … … … … … 56
2.2.9.7 Test for Resins … … … … … … … … 56
2.2.9.8 Test for Terpenoids and Steroids … … … … … … 56
2.2.10 Quantitative Phytochemical Analysis of S.dulcificum Pulp … … … 57
2.2.10.1 Determination of Alkaloids … … … … … … 57
2.2.10.2 Determination of Cyanogenic Glycosides … … … … 57
2.2.10.3 Determination of Saponins … … … … … … 58
2.2.10.4 Determination of Flavonoids … … … … … … 58
2.2.10.5 Determination of Tannins … … … … … … 59
2.2.10.6 Determination of Steroids … … … … … … 59
2.2.10.7 Determination of Terpenoids … … … … … … 60
2.2.11 Antinutrient Analysis of S. dulcificum Pulp … … … … … 60
2.2.11.1 Determination of Oxalates … … … … … … … 60
2.2.11.2 Determination of Phytates … … … … … … … 61
2.2.11.3 Determination of Haemagglutanins … … … … … 61
2.2.12 Blood Sample Collection for Biochemical Analysis … … … … 62
2.2.13 Biochemical Assays … … … … … … … … 62
2.2.13.1 Assay of Alanine Aminotransferase (ALT) Activity … … … 62
2.2.13.2 Assay of Aspartate Aminotransferase Activity … … … … 63
2.2.13.3 Assay of Alkaline Phosphatase (ALP) Activity … … … … 65
2.2.13.4 Determination of Bilirubin Concentration Using Colorimetric Method … 66
2.2.13.4.1 Determination of Total Bilirubin (TB) Concentration … … … 66

xiv
2.2.13.5 Total Serum Protein Assay … … … … … … 67
2.2.13.6 Serum Albumin Concentration … … … … … 68
2.2.13.7Creatinine … … … … … … … … … 69
2.2.13.8 Urea … … … … … … … … … … 70
2.2.13.9 Blood glucose Assay … … … … … … … 71
2.2.13.10 Estimation of Serum Lipid Concentrations … … … … 71
2.2.13.10.1 Estimation of Total Cholesterol Concentration … … … 71
2.2.13.10.2 Estimation of Low Density Lipoprotein-Cholesterol Concentration … 72
2.2.13.10.3 Estimation of High Density Lipoproteins (HDL)–Cholesterol Concentration
… … … … … … … … … … 74
2.2.13.10.4 Estimation of Triacylglycerol … … … … … 75
2.2.13.11 Estimation of Lipid Peroxidation … … … … … 76
2.2.14 Histopathological Examination … … … … … … 78
2.2.15 Statistical Analysis … … … … … … … … 80

xv
CHAPTER THREE: RESULTS
3.1 Proximate Composition of S. dulcificum Pulp … … … … 81
3.2 Mineral Composition of S. dulcificum Pulp … … … … … 82
3.3 Vitamin Content of S.dulcificum Pulp … … … … … 83
3.4 Amino Acid Profile of S. dulcificum Pulp … … … … … 84
3.5 Phytochemical Composition of S. dulcificum Pulp … … … … 85
3.6 Antinutritional Composition of S.dulcificum Pulp … … … … 86
3.7 Acute toxicity (LD50) Studies … … … … … … … 87
3.8 Mean Body Weights of Animals … … … … … … …… 88
3.9 Effect of S. dulcificumMethanolic Extract Administration on Alkaline Phosphatase (ALP) Activity in Rats … … … … … … … 89
3.10 Effect of S. dulcificumMethanolic Extract Administration on Alanine Aminotransferase (ALT) Activity in Rats … … … … … … … 91
3.11 Effect of S. dulcificumMethanolic Extract Administration on Aspartate Aminotransferase (AST) Activity in Rats … … … … … … 93
3.12 Effect of S. dulcificumMethanolic Extract Administration on Bilirubin levels in Rats … … … … … … … … … … … 95
3.13 Effect of S. dulcificumMethanolic Extract Administration on Total Serum Protein concentration in rats… … … … … … … … 97
3.14 Effect of S. dulcificumMethanolic Extract Administration on Serum Albumin Concentration in Rats… … … … … … … … 99
3.15 Effect of S. dulcificumMethanolic Extract Administration on Serum Globulinin Rats
… … … … … … … … … … 101
3.16 Effect of S. dulcificumMethanolic Extract Administration on Creatinine Level in Rats … … … … … … … … … … … 103
3.17 Effect of S. dulcificumMethanolic Extract Administration on Urea Level in Rats … … … … … … … … … … … 105
3.18 Effect of S. dulcificumMethanolic Extract Administration on Blood Glucose Concentration in Rats … … … … … … … … 107
3.19 Effect of S. dulcificumMethanolic Extract Administration on Cholesterol Concentration in Rats … … … … … … … … … … 109
3.20 Effect of S. dulcificumMethanolic Extract Administration on High Density Lipoprotein Cholesterol Concentration in Rats … … … … … … 111
3.21 Effect of S. dulcificumMethanolic Extract Administration on Low Density Lipoprotein Cholesterol Concentration in Rats … … … … … … 113
3.22 Effect of S. dulcificumMethanolic Extract Administration on Triacylglycerol Concentration in Rats … … … … … … … … 115

xvi
3.23 Effect of S. dulcificumMethanolic Extract Administration on Malondialdehyde Concentration in Rats … … … … … … … … 117
3.24 Effect of S. dulcificumMethanol Extract Administration on the Histopathology of Rat Liver [14 days duration] … … … … … … … 119
3.25 Effect of S. dulcificumMethanol Extract Administration on the Histopathology of Rat Liver [28 days duration] … … … … … … … 121
3.26 Effect of S. dulcificumMethanol Extract Administration on the Histopathology of Rat Kidney [14 days duration]… … … … … … … … 123
3.27 Effect of S. dulcificumMethanol Extract Administration on the Histopathology of Rat
Kidney [28 days duration] … … … … … … … 125

xvii
CHAPTER FOUR: DISCUSSION
4.1 Discussion … … … … … … … … 126
4.2 Conclusion … … … … … … … … 138
4.3 Suggestions For Further Studies … … … … … … 139
REFERENCES … … … … … … … … 140
APPENDICES … … … … … … … … 155
xviii
LIST OF FIGURES
Figure 1 Structure of Sucrose … … … … … … … 6
Figure 2 Syvsepalum dulcificum Fruit … … … … … … 10
Figure 3 Synsepalum dulcificum Tree … … … … … … 10
Figure 4 Structure of Cholesterol … … … … … … 29
Figure 5 Mechanism of Non-Enzymatic Lipid Peroxidation… … … 40
Figure 6 Proximate Composition of S. dulcificum Pulp … … … 81
Figure 7 Amino Acid Analyses of S. dulcificum Pulp … … … … 84
Figure 8: Effect of S.dulcificum Methanolic Extract Administration on Alkaline phosphatase Activity in Rat … … … … … …… 90
Figure 9 Effect of S.dulcificum Methanolic Extract Administration on Alanine
Aminotransferase Activity in Rat … … … … 92
Figure 10 Effect of S.dulcificum Methanolic Extract Administration on Aspartate
Aminotransferase Activity in Rat … … … … … 94
Figure 11 Effect of S.dulcificum Methanolic Extract Administration on Bilirubin
Concentration in Rat … … … … … … … 96
Figure 12 Effect of S.dulcificum Methanolic Extract Administration on Total Serum Protein
in Rat… … … … … … … … … 98
Figure 13 Effect of S.dulcificum Methanolic Extract Administration on Serum Albumin in
Rat … … … … … … … … … 100
Figure 14 Effect of S.dulcificum Methanolic Extract Administration on Serum Globulin in
Rat… … … … … … … … … … 102
Figure 15 Effect of S.dulcificum Methanolic Extract Administration on Creatinine Level in
rat … … … … … … … … … … 104
Figure 16 Effect of S.dulcificum Methanolic Extract Administration on Urea Level in Rat
… … … … … … … … … … 106
Figure 17 Effect of S.dulcificum Methanolic Extract Administration on Blood Glucose
Concentration in Rat … … … … … … … 108
Figure 18 Effect of S.dulcificum Methanolic Extract Administration on Total Cholesterol in
Rat… … … … … … … … … … 110

xix
Figure 19 Effect of S.dulcificum Methanolic Extract Administration on High-Density Lipoprotein Cholesterol Concentration in Rat … … … 112
Figure 20 Effect of S.dulcificum Methanolic Extract Administration on Low-Density
Lipoprotein Cholesterol Concentration in Rat … … … 114
Figure 21 Effect of S.dulcificum Methanolic Extract Administration on Triacylglycerol
Concentration in Rat … … … … … … … 116
Figure 22 Effect of S.dulcificum Methanolic Extract Administration on Malondialdehyde
Concentration in Rat … … … … … … … 118
Figure 23 Photomicrograph of Liver Sections of Rats 14 days Post Administration With
S.dulcificum Methanolic Extract … … … … 119
Figure 24 Photomicrograph of Liver Sections of Rats 28 days Post Administration With
S.dulcificum Methanolic Extract … … … … … 120
Figure 25 Photomicrograph of Kidney Sections of Rats 14 days Post Administration With
S.dulcificum Methanolic Extract … … … … … … 121
Figure 26 Photomicrograph of Kidney Sections of Rats 28 days Post Administration With
S.dulcificum Methanolic Extract … … … … … 122
xx
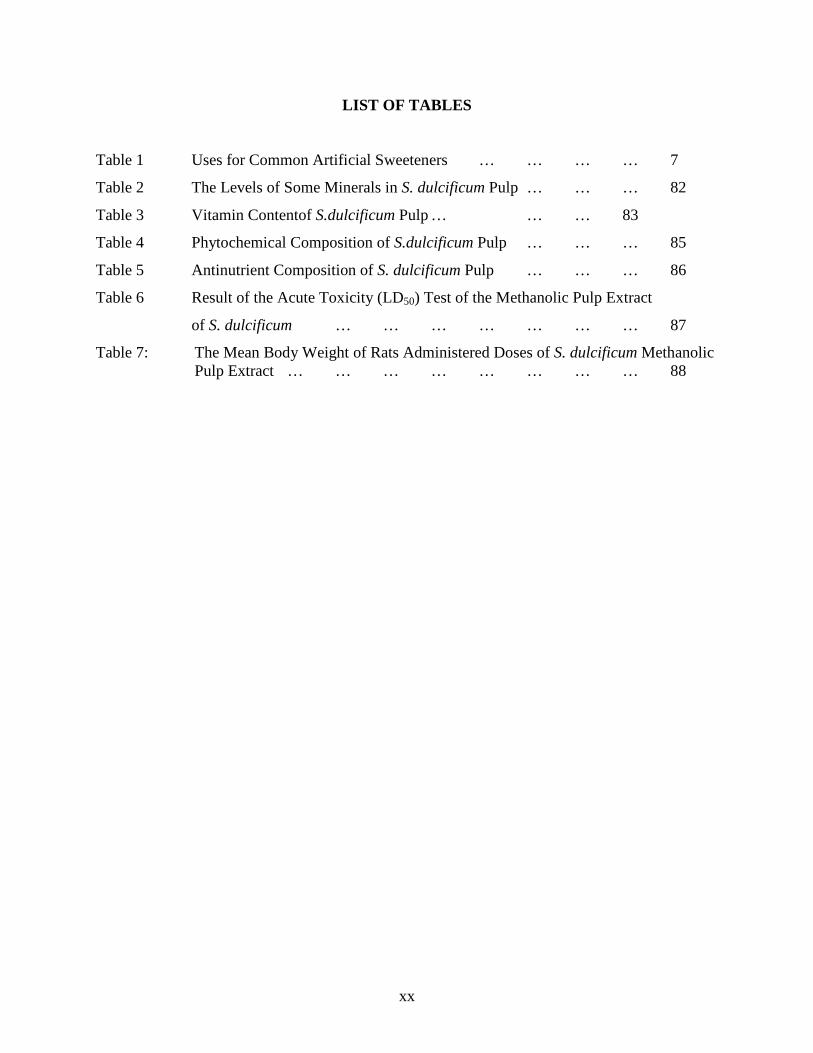
LIST OF TABLES
Table 1 Uses for Common Artificial Sweeteners … … … … 7
Table 2 The Levels of Some Minerals in S. dulcificum Pulp … … … 82
Table 3 Vitamin Contentof S.dulcificum Pulp … … … 83
Table 4 Phytochemical Composition of S.dulcificum Pulp … … … 85
Table 5 Antinutrient Composition of S. dulcificum Pulp … … … 86
Table 6 Result of the Acute Toxicity (LD50) Test of the Methanolic Pulp Extract
of S. dulcificum … … … … … … … 87
Table 7: The Mean Body Weight of Rats Administered Doses of S. dulcificum Methanolic Pulp Extract … … … … … … … … 88

xxi
LIST OF ABBREVIATIONS
ALP Alkaline phosphatase
ALT Alanine aminotransferase
AST Aspartate aminotransferase
BUN Blood urea nitrogen
cAmp Cyclic adenosine monophosphate
DNA Deoxyribonucleic acid
FAO Food and agriculture organisation
FDA Food and drug administration
GFR Glomerular filtration rate
GOT Glutamate oxaloacetate transaminase
GPT Glutamate pyruvate transaminase
HDL High density lipoprotein
IU/L International units per litre
LCAT Lecithin-cholesterol acyl transferase
LDL Low density lipoprotein
MDA Malondialdehyde
NFE Nitrogen free extract
PBM Peak Bone Mass
P.O Per oral
PUFA Polyunsaturated fatty acid
ROS Reactive oxygen species
SGPT Serum glutamate pyruvate transaminase
SGOT Serum glutamate oxaloacetate transaminase
TAG Triacylglycerol
RNA Ribonucleic acid
VLDL Very low density liporotein

xxii
CHAPTER ONE
INTRODUCTION
The worsening food crisis and the consequent widespread prevalence of malnutrition in
developing and under-developed countries have resulted in high mortality and morbidity rates,
especially among infants and children in low-income groups (Enujiugba and Akanbi, 2005).
Food has been defined as any substance containing primarily carbohydrates, fats, water, protein,
vitamins and minerals that can be taken by an animal or human to meet its nutritional needs and
sometimes for pleasure. Items considered as food may be sourced from plants, animals or
fungus as well as fermented products like alcohol. Food is also anything solid or liquid that has
a chemical composition which enables it provide the body with the material from which it can
produce heat or any form of energy, provide material to allow for growth, maintenance, repair
or reproduction to proceed and supply substances, which normally regulate the production of
energy or the process of growth, repair or reproduction. Food is therefore, the most basic
necessity of life (Turner, 2006).
Nutrition is the science that deals with all the various factors of which food is composed
and the way in which proper nourishment is brought about. The average nutritional
requirements of groups of people are fixed and depend on such measurable characteristics as
age, sex, height, weight, degree of activity and rate of growth. Good nutrition requires a
satisfactory diet which is capable of supporting the individual consuming it, in a state of good
health by providing the desired nutrients in required amounts. It must provide the right amount
of nutrients and fuel to execute normal physical activity. If the total amount of nutrients
provided in the diet is insufficient, a state of under- nutrition develops.
Plants are primary sources of medicines, food, shelters and other items used by humans
everyday. Their roots, stems, leaves, flowers, fruits and seeds provide for humans (Amaechi,
2009; Hemingsway, 2004). Fruits are sources of minerals, fibre and vitamins which also
provide essential nutrients for the human health (Anaka et al., 2009). Some fruits are also
known to have antinutritional factors such as phytate and tannins,that can diminish the nutrient
bioavailability if they are present at high concentrations (Baum, 2007). It has been reported that
these anti-nutritional factors could also help in the treatment and prevention of certain

xxiii
important diseases like the anti-carcinogenic activities reported for phytic acid which has been
demonstrated both invivo and invitro (Anaka et al., 2009).
The reliance on starchy roots and tubers and certain cereals as main staples result in
consumption of non-nutritious foods. The insufficient availability of nutrient rich diets and the
high cost of available ones have prompted an intense research into harnessing the potentials of
the lesser known and underutilized crops, which are potentially valuable for human and animal
foods to maintain a balance between population and agricultural productivity, particularly in the
tropical and sub-tropical areas of the world. The challenge of improper nutrition especially in
developing countries which include Nigeria, is indeed alarming. The World Health
Organization (WHO, 2007) reported that poor nutrition contributes to one out of two deaths
associated with infectious diseases among children within five yearsand the aged. Poor diet can
have an injurious impact on health, causing deficiency diseases such as scurvy, beriberi and
kwashiokor, health-threatening conditions such as obesity, metabolic syndrome, and such
common other diseases as cardiovascular diseases, diabetes and osteoporosis. Under-nutrition
among pregnant women in developing countries leads to one out of six infants being born with
low birth weight, which is a risk factor for neonatal deaths, learning disabilities, mental
retardation, poor health and premature death. One out of three people in developing countries is
affected by vitamin and mineral deficiencies making them prone to infectious diseases and
impaired psycho intellectual development. Under and chronic nutrition problems and diet
related chronic diseases account for more than half of the world’s diseases (WHO, 2007). In
most of these side effects or diseases, the biochemical and haematological parameters are
usually altered. For a food to be considered safe for human and animal consumption, its effect
on these parameters need to be investigated to understand the nutritional potentials and safety of
such foods with a view to determining their acceptability.
1.1 Sweeteners
Sweeteners are food additives that are used to improve the taste of everyday foods. Natural
sweeteners are sweet-tasting compounds with some nutritional value; the major ingredient of
natural sweeteners is either mono- or disaccharides. Artificial sweeteners, on the other hand, are
compounds that have very little or no nutritional value. This is possible because artificial
sweeteners are synthesized compounds that have high-intensities of sweetness, meaning less of

xxiv
the compound is necessary to achieve the same amount of sweetness. Artificial sweeteners are
used in products intended to limit caloric intake or prevent dental cavities. Sugar alcohols are
natural compounds with varying degrees of sweetness which are often added to boost or fine
tune flavours of products while increasing their sweetness. They are often used in conjuncture
with natural or artificial sweeteners in order to achieve a desired degree of sweetness, taste or
texture. Sugar alcohols typically provide some amount of nutrition but have other benefits such
as not affecting insulin response or promoting tooth decay which makes them a popular
sweetening choice.
1.1.1 Common Sweeteners and Their Production
A sugar substitute is a food additive that replicates the effect of sugar in taste, but usually has
less food energy. Some sugar substitutes are natural while others are synthetic, those that are not
natural are referred to as artificial sweeteners (Mattes and Popkin, 2009). An important class of
sugar substitutes is known as high-intensity sweeteners. These are compounds with sweetness
that is many times that of sucrose, a common table sugar. As a result, much less sweetener is
required, and energy contribution often negligible. The sensation of sweetness caused by these
compounds is sometimes notably different from sucrose, so they are often used in complex
mixtures that achieve the most natural sweet sensation. This may be seen in soft drinks labelled
as "diet" or "light"; they contain artificial sweeteners and often have notably different mouth feel.
In the United States, six intensely-sweet sugar substitutes have been approved for use (Mattes
and Popkin, 2009). They are saccharin, aspartame, sucralose, neotame, acesulfame potassium,
and stevia. The US Food and Drug Administration regulates artificial sweeteners as food
additives. The majority of sugar substitutes approved for food use are artificially-synthesized
compounds. However, some bulk natural sugar substitutes are known, including sorbitol and
xylitol, which are found in berries, fruit, vegetables and mushrooms (Mattes and Popkin, 2009).
Some non-sugar sweeteners are polyols, also known as "sugar alcohols." These are, in general,
less sweet than sucrose, but have similar bulk properties and can be used in a wide range of food
products. Sometimes the sweetness profile is 'fine-tuned' by mixing high-intensity sweeteners.
As with all food products, the development of a formulation to replace sucrose is a complex
proprietary process.
xxv
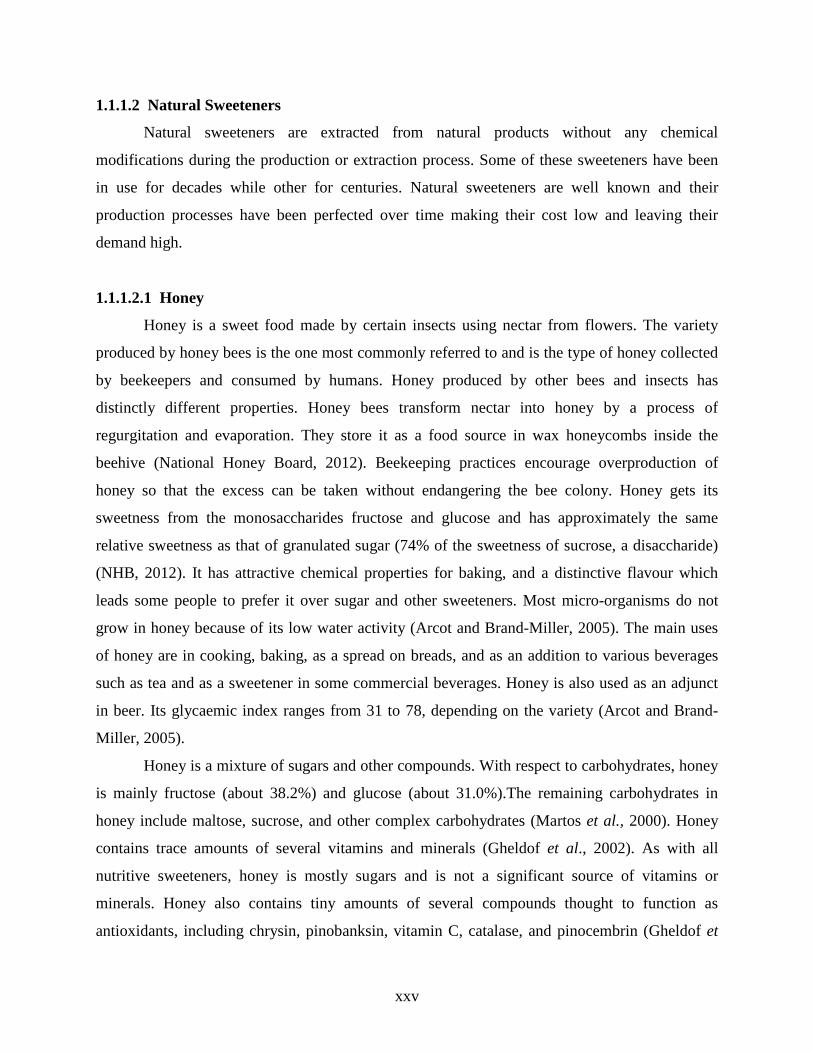
1.1.1.2 Natural Sweeteners
Natural sweeteners are extracted from natural products without any chemical
modifications during the production or extraction process. Some of these sweeteners have been
in use for decades while other for centuries. Natural sweeteners are well known and their
production processes have been perfected over time making their cost low and leaving their
demand high.
1.1.1.2.1 Honey
Honey is a sweet food made by certain insects using nectar from flowers. The variety
produced by honey bees is the one most commonly referred to and is the type of honey collected
by beekeepers and consumed by humans. Honey produced by other bees and insects has
distinctly different properties. Honey bees transform nectar into honey by a process of
regurgitation and evaporation. They store it as a food source in wax honeycombs inside the
beehive (National Honey Board, 2012). Beekeeping practices encourage overproduction of
honey so that the excess can be taken without endangering the bee colony. Honey gets its
sweetness from the monosaccharides fructose and glucose and has approximately the same
relative sweetness as that of granulated sugar (74% of the sweetness of sucrose, a disaccharide)
(NHB, 2012). It has attractive chemical properties for baking, and a distinctive flavour which
leads some people to prefer it over sugar and other sweeteners. Most micro-organisms do not
grow in honey because of its low water activity (Arcot and Brand-Miller, 2005). The main uses
of honey are in cooking, baking, as a spread on breads, and as an addition to various beverages
such as tea and as a sweetener in some commercial beverages. Honey is also used as an adjunct
in beer. Its glycaemic index ranges from 31 to 78, depending on the variety (Arcot and Brand-
Miller, 2005).
Honey is a mixture of sugars and other compounds. With respect to carbohydrates, honey
is mainly fructose (about 38.2%) and glucose (about 31.0%).The remaining carbohydrates in
honey include maltose, sucrose, and other complex carbohydrates (Martos et al., 2000). Honey
contains trace amounts of several vitamins and minerals (Gheldof et al., 2002). As with all
nutritive sweeteners, honey is mostly sugars and is not a significant source of vitamins or
minerals. Honey also contains tiny amounts of several compounds thought to function as
antioxidants, including chrysin, pinobanksin, vitamin C, catalase, and pinocembrin (Gheldof et

xxvi
al., 2002). The specific composition of any batch of honey depends on the flowers available to
the bees that produce the honey. A typical honey analysis shows the following: fructose: 38.2%,
glucose: 31.0%, sucrose: 1.5%, maltose: 7.2%, water: 17.1%, higher sugars: 1.5%, ash: 0.2%.
Honey has a density of about 1.36 kg/L (36% denser than water) (NHB, 2012). The pH of honey
is between 3.2 and 4.5. This relatively acidic pH level prevents the growth of many bacteria
(Arcot and Brand-Miller, 2005).
1.1.1.2.2 Maple Syrup
Maple syrup is a sweetener made from the sap of some maple trees. In cold climate areas,
these trees store sugar in their roots before the winter and the sap which rises in the spring can be
tapped and concentrated (Ball, 2007). The sap has only 3 to 5% total solids, consisting mainly of
sucrose. Other components of the maple syrup include organic acids (primarily malic acid) and
minerals (potassium and calcium), amino compounds (trace) and vitamins (trace). Maple Syrup
has about the same 50 cal/tbsp as white cane sugar. However, it also contains significant
amounts of potassium (35 mg/tbsp), calcium (21 mg/tbsp), small amounts of iron and
phosphorus, and trace amounts of β- complex vitamins. Its sodium content is as low as 2
mg/tbsp. The sugar content of sap averages 2.5% and the sugar content of syrup averages 66.5%
(Ball, 2007).
1.1.1.2.3 Molasses
Molasses is a viscous byproduct of sugar cane or sugar beets processing into sugar. The
quality of molasses depends on the maturity of the sugar cane or sugar beet, the amount of sugar
extracted, and the method of extraction exployed (Taubes, 2011). Molasses has the molecular
formula C6H12NNaO3S, molecular weight of 201.22 g/mol, and a density of 1.41 g/cm3 (Taubes,
2011). A typical composition of molasses shows the following substances: sucrose 35.9 %,
fructose 5.6 %, nitrogen 1.01 %, reducing substances 11.5 %, glucose 2.6 %, and sulfur 0.78 %
(Taubes, 2011).
1.1.1.2.4 Stevia
Stevia is one of the newest sweeteners available in the market. It has been known since
1899 for its sweet taste and has been cultivated in Japan since 1970. It was not until recently that

xxvii
a safe and successful extraction of glycosides (the chemical in the Stevia plant which gives it a
sweet taste) allowed for the Food and Drug Administration (FDA) to approve Stevia as a general
sweetener (Raji and Mohamed, 2012). Stevia is also known under different trade names as
TruViaand PureVia patents by Coca Cola and Pepsi(Raji and Mohamed, 2012). Many different
forms of Stevia as sweeteners exist such as: Reb A, B, C, D, Rebiana, Stevioside,
SunCrystalsand Enliten. Each has a small variation in the manufacturing process or how it is
used.
Stevia is an all natural sweetener because it is extracted from the Stevia plant and
undergoes no chemical changes in the manufacturing process. This makes it very desirable to
many consumers looking for healthy alternatives to sucrose sugar. Stevia is a general term
referring to a plant, Steviarebaudiana (Bertoni), native to Paraguay. The plant contains a number
of diterpene glycosides that taste sweet; the main ones are stevioside and rebaudioside A. These
glycosides are 200 and 300 times sweeter than sucrose respectively (Mattes and Popkin, 2009).
1.1.1.2.5 Sucrose
Sucrose is a disaccharide, formed from the monosaccharides glucose and fructose. It is
the organic compound commonly known as table sugar and sometimes called saccharose.It has
the molecular formula C12H22O11 and a molecular weight of 342.30 g/mol. In sucrose, the
component sugars glucose and fructose are linked via an α (alpha) 1 on the glucose, to a β (beta)
2 on the fructose glycosidic linkage.
Sucrose forms a major element in confectionery and desserts. Cooks use it for
sweetening, its fructose component which has almost double the sweetness of glucose makes
sucrose distinctively sweet in comparison to other carbohydrate foods (Taubes, 2011). It can also
act as a food preservative when used in sufficient concentrations. It is a common ingredient in
many processed and junk foods.

xxviii
Fig 1: Structure of sucrose (Stryer, 1995) 1.1.1.3 Artificial Sweeteners Table 1: Uses for common artificial sweeteners
Source:(http://www.jigsawhealth.com/resources/artificial-sweetner).Retrieved 5/14/2013 5:03pm
Chemical Name
Trade Names Sweetness Uses
Acesulfame Sweet One® Sunett®
200 times sweeter than sugar
Found in more than 4,000 productsincluding candies, tabletop sweeteners, chewing gums, beverages, dessert and dairyproduct mixes, baked goods,alcoholic beverages, syrups, refrigerated and frozen desserts,and sweet sauces and toppings.
Aspartame Equal® NutraSweet® NatraTaste®
180 times sweeter than sugar
Found in more than 6,000 productsincluding carbonated powderedsoft drinks, chewing gum, confections, gelatins, dessertmixes, puddings and fillings, frozendesserts, yoghurt, tabletop sweeteners, and somepharmaceuticals.
Neotame None yet 8,000-13,000 times sweeter than sugar
Approved for use in beveragesdairy products, frozen desserts,baked goods, and gums.
Saccharin Sweet N Low® 300-700times sweeter than sugar
Fountain Diet Coke® and pepsi®,Tab®, and often mixed withaspartame.
Sucralose Splenda® 600 times sweeter than sugar
Found in everything from frozendesserts, cookies, gum, sodas,candies. Can also be used forbaking.

xxix
Artificial sweeteners are derived from chemical synthesis of organic compounds which
may or may not be found in nature. They are relatively new and their uses are being researched
and extended every day. Much controversy surrounds artificial sweeteners and their health
effects as they may break down into harmful chemical sub-compounds. New artificial sweeteners
are always being researched and due to their low cost and ease of production, they will likely
become the primary sweetening compounds in the future (Mattes and Popkin, 2009).
1.2 Synsepalum dulcificum
Synsepalum dulcificumis a shrub that grows up to 6.1m high in its native habitat but does
not usually grow higher than 10ft (3.048m) in cultivation (Wiersema and Leon, 1999).Its leaves
are 5-10cm long, 2-3.7cm wide and glabrous below. They are clustered at the end of the
branchlets. It is an evergreen plant that produces small orange fruits (Duke and Ducellier, 1993).
The seeds are about the same size as coffee beans (fig. 2). The plant is also known as
Richardelladulcificum (old name), miracle fruit, magic fruit, miraculous or flavor fruit (Duke
and Ducellier,1993). The miracle fruit plant (Synsepalum dulcificum) produces fruits or berries
that, when eaten, causes sour foods (including lime and lemon) consumed later to taste sweet
(fig. 3) (Joseph et al., 2009). The fruit was first documented by explorer Chevalier des Marchais
who searched for many different foods during a 1725 excursion to its native West Africa
(Roecklin and Leung, 1987). Marchais noticed that local tribes picked the fruit from shrubs and
chewed it before meals.
The berry contains an active glycoprotein molecule, with some trailing carbohydrate
chain called miraculin (Forester and Waterhouse, 2009). When the fleshy part of the fruit is
eaten, the molecule binds to the tongue’s taste buds, causing sour foods to taste sweet. While the
exact cause of this change is unknown, one theory is that the glycoprotein, miraculin works by
distorting the shape of sweetness receptors so that they become responsive to acids, instead of
sugar and other sweet things (Duke and Ducellier,1993).This effect can last for 10min-2hr
(Joseph et al.,2009).
In Africa, S. dulcificum leaves are attacked by lepidopterous larvae and fruits are infested
with larvae of fruit flies. A fungus which has been found on this plant is microporous (Duke and
Ducellier, 1993). In tropical West Africa where this specie originates, the fruit pulp is used to
sweeten palmwine (Joseph et al., 2009). Attempts have been made to make a commercial
xxx
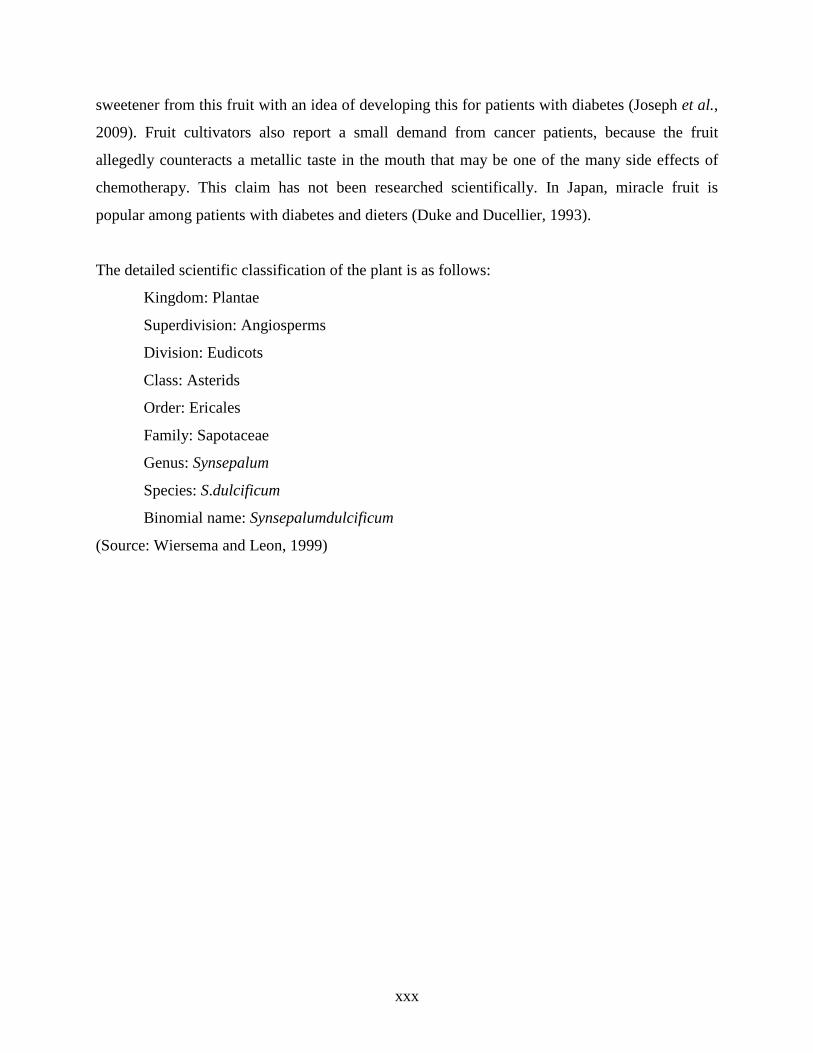
sweetener from this fruit with an idea of developing this for patients with diabetes (Joseph et al.,
2009). Fruit cultivators also report a small demand from cancer patients, because the fruit
allegedly counteracts a metallic taste in the mouth that may be one of the many side effects of
chemotherapy. This claim has not been researched scientifically. In Japan, miracle fruit is
popular among patients with diabetes and dieters (Duke and Ducellier, 1993).
The detailed scientific classification of the plant is as follows:
Kingdom: Plantae
Superdivision: Angiosperms
Division: Eudicots
Class: Asterids
Order: Ericales
Family: Sapotaceae
Genus: Synsepalum
Species: S.dulcificum
Binomial name: Synsepalumdulcificum
(Source: Wiersema and Leon, 1999)

xxxi
Fig. 2: Synsepalum dulcificum fruit (taken at source)
Fig. 3: Synsepalum dulcificum tree (taken at source)

xxxii
1.3 Nutrients
A nutrient is any substance that is assimilated by an organism to promote growth (Harper,
1999). Nutrients consist of various chemical substances in the foods that make up each diet.
Many nutrients are essential for life and an adequate amount of the nutrients in the diet is
necessary for providing energy, building and maintaining of the body organs and for various
metabolic processes (Morrison and Mark, 1999). There are six major classes of nutrients found
in the food: carbohydrate, protein, fats, vitamins (both fat soluble and water soluble), mineral and
water.
1.3.1 Carbohydrates
Carbohydrates are one of the main dietary components of food. This category of foods
includes sugars, starches and fibres. Carbohydrates are important in the body as sources of
energy. They can be found in a wide range of plant and animal food sources. In plants, they are
generally end products of photosynthesis- the process in which plants convert carbondioxide and
water into simple sugars such as glucose. In foods, carbohydrates are important for adding
flavour, texture and colour (Harper, 1999).
1.3.2 Proteins
Dietary proteins are powerful compounds that build and repair body tissues from hair and
fingernails to muscles. In addition to maintaining the body’s structure, proteins as enzymes speed
up chemical reactions in the body, as well as serve as chemical messengers in the body, fight
infection and transport oxygen from the lungs to the body’s tissues. Proteins play an important
role in biochemical, biophysical and physiological processes. The deficiency of proteins lead to
weakness, anaemia, protein-energy malnutrition (kwashiorkor and marasmus), delayed wound
and fracture healing, decreased resistance to infection because antibody formation is decreased
and sprue syndrome (Wardlaw,1999).
1.3.3 Fats
Fats in the body serve as energy sources and as protective cushion around organs.
Saturated fats are usually solid at room temperature while unsaturated fats remain liquid at room
temperature. They provide insulation for the body, protect vital organs, and aid in the absorption
xxxiii
and transportation of the fat soluble vitamins A, D, E and K. A lot of health disorders arise when
proper amount of essential fats are not absorbed. This leads to autoimmune, inflammatory and
cardiovascular diseases (Wardlaw, 1999). Those suffering from degenerative diseases such as
obesity, cancer, cardiovascular disease, diabetes and liver disorders usually have low levels of
essential fatty acids in their tissues. A deficiency of some essential fats will retard growth and
produce eczema, acne, dry skin and dandruff, dull, brittle and sparse hair, soft brittle and flaking
nails, dry eyes and mouth, diarrhoea, allergies, varicose vein, decreased or increased
weight,gallstone, decreased radiation resistance, heart disease ,cancers, deterioration of skin,
sterility, swollen joints, liver deterioration, fatigue, emotional agitation, decreased immunity,
e.t.c. Excess fat has been shown to produce an abnormal weight gain and diminishing
metabolism (Wardlaw, 1999).
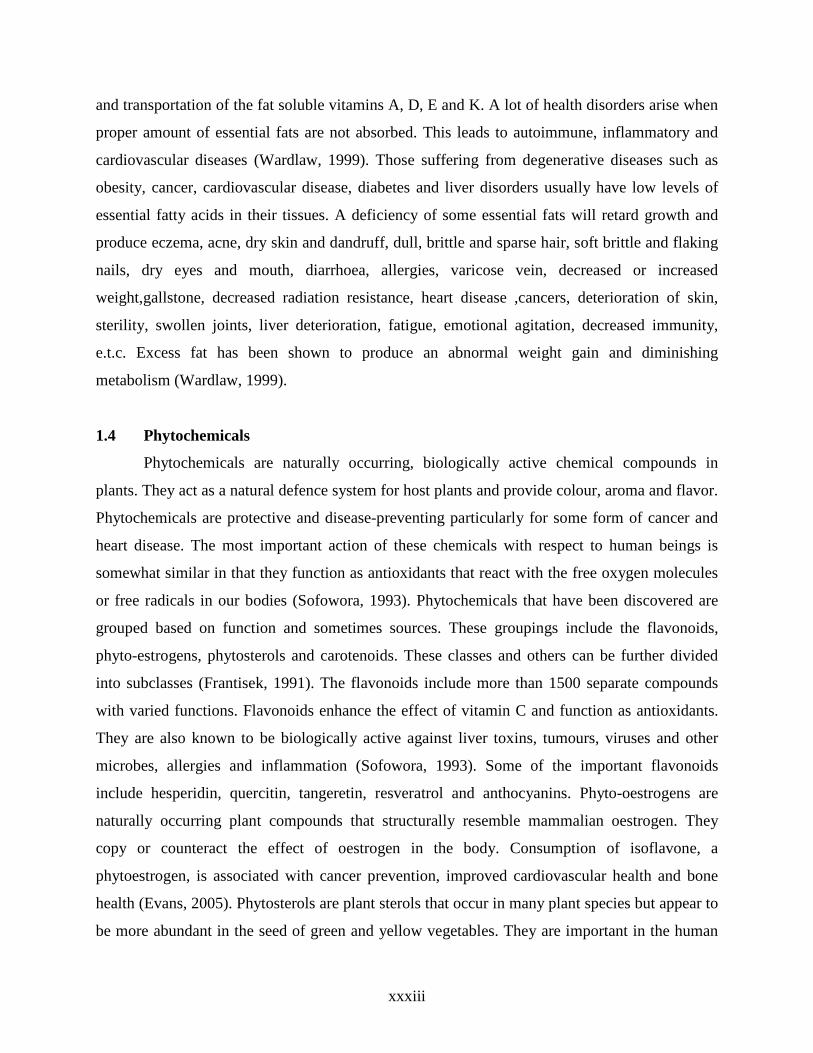
1.4 Phytochemicals
Phytochemicals are naturally occurring, biologically active chemical compounds in
plants. They act as a natural defence system for host plants and provide colour, aroma and flavor.
Phytochemicals are protective and disease-preventing particularly for some form of cancer and
heart disease. The most important action of these chemicals with respect to human beings is
somewhat similar in that they function as antioxidants that react with the free oxygen molecules
or free radicals in our bodies (Sofowora, 1993). Phytochemicals that have been discovered are
grouped based on function and sometimes sources. These groupings include the flavonoids,
phyto-estrogens, phytosterols and carotenoids. These classes and others can be further divided
into subclasses (Frantisek, 1991). The flavonoids include more than 1500 separate compounds
with varied functions. Flavonoids enhance the effect of vitamin C and function as antioxidants.
They are also known to be biologically active against liver toxins, tumours, viruses and other
microbes, allergies and inflammation (Sofowora, 1993). Some of the important flavonoids
include hesperidin, quercitin, tangeretin, resveratrol and anthocyanins. Phyto-oestrogens are
naturally occurring plant compounds that structurally resemble mammalian oestrogen. They
copy or counteract the effect of oestrogen in the body. Consumption of isoflavone, a
phytoestrogen, is associated with cancer prevention, improved cardiovascular health and bone
health (Evans, 2005). Phytosterols are plant sterols that occur in many plant species but appear to
be more abundant in the seed of green and yellow vegetables. They are important in the human

xxxiv
diet because they help to reduce the amount of dietary cholesterol absorbed by the body by
blocking uptake in the intestine. They also facilitate cholesterol excretion from the body.
Carotenoids are plant pigments found in bright yellow, orange and red fruits and vegetables.
Carotenoids are generally well known as vitamin A precursors (Frantisek, 1991). Phytochemicals
are found in all plant products. Some good sources include vegetables, spinach, tomatoes,
peppers, carrots, watermelon, citrus fruits, mangoes, papaya, grapes, apples, red grape, pears,
oats, barley, sweet potatoes, corn, ginger, thyme, onions, green tea (Okaka etal., 1992).
1.5 Antinutrients
Antinutrients are chemical substances found in food that usually interfere with digestion,
absorption or utilization of proteins (Price etal., 1987). The three broad classes of antinutrients
are antiproteins, antivitamins and antiminerals.
Antiproteins are substances that interfere with the digestion, absorption or utilization of
proteins. They occur in many plants and some animals (Ayyagari etal., 1989). Various protease
inhibitors affect proteolytic enzymes of the gut usually by binding to the enzyme’s active site.
Lectins are antiproteins that have binding site for cell receptors similar to what antibodies have.
Haemaglutinins cause red blood cell to agglutinate. Trypsin and chymotrypsin inhibitors can be
found in legumes, vegetables, milk, wheat and potatoes (Ayyagari etal., 1989).
Antivitamins are substances that inactivate or destroy vitamins or inhibit the activity of a
vitamin in a metabolic reaction and increase an individual’s need for the vitamins. They destroy
or inhibit the metabolic effect of vitamins. Examples of antivitamins in foods include thiaminase
(an antivitamin B present in raw fish and other animal foods), caramel colourants (antivitamin
B6) and dicoumarol (antivitamin K). Antinutrients are sometimes consumed as natural
component of food or medication (Liener, 1980). These vitamins can cause deficiency symptoms
similar to those observed when the corresponding vitamins are not present. The administration of
the specific vitamins reverses the deficiency symptoms. Isotonic acid hydrazide, also called
isoniazid used to treat tuberculosis, can cause deficiency of niacin and vitamin B6. The
deficiency symptoms are reversed after giving supplement of these two vitamins.
Antiminerals are substances that interefere with absorption and metabolic utilization of
minerals. Some examples are phytates, oxalates, glucosinolates, dietary fibre and gossypol.
Phytic acid is found in bran and germ of many seeds and grains, legumes and nuts. In addition,
xxxv
phytic acid can compromise the absorption of magnesium, zinc, copper and manganese, usually
forming precipitates. Formation of soybean-phytate complexes during processing has been
associated with a reduction in bioavailability of minerals such as Ca, Zn, Fe and Mg. On the
other hand, fermentation and other processing techniques are useful in reducing phytate levels
(Liener, 1980). Oxalic acid, like phytic acid reduces the availability of bivalent cations. Sources
of oxalic acid include rhubarb, spinach, beets, potatoes, teas, coffee and cocoa. Glucosinolates
reduce an enlargement of the thyroid gland and inhibit iodine uptake into the thyroid. Rutabaga,
turnips, cabbage, peaches and strawberries are good sources of glucosinolates (Liener, 1980).
1.6 VITAMINS
Vitamins are essential organic substances needed in small amounts in the diet for the
normal function, growth and maintenance of body tissues. Although vitamins themselves provide
no energy to the body, some can facilitate energy–yielding chemical reactions. Vitamins A, D, E
and K dissolve in organic solvents such as ether and benzene and are referred to as fats – soluble
vitamins. The B-vitamins and vitamins C, in contrast, dissolve in water and are the water soluble
vitamins.
Vitamins are generally indispensable in human diets because they can’t be synthesized in
sufficient quantities to meet individual needs. Again synthesis is curtailed by environmental
factors or they also can’t be synthesized at all (Hampl and Gordon, 2007).
To be classified as a vitamin, the compound must be organic and must meet the criteria to
be an essential nutrient – the body is unable to synthesize enough of the compound to maintain
health and the absence of the compound from the diet for a defined period of time produces
deficiency symptoms that, if caught in time, are quickly cured when the substance is resupplied.
A substance does not qualify as a vitamin merely because the body can’t make it. Evidence must
suggest that health declines when the substance is not consumed (Hampl and Gordon, 2007).
1.6.1 VitaminA (Beta-carotene)
Beta-carotene is an unstable fat-soluble primary alcohol. It is necessary for the
production and resynthesis of rhodopsin (visual purple) and may protect against (or reverse)
radiation damage (Watty, 2000). Beta-carotene acts as an antioxidant to scavenge radiation
induced oxygen radicals and reduce lipofuscin (a component of drusen).

xxxvi
Consuming foods rich in beta-carotene appears to protect the body from damaging
molecules called free radicals (Gaziano et al., 2007). The antioxidant action of beta-carotene
makes it valuable in protecting against and in some cases even reversing precancerous conditions
affecting the breast, mucous membranes, throat, mouth, stomach, prostate, colon, cervix and
bladder (Gaziano et al., 2007). Individuals with high levels of β-carotene intake have lower risks
of lung cancer, coronary artery heart disease, stroke and age-related eye diseases than individuals
with low levels of β-carotene intake. Too much intake of β-carotene may cause or and may be
mistaken for jaundice (Gaziano et al., 2007). Beta-carotene is richly found in yellow, orange and
green leafy fruits and vegetables such as carrots, spinach, lettuce, tomatoes, sweet potatoes,
broccoli, cantaloupe and winter squash (Bjelakovic, 2007). Deficiency of vitamin A causes night
blindness, xerophthalmia (an extreme dryness of the conjunctiva), keratosis (an epidermal lesion
of tissue overgrowths) and infections (Watty, 2000).
1.6.2 Vitamin C (Ascorbic acid)
Ascorbic acid is a sugar acid with antioxidant properties. Its appearance is white to light-
yellow crystals or powder, and it is water-soluble. One form of ascorbic acid is commonly
known as vitamin C (Shigeoka et al., 2002). Most animals are able to produce this compound in
their bodies and do not require it in their diet. In cells, it is maintained in its reduced form by
reaction with glutathione, which can be catalysed by protein disulfide isomerase and
glutaredoxins (Jacob, 1996). Ascorbic acid is a reducing agent and can reduce and neutralize
reactive oxygen species generated by molecules such as H2O2 (Shigeoka et al., 2002). Vitamin C
neutralizes potentially harmful reactions in the aqueous parts of the body, such as the blood and
the fluid inside and surrounding cells (Khaw and Woodhouse, 1995). Vitamin C may help
decrease total LDL cholesterol and triacylglycerol, as well as increase HDL levels. Vitamin C
antioxidant activity may be helpful in the prevention of some cancers and cardiovascular
diseases (Padayatty, 2003). It is found in high concentrations in ocular tissue. It is a potent
antioxidant and prevents scurvy, a condition that causes ulceration of the gums, skin and mucous
membranes. The antioxidants properties of vitamin C are thought to protect smokers, as well as
people exposed to secondary smoking (passive smokers), from the harmful effects of free
radicals (i.e. prevents the conversion of nitrates from tobacco smoke). As a powerful antioxidant,
vitamin C may help to fight against cancer by protecting healthy cells from free-radical damage

xxxvii
and inhibiting the proliferation of cancerous cells (Bjelakovic, 2007). In addition to its direct
antioxidant effects, ascorbic acid is also a substrate for the antioxidant enzyme ascorbate
peroxidase, a function that is particularly important in stress resistance in plant (Shigeokaet al.,
2002). Foods containing the highest sources of vitamin C include green peppers, citrus fruit and
juices, strawberries, tomatoes, pineapple, pawpaw, sweet and white potatoes, and cantaloupe
(Jacob, 1996).
1.6.3 Vitamin D
Vitamin D is a fat soluble vitamin that is used by the body in the absorption of calcium
which is essential for normal development and maintenance of healthy teeth and bones. It helps
in maintaining adequate blood levels of calcium and phosphorus. It is also called the ‘sunshine
vitamin’ because the body manufactures the vitamin after being exposed to sunshine. Vitamin D
is found in the following foods: dairy products like cheese, butter, margarine, cream, fortified
milk, fish, oysters and fortified cereals. Deficiency of vitamin D leads to osteoporosis in adults or
rickets in children. Excessive doses of vitamin D can result in increased calcium absorption from
the intestinal tract. This may cause increased calcium resorption from the bones, leading to
elevated levels of calcium in the blood. Kidney stones, vomiting and muscle weakness may also
occur due to the ingestion of too much vitamin D.
1.6.4 Vitamin E
Vitamin E is a fat-soluble antioxidant vitamin known to occur in the human body and it
prevents free radical damage of biological membranes (Traber and Atkinson, 2007). Vitamin E is
actually a generic term that refers to all entities that exhibit biological activity of the isomer α -
tocopherol. The alpha-tocopherols are the most widely available isomer that have the highest
bio-potency effect in the body (Schneider, 2005).
Vitamin E appears to be the first line of defence against peroxidation of polyunsaturated
fatty acids contained in cellular and subcellular membrane phospholipids (Murray et al., 2003).
The phospholipids of the mitochondria, endoplasmic reticulum and plasma membranes possess
affinities for α–tocopherol, and the vitamin appears to concentrate at these sites. The tocopherol
acts as antioxidants, breaking free-radical chain reactions as a result of their ability to transfer
phenolic hydrogen to a peroxyl free radical of a per-oxidized polyunsaturated fatty acid. The

xxxviii
phenoxy free radical formed may react with vitamin C to regenerate tocopherol or it reacts with a
further peroxyl free radical so that the chromane ring and the side chain are oxidized to the non-
free radical product (Murray et al., 2003).
Vitamin E is an antioxidant that helps to stabilize cell membranes and protect the tissues
of the skin, eyes, liver, breast and testis, which are more sensitive to oxidation (Watty, 2000). It
retards cellular aging of the eyes due to oxidation, it strengthens the capillary walls and supplies
oxygen to the blood, which is then carried to the eyes (Watty, 2000). Vitamin E is a blood
thinner, which should be used with caution in cases of exudative (wet) muscular degradation.
Vitamin E is found in many common foods, including vegetable oils (such as soybean, corn,
cotton seed and safflower) and products made from these oils (margarine),avocado, milk, egg,
wheat germ, nuts and green leafy vegetable (Schneider, 2005).
1.6.1.5 Vitamin K
Vitamin K is a fat soluble vitamin that helps blood to clot and stop bleeding. Food
sources of vitamin K include cabbage, cauliflower, spinach and other green leafy vegetables as
well as cereals. Vitamin K is also made in the body by normal beneficial gastrointestinal
bacteria. Deficiency problems of vitamin K are thin blood that does not adequately coagulate.
1.7 Antioxidant
Antioxidants are radical scavengers which protect the human body against free radicals
(Poteract, 1997). A free radical is an atom or molecule that has one or more unpaired electron(s)
and is capable of independent existence (Halliwell et al., 1995). The most biological significant
free radicals are the reactive oxygen species (ROS) (Murray etal., 2000), which include hydroxyl
radical (OH˚) and superoxide radical (O2˚). ROS are formed due to various exogenous and
endogenous factors such as exposure to radiation from the environment and the utilization of
oxygen during aerobic respiration (Krishnaiah et al., 2007).
Imbalance in favour of the generation of reactive oxygen species against the activity of
the antioxidant defences leads to a pathophysiological condition known as oxidative stress.
Oxidative stress is defined, in general, as excess formation and/or insufficient removal of highly
reactive molecules such as ROS (Johansen et al., 2005). Oxidative stress is associated with a lot

xxxix
of diseases such as cancer, atherosclerosis, diabetes, rheumatoid arthritis, Parkinson’s disease,
malaria and HIV/AIDS (Aruoma, 1993).
1.8 MINERIALS AND THEIR BIOLOGICAL FUNCTIONS
Minerals of biological importance are classified into macro and micro (trace) elements.
Macro minerals are those that are required by the system in large amounts while micro (trace)
minerals are required in minute quantities. Macro minerals include calcium (Ca), phosphorus (P),
magnesium (Mg), sodium (Na), potassium (K) while micro minerals include iron (Fe), copper
(Cu), zinc (Zn), iodine (I), chromium (Cr), selenium (Se) and manganese (Mn) (Chaney, 2002).
These minerals play very important roles in physiological activities.
1.8.1 Calcium (Ca)
Calcium is essential for living organisms in particular in cell physiology. A 70kg normal
adult human body has about 1200g of calcium which amounts to about 1–2% of body weight.
About 99% of it is found in mineralized tissues such as bones and teeth. The remaining 1% is
found in the blood extra- cellular fluid, muscles and other tissues. In food, calcium occurs as salt
or it gets associated with other dietary constituents in the form of complexes of calcium ions.
Calcium must be released in a soluble and ionized form before it can be absorbed. Absorption
occurs basically in the intestine (Girventet al., 2005).
1.8.1.1 Metabolic functions and deficiency symptoms of calcium
Calcium is required for normal growth and development of the skeleton. Adequate
calcium intake is critical to achieving optimal peak bone mass (PBM) and modifies the rate of
bone loss associated with aging (Girventet al., 2005). Calcium mediates some hormonal
responses and is required by many enzymes as co-factor. Muscle contractility and normal
neuromuscular activity and irritability require the presence of calcium (Chaney, 2002).
Calcium deficiency results in muscle cramp and osteoporosis. Chronic inadequate intake
or poor intestinal absorption of calcium is suspected to play some role in the aetiologies of
hypertension and colon cancer (Girventet al., 2005).

xl
1.8.2 Magnesium (Mg)
Magnesium, another abundant mineral in the body is essential for healthy functions of the
system. Total magnesium (50-60%) is found in bone while the other half, is found within body
tissues and organs. About 1% is found in the blood (Rude, 1998; Girventet al., 2005).
1.8.2.1 Metabolic functions and deficiency symptoms of magnesium
Magnesium is required for several enzyme activities particularly those involving ATP
synthesizing as ATP–Mg2+ complex; and for neuromuscular transmission (Chaney, 2002). It also
enhances the condensation of chromatin.
Magnesium deficiency does not appear to be a problem in healthy individuals since its
homeostasis can be maintained by a wide range of intakes. Its deficiency is only seen as a
secondary complication of a primary disease state as in cardiovascular and neuromuscular mal-
functions, endocrine disorders and muscle wasting (Girventet al., 2005).
1.8.3 Zinc (Zn)
Zinc is a ubiquitous mineral in the body. It is the most abundant intracellular trace
element. About 2g of zinc is found in adults with 60% and 30% are present in muscles and bones
respectively. It is absorbed from the small intestine and transported in the plasma by albumin and
α 2–macroglobulin (Girventet al., 2005).
1.8.3.1 Metabolic functions and deficiency symptoms of zinc
Zinc functions as a co-factor. Over 300 zinc metalloenzymes that have been described to
date include a number of regulatory proteins and both RNA and DNA polymerases (Chaney,
2002). The structural functions are found in the zinc finger motif in proteins. Zinc is required by
protein kinases that participate in signal transduction processes (Girventet al., 2005).
Zinc deficiency in children is usually marked by poor growth and impairment of sexual
development (Chaney, 2002). Poor wound healing results from zinc deficiency in both adults and
children. Other malfunctions resulting from zinc deficiency include decreased taste sense and
impaired immune function (Girvent et al., 2005).

xli
1.8.4 Iron (Fe)
The iron content of a typical 70kg adult man is approximately 4–5g. About two–thirds of
this is utilized as functional iron such as haemoglobin, myoglobin and other haem (cytochromes
and catalase) and non-haem (NADH dehydrogenase) enzymes. Others are stored as ferritin and
hemosiderin (Girvent et al., 2005).
Iron from food is absorbed mainly in the duodenum by an active process that transports
iron from the gut lumen into the mucosal cell. When required by the body for metabolic
processes, iron passes directly through the mucosal cell into the blood stream where it is
transported by transferrin, together with the iron released from old blood cells to the bone
marrow and other tissues. Iron absorbed in excess is stored in the liver, spleen or bone marrow. It
is usually released from these stores for utilization in times of high need, such as during
pregnancy (Girventet al., 2005).
1.8.4.1 Metabolic functions and deficiency symptoms of iron
Iron present in haemoglobin and myoglobin is required for transport of oxygen during
cellular respiration and storage in muscles. Being part of the tissue enzymes makes it critical for
energy production. It also plays a role in the functioning of the immune system (Girvent et al.,
2005).
A major deficiency symptom of iron is anaemia. This results from insufficient
haemoglobin for the production of new erythrocytes. This is most common in infants, preschool
children, adolescents and women of child–bearing age particularly in developing countries
(Chaney, 2002).
1.8.5 Copper (Cu)
Copper is a micronutrient present in a number of important metallo enzymes including
cytochrome C oxidase, dopamine-β-hydroxylase and superoxide dismutase (Chaney, 2002).
About 50–75% dietary copper is absorbed mostly through the intestinal mucosa from a
typical diet. The absorption of copper is primarily influenced by the amount ingested; increased
ingestion leads to decreased absorption (Chaney, 2002). Other factors that influence the
absorption of copper or that affect its bioavailability include the antagonistic effects of zinc, iron,
ascorbic acid, sucrose and fructose (Girvent et al., 2005).

xlii
1.8.5.1 Metabolic functions and deficiency symptoms of copper
As a component of several enzymes, co-factors and proteins, it is essential for important
bioactivities. It is required for proper functioning of the immune, nervous and cardiovascular
systems. It plays a role in iron metabolism and formation of erythrocytes. It also functions as an
electron transfer intermediate in redox reactions (Girventet al., 2005).
This is relatively rare in humans and animals on typical, varied diets. Most features of
severe copper deficiency can be explained by a failure of one or more of the copper-dependent
enzymes like superoxide dismutase, lysyl oxidase, tyrosinase, e.t.c. For instance, lysyl oxidase
plays one of the most important and best understood roles of copper in the body (Girvent et al.,
2005). This is the main enzyme involved in cross- linking of connective tissues. Optimal
functioning of lysyl oxidase ensures the proper cross-linking of collagen and elastin, vital for the
strength and flexibility of our connective tissue. A reduction in lysyl oxidase activity affects the
integrity of numerous tissue including the skin, bones and blood vessels. Not surprising, some of
the hallmarks of copper deficiency are connective tissue disorders, osteoporosis and blood vessel
damage (Chaney, 2002).
1.9 Blood glucose
Glucose transported through the blood stream from the intestines to other tissues and
organs is the primary source of energy for the body’s cells (Spiller, 1992). Blood sugar
concentration or glucose level is tightly regulated in the human body. Normal blood glucose
level is maintained between 4 and 6mM. Normal blood glucose concentration (homeostasis) is
about 90mg/100ml; which works out to 5mM/L as the molecular weight of glucose. The normal
total amount of glucose in circulating blood is therefore about 3.3 to 7.0g (Henry, 2001). Glucose
concentration rises after meal for an hour or two and is usually lowest in the morning, before the
first meal of the day. Failure to maintain blood glucose in the normal range leads to conditions of
persistently high (hyperglycaemia) or low (hypoglycaemia) blood sugar. Although it is called
‘blood sugar’, other simple sugars such as fructose and galactose aside from glucose are found in
the blood. Only glucose concentrations are used as metabolic regulation signals (Sacher and
Mcpherson, 2001). Despite the long intervals between meals and the occasional consumption of
meals with a substantial carbohydrate load, human blood glucose concentrations normally
remain within a remarkable narrow range. In most humans, this varies from about 80mg/dl to

xliii
perhaps 120mg/dl (3.9 to 6.0mml/litre) except shortly after eating when the blood glucose
concentration rises temporarily. In a healthy adult male of 75kg body weight with a blood
volume of 5litres, a blood glucose level of 100mg/dl or 5.5mmol/litre corresponds to about 5g in
the total body water (Henry, 2001).
1.9.1 Blood glucose regulation
The homeostatic mechanism which keeps the blood value of glucose in a remarkably
narrow range is composed of several interacting systems, of which hormone regulations is the
most important. There are two types of mutually antagonistic metabolic hormones affecting
blood glucose levels: catabolic hormones such as glucagon, growth hormone (e.g. pituitary
hormone), glucocorticoids(e.g. cortisol) and catecholamines (e.g. norepinephrine,
epinephrine,dopamine) which increase blood glucose; anabolic hormone (insulin), which
decreases blood glucose.
The human body maintains blood glucose in a very narrow range. Insulin and glucagon
are the hormones which make this possible(John and Harry, 2001). Both insulin and glucagon
are secreted from the pancreas, and thus are referred to as pancreatic endocrine hormones. It is
the production of insulin and glucagon by the pancreas which ultimately determines if a patient
has diabetes, hypoglycemia, or some other forms of sugar problems (John and Harry, 2001).
Insulin is normally secreted by the beta cells (a type of islet cells) of the pancreas. The
stimulus for insulin secretion is high blood glucose. Although there is always a low level of
insulin secreted by the pancreas, the amount secreted into the blood increases as the blood
glucose rises. Similarly, as blood glucose falls, the amount of insulin secreted by the pancreatic
islets goes down. Insulin has an effect on a number of cells, including muscle, red blood cells,
and fat cells. In response to insulin, these cells absorb glucose out of the blood, having the net
effect of lowering the high blood glucose levels the normal range (John and Harry, 2001).
Glucagon is secreted by the alpha cells of the pancreatic islets in much the same manner
as insulin except in the opposite fashion. If blood glucose is high, then no glucagon is secreted.
When blood glucose goes low, however, (such as between meals and during exercise), more and
more glucagon is secreted. The effect of glucagon is to make the liver release the glucose it has
stored in its cells into the blood stream, with the net effect of increasing blood glucose.
xliv
1.10 Lipids
Lipids constitute a group of naturally occurring molecules that include fats, waxes,
sterols, fat soluble vitamins (such as vitamins A, D, E and K), monoacylglycerol, diacylglycerol,
triacylglycerol, phospholipids and others (Fahy et al., 2009). The main biological function of
lipids includes energy storage, signaling and acting as structural components of cell membranes
(Fahy et al., 2009). Lipids have found application in cosmetic and food industries as well as in
nanotechnology (Mashaghi et al., 2013).
Lipids may be broadly defined as hydrophobic or amphiphilic small molecules, the
amphiphilic nature of some lipids allow them to form structures such as vesicles, liposomes or
membranes in an aqueous environment. Biological lipids originate entirely or in part from two
distinct types of biochemical subunits or “building blocks”: ketoacyl and isoprene groups (Fahy
et al., 2009). Although the term lipids is sometimes used as alternative for fats, fats are a group
of lipids called triacylglycerol. Lipids also encompass molecules such as fatty acids and their
derivatives as well as other sterol containing metabolites such as cholesterol. Although humans
and other mammals use various biosynthetic pathways to breakdown and synthesize lipids, some
essential lipids cannot be made this way and must be obtained from the diet (Fahy et al., 2009).
1.10.1 Lipoproteins: Types and Functions
Lipoproteins consist of a non polar core and a single surface layer of amphipathic lipids.
The non polar core consists of mainly triacylglycerol and cholesteryl ester and is surrounded by a
single surface layer of amphipathic phospholipid and cholesterol molecules. These are oriented
so that their polar groups face outwards to the aqueous medium, as in the cell membrane. The
protein moiety of a lipoprotein is known as apolipoprotein or apoprotein, constituting nearly 70%
of some HDL as little as 1% of chylomicrons (Murray etal., 2008).
Because fat is less dense than water, the density of a lipoprotein decreases as the
proportion of lipid to protein increases. In addition to FFA, four major groups of lipoproteins
have been identified that are important physiologically and in clinical diagnosis. These include:
� Chylomicrons, derived from intestinal absorption of triacylglycerol and other lipids;
� Very low density lipoproteins (VLDL, or pre- β - lipoproteins), derived from the liver for
the export of triacylglycerol;

xlv
� Low-density lipoproteins (LDL, or β -lipoproteins), representing a final stage in the
catabolism of VLDL; and
� High- density lipoproteins (HDL, or α- lipoprotein), involved in VLDL and chylomicron
metabolism and also in cholesterol transport.
Triacylglycerol is the predominant lipid in chylomicrons and VLDL, whereas cholesterol
and phospholipids are the predominant lipids in LDL and HDL, respectively.
Lipoproteins may be separated according to their electrophoretic properties into α-,β-,
and pre- β- lipoproteins.
1.10.1.1 Chylomicrons
Chylomicrons in connection with the movement of dietary triacylglycerols from the
intestine to other tissues are the largest of the lipoproteins and the least dense, containing a high
proportion of triacylglycerol. Chylomicrons are synthesized in the endoplasmic recticulum of
epithelial cells that line the small intestine, then move through the lymphatic system and enter
the bloodstream via the left subclavian vein (Nelson and Cox, 2005).
Larger particles are catabolized more quickly than smaller ones. Fatty acids originating
from chylomicron triacylglycerol are delivered mainly to the adipose tissue, heart and muscle
(80%), while about 20% goes to the liver (Murray etal., 2008). However, the liver does not
metabolize native chylomicrons or VLDL significantly; thus, the fatty acid in the liver must be
secondary to their metabolism in extrahepatic tissues (Murray etal., 2008).
The apoproteins of chylomicrons include apo B-48(unique to this class of lipoproteins),
apoE, and apoC-II. ApoC-II activates lipoprotein lipase in the capillaries of adipose, heart,
skeletal muscle, and lactating mammary tissues, allowing the release of free fatty acids to these
tissues. Chylomicrons thus carry dietary fatty acids to tissues where they will be consumed or
stored as fuel. The remnant of chylomicrons (depleted of most of their triacylglycerols but still
containing cholesterol, apoE, and apoB-48) move through the bloodstream to the liver. Receptors
in the liver bind to the apoE in the chylomicron remnants and mediate their uptake by
endocytosis. In the liver, the remnants release their cholesterol and are degraded in lysosomes
(Murray etal., 2008).

xlvi
1.10.1.2 Very Low Density Lipoprotein (VLDL)
When diets contain more fatty acids than are needed immediately as fuel, they are
converted to triacylglycerol in the liver and packaged with specific apolipoproteins into very-
low-density-lipoprotein (VLDL). Excess carbohydrates in the diet can also be converted to
triacylglycerols in the liver and exported as VLDLs (Nelson and Cox, 2005).
In addition to triacylglycerols, VLDLs contain some cholesterol and cholesteryl esters, as
well as apoB-100, apoC-I, apoC-II, apoC-III and apo-E.These lipoproteins are transported in the
blood from the liver to muscle and adipose tissue, where activation of lipoprotein lipase by
apoC-II causes the release of free fatty acids from the VLDL triacylglycerols. Adipocytes take
up these fatty acids, reconvert them to triacylglycerols and store the products in intracellular lipid
droplets; mycocytes in contrast, primarily oxidize the fatty acids to supply energy. Most VLDL
remnants are removed from the circulation by hepatocytes. The uptake, like that for
chylomicrons, is receptor-mediated and depends on the presence of apoE in the VLDL remnants.
The loss of triacylglycerol converts some VLDL to VLDL remnants (also called intermediate
density lipoprotein, IDL) (Nelson and Cox, 2005).
1.10.1.3 Low Density Lipoprotein (LDL)
1.10.1.3.1 Metabolism of low density lipoprotein via LDL receptor
The liver and many extrahepatic tissues express the LDL (B-100, E) receptor. It is so
designated because it is specific for apoB-100 but not B-48, which lacks the carboxyl terminal
domain of B-100 containing the LDL receptor ligand, and it also takes up lipoproteins rich in
apoE. This receptor is defective in familial hypocholesterolemia. Approximately 30% of LDL is
degraded in extrahepatic tissues and 70% in the liver. A positive correlation exists between the
incidence of coronary atherosclerosis and the plasma concentration of LDL cholesterol (Murray
et al., 2008).
1.10.1.3.2 Regulation of LDL receptor
Low density lipoprotein (LDL) receptor is highly regulated. LDL (apo B-100,E)
receptors occur on the cell surface in the pits that are coated on the cytosolic side of the cell
membrane with a protein called clathrin. The glycoprotein receptor spans the membrane the B-
100 binding region being at the exposed amino terminal end. After binding, LDL is taken up

xlvii
intact by endocytosis. The apoprotein and cholesteryl esters are then hydrolysed in the lysosome
and cholesterol is translocated into the cell. The receptors are recycled to the cell surface. This
influx of cholesterol inhibits in a co-ordinated manner HMG-CoA synthase, HMG CoA
reductase and therefore cholesterol synthesis; stimulates ACAT activity and down-regulates
synthesis of LDL receptor. Thus, the number of LDL receptors on the cell surface is regulated by
the cholesterol requirement for membranes, steroid hormones, or bile acid synthesis. The apo B-
100, E receptor is a ‘high affinity’ LDL receptor, which may be saturated under most
circumstances. Other ‘low- affinity’ LDL receptors also appear to be present in addition to a
scavenger pathway, which is not regulated (Murray etal., 2008).
In Western countries, the total plasma cholesterol in humans is about 5.2mmol/L, rising
with age, though there are wide variations between individuals. The greater part is found in the
esterified form. It is transported in lipoprotein of the plasma and the highest proportion of
cholesterol is found in the LDL. Dietary cholesterol equilibrates with the plasma cholesterol in
days and with tissue cholesterol in weeks. Cholesteryl esters in the diet are hydrolysed to
cholesterol, which is then absorbed by the intestine together with dietary unesterified cholesterol
and other lipids. With cholesterol synthesized in the intestines,it is then incorporated into
chylomicrons. Of the cholesterol absorbed, 80-90% is esterified with long-chain fatty acids in the
intestinal mucosa. Ninety-five percent of the chylomicron cholesterol is delivered to the liver in
chylomicron remnants, and most of the cholesterol secreted by the liver in VLDL is retained
during the formation of LDL and ultimately LDL, which is taken up by the LDL receptor in liver
and extrahepatic tissues (Murray etal., 2008).
Further removal of triacylglycerol from VLDL produces low density lipoprotein (LDL).
Very rich in cholesterol and cholesteryl esters and containing apoB-100 as their major
apolipoprotein, LDLs carry cholesterol to extrahepatic tissues that have specific plasma
membrane receptors that recognize apoB-100. These receptors mediate the uptake of cholesterol
and cholesteryl esters (Nelson and Cox, 2005).
1.10.1.4 High Density Lipoprotein (HDL)
The fourth major lipoprotein type, high-density lipoprotein (HDL), originates in the liver
and small intestine as small, protein-rich particles that contain relatively little cholesterol and no
cholesteryl esters. HDLs contain apoA-I, apoC-I, apoC-II, and other apolipoproteins, as well as

xlviii
the enzyme lecithin-cholesterol acyl transferase (LCAT), which catalyses the formation of
cholesteryl esters from lecithin (phosphatidyl choline) and cholesterol. LCAT on the surface of
nascent (newly forming) HDL particles converts the cholesterol and phosphatidyl choline of
chylomicron and VLDL remnants to cholesteryl esters, which begin to form a core, transforming
the disk-shaped nascent HDL to a mature, spherical HDL particle. This cholesterol- rich
lipoprotein then returns to the liver, where the cholesterol is unloaded, some of this cholesterol is
converted to bile salts (Nelson and Cox, 2005).
HDL may be taken up in the liver by receptor mediated endocytosis, but at least some of
the cholesterol in HDL is delivered to other tissues by a novel mechanism.HDL can bind to
plasma membrane receptor proteins called SR-B1 in hepatic and steroidogenic tissues such as the
adrenal gland. This receptor mediates not only endocytosis but also partial and selective transfer
of cholesterol and other lipids in HDL into the cell (Nelson and Cox, 2005).
Depleted HDL then dissociates to recirculate in the bloodstream and extract more lipids
from chylomicron and VLDL remnant. Depleted HDL can also pick up cholesterol stored in
extrahepatic tissues and carry it to the liver, in reverse cholesterol transport pathways. In one
reverse transport path, interaction of nascent HDL with SR-B1 receptors in cholesterol-rich cells
triggers passive movement of cholesterol from the cell surface into HDL, which then carries it
back to the liver. In a second pathway, apoA-I in depleted HDL interacts with an active
transporter, the ABC1 protein, in a cholesterol- rich cell. The apoA-1(and presumably the HDL)
is taken up by endocytosis, then resecreted with a load of cholesterol, which it transports to the
liver (Nelson and Cox, 2005).
The ABC1 protein is a member of a large family of multidrug transporters, sometimes
called ABC transporters, because they all have ATP- binding cassettes; they also have two
transmembrane domains with six transmembrane helices. These proteins actively transport a
variety of ions, amino acids, vitamins, steroid hormones and bile salt across plasma membranes.
The CFTR protein that is defective in cystic fibrosis is another member of this ABC family of
multidrug transporters (Nelson and Cox, 2005).
1.11 Total cholesterol and cholesterol balance in tissues
Cholesterol is a lipid that is made in the liver from fatty foods. It is found in cell
membranes of all tissues and is transported in blood plasma of all animals. Cholesterol is also
xlix
considered a sterol (Stryer, 1995). Most of the cholesterol in the body is synthesized by the body
and some have dietary origin. Cholesterol is more abundant in tissues which either synthesize
more or have more abundant densely packed membranes, for example, the liver, spinal cord and
brain. It plays a central role in many biochemical processes such as the composition of cell
membranes and the synthesis of steroid hormones (Smith, 1991). Since cholesterol is insoluble in
blood, it is transported in the circulatory system within lipoproteins, complex spherical particles
which have an exterior composed mainly of water, soluble proteins; fats and cholesterol are
carried internally (Stryer, 1995). Cholesterol is required to build and maintain cell membranes; it
regulates membrane fluidity over a wide range of temperature. Some research indicates that
cholesterol also aid in the manufacture of bile and is also important for the metabolism of fat
soluble vitamins and of the various steroid hormones (Haines, 2001). Conditions with elevated
concentrations of oxidized LDL particles are associated with atheroma formation in the walls of
arteries, a condition known as atherosclerosis, which is the principle cause of coronary heart
disease and other forms of cardiovascular diseases. Abnormally low levels of cholesterol are
termed hypocholesterolemia. Research into the cause of this state is relatively limited but some
studies suggest a link with depression, cancer and cerebral haemorrhage. It is unclear whether the
low cholesterol concentrations causes for these conditions or something which occurs along side
them (Shepherd et al., 1995). Normal values for serum cholesterol are 3.6 or 5.0 – 6.5mmol/l or
120 or 140 – 200 or 250mg/dl (Deepak et al., 2007).
In tissues, cholesterol balance is regulated as follows: cell cholesterol increase is due to
uptake cholesterol- containing lipoproteins by receptors e.g. the LDL receptor or the scavenger
receptor; uptake of free cholesterol from cholesterol-rich lipoproteins to the cell membrane;
cholesterol synthesis, and the hydrolysis of cholesteryl esters by the enzyme cholesteryl ester
hydrolase. Decrease is due to the efflux of cholesterol from the membrane to HDL, promoted by
LCAT (lecithin cholesterol acyltransferase); esterification of cholesterol by ACAT (acyl coA:
cholesterol acyltransferase); and utilization of cholesterol for synthesis of other steroids, such as
hormones or bile acids in the liver (Illingworth, 2000).

l
Fig. 4: Structure of cholesterol (Murray et al., 2008)
1.11.1 Diet and cholesterol regulation
Hereditary factors play important roles in determining individual serum cholesterol
concentrations; however, dietary and environmental factors may also play some parts, and the
most beneficial of these is the substitution in the diet of polyunsaturated and monounsaturated
fatty acids for saturated fatty acids. Plant oil such as corn oil and sunflower seed oil contain a
high proportion of polyunsaturated fatty acids, while olive oil contains a high concentration of
monounsaturated fatty acids. On the other hand, butter fat and beef fat contain a high proportion
of saturated fatty acids. Sucrose and fructose have a greater effect in raising blood lipids,
particularly triacylglycerol, than do other carbohydrates (Murray etal., 2008).
The reason for the cholesterol-lowering effect of polyunsaturated fatty acids is still not
fully understood. It is clear, however, that one of the mechanisms involved in the up-regulation
of LDL receptors by poly and monounsaturated as compared with saturated fatty acids, causing
an increase in the catabolic rate of LDL, the main atherogenic lipoprotein. In addition, saturated
fatty acids cause the formation of smaller VLDL particles that contain relatively more

li
cholesterol, and they are utilized by extra hepatic tissues at a slower rate than are larger particles-
tendencies that may be regarded as atherogenic (Ness and Chambers, 2000).
1.12 LIVER FUNCTION BIOMARKERS
Liver function tests are groups of clinical blood assays designed to give information
about the state of a patient’s liver. The tests specifically detect the levels of some liver enzymes
which leak into the blood stream in the event of a damage. Some of these enzymes include –
alanine aminotransferase (ALT), aspartate aminotransferase (AST), and alkaline phosphatase
(ALP).
1.12.1 Alanine aminotransferase
Alanine aminotransferase (ALT), formerly called serum glutamate-pyruvate transminase
(SGPT), catalyses the transfer of α-amino group from alanine to α-keto-glutarate with the release
of pyruvate and glutamate.
(Reaction 1)
Alanine aminotransferase can also be found in several tissues throughout the body, but the
concentrations in the liver are considerably higher than elsewhere (Murray et al., 2003). At
physiologic pH, the reaction is energetically favoured towards the formation of L– alanine and
α -oxoglutarate.In vivo, the reaction goes to the right to provide a source of nitrogen for the urea
cycle. The glutamate thus produced is deaminated by glutamate deydrogenase resulting in
ammonia and regeneration of α -oxoglutarate (α -ketoglutarate) whereas, the pyruvate thus
generated is available for entry into the citric acid cycle. The reaction is reversible; the chemical
equilibrium favours the formation of alanine and α -oxoglutarate (Murray et al., 2003).
C
COO−
H NH2
CH3
+ O C
COO−
(CH2)2
COO−
C
COO−
CH3
O + C
COO−
H
(CH2)2
NH2
COO−
L-Alanine α-Oxoglutarate Pyruvate L-Glutamate

lii
Alanine aminotransferase is found in high concentrations in the hepatocytes, and in much
smaller concentrations in other tissues such as kidney, heart, skeletal muscle, spleen and serum.
There is more than one form of alanine aminotransferase in the body. The mitochondrial form is
low in concentration and very unstable as compared to the cytosolic form. The different
electrophoretic components have been identified. They include alanine glutamate transaminase
and alanine pyruvate transaminase. The former is very specific for alanine and glutamic acid,
whereas the latter is non-specific and has alanine and pyruvate as principal substrates and can
also act on other amino acids though at a very low rate (Murray et al., 2003).
1.12.2 Aspartate aminotransferase
Aspartate aminotransferase (AST), formerly known as glutamate-oxaloacetate
transaminase (GOT) or serum glutamate–oxaloacetate transaminase (SGOT), catalyses the
transfer of the α-amino group from aspartate to α-ketoglutarate with the release of oxaloacetate
and glutamate.
(Reaction 2)
Aspartate aminotransferase is located in the cytosol and mitochondria of the liver cells.
There are individual iso–enzymes, and the main serum component is from the cytosolic fraction.
This enzyme is also located in the cardiac muscle, skeletal muscle, brain, kidney, pancreas,
erythrocytes and serum. The hepatic mitochondrial cytosolic AST isoenzymes are genetically
distinct and different in their amino acid composition, kinetic behaviour, electrophoretic mobility
and immunochemical properties. Isoelectric focusing shows that mitochondrial isoenzymes from
human liver exist in a single form whereas the cytoplasmic isoenzymes have at least three sub-
forms with similar immunochemical behaviour (Nelson and Cox, 2000).
+ O C
COO−
(CH2)2
COO−
C
COO−
CH2
COO−
O C
COO−
H NH2
CH2
COO−
C
COO−
H NH2
(CH2)2
COO−
+
L-Aspartate α-ketoglutarate Oxaloacetate L-Glutamate

liii
1.12.3 Alkaline Phosphatase
Alkaline phosphatase is the name given to a group of enzymes that catalyse the
hydrolysis of phosphate esters in alkaline pH. This enzyme is widely distributed in human
tissues, including liver, bone, placenta, intestine, kidney and leukocytes. In the liver, the enzyme
is mainly bound to canalicular membranes (Nelson and Cox, 2000).
Liver and bone isoenzymes are the major fractions of the serum alkaline phosphatase in
healthy adults. In children and adolescents, where bone growth is active, the serum alkaline
phosphatase may increase up to three fold and the boneisoenzymes become the major fraction.
The placenta isoenzyme is prominent in pregnant women, particularly during the third trimester.
An intestinal component is often present in Lewis antigen secretors of blood groups O and B,
particularly after ingesting a fatty meal.
Although the prime metabolic function of the enzymes is not yet understood, the enzyme
is closely associated with the calcification process in bones. Alkaline phosphatase displays
considerable inter ad intra–tissue heterogeneity, but there are rarely more than two or three forms
in any one serum specimen.
The isoenzymes of alkaline phosphatase exhibit optimal activity invitro at a pH of about
10, although the optimal pH varies with the nature and concentration of the substrate acted upon,
the type of buffer or phosphate acceptor present, and to some extent, the nature of the
isoenzymes. Alkaline phosphatase acts on a large variety of naturally occurring synthetic
substrates but the natural substrates on which they act in the body are not known.
Some divalent ions such as Mg(II), Co(II) and Mn(II) are activators of the enzyme and
Zn(II) is a constituent metal ion. The correct ratio of Mg(II)/Zn(II) ion is necessary to obtain
optimal activity (Nelson and Cox, 2000).
1.12.4 Clinical and Diagnostic Significance of Liver Function Enzymes
Analysis of some enzyme activities in blood serum gives valuable diagnostic information
for a number of disease conditions. Alanine aminotransferase (ALT) and aspartate
aminotransferase (AST) are important in the diagnosis of heart and liver damage caused by heart
attack, drug toxicity or infection. After a heart attack, a variety of enzymes, including these
aminotransferases, leak from the injured heart cells into the blood stream. Measurements of the
blood serum concentration of the two aminotransferases and alkaline phosphatase by SGPT,

liv
SGOT and alkaline phosphatase tests and of another enzyme, creatine kinase and is the first heart
enzyme to appear in the blood after a heart attack; it also disappears quickly from blood. AST is
the next to appear and ALT follows later.
The AST and ALT tests are also important in industrial medicine, to determine whether
people exposed to carbon tetrachloride, chloroform, or other industrial solvents have suffered
liver damage. Aminotransferases are most useful in the monitoring of people exposed to these
chemicals because they are very active in liver and their activity can be detected in very small
amounts (Nelson and Cox, 2000).
1.12.5 Bilirubin
Bilirubin is a product of red cell breakdown in the liver, spleen, and bone marrow. A
small amount is produced form the breakdown of haem-containing proteins such as myoglobin
(oxygen-transporting muscle protein), and the enzymes catalase, cytochromes, and peroxidases.
The haem (iron porphyrin part is converted to biliverdin which is then reduced to
bilirubin. This bilirubin is referred to as unconjugated (indirect) bilirubin. It is not soluble in the
blood to the liver. In the liver cells, the enzyme glucuronosyl-transferase joins (conjugates)
glucuronic acid to bilirubin forming bilirubin glucuronides (mainly diglucuronide). This bilirubin
is known as conjugated (direct) bilirubin. It is water-soluble and non-toxic. Conjugated or direct
bilirubin refers to bilirubin which has been conjugated in the liver to form water-soluble mono-
and diglucuronides of bilirubin, in certain forms of jaundice (not haemolytic) it can be found in
urine. Conjugated bilirubin passes into the bile canaliculi, through the bile duct, and into the
intestine. In the terminal ileum and colon, the conjugated bilirubin is reduced by bacteria to
various pigments and colourlesschromogens (urobilinogen), most of which are excreted in the
faeces. One of the urobilinogenchromogens excreted in the faeces is stercobilinogen
(Cheesborough, 1987).
Some of the urobilinogen from the intestine is absorbed into the portal circulation and
reaches the liver. Where it re- enters the intestine in the bile and is excreted in the faeces. A
small amount of this reabsorbed urobilinogen is carried in the blood through the liver and
transported to the kidneys where it is excreted in the urine. Urobilinogen is rapidly oxidized to
the coloured pigment urobilin (stercobilinogen to stercobilin).

lv
The normal concentration of total bilirubin (unconjugate and conjugated) in the blood of
an adult is usually 3-17 µmol/L (0.2-0.9mg%). When the plasma bilirubin reaches around 34
µmol/ L (2 mg%) a person will become jaundiced, with the skin and particularly the white part
of eyes appearing yellow-coloured. (Cheesborough, 1987).
In haemolytic (prehepatic) jaundice, more bilirubin is produced than the liver can
metabolise e.g. in severe haemolysis. The excess bilirubin which builds up in the plasma is
mostly of the unconjugated types and is therefore not found in the urine.
In hepatocellular (hepatic) jaundice, there is a build up of bilirubin in the plasma because
it is not transported, conjugated or excreted by the liver cells since they are damaged e.g. in viral
hepatitis. The excess bilirubin is usually of both the unconjugated and conjugated types with
bilirubin being found in the urine.
In obstructive (posthepatic) jaundice, bilirubin builds up in the plasma because it is
obstructed in the small bile channels or in the main bile duct. This can be caused by gall stones
or a tumour obstructing or closing the biliary tract. The excess bilirubin is mostly of the
conjugated type and is therefore found in the urine.
1.12.6 Serum protein
Blood proteins also called serum protein, are found in blood plasma. Serum total protein
in blood is 7 g/dl, which makes 7% of total body weight (Anderson and Anderson, 1977). They
serve many different functions including circulating transport molecules for lipids, hormones,
vitamins and minerals, enzymes, complement components and protease inhibitors, and in
regulation of cellular activity and functioning and in the immune system. About 60% of plasma
proteins are made up of the protein, albumin which is a major constituent to osmotic pressure of
plasma assists in the transport of lipids and steroid hormones. Globulins make up 35% of plasma
proteins and are used in the transport of ions, hormones and lipids assisting in immune function;
40% is fibrinogen and this is essential in the clotting of blood and can be converted to insoluble
fibrins (Adkins etal., 2002). A total serum protein test measures the total amount of protein in the
blood. It also measures the amounts of the two major groups of proteins in the blood; albumin
and globulin (Fischbach and Dunning, 2004). Normally, there is little more albumin than
globulin and the ratio is greater than 1.A ratio less than 1or much greater than 1 can give clue
about problems in the body (Pagana and Pagana, 2002).

lvi
1.12.7 Serum albumin
Human serum albumin is the most abundant protein in human blood plasma. It is
produced in the liver. Albumin comprises about half of the blood protein. The reference range
for albumin concentration in blood is 3.0-5.5 g/dl(Pagana and Pagana, 2002). It has a serum half
life of approximately twenty days. It has a molecular mass of 67 KDa (Mohamadi-Nejadet al.,
2002). Albumin transports thyroids hormones and other hormones particularly fat soluble
hormones, unconjugated bilirubin and many drugs to the liver and other important organs. Low
blood albumin concentrations (hypoalbuminaemia) can be caused by liver disease/cirrhosis of
the liver, decreased production (as in starvation/malnutrition/malabsorbtion), excess excretion by
the kidney, excess loss in bowel, burns, redistribution, acute disease states, and mutation causing
analbuminaemia. Hyper albuminaemia typically is a sign of severe dehydration.
1.13 RENAL FUNCTION BIOMARKERS
1.13.1 Blood urea nitrogen (BUN)
Urea is a waste product of the liver and part of the urea cycle. Urea is removed from the blood by
the kidneys. Urea clearance is similar to creatinine clearance but urea is both filtered and
reabsorbed and urea levels vary with the state of hydration and diet. Urea clearance is therefore
less than glomerular filtration rate (GFR), if protein intake and metabolism are constant.
However, plasma levels increase as the GFR declines. If there is no tubular adaptation, urea
levels change because urea is primarily excreted by glomerular filtration. BUN levels are
measured by chemical colorimetric method.
The concentration of urea nitrogen in the blood reflects glomerular filtration and urine-
concentrating capacity. Urea is filtered at the glomerulus and as a result, BUN levels increase as
glomerular filtration drops. BUN rises in states of dehydration and acute and chronic renal failure when
passage of fluids through the tubules is slowed, because urea is reabsorbed by the blood through the
permeable tubules. BUN also varies as a result of changed protein intake and protein catabolism and
therefore is a poor measure of GFR. BUN is used for the detection of chronic kidney injury, as BUN
levels do not change until there is extensive renal damage.
Increases are usually caused by excessive protein intake, kidney damage, certain drugs,
low fluid intake, intestinal bleeding. Decreased levels may be due to a poor diet, malabsorption,
liver damage or low nitrogen intake (Girventet al., 2005).

lvii
1.13.2 Creatinine
This is basically the waste product of muscle metabolism. Its level is a reflection of body
muscle mass. Low levels are sometimes seen in kidney damage, protein starvation, liver diseases
or pregnancy. Elevated levels are seen in kidney diseases (since kidney is involved in its
excretion), muscle degeneration and some drugs involved in impairment of kidney function
(Jaeger and Hedegaard, 2002).
Creatinine is a break-down product of creatine phosphate, which is used as an energy
resource in the muscles. Creatinine is produced by the muscles and excreted into the blood at a
relatively constant rate. Creatinine is commonly used in the clinic to determine glomerular
filtration rate (GFR) in a patient.
GFR is a measurement of the functioning of the glomerulus. Creatinine is freely filtered
at the glomerulus. Small amounts are secreted by the tubules, which leads to a small but
acceptable overestimation of GFR. These qualities make blood creatinine levels a good measure
of GFR. When the body is in steady state, the amount produced by the body approximates the
amount filtered and excreted in the kidneys. The plasma concentration of creatinine changes until
the amount excreted again equals the production if either the rate of production or the GFR
changes. Therefore, if GFR levels decline (e.g. chronic renal failure), the plasma creatinine level
increases by a reciprocal amount. The plasma levels continue to increase as the GFR decreases,
because no significant tubular adjustment occurs for creatinine. This relationship between
creatinine blood concentration and renal excretion of creatinine allows plasma creatinine
concentration to serve as an estimate of changing glomerular function.
1.14 Lipid Peroxidation
Lipid peroxidation is a major form of oxidative stress. It is the oxidative deterioration of
unsaturated lipids containing methylene-interrupted double bonds. Lipid peroxidation is a source
of free radicals. In the presence of the free radical like the hydroxyl radicals, lipids undergo
peroxidation. Hydroxyl radicals are capable of initiating lipid peroxidation by abstracting
hydrogen atom from fatty acid side chain (Kanner et al., 1997). Lipid peroxidation involves the
direct reaction of lipids with free radical intermediates and semi stable peroxides. Peroxidation
(auto-oxidation) of lipids exposed to oxygen is responsible not only for deterioration of food
(rancidity) but also for damage to tissues in vivo, where it may be a cause of cancer,

lviii
inflammatory diseases,atherosclerosis and ageing (Murray et al., 2003). The deleterious effects
are considered to be caused by free radicals (ROO; RO;OH) produced during peroxide formation
from fatty acids containing methylene interrupted double bonds i.e. those found in the naturally
occurring polyunsaturated fatty acids. Lipid peroxidation can be said to be the oxidative
degradation of lipids. It is the process whereby free radicals “steal”’ electrons from the lipids in
cell membranes (Halliwell etal., 1999), resulting in cell damage. This proceeds by a free radical
chain reaction mechanism. Most often it affects polyunsaturated fatty acids, because they contain
multiple double bonds which lie between methylenes (CH2-) groups they possess especially,
reactive hydrogen. As with any radical reaction, lipid peroxidation is a chain reaction providing a
continuous supply of free radicals that initiate further peroxidation (Kanner etal., 1997). The
reaction consists of three major steps: initiation, propagation and termination.
1.14.1 Initiation
Initiation is the step whereby a fatty acid radical is produced. The initiators in living cells
are most notable ROS, such as OH, which combines with a Hydrogen atom to make water and a
fatty acid radical (Halliwell, 1994).
ROOH + Metal (n)+ ROO-+ Metal(n-1)+ +H+
X + RH R- + XH
(Reaction 3)
The products of the initiation phase could undergo molecular rearrangement to form conjugated
dienes.
1.14.2 Propagation
The fatty acid radical is not a very stable molecule, so it reacts readily with molecular
oxygen, thereby creating a peroxyl fatty acid radical. This too is an unstable specie that reacts
with another free fatty acid producing a different fatty acid radical and a hydrogen peroxide or
cyclic peroxide if it had reacted with itself. This cycle continues as the new fatty acid radical
reacts in the same way. (Aruoma et al., 1989)
R + O2 ROO
ROO- + RH ROOH + R-
ROOH + Fe2+ OH- + RO- + Fe3+
(Reaction 4)

lix
The hydrogen peroxide is unstable and in the presence of a metal catalyst such as iron forms a
reactive alkoxy radical (Braughler etal., 1996).
1.14.3 Termination
When a radical reacts it always produces another radical, which is why the process is
called a “chain” reaction mechanism”. The radical reaction stops when two radicals react and
produce a non-radical species. This happens only when the concentration of radical species is
high for the probability of two radicals colliding. Living organisms have different molecules that
speed up termination by catching free radical and therefore protect the cell membrane. One
important of such antioxidants is alpha-tocopherol, also known as vitamin E. Other antioxidants
made within the body include the enzymes: superoxide dismutase, catalase and peroxidase
(Gutteridge 1997).
In addition, end-products of lipid peroxidation may be mutagenic and carcinogenic. For
instance, the end-product; malondialdehyde reacts with deoxyadenosine and deoxyguanosine in
DNA, forming DNA adducts (Gutteridge, 1996).
ROO- + ROO ROOR + +O2
ROO- + R- ROOR
R- + R-RR
(Reaction 5)
Since the molecular precursor for the initiation process is generally the hydrogen peroxide
product-ROOH, lipid peroxidation is a chain reaction with potentials of devastating effects. To
control and reduce lipid peroxidation both humans in their activities and nature invoke the use of
antioxidants. Propyl gallate, butylated hydroxyl toluene(BHT) are antioxidants used as food
additives (Murray etal, 2003).
1.14.4 Types of Lipid Peroxidation
1.14.4.1 Non- Enzymatic Lipid Peroxidation
Lipid peroxidation is probably the most extensively investigated free radical-induced
process (Gutteridge and Halliwell,1990). Polyunsaturated fatty acids (PUFAs) are particularly
susceptible to peroxidation and once the process is initiated, it proceeds as a free radical-
mediated chain reaction involving initiation, propagation and termination. Initiation of lipid

lx
peroxidation is caused by attack of any specie that has sufficient reactivity to abstract a hydrogen
atom from a methylene group upon a PUFA. Since hydrogen atom in principle is a radical with a
single unpaired electron on the carbon to which it was originally attached. The carbon-centred
radical is stabilized by a molecular rearrangement to form a conjugated diene, followed by
reaction with oxygen to give a peroxyl radical. Peroxyl radicals are capable of abstracting a
hydrogen atom from another adjacent fatty acid side chain to form a lipid hydrogenperoxide, but
can also combine with each other or attack membrane proteins, when the peroxyl radical
abstracts a hydrogen atom from fatty acid, the new carbon-centered radical can react with
oxygen to form another peroxyl radical, and so the propagation of the chain reaction of lipid
peroxidation continues (Gutteridge, 1996).

lxi
+H0
(PUFA )
R- (Carboncentered
Radical)
R-+H0
(ConjugationDiene)
ROO-
(PeroxylRadical)
O I O-
ROOH (Hydroperoxide)
O I O H
- H Loss of H0 to free radical
Molecular rearrangement
+ O2
Uptake of Oxygen
Abstraction of H- from an adjacent fatty acid
Fig 5 Mechanism of non-enzymatic lipid peroxidation (Source: Gutteridge, 1996).

lxii
1.14.4.2 Enzymatic lipid peroxidation
Cyclooxygenase and lipoxgenase catalyse lipid peroxidation (Vane and Botting, 1995).
The peroxidation of PUFAs can proceed not only through non-enzymaticfree radical induced
pathways, but also through processes that are enzymatically catalysed. Enzymatic lipid
peroxidation may be referred only to the generation of lipid hydroperoxides achieved by
insertion of an oxygen molecule at the active center of an enzyme (Halliwell etal., 1999). Free
radicals are probably important intermediates in the enzymatically–catalysed reaction, but are
localized to the active site of the enzyme. Cyclooxygenase (COX) and lipoxygenase carry out
enzymatic lipid peroxidation when they catalyse the controlled peroxidation of various fatty acid
substrates. The hydroperoxides and endoperoxides produced form enzymatic lipid peroxidation
become stereospecific and have important biological functions upon conversion to stable active
compounds. Both enzymes are involved in the formation of eicosanoids, which comprise a large
and complex family of biologically active lipids derived from PUFAs with 20 carbon atoms.
Prostaglandins are formed by cyclooxygenase-catalysed peroxidation of arachidonic acid
(Samuelson etal., 1975). Cyclooxygenase exist in at least two isoforms (Vane and Botting,1995).
Cylooxygenase-1 is present in cells under physiological conditions, whereas cyclooxygenase-2 is
induced in macrophages, epithelial cells and fibroblasts by several inflammatory stimuli leading
to release of prostaglandins (Halliwell etal., 1999).
1.15 RESEARCH OBJECTIVES
1.15.1 General Objective
The major objective of this work is to determine the nutritive composition of the pulp of
S.dulcificum and to ascertain whether or not the methanolic pulp could have beneficial effects on
some biochemical parameters such as liver function status, kidney function parameters, blood
glucose, serum lipid profile and lipid peroxidation/antioxidant activity of rats as the animal
model for the research.
1.15.2 Specific Objectives
Thespecificobjectives of this research work are:
� To determine the nutritive and antinutritive composition of pulp of S. dulcificum.

lxiii
� To determine the LD50 (lethal dose) of the methanolic pulp extract of S.
dulcificum in rats.
� To determine the effect of the methanolic pulp extract of S.dulcificum on some
liver function enzymes (ALT, AST and ALP) and liver function status (serum
total protein, serum albumin, serum globulin and bilirubin) concentration in rats.
� To determine the effect of the methanolic pulp extract of S. dulcificumon kidney
function parameters (creatinine and urea concentration) in rats.
� To establish already known anti-diabetic properties of the plant
� To determine the effect of the methanolic pulp extract of S. dulcificum on serum
lipid profile (total cholesterol, LDL cholesterol, HDL cholesterol, TAG
concentrations) in rats.
� To determine lipid peroxidation/antioxidant activity.
� To study the effect of the methanolic pulp extract of S.dulcificum on the histology
of liver and kidney of the rats so as to confirm the toxicity studies.

lxiv
CHAPTER TWO
MATERIALS AND METHODS
2.1 Materials
2.1.1 Plant materials
S.dulcificum (miracle fruit) were collected from Uke town in Idemili North LGA
Anambra State and was identified at Bioresource and Development Conservative Programme
(BDCP), Nsukka, Nigeria. The plant material was registered and deposited at the University
hebarium.
2.1.2 Animals
Adult male and female albino rats were purchased from the Faculty of Biological Science
Animal House, University of Nigeria, Nsukka, Enugu State, Nigeria and were about 12weeks
old. The animals were kept under standard conditions for 7days with free access to water and
food before starting the experiment to acclimatize.The animals were housed in separate standard
cages and provided with pelletized feed (Grand cereals and oil mills Nigeria Limited) and water
ad libitum at room temperature. Albino mice 20.50+4.27g weights were used in determination of
median lethal dose (LD50).
2.1.3 Chemicals and Reagents
All chemicalsused were purchased from Sigma Chemicals, St Louis, USA and were of
analytical grade. Kits for evaluation of liver and kidney functions, lipid profile and lipid
peroxidation were products of QuimicaClinicaApplicada (QCA), Spain. Also, the kits used for
evaluation of total cholesterol, serum total protein and serum albumin were purchased from
QuimicaClinicaApplicada (QCA), Spain. Kit used for evaluation of triacylglycerol level was
purchased from Randox kit, USA.
2.1.4 Equipment /Instruments
All the equipment and facilities used were those available at the General laboratory,
International Institute of Tropical Agriculture, Ibadan, Oyo State, Postgraduate Laboratory,
Department of Biochemistry, University of Nigeria, Nsukka and Shalom Laboratories, Nsukka,
Enugu State.

lxv
2.2 Methods
2.2.1 Experimental design
In this study, a total of twenty four (24) albino rats were used. They were acclimatized to
laboratory conditions for a period of one week and all rats had access to pelletized feed (Grand
Cereals and Oil Mills Nigeria Limited) and water ad libitum. They were randomly distributed
into four (4) groups of six (6) animals each. The study lasted for 28days.
The experimental groups were as follows:
� Group I (Control): Rats were administered 0.2ml of normal saline (0.9% NaCl).
� Group II: Rats were administered 100mg/kg body weight of methanolic extract of
S. dulcificum pulp.
� Group III: Rats were administered 200mg/kgbody weight of methanolic extract of
S. dulcificum pulp.
� Group IV: Rats were administered 500mg/kg body weight of methanolic extract
of S. dulcificum pulp.
The first phase of the animal experiment lasted fourteen (14) days. On the 15th
day, blood samples (2ml each) were collected via ocular puncture from three (3)
animals in each group for analysis of biochemical parameters such as liver
function enzymes and status, kidney function parameters, blood glucose levels,
serum lipid profile and lipid peroxidation. Thereafter, they were anaesthesized
with chloroform, sacrificed and then their organs removed for histopathological
studies.
The experiment continued with the remaining (3) animals in the groups for another
fourteen (14) days. Blood samples were collected from the remaining animals via ocular
puncture on the 29th day and used for same biochemical analyses, they were anaesthesized in
chloroform and sacrificed. The internal organs were removed and used for histopathological
studies as well.
2.2.2 Extraction of plant material
The fruit was cleaned, washed and the pulp removed from the fruit. A weighed quantity,
560 g of the pulp was extracted by cold maceration inmethanol for 48 hours. The extract was
first filtered with a white muslin cloth after which the filtrates were refiltered with Whatman no.
1 filter paper. The resulting methanolic pulp extract was concentrated in vacuo using a rotary

lxvi
evaporator (at an optimum temperature between 40 and 45 ºC to avoid denaturation of the active
ingredients) to obtain a slurry mass. The weight of the slurry extract was determined and a
weighed quantity of the extract was dissolved in 0.9% NaCl and used for the animal
administration.
2.2.3 Determination of the extract yield
The percentage yield of the extract was determined by dividing the weight of the extract
by the weight of the S.dulcificum pulp used for the extraction.
2.2.4 Toxicological studies
2.2.4.1 Acute toxicity studies and lethal dose (LD50) test
Acute toxicity studies of the methanol extract of S. dulcificum pulp was carried out by the
Lorke (1983) method. A total of twenty two male albino mice were used for the determination.
The studies were conducted in two phases. In phase I, three groups of three (3) mice per group
were administered one dose of the extract daily through oral route, by means of polythene
cannula, 10mg/kg b.w, 100mg/kg b.w, and 1000mg/kg b.w. respectively for each group. The
mice were monitored for 24hours for mortality and general behaviour. In phase II, after 24hours,
three (3) mice each were given different concentrations (1,600mg/kg, 2,900mg/kg respectively)
orally, by means of polythene cannula based on the findings from phase 1. The fourth mice
received distilled water which served as control. The mice were monitored for 24 hours for
lethality and general behaviour.
2.2.5 Proximate Analysis
Percentage concentrations of protein, fat, carbohydrate crude fibre, moisture and ash were
determined for S. dulcificum using the AOAC method (1990).
2.2.5.1 Moisture
Method:
The crucible and freshly collected samples of pulp (2 g) were weighed and dried in the
oven at 110oC to constant weights. The dishes and samples were cooled and reweighed and
percentage moisture content calculated using.

lxvii
% Moisture = 1001
32 ×−
W
WW
Where
W1 = Weight of sample
W2 = Initial weight of sample and dish
W3 = Final weight of dry sample and dish
2.2.5.2Crude Protein
Principle:
The crude protein content was determined using the micro Kjeldahl method. The method
is generally used to determine nitrogen (N) in substances which contain N as ammonium salts,
nitrates or organic N compounds. Since it measures the total amount of N in a compound, only a
rough indication of the total protein content (a measure of N quantity and not quality) can be
obtained and is termed crude protein. The quantity of N measured is then multiplied by 6.25 to
calculate the protein content of the compound. The multiplication factor can vary with some
materials (AOAC, 1990)
The N of protein and other compounds are converted into ammonium sulphate by acid
digestion with boiling H2SO4. The acid digest is cooled, diluted with water and made strongly
basic with NaOH. Ammonium is released and distilled into a 4% boric acid solution. The amount
of ammonium borate formed is determined with standardized H2SO4.
The indicator used, bromocresol green, gives a pink coloured end point at a hydrogen ion
concentration corresponding to a solution of NH4Cl. Boric acid itself is so weak that it has no
appreciable influence on the pH concentration.
The method involves three major steps:
• Digestion of the sample
• Distillation of the ammonia into a trapping solution.
• Quantification of the ammonia by titration.
Digestion: A small quantity of sample of the pulp (0.1g) was weighed in a Kjeldhal flask with 2g
of catalyst (sodium sulphate/copper sulphate). Concentrated H2SO4 (20ml) was poured into the
lxviii
flask and the contents gently heated. The heating was increased until the contents of the flask
were completely digested giving a clear solution.
Distillation: The content of the flask was washed with 220ml distilled water into a distillation
flask and cooled under ice. A quantity, 100ml of 4% boric acid was poured into the same flask
and 3 drops of screened methyl red was added.
Back titration: Cooled 40% NaOH (50ml) was added into the same flask and the distillate was
titrated against 0.5N Na2SO4 solution.
% Nitrogen = 100××××SampleofWeight
MWNDfNT
Where
T = Titre volume
N = Normality of acid
Df = Dilution factor
MWN = Molecular weight of nitrogen
% Protein = % Nitrogen × 6.25
Where 6.25=conversion factor of nitrogen to protein
2.2.5.3 Crude Fat
Principle:
The sample was continuously extracted with ether for 5 hours, using a soxhlet apparatus.
After extraction, the ether extract was evaporated to dryness and the residue designated the ether
extract. This is sometimes referred to as the fat portion of the sample. However, the ether extract
also contains organic acids, oils, pigments, alcohols and fat-soluble vitamins and this is termed
crude fat. Many of the complex lipids, such as phospholipids are not completely extracted in this
procedure (Ensimger and Olentine, 1978).
Method:
A washed, dried and cooled soxhlet apparatus was weighed. A fresh sample of pulp (2g)
was weighed into extraction thimble and placed into the quick-fit soxhlet apparatus. The solvent
flask containing 250ml of diethyl ether was connected to a condenser. The set-up was heated for

lxix
5 hr. The extract was evaporated at 70oC to remove the solvent present. The flask was reweighed
and percentage fat calculated as follows:
% Crude Fat = 100×SampleofWeight
OilofWeight
2.2.5.4 Crude Fibre
Principle:
This fraction was designed to include those materials in food which are of low
digestibility namely cellulose, certain hemicelluloses and some of the lignin, if present. Some of
the lignin, however, may be included in the nitrogen free extract. A moisture–free, ether extract
is digested first with weak acid solution (1.25% H2SO4) and then with a weak base solution
(1.25% NaOH). The organic residue left after digestion was collected. The loss of weight on
ignition was called crude fibre.
Method:
Sample of the pulp (2 g each) was weighed into 50 ml beakers containing pre-heated
diluted 1.25% H2S04 about (40ml). The content was boiled for 30 minutes and filtered. The
residue was washed three times with hot water, then 150ml of pre-heated 1.25% KOH and drops
of antifoam agent (loctanol) were added to the sample in the beaker and heated to boiling. The
mixture was boiled slowly for 30 minutes more, filtered and washed three times with hot water.
Acetone was then used in washing it three times in cold extraction unit and the content dried at
130oC for an hour.
The content was then ashed at 500oC and the ash weighed and percentage fibre
calculated.
% Crude Fibre = 100×SampleofWeight
FibreofWeight
2.2.5.5Ash/Mineral Matter
Principle:
The sample was ashed at 600oC to burn off all organic materials. The inorganic material which
did not volatilize at this temperature was designated ash.

lxx
Method:
A quantity (2g) of pulp was placed into a previously weighed porcelain dish and
reweighed. The crucible with sample was placed in a muffle furnace at 600oC for 3hours. The
crucible with the ash was cooled in a desiccator and reweighed and percentage ash content
calculated using the relationship:
% Ash = 12
13
WW
WW
−−
Where
W1 = Weight of crucible
W2 = Weight of crucible and sample
W3 = Weight of crucible and ash
2.2.5.6 Carbohydrate or Nitrogen Free Extract (NFE)
Principle:
This is also known as nitrogen free extract (NFE). It includes mostly sugars and starches
and also some of the more soluble hemicelluloses and lignin (Cullison, 1982). Since this fraction
was designed to include the more soluble carbohydrates, it is sometimes referred to as the
carbohydrate portion of the material being analysed.
Method:
NFE was determined by subtracting the sum of the other fractions from 100 as follows:
100 – (% moisture+ % crudeprotein + % crude fat + crude fibre + % ash) = % NFE.
2.2.6 Estimation of vitamins (AOAC, 1990)
2.2.6.1 Estimation of Vitamin A (Beta-Carotene)
To 10g aliquot of the edible pulp was added 50ml of acetone:petroleum ether (1:1v/v).
After two hours, the mixture was filtered and the volume of the filtrate measured. An equal
volume of 50% NaCl was added to wash the filtrate. It was shaken and transferred into a
separating funnel. The lower layer was removed and the supernatant collected and washed with

lxxi
equal volume of 10% K2CO3 and separated. The upper layer was washed with 20ml distilled
water, separated carefully and its absorbance was read at 390nm using 1:1v/v acetone/ petroleum
ether as blank.
To get the concentration in mg/g, the following relationship was employed
materialStartingmlCuvetteofVolume
SampleExtractedofVolumeX
××
)5(
Where X is concentration extrapolated from the standard curve.
2.2.6.2 Determination of Vitamin C
To a 10g quantity of the edible pulp was added 80ml ethanol and 20ml of distilled water;
it was covered and shaken in an orbital shaker for 2hours. Then, it was filtered and the volume of
the filtrate measured. The filtrate (5 ml) was measured into a conical flask, 50ml of distilled
water and 2.5ml of 1M H2SO4 were added. 1ml of 10% starch indicator was added and titrated
with 0.05M iodine solution till a blue-black colour appeared.
To get concentration in mg/g, the following relationship was employed.
SampleofWeightmlCurvetteofVolume
ExtractofVolVT
×××
)5(
00886.0..
where
T.V is Titre value.
One ml of 0.05M iodine solution liberates 0.00886g of Vitamin C
2.2.6.3 Determination of Vitamin D
A quantity, 20 ml of petroleum ether was added to 1 g of pulp and allowed to stand for 1
hr with intermittent shaking every 10 min. It was centrifuged for 5 min then 3 ml of supernatant
was put in a flask and evaporated to dryness, alcohol potassium hydroxide, 2 ml was added and
boiled for 30 min. To the mixture, 0.5 ml of 0.1% pyrogallol and 4 drops of 10% aluminium

lxxii
chloride were added and heated in a water bath for 4 min. After allowing the mixture to cool, 4.5
ml of ethanol was added and absorbance measured at wavelength of 470nm. Vitamin D
concentration was extrapolated from the standard curve.
2.2.6.4 Determination of Vitamin E
A sample of thepulp (1g) was weighed out into a conical flask and 5ml acetone was
added and allowed to stand for 10minutes. 2ml of distilled water and 5ml of petroleum ether
were added to the filtrate (oily layer). 5ml of the oily layer was collected and its absorbance was
read at 450nm. A standard curve was prepared using vitamin E standard treated same as sample.
To get the concentration in mg/g, the following relationship was employed
materialStartingmlCuvetteofVolume
SampleExtractedofVolumeX
××
)5(
Where
X is concentration extrapolated from the graph
2.2.6.5 Determination of Vitamin K
A quantity, 20 ml of petroleum ether was added to 1 g of pulp and allowed to stand
for 1 hr with intermittent shaking every 10 min. It was centrifuged for 5 min then 3 ml of
supernatant was put in a flask and evaporated to dryness. Water, 2 ml and 1 ml of 0.04% 2, 4-
dinitrophenylhydrazine was added, the mixture was then boiled in a water bath for 15 min,
cooled and made up to 10 ml with ammonium hydroxide. It was mixed properly and absorbance
measured at wavelength of 635nm. Vitamin K concentration was extrapolated from the standard
curve
2.2.7 Determination of Mineral Content of S. dulcificum Pulp
Principle:
Atomic absorption spectrophotometerquantitatively measures the concentration of
elements present in a sample. It utilizes the principle that elements in the gas phase absorb light
at very specific wavelengths; this gives the technique excellent specificity and detection limits.
lxxiii
The liquid is drawn into a flame where it ionizes in the gas phase. The absorption is proportional
to the concentration of the element.
Digestion
An(0.2g) amount of the sample was weighed out. After adding 5 ml of perchloric acid,
10ml of concentrated HCl was also added. The mixture was put in an oven at 150oCfor
45minutes after which it was transferred into a 250ml conical flask and made up to mark. It was
then analysed using atomic absorption spectrophotometer (AAS) which was at the set absorbance
mode.
2.2.7.1 Determination of Phosphorus
The wavelength of the spectrophotometer was first set at 650nm. 10ml of the digested
sample was measured into a conical flask and 4ml of 1.25% ammonium molybdate and 4ml of
10N H2SO4 were added in that order. After shaking properly, four drops of 2.5% stannous
chloride were added. It was transferred into a 50ml flask and made up to mark with distilled
water. The absorbance was then taken at 650nm. Phosphorus concentration was extrapolated
from the standard curve.
2.2.8 Determination of Amino Acid Profile
Principle of assay:
The amino acid profile in the pulp sample was determined using the methods described
by Benitez (1984). The pulp sample was dried to a constant weight, defatted using soxhlet
apparatus, hydrolyzed with 6N HCl and evaporated in a rotary evaporator to a constant weight
and loaded into the Technicon sequential multi sample Amino Acid Analyzer (TSM).
2.2.8.1 Defatting of the Pulp
A quantity, 2g of the pulp was weighed into extraction thimble and the fat was extracted
with chloroform/ methanol (2:1v/v) using soxhlet extraction apparatus as described by AOAC
(2006). The extraction lasted for 15hrs.
lxxiv
2.2.8.2 Hydrolysis of the Pulp
A known weight of the defatted sample was weighed into glass ampoule. 7 ml of 6 N HCl
was added and oxygen was expelled by passing nitrogen into the ampoule (this is to avoid
possible oxidation of some amino acids during hydrolysis e.g. methionine and cysteine). The
glass ampoule was then sealed with Bunsen burner flame and put in an oven at 105ºC ± 5ºC for
22 hours. The ampoule was allowed to cool before being broken open at the tip and the content
was filtered to remove the humins. It should be noted that tryptophan is destroyed by 6 N HCl
during hydrolysis.
The filtrate was then evaporated to dryness at 40ºC under vacuum in a rotary evaporator.
The residue was dissolved with 5 ml of acetate buffer (pH 2.0) and stored in plastic specimen
bottles which were kept in the freezer.
2.2.8.3 Nitrogen Determination
A small amount (200mg) of the pulp was weighed, wrapped in Whatman filter paper
No.1 and put in the Kjedahl digestion flask. Concentrated sulphuric acid (10ml) was added.
Catalyst mixture (0.5g) containing sodium sulphate (Na2SO4), copper sulphate (CuSO4) and
selenium oxide (SeO2) were added in the ratio of 10:5:1v/v/v into the flask to facilitate digestion.
Four pieces of anti-bumping granules were also added.
The flask was then put in Kjedahl digestion apparatus and digestion carried out for
3hours until the liquid turned light green. The digested sample was cooled and diluted with
distilled water to 100ml in standard volumetric flask. Aliquot (10ml) of the diluted solution with
10ml of 45% sodium hydroxide was put into the Markham distillation apparatus and distilled
into 10ml of 2% boric acid containing 4drops of bromocresol green/ methyl red indicator until
about 70ml of distillate was collected.
The distillate was then titrated with standardize 0.01N hydrochloric acid to grey coloured
end point, the percentage nitrogen in the original sample was calculated using the formula:
Percentage nitrogen = (a-b) x 0.01 x 14 x V x 100
W x C
Where a =Titre value of the digested sample
b=Titre value of blank sample
v=Volume of dilution (100ml)

lxxv
w=Weight of dried sample (mg)
C=Aliquot of the sample used (10ml)
14= Nitrogen constant in mg
2.2.8.4 Loading of the Hydrolysate into TSM Analyzer
The amount loaded was between 5 – 10 microlitre. This was dispended into the catridge
of the analyzer. The TSM analyzer is designed to separate and analyzer free acidic, neutral and
basic amino acids of the hydrolysate. The period of analysis lasted for 76min.
2.2.8.5 Method of Calculating Amino Acid values using Chromatogram Peaks
The net height of each peak produced by the chart recorder of TSM (each representing an
amino acid was recorded). The half- height of the peak on the chart was found and the width of
the peak on the half height was accurately measured and recorded. Approximately area of each
peak was then obtained by multiplying the height with the peak at half-height.
The norcleucine equivalent (NE) for each amino acid in the standard mixture was
calculated using the following formula:
NE = Area of norcleucine peak Area of each amino acid A constant S was calculated for each amino acid in the standard mixture:
Where Sstd = NEstd x molecular weight x µMAAstd
Finally, the amount of each amino acid present in the pulp was calculated in g/16gN or
g/100g protein using the formula
Concentration (g/100g protein) = NH x W@ NH/2 x Sstd x C
Where C = dilution x 16 + NH x W(nlcµ) Sample weight (g) x N% x 10 x vol. loaded Where NH = net height
W = width @half height
nlcµ =norleucine
2.2.9 Qualitative Phytochemical Studies on SynsepalumdulcificumPulp
Phytochemical methods of Trease and Evans (1983) and Harborne (1983) were used in
the study.

lxxvi
2.2.9.1 Test for Alkaloids
Acidic extract was prepared by heating a conical flask containing 0.2 g of the soft pulp
samples in 5 ml of 2% HCl in a steam bath. The content of the flask was boiled, cooled and
filtered. An aliquot portion (1 ml) was put in three test tubes.
Few drops of Mayer’s reagent were added to one test tube containing 1 ml aliquot of the
filtrate and observed for the presence of turbidity or precipitate. To another 1 ml, few drops of
Dragendorff’s reagent were added and observed for white precipitate. To the other 1 ml portion
was added a few drops of Wagner’s reagent. The appearance of turbidity or precipitate was
indicative of a positive result.
2.2.9.2 Test for Glycosides
To 3 g quantity of S.dulcificum pulp in a flask was added 30 ml of water and boiled for 5
minutes. The contents were filtered. Dilute H2SO4(5 ml) was added to 10 ml of filtrate and
heated for five minutes to facilitate hydrolysis. The solution was neutralized with dilute KOH.
The resulting solution was tested with Fehlings solution A and B. Reddish brown precipitate was
indicative of a positive result.
2.2.9.3 Test for Cyanogenic Glycosides
To 1 g pulp in a conical flask was added 10 ml water and 1 ml dilute HCl. Picrate paper
was suspended above the mixture. The contents of the flask were heated at 45oC for 1 hour. A
control without the pulp was set up. A colour change from yellow to reddish purple of the picrate
paper was a positive test.
2.2.9.4 Test for Tannins
Water (10 ml) was added to 0.5 g of pulp in a conical flask and brought to boiling. The
contents were filtered and the filtrate was diluted with 5 ml of distilled water and a few drops of
ferric chloride solution were added. A deep blue-black precipitate was indicative of positive test.
2.2.9.5 Test for Saponins
The edible pulp (1 g) was extracted with 20ml water in a conical flask. The contents were
boiled for five minutes, filtered hot and then cooled. A 5 ml aliquot of the filtrate was diluted

lxxvii
with distilled water and shaken. Foaming which did not break on standing was indicative of a
positive result. To another 5 ml portion was added some drops of vegetable oil and shaken
thoroughly. This was left to stand for 5 min and observed for emulsification.
2.2.9.6 Test for Flavonoids
A mixture of 0.2 g of edible pulp and 10ml ethylacetate in a conical flask was heated in
boiling water bath for 3 minutes. The solution was filtered and the filtrate was divided into two
different test tubes. To 4 ml portion of filtrate in a test tube was added 1 ml ammonia solution.
To another 4 ml portion of filtrate was added few drops of 1% ferric chloride solution. The two
test tubes were thoroughly shaken and observed for colour changes.
2.2.9.7 Test for Resins
A quantity, (0.2 g) of the edible pulp was extracted with 15ml of 96% ethanol and
filtered. The alcohol extract was then poured into 20ml of distilled water in a beaker. A
precipitate occurring indicates the presence of resins. Another 0.2g of the sample was extracted
with 10 ml chloroform and the extract evaporated to dryness. The residue was redissolved in 3
ml of acetone and 3 ml of concentrated hydrochloric acid was added. The mixture was heated in
water bath for 30 minutes. Pink colour which changes to magenta red indicates the presence of
resins.
2.2.9.8 Test for Terpenoids and Steroids
Ethanol (9 ml) was added to 1 g of the edible pulp and refluxed for a few minutes and
filtered. The filtrate was concentrated down to 2.5 ml in a boiling water bath and 5 ml of hot
water was added. The mixture was allowed to stand for 1hour and the waxy matter filtered off.
The filtrate was extracted with 2.5 ml of chloroform in a separating funnel. To 0.5ml of the
chloroform extract in a test tube, 1 ml of concentrated sulphuricacidwas carefully added to form
a lower layer. A reddish brown interface shows the presence of steroids.
Another 0.5ml of the chloroform extract was evaporated to dryness in a water bath and
heated with 3 ml of concentrated sulphuric acid for ten minutes in a water bath. A grey colour
indicates the presence of terpenoid.

lxxviii
2.2.10 Quantitative Phytochemical Analysis of S.dulcificum Pulp
The quantitative phytochemical analysis of S.dulcificum pulp was determined using standard
methods described by Harborne (1984); Obadoni and Ochuko (2001); Boham and Kocipai
(1994) and Nabavi et al. (2008).
2.2.10.1 Determination of Alkaloids
The alkaloid content of Synsepalum dulcificum pulp was determined gravimetrically
(Harborne, 1993). A quantity, 5 g of S.dulcificum pulp was weighed using a balance and
dispersed into 50 ml of 10% acetic acid solution in ethanol. The mixture was well shaken and
then allowed to stand for about 4 hours before it was filtered. The filtrate was then evaporated to
one quarter of its original volume on a hot plate. Concentrated ammonium hydroxide was added
dropwise in order to precipitate the alkaloids. A pre-weighed filter paper was used to filter off
the precipitate and it was then washed with 1% ammonium hydroxide solution. The filter paper
containing the precipitate was dried on an oven at 60ºC for 30 minutes, transferred into
dessicators to cool and then reweighed until a constant weight was obtained. The constant weight
was recorded. The weight of the alkaloid was determined by weight difference of the filter paper
and expressed as a percentage of the sample weight analysed.
% Alkaloids = W2 – W1 X 100
Wt of sample
Where W1 = Weight of the filter paper and W2 = Weight of the paper + alkaloid precipitate
2.2.10.2 Determination of Cyanogenic Glycosides
Principle of assay:
The AOAC (2006) method was used to determine the quantity of cyanogenic glycosides
present in synsepalum dulcificum pulp. A quantity, 40 ml distilled water was added to release
bound hydrocyanic acid after which it was distilled and titrated against AgNO3 solution.
Method:
S.dulcificum pulp, 4g was soaked in a mixture containing 40 ml distilled water and 2 ml
of orthophosphoric acid. The mixture was stirred, stoppered and left overnight at room
temperature to set free all bounded hydrocyanic acid. The resulting sample was transferred to a

lxxix
distillation flask and a drop of tannic acid added (as an anti-foaming agent) together with broken
chips (as anti-bumps). The flask was fitted into another distillation apparatus before distillation.
About 5 ml of distillate was collected in the receiving flask containing 40 ml of distilled water
and 0.1 g NaOH pellets. The distillate was then transferred into 25 ml volumetric flask and 1.6
ml of 5% potassium iodide solution was added to the flask. The resulting mixture was titrated
against 0.01 M AgNO3 until the end point was indicated by a faint but permanent turbidity. The
blank was also prepared using distilled water instead of the distillate.
The amount of cyanide (mg/kg) = 13.5 (Vi-V0)
M
Where Vi = Titre value for S.dulcificum pulp, V0 = Titre value for blank and M = mass of
S.dulcificum pulp.
2.2.10.3 Determination of Saponins
A quantity, 20 g of S.dulcificum pulp was placed in 200 ml of 20% ethanol. The
suspension was heated over water bath for 4 hours with continuous stirring at 55ºC. The mixture
was filtered and the residue re-extracted with another 200 ml of 20% ethanol. The combined
extracts were reduced to 40 ml over a water bath at 90ºC. The concentrate was transferred into a
250 ml separating funnel and 20 ml diethyl ether was added and shaken vigorously. The aqueous
layer was recovered while the ether layer was discarded. The purification process was repeated
until a colourless solution was obtained. Thereafter, 60 and 30 ml portions of n-butanol were
added to the solution and shaken vigorously following each addition. The combined butanol
extract was washed using 5% aqueous NaCl and evaporated to dryness to give crude saponin,
which was weighed (saponin content = weight of sample before extraction- weight of extract
after extraction). The saponin content was calculated in percentage (Obadoni and Ochuko, 2001).
2.2.10.4 Determination of flavonoids
A quantity (10 g) of S.dulcificum pulp was extracted repeatedly with 100 ml of 80%
aqueous methanol at room temperature. The solution was filtered through what man filter paper
No.4 (125 mm). The filtrate was later transferred into a crucible and evaporated to dryness over a

lxxx
water bath, weighed and expressed as a percentage of the sample weight analysed (Nabavi et al.,
2008).
2.2.10.5 Determination of tannins
Tannin content of S.dulcificum pulp was determined by the Follins-Dennis
spectrophotometric method of Pearson (1976). S.dulcificum pulp, 1 g was dispensed in 50 ml of
distilled water and shaken to mix well for 30 minutes in the shaker. It was filtered and the filtrate
was used for the experiment. The extract, 5 ml was measured into 50 ml volumetric flask and
diluted with 35 ml of distilled water. Similarly, 5 ml of standard tannin solution (tannic acid) and
5 ml of distilled water were measured into separation flasks to serve as the standard and blanks
respectively. Both were also diluted with 35 ml of distilled water. Follin–Dennis reagent, 1 ml
was added to each of the flasks followed by 2.5 ml of saturated sodium carbonate (Na2CO3)
solution. The content of each flask was made up to mark and incubated for 90 min at room
temperature. The absorbance of the developed colour was measured at 760 nm wavelength with
the reagent blank at zero. The experiment was repeated two more times to get an average. The
tannin content was calculated as shown below:
% Tannin = 100 x Au x C x Vf x D
1 As Va
Where: Va = Weight of sample analysed, Au = Absorbance of the test sample, As = Absorbance
of standard tannin solution, Vf = volume of volumetric flask used and C = Concentration of
standard in mg/ml
2.2.10.6 Determination of Steroids
Petroleum ether (20ml) was added to 1g of the pulp and allowed to stand for 1 hr with
intermittent shaking every 10 min. It was centrifuged for 5 min, then 2 ml of supernatant was put
in a flask and 2 ml of alcoholic potassium hydroxide was added. The mixture was boiled for 30
min, cooled and 3 ml of petroleum ether added. It was shaken for 2 min, centrifuged for 5 min
and 2 ml of supernatant put in another flask. Then, the mixture was evaporated to dryness,
cooled and 2 ml of ethanol added to dissolve the residue.
lxxxi
Colour reagent, 2 ml was added, shaken vigorously and allowed to stand for 30 min.
Absorbance was measured at wavelength of 550 nm. Concentration of steroids was extrapolated
from the standard curve.
2.2.10.7 Determination of terpenoids
To 0.5 g of pulp, 10 ml of absolute ethanol was added and centrifuged for 5 min. A
quantity, 1 ml of supernatant was put in a flask then 1 ml of 5% aqueous phosphomolybdic acid
solution and 1 ml concentrated sulphuric acid gradually added to the mixture and allowed to
stand for 30 min. A quantity, 2 ml of ethanol was added and absorbance measured at 700 nm.
Concentration of terpenoids was extrapolated from the standard curve.
2.2.11 Antinutrient analysis of S. dulcificum
The concentrations of some antinutrients like oxalates, phytate, and hemaglutannin were
determined by the method described by the Association of Official Analytical Chemists (AOAC,
1990).
2.2.11.1 Determination of Oxalates
Principle of Assay: It involves the digestion of sample with glacial acetic acid and precipitation
of oxalate to remove ferrous ions on addition of ammonium hydroxide solution.
Method:
The method of Munro and Basir (1969) was used for the extraction. A quantity, 5 g of the
sample was extracted 3times by warming (40-500C) and stirring with magnetic stirrer for 1 hour
in 20 ml of 0.3 N HCl. The combined extract was diluted to 100ml with water and used for total
oxalate estimation.
For oxalate estimation, 5 ml of extract was made alkaline with 1 ml of 5N ammonium
hydroxide. This was made acid to phenolphthalein by drop wise addition of glacial acetic acid. A
volume, 1.0ml of 5% CaCl2 solution was then added and the mixture allowed to stand for 3
hours, after which it was centrifuged at 3000rpm for 15minutes. The supernatants were discarded
and the precipitate washed 3 times with hot water with thorough mixing and centrifuging each
time. Then to the test tube, 2 ml of 3N H2SO4 was added and the precipitate dissolved by
warming in a water bath at 800C. The content of the tube was then titrated with freshly prepared

lxxxii
0.01N KMnO4. Titration was carried out at room temperature until the first pink colour appeared
throughout the solution, and then allowed to stand until the solution turned colourless. The
solution was then warmed to 800C and titration continued until a pink colour persisted for at least
30 seconds.
Oxalate = T x (Vme)(Df) x 10 x 10(mg/100g)
ME x Mf
Where T= titre value of KMnO4, Df= dilution factor, Vme = volume-mass equivalent (that is, 1
ml of 0.05M KMnO4solution is equivalent to 0.00225g anhydrous oxalic acid), ME= molar
equivalent of KMnO4, Mf = mass of sample used
2.2.11.2 Determination of Phytate
Procedure:
Phytate was determined using the procedure described by Lucas and Markakas (1982). A
quantity, 2 g of the sample was weighed into 250 ml conical flask. This was followed by the
addition of 100 ml of 2% hydrochloric acid and this was filtered through a double layer of
hardened filter papers. A volume, 50 ml of filtrate was placed in 250 ml marked beaker and 107
ml of distilled water was added in each case. Then, 10 ml of 0.3% ammonium thiocyanate
solution was added into the solution as indicator. This was titrated with standard ferric chloride
solution (which contained 0.00195 g iron per ml) to an end point of slightly brownish-yellow
coloration which persisted for 5 minutes. The percentage phyate was calculated.
% phytate (g/100g) = Ɣ x 1.19 x 100
Where Ɣ = titre value x 0.00195
2.2.11.3 Determination of haemagglutanin
A quantity, 0.5 g of pulp was weighed and dispersed into a 10 ml normal saline solution
buffered at pH 6.4 with 0.01 M phosphate buffer solution, allowed to stand at room temperature
for 30 min and centrifuged for 20 min. To 0.1 ml of the extract diluent, 1 ml of trypsinized rabbit
blood was added. The blood cells served as the control. Normal saline, 1 ml was added to the
flasks and allowed to stand for 10 min after which the absorbance was read at 620 nm. The flask
containing only blood cells and normal saline served as the blank.

lxxxiii
Haemagglutanin unit/mg = (b-a) x F
Where b = absorbance of test sample solution
a = absorbance of the blank control
F = (1/w x Vf/Va )D
Where w = weight of sample
Vf = total volume of extract
Va = volume of extract used in the assay
D = dilution factor
2.2.12 Blood Sample Collection for Biochemical Analysis
Blood samples for biochemical analyses were collected from the retro-bulbar plexus of
the medial canthus of the eye of the rats. Microcapillary tube was carefully inserted into the
medial canthus of the eye to puncture the retro-bulbar plexus to enable outflow of about 2ml of
blood into a clean glass test tube. The blood sample was kept at room temperature for thirty
minutes to clot. The blood sample was then centrifuged at 3,000 revolutions per minute for
10minutes using a table top centrifuge. The clear supernatant serum was then carefully aspirated
with syringe and needle and stored in a clean sample bottle for the biochemical analyses.
2.2.13Biochemical Assays
2.2.13.1Alanine aminoTransaminase (ALT) Activity
The activity of (ALT) was determined by the Reitman-Frankel colorimetric method
(Reitman and Frankel, 1957) for invitro determination of GPT/ALT in serum using a
QuimicaClinicaApplicada (QCA) test kit.
Principle:
Alanine aminotransaminase also called glutamic-pyruvate transaminase (GPT) catalyses
the transfer of α-amino group from alanine to α-ketoglutarate with the release of pyruvate and
glutamate.
L- alanine + α -oxologlutarate ALT pyruvate + L – glutamate - - - -I
Pyruvate + Reduced Cofactor + H+ Lactate + Cofactor - - - - II
ALT activity was measured by monitoring the concentration of pyruvate hydrazone formed with
2,4-dinitrophenylhydrazine which is proportional to its concentration at 505nm.

lxxxiv
Reagents
GPT substrate solution (Reagent A), containing phosphate buffer pH 7.4 and α - ketoglutaric
acid and L-alanine.
Colour developer (Reagent B), containing 2, 4–dinitrophenylhydrazine (DNPH)
NaOH 4N- This was diluted 1/10 with deionized water prior to use (Reagent C). The diluted
NaOH needed not be refrigerated
Standard (Reagent D), aqueous solution of sodium pyruvate.
Methodology
To each of the test tubes were added 0.5 ml of Reagent A (ALT substrate solution) and
incubated for 5 min at 37˚C. After incubation 0.1 ml of each of the serum samples was then
added. The test tubes were incubated foe 30 mins at 37˚C. The standards were prepared as
follows;
Tube 1 – 0.1 ml deionised water + 0.5 ml reagent A
Tube 2 - 0.1 ml deionised water + 0.45 ml reagent A+ 0.05 ml of standard
Tube 3 - 0.1 ml deionised water + 0.40 ml reagent A+ 0.10 ml of standard
Tube 4 - 0.1 ml deionised water + 0.35 ml reagent A+ 0.15 ml of standard
Tube 5 - 0.1 ml deionised water + 0.30 ml reagent A+ 0.20 ml of standard
A 0.5 ml of colour developer (Reagent B) was then added to both sample tubes and the
standards. They were allowed to stand for 20 min at room temperature. After, 5 ml of NaOH
working solution (diluted reagent C) was added and they were left to stand for 15 min at room
temperature. The absorbencies of both samples and standards were read at505nm against
deionised water blank within 1 hr. To obtain ALT activity/ value of the samples were
intrapolated in the calibration curve made from the standards; the results were expressed in SI
units [International units per litre ( iU/L)].
2.2.13.2 Aspartate Aminotransferase Activity
GOT (AST) activity was determined by the Reitman – Frankel colorimetric method
(Reitman and Frankel, 1957) for invitro determination of GOT/AST in serum using a
QuimicaClinicaApplicada (QCA) test kit.
lxxxv
Principle
Aspartate aminotransferase (AST) formerly called glutamate–oxaloacetate transaminase
(GOT) is measured by monitoring the concentration of oxaloacetate hydrazone formed with 2, 4-
dinitrophenylhydrazine. The enzyme catalyzes the transfer of the α - amino group from aspartate
to α- ketoglutarate with the release of oxaloacetate and glutamate
L-aspatate + α - ketoglutarate AST oxaloacetate + L- glutamate- - - -I
Oxaloacetate + NADH + H+ Malate+ NAD+ - - - - -II
AST activity was measured by monitoring the concentration of oxaloacetate hydrazone formed
with 2,4 – dinitrophenylhydrazine spectrophotometrically at 505nm
Reagents
GOT/AST substrate solution (Reagent A), containing phosphate buffer pH 7.4 and α -
ketoglutaric acid and L-Aspartatic acid.
Colour developer (Reagent B), containing 2,4–denitrophenylhydrazine (DNPH)
NaOH (4N) – This was diluted 1/10 with deionized water prior to use (Reagent C). The diluted
NaOH needed not be refrigerated
Standard (Reagent D), aqueous solution of sodium pyruvate.
Methodology
To each of the test tubes were added 0.5 ml of Reagent A (AST substrate solution) and
incubated for 5 min at 37˚C. After incubation 0.1 ml of each of the serum samples was then
added. The test tubes were incubated foe 60 mins at 37˚C. The standards were prepared as
follows;
Tube 1 – 0.1 ml deionised water + 0.5 ml reagent A
Tube 2 - 0.1 ml deionised water + 0.45 ml reagent A+ 0.05 ml of standard
Tube 3 - 0.1 ml deionised water + 0.40 ml reagent A+ 0.10 ml of standard
Tube 4 - 0.1 ml deionised water + 0.35 ml reagent A+ 0.15 ml of standard
Tube 5 - 0.1 ml deionised water + 0.30 ml reagent A+ 0.20 ml of standard

lxxxvi
A 0.5 ml of colour developer (Reagent B) was then added to both sample tubes and the
standards. They were allowed to stand for 20 min at room temperature. After, 5 ml of NaOH
working solution (diluted reagent C) was added and they were left to stand for 15 min at room
temperature. The absorbencies of both samples and standards were read at505nm against
deionised water blank within 1 hr. To obtain AST activity/ value of the samples were
intrapolated in the calibration curve made from the standards; the results were expressed in SI
units [International units per litre ( iU/L)].
2.2.13.3Alkaline Phosphatase (ALP) activity
Phenolphthalein monophosphate method (Klein et al.,1960) for the in vitro determination
of alkaline phosphatase in serum using Quimica ClinicaApplicada (QCA) test kit.
Principle
Alkaline phosphatase acts upon the AMP-buffered sodium thymolphthalein
monophosphate. Addition of the alkaline reagent stops the enzyme activity and simultaneously
develops a blue chromagen which can be measured photometrically at wavelength of 550nm.
Reagents
Alkaline phosphatase chromogenic substrate, colour developer, standard solution of
alkaline phosphatase in water (equivalent to 30 IU/L).
Methodology
The colour developer was prepared by adding one vial of colour developer salt to 250ml
of deionized water. Deionized water 0.1ml was added to a clean test tube, one drop of
chromogenic substrate was added, mixed and incubated at 37oC for 5minutes. Serum sample
(0.1ml) was added to the test tube, mixed and incubated at 37oC for 20 minutes. 5ml of colour
developer was added. The absorbance was read against a water blank at wavelength of 550nm.
For the standard, one ml of water was added to a test tube and one drop of the chromogenic
substrate added. It was mixed and incubated at 37oc for 20minutes. Colourdeveloper (5ml) was
added and absorbance read at 550nm.

lxxxvii
The following formula was used to obtain the alkaline phosphatase activity in the serum
sample.
1
30
tan×
dardSofAbsorbance
SampleofAbsorbance= IU/L of alkaline phosphatase
Where 30 = standard concentration in solution of alkaline phosphatase in water
2.2.13.4 BilirubinUsing Colorimetric Method
Principle
Bilirubin reacts with diazotized suphanilic acid in alkaline medium to form a blue coloured
complex. Total bilirubin concentration is determined in the presence of caffeine, which releases
albumin bound bilirubin, by the reaction with diazotized suphanilic acid. The increase in
absorbance at 578nm is directly proportional to the total bilirubin concentration (Doumas et al.,
1973).
Reagents
1. Reagent A – Sulphuric acid
2. Reagent B – Caffeine solution
3. Reagent C – Tartarate solution
4. Reagent D – Sodium nitrite
2.2.13.4.1 Determination of Total Bilirubin (TB) Concentration
Procedure
Reagent 1, sulphanilic acid, hydrochloric acid (0.20ml each), was pipetted into two
different cuvettes labeled sample blank (B) and sample (A) respectively, then a drop (0.05ml) of
the reagent was introduced. A drop of 0.05ml of the reagent was pipetted into the cuvette
containing sample (A) only.
Afterwards, 1.0ml of reagent 3 (caffeine, sodium benzoate) was pipetted into the cuvettes
containing samples B and A respectively. Serum sample (0.2ml) was then pipetted into both

lxxxviii
cuvettes, sample blank (B) and sample (A). Their contents were separately mixed and allowed to
stand at 250C for 10min.
This was followed by the addition of 1ml of reagent 4 (tartrate, sodium hydroxide) into
both cuvettes. They were mixed and allowed to stand at 250C for 30min. Finally, the absorbance
of the sample against the sample blank (ATB) was read at 560nm. Total bilirubin concentration
values were obtained using the relationship:
Total bilirubin (µmol/L = 185 x ATB (560nm)
or
Total bilirubin (mg/dl) = 10.8 x ATB (560nm)
2.2.13.5 Total Serum Protein
The Biuret method was used for total protein determination. Commercially prepared
Quimica Clinica Applicada (QCA) test kit (Quimica Clinica Applicada, Spain) was used for the
analysis.
Method of assay: Lubran (1978)
Basic principle
Cupric ions in alkaline medium interact with protein peptide bond resulting in the
formation of a coloured complex (violet colour) which is proportional to the amount of protein
present.
Materials
� Biuret Reagent
a. Sodium hydroxide 100 mmol/l
b. Na-K tartarate 16 mmol/l
c. Potassium iodide 15 mmol/l
d. Cupric Sulphate 6 mmol/l
100 ml of biuret reagent diluted in 400 ml of distilled water to give the standard
biuret reagent
e. Standard protein concentration 50g/L (5g/dl)
Procedure
A volume, 0.02 ml of each serum sample was dispensed into labeled test tubes. For the
standard, 0.02 ml of protein standard (60 mg/dl) was pipette into a test-tube. After this, 1.0 ml of

lxxxix
biuret reagent added to all the tubes and their contents were mixed and incubated at room
temperature (20-250C) for 10 minutes. Then the absorbance of the sample and the standard were
measured against the reagent blank containing 0.02 ml distilled water and 1.0 ml biuret reagent
at 540 nm.
Total protein concentration was calculated as follows:
Total protein (g/dl) = Abs of sample X 5
Abs of std 1
2.2.13.6 Serum Albumin
Method of Doumas, 1971 was used for serum albumin determination using commercially
prepared Quimica Clinica Applicada (QCA) test kit (Quimica Clinica Applicada, Spain).
Reagents (R1)
Bromocresol green 0.15 mmol/L
Succinate buffer pH 4.20; 75 mmol/L
Brij 35; 7ml/L
Reagent (R2)
Albumin standard 50g/L (5g/dl)
Principle
At pH 9.2, albumin bind with bromocresol green to produce a blue-green complex. The
change in absorbance at 628 nm correlates with the concentration of albumin.
Procedure:
A volume, 0.01 ml of serum sample was dispensed into labeled test tube. 1 ml of reagent
was dispensed into the test tube containing serum samples. For the standard, 0.01 m of albumin
standard (50 g/L) was dispensed into a test tube. After this, 1 ml of reagent 1 was added and the
components were mixed and incubated at room temperature (20-250C) for 30 minutes and
absorbance read against a reagent blank containing 0.01 M distilled water and 1 ml reagent at
600 nm.

xc
2.2.13.7 Creatinine
The modified Jaffe method (Blass et al., 1974) for the in vitro determination of creatinine
in serum using the QuimicaClinicaApplicada (QCA) creatinine test kit was employed in the
determination of creatinine concentration.
Principle
Creatinine in alkaline solution reacts with picrate to form a coloured complex. The rate of
increase in absorbance at 546nm due to the formationof the creatinine-picrate complex is directly
proportional to the concentration of creatinine in the sample.
Reagents
Reagent A = Alkaline solution containing NaOH and Na2CO3
Reagent B = Picric acid solution
Reagent C= Standard, an aqueous solution equivalent to 2mg/dl of creatinine.
Methodology
A working reagent composed of equal volumes of Reagent A and B (Alkaline solution
and picric acid solution) was prepared. For each determination, 0.5ml of Reagent A mixed with
0.5 ml of Reagent B gave 1ml of working reagent. For each serum sample, 0.1ml of sample was
added to 1.0ml of working reagent in a clean test tube. It was mixed properly and transferred to a
cuvette, a stop watch was started and absorbance was read at the 20th and 80th seconds against a
working reagent blank at 546nm. Two standards were prepared and run by adding 0.1ml of the
standard (Reagent C) to 1ml of working reagent in a test tube. It was mixed properly and
transferred to a cuvette, a stop watch was started and absorbance read at the 20th and 80th seconds
against a working reagent blank at 546nm for the samples. The mean of the standards was used
as the standard.
The following formula was used to calculate the serum creatinine concentration of each
sample
Serum creatinine concentration (mg/dl)

xci
= 1
2
tansec)2080(
sec)2080( ×−
−dardSofAbsorbanceofChange
SampleofAbsorbanceofChangethth
thth
Where 2 =standard concentration in aqueous solution of creatinine
2.2.13.8 Urea
The modified method of Searcyet al. (1967) for the in vitro determination of urea in
serum using a QuimicaClinicaApplicada (QCA) enzymatic urea test kit was used
Reagents
Reagent A – Urease /Salicylate which contains urease, sodium salicylate, sodium nitroprusiate,
EDTA – Na2 and phosphate buffer pH 6.8
Reagent B – Alkaline hypochlorite which contains alkaline hypochlorite in NaOH.
Reagent C – Standard containing aqueous solution of urea equivalent to 40mg/dl.
Methodology
Reagent A was prepared by dissolving one vial of the urea – salicylate in 100ml of
deionized water. Reagent B (alkaline hypochlorite was prepared by mixing /diluting the alkaline
hypochlorite supplied in 500ml of deionized water. Reagent A (0.1ml) was added to a test tube,
then 0.0lml of serum sample was added to the test tube and 0.0lml of standard added to the two
test tubes labeled “standard 1” and “standard 2”. One test tube was left for blank. Each of the
tubes was mixed thoroughly and incubated for 5minutes at room temperature. After that, 1ml of
reagent B was added to all (both samples, standard and blank), incubated for 5 minutes at room
temperature. The absorbance was read against the blank at 578nm.
The concentration of urea in mg urea /dl was obtained using the formula.
1
40
tan×
dardSofAbsorbance
SampleofAbsorbance= mg Urea/dl
Where 40 =standard concentration in aqueous solution of urea

xcii
2.2.13.9 Blood Glucose Assay
Blood glucose assay: method of Marks and Dawson (1965) was used.
BasicPrinciple
Glucose Gluconic acid+ H2O
H2O2 H2O + O-
Materials: Glucometre (Roche Diagnostics GmbH, Mannheim, Germany)
Test strips containing the following reagents: Glucose dehydrogenase, bis-(2-
hydroyethyl)-(4-hydroxminocyclohexa-2, 5-dienylindene)-ammonium chloride, 2, 18-
phosphomolybdic acid and a stabilizer.
The accu-chek glucometer is essentially a reflectant metre. The amount of light reflected
in reagent area of the accu-chek strip measured on the display of the glucometer, is a measure of
the concentration of glucose in the blood. Blood glucose concentration was measured in the
animals using an Accu-chek glucometer whose measuring range was 10-600mg/dl (0.6-
33.3mmol/l) and an Accu-chek active glucose test strip.
Procedure
The code key was inserted into the glucometer code key opening. A test strip was
inserted to make sure that the code on the glucometer matches the code on the test strip vial. A
new test strip was inserted with the orange pad facing upwards. An image of a flashing blood
appeared on the glucometer screen signifying that the glucometer is ready. A drop of blood
collected with a capillary tube was then placed on the centre of the square of the orange pad.
Result was displayed on the screen in g/dl.
2.2.13.10 Determination of Serum Lipid Concentrations
2.2.13.10.1 Estimation of Total Cholesterol Concentration [Using QCA Commercial Kit;
Allain et al. (1976)]
Principle
The total cholesterol determination using QCA commercial enzyme kit is based on the
assay principle that total cholesterol is determined after enzymatic hydrolysis and oxidation. The
Cholesterol
Glucose oxidase
Peroxidase

xciii
indicator, coloured quinonic derivative is formed from hydrogen peroxide and 4-aminoantipyrine
in the presence of p-hydroxybenzoic acid and peroxidase.
[ ] acidsFatty lCholestero OH esters-lCholestero Esterase Chol.2 + →+
22oxidase Chol.
22 OH neCholesteno O OH lCholestero + →++
04H derivated quinonic Coloured acid zoicHydroxyben-p yrineAminoantip-4 OH 2 Peroxidase
22 + →++
Procedure
Blank (BL), sample (SA) and standard (ST) were the three
sets of labelled test tubes.A quantity, 0.01 ml, of the serum
sample was pipetted into the sample (SA) test tube. Also, 0.01
ml of the standard was introduced into the standard (ST) test
tube with a corresponding addition of 1 ml of working reagent
into each of the test tubes. The solutions in the different sets of
test tubes were well mixed and allowed to stand for 5 minutes at
37oC (or 10 minutes at room temperature). The absorbance was
read at the wavelength of 546 nm.
Calculations The total cholesterol concentration in the sample was calculated using the following
general formula:
lcholestero totalof mg/dl 200 x O.D.ST
O.D.SA =
Where SA is Sample
ST is Standard
OD is Optical density

xciv
200 is a constant
SI Units = (mg/100 ml) × 0.0259 = mmol/L
2.2.13.10.2 Estimation of Low Density Lipoprotein-Cholesterol [Using QCA Commercial
Kit; Assmann et al. (1984)]
Principle
Low density lipoprotein–cholesterol (LDL–cholesterol) can be determined as the
difference between total cholesterol and cholesterol content of the supernatant after precipitation
of the LDL fraction by polyvinyl sulphate (PVS) in the presence of polyethylene glycol
monomethyl ether.
LDL-cholesterol = Total cholesterol – cholesterol in the supernatant
Reagents Content Initial concentration of solutions
1. Precipitation Reagent:-
Polyvinyl sulphate 0.7 g/L
EDTA Na2 5.0 mM
Polyethylene glycol monomethyl ether 170 g/L
Stabilizer
Procedure (1) Precipitation reaction
The precipitation solution (3 drops or 0.1 ml) was carefully measured into test tubes
labeled accordingly. The serum sample (0.2 ml) was added to the labeled test tubes. The contents
were thoroughly mixed and left to stand for 15 minutes at room temperature (20–25oC). Then,
the mixture was centrifuged at 2,000 × g for 15 minutes and the cholesterol concentration in the
supernatant was determined.
(2) Cholesterol determination
The concentration of the serum total cholesterol was determined according to the QCA
CHOD–PAP method.

xcv
Calculations The LDL–cholesterol concentration in the sample was calculated using the following
general formula:
LDL–cholesterol (mg/dl) = Total cholesterol (mg/dl) – 1.5 × supernatant cholesterol (mg/dl).
2.2.13.10.3 Estimation of High Density Lipoproteins (HDL)–Cholesterol [Using QCA
Commercial Kit; Albers et al. (1978)]
Principle
Low density lipoprotein (LDL) and very low density lipoprotein (VLDL) are lipoproteins
precipitated from the serum by the action of a polysaccharide in the presence of divalent cations.
Then, high density lipoprotein–cholesterol (HDL–Cholesterol) present in the supernatant, is
determined.
acidFatty lCholestero OH esters-lCholestero esterase chol.2 + →+
22oxidase chol.
22 OH neCholesteno OH O2
1 lCholestero + →++
04H neQuinoneimi DCFS yrineAminoantip-4 OH2 2eperoxidase
22 + →++
Reagents
1. Precipitation solution containing dextran sulphate and magnesium acetate
2. Working reagent composed of cholesterol esterase, cholesterol oxidase, peroxidase,
PIPES buffer Ph 6.8, Phenol-3,5-dichlorophenol, 4-aminoantipyrene
3. Standard, equivalent to 200mg/dl HDL-cholesterol
Procedure
The procedure took two steps:
(A) Precipitation step

xcvi
The serum sample (0.3 ml) was pipetted into labeled centrifuge tubes. Also, a drop of the
precipitant solution or reagent (10g/L of dextran sulphate, 1M of magnesium acetate and
stabilizers) was added to each of the centrifuge tubes.
(B) Colorimetric step
Then contents in the various tubes were thoroughly mixed and allowed to stand for 15
minutes at room temperature (20–25oC); then centrifuged at 2,000 × g for 15 minutes (or 10,000
× g for 2 minutes). The concentration of cholesterol in the supernatant was then determined.
Calculations The HDL cholesterol concentration in the sample was calculated using the following
general formula:
lCholestero - HDL mg/dl 52.5 x A
A
standard
sample =
Or
lCholestero - HDL mmol/dl 1.36 x A
A
standard
sample =
Where
52.5 and 1.36 are constants.
2.2.13.10.4 Estimation of TriacylglycerolConcentration (Randox Enzyme Kit)
Principle
The concentration of triacylglycerol is determined after enzymatic hydrolysis with
lipases. The indicator is quinoneimine formed from hydrogen peroxide, 4 – aminophenazone and
4 – chlorophenol under the catalytic influence of a peroxidase.
Triacylglycerols + H2O glycerol + fatty acids
Glycerol + ATP Glycerol–3–phosphate + ADP
Glycerol – 3 – phosphate + O2Dihyroxy acetone + Phosphate + H2O2
Lipases
Glycerol kinase
GPO*
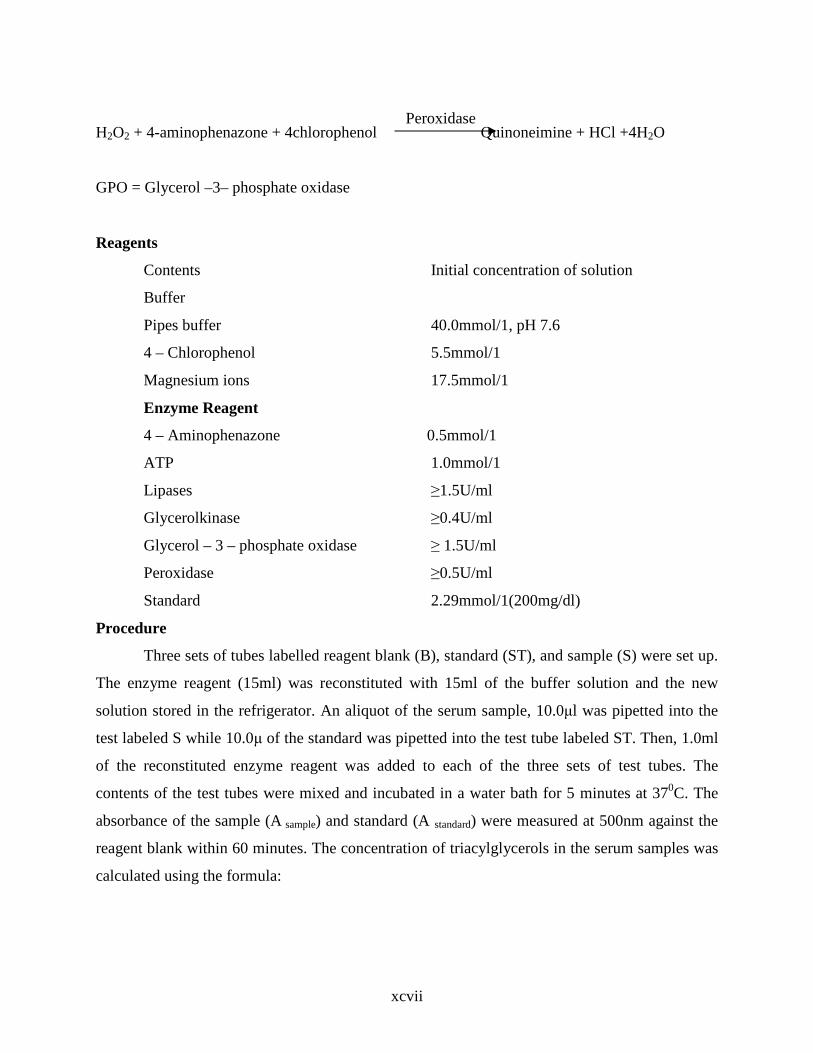
xcvii
H2O2 + 4-aminophenazone + 4chlorophenol Quinoneimine + HCl +4H2O
GPO = Glycerol –3– phosphate oxidase
Reagents
Contents Initial concentration of solution
Buffer
Pipes buffer 40.0mmol/1, pH 7.6
4 – Chlorophenol 5.5mmol/1
Magnesium ions 17.5mmol/1
Enzyme Reagent
4 – Aminophenazone 0.5mmol/1
ATP 1.0mmol/1
Lipases ≥1.5U/ml
Glycerolkinase ≥0.4U/ml
Glycerol – 3 – phosphate oxidase ≥ 1.5U/ml
Peroxidase ≥0.5U/ml
Standard 2.29mmol/1(200mg/dl)
Procedure
Three sets of tubes labelled reagent blank (B), standard (ST), and sample (S) were set up.
The enzyme reagent (15ml) was reconstituted with 15ml of the buffer solution and the new
solution stored in the refrigerator. An aliquot of the serum sample, 10.0μl was pipetted into the
test labeled S while 10.0μ of the standard was pipetted into the test tube labeled ST. Then, 1.0ml
of the reconstituted enzyme reagent was added to each of the three sets of test tubes. The
contents of the test tubes were mixed and incubated in a water bath for 5 minutes at 370C. The
absorbance of the sample (A sample) and standard (A standard) were measured at 500nm against the
reagent blank within 60 minutes. The concentration of triacylglycerols in the serum samples was
calculated using the formula:
Peroxidase se

xcviii
TAG concentration = dardS
Sample
A
A
tan
× 2.29mmol/1
2.2.13.11 Estimation of Lipid Peroxidation Level
Lipid peroxidation was determined spectrophotometrically by measuring the level of the
lipid peroxidation product, malondialdehyde (MDA) as described by Wallinet al. (1993).
Principle
Malondialdehyde (MDA) reacts with thiobarbituric acid to form a red or pink coloured
complex which, in acid solution, absorbs maximally at 532nm.
MDA+2TBA MDA:TBA adduct + H2O
Reagent Preparation
i. 1.0% Thiobarbituric acid (TBA): A quantity, 1.0g, thiobarbituric acid was dissolved in
83ml of distilled water on warming. After complete dissolution the volume was made
up to 100ml with distilled water.
ii. 25% Trichloroacetic acid (TCA): A quantity, 12.5g, of trichloroacetic acid was
dissolved in distilled water and made up to 50ml in a volumetric flask with distilled
water.
iii. Normal saline solution (NaCl): A quantity, 0.9g, of NaCl was dissolved in 10ml of
distilled water and made up to 100ml with distilled water.
Procedure
To 0.1ml of serum in test tube was added 0.45ml of normal saline and mixed thoroughly
before adding 0.5ml of 25% trichloroacetic acid (TCA) and 0.5ml of 1% thiobarbituric acid. The
same volume of tricholoracetic acid, and saline was added to the blank. 0.1ml of distilled water
was also added to the blank instead of serum. Then, the mixture was heated in a water bath at
950C for 40 minutes. Turbidity was removed by centrifugation. The mixture was allowed to cool
before reading the absorbance of the clear supernatant against reagent blank at 532nm.
Thiobarbituric acid reacting substances were quantified as lipid peroxidation product by referring

xcix
to a standard curve (Appendix III) of MDA concentration (i.e. equivalent generated by acid
hydrolysis of 1,1,3,3-tetraethoxypropane(TEP) prepared by serial dilution of a stock solution).
Pipetted into cuvette
Blank Test
Plasma – 0.10ml
Distilled water 0.10ml –
Normal saline 0.45ml 0.45ml
25% TCA 0.50ml 0.50ml
1%TBA 0.50ml 0.50ml
2.2.14 Histopathological Examination
The histopathological examination was carried out by methods described by Billingham
et al., 1978
A. Fixation and Washing
Formalin (10%) was used as the fixative and for the purpose of preservation. A thin section of
the tissue (about 1 to 2 cm in diameters) was trimmed with a sharp razor blade. The small pieces
of the tissue were placed in the 10% formalin, the container was shaken gently several times to
make sure that the fluid had reached all surfaces and that pieces were not sticking to the bottom.
This was then incubated at 250C for 24 hours, to allow proper fixing. The fixed tissue pieces
were washed with running water for 24 hours to free them from excess fixatives.
B. Dehydration
Water was removed from the tissue before embedding the tissue in paraffin. The dehydration
was achieved by immersing the thin sections of the tissue in automatic tissue processor
containing 12 jars. The first three (3) jars contained 70, 90 and 95% absolute alcohol
respectively. This was done to remove the water content in the tissues. The absolute alcohol
reduced the shrinking that occurred in the tissue. The time for each step was 30 minutes. A
second change of absolute alcohol was included to ensure complete removal of water. This was
achieved in the second of three (3) jars of the automatic tissue processor.
C. Clearing

c
Solutions of xylene were used for clearing the tissue sections. This step was achieved in the third
of three (3) jars of the automatic tissue processor. Because the alcohol (ethanol) used for
dehydration would not dissolve or mix with molten paraffin, the tissue was immersed in xylene
solution which was miscible with alcohol and paraffin before infiltration could take place.
Clearing was done to remove opacity from dehydrated tissue. A period of 15 minutes was
allowed to elapse before the tissue was removed from the solution for infiltration with paraffin.
D. Infiltration with Paraffin
Paraffin wax at 50 to 520C was used to infiltrate the tissue. The tissue was transferred directly
from the clearer to a bath containing melted paraffin. After 30 – 60minutes of incubation in the
first bath, the tissue was then removed to a fresh dish of paraffin contained in the fourth three
jars of the automatic tissue processor for a similar length of time.
E. Embedding (Blocking) with Paraffin
As soon as the tissue was thoroughly infiltrated with paraffin, it (paraffin) was allowed to
solidify around and within the tissue.
F. Paraffin Sectioning
The embedded blocks were trimmed into squares and fixed in the microtome knives for
sectioning after which the sections were floated on a water bath.
G. Mounting
Glass slides were thoroughly cleaned and a thin smear of albumen fixative was made on the
slides. The albumenized slide was used to collect the required section from the rest of the ribbon
in the water. The section on the glass slide was kept moist before staining.
H. Staining with Haematoxylin
The slides were passed through a series of jars containing alcohols of decreasing strength and
various staining solutions in the following order and duration:
1 Xylene 3 minutes
2 Absolute 2-3 minutes
3 95% Alcohol 2 minutes
4 70% Alcohol 2 minutes

ci
5 Lugol solution 3 minutes
6 Running water 3 minutes
7 5% Sodium thiosulphate 3 minutes
8 Running water 5 minutes
9 Delafield hematoxylin 5 minutes
10 Running water 3 minutes
11 Scott solution 9 minutes
12 Running water 3 minutes
The counterstaining of the tissue with eosin was achieved in the order below:
1 70% Alcohol 1 dip
2 95% Alcohol 2 dips
3 Absolute Alcohol 3 minutes
4 Absolute Alcohol – Xylene (1:1) 3 minutes
5 Xylene 3 minutes
6 Mounting Medium: The section was kept with xylene while
cover glass was added on the glass slide.
I. Microscopic Observation of Slide
The slides prepared were mounted on photomicroscope, one after the other and viewed at
different magnification power of the microscope. Photograph of each of the slides was taken.
2.2.15 Statistical Analysis
The data collected were analysed using SPSS (version 12.0) analytical package. One way
analysis of variance (ANOVA) and Fisher’s least significant difference (F-LSD) were used to
separate the means. Results were presented as mean ± standard deviation of all parameters
determined.
WHO World Health Organization

cii
CHAPTER THREE RESULTS
3.1 Proximate Composition of S. dulcificum Pulp The proximate composition shows that S. dulcificum contains 7.75% protein, 59.55% moisture
content, 4.36% ash, 6.24% crude fibre, 3.26% fat and 18.84% carbohydrate.
Fig. 6: Proximate composition of Synsepalum dulcificum pulp 3.2 Mineral Composition of S. dulcificum Pulp
Table 2 shows the result of the determination of mineral content in S.dulcificum pulp. The
minerals and their compositions were 100 mg/g Ca, 24.20 mg/g Fe, 9.49 mg/g Zn, 6.22 mg/g Cu,
0.01 mg/g Cr and 0.01 mg/g Co. The pulp contains relatively high concentrations of calcium,
0
10
20
30
40
50
60
70
Protein Moisture Ash Crude Fibre Fat Carbohydrate
Nutritional components
% C
om
po
siti
on

ciii
moderate amount of iron and relatively low amounts of zinc and copper. Chromium and cobalt
were present in almost trace amounts.
Table 2: The levels of some minerals in S. dulcificum pulp
3.3 Vitamin Content of S. dulcificum Pulp
The determination of the vitamin content of S. dulcificum pulp shows that it contains antioxidant
vitamins A and C. Vitamin C (22.69%) was present in high concentrations and vitamin A
(0.04%) in low concentrations. Other vitamins present in the pulp include vitamin D (0.01%) and
vitamin K (0.02%). Both were present in relatively low concentrations as shown in Table 3.
Table 3: Vitamins content of S.dulcificum pulp
MINERALS CONCENTRATION (mg/g) Calcium (Ca) 100.00 Iron (Fe) 24.20 Zinc (Zn) 9.49 Copper (Cu) 6.22 Chromium (Cr) 0.01 Cobalt (Co) 0.01 0.01
VITAMINS CONCENTRATION (%) VITAMIN A 0.04 VITAMIN C 22.69 VITAMIN D 0.01 VITAMIN K 0.02

civ
3.4 Amino acid profile of S. dulcificum pulp
Figure 6 shows the composition of amino acids present in S. dulcificum pulp. Both
essential and non essential amino acids were detected. Essential amino acid, 8.06% tryptophan,
was the most abundant. Others are 1.35% phenylalanine, 0.70% isoleucine, 1.05% methionine,
0.69% valine, 1.10% threonine, 0.40% histidine, 1.02% arginine, 0.63% lysine and 0.64%
leucine. Glutamic acid (1.60%) was the most abundant non essential amino acid in the pulp.
Others are 0.50% tyrosine, 0.40% proline, 0.50% alanine, 1.02% glutamine, 0.72% glycine,
0.33% serine, 0.14% aspartic acid and 1.23% asparagine.
Figure 7: Amino acid profile of S.dulcificum pulp
3.5 Phytochemical Composition of S. dulcificum Pulp
0
1
2
3
4
5
6
7
8
9
Co
mp
ositi
on (
%)
Nutritional Components
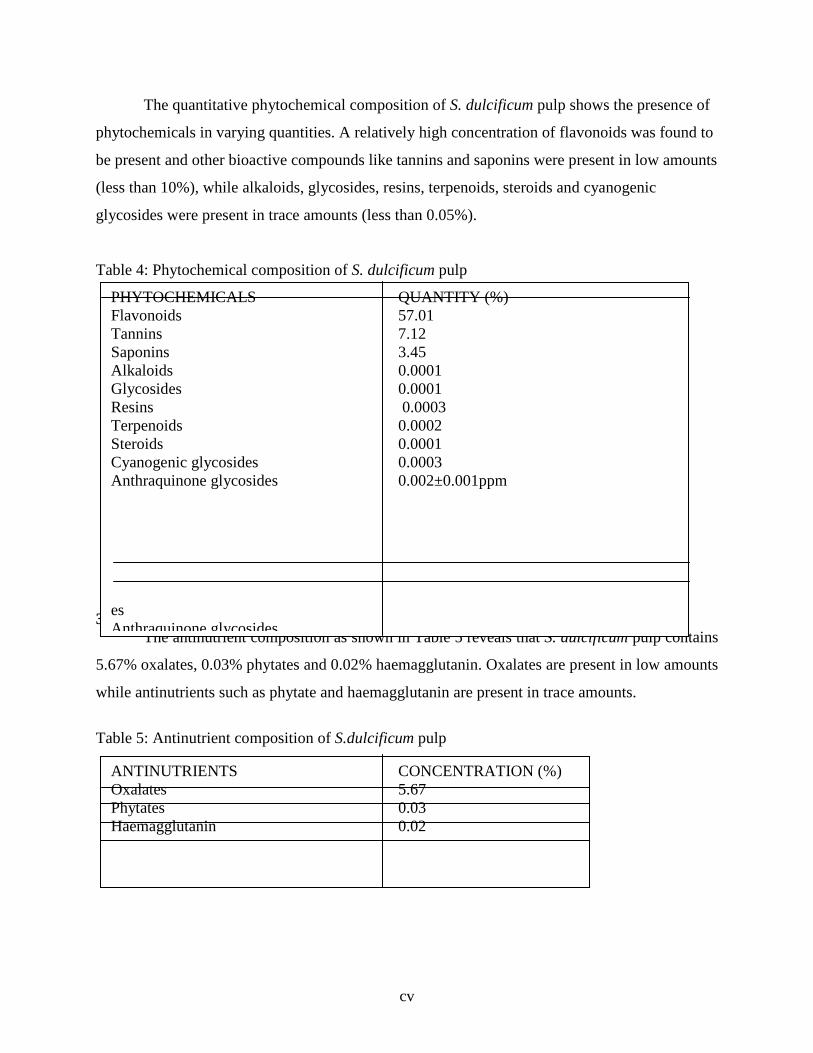
cv
The quantitative phytochemical composition of S. dulcificum pulp shows the presence of
phytochemicals in varying quantities. A relatively high concentration of flavonoids was found to
be present and other bioactive compounds like tannins and saponins were present in low amounts
(less than 10%), while alkaloids, glycosides, resins, terpenoids, steroids and cyanogenic
glycosides were present in trace amounts (less than 0.05%).
Table 4: Phytochemical composition of S. dulcificum pulp 3.6 Antinutrient Composition of S. dulcificum Pulp
The antinutrient composition as shown in Table 5 reveals that S. dulcificum pulp contains
5.67% oxalates, 0.03% phytates and 0.02% haemagglutanin. Oxalates are present in low amounts
while antinutrients such as phytate and haemagglutanin are present in trace amounts.
Table 5: Antinutrient composition of S.dulcificum pulp
ANTINUTRIENTS CONCENTRATION (%) Oxalates 5.67 Phytates 0.03 Haemagglutanin 0.02
PHYTOCHEMICALS QUANTITY (%) Flavonoids 57.01 Tannins 7.12 Saponins 3.45 Alkaloids 0.0001 Glycosides 0.0001 Resins 0.0003 Terpenoids 0.0002 Steroids 0.0001 Cyanogenic glycosides 0.0003 Anthraquinone glycosides 0.002±0.001ppm
es Anthraquinone glycosides

cvi
3.7 Acute toxicity (LD50) Studies
At the first stage of the acute toxicity study, animals were given 10mg/kg b.w, 100mg/kg
b.w and 1000mg/kg b.w respectively. No deaths were recorded at the end of this stage. During
the second stage, animals were administered 1600mg/kg b.w, 2900mg/kg b.w and 5000mg/kg
b.w respectively. Similarly, no deaths were recorded at the end of this stage. The acute toxicity
study therefore shows that S.dulcificum methanolic pulp extract was not toxic to mice at the
tested doses of 10mg/kg b.w – 5000mg/kg b.w.
Table 6: Result of the acute toxicity (LD50) test of the methanolic pulp extract of S. dulcificum
Group No of Animals Dosage (mg/kg) Mortality
STAGE I
Group i 3 10 0/3
Group ii 3 100 0/3
Group iii 3 1000 0/3
STAGE II
Group i 1 1600 0/1
Group ii 1 2900 0/1
Group iii 1 5000 0/1
Control 1 - 0/1

cvii
3.8 Mean Body Weights of Animals
Table 7 shows the mean body weights of animals administered 100mg/kg b.w, 200mg/kg
b.w and 500mg/kg b.w of S. dulificum methanolic pulp extract and the control on days 0, 14 and
28 of the study. It was observed that there was increase in weight in the animals at the end of the
experimental period.
Table 7: The mean body weight of rats administered doses of S. dulcificum methanolic pulp extract DAY GROUP 1
(control) GROUP 2 (100mg/kg b.w)
GROUP 3 (200mg/kg b.w)
GROUP 4 (500mg/kg b.w)
0 104.72±10.29 84.72±8.36 82.02±12.74 98.7±9.25 14 138.47±15.65 136.48±11.66 150.33±15.65 133.7±11.62 28 149.9±1.04 141.67±4.57 170.77±7.45 164.67±13.75 3.9 Effect of S. dulcificum Methanolic Extract Administration on Alkaline Phosphatase
(ALP) Activity in Rats The ALP concentration showed no significant difference (p>0.05) across the groups
compared with the control at the end of the 14 days administration. There was no significant
difference (p>0.05) in serum concentration of ALP in group 3 and 4 with 200mg/kg b.w and
500mg/kg b.w of S. dulcificum methanolic esxtract compared with the control during the
duration of 28 days (Fig 7). However, significant decrease (p<0.05) was observed at the end of
the 28 days in the groups with 100mg/kg b.w (low dose) of the extract compared with the
control. A significant decrease (p<0.05) was observed only in the group that had 100mg/kg b.w

cviii
of the extract between the first phase of the experiment and the final phase of the experiment.
However, there was no significant difference (p>0.05) in the mean ALP concentration between
the 14 and 28 days of experiment.
Fig. 16: Effect of Synsepalum dulcificum pulp ingestion on alkaline
0
10
20
30
40
50
60
70
80
Group 1 Group 2 Group 3 Group 4
Treatment Group
Mea
n A
LP
Act
ivit
y (I
U/L
)
Fig. 8: Effect of s. dulcificum methanolic extract administration on alkaline phosphatase activity in rat
Day 28Day 14
Group 1=Control Group 2=Administered 100mg/kg b.w. of methanol extract of S. dulcificum pulp Group 3=Administered 200mg/kg b.w. of methanol extract of S. dulcificum pulp Group 4=Administered 500mg/kg b.w. of methanol extract of S. dulcificum pulp
cix
3.10 Effect of S. dulcificum Methanolic Extract Administration on Alanine
Aminotransferase (ALT) Activity in Rats After 14 days of administration of S. dulcificum methanolic pulp extract, no significant
change (p>0.05) was observed in the activities of ALT across the groups compared with the
control (Fig. 9). After 28 days of administration, there was no significant difference (p>0.05) in
the activity of ALT of groups 3 and 4 administered 200mg/kg b.w and 500mg/kg b.w
respectively compared with the control. Only the groups 100mg/kg b.w of extract showed
significant decreases (p<0.05) in serum levels of ALT at the end of the 28 days study compared
with the control. There was significant difference (p<0.05) observed across the groups 100mg/kg
b.w, 200mg/kg b.w and 500mg/kg b.w at the end of the 14th day compared with the 28th day.

cx
3.11 Effect of S. dulcificum Methanolic Extract Administration on Aspartate
Aminotransferase (AST) Activity in Rats Figure 10 shows there was no significant changes (p>0.05) in the AST activity of rats in
groups 2, 3 and 4 administered 100mg/kg b.w, 200mg/kg b.w and 500mg/kg b.w of the extract
compared with those of the control that were given normal saline at the end of the 14th day of
0
10
20
30
40
50
60
Group 1 Group 2 Group 3 Group 4
Treatment Group
Mea
n A
LT
Act
ivit
y (I
U/L
)
Group 1=Control Group 2=Administered 100mg/kg b.w. of methanol extract of S. dulcificum pulp Group 3=Administered 200mg/kg b.w. of methanol extract of S. dulcificum pulp Group 4=Administeed 500mg/kg b.w. of methanol extract of S. dulcificum pulp
Fig. 9: Effect of s. dulcificum methanolic extract administration on alanine aminotransferase activity in rat
Day 28
Day 14

cxi
feeding. Similarly, no significant change (p>0.05) was observed in the groups administered
100mg/kg b.w, 200mg/kg b.w and 500mg/kg b.w of the extract compared with the control at the
end of the 28 days study. No significant difference (p>0.05) in the mean ALP activity between
the two phases of the experiment (14 and 28 days).

cxii
3.12 Effect of S. dulcificum Methanolic Extract Administration on Bilirubin Lev els in
Rats Figure 11 shows the bilirubin levels of the rats and which showed no significant change
(p>0.05) across the groups at the end of the 14 days. However, a decrease in bilirubin
concentration was observed in all the test groups when compared with the control after 28days of
0
5
10
15
20
25
30
35
40
45
50
Group 1 Group 2 Group 3 Group 4
Treatment Group
Mea
n A
ST
Act
ivit
y (I
U/L
)
Group 1=Control Group 2=Administered 100mg/kg b.w. of methanolic extract of S. dulcificum pulp Group 3=Administered 200mg/kg b.w. of methanolic extract of S. dulcificum pulp Group 4=Administered 500mg/kg b.w. of methanolic extract of S. dulcificum pulp
Fig. 10: Effect of s. dulcificum methanolic extract administration on aspartate aminotransferase activity in rat
Day 28
Day 14

cxiii
the experiment. A significant decrease (p<0.05) was observed in the groups administered
100mg/kg b.w, 200mg/kg b.w and 500mg/kg b.w of the extract compared with the control after
the 28 days study. A significant decrease (p<0.05) was observed across the groups that had
100mg/kg b.w, 200mg/kg b.w and 500mg/kg b.w of the extract at the end of the 14 days study
compared with the 28 days study.
Day 28Day 14

cxiv
3.13 Effect of S. dulcificum Methanolic Extract Administration on Serum Total Protein
Concentration in Rats Fig. 12 shows dose dependent increase in the protein concentration across the test groups
during the first phase (14 days) of administration of S. dulcificum methanolic extract relative to
the control. The result shows that the protein concentration in the test groups was not
significantly different (p>0.05) from the control group at the end of the 14 days study. However,
the protein concentration in the blood increased significantly (p<0.05) in all the test groups
0
0.1
0.2
0.3
0.4
0.5
0.6
0.7
0.8
Group 1 Group 2 Group 3 Group 4
Treatment Group
Mea
n B
iliru
bin
Co
nc
(mg
/dl)
Group 1=Control Group 2=Administered 100mg/kg b.w. of methanolic extract of S. dulcificum pulp Group 3=Administered 200mg/kg b.w. of methanolic extract of S. dulcificum pulp Group 4=Administered 500mg/kg b.w. of methanolic extract of S. dulcificum pulp
Fig. 11: Effect of s. dulcificum methanolic extract administration on bilirubin concentration in rat

cxv
(groups 2, 3 and 4) administered 100mg/kg b.w, 200mg/kg b.w and 500mg/kg b.w of S.
dulcificum methanolic extract respectively as compared with the animals in the control group
after 28 days. The increase was found to be dose dependent. A significant difference (p<0.05) in
the protein concentration was observed between the first (14 days) and the second (28 days)
phases of administering with the pulp extract.

cxvi
3.14 Effect of S. dulcificum Methanolic Extract Administration on Serum Albumin Concentration in Rats
Fig. 7: Effect of Synsepalum dulcificum pulp ingestion on total protein concentration in rats
0
1
2
3
4
5
6
7
Group 1 Group 2 Group 3 Group 4
Treatment Group
Mea
n T
ota
l Pro
tein
Co
nc.
(g
/dl)
Day 14Day 28
Group 1=Control Group 2=Administered 100mg/kg b.w. of methanolic extract of S. dulcificum pulp Group 3=Administered 200mg/kg b.w. of methanolic extract of S. dulcificum pulp Group 4=Administered 500mg/kg b.w. of methanolic extract of S. dulcificum pulp
Fig. 12: Effect of S. dulcificum methanolic extract administration on serum total protein concentration in rats
cxvii
No significant increase or decreaase (p>0.05) was observed in the albumin concentration
across the groups administered respectively 100mg/kg b.w, 200mg/kg b.w and 500mg/kg b.w of
the S. dulcificum methanolic extract compared with the control that had normal saline at the end
of the 14 days. There was no significant difference (p>0.05) in the albumin concentration
between and across the groups administered 100mg/kg b.w, 200mg/kg b.w and 500mg/kg b.w of
the S. dulcificum extract compared with the control at the end of the 28 days study. Similarly,
there was no significant difference (p>0.05) in the albumin concentration across the groups after
the 14 days study compared with the 28 days study.

cxviii
3.15 Effect of S. dulcificum Methanolic Extract Administration on Serum Globulin
Concentration in Rats
Fig. 8: Effect of Synsepalum dulcificum pulp ingestion on albumin concentration in rats
0
0.5
1
1.5
2
2.5
3
3.5
4
4.5
Group 1 Group 2 Group 3 Group 4
Treatment Group
Mea
n A
lbu
min
Co
nc
(g/d
l)Day 14Day 28
Group 1=Control Group 2=Administered 100mg/kg b.w. of methanolic extract of S. dulcificum pulp Group 3=Administered 200mg/kg b.w. of methanolic extract of S. dulcificum pulp Group 4=Administered 500mg/kg b.w. of methanolic extract of S. dulcificum pulp
Fig. 13: Effect of S. dulcificum methanolic extract administration on serum albumin in rats

cxix
Fig. 14 shows that the ingestion of the methanolic pulp extract caused a dose dependent
relationship across the group in the first phase (14 days) of the experiment. At the end of the 14
days of feeding, a significant difference (p˂0.05) was observed in the globulin concentration
across the groups administered 100mg/kg b.w, 200mg/kg b.w and 500mg/kg b.w of the S.
dulcificum extract compared with the control that had normal saline. Also, at the end of
the second phase (28days) of the experiment there was a dose dependent relationship across the
groups. The globulin concentration similarly, showed significant increase (p˂0.05) across the
groups administered 100mg/kg b.w, 200mg/kg b.w and 500mg/kg b.w of the S. dulcificum
extract compared with the control at the end of the 28 days study. Similarly, a significant
increase (p˂0.05) was observed in the globulin concentration across the groups after the 14 days
study compared with the 28 days study.

cxx
3.16 Effect of S. dulcificum Methanolic Extract Administration on Creatinine Level in
Rats
0
0.5
1
1.5
2
2.5
3
Group 1 Group 2 Group 3 Group 4
Mea
n G
lob
ulin
Co
nc
(g/d
l)
Treatment Group
Fig. 9: Effect of Synsepalum dulcificum pulp ingestion on globulin concentration in rats
Day 14
Day 28
Group 1=Control Group 2=Administered 100mg/kg b.w. of methanolic extract of S. dulcificum pulp Group 3=Administered 200mg/kg b.w. of methanolic extract of S. dulcificum pulp Group 4=Administered 500mg/kg b.w. of methanolic extract of S. dulcificum pulp
Fig. 14: Effect of s. dulcificum methanolic extract administration on serum globulin in rats

cxxi
The decrease in concentration of creatinine was found to be significant (p<0.05) only in
the groups administered 100mg/kg b.w compared with the control after the 14 days of
experiment. But there was no significant change (p>0.05) in the concentration of creatinine of
rats administered 200mg/kg b.w and 500mg/kg b.w of S.dulcificum extract compared with the
control after 14 days of administration with the extract. A significant change (p<0.05) was
observed in groups 3 and 4 rats compared with the control after the experimental duration of 28
days. A significant difference (p<0.05) was observed only in the group that had 500mg/kg b.w of
extract on the 14 day study compared with the 28 day study.

cxxii
3.17 Effect of S. dulcificum Methanolic Extract Administration on Urea Level in Rats
When compared with the control (group 1), the urea level of the test groups (2, 3 and 4)
administered 100mg/kg b.w, 200mg/kg b.w and 500mg/kg b.w respectively showed no
significant change (p>0.05) over the period of 14 days. After 28 days of administration of S.
dulcificum extract, the concentration of urea significantly decreased (p<0.05) in the group 2
0
0.2
0.4
0.6
0.8
1
1.2
Group 1 Group 2 Group 3 Group 4
Treatment Group
Mea
n C
reat
inin
e C
on
c. (
mg
/dl)
Day 28
Day 14
Group 1=Control Group 2=Administered 100mg/kg b.w. of methanolic extract of S. dulcificum pulp Group 3=Administered 200mg/kg b.w. of methanolic extract of S. dulcificum pulp Group 4=Administered 500mg/kg b.w. of methanolic extract of S. dulcificum pulp
Fig. 15: Effect of S. dulcificum methanolic extract administration on creatinine level in rat
cxxiii
administered 100mg/kg b.w extract compared with the control (Fig 16). No significant change
(p>0.05) was recorded in the groups that had 200mg/kg b.w and 500mg/kg b.w extract
respectively compared with the control. Similarly, no significant difference (p>0.05) in urea
concentration of test animals in the second phase (28 days) compared with those of the first
phase (14 days) of the experiment.
Day 28
Day 14

cxxiv
3.18 Effect of S. dulcificum Methanolic Extract Administration on Blood Glucose
Concentration in Rats Fig. 17 shows dose dependent decrease in the blood glucose concentration across the test
groups during the first phase (14 days) of administration of S. dulcificum methanolic extract
relative to the control. The 200mg/kg b.w and 500mg/kg b.w doses significantly decreased
(p<0.05) the blood glucose level compared with the control at the end of the 14 days experiment.
Fig. 21: Effect of Synsepalum dulcificum pulp ingestion on urea
0
5
10
15
20
25
30
35
Group 1 Group 2 Group 3 Group 4
Treatment Group
Mea
n U
rea
Co
nc
(mg
/dl)
Group 1=Control Group 2=Administered 100 mg/kg b.w. of methanolic extract of S. dulcificum pulp Group 3=Administered 200 mg/kg b.w. of methanolic extract of S. dulcificum pulp Group 4=Administered 500 mg/kg b.w. of methanolic extract of S. dulcificum pulp
Fig. 16: Effect of S. dulcificum methanolic extract administration on urea level in rat

cxxv
However, no significant difference (p>0.05) was observed in the group administered 100mg/kg
b.w of S. dulcificum extract compared with the control. During the second phase of the
experiment, the blood glucose of the groups fed with 100mg/kg b.w and 500mg/kg b.w doses
significantly decreased (p<0.05) the blood glucose level compared with the control at the end of
the 28 days experiment. However, no significant difference (p>0.05) was observed in the group
administered 200mg/kg b.w of S. dulcificum extract compared with the control. The mean blood
glucose concentration of animals that had 100mg/kg b.w and 500mg/kg b.w doses of the extract
were significantly decreased (p<0.05) at the end of the 14 days experiment compared with the 28
days experiment. However, no significant difference (p>0.05) was observed in the blood glucose
concentration of animals administered 200mg/kg b.w of extract after the 14 day study compared
with the 28 day study.

cxxvi
3.19 Effect of S. dulcificum Methanolic Extract Administration on Cholesterol
Concentration in Rats Fig. 18 shows that there was no significant difference (p>0.05) in the serum cholesterol
levels of all the experimental groups fed S. dulcificum methanolic extract when compared with
the control after the initial 14 days. After 28 days of S. dulcificum extract administration, no
Fig. 15: Effect of Synsepalum dulcificum pulp ingestion on glucose
0
50
100
150
200
250
300
Group 1 Group 2 Group 3 Group 4
Treatment Group
Mea
n G
luco
se C
on
c (g
/dl)
Group 1=Control Group 2=Administered 100mg/kg b.w. of methanolic extract of S. dulcificum pulp Group 3=Administered 200mg/kg b.w. of methanolic extract of S. dulcificum pulp Group 4=Administered 500mg/kg b.w. of methanolic extract of S. dulcificum pulp
Fig. 17: Effect of s. dulcificum methanolic extract administration on blood glucose concentration in rat
Day 28Day 14

cxxvii
significant difference (p>0.05) was also observed in the cholesterol concentration of test groups
administered 100mg/kg b.w, 200mg/kg b.w and 500mg/kg b.w extract compared with the control
group. However, a significant decrease (p˂0.05) was observed in the concentration of cholesterol
in all the test groups as in the second phase (28 days) compared with the first phase (14 days).
0
0.5
1
1.5
2
2.5
3
3.5
4
Group 1 Group 2 Group 3 Group 4
Treatment Group
Mea
n T
ota
l Ch
ol C
on
c (m
g/d
l)
Day 14Day 28
Group 1=Control Group 2=Administered 100mg/kg b.w. of methanolic extract of S. dulcificum pulp Group 3=Administered 200mg/kg b.w. of methanolic extract of S. dulcificum pulp Group 4=Administered 500mg/kg b.w. of methanolic extract of S. dulcificum pulp
Fig. 18: Effect of S. dulcificum methanolic extract administration on total cholesterol in rats

cxxviii
3.20 Effect of S. dulcificum Methanolic Extract Administration on High Density
Lipoprotein Cholesterol Concentration in Rats Fig. 19 shows a dose dependent increase in the concentration of high density lipoprotein
(HDL) with increase in dose across the test groups during the first phase (14 days) of
administration of S. dulcificum methanolic extract relative to the control. The result shown in the
Fig. 19 indicates that the HDL cholesterol concentrations of the test groups were not
significantly different (p>0.05) compared with the control at the end of the 14 days study. The
second phase of S. dulcificum extract administration which lasted 28 days revealed a similar
trend as in the first phase with no significant difference (p>0.05) observed across the groups at
the end of the 28 days study. When HDL cholesterol was determined after 28 days, a significant
increase (p˂0.05) was observed across the groups compared with similar groups after the 14 day
administration.

cxxix
3.21 Effect of S. dulcificum Methanolic Extract Administration on Low Density
Lipoprotein Cholesterol Concentration in Rats Fig. 20 shows that among animals treated with varying doses of S. dulcificum methanol
extract, there was dose dependent decreases in low density lipoprotein (LDL) cholesterol
0
0.2
0.4
0.6
0.8
1
1.2
1.4
Group 1 Group 2 Group 3 Group 4
Treatment Group
Mea
n H
DL
Co
nc
(mg
/dl)
Day 14Day 28
Fig. 19: Effect of S. dulcificum methanolic extract administration on high-density lipoprotein cholesterol concentration in rat
Group 1=Control Group 2=Administered 100mg/kg b.w. of methanolic extract of S. dulcificum pulp Group 3=Administered 200mg/kg b.w. of methanolic extract of S. dulcificum pulp Group 4=Administered 500mg/kg b.w. of methanolic extract of S. dulcificum pulp

cxxx
concentrations across the groups. The LDL concentrations of the test groups showed non-
significant increase or decrease (p>0.05) compared with the control after the 14 days experiment.
The second phase (28 days) of the experiment also showed a dose dependent relationship across
the groups. There was a significant difference (p˂0.05) in the test groups compared with the
control group after the 28 days experiment. Similarly, when LDL cholesterol was determined
after the duration of 28 days, a significant decrease (p˂ 0.05) was observed across the groups
compared with similar groups after the 14 day administration.

cxxxi
3.22 Effect of S. dulcificum Methanolic Extract Administration on Triacylglycer ol
Concentration in Rats
0
0.5
1
1.5
2
2.5
Group 1 Group 2 Group 3 Group 4
Treatment Group
Mea
n L
DL
Co
nc.
(m
g/d
l)
Day 14Day 28
Group 1=Control Group 2=Administered 100mg/kg b.w. of methanolic extract of S. dulcificum pulp Group 3=Administered 200mg/kg b.w. of methanolic extract of S. dulcificum pulp Group 4=Administered 500mg/kg b.w. of methanolic extract of S. dulcificum pulp
Fig. 20: Effect of S. dulcificum methanolic extract administration on low density lipoprotein cholesterol concentration in rat

cxxxii
The triacylglycerol concentration in the sera differed significantly (p<0.05) only in the
test groups administered 200mg/kg b.w and 500mg/kg b.w compared with the control after the
14 days experiment (Fig. 21). However, the triacylglycerol concentration did not show any
significant decrease (p>0.05) or increase in the test group that was administered 100mg/kg b.w
extract compared with the control. Similarly, no significant difference (p>0.05) was observed in
the triacylglycerol concentration of the animals across the groups after the 28 days study (Fig.
21). A non-significant increase was observed across the groups, however, no significant
difference (p>0.05) was observed across the groups compared during the 14 and 28 days of
administration.

cxxxiii
3.23 Effect of S. dulcificum Methanolic Extract Administration on Malondialdehyde
Concentration in Rats
0
0.2
0.4
0.6
0.8
1
1.2
1.4
1.6
1.8
2
Group 1 Group 2 Group 3 Group 4
Treatment Group
Mea
n T
AG
Co
nc.
(m
g/d
l)
Day 14Day 28
Group 1=Control Group 2=Administered 100mg/kg b.w. of methanolic extract of S. dulcificum pulp Group 3=Administered 200mg/kg b.w. of methanolic extract of S. dulcificum pulp Group 4=Administered 500mg/kg b.w. of methanolic extract of S. dulcificum pulp
Fig. 21: Effect of S. dulcificum methanolic extract administration on triacylglycerol concentration in rat

cxxxiv
The malondialdehyde concentrations of animals fed with varying doses of the extract
showed no significant change (p>0.05) in MDA levels in all the groups when compared with the
control after the 14 days experiment. After 28 days of S. dulcificum extract administration, no
significant decrease (p>0.05) in the malondialdehyde concentration of test groups administered
100mg/kg b.w, 200mg/kg b.w and 500mg/kg b.w of the extract was observed when compared
with the control group. However, a significant increase (p˂0.05) was observed in the
concentration of malondialdehyde in all the test groups in the second phase (28 days) compared
with the first phase (14 days).
0
1
2
3
4
5
6
7
8
9
10
Group 1 Group 2 Group 3 Group 4
Treatment Group
Mea
n M
DA
Co
nc
(mg
/dl)
Day 28
Day 14
Fig. 22: Effect of S. dulcificum methanolic extract administration on malondialdehyde concentration in rat

cxxxv
3.24 Effect of S. dulcificum Methanol Extract Administration on the Histopathology of
Rat Liver [14 Days Duration] LIVER
Group A (Control) Group B (100 mg/kg b.w)
Group C (200 mg/kg b.w) Group D (500 mg/kg b.w) Fig. 23: Photomicrograph of liver sections of rats 14 days post administration with S. dulcificum methanolic extract showing normal liver architecture(central vein-CV,sinusoids- black arrow, plates of hepatocytes-white arrow). H and E X400
CV
CV
CV
Group 1=Control Group 2=Administered 100mg/kg b.w. of methanolic extract of S. dulcificum pulp Group 3=Administered 200mg/kg b.w. of methanolic extract of S. dulcificum pulp Group 4=Administered 500mg/kg b.w. of methanolic extract of S. dulcificum pulp

3.25 Effect of S. dulcificum Methanol Extract Administration on the Histopathology of Rat Liver [28 Days Duration]
Group A (Control)
Group C (200 mg/kg b.w) Fig 24: Photomicrograph of liver sections of rats 28 days post administration with methanolic extract. Note mild hepatocyte degenerations in Group D (arrows). Sections from Groups A (Control), B 100 mg/kg b.w and C 200 mg/kg b.w had no observable histologic changes. See the central vein (CV).H and E X400. 3.26 Effect of S. dulcificum
Rat Kidney [14 Days Duration]
P
Group A (Control)
cv
cv
G cxxxvi
Methanol Extract Administration on the Histopathology of Rat Liver [28 Days Duration]
LIVER
Group A (Control) Group B (100 mg/kg b.w)
Group C (200 mg/kg b.w) Group D (500 mg/kg b.w)Photomicrograph of liver sections of rats 28 days post administration with
t. Note mild hepatocyte degenerations in Group D (arrows). Sections from Groups A (Control), B 100 mg/kg b.w and C 200 mg/kg b.w had no observable histologic changes. See the central vein (CV).H and E X400.
Methanol Extract Administration on the Histopathology of Rat Kidney [14 Days Duration]
KIDNEY
Group B (100 mg/kg b.w)
cv
cv
cv
G
Methanol Extract Administration on the Histopathology of
Group B (100 mg/kg b.w)
Group D (500 mg/kg b.w)
Photomicrograph of liver sections of rats 28 days post administration with S. dulcificum t. Note mild hepatocyte degenerations in Group D (arrows). Sections from
Groups A (Control), B 100 mg/kg b.w and C 200 mg/kg b.w had no observable histologic
ministration on the Histopathology of
cv

cxxxvii
Group C (200 mg/kg b.w) Group D (500 mg/kg b.w)
Fig. 25 : Photomicrograph of kidney sections of rats 14 days post administration of S. dulcificum extract showing the Control A, low dose Group B (100 mg/kg), medium dose Group C (200 mg/kg) and high dose Group D (500 mg/kg) with normal glomerulus (G) and renal tubules (arrow). H and E X400. 3.27 Effect of S. dulcificum Methanol Extract Administration on the Histopathology of
Rat Kidney [28 Days Duration] KIDNEY
Group A (Control) Group B (100 mg/kg b.w)
G G
G
G G

cxxxviii
Group C (200 mg/kg b.w) Group D (500 mg/kg b.w) Fig 26: Photomicrograph of kidney sections of rats 28 days post administration with S. dulcificum methanolic extract. All the Groups - A (Control), B (100mg/kg b.w), C (200mg/kg b.w) and D (500mg/kg b.w) had no observable histologic changes. Note the normal glomeruli (G) and renal tubules (arrow).H and E X 400.
G

cxxxix
CHAPTER FOUR
DISCUSSION
The tropical rain forest of Nigeria is located at the southern part of the country (Onochie,
1979). Within the rainforest are some plant species producing edible fruits, seeds and leaves
(Keay, 1989). Presently, most of the original rainforest areas have been logged, cleared and
cultivated with arable crops. Okafor (1993) reported that some plant species were in the process
of being lost. Recently, a total of 30 plant species producing edible fruits, seeds and leaves in the
South-eastern Nigeria rainforest have been reported as endangered (Meregini, 2005).
The determination of the proximate composition of any material is a major index of its
nutritional potential. The result of proximate composition of S. dulcificum (miracle fruit) pulp is
presented in Fig. 5. The moisture content of S. dulcificum pulp obtained from the analysis was
59.55%. This value is higher than 42.10% reported for Chrysophyllum africanum fruit (Amusa et
al., 2003) and lower than 87.7%, 82.0%, 81%, 96.4% and 85.07% moisture contents reported for
Carica papaya, Psidium guajava, Musa paradisiaca, Citrus lanatus and Ananus comosus
respectively (Ashaye et al., 2005; Ramulu and Rao, 2003). The moisture content of any fruit is
an index of its water activity (Frazier and Wwstoff, 1978) and is used as a measure of the
stability and susceptibility of microbial contamination (Scott, 1980). The result shows that S.
dulcificum pulp may have a short shelf-life due to its high moisture content. The high moisture
content of the pulp is typical of fresh fruits at maturity (Umoh, 1998) and provides part of the
medium for normal functioning of enzymes and general metabolic processes. The crude fat
(3.26%) observed for the fruit in this study is lower than 16.20% reported for most tropical plants
namely C. africanum fruit (Amusa et al., 2003) and higher than values reported for M.
paradisiaca (0.99±0.05%), P. guajava (0.53±0.02%), C. papaya (0.65±0.01%), C. sinensis
(0.11±0.00%) and A. comosus (0.10±0.00%) (Ekpete et al., 2013). Fat is important in the diet
because it promotes fat soluble vitamin absorption (Bogert et al., 1994). It is a high-energy
nutrient but does not add to the bulk of the diet.
The ash content of S. dulcificum pulp obtained in this study was 4.36%. This value is
higher than 2.95% reported for some tropical plants namely C. africanum fruit (Amusa et al.,
2003), 2.05±0.3% reported for C. sinensis and2.50±0.34% for I. gobonensis (Ekpete et al., 2013)
but lower than 10.0% reported for both Solanum gilo and Solanum aubergine fruits (Edem et al.,
2009). The percentage ash content of the sample gives an idea about the inorganic content of the

cxl
sample from where the minerals could be obtained. Samples with high percentages of ash
contents are expected to have high concentrations of various mineral elements which are
expected to speed up metabolic processes and improve growth and development (Bello et al.,
2008).
The protein content of S. dulcificum pulp obtained from the analysis was 7.75% which is
lower than 8.75% reported for C. africanum fruit (Amusa et al., 2003) but higher than
1.25±0.21%, 1.28±0.10%, 0.82±0.02%, 0.87±0.01% and 0.39±0.02% reported for M.
paradisiaca, P. guajava, C. papaya, C. sinensis and A. comosus respectively (Ekpete et al.,
2013). Proteins are essential components of the diet needed for survival of animals and humans;
their basic function in nutrition is to supply adequate amounts of required amino acids
(Pugalenthi et al., 2004). Protein deficiency causes growth retardation, muscle wasting, oedema,
abnormal swelling of the belly and collection of fluids in the body (Perkins-Veazie et al., 2005).
This value can be improved by the dehydration of the fruits (Igboh et al., 2009).
The crude fibre content of S. dulcificum pulp (6.24%) obtained from the analysis is higher
than 4.50% reported for C. africanum fruit (Amusa et al., 2003), 0.75±0.03%, 0.21±0.01%,
1.23±0.01%, 3.55±0.02% and 0.61±0.01% reported for M. paradisiaca, P. guajava, C. papaya,
C. sinensis and A. comosus respectively (Ekpete et al., 2013) but lower than 8.60% reported for
Averrhoa carambola (Edem et al., 2008). However, emphases have been placed on the
importance of keeping fibre intakes low in the nutrition of infants and pre-school children
(Eromosele and Eromosele, 1993) because high fibre levels in weaning diets can lead to irritation
of the gut mucosa, reduced digestibility and vitamin and mineral availability. Those with high
fibre content are desirable in adult diet. Fibre diets promote the wave-like contractions that move
food through the intestine. High fibre food expands the inside wall of the colon, easing the
passage of wastes, thus making it an effective anti-constipation. Increased crude fibre
consumption also increases fecal bulk and rate of intestinal transit and have prebiotic effects
(Igboh et al., 2009). The value of crude fibre in the pulp may contribute to a reduction in the
incidence of certain diseases like colon cancer, coronary heart disease, high blood pressure,
obesity and other digestive disorders (Igboh et al., 2009; Walker, 1978; FAO, 1990; Eriyamremu
and Adamson, 1994; SACH, 2008). This will normally suggest a beneficial effect in pathologic
conditions.

cxli
The carbohydrate content obtained for S. dulcificum pulp (18.84%) is lower than 67.60%
reported for C. africanum fruit (Amusa et al., 2003) but comparable to 18.46±2.80% reported for
C. sinensis and 18.26±2.51% for C. papaya. The value is however higher than 7.50±0.64% for
C. lanatus and 12.06±1.62% for A. comosus as reported by Ekpete et al., 2013. Samples with
low carbohydrate can be ideal for diabetic and hypertensive patients requiring low sugar diets.
Mineral elements in plants become important when their health benefits are considered in
the body of organisms. Most of these minerals occur as chemical compounds in solution form
hence, they are able to diffuse in different parts of plants. The mineral composition as shown in
Table 3 shows that S. dulcificum pulp contains 100 mg/g calcium, 24.20 mg/g iron, 9.49 mg/g
zinc, 6.22 mg/g copper, 0.01 mg/g chromium and 0.01 mg/g cobalt. These minerals are very
important to the health of humans. The value for calcium in this study is higher than 7.24±0.05
mg/g, 7.00±0.04 mg/g, 16.46±1.02 mg/g, 14.35±1.50 mg/g and 16.45±1.50 mg/g reported for
some tropical plants namely M. paradiaca, C. lanatus, P. guajava, I. gabonensis and A. comosus
respectively (Ekpete et al., 2013). Calcium is important in blood clotting, muscle contraction and
in certain enzymes of metabolic processes. Ayivor et al., 2011 reported zinc content of 6.72
mg/g for I. gabonensis which is lower than 9.37 mg/g reported for S. dulcificum in this study.
However, Onibon et al., 2011 reported M. domestica (22.9 mg/g) and P. guajava (22.9 mg/g)
which is higher than the value of zinc in this study. Zinc plays a role in wound healing and zinc
is essential for general growth and proper development of the reproductive organs and for normal
functioning of the prostate gland. In addition to the numerous biological roles these minerals
play, they also serve as co-factors in certain biochemical reactions including those involving
antioxidant enzymes. Ihekoronye and Ngoddy (1985) reported 0.40 mg/g (C. papaya), 0.20 mg/g
(C. lanatus), 0.30 mg/g (A. comosus) and 0.40 mg/g (C. sinensis) for iron content. These values
are lower than the value of iron in this present study. Iron serves as a co-factor for the enzyme
catalase, a primary antioxidant that detoxifies hydrogen peroxide by dismutation to water and
oxygen. Iron is a vital component of haemoglobin, the oxygen carrying pigment in red blood
cells. People with iron deficiency suffer from anaemia, which is characterized by such symptoms
as fatigue, paleness, headache and shortness of breath during mild exertion arising from a
decreased ability of blood to transport oxygen to tissues (Winick et al., 1998). The result of the
metal analysis shows that the pulp is a good source of iron and may be useful for the treatment of
anaemia. Minerals like magnesium, potassium, sodium, manganese and lead were not detected
cxlii
in the pulp. The absence of lead and trace amount of chromium could be an indication that the
pulp is free from toxic metals.
The role of antioxidants in human health has prompted some studies in the fields of food
science and horticulture to assess fruit and vegetable antioxidants (Kalt et al., 1999). The
protective action of fruits and vegetables has been attributed to the presence of antioxidants,
especially antioxidant vitamins including ascorbic acid, α-tocopherol and beta-carotene (Grivetti
and Ogle, 2000). The result of the vitamin analyses shows that the S. dulcificum pulp contained
0.04% vitamin A, 22.69% vitamin C, 0.01% vitamin D and 0.02% vitamin K. The high level of
vitamin C in this fruit shows that the fruit could be used to promote healthy living such as
protection against scurvy and other ascorbic acid deficiency related ailments. It has been reported
that supplementing with 500 mg/day of vitamin C for two weeks increased the glutathione
concentration of the blood by 50 per cent (Johnson et al., 1993). Glutathione is one of the body’s
most important natural antioxidants. Vitamin C has also been shown to facilitate iron absorption
by its ability to reduce inorganic ferric ion to the ferrous form (Charttejea and Shinde, 2005).
Deficiency of vitamin C causes scurvy in humans. Vitamin C facilitates wound healing,
production of collagen, formation of red blood cells and boosts immune system.The vitamin C
content of the S. dulcificum pulp is higher than 4.60% reported for A. carambola fruit (Edem et
al., 2008) and lower than 53.5% reported for Tetracarpidum conophorum seeds (Edem et al.,
2009), 93.7% and 75.9% reported for S. gilo and S. aubergine fruits respectively (Edem et al.,
2009). Vitamin A helps maintain good sight and prevents certain diseases of the eye. Vitamin D
acts as a prohormone and it is needed by the body in the absorption of calcium (Morrison and
Hark, 1999).The deficiency of vitamin D leads to rickets.
Amino acids is a class of biologically active compounds present in food and beverages
and are important for human nutrition (Massey et al., 1998) and affect the quality of foods
including taste, aroma, and colour (Ames, 1998; Haefeli and Glaser, 1990). Amino acids are
useful markers to define fruit juice genuineness; however, their use is complicated by the natural
variability of fruit compositions (Linskens et al., 1988).
Figure 6 shows that S. dulcificum pulp contains 8.055% tryptophan, 1.35%
phenylalanine, 0.7% isoleucine, 0.5% tyrosine, 1.05% methionine, 0.4% proline, 0.69% valine,
1.1% threonine, 0.4% histidine, 0.5% alanine, 1.02% glutamine, 1.6% glutamic acid, 0.7%
glycine, 0.3% serine, 1% arginine, 0.1% aspartic acid, 1.23% asparagine, 0.6% lysine, 0.6% and

cxliii
leucine. A study of the amino acid distribution shows that the pulp contains both the essential
and non- essential amino acids in high concentrations. Such rich contents for these amino acids
make it important as a raw material for the production of pharmaceuticals and diet supplements.
Particular focus is given to the lysine requirements of adults, since this indispensable amino acid
is most likely to be limiting in the cereal-based diets characteristic of populations in large areas
of the developing world (Young and Pellett, 1990; Hoshiai, 1995).For some amino acids,
considerable literature exists from human and animal studies, in particular, glutamate, aspartate,
and phenylalanine are well represented because of their use as food-flavouring agents (glutamate
as monosodium gluatamate (MSG) and aspartate and phenylalanine in aspartame) and lysine
health benefits (Garlick, 2004). Considerably higher level of phenylalanine compared to daily
intake was obtained in this study. Concern for the safety of phenylalanine arises from the
abnormal brain development known to occur in humans with phenylketonuria. But, in those with
a normal ability to metabolize phenylalanine, this amino acid is relatively safe. Investigated
essential amino acids and some hormones are termed indispensable amino acids which must be
provided in the diet. In this study, sufficient amounts of essential amino acids expressing
valuable nutritious potential of this fruit were obtained. Although no single plant would provide
humans with adequate levels of all essential amino acids, S. dulcificum pulp could be consumed
with other foods to contribute useful amounts of the amino acids to the diet.
The quantitative phytochemical composition of S. dulcificum pulp as observed in Table 2
shows a relatively high concentration of flavonoids while bioactive compounds like tannin and
saponin were present in small concentrations. Flavonoid isolated from egg plant peel is a potent
antioxidant and free radical scavenger and has been shown to protect cell membranes from
damage (Noda et al., 2000). Flavonoids extracted from the fruits of S. melongena showed
significant hypolipidemic action in normal and cholesterol fed rats (Sudheesh et al., 1997). In
vitro studies have also shown that flavonoids have anti-allergic, anti-inflammatory, anti-
microbial and anti-cancer activities (Cushnie and Lamb, 2005; Sousa et al., 2007; Yamamoto
and Gaynor, 2001). Therefore, the s. dulcificum pulp might be ascribed with these potentials.
Tannins have astringent properties that affect palatability, reduce food intake and consequently
body growth. It also hastens the healing of wounds and prevention of decay. Tannin compounds
have antimicrobial activities and are responsible for preventing and treating urinary tract
infections and other bacterial infections (Tapiero et al., 2002). They are known to inhibit the

cxliv
activities of digestive enzymes and nutritional effects of tannins are mainly related to their
interaction with protein. Tannin protein complexes are insoluble and protein digestibility is
decreased (Carnovale et al., 1991). Studies on rats, chicks and livestock revealed that high tannin
in the diet adversely affect digestibility of proteins and carbohydrates thereby reducing growth,
feeding efficiency, metabolizable energy and bioavailability of amino acids (Aletor, 1993). This
shows that S. dulcificum pulp might have antioxidant activity.
Saponins are known to reduce certain nutrients like glucose and cholesterols at the gut
through intra-lumenal physicochemical interactions (Price et al., 1987). Also, when saponins are
consumed they may aid in lessening the metabolic burden that would have been placed on the
liver (Igboh et al., 2009). They are known to inhibit the structure dependent biological activities
(Savage, 1993). Saponins have been reported to be useful in reducing inflammation of upper
respiratory passage and also chiefly as foaming and emulsifying agents and detergents
(Frantisek, 1991).These compounds serve as natural antibiotics, helping the body to fight
infections and microbial invasion (Okwu, 2004).
Phytochemicals like alkaloids, glycosides, resins, terpenoids, steroids and cyanogenic
glycosides were present in trace concentrations as shown in Table 2. Alkaloids, saponins and
tannins are known to have antimicrobial activities as well as other physiological activities
(Sofowora, 1993; Evans, 2005). Alkaloids are known for their toxicity but not all alkaloids are
toxic. Alkaloids inhibit certain mammalian enzymatic activities such as those of
phosphodiesterase, prolonging the action of cAMP. While some forms have been reported to be
carcinogenic (Okaka et al., 1992), some have been used either as an analgesic, antispasmodic or
bactericidal agents (Frantisek, 1991). Resins which were present in the pulp are important
because they can be used in African medicine (Leakey, 1999).The resins are medicinal and are
applied to cure skin diseases such as ringworms, craw-craw and jiggars (Hutchinson et al.,
1993). Resins when applied in lotions and creams stabilize emulsion, add smoothness to the skin
and form protective coating on the skin. The results obtained from the phytochemical test
indicates that the pulp possess some biologically active compounds which could serve as
potential source of vegetable drugs in herbal medicine. These phytochemicals exhibit diverse
pharmacological and biochemical actions when ingested by animals (Amadi et al., 2006).
The antinutrient composition of S. dulcificum pulp presented in Table 5 shows that S.
dulcificum pulp contains 5.67% oxalates, 0.03% phytates and 0.02% haemagglutanin. The

cxlv
oxalate value is higher than 1.06mg/100g reported for B. coricea seeds (Amaechi, 2009) and
0.159 mg/100g reported for Pennsetum purpureum (Okaraonye and Ikewuchi, 2009) but lower
than (58.81 mg/100 g) reported for the seeds of Solanum nigrum (Akubugwo et al., 2007) and
109.00 mg/100 g reported for Gnetum africanum seeds (Ekpo, 2007).Oxalate is of concern
because of its negative effect on mineral availability. High oxalate diet can increase the risk of
renal calcium absorption and has been implicated as a source of kidney stones (Chai and
Liebman, 2004). The level of oxalate in the fruit may not play important role in its nutritive
value. Munro and Bassir (1989) have revealed that the possibility of oxalate poisoning in Nigeria
from consumption of local fruit and vegetables is as remote as it is in other parts of the world.
The phytate content of S. dulcificum pulp is lower than 0.006% reported for Pennsetum
purpureum (Okaraonye and Ikewuchi, 2009) and 0.318 mg/100 g reported for B. coricea seeds
(Amaechi, 2009). The knowledge of phytate level in foods is necessary because high
concentrations of phytate can cause adverse effects on digestibility. Also, phytic acid binds
metals like calcium, zinc, iron and other minerals thereby reducing their bioavailability in the
body (FAO, 1990). Similarly, phytic acid binds to phosphorus and converts it to phytate which is
an indigestible substance thereby decreasing the bioavailability of this element.They also inhibit
digestion of proteins by forming complexes with them (Singh and Krikoran, 1982). Phytic acid
has a negative effect on amino acid digestibility, thereby posing problem to non-ruminant
animals due to insufficient amount of intrinsic phytase necessary to hydrolyse the phytic acid
complex, but the presence is also beneficial because it may have a positive nutritional role as an
antioxidant and anti-cancer agent (Turner, 2006).
Acute toxicity tests are generally the first tests conducted in any toxicity study. They
provide data on the relative toxicity likely to arise from a single or brief exposure to any
substance. Different plant extracts have been known to possess different levels of toxicity which
majorly depends on the levels of antinutrients inherent in the plants (Sofowora, 1993). Safety
profile assay of the extract using mice revealed an oral median lethal dose (LD50) greater than 5
g/kg body weight which is the maximum allowable dose by the Organization for Economic Co-
operation and Development (OECD) guideline 423 for testing of chemicals (OECD, 2008). This
result suggests that the pulp is relatively non-toxic since LD50 above 5 g/kg body weight is of no
practical significance (Lorke, 1983). This is expected considering that the pulp is edible.
Preliminary investigations in the present study on the acute toxicity of the methanol extract of S.

cxlvi
dulcificum pulp in mice showed that the methanol extract of S. dulcificum pulp was not toxic to
mice at the administered concentrations and hence the extract was considered to be safe and non-
toxic for further pharmacological screening.
The change in mean body weight in rats after 14 and 28days are presented in Table 8. A
general increase in physical activities, food and water intake were observed for all the animals
during the feeding experiment. There was initial increase in weight which was sustained. The
increase in weight could be due to increases in both extract and water intake observed all through
the experimental period. The increase in weight of the animals suggests that they increasingly
accumulated calories from the normal rat diet and from the nutrient rich extract. The protein
content of S. dulcificum pulp was relatively high compared with other fruits and may have
contributed to the increase in growth rate observed in the animals. Although the animals used in
this study were fed with normal rat diets, the S. dulcificum methanolic extract might have
allowed proper absorption and utilization of the nutrients. Low level of active/toxic principles
may have stimulated appetite and increased feed utilization resulting in increased weight gain.
When the fleshy part of the fruit is eaten, this glycoprotein binds to the tongue’s taste bud
causing sour foods to taste sweet. There have not been any reported cases of toxicity in humans.
From the results of this investigation, hepatocellular function-enhancing effect of the
methanolic extract of S. dulcificum pulp is reported. Generally, analyses of the activities of some
basic liver function enzymes in the plasma or serum can be used to indirectly access the integrity
of tissues after being exposed to certain pharmacological agent(s). These enzymes are usually
biomarkers whose plasma concentrations above the homeostatic limits could be associated with
various forms of disorders which affect the functional integrity of the liver tissues. Preliminary
phytochemical screening carried out in this study indicated that S. dulcificum pulp contain
flavonoids, saponins, tannins and alkaloids. These phytochemicals are known to perform several
general and specific functions in plants, and may exhibit different biochemical and
pharmacological actions in different species of animals when ingested. These actions range from
cell toxicity to cell protective effects (Trease and Evans, 1996).
A significant decrease (p<0.05) was observed in ALP and ALT levels at the end of the
28 day in the groups fed with 100 mg/kg b.w of the extract compared with the control. The value
of the liver function test depends on the specificity for damage as well as their sensitivity
(Okonkwo et al., 1997, Sodipo et al., 2009). Although, serum levels of both AST and ALT

cxlvii
become elevated when disease processes affect the liver integrity, ALT is the more liver specific
enzyme and therefore generally more specific to changes in activity levels than AST (Kachmar
and Moss, 1976; Sodipo et al., 2009). The result of this present study in which AST and ALT
levels were decreased at the two phases of the experiment (14 and 28 days) and dose-
dependently, therefore suggest that the extract may not have had any significant influence on the
liver function. Also, AST is highly concentrated in several tissues including the heart, muscle,
liver, skeletal muscle and kidney while ALT has its highest concentration in the liver (Kaneko
and Cornelius, 1971; Wilkinson, 1976; Okonkwo et al., 1997; Nduka, 1997; Mayne, 1998;
Atangwho et al., 2007, Sodipo et al., 2009). Therefore, a measure of ALT in serum is of greater
diagnostic specificity in confirming or excluding liver damage. Since the decrease in ALT in this
study was significant after 28 days of administration compared with the control, then there may
not be any likelihood of liver damage by the methanol pulp extract of S. dulcificum.
A significant decrease (p<0.05) was observed in bilirubin level in the groups
administered 100 mg/kg b.w, 200 mg/kg b.w and 500 mg/kg b.w of the extract compared with
the control after the 28 day. The decrease in bilirubin concentration which was significant after
the second phase of the experiment may be caused by increasing doses of the extract. Increase in
bilirubin concentrations may be caused by liver damage, excessive haemolytic destruction of the
erythrocytes, obstruction of the biliary tract (obstructive jaundice) and in drug-induced reactions
(Mukherjee, 1998; Odutola, 1992, Sood, 2006).
A statistically significant decrease (p<0.05) in ALP value as obtained in the group
administered 100 mg/kg b.w of extract after the 28 day study is not of much clinical significance
(Atangwho et al., 2007, Sodipo et al., 2009). Even if there had been an elevation in ALP upon
extract administration, it could still not have confirmed liver damage because according to
Odutola (1992), ALP and AST originate from different tissues such as the liver, bones, intestine
and placenta. All these may show that the effect of the methanolic extract of S. dulcificum pulp
on the rats in this study may not be that of toxicity.
Figures 11 and 13 show time and dose dependent increase in the protein and globulin
concentrations across the test groups during the first phase and second phase (14 and 28 days) of
administration of S. dulcificum extract relative to the control. However, Fig. 12 shows that no
significant difference (p>0.05) was observed in the albumin concentration across the groups

cxlviii
administered respectively100 mg/kg b.w, 200mg/kg b.w and 500 mg/kg b.w of the S. dulcificum
methanolic extract compared with the control at the end of the 14 and 28 days of administration.
The results obtained show that the protein levels in the test groups were significantly
different (p˂ 0.05) at the end of the 14 days compared with the 28 day study. Since serum total
proteins, albumins and globulins are generally influenced by total protein intake (Onifade and
Tewe, 1993), the results obtained indicate nutritional adequacy of the dietary and the extract
proteins. Abnormal serum albumin usually indicates an alteration of normal systemic protein
utilization (Apata, 1990). Awosanya et al., (1999) have demonstrated the dependence of blood
protein on the quality and quantity of protein source. The low level of phytate in the pulp could
also have led to the increased absorption of protein from the rat diet. Phytate acts as a chelator,
impairing proteins and minerals bioavailability (Davies and Gathlin, 1991). Serum albumin is
frequently utilized as an index of the hepatocyte’s ability to carry out synthetic function. Serum
albumin does not change in mild liver injury but readily declines in the face of submassive liver
necrosis (Johnston, 1999). For the duration of administration of the pulp extract, the results
obtained for serum total protein, albumin and globulin suggests that S. dulcificum pulp extract
did not diminish the protein synthetic capacity of the liver. The total protein, albumin and
globulin levels may decrease due to liver dysfunction, malnutrition and malabsorption, diarrhoea,
nephrosis, alpha-1-antitripsin deficiency, acute haemolytic anemia, hypogammaglobulinaemia
/agammaglobulinaemia; severe and loss through the urine in severe kidney disease and
pregnancy. Prolonged destruction of the hepatic cells results in more hepatic releases to
exacerbate hepatic dysfunction and causes decrease in the serum levels of total protein, albumin
and globulin.
The kidney plays an important role in the removal of metabolic wastes from the blood
stream. Its functionality therefore can be assessed among many others by determining the serum
concentration of excretory constituents (Spancer et al., 2011). Measuring creatinine is a simple
test and is the most commonly used indicator for renal function (Delanghe, 1989). The decrease
in creatinine level was found to be significant (p<0.05) only in the groups administered
100mg/kg b.w compared with the control after 14 days. Blood urea nitrogen (BUN) is the end
product of protein metabolism. Its concentration is known to influence the rate of BUN
excretion. After 28 days of administration of S. dulcificum extract, the concentration of urea
significantly decreased (p<0.05) in the test group 2 administered 100 mg/kg b.w extract

cxlix
compared with the control (Fig 21). Urea concentration is elevated in kidney damage, excessive
protein intake and low fluid intake (Jaeger and Hedegaard, 2003).
There was no significant decrease (p>0.05) in the levels of creatinine of groups 3
and 4 animals administered 200 mg/kg b.w and 500 mg/kg b.w of S. dulcificum extract
respectively compared with the control after the 14 day. In a similar manner, Figure 20 shows no
significant difference ( p>0.05) in creatinine concentraions of groups 2, 3 and 4 rats administered
varying doses of S. dulcificum extract compared with group 1 rats after 28 days. The creatinine
levels of rats suggest that these diets did not alter protein metabolism in the rats (Jaeger and
Hedegaard, 2003). Urea and creatinine levels are basically used to assess kidney status. The
normal levels of urea and creatinine of rats administered S. dulcificum methanol extract strongly
indicate that the extract has no adverse effects on kidney functions.
Failure to maintain blood glucose in the normal range leads to conditions of persistently
high (hyperglycaemia) or low (hypoglycaemia) blood sugar (Sacher and Macpherson, 2001). Fig.
16 shows time and dose dependent decrease in the blood glucose concentration across the test
groups during the first (14 days) and second phases (28 days) of administration of S. dulcificum
methanolic extract. The 200 mg/kg b.w and 500 mg/kg b.w doses significantly decreased
(p<0.05) the blood glucose level compared with the control at the end of the 14 day. Similarly,
the 100 mg/kg b.w and 500 mg/kg b.w doses significantly decreased (p<0.05) the blood glucose
level compared with the control at the end of the 28 day. This finding is suggestive of a
hypoglycaemic effect and this effect may aid in lessening the metabolic burden that would have
been placed on the liver. It is well known that soluble fibres generally slow emptying of the
stomach and slow glucose absorption (Swaminathan, 2002). Presence of high crude fibre
improves glucose tolerance and is beneficial in treating maturity onset diabetes (Eromosele and
Eromosele, 1993) thus, the incorporation of this fruit into human diet would increase the level of
fibre intake and could be of tremendous benefit. Some bioactive compounds like saponins
interfere with absorption of dietary glucose (Jenkins and Atwal, 1994). They do this by working
alone or with other nutrients in food. This effect supports the earlier hypothesis that S. dulcificum
pulp may be important for diabetics and those seeking to reduce weight (Chen et al., 2006).
The effect of administration of S. dulcificum pulp methanolic extract on lipid profile
showed no significant difference (p>0.05) across the test groups. A decrease was observed in
serum cholesterol and LDL cholesterollevels but the decrease was not statistically significant.

cl
The trend of result obtained on the lipid profile following the twenty-eight day administration is
similar to that of the fourteen day. LDL cholesterol is often designated “bad” cholesterol since
high level of it in the plasma is linked with increased deposition of cholesterol in the arterial
walls (Vander et al., 1998). HDLs serve as acceptors of cholesterol from various tissues. They
promote the removal of cholesterol from cells and its secretion into the bile by the liver (Vander
et al., 1998). The best single indicator of the likelihood of developing atherosclerotic heart
disease is not total plasma cholesterol but rather the ratio of plasma LDL cholesterol to plasma
HDL cholesterol. The slight increase in TAG observed in the study may predispose the liver to
pathological risk (Belal, 2011).Increase in TAG following administration of the extract could
also be due to the presence of simple sugar, fructose which causes the liver to synthesize fats
through denovo lipogenesis, this reduces sugar in the blood and raised triacylglycerols. Low
density lipoproteins (LDLs) transport cholesterol from its site of synthesis in the liver to the
various tissues and body cells where it is separated and used by the cells. HDLs on the other
hand transport excess or unused cholesterol from the tissue back to the liver where it is broken
down to bile acids and then excreted; this makes HDL beneficial to health. The observed
increase in HDL concentration therefore may impact positively on the function of the liver.
The reduction in cholesterol levels at the different doses may have contributed to the
increase in level of HDL cholesterol observed in the rats across the groups and at the two phases
of the study. HDL cholesterol can remove cholesterol from atheroma within arteries and transfer
it back to the liver for its excretion or reutilization, and as suggested by (Kwiterovich, 2000),
high levels of HDL-cholesterol protect against cardiovascular diseases. The observed increase in
HDL-cholesterol concentration upon administration of the extract indicates that the extract doses
have HDL-cholesterol boosting effect.
LDL-cholesterol transports cholesterol to the arteries where they can be retained in the
atheria proteoglycans starting the formation of plaques, LDL-cholesterol possesses the risk of
cardiovascular diseases when it invades the endothelium and becomes oxidized and the oxidized
form is more easily retained by the proteoglycan, thus increase of LDL cholesterol is associated
with artherosclerosis, heart attack, stroke, peripheral vascular disease (Cromwell and Otvos,
2004). The importance of this LDL-cholesterol lowering effect is that the extract may aid in the
reduction or prevention of cardiovascular diseases.

cli
Figure 21 shows that extract had no significant mean effect (p>0.05) in malondialdehyde
levels compared with the control after the 14 day treatment. Interest in oxidative stress with
relation to the development of disease has gained large attention during the last decade. Lipid
peroxidation is a major mechanism of cell injury in tissues and organs subjected to oxidative
stress that has been studied extensively (Aruoma et al., 1989). It is thought to be an important
factor in the pathophysiology of a number of diseases and in the process of ageing. The control
of lipid peroxidation is of special significance in biology because of its particular importance in
relation to membrane damage (Slater, 1984). Similarly, after 28 days of S. dulcificum extract
administration, Fig. 21 also shows no significant alteration (p>0.05) in the malondialdehyde
concentration of test groups administered 100 mg/kg b.w, 200 mg/kg b.w and 500 mg/kg b.w
extract compared with the control group. This could be as a result of the presence of flavonoids,
antioxidant vitamins and minerals in the pulp. This indicates the ability of the S. dulcificum
methanol extracts to protect against lipid peroxidation, a major mechanism of cell injury in
organisms exposed to oxidative stress. Similar observations have been reported by Arulselvan
and Subramanian, (2007) and Ugochukwu et al. (2003) on the respective effects of M. koenigii
and G. latifolium on diabetic rats.
Histopathological examination of kidney sections of rats following the 14 day and 28 day
post administration of S. dulcificum methanolic extract as observed in Fig 24 and Fig 25 shows
that the Control A, Group B (100 mg/kg b.w), Group C (200 mg/kg b.w) and Group D (500
mg/kg b.w) as having normal kidney architecture [glomerulus (G) and renal tubules (arrow)].
This suggests that the methanolic extract did not have any negative effect on the kidneys at the
tested concentrations and duration of the study. Histopathological examination of liver sections
of rats 14 day post administration with S. dulcificum methanolic extract shows normal liver
architecture. In this study also, a non-significant effect of the methanolic extract of S. dulcificum
pulp on the morphological architecture of the liver tissues is reported.

clii
4.2 CONCLUSION
The aim of this study was to estimate the nutritive composition of Synsepalum dulcificum
pulp and to determine the effect of the methanolic extract on some biochemical parameters in
albino rats. To realise these objectives, it was decided to; firstly, determine the nutritive, amino
acid and antinutritive compositions of the Synsepalum dulcificum pulp, secondly, determine the
quantitative phytochemical constituents. Thirdly, to determine the LD50 for Synsepalum
dulcificum methanolic pulp extract administered acutely in mice. Fourthly, to determine the
effect of the methanolic extract on body weight, hepatic function, serum proteins, albumin,
globulin, renal function, blood sugar level, lipid profile, lipid peroxidation and histopathology
after 14 and 28 days of administration in rats.
cliii
From the results obtained in this study, the following conclusions may be drawn
1. Synsepalum dulcificum pulp is rich in important nutrients especially proteins and crude
fibre which are higher than values reported for most tropical fruits in literature.
2. Synsepalum dulcificum pulp is rich in important minerals with iron and calcium being
more abundant than the other minerals analysed.
3. Synsepalum dulcificum pulp is rich in important vitamins like Vitamins A, C, and E, and
also contains fewer amounts of antinutrients compared with other fruits in literature.
4. The amino acid content of Synsepalum dulcificum protein hydrosylate in the pulp is
adequate with acidic amino acids like tryptophan being most abundant.
5. Phytochemicals such as flavonoids are highly present in Synsepalum dulcificum pulp.
6. Synsepalum dulcificum pulp appears to be practically safe (LD50 above 5000 mg/kg b.w)
when administered acutely to mice through the oral route.
7. The extract significantly reduced (p<0.05) serum levels of ALT, bilirubin, glucose and
low density lipoprotein cholesterol after the 14 day study compared with the 28 day study
and protein, globulin and HDL cholesterol levels were significantly elevated (p<0.05)
Nigeria, a developing country is experiencing food shortage as a result of population
growth, competition for fertile land, poverty, lack of agricultural inputs, poor loan schemes and
incentives (Bello et al., 2008). Nutritionists have advised that eating at least five portions of
fruits and vegetables a day can help people to maintain good health throughout their lives,
protecting them from heart disease and cancer, type 2 diabetes and kidney stones (Wenkam,
1990; USDA, 2003). The present study shows that the S. dulcificum pulp contains important
nutrients necessary for good human and animal health. The findings indicate that the fruit which
is popularly eaten as a sweetener is rich in important food properties when compared with other
fruits. The investigation reveals that neither the pulp nor the extract has a negative effect on
some biochemical parameters, at least in rats. Considering the economic situation in Nigeria and
the near zero economic value of this fruit, its cultivation and consumption should be encouraged.
4.3 SUGGESTIONS FOR FURTHER STUDIES
1.) The effects of pulp extract on antioxidant enzymes and haematological parameters.
2.) The use of another extract for extraction and comparing its effect on some biochemical

cliv
parameters.
3.) The effects of pulp extract on immunological parameters.
4.) Possibly, the nutritional potentials of the seed could be analysed so as to compare with the
information on the pulp.
5.) The mechanism of its hypoglycaemic effects.
REFERENCES Adkins, J.N., Varnum, S.M., Auberry, K.J., Moore, R.J., Angel, N.H., Smith, R.D., Springer,
D.L. and Pound, J.G. (2002). Toward human blood serum proteome; analysis by multidimensional separation coupled with mass spectrometry, Molecular Cell Proteome, 1(12): 947-955.
Akubugwo, I.E., Obasi, A.N. and Ginika, S. (2007). Nutritional potentials of leaves and seeds of
Black Nightshade Solanum nigrum L Var virginicum from Afikpo, Nigeria. Pakistan Journal of Nutrition, 6: 323-326.
Albers, J.J., Warmick, G.R. and Cheng, M.C. (1978). Determination of high density lipoprotein
(HDL)- cholesterol. Lipids, 13: 926 - 932. Aletor, V.A.(1993). Allelo chemicals in plant food and feeding stuffs (I). Nutritional,
biochemical and psychopathological aspects in animal production. Journal of Veterinary and Human Toxicology, 35(1): 57-67.
Allain, C. C., Poon, L. S., Chan, C. S., Richmond, W. and Fu, P. C. (1976). Enzymatic
determination of total cholesterol. Clinical Chemistry, 20(4): 470-475.
clv
Amadi, B.A., Ibegbulem, C.O. and Egbebu, A.C. (2006). Assessment of the effect of aqueous extract of Asimina triloba root on organ weights and liver functions of albino rats. International Journal of Natural and Applied Sciences, 2: 79-81.
Amaechi, N.C. (2009). Nutritive and anti-nutritive evaluation of Wonder kola
(Buccholziacoricea) seeds. Pakistan Journal of Nutrition, 8 (8): 1120-1122. Ames, J.M. (1998). Application of the milliard reaction in the food industry. Food Chemistry,
62: 431-439. Amusa, N.A., Ashaye, O.E. and Oladapo, M.O. (2003). Biodeterioration of proximate composition of African star apple in storage and effects on its food value. African Journal of Biotechnology, 2(3): 56-59. Anaka,O.N., Ozolua, R.I. and Okpo, S.O. (2009). Effect of the aqueous seed extract of Persea
americana mill (Lauraceae) on the blood pressure of spague Dawley rats. African Journal of Pharmacology, 3(10): 485-490.
Anderson, L. and Anderson, N.G. (1977). High resolution two-dimensional electrophoresis of
human plasma proteins. Publication of National Academy of Science, 4(12): 5421-5425. Apata, D.F. (1990). Biochemical, nutritional and toxicological assessment of some tropical
legume seeds. PhD Thesis. University of Ibadan, Nigeria. Arcot, J. and Brand-Miller, J. (2005). A preliminary assessment of the glycemic index of honey.
A Report for the Rural Industries Research and Development Corporation. RIRDC publication No 05/027.
Aruoma, O.I. (1993). Free radicals in tropical diseases. Harwood Academic Publishers, London. Aruoma, O.I., Halliwell, B., Laughton, M.J., Quinlan, G.J. and Gutteridge, J.M. (1989). The
mechanism of initiation of lipid peroxidation. Evidence against a requirement for an iron (II)- iron (III) complex. Biochemical Journal, 258: 617-620.
Aruselvan, P. and Subramanian, S.P. (2007). Beneficial effect of murray koenigii leaves on
antioxidant defense system and ultra structural changes of pancreatic B-cells in experimental diabetes in rats. Chemico- Biological Interactions, 165(2): 155-164.
Ashaye, O.A, Babalola, S.O, Aina, J.O, Fasoyiro, S.B. (2005). Chemical and organoleptic
characterization of pawpaw and guava leathers. World Journal Agricultural Sciences. 1(1): 50-51.
Assmann, G., Jabs, H.U., Kohnert, U., Nolte, W. and Schriewer, H. (1984). Determination of low density lipoprotein (LDL)-cholesterol. Clinica Chimica Acta, 140: 77 – 83.
Association of Official Analytical Chemists (AOAC) (1990). Official Methods of Analysis. 15th
Ed.,Washington, D.C. Pp 220 – 224.

clvi
Association of Official Analytical Chemists (AOAC) (2006). Official Methods of Analysis. 18th
Ed.,Washington, D.C Atangwho, I.J., Ebona, P.E., Egbung, G.E., Eteng, M.U. and Eyong, E.U. (2007). Effect of
Veronia amygdalina Del. on liver function in alloxan-induced hyperglycaemic rats. Journal of Pharmacy and Biological Research, 4 (1): 25-31.
Awosanya, B., Joseph, J.R, Apata, D.F. and Agboola, M.A. (1999). Performance, blood
chemistry and carcass quality attributes of rabbits fed raw and processed pueraria seed meal. Tropical Journal of Animal Science, 2(2): 89-96.
Ayivor, J.E., Debrah, S.K, Nuviadenu, C. and Forson, A. (2011). Evaluation of elemental
contents of wild mango (Irvingia gabonensis) . Advanced Journal of Food Science & Technology;3(5): 381-84.
Ayyagari, R., Roa, B.S.N. and Roy, D.N. (1989). Lectins, trypsin inhibitors, BOAA and tannins in legumes and cereals and the effect of processing. Food Chemistry, 34(3): 229-238.
Ball, D. (2007) “The chemical composition of maple syrup”. Journal of Chemical Education, 84
(10): 1647- 1650. Baum, F. (2007). Health for all now. Reviving the spirit of Alma Ata in the twenty first century.
An introduction to Alma Ata declaration. Social Medicine, 2(1): 31-34. Belal, N.M. (2011). Hepatoprotective effect of feeding celery leaves mixed with chicory leaves
and barley grains to hypercholesterolemic rats. Asian Jounal of Clinical Nutrition, 3: 14-24
Bello, M.O, Falade, O.S, Adewusi, S.R and Olawole, N.O. (2008). Studies on the chemical
compositions and anti-nutrients of some lesser known Nigerian fruits. African Journal of Biotechnology;7: 3972 -79.
Benitez, L.V. (1984). Amino acid and fatty acid profile in aquaculture nutrition studies, p.23-35. In S.S De Silver (eds.). Food Nutrition Research in Asia. Proceedings of the Third Asian Fish Nutrition Network Meeting. Asian fish Society Special Publication, 4:166. Asian Fisheries Society, Manilla, Philippines.
Billingham, M.E., Mason, J.W., Bristow, M.R. and Daniels, J.R. (1978). Anthracycline
cardiomyopathy monitored by morphologic changes. Cancer Treatment Report, 62: 865-872.
Bjelakovic, G. (2007). “Mortality in randomized trials of antioxidants supplements for primary
and secondary prevention: systematic review and meta-analysis”. Journal American Medical Association 279(8): 842-57.
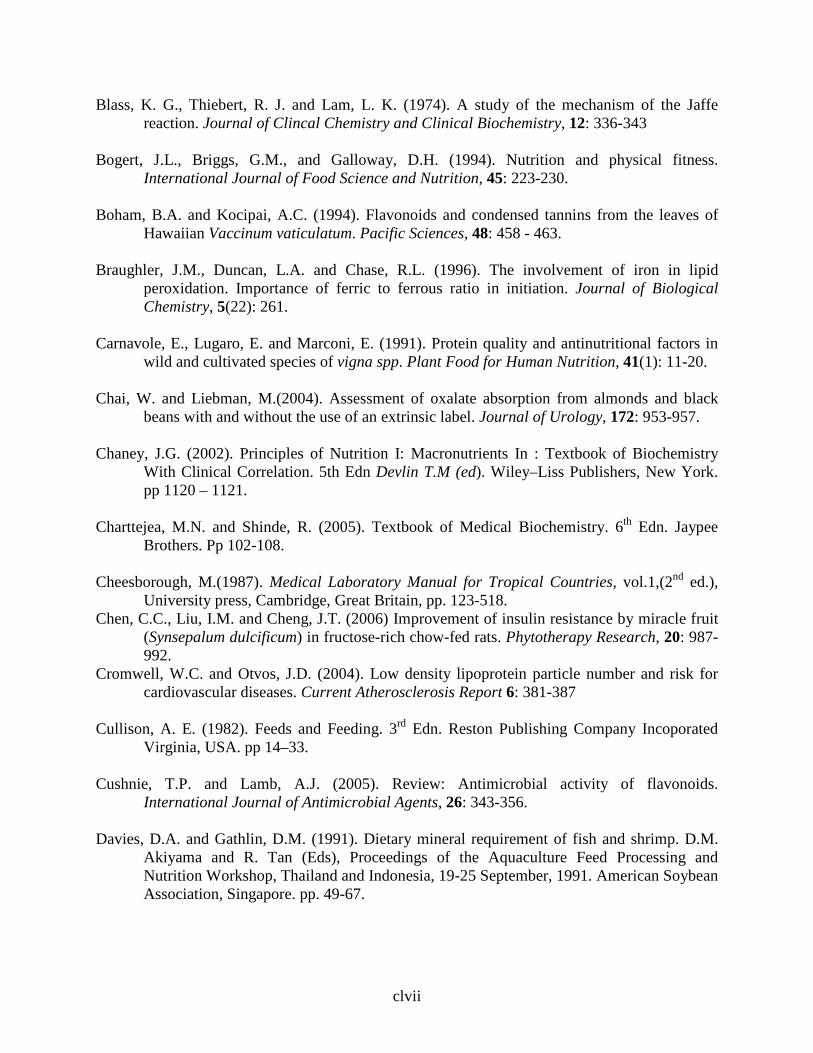
clvii
Blass, K. G., Thiebert, R. J. and Lam, L. K. (1974). A study of the mechanism of the Jaffe reaction. Journal of Clincal Chemistry and Clinical Biochemistry, 12: 336-343
Bogert, J.L., Briggs, G.M., and Galloway, D.H. (1994). Nutrition and physical fitness.
International Journal of Food Science and Nutrition, 45: 223-230. Boham, B.A. and Kocipai, A.C. (1994). Flavonoids and condensed tannins from the leaves of
Hawaiian Vaccinum vaticulatum. Pacific Sciences, 48: 458 - 463. Braughler, J.M., Duncan, L.A. and Chase, R.L. (1996). The involvement of iron in lipid
peroxidation. Importance of ferric to ferrous ratio in initiation. Journal of Biological Chemistry, 5(22): 261.
Carnavole, E., Lugaro, E. and Marconi, E. (1991). Protein quality and antinutritional factors in
wild and cultivated species of vigna spp. Plant Food for Human Nutrition, 41(1): 11-20. Chai, W. and Liebman, M.(2004). Assessment of oxalate absorption from almonds and black
beans with and without the use of an extrinsic label. Journal of Urology, 172: 953-957. Chaney, J.G. (2002). Principles of Nutrition I: Macronutrients In : Textbook of Biochemistry
With Clinical Correlation. 5th Edn Devlin T.M (ed). Wiley–Liss Publishers, New York. pp 1120 – 1121.
Charttejea, M.N. and Shinde, R. (2005). Textbook of Medical Biochemistry. 6th Edn. Jaypee
Brothers. Pp 102-108. Cheesborough, M.(1987). Medical Laboratory Manual for Tropical Countries, vol.1,(2nd ed.),
University press, Cambridge, Great Britain, pp. 123-518. Chen, C.C., Liu, I.M. and Cheng, J.T. (2006) Improvement of insulin resistance by miracle fruit
(Synsepalum dulcificum) in fructose-rich chow-fed rats. Phytotherapy Research, 20: 987-992.
Cromwell, W.C. and Otvos, J.D. (2004). Low density lipoprotein particle number and risk for cardiovascular diseases. Current Atherosclerosis Report 6: 381-387
Cullison, A. E. (1982). Feeds and Feeding. 3rd Edn. Reston Publishing Company Incoporated
Virginia, USA. pp 14–33. Cushnie, T.P. and Lamb, A.J. (2005). Review: Antimicrobial activity of flavonoids.
International Journal of Antimicrobial Agents, 26: 343-356. Davies, D.A. and Gathlin, D.M. (1991). Dietary mineral requirement of fish and shrimp. D.M.
Akiyama and R. Tan (Eds), Proceedings of the Aquaculture Feed Processing and Nutrition Workshop, Thailand and Indonesia, 19-25 September, 1991. American Soybean Association, Singapore. pp. 49-67.

clviii
Deepak, A.R., Le, T. and Blushan, V. (2007). First Aid for the USMLE Step 1 2008 (First Aid for the USMLE Step 1) McGraw-Hill Medical. Pp 4-10.
Delanghe, J., De Slypere, J.P., De Buyere, M., Robbrecht, J., Nieme, R. and Vermeulen, A.
(1989). Normal reference values for creatinine, creatine and creatine are lower in vegetarians. Clinical Chemistry, 35: 1802-1803.
Doumas, B.T. (1971). Standards for total protein assays- a collaborative study. Clinical
Chemistry, 21: 1159–1166. Duke, J.A. and Ducellier, J.L. (1993). Handbook of Alternative Cash Crops. CRC Press. pp. 433-
434. Edem, C.A., Dosunmu, M.I., Ebong, A.C. and Jones, M. (2008). Determination of proximate
composition of ascorbic acid and heavy metal content of star fruit (Averrhoa Carambola). Global Journal of Pure and Applied Sciences, 14(2): 193-195.
Edem, C.A., Dosunmu, M.I., Bassey, F.I., Wilson, C. and Umoren, P. (2009). A comparative
assessment of the proximate composition, ascorbic acid and heavy metal content of two species of garden egg Solarium gilo and Solarium anbergrine. Parkistan Journal of Nutrition, 8(8): 582-584.
Ekpete, O.A., Edori, O.S. and Fubara, E.P.(2013). Proximate and mineral composition of some
Nigerian fruits. British Journal of Applied Science & Technology 3(4): 1447-1454 Ekpo, A.S. (2007). Determination of chemical composition of Gnetum africanum (Afang) seeds.
Pakistan Journal of Nutrition, 6:40-43. Ensminger, M.E. and Olentine, C. G. (1978). Feeds and Nutrition–Complete. Ist Edn. The
Ensminger Publishing Company, California. p.1057. Enujiuba, V.N. and Akanbi, C.T. (2005). Compositional changes in African oil bean
(Pentaclethra macrophylla Benth) seeds during thermal processing. Pakistan Journal of Nutrition. 4(1): 27-31.
Eriyamremu, G.E. snd Adamson, I. (1994). Early change in energy metabolism in rats exposed to
an acute level of deoxcholate and fed a Nigerian diet. Annals of Nutrition and Metabolism, 38: 174-183.
Eromosele,I.C. and Eromosele, C.O (1993). Studies on the chemical composition and physio-
chemical properties of seeds of some wild plants. Plant Foods for Human Nutrition 43: 251-258. http://www.springer.com/food+science/journal/11130
Evans, N.S. (2005). Trease and Evans.Pharmacognosy. 15th Edn, Elsevier, India. pp 1-24.

clix
Fahy, E., Subramaniam, S., Murphy, R. C., Nishijima, M., Raetz, C. R., Shimizu, T., Spener, F., Van meer, G., Wakelam, M. J. and Dennis, E. A. (2009). Update of the LIPID MAPS: Comprehensive classification system for lipids. Journal of Lipid Research, 50: 9-14. FAO (1990). Root, Tuber, Plantains and Bananas in Human Nutrition. FAO Corporate
Document Repository, Rome. http//www.fao.org/docrep/t0207e Fischbach, F.T. and Dunning, M.B. (2004). Manual of Laboratory and Diagnostic Tests. 7thEdn.
Lippincott Williams and Wilkin, Philadelphia. pp 23-25. Forester, S.C. and Waterhouse, A.L. (2009). Metabolites are key to understanding health effects
of wine polyphenolics. Journal of Nutrition, 139: 1824-1831. Frantisek, S.S. (1991). The Natural Guide to Medicinal Herbs and Plants. Tiger Barks Cast,
Twinkemhan, United Kingdom. pp.1-5. Frazier, W.S. and Wwstoff, D.C. (1978). Food Microbiology. 3rd Edn. McGraw Hill, New York. Garlick, P.J. (2004). The nature of human hazards associated with excessive intake of amino
acids. Journal of Nutrition, 134: 1633-1639. Gaziano, J. M., Albert, C.M. and Cook, N. R. (2007). A randomized factorial trial of vitamins C
and E and beta carotene in the secondary prevention of cardiovascular events in women. Archives of Internal Medicine, 167(15): 1610-1618.
Gheldof, N., Wang, X. and Engeseth, N. (2002). “Identification and quantification of antioxidant
components of honey from various floral sources”. Journal of Agiculture and Food Chemistry, 50(21): 5870- 5877.
Girvent, M., Franch, G. and Sitges–Serra, A. (2005). Water and Electrolytes. In: Clinical
Nutrition Gibney, M.J. and Merinos, F. Blackwell Publishers, U.K. pp 441–456. Grivetti, L.E. and Ogle, B.M. (2000). Value of traditional foods in meeting macro and
micronutrient needs: the wild plant connection. Nutrition Research Reviews, 13(1): 31-36.
Gutteridge, J.M. (1996). Lipid peroxidation and antioxidants as biomarkers of tissue damage.
Clinical Chemistry, 41: 1819-1828. Gutteridge, J.M. (1997). The protective action of superoxide dismutase on metal iron catalysed
peroxidation of phospholipids. Biochemistry and Biophysical Research Communications, 77(1): 379-386.
Gutteridge, J.M. and Halliwell, B. (1990). The measurement and mechanism of lipid
peroxidation in biological system trends. Biochemical Science, 15: 129-135.

clx
Haefeli, R.J. and Glaser, D. (1990). Taste responses and thresholds obtained with the primary amino acids in humans. Lebensm-Wiss U-Technology, 23: 523- 527.
Haines, T.H. (2001). Do sterols reduce proton and sodium leaks through lipid bilayers? Progress
in Lipid Research, 40(4): 299-324. Halliwell, B. (1994). Free radicals and antioxidants free radicals, antioxidants and human
disease: Curiosity, cause or consequence? Lancet,344: 721-724. Halliwell, B., Murcia, M.A., Chirico, S. and Aruoma, O.I. (1995). Free radicals and antioxidants
in food and invivo: what they do and how they work. Critical Review of Food Science and Nutrition, 35: 7-20.
Halliwell, B., Gutteridge, J.M. and Gregory, T.Q. (1999). The mechanism of initiation of lipid
peroxidation. Evidence against a requirement for an iron (II)- iron (III) complex. Biochemistry Journal, 258: 617-620.
Hampl, S. J. and Gordon, W. M. (2007). Perspectives in Nutrition.7th Ed., McGraw-Hill, New
York. pp 10-11. Harborne, J. B. (1983). Phytochemical Methods: A Guide to Modern Technology of Plant
Analysis. 2nd Edn. Chapman and Hall, New York. p 113. Harborne, J.B. (1984). Phytochemical Methods: A Grade to Modern Technology of Plant
Analysis. 2ndEdn. Chapman and Hall, New York. pp 88-185. Harper, A. (1999). Redefining the Essentiality of Nutrient: In: Modern Nutrition in Health and
Disease, 9th Edn. M.E. Shills, et al. (Eds). Williams and Wilkins, Baltimore, M.D. pp. 56-90.
Hemingsway, C.A. (2004). Plant and People. Edible Plant J.P.1 Henry, J.B. (2001). Clinical Diagnosis and Management by Laboratory Methods. 20th Edn.
Saunders, Philadelphia P.A. p.23. Hoshiai, K.(1995). World balance of dietary essential amino acids relative to the 1989
FAP/WHO protein scoring pattern. Food Nutrition Bulletin, 16: 166-177. Hutchinson, J. M., Dalziel, J. and Hepper, F. N. (1993). Flora of West Africa (Vol. 11)
Macmillan Publishers Ltd, Lagos. pp. 252 – 260. Igboh, M.N., Ikewuchi, C.J. and Ikewuchi, C.C. (2009). Chemical profile of chormolaena
odoratal. Pakistan Journal of Nutrition, 8(5): 521-524. Ihekoronye, A.I.and Ngoddy, P.O. (1985). Integrated Food Science and Technology for The
Tropics. Macmillan publishers London. pp 366-367.

clxi
Illingworth, D.R. (2000). Management of hypercholesterolemia. Medical Clinics of North America, 84: 23.
Jacob, R. (1996). Three eras of vitamin C discovery. Sub-Cellular Biochemistry, 25: 1-16 Jaeger, J. J. and Hedegaard, H. (2003). Liver function tests: In the Danish Hepatitis c website.
http://home3. inet.tele.dk/omni/alttest.html. Jenkins, K.J. and Atwal, A.S. (1994). Effect of dietary saponins on fecal bile acids and nuetral
sterols and availability of vitamins A and E in chicks. Journal of Nutritional Biochemistry, 5(3): 134-137.
Johansen, J.S., Harris, A., Rychly, D.J. and Ergul, A. (2005). Oxidative stress and the use of
antioxidants in diabetes: Linking basic sciences to clinical practice. Cardiovascular Diabetology, 4: 5. Available online at http://www.cardiab.com/content. Retrieved 4th January, 2005.
John, B. and Henry, M.D. (2001). Clinical diagnosis and management by laboratory methods.
Clinical Chemistry, 20(4): 570-575. Johnson, M. K., Hashtroudi, S. and Lindsay, D. S. (1993). Source monitoring. Psychological
Bulletin, 114: 3-28. Johnston, D. E. (1999). Special consideration in interpreting liver function test. American
Academy of Family Physician, 59: 2223-2230. Joseph, J.A., Shukitt-Hale, B., Willis, L.M. (2009). Grape juice, berries and walnuts affect brain
aging and behavior. Journal of Nutrition, 139: 1818-1823. Kachmar, J.F. and Moss, D.W. (1976). Enzymes (Transaminases). In: Fundamental of Clinical
Chemistry W. E. Nobert and N.W. Teitz, eds, W.B. Kalt, W., C.F., Forney, C.F., Martin, A. and Prior, R.L. (1999). Antioxidant capacity, vitamin C,
phenolics and anthocyanins after fresh storage of small fruits. Journal of Agriculture and Food Chemistry, 47: 4638-4644.
Kaneko, J.J. and Cornelius, C.E. (1971). Clinical Biochemistry of Domestic Animals. 2nd Edn.
Academic Press, New York. pp 20-25. Kanner, J., German, G.B. and Kinsella, J.E. (1997). Initiation of lipid peroxidation in biological
systems. Critical Review of Food Science Nutrition, 25(4): 317-364. Keay, R.W.J. (1989).Trees of Nigeria. Clarendo Press. Oxford, U.K. pp.476 Khaw, K. and Woodhouse, P. (2005). ”Interrelation of vitamin C, infection, haemostatic factors
and cardiovascular disease”.British Medical Journal, 310(6994): 1559-1563.

clxii
Klein, B., Read, P.A. and Babson, A. L. (1960). Rapid method for the quantitative determination
of serum alkaline phosphatase. Clinical Chemistry, 12(18): 482-490. Krishnaiah, D., Sarbatly, R. and Bono, A. (2007). Phytochemical antioxidants for health and
medicine, a move towards nature. Biotechnology and Molecular Biology Review, 1:97-104. Available online at http://www.academicjournals.org/BMR
Kwiterovich, P.O. (2000). The metabolic pathways of high-density lipoprotein, low-density
lipoprotein and triglycerides: A current review. American Journal of Cardiology,86 (12A): 5L-10L
Leakey, R. R. B. (1999). Potential for novel food products from agro forestry Trees. A Review of
Food Chemistry, 1 – 4 Liener, I.E. (1980). Toxic Constituents of Plant Foodstuffs. 2nd Edn. Academic Press, New York
and London. p. 502 Linskens, H.F., Jackson, J.F. and Fang, T.T. (1988). Modern Methods of Plant Analysis.
Springer-Verlag Berlin, Germany. pp. 51-68. Lubran, M.M. (1978). The measurement of total serum proteins by the biuret method. Annals of
Clinical Laboratory Science, 8(2): 106-110. Lorke, D. (1983). A new approach to practical acute toxicity testing. Archives of Toxicology, 53:
275-289. Lucas, G.M. and Markakas, P. (1982). Phytic acid and other phosphorus compounds of bean
(Phaseolus vulgaris). Journal of Agriculture Education and Chemistry, 23: 13-15. Marks, V. and Dawson, A. (1965). Rapid sticks method for determining blood glucose
concentration. British Medical Journal, 30:1(5430): 293-294 Martos, I., Ferreres, F. and Tomas-Barberan, F. (2000). “Identification of flavonoid markers for
the botanical origin of Eucalyptus honey”. Journal of Agriculture and Food Chemistry, 48(5): 1498-1502.
Mashaghi S, Jadidi T, Koenderink G, Mashaghi A (2013). Lipid nanotechnology
International Journal of Molecular Science, 14: 4242–4282. Massey, K.A., Blakeslee, C.H. and Pitlow¸ H.S. (1998). A review of physiological and metabolic effects of essential amino acids. Amino Acids, 14: 271- 300. Mattes, R.D. and Popkin, B.M. (2009). “Non-nutritive sweetener consumption in humans: Effect
on appetite and food intake and their putative mechanism”. American Journal of Clinical Nutrition, 89(1): 1-14.

clxiii
Mayne, P.D. (1998). Clinical Chemistry Diagnosis and Treatment. 6th Edn. Arnold International, London. pp 199 - 204. Meregini, A.O.A. (2005). Some endangered plants producing edible fruits and seeds in South
Eastern Nigeria. Fruits, 60(3): 211-220. Mohamadi-Nejed, A., Moosari-Movahedi, A., Hakimelahi, G. and Sheibani, N. (2002).
Thermodynamic analysis of human serum albumin interaction with glucose. Insights into the diabetic range of glucose concentration. International Journal of Biochemistry and Cell Biology, 34(9): 1115-1124.
Morrison, G. and Hark, L. (1999). Medical Nutrition and Disease. 2nd Edn. Blackwell Science,
Cambridge, M.A. pp. 17. Mukherjee, K.L. (1998). Medicinal Laboratory Technology. A Procedure Manual for Routine
Diagnosis Tests. Vol III. Tata McGraw Hill Pub. Co. Ltd. New Delhi. pp 1: 282. Munro, A. and Basir, O. (1969). Oxalate in Nigerian vegetables. West African Journal of Biology
and Applied Chemistry, 12(1): 4-18. Murray, R. K., Granner, D.K., Mayers, P.A. and Rodwel, V.W. (2000). Harper’s Biochemistry.
25th Edn. McGraw Publishers, New York. pp. 647-651. Murray, R.K., Granner, D.K., Mayers, P.A. and Rodwel, V.W. (2003).Harper’s Biochemistry.
26th ed. McGraw Publishers, New York. Murray, R.K., Granner, D.K., Mayers, P.A. and Rodwel, V.W. (2008). Harper’s Biochemistry,
27th Edn. McGraw Publishers, New York. Nabavi, S.M., Ebrahimzadeh, M.A., Nabavi, S.F., Hamidinia, A. and Bekhradnia, A.R. (2008).
Determination of antioxidant property, phenol and flavonoid contents of parotia persica mey. Pharmacology Online, 2: 560-567.
National Honey Board (NHB) (2012). “Carbohydrates and the sweetness of Honey”. Nduka, N. (1997). Clinical Biochemistry for Students of Chemical Pathology. 1st Edn. Longman
Nigeria Plc, Lagos. pp 122-123. Nelson, D.L. and Cox, M.M. (2000). Lehninger’s Principles of Biochemistry. 3rd Edn. Worth
Publishers, New York. Available online at http://www.worthpublishers.com/lehninger, USA.
Nelson, D.L. and Cox, M.M. (2005). Lehninger’s Principles of Biochemistry. 3rd Edn. Worth
Publishers, New York. USA Available online at http://www.worthpublishers.com/lehninger.

clxiv
Ness, G.C. and Chambers, C.M. (2000). Feedback and hormonal regulation of hepatic 3-hydroxy-3-methylglutaryl coenzyme A reductase: The concept of cholesterol buffering capacity. Proceedings of the Society of Experimental Biology and Medicine, 224: 8
Noda, Y., Kneyuki, T., Igarashi, K., Mori, A. and Packer, L. (2000). Antioxidant activity of
nasunin, an anthocyanin in egg plant peels. Toxicology, 148: 119-123 Obadoni, B.O. and Ochuko, P.O. (2001). Phytochemical studies and comparative efficacy of the crude extract of some homeostatic plants in Edo and Delta States of Nigeria. Global Journal of Pure and Applied Sciences, 8: 203-208. Odutola, A. A. (1992). Rapid Interpretation of Routine Clinical Laboratory Tests. S. Asekome
and Company, Zaria. p. 112. OECD (2008). Guidelines for the Testing of Chemicals. Acute Oral Toxicity- Up and Down
Procedure (UDP) (425). Okafor, J.C. (1993). Edible indigenous woody plants in the rural economy of the Nigerian forest
zone. Forest Ecology and Management (3): 48-55. Okaka, J.C., Enoch, N.J. and Okaka, N.C. (1992). Human Nutrition: An Integrated Approach,
ESUT Publications. Enugu pp. 57-58. Okaraonye, C.C. and Ikewuchi, J.C. (2009). Nutrition and anti-nutritional components of
Pennisetum ipnpureum Schmach. Pakistan Journal of Nutrition 8: 32-34. Okonkwo, P.O, Edagha, B. and Ogbe, R.J.(1997). Enzymes as markers of liver damage in
apparently healthy alcohol drinkers resident in Vom community. International Journal of Biosciences, 2( 4), 90-95
Okwu, D. E. (2004). Phytochemicals and vitamin content of indigenous spices of South Eastern Nigeria. Journal of Sustainable Agriculture Environment 6(1): 30 – 37.
Onibon,V.O., Abulude, F.O. and Lawal, L.O. (2011).Nutritional and anti-nutritional composition
of some Nigerian fruits. Journal of Food Technology,5(2): 120–122.
Onifade, A.A. and Tewe, O.O.(1993). Alternative tropical energy feed performance in rabbit diets: growth performance, diet digestibility and blood composition. World Rabbit Science.1: 17-24.
Onochie, C.F.A. (1979). The Rainforest Ecosystem- An Overview. In: D.U.U.Okali (ed.) The
Nigerian Rainforest Ecosystem. Federal Ministry of Science and Technology, MAB, Ibadan. pp. 1-13.
Padayatty, S., Katz, A., Wang, Y., Eck, P.,Kwon,O., Lee, J., Chen, S, Crop, C., Dutta, A., Dutta,
S. and Levine, M. (2003). Vitamin C as antioxidants: Evolution as its role in disease prevention. Journal of the American College of Nutrition, 22 (1): 18-35.

clxv
Pagana, K.D. and Pagana, T.J. (2002).Mosby’s Manual of Diagnostic and Laboratory Tests.
2ndedn, St Louis:Mosby. pp. 53-62. Pearson, D. A. (1976). Chemical Analysis of Food. 9th Edn. Churchill Livingstone, Edinburgh,
London. pp 135 – 377. Perkins-Veazie, P.M., Collins, J.K. and Robert, W. (2005). Screening carotenoid content in
seeded and seedless watermelon fruit. Journal of Horticultural Science;39: 830. Poteract, C. (1997). Antioxidants and free radical scavengers of natural origin. Current Organic
Chemistry, 1: 415-440. Price, K.R., Johnson, L.I. and Feriwick, H. (1987). The chemical and biological significance of
saponins in foods and feeding stuffs. Critical Reviews in Food Science and Nutrition, 26: 127-135.
Pugalenthi, M., Vadivel, V., Gurumoorthi, P. and Janardhanan, K. (2004). Comparative
nutritional evaluation of little known legumes, Tamarindus indica, Erythrina indica and Sesbania bispinosa. Tropical and Subtropical Agroecosystem, 4: 107-123.
Raji, A.A. and Mohamed, O.(2012). “Studies of effect of pruning on vegetative traits in Stevia rebaudiana bertoni (compositae)”. International Journal of Biotechnology, 4(1): 146.
Ramulu, P. and Rao, P.U.(2003). Total insoluble and soluble dietary fibre contents of Indian fruits. Journal of Food Composition and Analysis, 16: 677-85. Reitman, S. and Frankel, S. (1957). A colorimetric method for determination of serum glutamic
oxaloacetic and glutamic pyruvic transaminases. American Journal of Clinical Pathology, 28: 56-62.
Roecklin, J.C. and Leung, P. (1987). A Profile of Economic Plants. Transaction Publishers. pp.
412. Rude, C. (1998). Magnesium deficiency: A cause of heterogenous diseases in human. Journal of
Bone and Mineral Research, 13: 749–758. SACH (2008). Draft SACN position on dietary fibre and health and the dietary fibre definition
SACN/08/20. http://www.sacn.gov.uk/pdfs/final_draft_scan statement Sacher, R.A. and Mcpherson, R.A. (2001). Widmann’s Clinical Interpretation of Laboratory
Tests. 11th Edn. F.A.Davis Company. pp.13-79. Samuelson, B., Granstrom, E., Green, K., Harnberg, M. and Hammerstrom, S. (1975).
Prostaglandins. Annual Review of Biochemistry, 44: 669-695.

clxvi
Savage, G.P. (1993). Saponins. In: Encyclopaedia of Food Science, Food Technology and Nutrition, Macrae, R., Robinson, R.K. and Sadler, M.J. (Eds). Academic Press London. pp. 3998-4001.
Schneider, C. (2005). Chemistry and Biology of Vitamin E. Molecular Nutrition and Food
Research, 49(1): 7-30. Scott, W.S. (1980). Water relations of food spoilage microorganisms. Advances in Food
Research, 7: 84-127. Searcy, R. L., Reardon, J. E. and Foreman, J. A. (1967). A new photometric method for serum
urea nitrogen determination American Journal of Medical Technology, 33: 15-20. Shepherd, J., Cobbe, S.M. and Ford, I. (1995). Prevention of coronary heart disease with
Indophenols in men with hypercholesterolemia. West of Scotland Coronary Prevention Study Group. New England Journal of Medicine, 333(20): 1301-1307.
Shigeoka, S., Ishikawa, T., Tamoi, M., Miyaguwa, Y., Takeda, T., Yabuta, Y. and Yoshimura,
K. (2002). “Regulation and functions of ascorbata peroxidase isoenzyme”. Journal of Experimental Botany, 53 (372): 1305-319.
Singh, M. and Krikoran, A.D. (1982). Inhibition of trypsin activity in vitro by phytate. Journal of
Agriculture and Food Chemistry, 30: 799-800. Slater, R. J. (1984). Experiments in Molecular Biology. Clifton Humana Press, New Jersey. p
269. Smith, L.L. (1991). Another cholesterol hypothesis; cholesterol as antioxidant free radical.
Journal of Biology and Medicine.11(1): 47-61. Sodipo, O.A., Abdulrahman, F.I, Sandabe, U.K. and Akinniyi, F.I. (2009). Effect of Solanum
macrocarpum Linn. on biochemical liver function in diet induced hypercholesterolaemic rats. Nigerian Veterinary Journal, 30: 1-8.
Sofowora, E.A. (1993). Medicinal Plants and Traditional Medicine in Africa. Spectrum
Books Limited, Ibadan-Owerri -Kaduna-Lagos. pp 159-176; 179-189; 195-238. Sood, R. (2006). Textbook of Medical Laboratory Technology. 1st Edn. Jaypee Brothers
Medical Publishers (p) New Delhi. pp 609-672. Sousa, R.R., Queiroz, K.C., Souza, A.C., Gurgueira, S.A., Augusto, A.C., Miranda, M.A.,
Peppelenbosch, M.P., Ferreira, C.V. and Aoyama, H. (2007). Phosphoprotein levels, MAPK activities and NFkappaB expression are affected by fisetin, Journal of Enzyme Inhibition and Medical Chemistry, 22 (4): 439–444.
Spancer, C.O.N., Sunday, J.J., Teslimat, E.A., Kazeem, O.A.,Eguagie, O.O. and Akinola, A.A.
(2011). Comparative effects of aqueous and ethanolic leaf extracts of Gongronema

clxvii
latifolium on serum lipid and liver biomarkers of normal male rats. Asian Journal of Biological Science, 4: 540-547.
Spiller, G. (1992). Definition of dietary fibre. In: Dietary Fibre in Human Nutrition. Spiller Gene
Ed. CRC Handbook, 2nd Ed. Boca Raton, Florida. pp 15-18. Sudheesh, S., Presannakumar, G., Vijayakumar, S. and Vijayalakshmi, N.R. (1997).
Hypolipidemic effect of flavonoids from Solanum melongena plant food. Human Nutrition, 51: 321-330.
Stryer, L. (1995). Biochemistry. 4th Edn. (In 82ndophe), New 82ndo: W.H Freeman and CO. pp.
208, 703. Swaminathan, M. (2002). Essentials of Food and Nutrition.Volume 1. The Bangalore Printing
and Publishing Co. Ltd. Tapiero, H. Ba, G.N. and Tew, K.D. (2002). Estrogen andenvironmental estrogens. Biomedical
Pharmacotherapy, 56: 1-9. Taubes, G.(2011). Is sugar toxic? The New York Times. Traber, M. G. and Atkinson, J. (2007). Vitamin, antioxidant and nothing more. Free Radical
Biology and Medicine, 43(1): 4-15. Trease, G. E. and Evans, W. C. (1983). Pharmacognosy, 9th Edn. Lee and Febiger. p. 208. Trease, G.E. and W.C. Evans, (1996). Phenols and Phenolic Glycosides, In: Trease and Evans Pharmacognosy and Biliere Tindall, London. p 832. Trinder, P. (1969). Determination of glucose in blood using glucose oxidase with an alternative
oxygen acceptor. Annals of Clinical Biochemistry, 6: 24 – 27. Turner, P. R. (2006). View Point Food For Life Global Perspectives II. One World Publisher
USA. p 20 Ugochukwu, N.H., Babady, N.E., Cobourne, M. and Gasset, S.R. (2003). The effect of
Gongromema latifolium extracts on serum lipid profile and oxidative stress in hepatocytes of diabetic rats. Journal of Biosciences, 28: 1-5.
Umoh I.B. (1998). Commonly used fruits in Nigeria, In: Nutritional Quality of Plant Foods (Eds:
Osagie AU, Eka OU). Post – Harvest Research Unit, University of Benin, Benin City Nigeria.
USDA (2003). United State Department of Agriculture; Juice or Fruit Drink? Nibbles for Health 20 Nutrition Newsletters for Parents of Young Children, Food and Nutrition Service, 1400 Independence Ave., S. W. Washington, DC20250USDA1-2.

clxviii
Vander, A., Sherman, J. and Lucian, D. (1998). Human Physiology: The Mechanism of Body Function. 7th ed., McGraw–Hill Co, New Jersey. pp. 275-299.
Vane, J.R. and Botting, R.M. (1995). A better understanding of anti-inflammatory drug vehicles
on the pharmacokinetics of orally adminstered carbon tetrachloride, vitamins C and E and betacarotene in the secondary presentation of cardiovascular study. Archives of International Medicine, 167(15): 1610-1618.
Wallin, B., Rosengren, B., Shertzer, H.G. and Camejo, G. (1993). Lipoprotein oxidation and
measurement of thiobarbituric acid reacting substances formation in a single microtitre plate: its use for evaluation of antioxidants. Analytical Biochemistry, 208: 10-15
Walker, A.R.P. (1978). The relationship between bowel cancer and fibre content in the diet.
American Journal of Clinical Nutrition, 31: 5248-5251. Wardlaw, G.M. (1999). Perspective in Nutrition. 4th Edn. McGraw-Hill Companies, USA. p. 532. Watty, W. (2000). Descriptions of antioxidant vitamins, nutrients and minerals.
http://www.mdsupport.org. Wenkam A. (1990). Utilization and processing of fruits. Macmillan Press, London. Wiersema, J.H. and Leon, B. (1999). World Economic Plants: A Standard Reference. CRC
Press. p. 661. Wilkinson, J.H. (1976). The Principles and Practice of Diagnostic Enzymology. Edward Arnold Press, London. pp 87-95-129-138; 303. Winick, M., Basel, J.A. and Rasso, P. (1998). A nutrition and cell growth. In: Winick, M.(ed)
Nutrition and Development, John Wiley and Sons, New York. pp. 49-97. WHO (2007). Nutrition for health and development-challenges.www. who/nutrition. html. Yamamoto, Y. and Gaynor, R.B.(2001). Therapeutic potential of inhibition of the NF-Kappa B
pathway in the treatment of inflammation and cancer. Journal of Clinical Investigation 107(2): 135-142.
Young, V.R. and Peletti, P.L.(1990). Currrent concepts concerning indispensable amino acid
needs in adults and their implication for international nutrition planning. Food Nutrition Bulletin,12: 289-300.
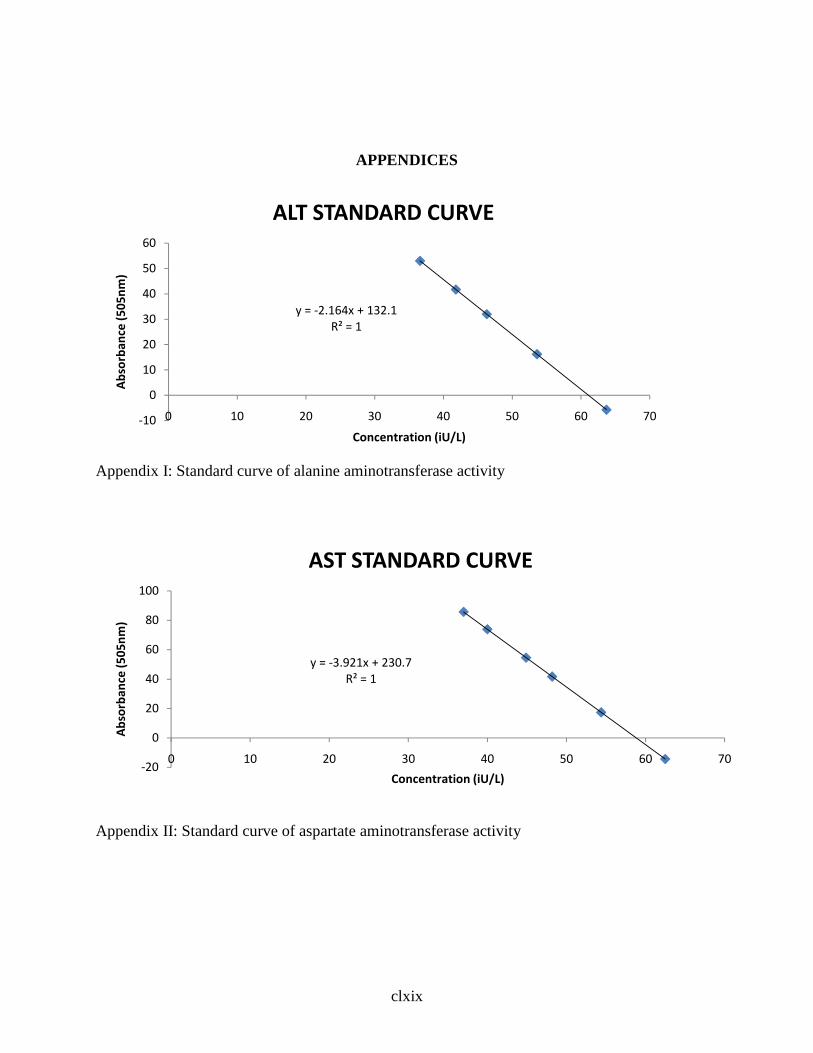
clxix
APPENDICES
Appendix I: Standard curve of alanine aminotransferase activity
Appendix II: Standard curve of aspartate aminotransferase activity
y = -2.164x + 132.1
R² = 1
-10
0
10
20
30
40
50
60
0 10 20 30 40 50 60 70
Ab
sorb
an
ce (
50
5n
m)
Concentration (iU/L)
ALT STANDARD CURVE
y = -3.921x + 230.7
R² = 1
-20
0
20
40
60
80
100
0 10 20 30 40 50 60 70
Ab
sorb
an
ce (
50
5n
m)
Concentration (iU/L)
AST STANDARD CURVE

clxx
Appendix III: Lipid peroxidation (MDA) standard curve
y = 0.0102xR2 = 1
0
0.05
0.1
0.15
0.2
0.25
0.3
0 5 10 15 20 25 30
Concentration (mg/mol)
Ab
sorb
ance
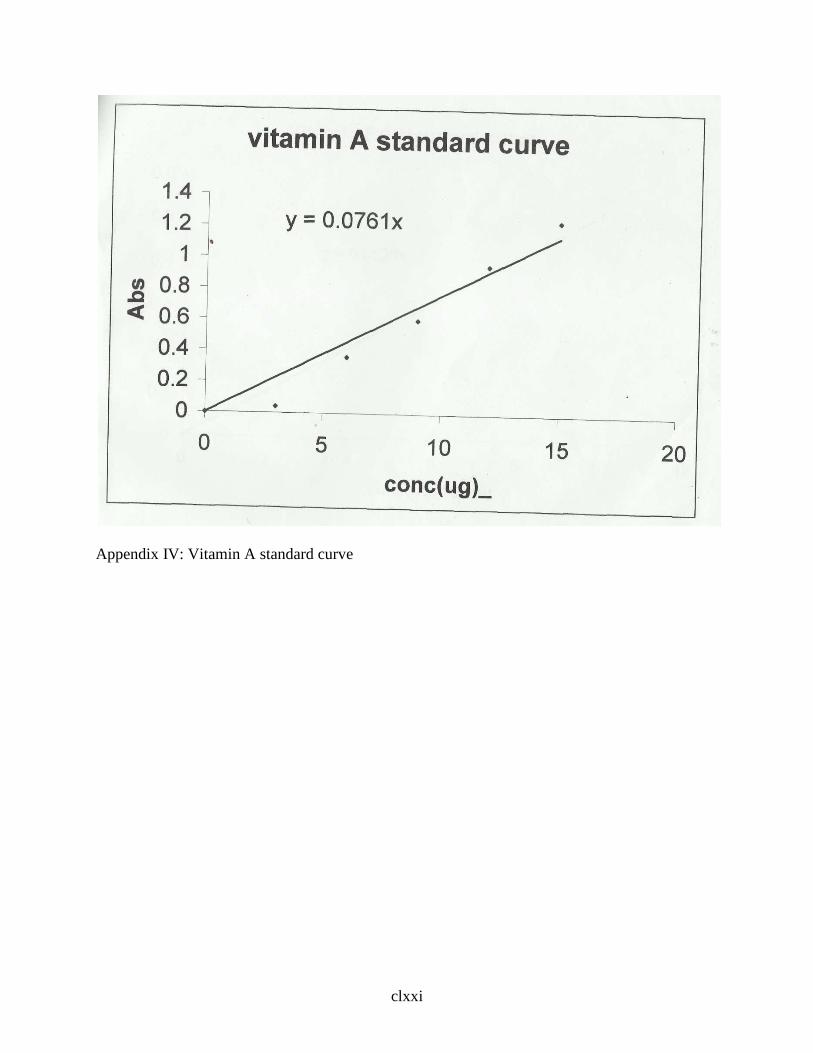
clxxi
Appendix IV: Vitamin A standard curve

clxxii
Appendix V: Vitamin C standard curve

clxxiii
Appendix VI: Vitamin C standard curve
APPENDIX VII: Standard curve of vitamin D
y = 0.902x
00.10.20.30.40.50.60.70.8
0 0.5 1
AB
S
CONC(mg/100ml)
VITAMIN E STANDARD CURVE
y = 0.587x
0
0.1
0.2
0.3
0.4
0.5
0.6
0.7
0 0.2 0.4 0.6 0.8 1 1.2
clxxiv
APPENDIX VIII: Standard curve of vitamin K
Extraction yield
The percentage yield of the methanolic pulp extract of S. dulcificum is shown on Table 7. The extract yield of 13.5% was obtained.
Percentage yield of the methanolic extract
INITIAL WEIGHT (g) FINAL WEIGHT (g) PERCENTAGE YIELD (%)
560 75.66 13.5
APPENDIX IX : Percentage yield of the methanolic extract
y = 11.429x
0
0.1
0.2
0.3
0.4
0.5
0.6
0.7
0 0.01 0.02 0.03 0.04 0.05 0.06
Concentration
Abs
orba
nce

clxxv
APPENDIX X: Parts of this thesis published in the following journal articles:
1. Nkwocha Chinelo C., Njoku Obi U. and Ekwueme Florence N. (2014). Phytochemical,
Antinutrient and Amino Acid Analyses of Synsepalum dulcificum Pulp. IOSR Journal of
Pharmacy and Biological Sciences, 9: (2) 25-29,
2. Nkwocha Chinelo, Njoku Obioma and Ekwueme Florence (2014). Proximate and
Micronutrient Analyses of Synsepalum Dulcificum Pulp. Scientific Research Journal,
2: (I), 25-28
APPENDIX XI : Preparation of Reagents
� 37.5% Ammonium solution: A quantity, 187.5 ml, of the stock concentrated
ammonium solution was dissolved in 31.25 ml of distilled water and made up to 500 ml.
� 45% Absolute ethanol: A quantity, 45 ml, of absolute ethanol was mixed with 55 ml of
distilled water.
� 0.5% Aluminum chloride solution: A quantity, 0.5 g, of aluminum chloride was dissolved
in 100 ml of distilled water.
� 10.9% Sulphuric acid: A quantity, 10.9 ml, of concentrated sulphuric acid was mixed with
5 ml of distilled water and made up to 100 ml.
� Dragendorff’s reagent: A quantity, 0.85 g, of bismuth carbonate was dissolved in 100 ml of
glacial acetic acid and 40 ml of distilled water to give solution A. Another solution called
solution B was prepared by dissolving 8.0 g of potassium iodide in 20 ml of distilled water.
Both solutions were then mixed to give a stock solution.
� 5% Ferric chloride solution: A quantity, 5 g, of ferric chloride was dissolved in 100 ml of
distilled water.
� 2% Hydrochloric acid: A quantity, 2 ml, of concentrated hydrochloric acid was dissolved in
some distilled water and made up to 100 ml.

clxxvi
� Lead Sub-acetate solution: A quantity, 45 ml, of 15% lead acetate solution (i.e. 7.5 g of
lead acetate in 50 ml of distilled water) was dissolved in 20 ml of absolute ethanol and 35 ml
of distilled water.
� Mayer’s reagent: A quantity, 1.35 g, of mercuric chloride was dissolved in 50 ml of distilled
water. Also, 5 g of potassium iodide was dissolved in 20 ml of distilled water. The solutions
were mixed and the volume made up to 100 ml.
� 40% sodium hydroxide: A quantity, 40 ml, of concentrated sodium hydroxide was diluted
with 60 ml of distilled water.
� Wagner’s reagent: A quantity, 2 g, of iodine crystals and 3 g of potassium iodide were
dissolved in 100 ml of distilled water.
� Follin-Dennis reagent: A quantity, 20g of phosphomolybdic acid was mixed with 100g of
sodium tungstate and 50ml of 85% phosphoric acid and 750ml of water. The mixture was
heated in a flask equipped with a reflux condenser for 2 hr. It was then cooled and diluted
with water to 1 litre


