
NVS
New ZealandNational Vegetation Survey

What is NVS?
• NVS (National Vegetation Survey) – New Zealand’s largest archive facility for plot-based vegetation data
• NVS is both a physical (field data sheets, maps, photographs) and electronic archive (database)

NVS - coverage
• Best in grassland and indigenous forest
• Collection intensity has varied over 50+ years
• 14 000 permanent and52 000 relevé plots

Who uses NVS?
Four main types of user:
– biodiversity management practitioners,
– researchers,
– database-to-database,
– users and policy developers and IT-level users.

How is NVS used?
Users rely on NVS as an archive and as a primary source of quantitative vegetation biodiversity data
Traditional uses• monitoring environmental change
• assessing and monitoring impacts of introduced animals
• inventory and description of plant communities
New activities• guiding the design of national-level biodiversity inventory and monitoring programmes
• providing empirical data for validating predictive models
• deriving carbon storage estimates.

NVS data management
• NVS database consists of two distinct parts:

NVS data management
• NVS database consists of two distinct parts:
1. Metadata for projects and datasets (>3000)
• Databank organisation and management
• Search and locate datasets
• Assess suitability for use
• Constraints - Permissions
• Xml Schema – Web delivery

NVS data management
• NVS database consists of two distinct parts:
1. Metadata for projects and datasets (> 3000)
2. Plot-based vegetation survey data • Mainly standardised survey’s (20x20m plots)
• Plot/site descriptors
• Relevé, Repeat measures of individual trees, Understory composition
• Also a wide range of other data types collected by various means (ranks, CWD, browse, etc)
• Relational database – Desktop management system
(new system currently being developed)

Metadata application

Species present
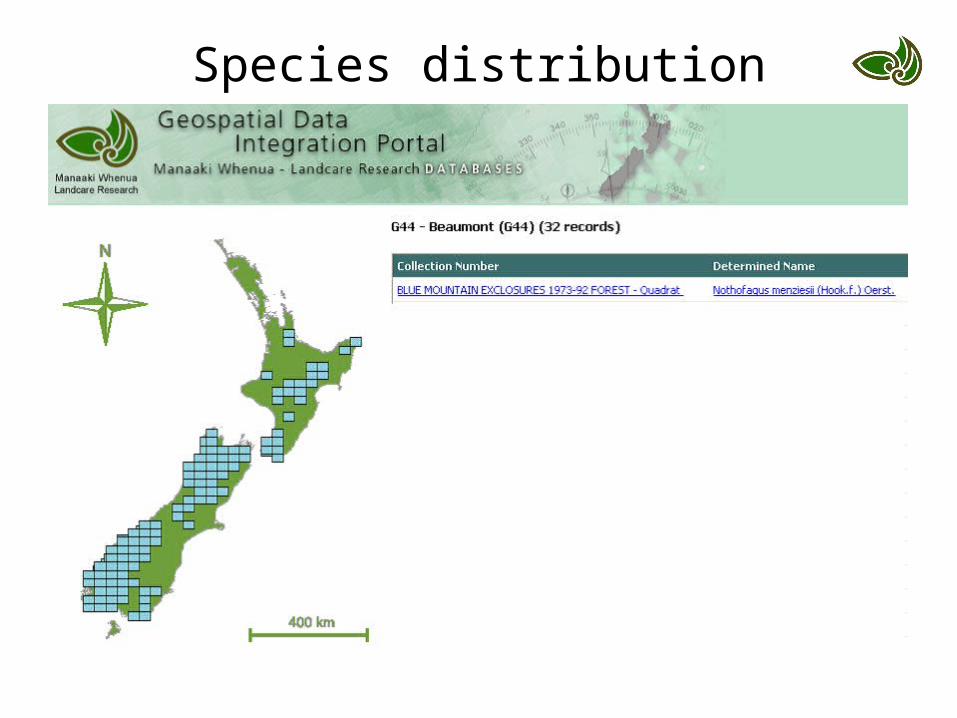
Species distribution

Dataset request

Plot vegetation application

Sample methods

Tree data

Data model overview
Plot
Plot Observation
Project
Observation Method
Individual Observation
Taxon Observation
Taxon

Future uses
• What do users want to do in the future:– Use NVS data in concert with Land Environments New Zealand classification (LENZ) to
identify priority sites for conservation management
– Comparative analysis of vegetation communities in different regions of New Zealand
– Address monitoring requirements supporting a number of national and international reporting objectives, e.g. NZ Carbon Monitoring System, Montreal Process Indicator reporting, Natural Heritage Asset Management reporting
– Large-scale ecological analyses using pooled data at both national and global scales
• What they require:– Tools for entering data into a format suitable for NVS-specific analysis packages
– Formalised and automatic mechanism for uploading data into NVS and returning data corrections and additions to datasets already stored in NVS
– An unrestrictive format to handle data collected using non-standard methods or miscellaneous associated data

Future plans
• Complete new system• Database loaded with historic data• Standard data exchange format• Analysis tools

Goals for this workshop
• Draft vegetation schema is developed
• Ensure that our specific requirements fit into a schema that is usable for all
• Our effort is aligned with that of the larger vegetation science community

What LCR can offer
• Experience in management and recording of individual tree data
• Users protocols, end-users• New tools being developed• TDWG/GBiF, TCS, LSID expertise

Funded by
NZ Foundation for Research Science & Technology - FRST
NZ Department of Conservation -Terrestrial & Freshwater Biodiversity Information System - TFBIS

LCR requirements
• Snapshot/single dataset oriented schema • Link to project and dataset level metadata• Capture methods, units, constraints for data• A format for transferring data between end-users
and NVS• A portable format that is easily read by humans,
but also suitable for machine processing
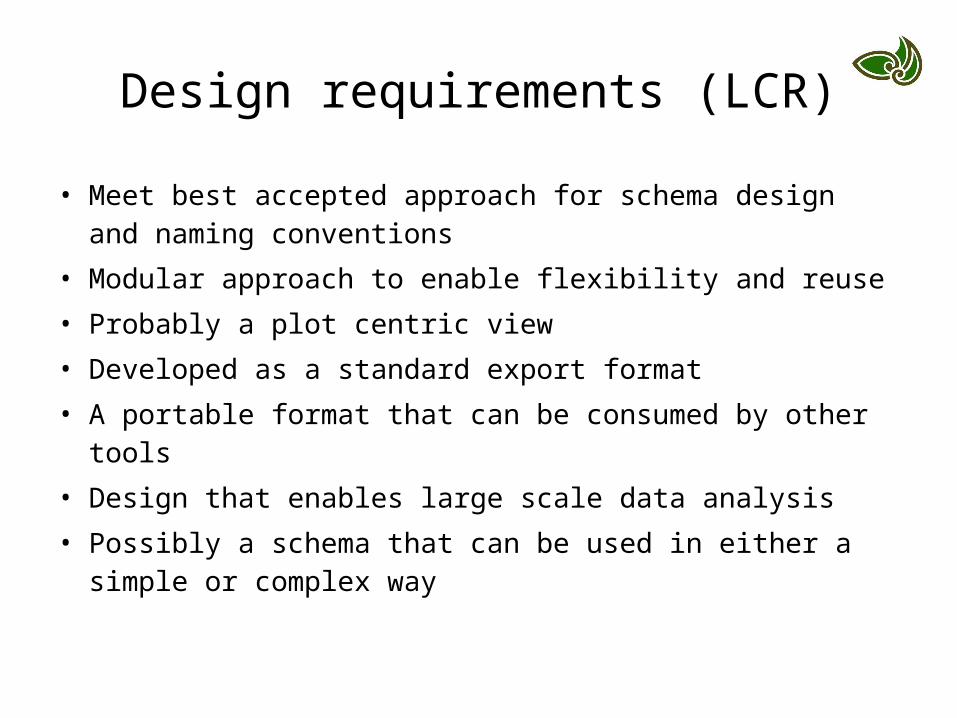
Design requirements (LCR)
• Meet best accepted approach for schema design and naming conventions
• Modular approach to enable flexibility and reuse• Probably a plot centric view• Developed as a standard export format• A portable format that can be consumed by other tools• Design that enables large scale data analysis• Possibly a schema that can be used in either a simple or
complex way

Plot tables
tblProject
PK ProjectPK
NameTypeFKDescriptionStartDateStopDate
FK1 ParentFKGUID
tblPlot
PK PlotPK
NameShapeFKAreaRectangleLength1RectangleLength2RadiusOriginPointFKOriginPointLabelDirectionalBearingAltitudeAltitudeLowerAltitudeUpperAltitudeDatumFKAltitudeMethodFKAspectAspectDirectionFKAspectMethodFKSlopeSlopeMethodFKSlopeShapeFKPhysiographyFKLandformFKParentMaterialFKLocationDescriptionLocationNarrativePlacementMethodFKPermanenceGISFIDParentPlotRelationship
FK1 ParentPlotFK
tblPlotObs
PK PlotObsPK
CurrentNameStartDateStopDateLandUseMeanTopHeightMeanTopHeightMethodFKMaxCanopyHeightCanopyPercentageBasalAreaEstimateIsRelocatedObservedLandcoverFKDrainageFK
FK2 PlotFKFK1 ParentFKFK3 ProjectFK
PlotTreatmentFKGUID
tblDisturbance
PK DisturbancePK
FK1 PlotObsFKTypeFKIntensityAgeExtentComment
tblSoilDepths
PK SoilDepthsPK
FK1 PlotObsFKTypeFKLabelMeasurement
tblPlotGroundCover
PK PlotGroundCoverPK
FK1 PlotObsFKCoverTypeFKCoverMethodFKPercent
tblSurfacePresence
PK SurfacePresencePK
FK1 PlotObsFKSurfaceFKAbsence
tblPlotCoordinate
PK PlotCoordinatePK
FK1 PlotFKSpatialCoordinatesFK
tblUserDefined
PK UserDefinedPK
TableNameFieldNameDataTypeFKUnitsLowerBoundUpperBoundPrecisionScaleValue
tblPlotUserDefined
PK PlotUserDefinedPK
FK1 PlotFKFK2 UserDefinedPK
tblPlotObsUserDefined
PK PlotObsUserDefinedPK
FK1 PlotObsFKFK2 UserDefinedPK

Method tables

Relevé tables
tblTaxonObservation
PK TaxonObservationID
FK1 PlotMethodIDFK2 TaxonNameID VerbatimSpeciesCode TaxonNote
tblTaxonCoverClass
PK CoverClassID
FK1 TierIDFK2 TaxonObservationID CoverClassTypeID
tblTier
PK TierID
FK1 PlotMethodID TypeID LowerBounds UpperBounds
tblTaxonObsAttribute
PK TaxonObsAttributeID
FK2 TaxonObservationIDFK1 AttributeCategoryID AttributeValue
tblPlotMethod
PK PlotMethodID
PlotObsevationID SampleMethodID
tblTaxon
PK TaxonPK
tblAttributeCategory
PK AttributeCategoryID
AttributeID CategoryName CategoryIndex CategoryDescription

Individual tree tables


