OECD/NEA OECD/NEA –– IAEA/ISSC IAEA/ISSC Workshop Workshop
on on
Soil Structure InteractionSoil Structure Interaction KnowledgeKnowledge
Ottawa, Canada
October 2010
“KARISMA Benchmark Phase I Results”
Ayhan ALTINYOLLAR, ISSC/IAEA
IAEA International Atomic Energy Agency
Content
1. Objectives of the benchmark
2. Features of the benchmark
3. Organisation
4. Participants
5. Tasks
6. Phase I results
7. Conclusions from Phase I
8. Perspectives (Phase II)
9. Activities to be continued (Phases II and III)
3
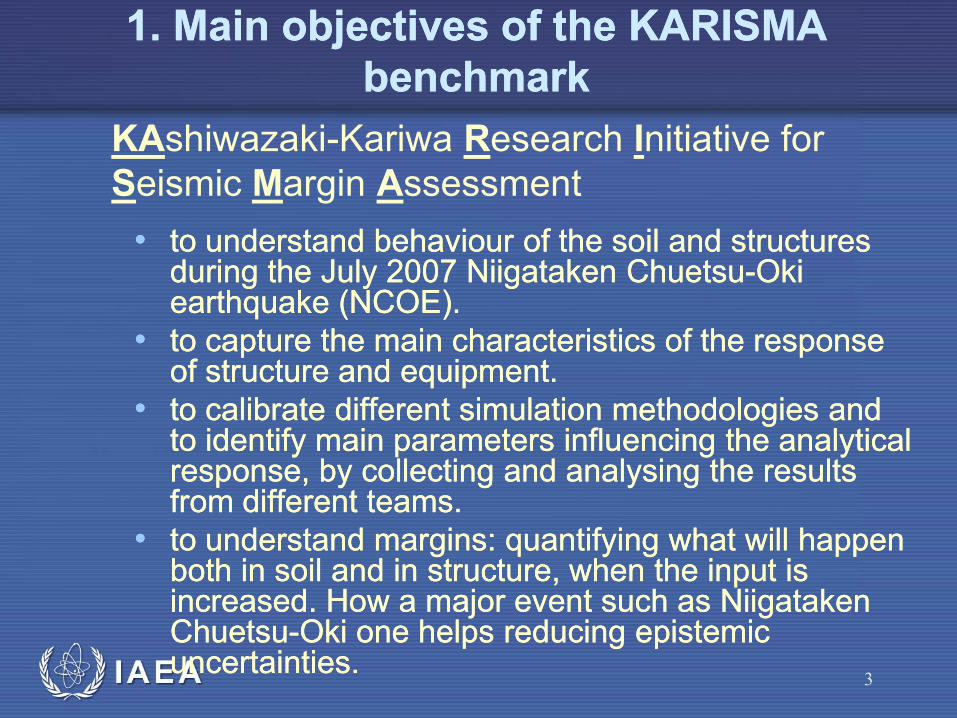
1. Main objectives of the KARISMA 1. Main objectives of the KARISMA
benchmarkbenchmark
•• to understand behaviour of the soil and structures to understand behaviour of the soil and structures during the July 2007 during the July 2007 Niigataken Niigataken ChuetsuChuetsu--Oki Oki earthquakeearthquake (NCOE).(NCOE).
•• to capture the main characteristics of the responseto capture the main characteristics of the response of structure and equipment.of structure and equipment.
•• to calibrate different simulation methodologies and to calibrate different simulation methodologies and to identify main parameters influencing the analytical to identify main parameters influencing the analytical response, by collecting and analysing the results response, by collecting and analysing the results from different teams.from different teams.
•• to understand margins: quantifying what will happen to understand margins: quantifying what will happen both in soil and in structure, when the input is both in soil and in structure, when the input is increased. How a major event such as increased. How a major event such as Niigataken Niigataken ChuetsuChuetsu--Oki one helps reducing epistemic Oki one helps reducing epistemic uncertainties.uncertainties.
KAshiwazaki-Kariwa Research Initiative for
Seismic Margin Assessment
4
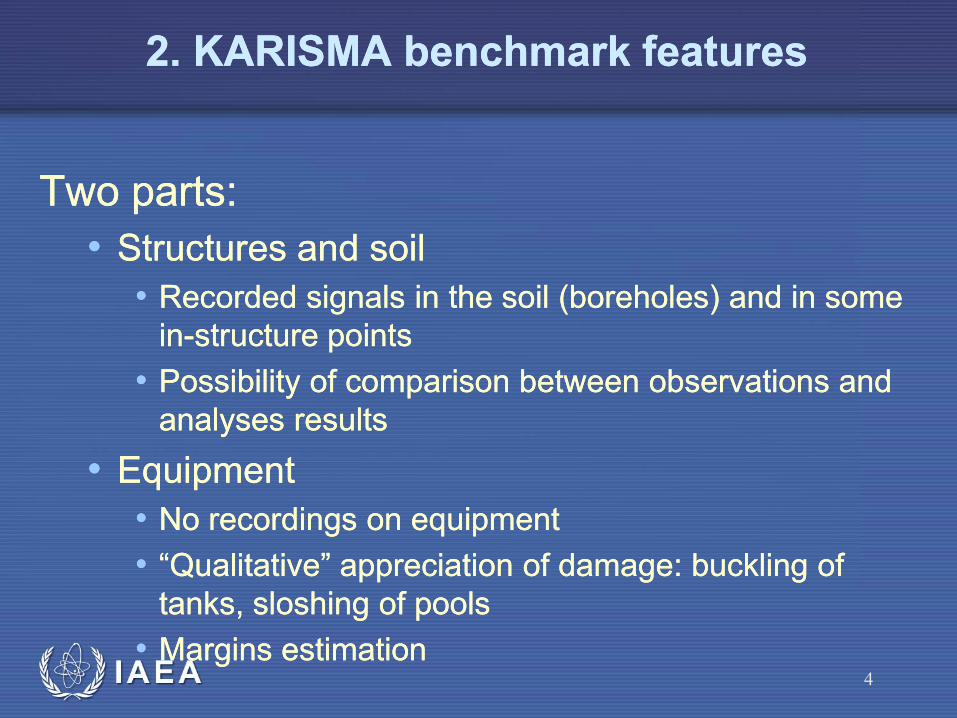
2. KARISMA benchmark features2. KARISMA benchmark features
Two parts:Two parts:
•• Structures and soilStructures and soil
•• Recorded signals Recorded signals in the soil (boreholes) and in some in the soil (boreholes) and in some
inin--structure pointsstructure points
•• Possibility of Possibility of comparison between observations and comparison between observations and
analyses analyses resultsresults
•• EquipmentEquipment
•• No recordings on equipmentNo recordings on equipment
•• “Qualitative” appreciation of damage: buckling of “Qualitative” appreciation of damage: buckling of
tanks, sloshing of poolstanks, sloshing of pools
•• Margins estimationMargins estimation
5
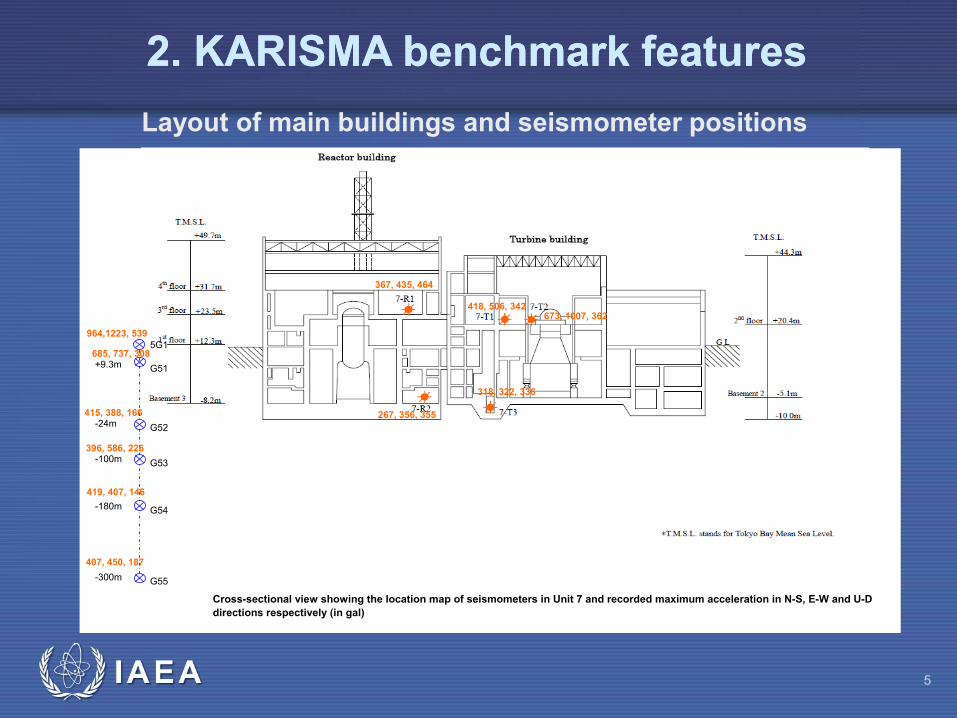
Layout of main buildings and seismometer positions
Cross-sectional view showing the location map of seismometers in Unit 7 and recorded maximum acceleration in N-S, E-W and U-D
directions respectively (in gal)
367, 435, 464
267, 356, 355
418, 506, 342673, 1007, 362
964,1223, 539
685, 737, 308
415, 388, 166
318, 322, 336
+9.3m
-24m
-100m
-180m
-300m
396, 586, 226
419, 407, 146
407, 450, 187
5G1
G51
G52
G53
G54
G55
2. KARISMA benchmark features2. KARISMA benchmark features
•• Different teams are calculating the behaviour of structures Different teams are calculating the behaviour of structures under the same strong event; each team use under the same strong event; each team use their their own own approach.approach.
•• Interaction between teamsInteraction between teams
•• Use of “national practices”Use of “national practices”
•• The possibility of constructing their own model of R/B, soil The possibility of constructing their own model of R/B, soil and equipment are given to teamsand equipment are given to teams..
•• Models should capture the linear and non linear Models should capture the linear and non linear behaviour of soil and structurebehaviour of soil and structure
•• NNeeded data for analyseseeded data for analyses were provided bywere provided by TEPCOTEPCO.
2. KARISMA benchmark features2. KARISMA benchmark features
3 3 -- Organization the KARISMA benchmarkOrganization the KARISMA benchmark
•• IAEA Secretariat is managing the benchmark. IAEA Secretariat is managing the benchmark.
•• ISSC Information System (IIS) is being used.ISSC Information System (IIS) is being used.
•• Guidance documents, result templatesGuidance documents, result templates
•• Organizing Committee (OC) of the benchmark adviseOrganizing Committee (OC) of the benchmark advisess
the IAEA Secretariat. the IAEA Secretariat.
•• The role of the OC is to review the participant results and to The role of the OC is to review the participant results and to
make decisions for the conduct of the benchmark. make decisions for the conduct of the benchmark.
•• Members of OC are: participant representatives, a Members of OC are: participant representatives, a
representative of the scientific committee of the EBP, experts representative of the scientific committee of the EBP, experts
and IAEA Secretariat (3 OC meetingand IAEA Secretariat (3 OC meetingss))
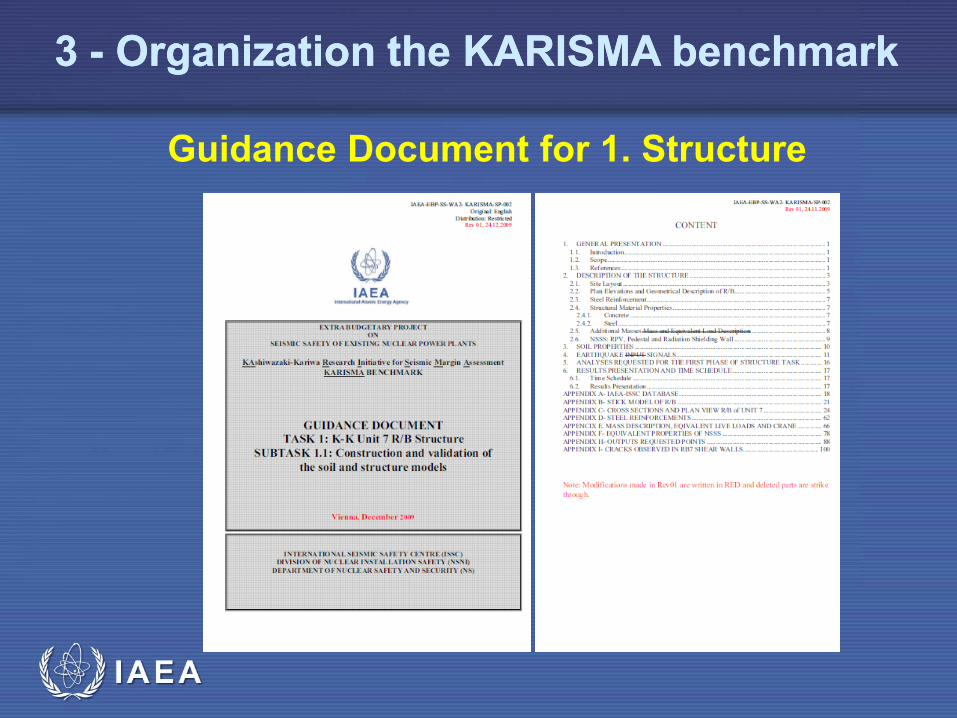
Guidance Document for 1. Structure
3 3 -- Organization the KARISMA benchmarkOrganization the KARISMA benchmark
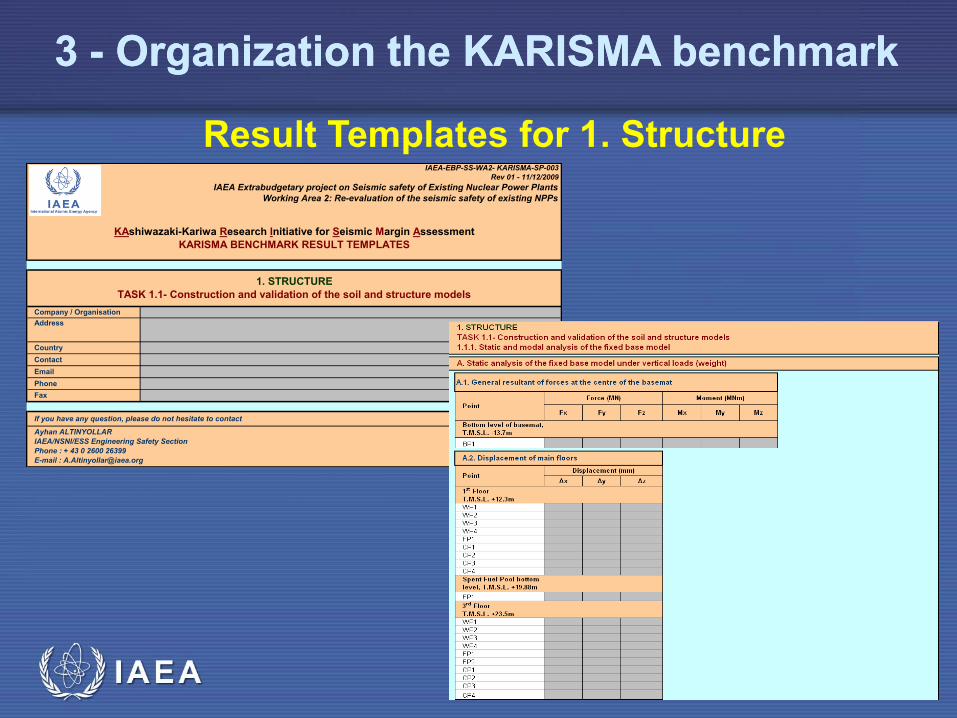
Result Templates for 1. Structure
3 3 -- Organization the KARISMA benchmarkOrganization the KARISMA benchmark
Rev 01 - 11/12/2009
1. STRUCTURE
TASK 1.1- Construction and validation of the soil and structure models
Ayhan ALTINYOLLAR
IAEA/NSNI/ESS Engineering Safety Section
Phone : + 43 0 2600 26399
E-mail : [email protected]
Contact
Phone
Fax
If you have any question, please do not hesitate to contact
KAshiwazaki-Kariwa Research Initiative for Seismic Margin Assessment
KARISMA BENCHMARK RESULT TEMPLATES
IAEA-EBP-SS-WA2- KARISMA-SP-003
Address
Country
IAEA Extrabudgetary project on Seismic safety of Existing Nuclear Power Plants
Working Area 2: Re-evaluation of the seismic safety of existing NPPs
Company / Organisation
10
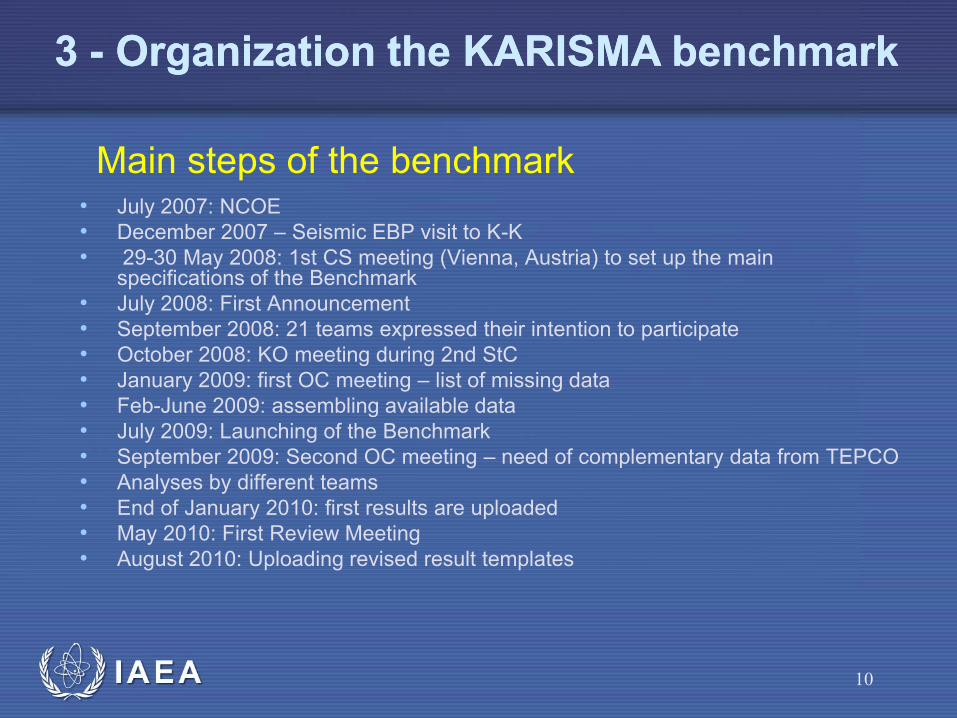
• July 2007: NCOE
• December 2007 – Seismic EBP visit to K-K
• 29-30 May 2008: 1st CS meeting (Vienna, Austria) to set up the main specifications of the Benchmark
• July 2008: First Announcement
• September 2008: 21 teams expressed their intention to participate
• October 2008: KO meeting during 2nd StC
• January 2009: first OC meeting – list of missing data
• Feb-June 2009: assembling available data
• July 2009: Launching of the Benchmark
• September 2009: Second OC meeting – need of complementary data from TEPCO
• Analyses by different teams
• End of January 2010: first results are uploaded
• May 2010: First Review Meeting
• August 2010: Uploading revised result templates
Main steps of the benchmark
3 3 -- Organization the KARISMA benchmarkOrganization the KARISMA benchmark
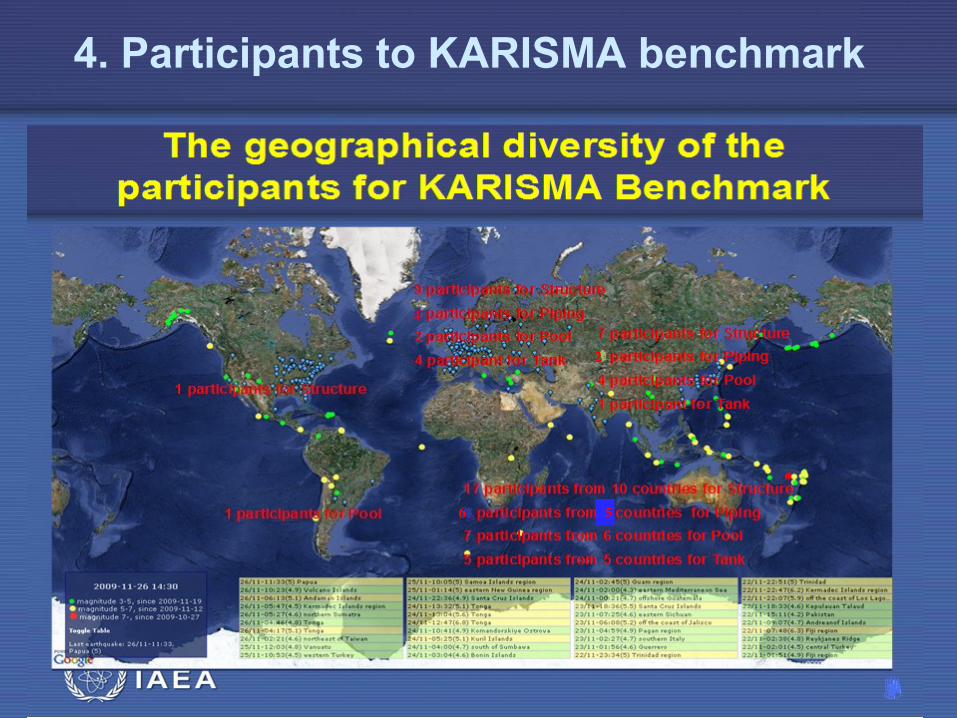
4. Participants to KARISMA benchmark
4
2
6 5
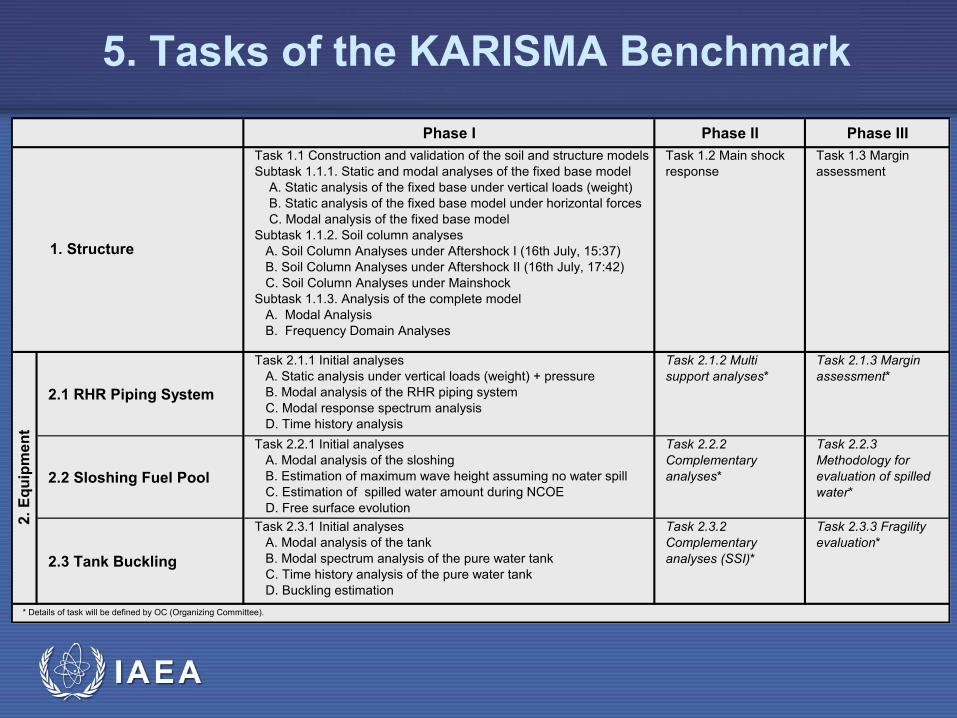
5. Tasks of the KARISMA Benchmark
Phase I Phase II Phase III
Task 1.1 Construction and validation of the soil and structure models
Subtask 1.1.1. Static and modal analyses of the fixed base model
A. Static analysis of the fixed base under vertical loads (weight)
B. Static analysis of the fixed base model under horizontal forces
C. Modal analysis of the fixed base model
Subtask 1.1.2. Soil column analyses
A. Soil Column Analyses under Aftershock I (16th July, 15:37)
B. Soil Column Analyses under Aftershock II (16th July, 17:42)
C. Soil Column Analyses under Mainshock
Subtask 1.1.3. Analysis of the complete model
A. Modal Analysis
B. Frequency Domain Analyses
Task 1.2 Main shock
response
Task 1.3 Margin
assessment
2.1 RHR Piping System
Task 2.1.1 Initial analyses
A. Static analysis under vertical loads (weight) + pressure
B. Modal analysis of the RHR piping system
C. Modal response spectrum analysis
D. Time history analysis
Task 2.1.2 Multi
support analyses*
Task 2.1.3 Margin
assessment*
2.2 Sloshing Fuel Pool
Task 2.2.1 Initial analyses
A. Modal analysis of the sloshing
B. Estimation of maximum wave height assuming no water spill
C. Estimation of spilled water amount during NCOE
D. Free surface evolution
Task 2.2.2
Complementary
analyses*
Task 2.2.3
Methodology for
evaluation of spilled
water*
2.3 Tank Buckling
Task 2.3.1 Initial analyses
A. Modal analysis of the tank
B. Modal spectrum analysis of the pure water tank
C. Time history analysis of the pure water tank
D. Buckling estimation
Task 2.3.2
Complementary
analyses (SSI)*
Task 2.3.3 Fragility
evaluation*
2.
Eq
uip
men
t
* Details of task will be defined by OC (Organizing Committee).
1. Structure
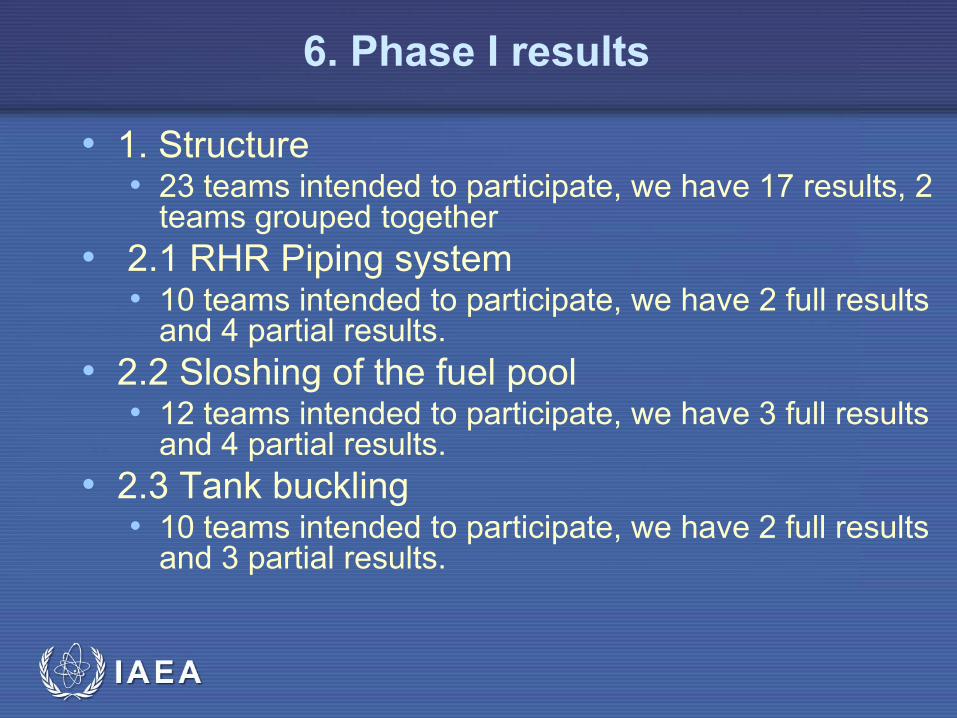
6. Phase I results
• 1. Structure • 23 teams intended to participate, we have 17 results, 2
teams grouped together
• 2.1 RHR Piping system • 10 teams intended to participate, we have 2 full results
and 4 partial results.
• 2.2 Sloshing of the fuel pool • 12 teams intended to participate, we have 3 full results
and 4 partial results.
• 2.3 Tank buckling • 10 teams intended to participate, we have 2 full results
and 3 partial results.
14
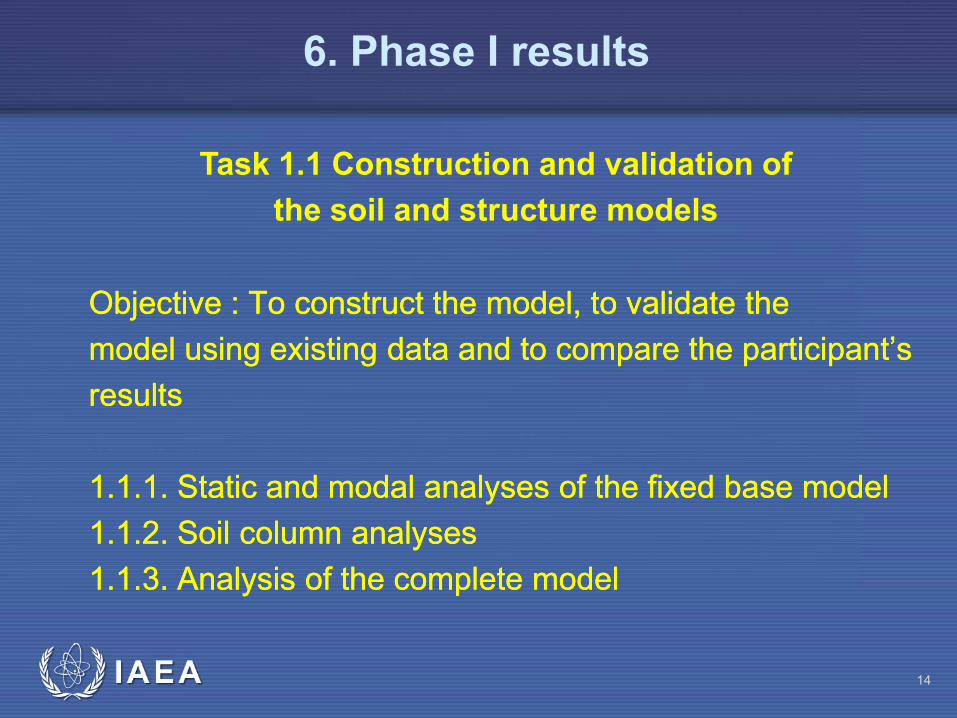
ObjectiveObjective :: ToTo constructconstruct thethe model,model, toto validatevalidate thethe
modelmodel usingusing existingexisting datadata andand toto comparecompare thethe participant’sparticipant’s
resultsresults
11..11..11.. StaticStatic andand modalmodal analysesanalyses ofof thethe fixedfixed basebase modelmodel
11..11..22.. SoilSoil columncolumn analysesanalyses
11..11..33.. AnalysisAnalysis ofof thethe completecomplete modelmodel
Task 1.1 Construction and validation of
the soil and structure models
6. Phase I results
15
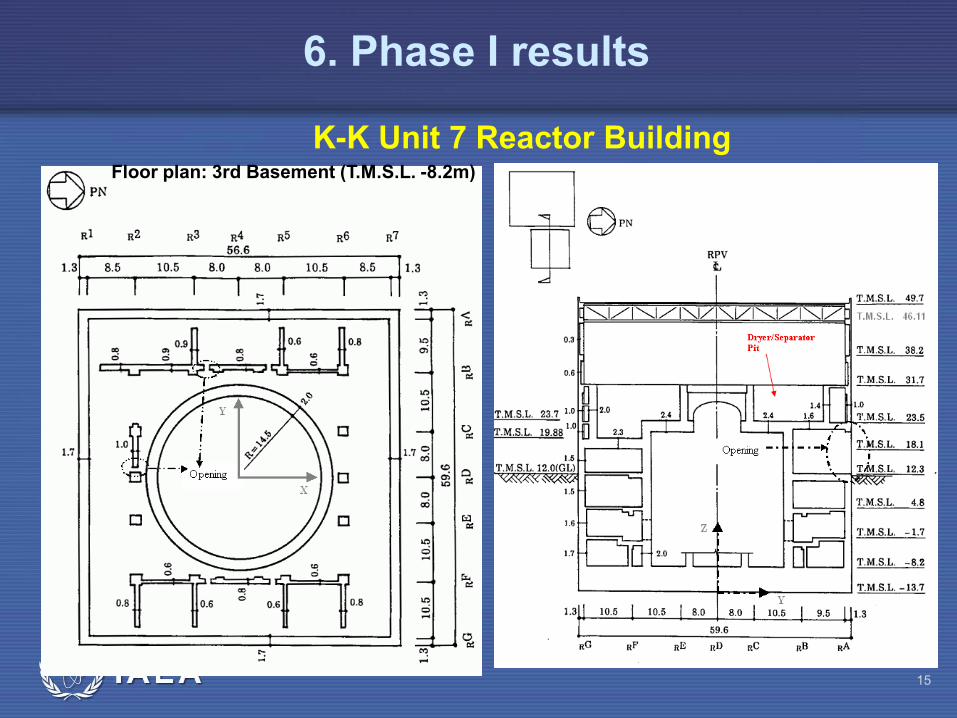
K-K Unit 7 Reactor Building Floor plan: 3rd Basement (T.M.S.L. -8.2m)
6. Phase I results
16
No Participant Organization Type of
model
Model characteristics
(Number of nodes, elements)
Concrete young
modulus (MPa)
Calcuation code
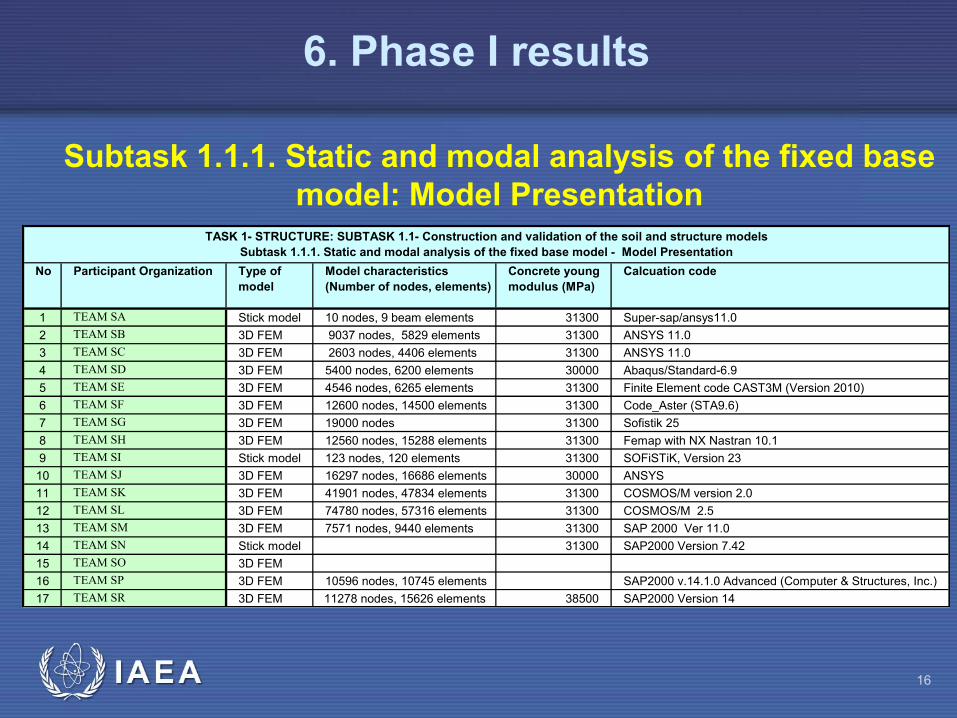
1 TEAM SA Stick model 10 nodes, 9 beam elements 31300 Super-sap/ansys11.0
2 TEAM SB 3D FEM 9037 nodes, 5829 elements 31300 ANSYS 11.0
3 TEAM SC 3D FEM 2603 nodes, 4406 elements 31300 ANSYS 11.0
4 TEAM SD 3D FEM 5400 nodes, 6200 elements 30000 Abaqus/Standard-6.9
5 TEAM SE 3D FEM 4546 nodes, 6265 elements 31300 Finite Element code CAST3M (Version 2010)
6 TEAM SF 3D FEM 12600 nodes, 14500 elements 31300 Code_Aster (STA9.6)
7 TEAM SG 3D FEM 19000 nodes 31300 Sofistik 25
8 TEAM SH 3D FEM 12560 nodes, 15288 elements 31300 Femap with NX Nastran 10.1
9 TEAM SI Stick model 123 nodes, 120 elements 31300 SOFiSTiK, Version 23
10 TEAM SJ 3D FEM 16297 nodes, 16686 elements 30000 ANSYS
11 TEAM SK 3D FEM 41901 nodes, 47834 elements 31300 COSMOS/M version 2.0
12 TEAM SL 3D FEM 74780 nodes, 57316 elements 31300 COSMOS/M 2.5
13 TEAM SM 3D FEM 7571 nodes, 9440 elements 31300 SAP 2000 Ver 11.0
14 TEAM SN Stick model 31300 SAP2000 Version 7.42
15 TEAM SO 3D FEM
16 TEAM SP 3D FEM 10596 nodes, 10745 elements SAP2000 v.14.1.0 Advanced (Computer & Structures, Inc.)
17 TEAM SR 3D FEM 11278 nodes, 15626 elements 38500 SAP2000 Version 14
TASK 1- STRUCTURE: SUBTASK 1.1- Construction and validation of the soil and structure models
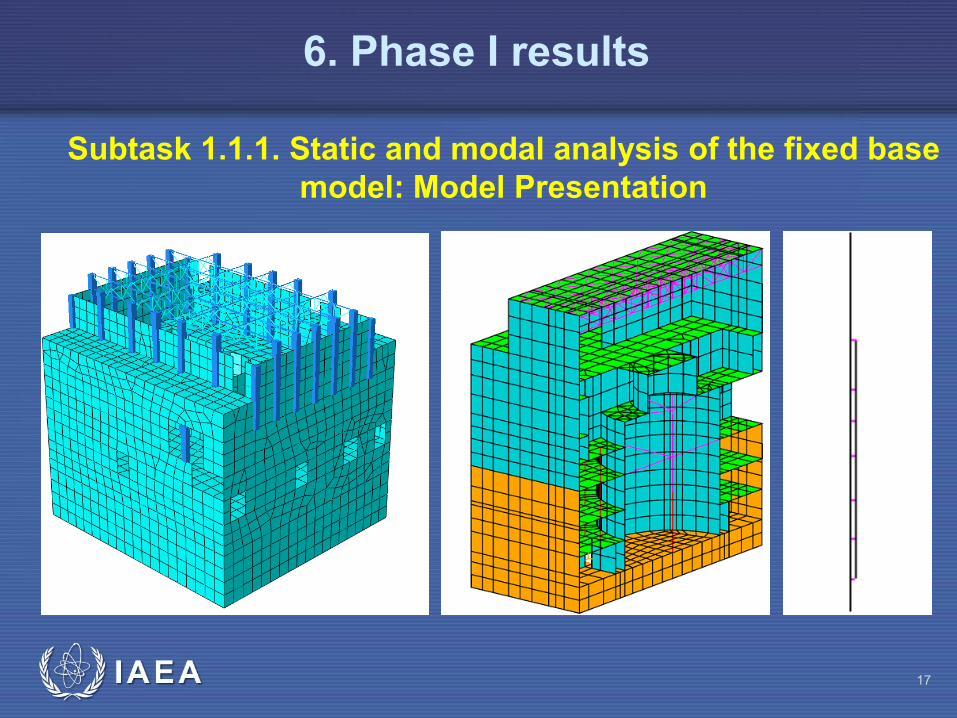
Subtask 1.1.1. Static and modal analysis of the fixed base model - Model Presentation
Subtask 1.1.1. Static and modal analysis of the fixed base
model: Model Presentation
6. Phase I results
17
Subtask 1.1.1. Static and modal analysis of the fixed base
model: Model Presentation
6. Phase I results

18
Subtask 1.1.1. Static and modal analysis of the fixed
base model: Resultant Forces
under Vertical
loads (weight)
Force (MN)Force
(MN)
Moment
(MNm)
Fz Fx My
1 TEAM SA 1903 19032 TEAM SB 2018 2128 16023 83 TEAM SC 2011 2011 37956 194 TEAM SD 1421 14215 TEAM SE 1971 1971 44749 236 TEAM SF 1956 1956 37843 197 TEAM SG 2051 2044 36412 188 TEAM SH 1874 1872 41853 229 TEAM SI 1992 199210 TEAM SJ 2017 2028 47803 2411 TEAM SK 1638 175712 TEAM SL 1941 1942 42860 2213 TEAM SM 2019 2019 45650 2314 TEAM SN 1992 1992 39393 2015 TEAM SO 2208 2208 43838 2016 TEAM SP 1865 1876 41069 2217 TEAM SR 2103 2103 17061 8
1940 1954 37885 19
179 173 10033 5
0.09 0.09 0.26 0.28
Mean
Standard deviationCoefficient of variation
No Participant Organization
My/Fx
Uniform distribution of 1 g acceleration, applied in X
1. STRUCTURE
TASK 1.1- Construction and validation of the soil and structure models
Subtask 1.1.1. Static and modal analysis of the fixed base model
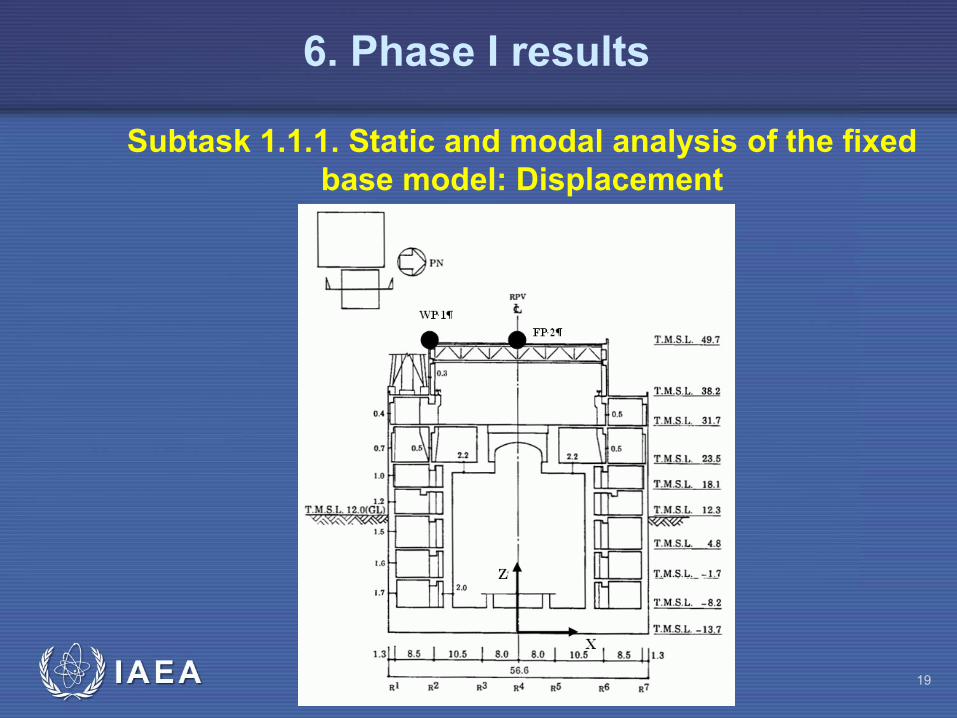
General resultant of forces at the centre of the basemat (T.M.S.L. -13.7 m),
BP1
6. Phase I results
19
Subtask 1.1.1. Static and modal analysis of the fixed
base model: Displacement
6. Phase I results
20
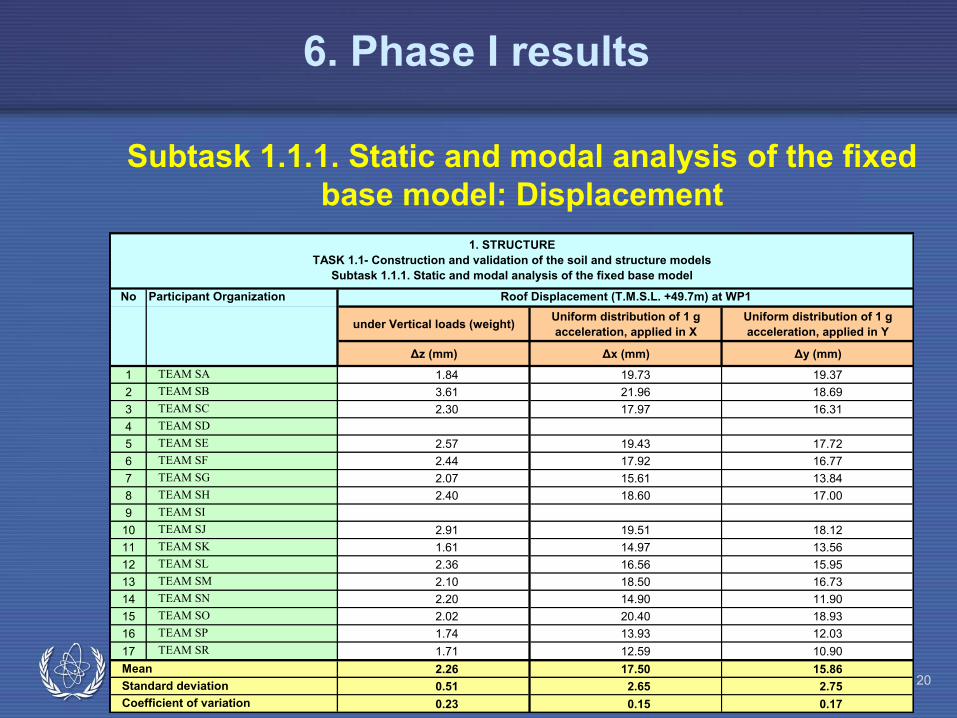
Subtask 1.1.1. Static and modal analysis of the fixed
base model: Displacement
under Vertical loads (weight)Uniform distribution of 1 g
acceleration, applied in X
Uniform distribution of 1 g
acceleration, applied in Y
Δz (mm) Δx (mm) Δy (mm)
1 TEAM SA 1.84 19.73 19.37
2 TEAM SB 3.61 21.96 18.69
3 TEAM SC 2.30 17.97 16.31
4 TEAM SD
5 TEAM SE 2.57 19.43 17.72
6 TEAM SF 2.44 17.92 16.77
7 TEAM SG 2.07 15.61 13.84
8 TEAM SH 2.40 18.60 17.00
9 TEAM SI
10 TEAM SJ 2.91 19.51 18.12
11 TEAM SK 1.61 14.97 13.56
12 TEAM SL 2.36 16.56 15.95
13 TEAM SM 2.10 18.50 16.73
14 TEAM SN 2.20 14.90 11.90
15 TEAM SO 2.02 20.40 18.93
16 TEAM SP 1.74 13.93 12.03
17 TEAM SR 1.71 12.59 10.90
2.26 17.50 15.86
0.51 2.65 2.75
0.23 0.15 0.17
Mean
Standard deviation
Coefficient of variation
1. STRUCTURE
TASK 1.1- Construction and validation of the soil and structure models
Subtask 1.1.1. Static and modal analysis of the fixed base model
No Participant Organization Roof Displacement (T.M.S.L. +49.7m) at WP1
6. Phase I results
21
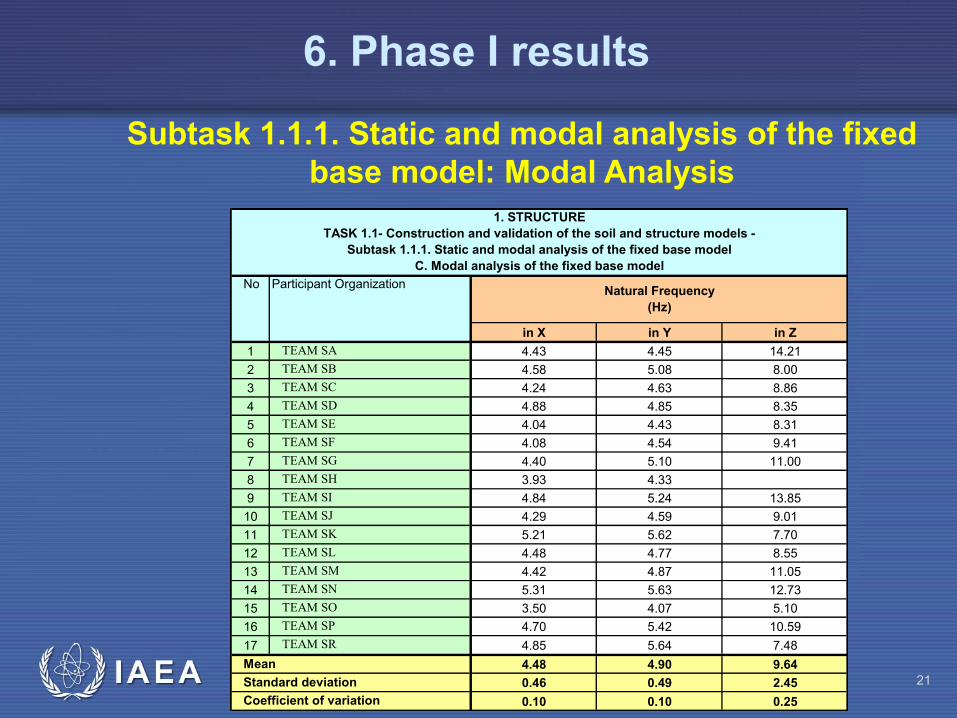
Subtask 1.1.1. Static and modal analysis of the fixed
base model: Modal Analysis
in X in Y in Z
1 TEAM SA 4.43 4.45 14.21
2 TEAM SB 4.58 5.08 8.00
3 TEAM SC 4.24 4.63 8.86
4 TEAM SD 4.88 4.85 8.35
5 TEAM SE 4.04 4.43 8.31
6 TEAM SF 4.08 4.54 9.41
7 TEAM SG 4.40 5.10 11.00
8 TEAM SH 3.93 4.33
9 TEAM SI 4.84 5.24 13.85
10 TEAM SJ 4.29 4.59 9.01
11 TEAM SK 5.21 5.62 7.70
12 TEAM SL 4.48 4.77 8.55
13 TEAM SM 4.42 4.87 11.05
14 TEAM SN 5.31 5.63 12.73
15 TEAM SO 3.50 4.07 5.10
16 TEAM SP 4.70 5.42 10.59
17 TEAM SR 4.85 5.64 7.48
4.48 4.90 9.64
0.46 0.49 2.45
0.10 0.10 0.25
Mean
Standard deviation
Coefficient of variation
1. STRUCTURE
TASK 1.1- Construction and validation of the soil and structure models -
Subtask 1.1.1. Static and modal analysis of the fixed base model
C. Modal analysis of the fixed base model
No Participant OrganizationNatural Frequency
(Hz)
6. Phase I results

22
Example: IAEA CRP Results
6. Phase I results
The CAMUS speciman is 5 stories shear wall structure.

23
Subtask 1.1.2. Soil column analyses:
Model Presentation
Cross-sectional view showing the location map of seismometers in Unit 7 and recorded maximum acceleration in N-S, E-W and U-D
directions respectively (in gal)
367, 435, 464
267, 356, 355
418, 506, 342673, 1007, 362
964,1223, 539
685, 737, 308
415, 388, 166
318, 322, 336
+9.3m
-24m
-100m
-180m
-300m
396, 586, 226
419, 407, 146
407, 450, 187
5G1
G51
G52
G53
G54
G55
6. Phase I results
24
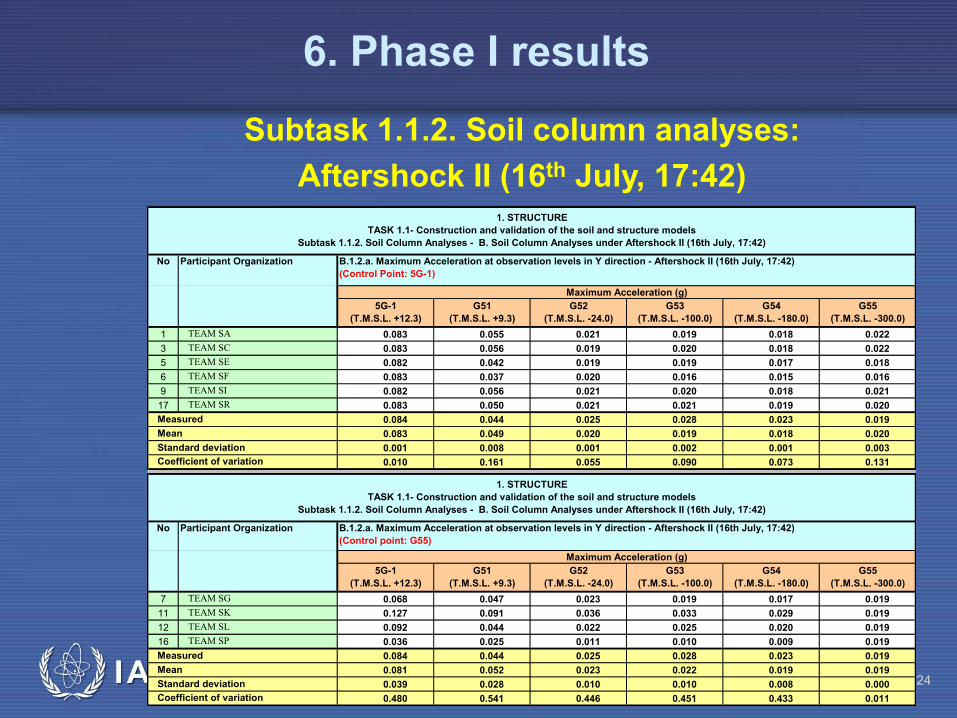
Subtask 1.1.2. Soil column analyses:
Aftershock II (16th July, 17:42)
1 TEAM SA 0.083 0.055 0.021 0.019 0.018 0.022
3 TEAM SC 0.083 0.056 0.019 0.020 0.018 0.022
5 TEAM SE 0.082 0.042 0.019 0.019 0.017 0.018
6 TEAM SF 0.083 0.037 0.020 0.016 0.015 0.016
9 TEAM SI 0.082 0.056 0.021 0.020 0.018 0.021
17 TEAM SR 0.083 0.050 0.021 0.021 0.019 0.020
0.084 0.044 0.025 0.028 0.023 0.019
0.083 0.049 0.020 0.019 0.018 0.020
0.001 0.008 0.001 0.002 0.001 0.003
0.010 0.161 0.055 0.090 0.073 0.131
7 TEAM SG 0.068 0.047 0.023 0.019 0.017 0.019
11 TEAM SK 0.127 0.091 0.036 0.033 0.029 0.019
12 TEAM SL 0.092 0.044 0.022 0.025 0.020 0.019
16 TEAM SP 0.036 0.025 0.011 0.010 0.009 0.019
0.084 0.044 0.025 0.028 0.023 0.019
0.081 0.052 0.023 0.022 0.019 0.019
0.039 0.028 0.010 0.010 0.008 0.000
0.480 0.541 0.446 0.451 0.433 0.011Coefficient of variation
G55
(T.M.S.L. -300.0)
Measured
Mean
Standard deviation
1. STRUCTURE
TASK 1.1- Construction and validation of the soil and structure models
Subtask 1.1.2. Soil Column Analyses - B. Soil Column Analyses under Aftershock II (16th July, 17:42)
No Participant Organization B.1.2.a. Maximum Acceleration at observation levels in Y direction - Aftershock II (16th July, 17:42)
(Control point: G55)
Maximum Acceleration (g)
5G-1
(T.M.S.L. +12.3)
G51
(T.M.S.L. +9.3)
G52
(T.M.S.L. -24.0)
G53
(T.M.S.L. -100.0)
G54
(T.M.S.L. -180.0)
1. STRUCTURE
TASK 1.1- Construction and validation of the soil and structure models
Subtask 1.1.2. Soil Column Analyses - B. Soil Column Analyses under Aftershock II (16th July, 17:42)
No Participant Organization B.1.2.a. Maximum Acceleration at observation levels in Y direction - Aftershock II (16th July, 17:42)
(Control Point: 5G-1)
Maximum Acceleration (g)
5G-1
(T.M.S.L. +12.3)
G51
(T.M.S.L. +9.3)
G52
(T.M.S.L. -24.0)
G53
(T.M.S.L. -100.0)
G54
(T.M.S.L. -180.0)
Coefficient of variation
G55
(T.M.S.L. -300.0)
Measured
Mean
Standard deviation
6. Phase I results
25
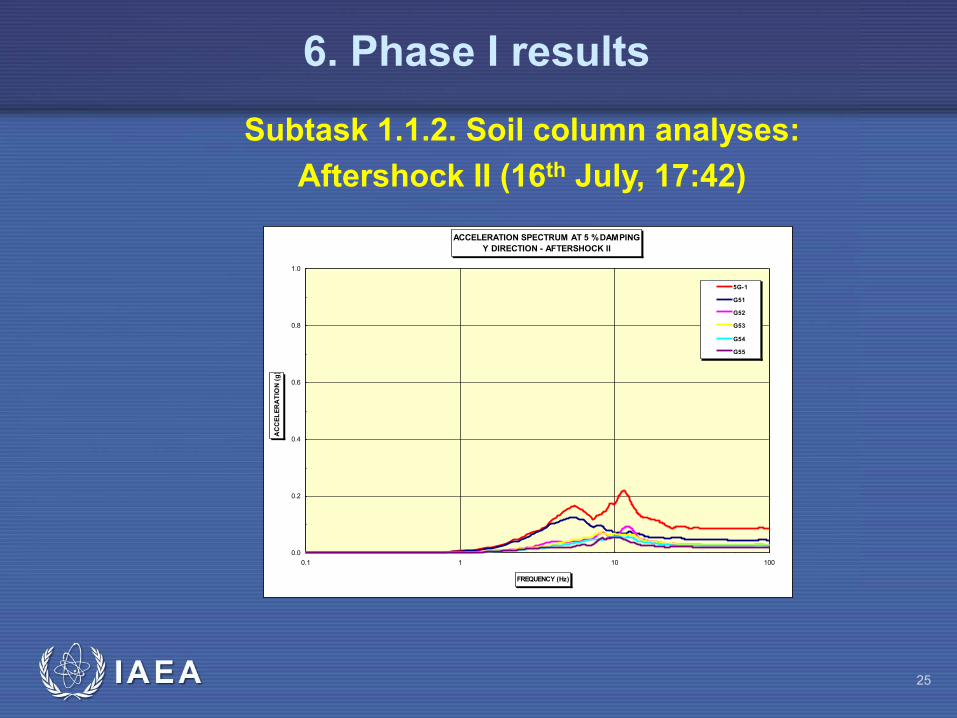
Subtask 1.1.2. Soil column analyses:
Aftershock II (16th July, 17:42)
ACCELERATION SPECTRUM AT 5 % DAMPING
Y DIRECTION - AFTERSHOCK II
0.0
0.2
0.4
0.6
0.8
1.0
0.1 1 10 100
FREQUENCY (Hz)
AC
CE
LE
RA
TIO
N (
g)
5G-1
G51
G52
G53
G54
G55
6. Phase I results
26
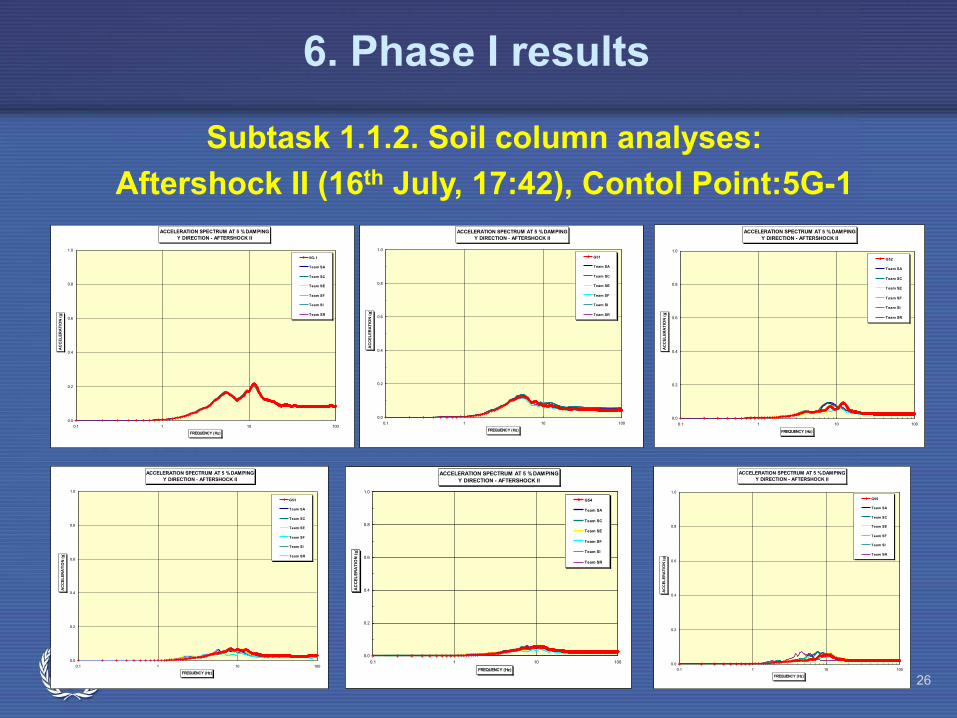
Subtask 1.1.2. Soil column analyses:
Aftershock II (16th July, 17:42), Contol Point:5G-1
ACCELERATION SPECTRUM AT 5 % DAMPING
Y DIRECTION - AFTERSHOCK II
0.0
0.2
0.4
0.6
0.8
1.0
0.1 1 10 100
FREQUENCY (Hz)
AC
CE
LE
RA
TIO
N (
g)
5G-1
Team SA
Team SC
Team SE
Team SF
Team SI
Team SR
ACCELERATION SPECTRUM AT 5 % DAMPING
Y DIRECTION - AFTERSHOCK II
0.0
0.2
0.4
0.6
0.8
1.0
0.1 1 10 100
FREQUENCY (Hz)
AC
CE
LE
RA
TIO
N (
g)
G51
Team SA
Team SC
Team SE
Team SF
Team SI
Team SR
ACCELERATION SPECTRUM AT 5 % DAMPING
Y DIRECTION - AFTERSHOCK II
0.0
0.2
0.4
0.6
0.8
1.0
0.1 1 10 100
FREQUENCY (Hz)
AC
CE
LE
RA
TIO
N (
g)
G52
Team SA
Team SC
Team SE
Team SF
Team SI
Team SR
ACCELERATION SPECTRUM AT 5 % DAMPING
Y DIRECTION - AFTERSHOCK II
0.0
0.2
0.4
0.6
0.8
1.0
0.1 1 10 100
FREQUENCY (Hz)
AC
CE
LE
RA
TIO
N (
g)
G53
Team SA
Team SC
Team SE
Team SF
Team SI
Team SR
ACCELERATION SPECTRUM AT 5 % DAMPING
Y DIRECTION - AFTERSHOCK II
0.0
0.2
0.4
0.6
0.8
1.0
0.1 1 10 100
FREQUENCY (Hz)
AC
CE
LE
RA
TIO
N (
g)
G54
Team SA
Team SC
Team SE
Team SF
Team SI
Team SR
ACCELERATION SPECTRUM AT 5 % DAMPING
Y DIRECTION - AFTERSHOCK II
0.0
0.2
0.4
0.6
0.8
1.0
0.1 1 10 100
FREQUENCY (Hz)
AC
CE
LE
RA
TIO
N (
g)
G55
Team SA
Team SC
Team SE
Team SF
Team SI
Team SR
6. Phase I results
27
ACCELERATION SPECTRUM AT 5 % DAMPING
Y DIRECTION - AFTERSHOCK II
0.0
0.2
0.4
0.6
0.8
1.0
0.1 1 10 100
FREQUENCY (Hz)
AC
CE
LE
RA
TIO
N (
g)
G54
Team SG
Team SK
Team SL
Team SP
ACCELERATION SPECTRUM AT 5 % DAMPING
Y DIRECTION - AFTERSHOCK II
0.0
0.2
0.4
0.6
0.8
1.0
0.1 1 10 100
FREQUENCY (Hz)
AC
CE
LE
RA
TIO
N (
g)
G55
Team SG
Team SK
Team SL
Team SP
ACCELERATION SPECTRUM AT 5 % DAMPING
Y DIRECTION - AFTERSHOCK II
0.0
0.2
0.4
0.6
0.8
1.0
0.1 1 10 100
FREQUENCY (Hz)
AC
CE
LE
RA
TIO
N (
g)
G53
Team SG
Team SK
Team SL
Team SP
ACCELERATION SPECTRUM AT 5 % DAMPING
Y DIRECTION - AFTERSHOCK II
0.0
0.2
0.4
0.6
0.8
1.0
0.1 1 10 100
FREQUENCY (Hz)
AC
CE
LE
RA
TIO
N (
g)
G52
Team SG
Team SK
Team SL
Team SP
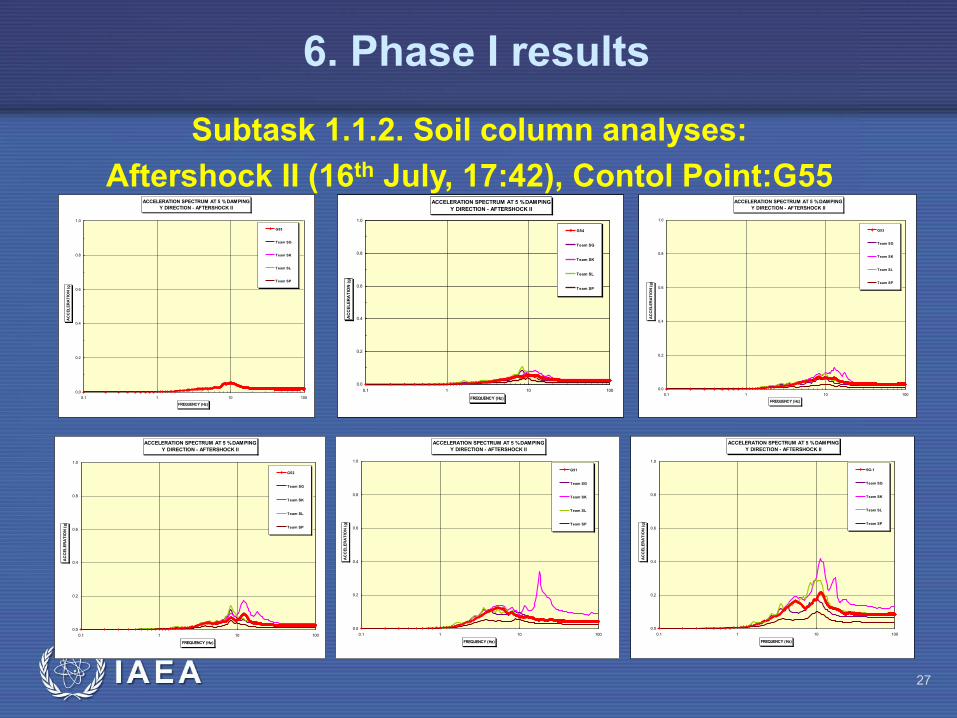
Subtask 1.1.2. Soil column analyses:
Aftershock II (16th July, 17:42), Contol Point:G55
ACCELERATION SPECTRUM AT 5 % DAMPING
Y DIRECTION - AFTERSHOCK II
0.0
0.2
0.4
0.6
0.8
1.0
0.1 1 10 100
FREQUENCY (Hz)
AC
CE
LE
RA
TIO
N (
g)
G51
Team SG
Team SK
Team SL
Team SP
ACCELERATION SPECTRUM AT 5 % DAMPING
Y DIRECTION - AFTERSHOCK II
0.0
0.2
0.4
0.6
0.8
1.0
0.1 1 10 100
FREQUENCY (Hz)A
CC
EL
ER
AT
ION
(g
)
5G-1
Team SG
Team SK
Team SL
Team SP
6. Phase I results
28
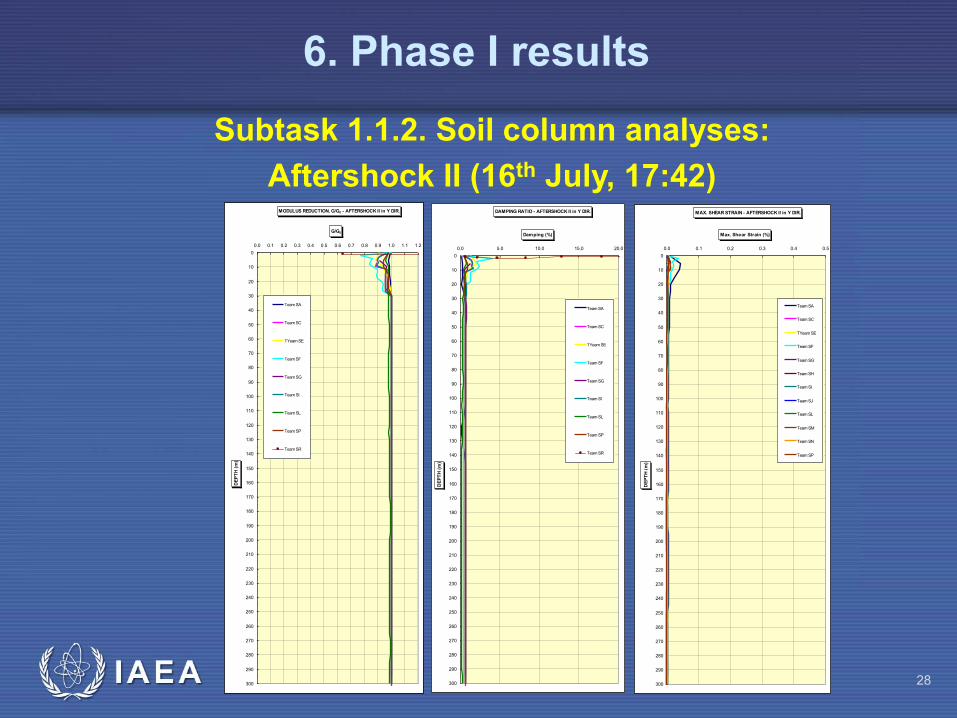
Subtask 1.1.2. Soil column analyses:
Aftershock II (16th July, 17:42) MODULUS REDUCTION, G/G0 - AFTERSHOCK II in Y DIR.
0
10
20
30
40
50
60
70
80
90
100
110
120
130
140
150
160
170
180
190
200
210
220
230
240
250
260
270
280
290
300
0.0 0.1 0.2 0.3 0.4 0.5 0.6 0.7 0.8 0.9 1.0 1.1 1.2
G/G0
DE
PT
H (
m)
Team SA
Team SC
TYeam SE
Team SF
Team SG
Team SI
Team SL
Team SP
Team SR
DAMPING RATIO - AFTERSHOCK II in Y DIR.
0
10
20
30
40
50
60
70
80
90
100
110
120
130
140
150
160
170
180
190
200
210
220
230
240
250
260
270
280
290
300
0.0 5.0 10.0 15.0 20.0
Damping (%)
DE
PT
H (
m)
Team SA
Team SC
TYeam SE
Team SF
Team SG
Team SI
Team SL
Team SP
Team SR
MAX. SHEAR STRAIN - AFTERSHOCK II in Y DIR.
0
10
20
30
40
50
60
70
80
90
100
110
120
130
140
150
160
170
180
190
200
210
220
230
240
250
260
270
280
290
300
0.0 0.1 0.2 0.3 0.4 0.5
Max. Shear Strain (%)
DE
PT
H (
m)
Team SA
Team SC
TYeam SE
Team SF
Team SG
Team SH
Team SI
Team SJ
Team SL
Team SM
Team SN
Team SP
6. Phase I results
29
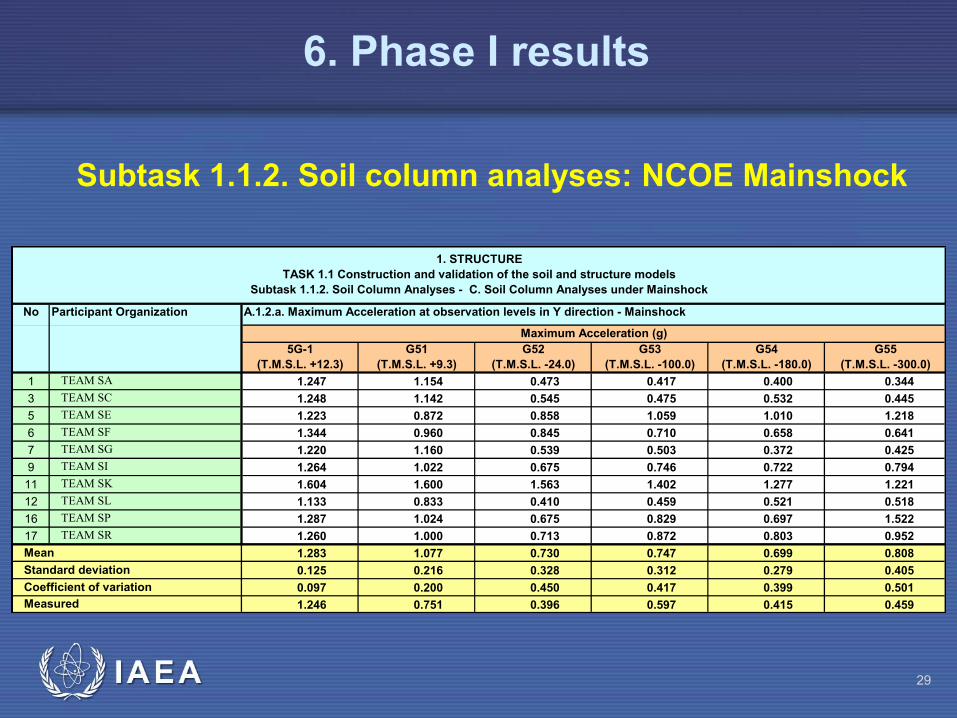
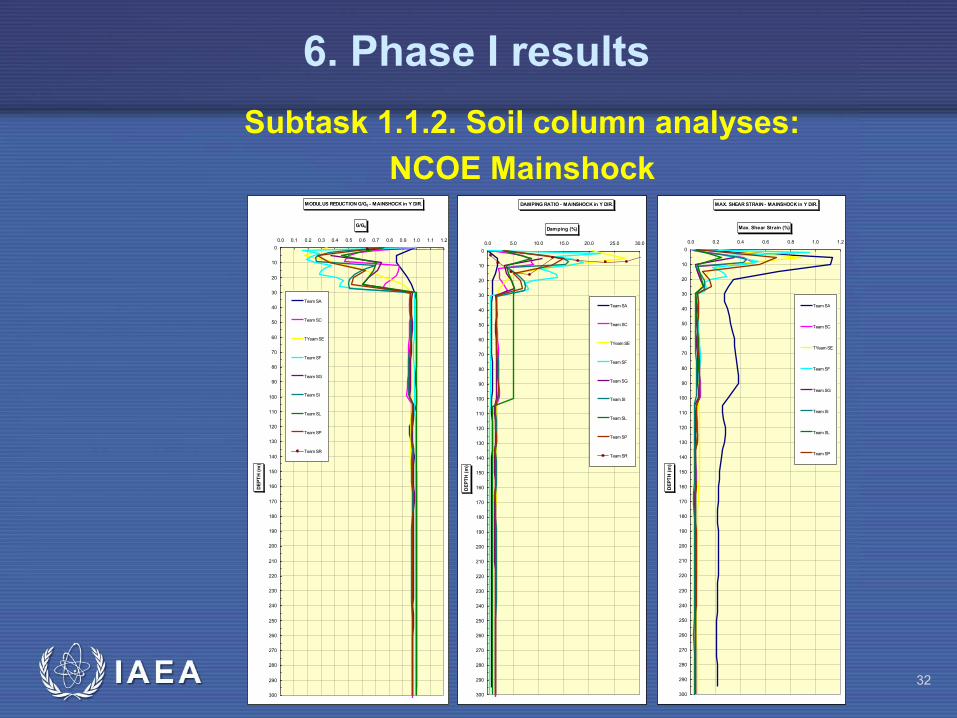
Subtask 1.1.2. Soil column analyses: NCOE Mainshock
1 TEAM SA 1.247 1.154 0.473 0.417 0.400 0.344
3 TEAM SC 1.248 1.142 0.545 0.475 0.532 0.445
5 TEAM SE 1.223 0.872 0.858 1.059 1.010 1.218
6 TEAM SF 1.344 0.960 0.845 0.710 0.658 0.641
7 TEAM SG 1.220 1.160 0.539 0.503 0.372 0.425
9 TEAM SI 1.264 1.022 0.675 0.746 0.722 0.794
11 TEAM SK 1.604 1.600 1.563 1.402 1.277 1.221
12 TEAM SL 1.133 0.833 0.410 0.459 0.521 0.518
16 TEAM SP 1.287 1.024 0.675 0.829 0.697 1.522
17 TEAM SR 1.260 1.000 0.713 0.872 0.803 0.952
1.283 1.077 0.730 0.747 0.699 0.808
0.125 0.216 0.328 0.312 0.279 0.405
0.097 0.200 0.450 0.417 0.399 0.501
1.246 0.751 0.396 0.597 0.415 0.459
G55
(T.M.S.L. -300.0)
1. STRUCTURE
TASK 1.1 Construction and validation of the soil and structure models
Subtask 1.1.2. Soil Column Analyses - C. Soil Column Analyses under Mainshock
No Participant Organization A.1.2.a. Maximum Acceleration at observation levels in Y direction - Mainshock
Maximum Acceleration (g)
5G-1
(T.M.S.L. +12.3)
G51
(T.M.S.L. +9.3)
G52
(T.M.S.L. -24.0)
G53
(T.M.S.L. -100.0)
G54
(T.M.S.L. -180.0)
Measured
Mean
Standard deviation
Coefficient of variation
6. Phase I results
30
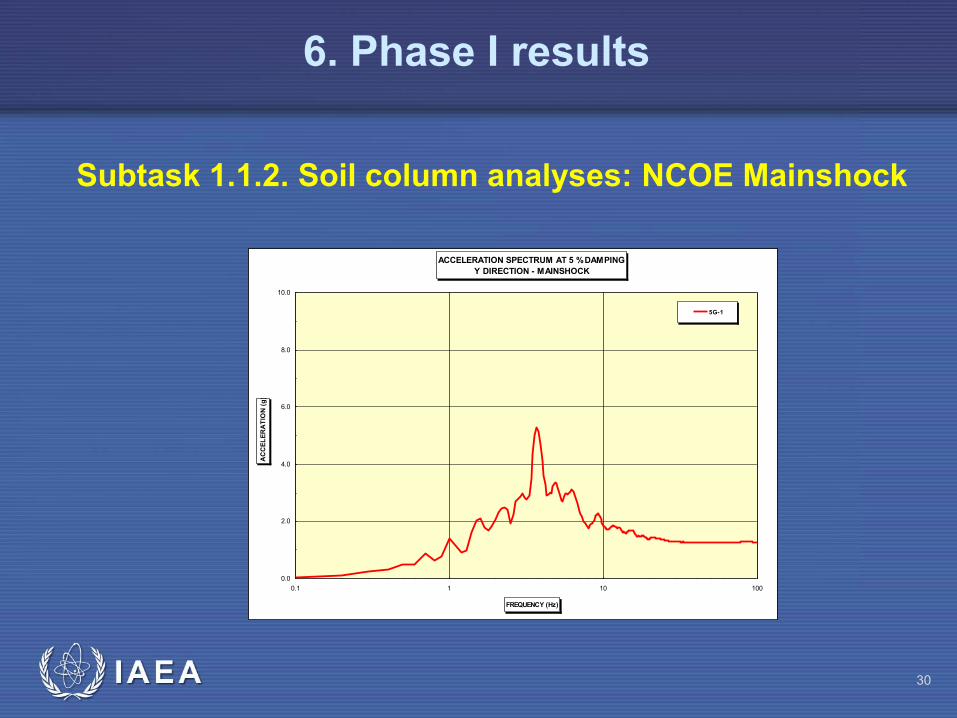
Subtask 1.1.2. Soil column analyses: NCOE Mainshock
ACCELERATION SPECTRUM AT 5 % DAMPING
Y DIRECTION - MAINSHOCK
0.0
2.0
4.0
6.0
8.0
10.0
0.1 1 10 100
FREQUENCY (Hz)
AC
CE
LE
RA
TIO
N (
g)
5G-1
6. Phase I results
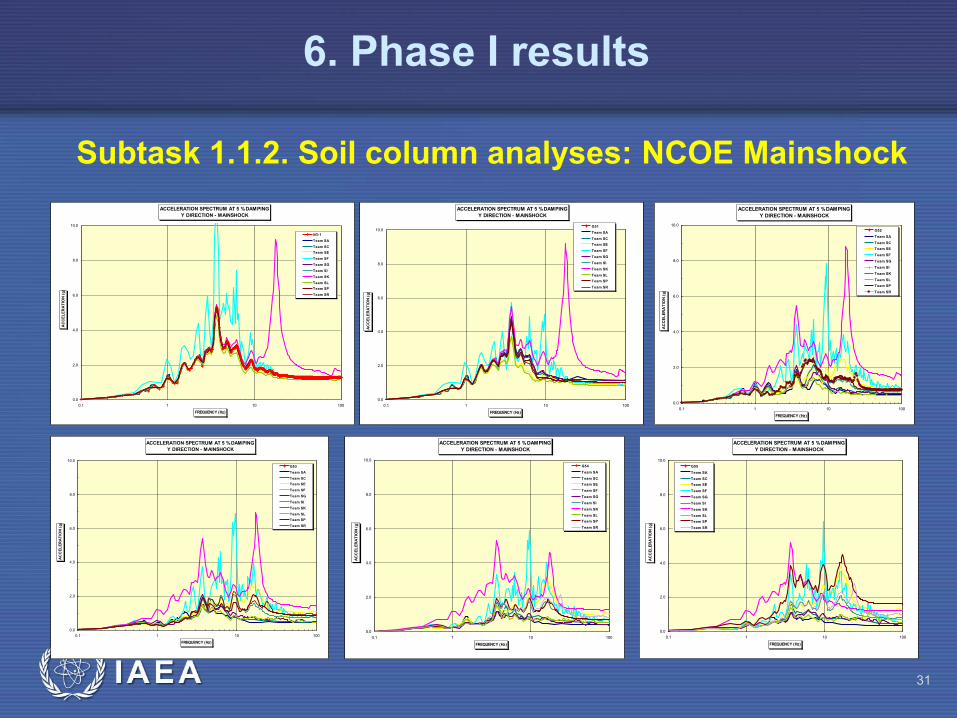
31
Subtask 1.1.2. Soil column analyses: NCOE Mainshock
ACCELERATION SPECTRUM AT 5 % DAMPING
Y DIRECTION - MAINSHOCK
0.0
2.0
4.0
6.0
8.0
10.0
0.1 1 10 100
FREQUENCY (Hz)
AC
CE
LE
RA
TIO
N (
g)
5G-1
Team SA
Team SC
Team SE
Team SF
Team SG
Team SI
Team SK
Team SL
Team SP
Team SR
ACCELERATION SPECTRUM AT 5 % DAMPING
Y DIRECTION - MAINSHOCK
0.0
2.0
4.0
6.0
8.0
10.0
0.1 1 10 100
FREQUENCY (Hz)
AC
CE
LE
RA
TIO
N (
g)
G51
Team SA
Team SC
Team SE
Team SF
Team SG
Team SI
Team SK
Team SL
Team SP
Team SR
ACCELERATION SPECTRUM AT 5 % DAMPING
Y DIRECTION - MAINSHOCK
0.0
2.0
4.0
6.0
8.0
10.0
0.1 1 10 100
FREQUENCY (Hz)
AC
CE
LE
RA
TIO
N (
g)
G52
Team SA
Team SC
Team SE
Team SF
Team SG
Team SI
Team SK
Team SL
Team SP
Team SR
ACCELERATION SPECTRUM AT 5 % DAMPING
Y DIRECTION - MAINSHOCK
0.0
2.0
4.0
6.0
8.0
10.0
0.1 1 10 100
FREQUENCY (Hz)
AC
CE
LE
RA
TIO
N (
g)
G53
Team SA
Team SC
Team SE
Team SF
Team SG
Team SI
Team SK
Team SL
Team SP
Team SR
ACCELERATION SPECTRUM AT 5 % DAMPING
Y DIRECTION - MAINSHOCK
0.0
2.0
4.0
6.0
8.0
10.0
0.1 1 10 100
FREQUENCY (Hz)
AC
CE
LE
RA
TIO
N (
g)
G54
Team SA
Team SC
Team SE
Team SF
Team SG
Team SI
Team SK
Team SL
Team SP
Team SR
ACCELERATION SPECTRUM AT 5 % DAMPING
Y DIRECTION - MAINSHOCK
0.0
2.0
4.0
6.0
8.0
10.0
0.1 1 10 100
FREQUENCY (Hz)
AC
CE
LE
RA
TIO
N (
g)
G55
Team SA
Team SC
Team SE
Team SF
Team SG
Team SI
Team SK
Team SL
Team SP
Team SR
6. Phase I results
32
Subtask 1.1.2. Soil column analyses:
NCOE Mainshock MODULUS REDUCTION G/G0 - MAINSHOCK in Y DIR.
0
10
20
30
40
50
60
70
80
90
100
110
120
130
140
150
160
170
180
190
200
210
220
230
240
250
260
270
280
290
300
0.0 0.1 0.2 0.3 0.4 0.5 0.6 0.7 0.8 0.9 1.0 1.1 1.2
G/G0
DE
PT
H (
m)
Team SA
Team SC
TYeam SE
Team SF
Team SG
Team SI
Team SL
Team SP
Team SR
DAMPING RATIO - MAINSHOCK in Y DIR.
0
10
20
30
40
50
60
70
80
90
100
110
120
130
140
150
160
170
180
190
200
210
220
230
240
250
260
270
280
290
300
0.0 5.0 10.0 15.0 20.0 25.0 30.0
Damping (%)
DE
PT
H (
m)
Team SA
Team SC
TYeam SE
Team SF
Team SG
Team SI
Team SL
Team SP
Team SR
MAX. SHEAR STRAIN - MAINSHOCK in Y DIR.
0
10
20
30
40
50
60
70
80
90
100
110
120
130
140
150
160
170
180
190
200
210
220
230
240
250
260
270
280
290
300
0.0 0.2 0.4 0.6 0.8 1.0 1.2
Max. Shear Strain (%)
DE
PT
H (
m)
Team SA
Team SC
TYeam SE
Team SF
Team SG
Team SI
Team SL
Team SP
6. Phase I results
33
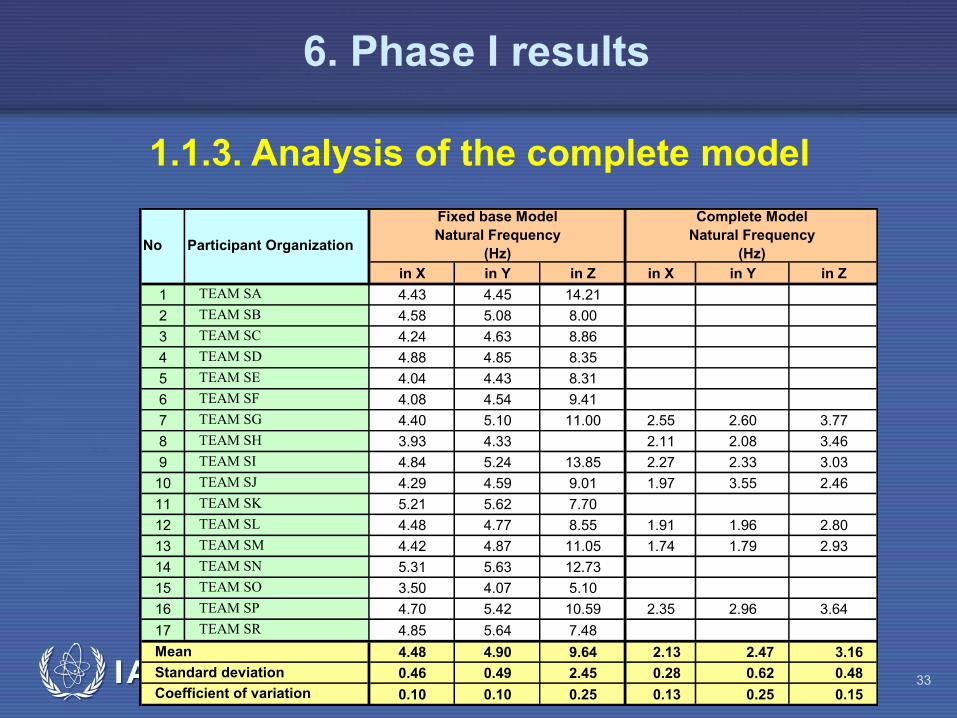
1.1.3. Analysis of the complete model
in X in Y in Z in X in Y in Z
1 TEAM SA 4.43 4.45 14.21
2 TEAM SB 4.58 5.08 8.00
3 TEAM SC 4.24 4.63 8.86
4 TEAM SD 4.88 4.85 8.35
5 TEAM SE 4.04 4.43 8.31
6 TEAM SF 4.08 4.54 9.41
7 TEAM SG 4.40 5.10 11.00 2.55 2.60 3.77
8 TEAM SH 3.93 4.33 2.11 2.08 3.46
9 TEAM SI 4.84 5.24 13.85 2.27 2.33 3.03
10 TEAM SJ 4.29 4.59 9.01 1.97 3.55 2.46
11 TEAM SK 5.21 5.62 7.70
12 TEAM SL 4.48 4.77 8.55 1.91 1.96 2.80
13 TEAM SM 4.42 4.87 11.05 1.74 1.79 2.93
14 TEAM SN 5.31 5.63 12.73
15 TEAM SO 3.50 4.07 5.10
16 TEAM SP 4.70 5.42 10.59 2.35 2.96 3.64
17 TEAM SR 4.85 5.64 7.48
4.48 4.90 9.64 2.13 2.47 3.16
0.46 0.49 2.45 0.28 0.62 0.48
0.10 0.10 0.25 0.13 0.25 0.15
Standard deviation
Coefficient of variation
Complete Model
Natural Frequency
(Hz) No Participant Organization
Fixed base Model
Natural Frequency
(Hz)
Mean
6. Phase I results
7. Some conclusions from Phase I
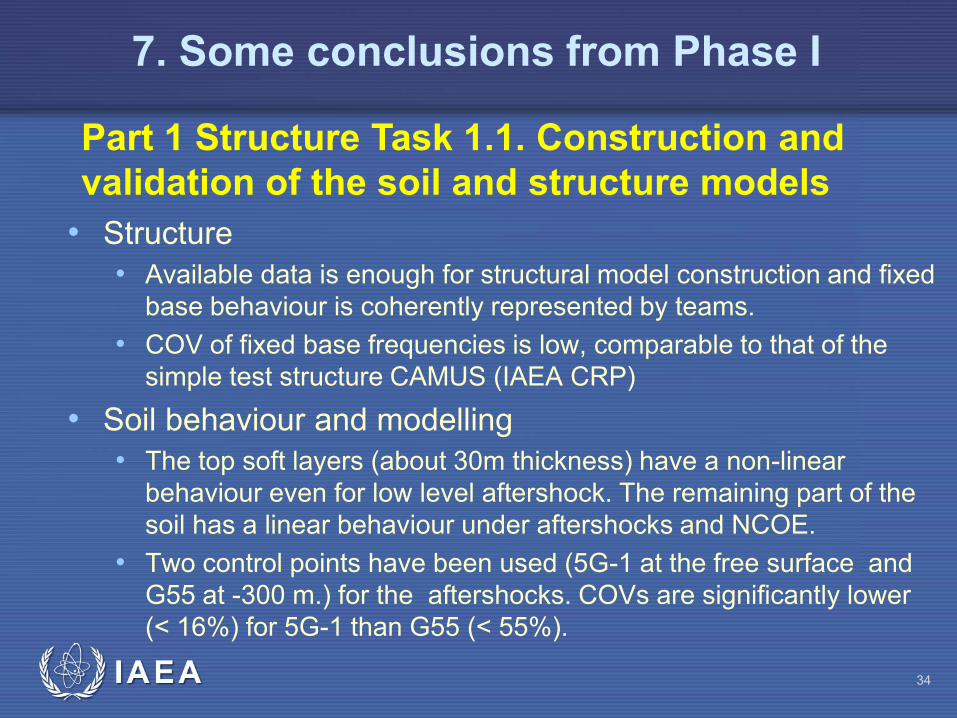
• Structure
• Available data is enough for structural model construction and fixed
base behaviour is coherently represented by teams.
• COV of fixed base frequencies is low, comparable to that of the
simple test structure CAMUS (IAEA CRP)
• Soil behaviour and modelling
• The top soft layers (about 30m thickness) have a non-linear
behaviour even for low level aftershock. The remaining part of the
soil has a linear behaviour under aftershocks and NCOE.
• Two control points have been used (5G-1 at the free surface and
G55 at -300 m.) for the aftershocks. COVs are significantly lower
(< 16%) for 5G-1 than G55 (< 55%).
Part 1 Structure Task 1.1. Construction and
validation of the soil and structure models
34
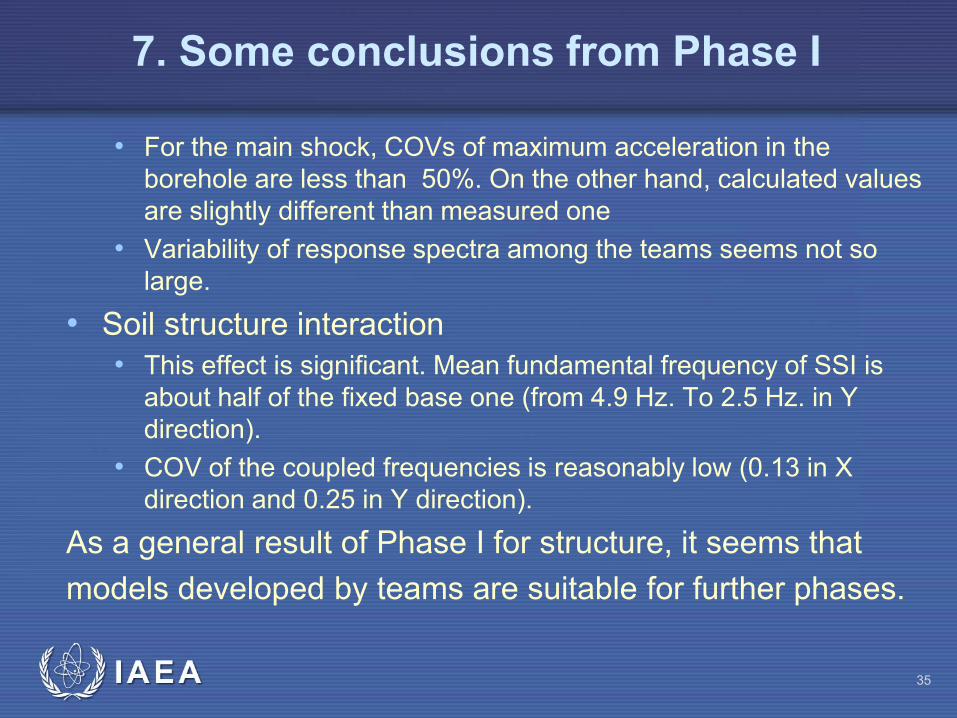
• For the main shock, COVs of maximum acceleration in the
borehole are less than 50%. On the other hand, calculated values
are slightly different than measured one
• Variability of response spectra among the teams seems not so
large.
• Soil structure interaction
• This effect is significant. Mean fundamental frequency of SSI is
about half of the fixed base one (from 4.9 Hz. To 2.5 Hz. in Y
direction).
• COV of the coupled frequencies is reasonably low (0.13 in X
direction and 0.25 in Y direction).
As a general result of Phase I for structure, it seems that
models developed by teams are suitable for further phases.
7. Some conclusions from Phase I
35

8. Perspectives (Phase II)
Phase II Analyses of NCOE mainshock • Simulation of NCOE with standard soil
properties and control point
• Best estimate analysis
• Optional task to determine structure
characteristics directly from recorded signals
36
9. Activities to be continued (Phases II and III)
Phase II
• Result templates will be available in October 2010
• Results templates will be uploaded in January 2011
• Second Review Meeting will be held in 1stQ of 2011
Phase III
• Margin evaluation
• Final Review Meeting will be held in 4th Q of 2011
37
38
International Atomic Energy Agency
Thank you for your attention


