
Oil & Gas Markets OutlookNational Ocean Industries Association
Dr. Helen Currie, Senior Economist
January 31, 2017

2

3
Oil Market

Global Oil Market: The Past Decade
0
20
40
60
80
100
$0
$25
$50
$75
$100
$125
$150
2007 2008 2009 2010 2011 2012 2013 2014 2015 2016
Brent Crude Oil Price(left hand scale)
Oil Volatility Index(right hand scale)
Global Oil Prices and VolatilityPrice/Bbl
% Volatility
4 Source: Bloomberg
Global Oil Market: Rebalancing and Recovery Imminent?
5
(1.5)
(1.0)
(0.5)
0.0
0.5
1.0
1.5
2.0
92
93
94
95
96
97
98
99
1Q 2Q 3Q 4Q 1Q 2Q 3Q 4Q 1Q 2Q 3Q 4Q
2015 2016 2017
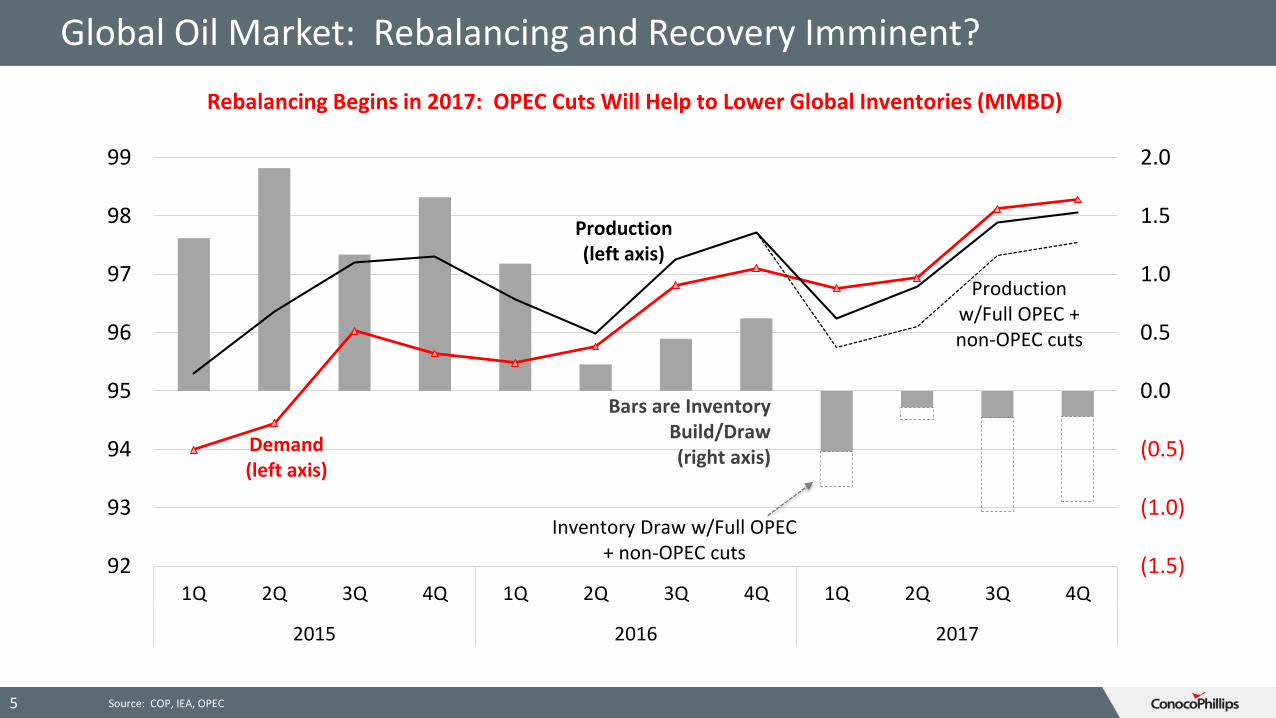
Rebalancing Begins in 2017: OPEC Cuts Will Help to Lower Global Inventories (MMBD)
Bars are Inventory Build/Draw (right axis)
Demand (left axis)
Production (left axis)
Production w/Full OPEC + non-OPEC cuts
Inventory Draw w/Full OPEC + non-OPEC cuts
Source: COP, IEA, OPEC

U.S. Crude Oil Production Expected to Grow
EIA Base Case
High Resource & Technology
Prior Base Case
0
5
10
15
2005 2010 2015 2020 2025 2030
EIA Projects Significant Upside to U.S. Oil Production with Additional Efficiency and Technological Improvements (MMBD)
6 Source: U.S. Department of Energy, EIA Annual Energy Outlook 2017

U.S. Crude Oil Production Growth Led by Onshore Fields
Offshore High Case
Onshore High Case
0
2
4
6
8
10
12
14
2015 2020 2025 2030
Lower-48 Offshore vs Onshore Oil Production (MMBD)
Onshore
Offshore
7 Source: U.S. Department of Energy, EIA Annual Energy Outlook 2017
Challenges to Offshore development vs Onshore Unconventional Plays:
• High initial capital
commitments
• Relatively long lead times
• Less flexibility
• Greater complexity

U.S. Unconventional, Light Tight Oil Plays Account for Future Growth
Gulf Coast
Midcontinent
Permian
Bakken, Niobrara/Rockies
East & West Coasts
0.0
0.5
1.0
1.5
2.0
2.5
3.0
3.5
4.0
2015 2020 2025 2030
Lower-48 Oil Production by Region (MMBD)
High Resource/Technology Cases
8 Source: U.S. Department of Energy, EIA Annual Energy Outlook 2017
Key Issues in Projecting Future Tight Oil Supply:
• Pace and Magnitude of
additional technology &
efficiency improvements
• Cost escalation as activity
accelerates
• Infrastructure needs
• Environmental compliance
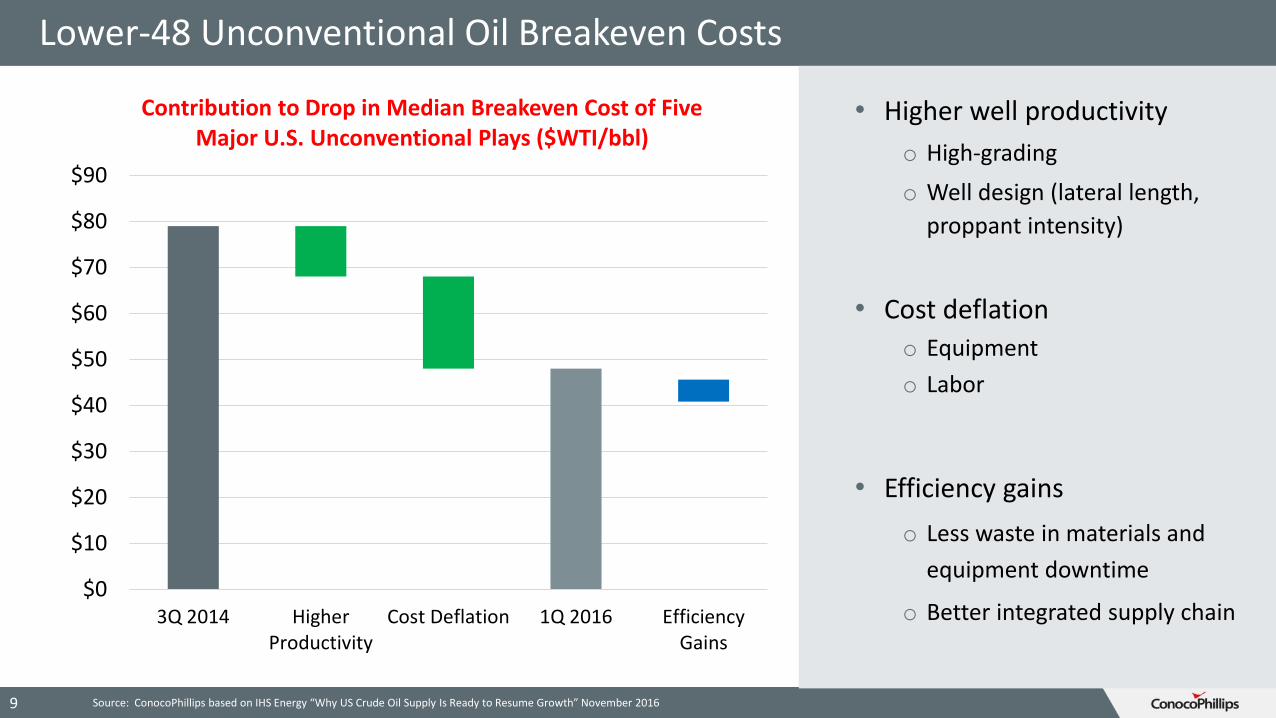
Lower-48 Unconventional Oil Breakeven Costs
9 Source: ConocoPhillips based on IHS Energy “Why US Crude Oil Supply Is Ready to Resume Growth” November 2016
• Higher well productivity
o High-grading
o Well design (lateral length,
proppant intensity)
• Cost deflation
o Equipment
o Labor
• Efficiency gains
o Less waste in materials and
equipment downtime
o Better integrated supply chain$0
$10
$20
$30
$40
$50
$60
$70
$80
$90
3Q 2014 HigherProductivity
Cost Deflation 1Q 2016 EfficiencyGains
Contribution to Drop in Median Breakeven Cost of Five Major U.S. Unconventional Plays ($WTI/bbl)
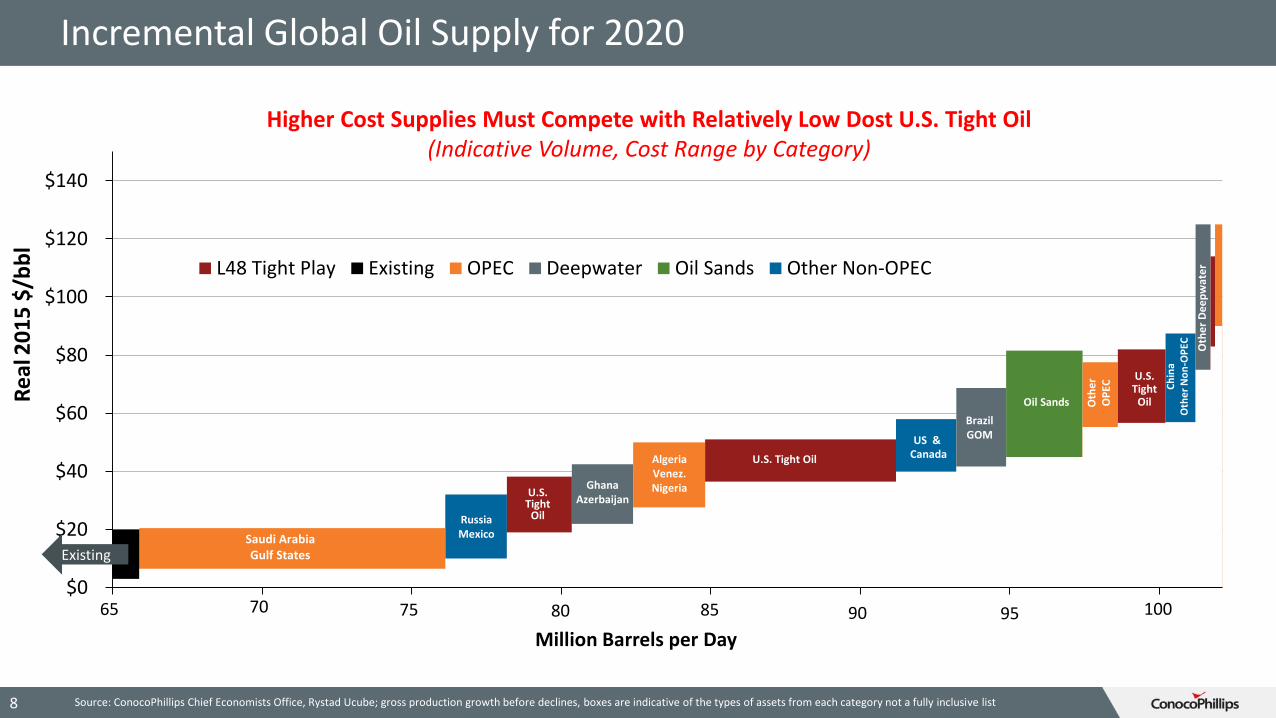
Incremental Global Oil Supply for 2020
65 80 85 90 95 100$0
$20
$40
$60
$80
$100
$120
$140
L48 Tight Play Existing OPEC Deepwater Oil Sands Other Non-OPEC
Existing
U.S. Tight
Oil
U.S. Tight Oil
Russia Mexico
US &Canada
Saudi ArabiaGulf States
Algeria Venez.NigeriaGhana
Azerbaijan
BrazilGOM
Oil Sands
Ch
ina
Oth
er
No
n-O
PEC
U.S. Tight
OilOth
er
OP
EC
Million Barrels per Day
Oth
er
De
ep
wat
er
70 75
Re
al2
01
5 $
/bb
l
Source: ConocoPhillips Chief Economists Office, Rystad Ucube; gross production growth before declines, boxes are indicative of the types of assets from each category not a fully inclusive list 8
Higher Cost Supplies Must Compete with Relatively Low Dost U.S. Tight Oil(Indicative Volume, Cost Range by Category)
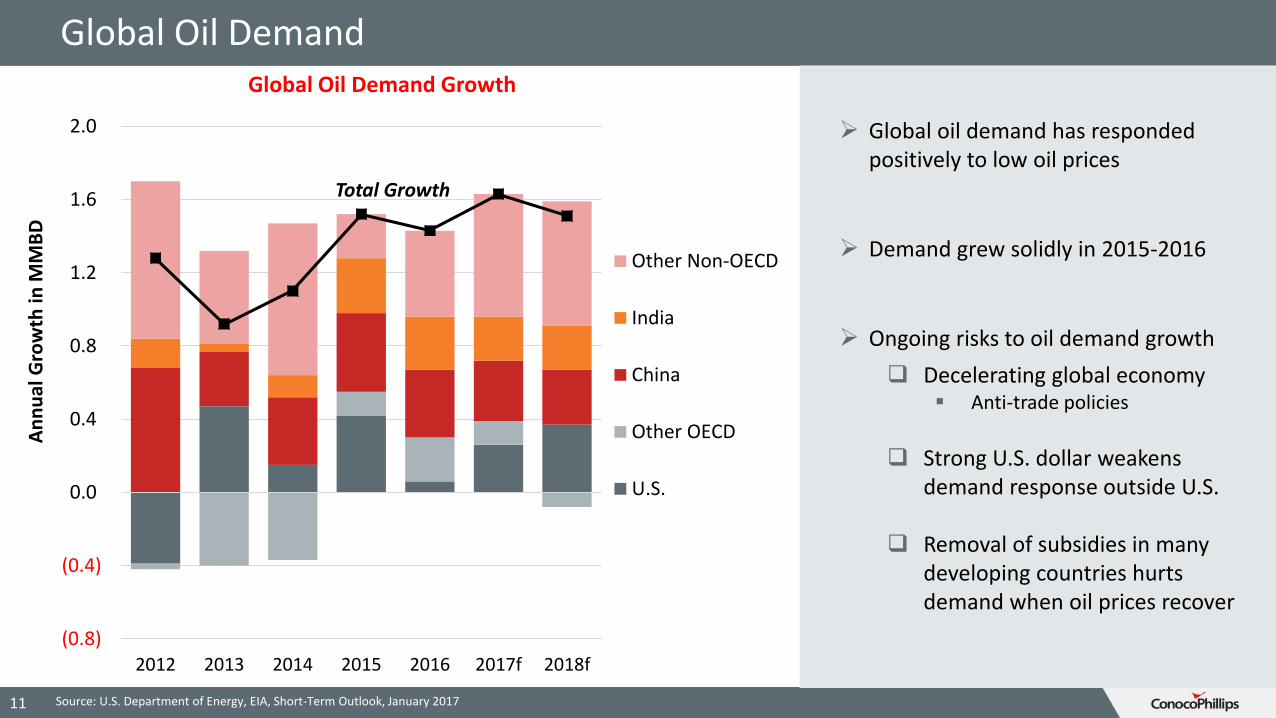
Global Oil Demand
11 Source: U.S. Department of Energy, EIA, Short-Term Outlook, January 2017
(0.8)
(0.4)
0.0
0.4
0.8
1.2
1.6
2.0
2012 2013 2014 2015 2016 2017f 2018f
Global Oil Demand Growth
Other Non-OECD
India
China
Other OECD
U.S.
Global oil demand has responded positively to low oil prices
Demand grew solidly in 2015-2016
Ongoing risks to oil demand growth
Decelerating global economy Anti-trade policies
Strong U.S. dollar weakens demand response outside U.S.
Removal of subsidies in many developing countries hurts demand when oil prices recover
An
nu
al G
row
th in
MM
BD
Total Growth

Slowing Growth in the Global Economy
12
The IMF consistently lowered growth projections for 2015 and 2016
The IMF lowered its GDP forecast for 2016 by 0.2% in its January 2016 forecast.
Downside risks to the economic outlook:
o Secular stagnation
o Hard landing in China’s slowdown
o European immigration crisis and Brexit
o Anti-trade policies
Global Economy: Slowing Growth Prospects
Fiscal Loosening
(10%)
Base (40%)Brexit slows
EU (5%)
Secular Stagnation (10%)
China Tightens (15%)
Strong US Anti-Trade Stance (3%)
2.8
3.0
3.2
3.4
3.6
3.8
4.0
2015 2016 2017 2018 2019 2020
Scenarios for Global Growth
% real GDP, PPP
Sources: Oxford Economics
13
Natural Gas Markets

Resilience of U.S. Shale Gas Production for Major Plays
0
10
20
30
40
50
2007 2008 2009 2010 2011 2012 2013 2014 2015 2016 2017
Permian
Niobrara
Eagle Ford
Bakken
Utica
Haynesville
Marcellus
Shale Gas Plays
AssociatedGas & Legacy Production
Source: EIA Drilling Productivity Report, January 2017. Type Curves based on data from DrillingInfo
0
1,000
2,000
3,000
4,000
5,000
6,000
7,000
1 3 5 7 9 11 13 15 17
0
100
200
300
400
500
600
700
1 3 5 7 9 11 13 15 17
BC
FD
MC
FDM
CFD
Production Month
Marcellus Type Curves
Permian Associated Gas Type Curves
2015 2013 2011
U.S. Shale Gas Production from Top Unconventional Plays
14
Production Month

North American Natural Gas Production Outlook
Source: Wood Mackenzie; U.S. and Canada production combined15
0
20
40
60
80
100
120
140
2015 2018 2021 2024 2027 2030
The Future of North American Production is Shale(Bcf/day)
Shale Gas
Other
Gas from Tight Oil
0
5
10
15
20
Mar
cellu
s
Uti
ca
Can
ada
Eagl
e F
ord
Hay
ne
svill
e
Per
mia
n
Mid
Co
n
Bak
ken
Marcellus is the Growth Leader
Growth in production 2016-2030 (Bcf/day)

LNG exports LNG exports
MexicoMexico
Power
PowerIndustrial
Other
Other
Transport
Res/Comm
0
2
4
6
8
10
12
14
16
18
2016-2020 2020-2030
Demand Growth Led by Export Markets and Power (Bcfd)
16
U.S. Natural Gas Demand Outlook
Source: IHS Energy, December 2016 N.A. Natural Gas Brief. The use of this content was authorized in advance by IHS Markit.Any further use or redistribution of this content is strictly prohibited without written permission by IHS. All rights reserved
Almost 9 Bcfd (70 MTPA) Lower-48 Liquefaction Capacity Online by 2020 (Bcfd)
0
2
4
6
8
2016 2017 2018 2019 2020
Gulf Coast East Coast
Source: Wood Mackenzie

Source: IHS Energy. The use of this content was authorized in advance by IHS Markit.Any further use or redistribution of this content is strictly prohibited without written permission by IHS. All rights reserved
16
(20)
0
20
40
60
80
100
120
140
160
180
Supply Demand Excess Supply
Global Cumulative Growth 2015-2025
U.S.
Australia
Other Pacific
Other Atlantic
Other
Japan, Korea, Taiwan
Other Asia
Europe
Americas
Middle East
New Excess
Existing Excess
Global LNG Supply-Demand BalanceM
TPA
Net growth

Summary
Oil• Prices may continue to experience elevated
volatilityo Uncertain government policies create headwinds for oil
markets
• U.S. production growth expected to be focused onshoreo Ongoing improvements to technology, productivity and
costs will drive growth in U.S. Light Tight Oil
Natural Gas• Shale gas will continue to be a game-changer
o U.S. and Canada will continue to be well supplied by shale resources
• Global gas markets will be more highly linked as LNG trade grows
18


