On the flow past a circular cylinder from critical to super-critical
Reynolds numbers: Wake topology and vortex shedding
I. Rodrıgueza, O. Lehmkuhla,b, J. Chivaa, R. Borrellb, A. Olivaa,∗
aHeat and Mass Transfer Technological Centre (CTTC), Universitat Politecnica deCatalunya-BarcelonaTech, ETSEIAT, Colom 11, 08222 Terrassa (Barcelona), Spain.
bTermo Fluids, S.L., Avda. Jaquard, 97 1-E, 08222 Terrassa (Barcelona), Spain
Abstract
Large-eddy simulations (LES) of the flow past a circular cylinder are used to inves-
tigate the flow topology and the vortex shedding process at Reynolds numbers Re =
2.5×10⁵−8.5×10⁵. This range encompasses both the critical and super-critical regimes. As
the flow enters the critical regime, major changes occur which affect the flow configuration.
Asymmetries in the flow are found in the critical regime, whereas the wake recovers its sym-
metry and stabilises in the super-critical regime. Wake characteristic lengths are measured
and compared between the different Reynolds numbers. It is shown that the super-critical
regime is characterised by a plateau in the drag coefficient at about CD ≈ 0.22, and a
quasi-stable wake which has a non-dimensional width of dw/D ≈ 0.4. The periodic nature
of the flow is analysed by means of measurements of the unsteady drag and lift coefficients.
Power spectra of the lift fluctuations are computed. Wake vortex shedding is found to occur
for both regimes investigated, although a jump in frequencies is observed when the flow
enters the super-critical regime. In this regime, non-dimensional vortex-shedding frequency
is almost constant and equal to St = fvsD/Uref ≈ 0.44. The analysis also shows a steep de-
crease in the fluctuating lift when entering the super-critical regime. The combined analysis
of both wake topology and vortex shedding complements the physical picture of a stable
and highly coherent flow in the super-critical regime.
Keywords: LES, critical and super-critical Reynolds numbers, vortex shedding, coherent
∗Tel: +34 93 739 8192; fax: +34 93 739 8101Email address: [email protected] ( A. Oliva)
Preprint submitted to International Journal of Heat and Fluid Flow April 27, 2015

flow, wake topology
1. Introduction
It is well known that the wake topology in the flow past a circular cylinder remains
almost unchanged up to Reynolds number ∼ 105 (Williamson, 1996). Then, at Re ∼ 2×10⁵
major changes take place entailing flow separation, turbulence transition in the detached
shear layers, reattachment of the flow and turbulent separation of the boundary layer on the
rearward of the cylinder. Furthermore, a dramatic decrease in the drag coefficient occurs
between Reynolds numbers 2×10⁵ and 5×10⁵. In this regime, a laminar separation bubble
(LSB) on one side of the cylinder is formed as a consequence of the detachment and further
reattachment of the boundary layer (Bearman, 1965; Schewe, 1983; Lehmkuhl et al., 2014).
This asymmetry in the flow causes asymmetric forces on the cylinder, the lift coefficient
being greater than zero. The formation of a second LSB on the other side of the cylinder
and the recovery of the symmetry of the flow marks the onset of the super-critical regime. By
entering the super-critical regime, the drag coefficient remains almost constant in the whole
range being about CD ≈ 0.2 (Delany and Sorensen, 1953; Achenbach, 1968; Shih et al.,
1993), whereas high values of the non-dimensional vortex shedding (Strouhal number St =
fvsD/Uref , where fvs is the vortex shedding frequency, Uref is the free-stream velocity and D
the cylinder diameter) have been reported (see for instance Achenbach and Heinecke, 1981;
Schewe, 1983).
Thorough observations and measurements of the wake behind cylinders have been made
mainly for the laminar and sub-critical regimes (e.g. Roshko, 1954; Bloor and Gerrard,
1966; Cantwell and Coles, 1983), but less work has been carried out in the critical and
super-critical regimes, where most of the studies have been focused on measuring loads
on the cylinder surface and vortex shedding (Delany and Sorensen, 1953; Achenbach, 1968;
Shih et al., 1993). Wieselsberger (1922) was one of the first researchers to point out the
narrowing of the wake beyond the critical regime and the shifting of the separation point
towards the rear of the cylinder. Spitzer (1965) performed experiments in the super-critical
regime and measured forces on the cylinder surface. He also carried out measurements of
2

the stream-wise velocity and its fluctuations in the wake, giving an idea of the wake width
and its variations in this regime. Roshko (1961), although did not carry out direct measure-
ments of the wake, described the changes occurring, especially those relative to the wake
narrowing.
Regarding the vortex shedding, contrary to the sub-critical regime where consistent mea-
surements of this parameter have been carried out, there is little information in the range of
critical to super-critical Reynolds numbers, the values reported being quite scattered. The
pioneering work of Relf and Simmons (1924) accounts for vortex shedding measurements
in a large range of Reynolds numbers, including the critical and super-critical regimes up
to Re = 106. However, at these high Reynolds numbers their results were scattered and,
even though they measured an increase in the Strouhal number, they concluded that the
flow was aperiodic in this range. Later, Dryden and Heald (1926) also registered a rapid
increase in the frequency with the Reynolds number when the flow is in the critical zone.
Delany and Sorensen (1953) experimented on cylinders of different shapes. Although the
data of vortex shedding frequencies in the circular cylinder were not exhaustive and much
more scattered than for drag coefficient, they reported non- dimensional frequencies around
0.35 and 0.45 in the range of Re = 106 − 2× 10⁶. Roshko (1961), in his experiments in the
high super-critical and trans-critical regimes, for Re < 3.5×10⁶ did not observe any periodic
behaviour whatsoever. Comparing his results with those of Delany and Sorensen (1953), he
attributed the inconsistency in his measurements to the position of the probe used, which
was located at [x, y] ≡ [7.3D, 0.7D] off the wake centreline.
Jones (1968) carried out measurements in the range Re = 3.6 × 10⁵ − 18 × 106 and
distinguished different regimes: a wide-band random regime in the high super-critical regime
at Re = 1.1 × 10⁶ − 3.5 × 10⁶ where no dominant frequency was detected, a narrow-band
random regime in the trans-critical zone at Re = 3.5 × 10⁶ − 6 × 10⁶ and a quasi-periodic
regime at larger Reynolds numbers with characteristic non-dimensional frequency of St =
0.3. Bearman (1969) studied the vortex shedding in the critical and super-critical regimes.
He found that as the fluid enters the critical zone the Strouhal number increases, being
0.32 in the asymmetric zone to rise up to 0.46 in the symmetric super-critical zone. These
3
measurements were later confirmed by Achenbach and Heinecke (1981) who also detected
vortex shedding in the super-critical zone with a value a bit larger of St = 0.5, however.
They attributed the differences to the blockage ratio of the wind tunnel which was smaller
in the experiments of Bearman (1969). The measurements of Schewe (1983) demonstrated
that the asymmetries in the flow in the critical regime reported in previous works (e.g
Bearman, 1969) were of a fundamental nature. He did also register vortex shedding in the
whole super-critical zone with a non-dimensional vortex shedding frequency of St = 0.48,
close to those measured by Bearman (1969) and Achenbach and Heinecke (1981). Other
experimental results reported in the literature attempted to measure vortex shedding at these
Reynolds numbers (Van Nunen, 1974; Shih et al., 1993) but did not succeed in capturing
the fundamental frequency in the super-critical regime. It is not clear why there is that
large scattering in the detection and measuring of the wake vortex shedding, but different
authors have reported that substantial changes might appear by the influence of axial or
geometrical perturbations, thus altering the way the wake develops (Fung, 1960; Schmidt,
1965; Achenbach and Heinecke, 1981).
With the rapid development of numerical techniques in the last two decades, the use of
computational fluid dynamics at high Reynolds numbers is becoming feasible and a comple-
ment to experimental studies. In that sense, large eddy simulations (LES) of the flow are
an interesting tool to cope with the complex fluid behaviour at critical Reynolds numbers
and beyond. Breuer (2000) analysed the capabilities of LES for solving the flow past a
cylinder at the near-critical Reynolds number of Re = 1.4 × 10⁵ with rather good results.
Karabelas (2010) did also solve the same Reynolds number but for both the stationary and
rotating cylinders, with good agreement with the experimental results for the non-rotating
one. Other researchers (Catalano et al., 2003; Moussaed et al., 2014) have also shown the
possibilities of LES to capture the drop in the drag in the super-critical regime. In a previous
work (Lehmkuhl et al., 2014), by means of LES computations, the flow in the critical regime
was studied and fundamental traits of the flow in this regime; e.g. measurements of the size
of the laminar separation bubble, drag and lift coefficients, amongst others; were reported.
In the present work, a further insight into the characteristics of the flow in both the
4

critical and super-critical regimes is presented by analysing the wake topology and the
variation of different critical parameters such as the vortex formation length, recirculation
length, wake width, amongst others. Furthermore, vortex shedding and fluctuating forces
are studied, giving a more complete picture of the variations the flow experiences when
goes from the critical to the super-critical regime. Results obtained are compared (when
available) to experimental results.
2. Mathematical and numerical model
The spatially filtered incompressible Navier-Stokes equations can be written as,
∂ui
∂xi= 0 (1)
∂ui
∂t+
∂uiuj
∂xj
− ν∂2ui
∂xj∂xj
+ ρ−1 ∂p
∂xi
= −∂Tij
∂xj
(2)
where xi and t are the spatial position in the i direction and the time, respectively. ui and
p stand for the filtered velocity and pressure. ν is the kinematic viscosity and ρ the density
of the fluid. In equation 2, Tij is the subgrid scale (SGS) stress tensor which has to be
modelled. Its deviatoric part is given by,
Tij −1
3Tkkδij = −2νsgsSij (3)
where S ij is the large-scale rate-of-strain tensor, S ij =1
2(gij + gji) being gij = ∂ui/∂xj .
δij is the Kronecker delta. The formulation is closed by formulating an appropriate expres-
sion for the subgrid-scale viscosity, νsgs. In this work, the wall-adapting local-eddy viscosity
model (WALE) (Nicoud and Ducros, 1999) is used. The WALE model evaluates the eddy
viscosity as,
νsgs = (Cw∆)2(Vij : Vij)
3
2
(Sij : Sij)5
2 + (Vij : Vij)5
4
(4)
5

where, Vij is the deviatoric part of the square of the velocity gradient tensor Vij =
1
2
(
g2ij + g2ji)
− 1
3δijg
2kk, with g2ij = gikgkj, and Cw is the model constant. Here a value of
Cw = 0.325 is used.
The governing equations are discretised on a collocated unstructured grid arrangement
by means of second-order spectrum-consistent schemes (Verstappen and Veldman, 2003).
Such schemes are conservative, i.e. they preserve the symmetry properties of the continuous
differential operators, and ensure both stability and conservation of the kinetic-energy bal-
ance even at high Reynolds numbers and with coarse grids. For the temporal discretisation
of the momentum equation a two-step linear explicit scheme on a fractional-step method
is used for the convective and diffusive terms (Trias and Lehmkuhl, 2011), while for the
pressure gradient term an implicit first-order scheme is implemented. The Poisson system
derived from the incompressibility constraint is solved by means of a FFT-based direct solver
(Borrell et al., 2011). For more details about the numerical method, the user is referred to
Rodrıguez et al. (2011); Jofre et al. (2014); Trias et al. (2014).
2.1. Definition of the case and boundary conditions
The flow past a circular cylinder at critical and super-critical Reynolds numbers in the
range of Re = UrefD/ν = 2.5×10⁵−8.5×10⁵ is considered. The Reynolds number is defined
in terms of the free-stream velocity Uref and the cylinder diameter D. For all the cases, the
circular cylinder is placed at (x, y, z) ≡ (0, 0, 0), the dimensions of the computational domain
being of x ≡ [−16D, 16D]; y ≡ [−10D, 10D] for the stream- and cross-stream directions,
whereas for the span-wise direction z ≡ [0, 0.5πD] is considered for Reynolds number up
to Re = 6.5 × 10⁵ and z ≡ [0, D] for the higher Reynolds numbers (see table 1). Being
Ly the size of the computational domain in the cross-stream direction, the blockage ratio is
D/Ly = 5%. In Table A.4 in the AppendixA, a compilation of the measurement conditions
for most of the experimental data used for comparison in this work is given. As can be
seen, the blockage ratio used in the present computations is well within the values reported
in the literature. It should be borne in mind that blockage ratio may affect the results as
this magnitude increases. West and Apelt (1981) showed that blockages lower than 6% has
6

Table 1: Computational meshes NCVt total number of CVs; NCV plane number of CVs in the
plane; Nplanes number of planes in the span-wise direction; Lz is the size of the span-wise
direction.
Re NCVt [×106] NCV plane Nplanes Lz
2.5× 10⁵ 38.4 299683 128 0.5π D
3.8× 10⁵ 48.6 379950 128 0.5π D
5.3× 10⁵ 64.1 500516 128 0.5π D
6.5× 10⁵ 83.2 650432 128 0.5π D
7.2× 10⁵ 89.4 698949 128 D
8.5× 10⁵ 105.1 820803 128 D
negligible effects on pressure distribution and drag. For larger blockages, the general effect,
at least in the sub-critical range, is to increase the force coefficients as well as the span-wise
correlation (Blackburn, 1994). In general, blockage may affect separation due to changes
on the surface pressure gradients, thus triggering the critical transition at lower Reynolds
numbers. Nonetheless, as pointed out by Blackburn and Melbourne (1996), these effects
would be of less importance in the super-critical regime as the wake width is smaller.
In the present computations the boundary conditions consist of uniform velocity (u, v, w) =
(1, 0, 0) at the inflow, symmetry conditions at the top and bottom boundaries of the domain,
while at the outlet a pressure-based condition is used. At the cylinder surface, no-slip con-
ditions are prescribed. As for the span-wise direction, periodic boundary conditions are
imposed.
2.2. Numerical domain. Mesh resolution studies.
Different unstructured grids from 38 million up to ∼ 105 million control volumes are
used for solving the different cases depending on the Reynolds number (see table 1). It was
shown in Lehmkuhl et al. (2014) that in order to capture the complexities of the physical
7

0
0.5
1
1.5
2
2.5
0 20 40 60 80 100 120 140 160 180
y+
angle
Re=7.2e5Re=5.3e5
Figure 1: Mesh resolution near the wall for Re = 5.3× 10⁵ and Re = 7.2× 10⁵.
phenomenon in the zone close to the cylinder; i.e. delayed separation, transition to tur-
bulence upon separation, reattachment, and further turbulent separation, amongst others;
the boundary layer should be well-resolved. To that end, control volumes are clustered
towards the cylinder wall and, a prism layer is constructed around the cylinder so as the
non-dimensional wall distance is kept y+ < 2. Being uτ =√
τw/ρ the friction velocity and
n the wall-normal distance, the non-dimensional wall-normal distance along the cylinder
circumference is evaluated as y+ = uτn/ν. The non-dimensional wall-normal distance for
Re = 5.3× 10⁵ and for Re = 7.2× 10⁵ is plotted in figure 1.
Regarding the span-wise size of the domain, for Reynolds numbers Re ≤ 6.5×10⁵ a length
of Lz = 0.5πD was enough to capture the largest scales of the flow (see Lehmkuhl et al.
(2014) for more details). Notice that this value is lower than those used in experimental
set-ups (see AppendixA). However in experiments, contrary to numerical computations,
the combination of cylinder end conditions and aspect ratio Lz/D are of importance since
structures formed close to the wall may interact with the vortex shedding and trigger the
wake three-dimensionality (this issue will be addressed in more detail in section 3.2). This
is especially true for the flow at critical and super-critical regimes. Thus a relative large
8
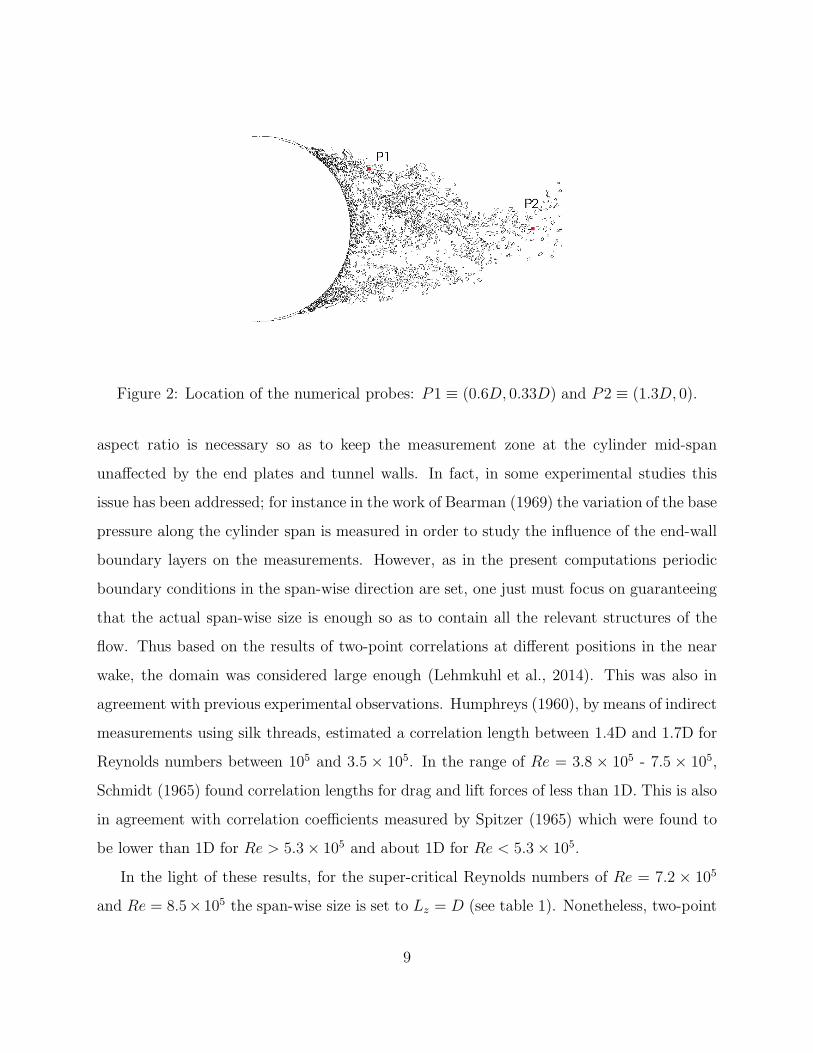
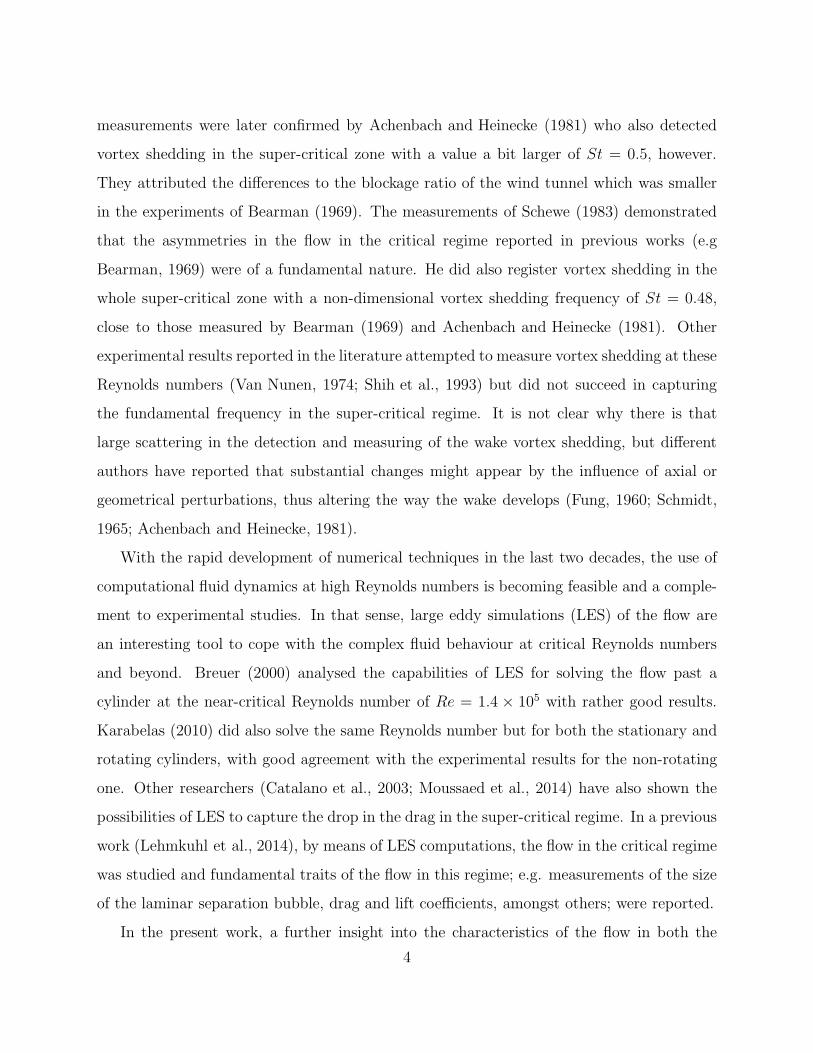
Figure 2: Location of the numerical probes: P1 ≡ (0.6D, 0.33D) and P2 ≡ (1.3D, 0).
aspect ratio is necessary so as to keep the measurement zone at the cylinder mid-span
unaffected by the end plates and tunnel walls. In fact, in some experimental studies this
issue has been addressed; for instance in the work of Bearman (1969) the variation of the base
pressure along the cylinder span is measured in order to study the influence of the end-wall
boundary layers on the measurements. However, as in the present computations periodic
boundary conditions in the span-wise direction are set, one just must focus on guaranteeing
that the actual span-wise size is enough so as to contain all the relevant structures of the
flow. Thus based on the results of two-point correlations at different positions in the near
wake, the domain was considered large enough (Lehmkuhl et al., 2014). This was also in
agreement with previous experimental observations. Humphreys (1960), by means of indirect
measurements using silk threads, estimated a correlation length between 1.4D and 1.7D for
Reynolds numbers between 105 and 3.5 × 10⁵. In the range of Re = 3.8 × 10⁵ - 7.5 × 10⁵,
Schmidt (1965) found correlation lengths for drag and lift forces of less than 1D. This is also
in agreement with correlation coefficients measured by Spitzer (1965) which were found to
be lower than 1D for Re > 5.3× 10⁵ and about 1D for Re < 5.3× 10⁵.
In the light of these results, for the super-critical Reynolds numbers of Re = 7.2 × 10⁵
and Re = 8.5×10⁵ the span-wise size is set to Lz = D (see table 1). Nonetheless, two-point
9

-0.4
-0.2
0
0.2
0.4
0.6
0.8
1
0 0.1 0.2 0.3 0.4 0.5
RΦ
Φ
δz/D
RuuRvvRww
(a)
-0.4
-0.2
0
0.2
0.4
0.6
0.8
1
0 0.1 0.2 0.3 0.4 0.5R
Φ Φ
δz/D
RuuRvvRww
(b)
-0.4
-0.2
0
0.2
0.4
0.6
0.8
1
0 0.1 0.2 0.3 0.4 0.5
RΦ
Φ
δz/D
RuuRvvRww
(c)
-0.4
-0.2
0
0.2
0.4
0.6
0.8
1
0 0.1 0.2 0.3 0.4 0.5
RΦ
Φ
δz/D
RuuRvvRww
(d)
Figure 3: Two-point correlations of the stream-wise, cross-stream and span-wise velocity
fluctuations in the near wake (a,b) at Re = 7.2 × 10⁵ at (x/D, y/D) ≡ (0.6, 0.33) and
(x/D, y/D) ≡ (1.3, 0), respectively; (c,d) at Re = 8.5× 10⁵ at (x/D, y/D) ≡ (0.6, 0.33) and
(x/D, y/D) ≡ (1.3, 0), respectively
10

correlations at different locations of the near wake are here evaluated in order to check if this
size is large enough to accommodate all structures. The locations where these correlations
are evaluated are shown in figure 2. These locations are: P1 ≡ (0.6D, 0.33D) in the turbulent
separated shear layer and P2 ≡ (1.3D, 0) in the wake centreline. One-dimensional two-point
correlations of the fluctuating variable φ′ = φ− < φ >,
ℜφφ(x, y, δz) =〈φ′(x, y, z, t) φ′(x, y, z + δz, t)〉
〈φ′2〉(5)
are plotted in figure 3. In the above equation, 〈·〉 denotes averaging over time. In
the detached turbulent boundary layer (see figure 3a,c), correlation coefficients drop to
zero much faster than in the wake centreline, where larger structures are observed (figure
3b,d). Nonetheless, correlation values for all three velocity fluctuations fall-off to zero for
separations lower than half of the domain. Thus, a span-wise length of 1D seems to be
acceptable for these Reynolds numbers.
3. Results
3.1. Wake topology
Once the flow enters the critical regime, a laminar separation bubble (LSB) is formed on
one side of the cylinder surface as a consequence of the combined effects of flow separation,
turbulence transition in the separated shear-layer and further reattachment of the flow (see
Lehmkuhl et al. (2014) at Re = 2.5×10⁵). However, as transition to turbulence is asymmet-
ric, the flow on the other side of the cylinder remains unaffected as in the sub-critical regime.
As a result, the forces acting on the cylinder surface are also asymmetric and the magni-
tude of the steady lift coefficient is greater than zero. With the increase in the Reynolds
number a second bubble starts to form, yet the flow is asymmetric (Re = 3.8× 10⁵). Flow
symmetry is reached when the second bubble stabilises at the end of the critical regime
(Re ≈ 5.3 × 10⁵ − 6.5 × 10⁵) and the drop in the drag is completed. The complete forma-
tion of this second bubble and the symmetry recovery marks the onset of the super-critical
regime.
11
0
0.2
0.4
0.6
0.8
1
1.2
1.4
104
105
106
107
CD
Re
Delany&Sorensen (1953)Spitzer (1965)
Achenbach&Heinecke (1981)Bursnall&Loftin (1951)
Vaz et al.(2007)Schewe (1983)
Wieselsberger (1922)Fage (1930)Present LES
Figure 4: Critical and super-critical drag coefficient. Comparison with the litera-
ture. ( ) Present results; (×) Delany and Sorensen (1953); (∗) Spitzer (1965); (⊡)
Achenbach and Heinecke (1981); (�) Bursnall and Loftin (1951): (⊙) Vaz et al. (2007); (+)
Schewe (1983); ( △) Wieselsberger (1922); (N) Fage (1930).
12

In figure 4, the drag coefficient at both critical and super-critical Reynolds numbers is
plotted together with available experimental measurements from the literature. The agree-
ment is rather good; the present computations are capable of capturing the steep drop in
the drag at critical Reynolds numbers and the plateau behaviour observed at super-critical
Reynolds numbers, once the drag has dropped to its minimum value. Yet, we would like to
draw attention to the somewhat large scattering present in the experimental data, especially
at critical Reynolds numbers. These differences may be due to several causes such as com-
pressibility, surface roughness, cylinder end conditions, inlet turbulence intensity, blockage
ratio, amongst others.
The influence of the blockage ratio has been addressed in section 2.1. As it has been
commented, ratios larger than 6% (West and Apelt, 1981) might affect the force coefficients.
Furthermore, the critical transition might be forced to occur at lower Reynolds numbers.
On the other hand, turbulence intensity also induces critical transition at lower Reynolds
numbers (Blackburn and Melbourne, 1996). However, the published experimental data (see
details summarised in AppendixA) used in this work were mainly obtained on low turbulence
intensity conditions, probably with the exception of the experiments of Fage (1930). Despite
the fact that in Fage’s experiments turbulence level was not reported, one may assume they
were performed at a higher stream turbulence level since the critical Reynolds number is
too low (see figure 4).
An issue of major importance is the compressibility effects that might be encountered
even at low Mach numbers, well below the critical value depending on the boundary layer
condition, and which occurs near Ma = 0.4 (Achenbach and Heinecke, 1981; Polhamus,
1984). Compressibility, due to the increase in the value of the minimum pressure point
which affects separation, shifts the critical transition range towards higher Reynolds num-
bers. This results in an increased drag at all Reynolds numbers. According to Polhamus
(1984), these effects begin to be measurable at Ma = 0.18− 0.2, which is also in agreement
with measurements of Zan (2008) in the super-critical region. Even though most of the
experiments summarised in table A.4 are in the low-Mach region, in some of them Ma > 0.2
conditions are attained, especially for the larger Reynolds numbers e.g. Delany and Sorensen
13

(1953); Jones (1968); Shih et al. (1993).
Regarding the cylinder surface conditions, all the experimental results used for compari-
son in this work were on smooth highly polished cylinders, as can be seen in the AppendixA.
According to Szechenyi (1975), below the super-critical regime, smooth cylinders behaves as
they have a very small non-dimensional surface roughness equivalent to ks/D ∼ 3.5 × 10⁻⁵
(ks is the total height of the surface roughness). In any case, roughness promotes an earlier
transition to a turbulent boundary layer, thus the critical regime occurs at smaller Reynolds
numbers, whereas minimum drag coefficient increases. However, as the Reynolds number
increases and the boundary layer becomes thinner, the value at which a surface may be
considered smooth decreases. For instance, Polhamus (1984) pointed out that values of
ks/D ∼ 10−5, as those of Roshko (1961), can produce a measurable increase in the drag in
the super-critical regime.
Apart from the aforementioned effects, discrepancies may also arise due to end flow
leakages (Delany and Sorensen, 1953) and latex end seals (Vaz et al., 2007), the use of a
three-dimensional cylinder model (Schmidt, 1965; Spitzer, 1965), problems with measure-
ment instruments such as pressure transducers working at a small fraction of their full scale
(Shih et al., 1993) and tunnel vibrations at some Reynolds numbers (Schewe, 1983), amongst
others.
The local pressure distribution along the cylinder circumference at different Reynolds
numbers is given in figure 5. In the figure, angular positions are measured in clock-wise
direction. At Re = 2.5 × 10⁵ the pressure distribution is asymmetric (figure 5a). Notice
that on the top side of the cylinder (angle=0 − 180◦), the agreement with the pressure
distribution measured by Cantwell and Coles (1983) at Re = 1.4 × 10⁵ is rather good,
especially the magnitude and position of the pressure minimum. This is because on this side
of the cylinder the flow resembles that of the sub-critical regime. On the other side of the
cylinder (angle=180 − 360◦), the flow behaviour is different and a large depression can be
observed, with a displacement in the position of the pressure minimum towards the cylinder
rear. With the increase in the Reynolds number, changes in the pressure distribution occur
on both sides of the cylinder and symmetry is gradually recovered (e.g. Re = 5.3 × 10⁵ in
14

-3
-2.5
-2
-1.5
-1
-0.5
0
0.5
1
0 60 120 180 240 300 360
Cp
angle
LSB
Re=2.5e5Re=5.3e5
Cantwell & Coles (1983)Bursnall & Loftin (1951)
(a)
-3
-2.5
-2
-1.5
-1
-0.5
0
0.5
1
0 60 120 180
Cp
angle
LSB
ST
Re=6.5e5Re=8.5e5
Roshko(1961)*Spitzer (1965)
(b)
Figure 5: Local pressure distribution at different Reynolds numbers. Comparison with the
literature. (a) At critical Reynolds numbers Re = 2.5 × 10⁵ and Re = 5.3 × 10⁵; (b) At
super-critical Reynolds numbers of Re = 6.5×10⁵ and Re = 8.5×10⁵. ∗. Results by Spitzer
(1965) at Re = 7.5× 10⁵. *Flachsbart at Re = 6.7× 10⁵ taken from Roshko (1961). Notice
that for Re = 6.5 × 10⁵ the approximate location of the laminar separation of the LSB (S)
and transition to turbulence (T) are also indicated.
15
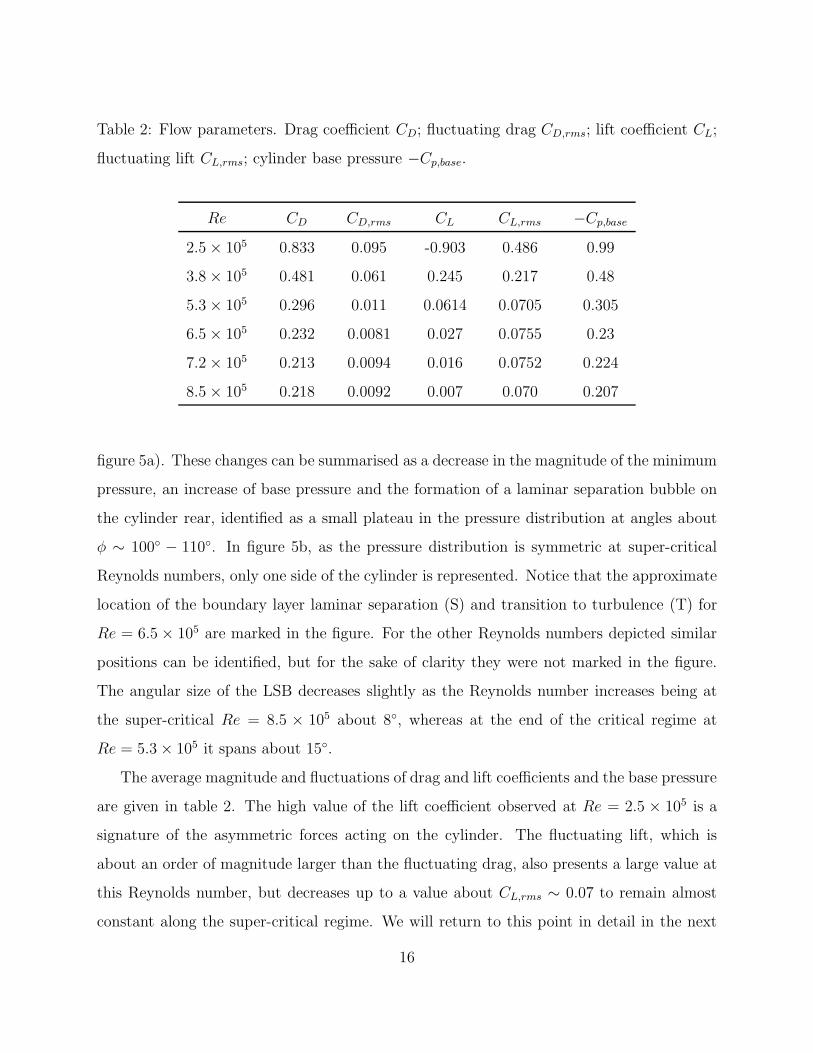
Table 2: Flow parameters. Drag coefficient CD; fluctuating drag CD,rms; lift coefficient CL;
fluctuating lift CL,rms; cylinder base pressure −Cp,base.
Re CD CD,rms CL CL,rms −Cp,base
2.5× 10⁵ 0.833 0.095 -0.903 0.486 0.99
3.8× 10⁵ 0.481 0.061 0.245 0.217 0.48
5.3× 10⁵ 0.296 0.011 0.0614 0.0705 0.305
6.5× 10⁵ 0.232 0.0081 0.027 0.0755 0.23
7.2× 10⁵ 0.213 0.0094 0.016 0.0752 0.224
8.5× 10⁵ 0.218 0.0092 0.007 0.070 0.207
figure 5a). These changes can be summarised as a decrease in the magnitude of the minimum
pressure, an increase of base pressure and the formation of a laminar separation bubble on
the cylinder rear, identified as a small plateau in the pressure distribution at angles about
φ ∼ 100◦ − 110◦. In figure 5b, as the pressure distribution is symmetric at super-critical
Reynolds numbers, only one side of the cylinder is represented. Notice that the approximate
location of the boundary layer laminar separation (S) and transition to turbulence (T) for
Re = 6.5× 10⁵ are marked in the figure. For the other Reynolds numbers depicted similar
positions can be identified, but for the sake of clarity they were not marked in the figure.
The angular size of the LSB decreases slightly as the Reynolds number increases being at
the super-critical Re = 8.5 × 10⁵ about 8◦, whereas at the end of the critical regime at
Re = 5.3× 10⁵ it spans about 15◦.
The average magnitude and fluctuations of drag and lift coefficients and the base pressure
are given in table 2. The high value of the lift coefficient observed at Re = 2.5 × 10⁵ is a
signature of the asymmetric forces acting on the cylinder. The fluctuating lift, which is
about an order of magnitude larger than the fluctuating drag, also presents a large value at
this Reynolds number, but decreases up to a value about CL,rms ∼ 0.07 to remain almost
constant along the super-critical regime. We will return to this point in detail in the next
16

Figure 6: Different wake configurations observed in the critical and super-critical regimes.
section.
According to the changes in the symmetry of the flow observed (see also Lehmkuhl et al.,
2014), three modes can be foreseen (figure 6): i) a one-bubble asymmetric mode, with flow
separation delayed on one side of the cylinder while the other remains sub-critical; ii) a
two-bubble asymmetric mode, with a small second bubble starting to be formed and; iii) a
two-bubble symmetric mode, with two symmetric bubbles on each side of the cylinder which
is a characteristic trait of the super-critical regime. As it will be shown hereafter, the flow
in the third mode is stable and little changes are observed in the wake characteristics.
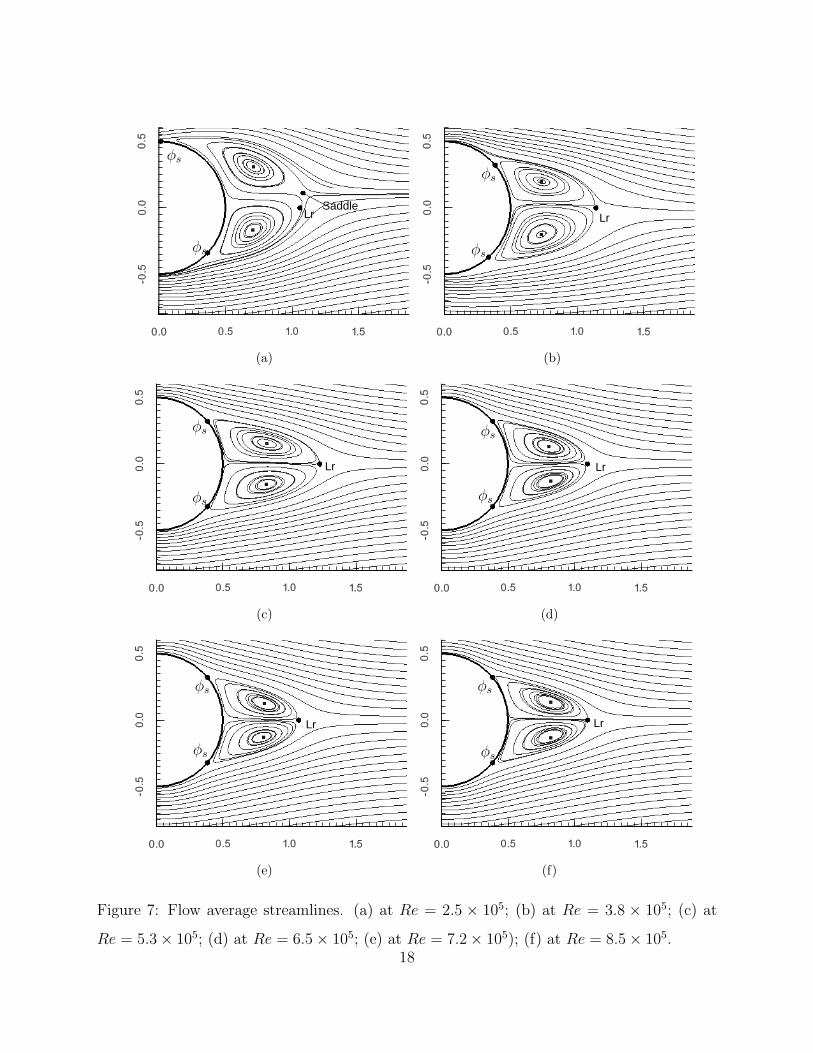
In figure 7, the mean streamlines in the near wake region are depicted for all Reynolds
numbers. A two-eddy configuration pattern is observed at all Reynolds numbers, though
differences in size, shape and length can readily be identified. The position of (laminar or
turbulent) flow separation φs and the vortex centroids are marked for each case in the figure.
At Re = 2.5× 10⁵ (figure 7a), recirculation vortices are of different size and streamlines are
bent towards the opposite side where the LSB is formed, i.e. the side with the lower pressure
17
LrSaddle
φs
φs
(a)
Lr
φs
φs
(b)
Lr
φs
φs
(c)
Lr
φs
φs
(d)
Lr
φs
φs
(e)
Lr
φs
φs
(f)
Figure 7: Flow average streamlines. (a) at Re = 2.5 × 10⁵; (b) at Re = 3.8 × 10⁵; (c) at
Re = 5.3× 10⁵; (d) at Re = 6.5× 10⁵; (e) at Re = 7.2× 10⁵); (f) at Re = 8.5× 105.18
gradient. This is a consequence of the difference in magnitude of the forces acting on both
sides of the cylinder. In this case, streamlines are bent towards the upper part of the wake
(see also figure 5a). The top eddy is similar to those seen in the sub-critical flow with
laminar separation close to the cylinder apex φs ∼ 90◦. On the other hand, the bottom
eddy is smaller, its centroid (defined as in Cantwell and Coles (1983)) is located closer to
the wake centreline than the opposite one (the position of the centroid of the eddies is given
in table 3) and turbulent flow separation is shifted towards the cylinder rear (φs ∼ 218◦).
The non-dimensional length of the recirculation zone Lr can also be observed from the
figure. This is the distance to the position where the recirculation closes, i.e. the distance
from the cylinder rear end to the saddle point formed by the time averaged streamline
topology. For a symmetric wake, this location is in the plane [x, y = 0]. However, as for
Re = 2.5×10⁵ the wake is asymmetric, the saddle point does not sit in this plane but slightly
off at [x, y] ≡ [1.082, 0.111]. In table 3, the non-dimensional length of the recirculation
together with other characteristic length scales such as the non-dimensional vortex formation
length, Lf (defined as in Bloor and Gerrard (1966), i.e. the distance between the cylinder
centroid and the location where the root-mean square stream-wise velocity peaks), and the
non-dimensional distance from the cylinder centre to the position where the stream-wise
velocity at the wake centreline reaches a minimum value, Lu,min, are also given. Notice that
in the table all these parameters are given for the cylinder mid-plane [x, y = 0], thus the
length of the recirculation for Re = 2.5 × 10⁵ was determined from the position where the
mean stream-wise velocity is zero. This distance is Lr = 0.559. However, if the distance
from the cylinder rear to the location of the saddle is considered, the actual size of the
recirculation zone is 0.588. This value is close to those reported at the end of the sub-
critical regime at Re = 1.4 × 10⁵, although some scatter in the measurement of this wake
length scale can be found in the literature (e.g. Lr = 0.6 in Cantwell and Coles (1983),
Lr = 0.73 in Braza et al. (2006), Lr ≈ 0.42 in Breuer (2000)).
In a lower degree, asymmetries in the flow are also present at Re = 3.8 × 10⁵ with the
wake bent down, i.e., towards the side with the lower pressure gradient (smaller bubble).
This Reynolds number corresponds to an intermediate state where two LSB are formed, but
19

Table 3: Critical parameters of the near wake. Lr, non-dimensional length of the recir-
culation zone; Lf , non-dimensional vortex formation length; Lu,min, umin non-dimensional
location and magnitude of the minimum stream-wise velocity u/Uref in the wake centreline,
respectively; xc and yc, non-dimensional stream-wise and cross-stream coordinates of the
location of the mean wake vortex centre.
vortex centre
Re Lr Lf Lu,min umin xc yc
2.5× 10⁵ 0.559 1.105 0.757 -0.194 0.711/0.707 0.308/-0.168
3.8× 10⁵ 0.641 1.107 0.778 -0.205 0.73/0.728 0.199/-0.2
5.3× 10⁵ 0.727 1.183 0.885 -0.253 0.831/0.825 0.153/-0.154
6.5× 10⁵ 0.596 1.044 0.86 -0.262 0.807/0.822 0.132/-0.129
7.2× 10⁵ 0.569 1.062 0.854 -0.254 0.813/0.807 0.125/-0.128
8.5× 10⁵ 0.597 1.091 0.871 -0.23 0.819/0.820 0.135/-0.134
they are different in size (two-bubble asymmetric mode). However, turbulent detachment
on both sides occurs towards the rearward. The centroid of the eddies is quasi symmetric
(see table 3) though they differ in size, the top one being smaller than its counterpart on
the bottom side. This is due to the differences in the position of the separation point, which
is not symmetric. Nonetheless, the saddle point is displaced only −0.0015 off the wake
centreline being indistinguishable from the point Lr in figure 7b.
As the Reynolds number increases and the flow enters the super-critical regime, the wake
stabilises into a flow configuration consisting in a two-symmetric eddy pattern with the eddy
centroid located closer to the wake centreline (see table 3). The turbulent separation of the
flow occurs at φs ≈ 148◦ on both sides of the cylinder with almost no variations regardless
of the Reynolds number.
By putting these parameters all together, in the super-critical regime the picture of a
quite stable mean wake with minor differences in the average parameters can be visualised.
20

Lr
LfLu,min
(a)
LrLfLu,min
(b)
Lr
LfLu,min
(c)
LrLfLu,min
(d)
LrLfLu,min
(e)
-8
8
0
LrLfLu,min
(f)
Figure 8: Contours of time-averaged non-dimensional span-wise vorticity (a) at Re = 2.5×
105; (b) at Re = 3.8×10⁵; (c) at Re = 5.3×10⁵; (d) at Re = 6.5×10⁵; (e) at Re = 7.2×10⁵;
(f) at Re = 8.5 × 10⁵. In (a,b) ωzD/Uref = ±(2.8 − 7) and in (c-f) ωzD/Uref = ±(4 − 7),
with ∆ωzD/Uref = 0.6.21
-0.6
-0.4
-0.2
0
0.2
0.4
0.6
0.8
0 0.5 1 1.5 2 2.5 3 3.5 4
y/D
x/D
Re=5.3e5Re=8.5e5
Re=6.5e5Re=2.5e5
Re=3.8e5
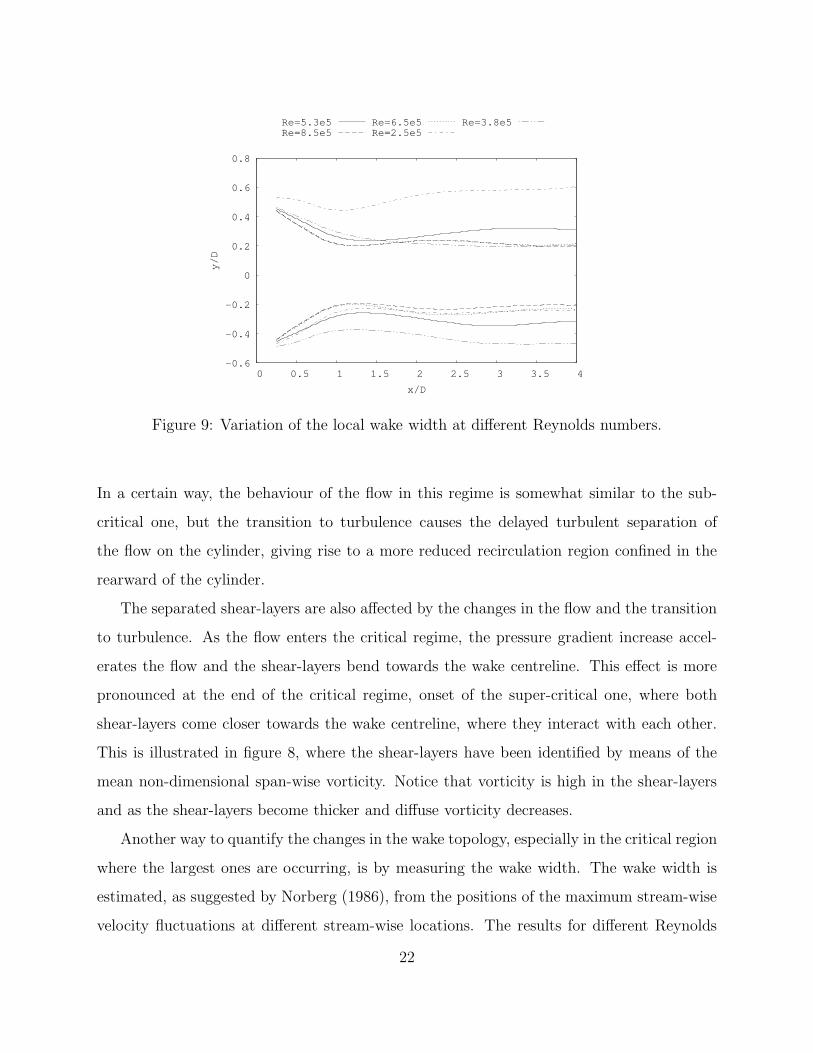
Figure 9: Variation of the local wake width at different Reynolds numbers.
In a certain way, the behaviour of the flow in this regime is somewhat similar to the sub-
critical one, but the transition to turbulence causes the delayed turbulent separation of
the flow on the cylinder, giving rise to a more reduced recirculation region confined in the
rearward of the cylinder.
The separated shear-layers are also affected by the changes in the flow and the transition
to turbulence. As the flow enters the critical regime, the pressure gradient increase accel-
erates the flow and the shear-layers bend towards the wake centreline. This effect is more
pronounced at the end of the critical regime, onset of the super-critical one, where both
shear-layers come closer towards the wake centreline, where they interact with each other.
This is illustrated in figure 8, where the shear-layers have been identified by means of the
mean non-dimensional span-wise vorticity. Notice that vorticity is high in the shear-layers
and as the shear-layers become thicker and diffuse vorticity decreases.
Another way to quantify the changes in the wake topology, especially in the critical region
where the largest ones are occurring, is by measuring the wake width. The wake width is
estimated, as suggested by Norberg (1986), from the positions of the maximum stream-wise
velocity fluctuations at different stream-wise locations. The results for different Reynolds
22

numbers are depicted in figure 9. The wake asymmetry at Re = 2.5× 10⁵ is clearly seen in
the figure, with the top limit of the wake occurring at a larger vertical distance (measured
from the wake centreline) than the bottom edge. As commented before, the top side of
the cylinder behaves as in the sub-critical regime, thus a wider wake should be expected.
However, on the bottom side, the flow is critical and with the acceleration of the flow the
wake narrows. As a result, the wake width is about dw/D ≈ 0.87, which is smaller than
that of the sub-critical wake (dw/D > 1).
At Re = 3.8 × 10⁵, the wake is also asymmetric but, as commented before, in the
present results it is bent downward, with the bottom edge of the wake located at a larger
distance from the wake centreline than the top one. As a consequence, the wake width is
narrower than at Re = 2.5 × 10⁵ being about dw/D ≈ 0.675. As the Reynolds number
increases the wake width decreases and the symmetry in the flow is gradually recovered.
When the flow enters in super-critical regime, this quantity remains almost unaffected as
can be seen from the figure. Notice also that in the super-critical regime the wake width is
approximately dw/D ≈ 0.4. This value is not only lower than that of the sub-critical regime
(dw/D > 1) but also almost half the value reported by Roshko (1961) for the trans-critical
regime (dw/D ≈ 0.81).
3.2. Vortex shedding
Unsteady lift and drag loads indicative of the fluctuating forces acting on the cylinder.
Measurements of these forces in the critical and super-critical regimes are scarce (Fung, 1960;
Schmidt, 1965). As unsteady lift is related to the vortex shedding, it has a periodic nature in
the sub-critical regime. However, there is large controversy regarding whether vortex shed-
ding occurs in the critical and super-critical regimes, and sometimes unsteady lift has been
reported to lose coherence in these regimes (e.g. Fung, 1960; Schmidt, 1965). In section 3.1,
it has been commented on the different causes of the large scattering observed in the drag
coefficient measurements. However, cylinder aspect ratio and end conditions have also an
important effect in the vortex shedding or the lack thereof. Achenbach and Heinecke (1981)
observed that for small cylinder aspect ratios the flow behind the cylinder became three-
23

dimensional and vortex shedding coherence was lost. These effects were observed for a cylin-
der of aspect ratio Lz/D = 3.38, whereas for a model of aspect ratio Lz/D = 6.75 a coher-
ent vortex shedding was measured. This was also commented by Blackburn and Melbourne
(1996), who attributed the absence of a coherent peak in the spectra in their measurements
to a relative small cylinder aspect ratio of Lz/D = 4.5. Furthermore, Bearman (1969) re-
ported that in the critical and the super-critical regimes the flow is very sensitive to small
changes in the experimental conditions; small disturbances on well polished surfaces, such
as dust particles, affected the flow and triggered its three-dimensionality along the span,
which in turn caused the regular vortex shedding ceasing.
Another possible cause of loss of coherence in the wake may be attributed to the use
of a three-dimensional model in the experiments, as in Schmidt (1965) and Spitzer (1965).
They both used a cantilevered cylinder of aspect ratio Lz/D = 8 and, in Spitzer (1965)
measurements were not made at the cylinder mid-span but at z/D = 4.86 − 5.87. It
has been shown both experimentally (see for instance Park and Lee, 2000) and numerically
(Afgan et al., 2007) that depending on the aspect ratio of the cylinder, the flow in the near
wake is rather non-uniform and that wake three-dimensionality and vortex shedding are
affected by the downwash flow from the free-end of the cylinder. The latter is relevant as
it was reported (for Re = 20× 103) that as Lz/D decreases vortex shedding frequency also
decreases and spectrum bandwidth increases; vortex shedding disappears for Lz/D ≤ 6. This
may be the reason why the non-dimensional vortex shedding frequency detected by Spitzer
(1965) at the beginning of the critical regime was of St = 0.12, lower than the values for
a two-dimensional cylinder in the subcritical regime St ≈ 0.2 (see for instance Williamson,
1996), and for higher Reynolds numbers the flow seemed incoherent. The relative low aspect
ratio of his model, together with the complexity of the flow in the critical regime and the fact
that he did not measure at the cylinder mid-span might have contributed to the observation
of a rather incoherent flow at the end of the critical regime and in the super-critical zone.
In Lehmkuhl et al. (2014), a regular von-Karman vortex street was observed at every
Reynolds numbers in the critical regime, with the exception of Re = 3.8 × 10⁵ (corre-
sponding with the two-bubble asymmetric mode according to figure 6) where the flow loses
24
-2
-1.5
-1
-0.5
0
0.5
1
60 65 70 75 80 85 90 95
Cd, Cl
tUref/D
Cd
Cl
(a)
-0.2
0
0.2
0.4
0.6
0.8
1
60 65 70 75 80 85 90 95
Cd, Cl
tUref/D
Cd
Cl
(b)
-0.2
-0.1
0
0.1
0.2
0.3
0.4
60 65 70 75 80 85 90 95
Cd, Cl
tUref/D
Cd
Cl
(c)
-0.2
-0.1
0
0.1
0.2
0.3
0.4
60 65 70 75 80 85 90 95
Cd, Cl
tUref/D
Cd
Cl
(d)
-0.2
-0.1
0
0.1
0.2
0.3
0.4
60 65 70 75 80 85 90 95
Cd, Cl
tUref/D
Cd
Cl
(e)
-0.2
-0.1
0
0.1
0.2
0.3
0.4
60 65 70 75 80 85 90 95
Cd, Cl
tUref/D
Cd
Cl
(f)
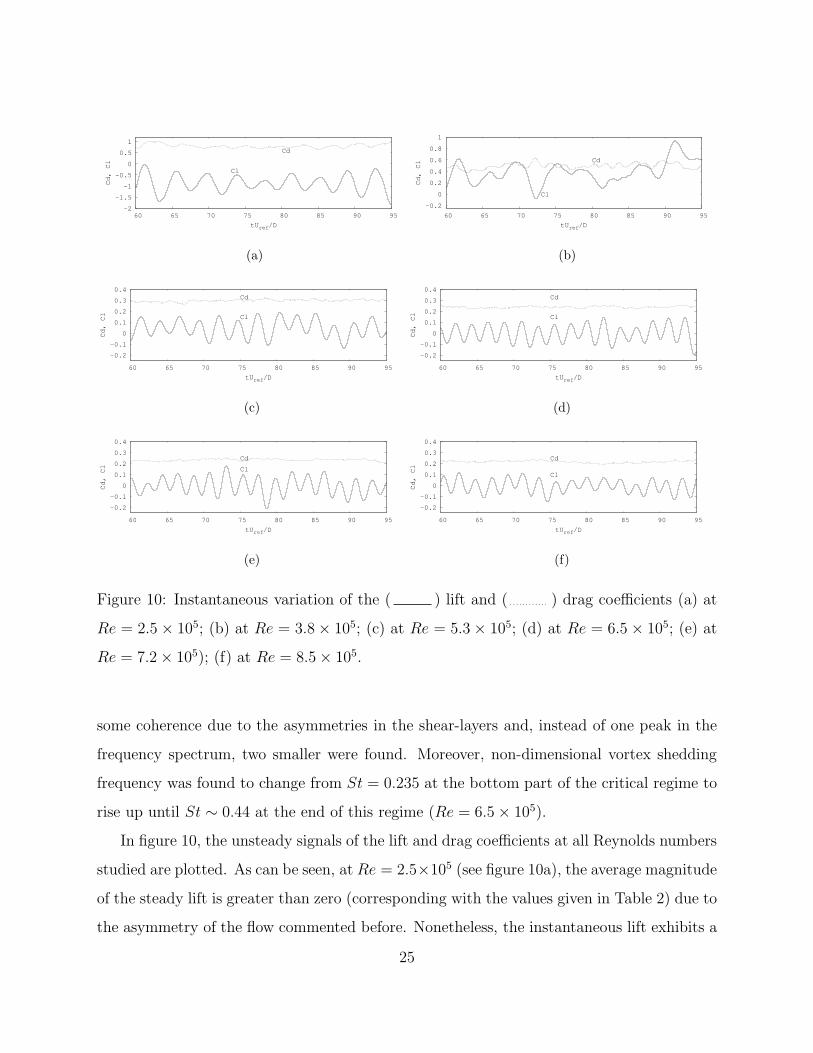
Figure 10: Instantaneous variation of the ( ) lift and ( ) drag coefficients (a) at
Re = 2.5 × 10⁵; (b) at Re = 3.8× 10⁵; (c) at Re = 5.3× 10⁵; (d) at Re = 6.5 × 10⁵; (e) at
Re = 7.2× 10⁵); (f) at Re = 8.5× 10⁵.
some coherence due to the asymmetries in the shear-layers and, instead of one peak in the
frequency spectrum, two smaller were found. Moreover, non-dimensional vortex shedding
frequency was found to change from St = 0.235 at the bottom part of the critical regime to
rise up until St ∼ 0.44 at the end of this regime (Re = 6.5× 10⁵).
In figure 10, the unsteady signals of the lift and drag coefficients at all Reynolds numbers
studied are plotted. As can be seen, at Re = 2.5×10⁵ (see figure 10a), the average magnitude
of the steady lift is greater than zero (corresponding with the values given in Table 2) due to
the asymmetry of the flow commented before. Nonetheless, the instantaneous lift exhibits a
25

0
0.1
0.2
0.3
0.4
0.5
0.6
104
105
106
CL rms
Re
Norberg (2003)
Fung (1960)
Schmidt (1965)
Figure 11: Fluctuating lift as a function of the Reynolds numbers. Comparison with avail-
able results. ( ) present results; (N) Schmidt (1965); (△) Fung (1960); ( ) results from
Norberg (2003); ( ) empirical function CL,rms = 0.09 + 0.43 exp[−105(Re/106)10] from
Norberg (2003). The dashed zone represents the bandwidth of the experimental measure-
ments.
periodic behaviour with a large magnitude in the amplitude of its fluctuations CL,rms ≈ 0.49.
This value, which is quite close to those measured in the sub-critical regime (see also figure
11), is also correlated to the wider wake width measured.
The changes in the critical regime; i.e. the increase in the base pressure, the steep drop
in the drag, amongst others; come also with an increase in the vortex shedding frequency
and a decrease in the vortex strength. Notice the change in scale between figures 10a and
10c-f. This is reflected in the average magnitude of lift fluctuations shown in figure 11. In
the figure, the experimental measurements by Fung (1960) and Schmidt (1965) together
with those summarised by Norberg (2003) for the sub-critical regime are also plotted as
reference. In general, the agreement is fair, the rapid decrease in the fluctuating lift is
well captured. Current results follow the trend predicted by the correlation proposed by
Norberg (2003) in the critical regime. In the super-critical regime, the fluctuating lift is
26

almost constant regardless of the Reynolds number. The present results fall between the
measurements by Fung (1960) and Schmidt (1965). In this regard, it should be commented
that Schmidt (1965) pointed out that these experimental differences might be due to facts
such as the model surface condition or end effects. Fung (1960) also reported the sensible
nature of lift fluctuations which could be altered by any small geometrical change or even
axial perturbations. Another issue to be here considered is the fact that both Fung (1960)
and Schmidt (1965) reported that the unsteady lift loads did not show any periodic behaviour
whatsoever. In the current simulations, the periodicity of the lift fluctuations can readily be
seen from the plots of figure 10, with the exception of Re = 3.8× 10⁵, where the coherence
in the signal is not that clear. This issue has been explained in Lehmkuhl et al. (2014), and
it is due to the randomness in the interaction between both shear-layers, as they both bend
towards the wake centreline but with different angles.
Figure 12 shows the power spectra of the lift fluctuations for all Reynolds numbers
studied. By means of the analysis of the spectra, the coherence (or lack thereof) of lift
fluctuations can be extracted. Out of Re = 3.8 × 10⁵, all spectra show a distinguishable
peak at the vortex shedding frequency. At Re = 3.8 × 10⁵, two peaks in the spectrum
are observed (see figure 12b) at St1 = 0.238 and St2 = 0.358, which agree with the values
obtained by means of the power spectra of velocity fluctuations at different stations in the
near wake (Lehmkuhl et al., 2014). This spectrum shows that the flow is in transition and
the coherence is almost lost. Vortex strength is lower than at Re = 2.5 × 10⁵, denoted by
the smaller peaks obtained. There are also fluctuations of low-frequency and high intensity
which is another indication of this transition in the flow.
At Re = 5.3× 10⁵, the symmetry in the flow is almost recovered and is reflected by the
high coherence of the signal in the spectrum. However, non-dimensional vortex shedding
frequency (St = 0.368) is lower than that at super-critical Reynolds numbers due to a wider
separation between both shear-layers caused by the lower base pressure and lower pressure
gradient (see also figure 8c vs. figures 8d-f).
In the super-critical regime, a steady plateau is reached, with vortex shedding about
St ≈ 0.44 at all Reynolds numbers. These observations are in good agreement with Schewe
27

0
0.015
0.03
0 0.1 0.2 0.3 0.4 0.5 0.6 0.7 0.8
fD/Uref
(f)
0
0.015
0.03
0 0.1 0.2 0.3 0.4 0.5 0.6 0.7 0.8
fD/Uref
(e)
0
0.015
0.03
0 0.1 0.2 0.3 0.4 0.5 0.6 0.7 0.8
fD/Uref
(d)
0
0.025
0.05
0 0.1 0.2 0.3 0.4 0.5 0.6 0.7 0.8
fD/Uref
(c)
0
0.1
0.2
0 0.1 0.2 0.3 0.4 0.5 0.6 0.7 0.8
fD/Uref
(b)
0
1
2
0 0.1 0.2 0.3 0.4 0.5 0.6 0.7 0.8
fD/Uref
(a)
Figure 12: Power spectra of the lift fluctuations at Reynolds numbers: (a) at Re = 2.5×10⁵;
(b) at Re = 3.8 × 10⁵; (c) at Re = 5.3 × 10⁵; (d) at Re = 6.5 × 10⁵; (e) at Re = 7.2 × 10⁵
and (f) at Re = 8.5× 10⁵.
28

0.1
0.2
0.3
0.4
0.5
105
106
St
Re
critical super-criticalsubcritical
Achenbach (1968)Schewe (1983)
Bearman (1969)present
Figure 13: Non-dimensional vortex shedding frequency at critical and super-critical Reynolds
numbers. Comparison with literature results. ( ) present LES; (*) Bearman (1969); (⊡)
Achenbach (1968); (N) Schewe (1983).
(1983). Contrary to other experimental results (e.g. Schmidt, 1965; Jones, 1968; Shih et al.,
1993) he did measure a periodic flow at super-critical Reynolds numbers. He also commented
that the super-critical regime was characterised by a very stable flow with low fluctuations
and a narrow band power spectrum of lift fluctuations. However, the value of lift fluctuations
reported in his work was of 0.02, which is lower than the values obtained in the present
computations.
The non-dimensional vortex shedding frequency obtained is summarised in figure 13 and
compared to those experimental results where vortex shedding was successfully measured.
The agreement is rather good though some scatter between them is observed, mainly due
to the critical nature of the flow in this range which makes more difficult the repeatability
of the results.
Roshko (1954) proposed a universal relation for the wake non-dimensional vortex shed-
ding based on the wake width dw, and he concluded that this universal Strouhal number is
St∗ = 0.164 regardless of the bluff body shape.
29

According to Roshko (1954),
St
St∗=
D
dw(1− Cpb)
1/2 (6)
Roshko (1961) used this scaling in the trans-critical regime and verified its validity,
though for the super-critical regime he was unable to corroborate it. He speculated whether
inaccurate measurements or the lack of coherence of the flow might be the cause why this
expression would not be suitable.
Using Roshko correlation, the ratio of the non-dimensional vortex shedding frequency
measured in the present numerical experiments to the non-dimensional vortex shedding
obtained (Stcorr) with equation 6 is evaluated. Results are plotted in figure 14. For the
particular case of Re = 3.8 × 10⁵, in which two frequencies were identified, the frequency
plotted is taken as the mean value. In spite of some scatter, one can observe that this
ratio is rather close to the unity for all Reynolds numbers. These observations extend
Roshko’s (1961) conclusions regarding the similarity of the vortex shedding phenomenon
in the trans-critical regime with that of the sub-critical regime, to both critical and super-
critical zones showing the continuity in the vortex shedding nature in the whole range of
Reynolds numbers. It is worth noting that in equation 6 the actual value of the wake width
was used, rather than obtain it from theoretical considerations as Roshko did.
Last but not the least, we would draw the attention to the onset of the instabilities in the
shear-layer. It was shown in Lehmkuhl et al. (2014) that in the critical regime, as long as
the attached boundary layers have not undergone turbulent, instabilities of the shear-layer
upon separation can be correlated to the vortex shedding frequency, following the correlation
proposed by Prasad and Williamson (1996). The same reasoning would be here applied for
the super-critical regime. Figure 15 depicts the ratio of the shear-layer instabilities to the
vortex shedding frequency fKH/fvs for all Reynolds numbers. It can be seen that fKH/fvs
follows the same trend in the super-critical regime as in the critical one. Thus, it would be
reasonable to suggest that this correlation might be valid for the whole super-critical regime,
where there is a laminar separation bubble followed by turbulent separation, up until fully
30

0
0.5
1
1.5
2
2.5×10⁵ 5.0×10⁵ 7.5×10⁵ 1.0×10⁶
St/Stcorr
Re
Figure 14: Ratio of the vortex shedding frequency to the vortex shedding obtained with
Roshko’s (1954) correlation (equation 6).
turbulent separation of the boundary layer takes place in the trans-critical regime.
4. Conclusions
The wake characteristics and the vortex shedding process in the flow past a circular
cylinder have been studied by means of large-eddy simulations for the range of Reynolds
numbers 2.5 × 10⁵ ≤ Re ≤ 8.5 × 10⁵, encompassing the critical and super-critical regimes.
In this range, three configurations are observed: i) one-bubble asymmetric mode, with flow
separation delayed on one side of the cylinder while the other remains sub-critical; ii) two-
bubble asymmetric mode, with a small second bubble starting to be formed and; iii) two-
bubble symmetric mode, with two symmetric bubbles on each side of the cylinder, which is a
characteristic trait of the super-critical regime. In the first two modes (occurring at critical
Reynolds numbers), the flow is asymmetric and the wake is bent towards the side with lower
pressure gradient. The average flow exhibits a two-eddy pattern, but vortices formed are
of different sizes and shapes. In the third mode (at super-critical Reynolds numbers), the
average wake is symmetric and the eddies formed are confined to the cylinder rearward, as
31

10
100
1000
2.5×10⁵ 5.0×10⁵ 1.0×10⁶
fKH/fvs
Re
0.0235Re0.67
Figure 15: Ratio of the shear-layer instability to the vortex shedding frequency as a
function of the Reynolds number. ( ) fKH/fvs = 0.0235Re0.67 correlation from
Prasad and Williamson (1996).
flow separation occurs at φs ≈ 148◦. In this mode, little changes in the wake configuration
are observed.
Lift fluctuations are found to decrease from a value of CL,rms ≈ 0.49 at the initial part
of the critical regime (at Re = 2.5 × 10⁵), close to those reported at the end of the sub-
critical regime (Norberg, 2003), to CL,rms ≈ 0.07 for the super-critical Reynolds numbers
(two-bubble symmetric flow). This drop in the fluctuating lift, also associated to the wake
narrowing, has been found to be in rather good agreement with experimental measurements.
In spite of the major changes occurring at these Reynolds numbers, evidence of the
wake vortex shedding has been obtained for all cases examined by means of the analysis
of the energy spectra of the lift fluctuations. The exception might be at Re = 3.8 × 10⁵
(two-bubble asymmetric mode) where coherence is considerably reduced due to the random-
like interaction of the bent shear-layers. However, coherence is rapidly recovered with the
symmetric formation of the second bubble. This has been observed as a narrow band peak
in the spectra, which moves towards higher frequencies as the Reynolds number increases
32

in the critical regime, to then remain almost constant about St ≈ 0.44 throughout the
super-critical regime. Furthermore, using the wake width measured as the vertical distance
between maximum stream-wise fluctuations, wake vortex shedding is found to follow the
universal scaling with the wake width proposed by Roshko (1954).
Following the observations made in Lehmkuhl et al. (2014), the shear-layer instability
mechanism seems to remain unaltered in the super-critical regime, as transition to turbulence
occurs upon separation. The ratio of the fundamental frequency of the shear-layer to the
wake vortex shedding shows the same dependency with the Reynolds number as proposed
by Prasad and Williamson (1996). It would then be reasonable to suggest that this might
remain valid for the whole super-critical regime as long as the attached boundary layer is
still laminar.
Acknowledgements
This work has been partially financially supported by the Ministerio de Economıa y
Competitividad, Secretarıa de Estado de Investigacion, Desarrollo e Innovacion, Spain (ref.
ENE2009-07689) and by the collaboration project between Universitat Politecnica de Cata-
lunya and Termo Fluids S.L. We acknowledge PRACE (project 2012071290) for awarding
us access to the MareNostrum III machine based in Barcelona, Spain.
AppendixA. Experimental details for measurements from the literature
A compilation of the measurement conditions for most of the experimental data presented
in this paper is given in table A.4. In the table, together with the range of Reynolds
numbers at which the experiments were carried out, the spanwise size of the model Lz/D,
the blockage ratio D/Ly, the roughness of the model ks/D, the inlet turbulence level Tu,
defined as Tu = urms/Uref , and the Mach number of the wind tunnel Ma are also given.
In most of these experiments the exact value of the surface roughness was not reported.
Instead, references to highly polished or smooth surfaces were reported, as seen in the table.
Notice that the experiments of Schmidt (1965) and Spitzer (1965) were performed with a
33

cantilevered cylinder. The conditions reported in the table for Wieselsberger (1922) are for
the cylinder of diameter 0.3m used in the critical regime.
Achenbach, E., 1968. Distribution of local pressure and skin friction around a circular cylin-
der in cross-flow up to Re=5e6. J. Fluid Mech 34, 625–639.
Achenbach, E., Heinecke, E., 1981. On vortex shedding from smooth and rough cylinders in
the range of Reynolds numbers 6e3 to 5e6. J. Fluid Mech 109, 239–251.
Afgan, I., Moulinec, C., Prosser, R., Laurence, D., 2007. Large eddy simulation of turbulent
flow for wall mounted cantilever cylinders of aspect ratio 6 and 10. International Journal
of Heat and Fluid Flow 28 (4), 561–574.
Bearman, P. W., 1965. Investigation of the flow behind a two-dimensional model with a blunt
trailing edge and fitted with splitter plates. Journal of Fluid Mechanics 21, 241–255.
Bearman, P. W., 1969. On vortex shedding from a circular cylinder in the critical Reynolds
number regime. J. Fluid Mech 37, 577–585.
Blackburn, H., 1994. Effect of blockage on spanwise correlation in a circular cylinder wake.
Experiments in fluids 18 (1–2), 134–136.
Blackburn, H., Melbourne, W., 1996. The effect of free-stream turbulence on sectional lift
forces on a circular cylinder. Journal of Fluid Mechanics 11, 267–292.
Bloor, M. S., Gerrard, J. H., 1966. Measurements on turbulent vortices in a cylinder wake.
Proceedings of the Royal Society A: Mathematical, Physical and Engineering Sciences
294 (1438), 319–342.
Borrell, R., Lehmkuhl, O., Trias, F. X., Oliva, A., 2011. Parallel direct Poisson solver for
discretisations with one Fourier diagonalisable direction. Computational Physics 230 (12),
4723–4741.
Braza, M., Perrin, R., Hoarau, Y., 2006. Turbulence properties in the cylinder wake at high
Reynolds numbers. Journal of Fluids and Structures 22, 757–771.
34
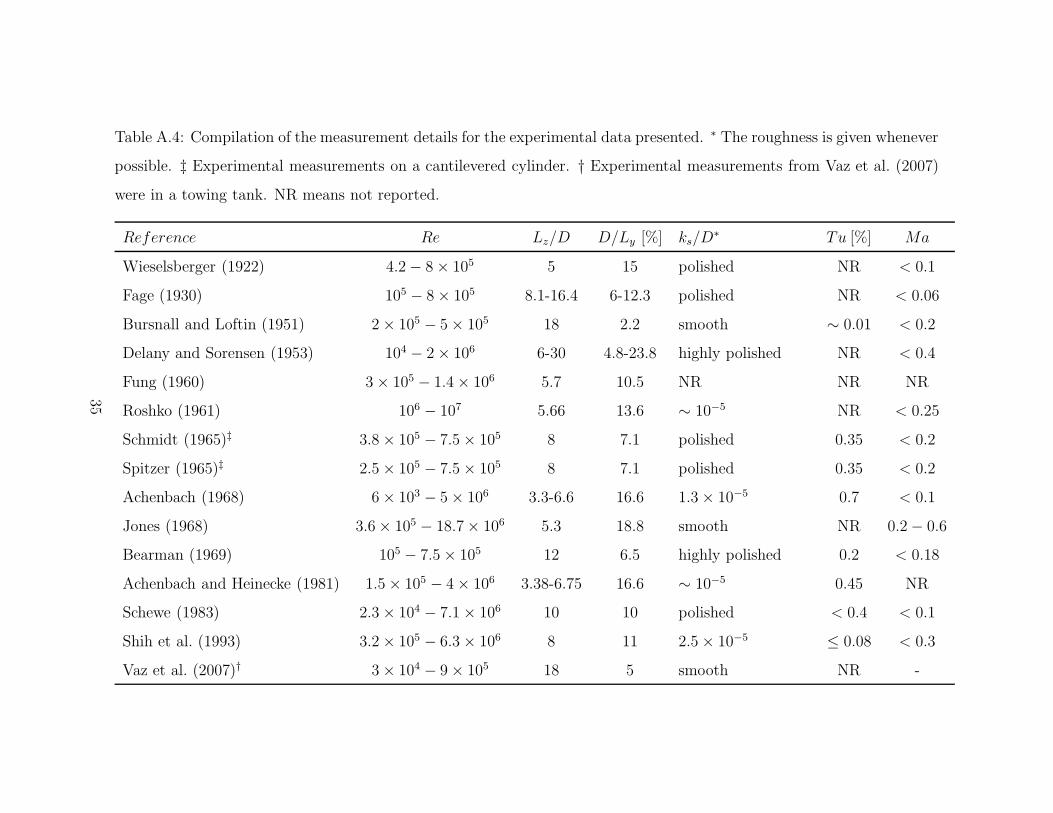
Table A.4: Compilation of the measurement details for the experimental data presented. ∗ The roughness is given whenever
possible. ‡ Experimental measurements on a cantilevered cylinder. † Experimental measurements from Vaz et al. (2007)
were in a towing tank. NR means not reported.
Reference Re Lz/D D/Ly [%] ks/D∗ Tu [%] Ma
Wieselsberger (1922) 4.2− 8× 10⁵ 5 15 polished NR < 0.1
Fage (1930) 105 − 8× 10⁵ 8.1-16.4 6-12.3 polished NR < 0.06
Bursnall and Loftin (1951) 2× 10⁵ − 5× 10⁵ 18 2.2 smooth ∼ 0.01 < 0.2
Delany and Sorensen (1953) 104 − 2× 10⁶ 6-30 4.8-23.8 highly polished NR < 0.4
Fung (1960) 3× 10⁵ − 1.4× 10⁶ 5.7 10.5 NR NR NR
Roshko (1961) 106 − 107 5.66 13.6 ∼ 10−5 NR < 0.25
Schmidt (1965)‡ 3.8× 10⁵ − 7.5× 10⁵ 8 7.1 polished 0.35 < 0.2
Spitzer (1965)‡ 2.5× 10⁵ − 7.5× 10⁵ 8 7.1 polished 0.35 < 0.2
Achenbach (1968) 6× 10³ − 5× 10⁶ 3.3-6.6 16.6 1.3× 10⁻⁵ 0.7 < 0.1
Jones (1968) 3.6× 10⁵ − 18.7× 10⁶ 5.3 18.8 smooth NR 0.2− 0.6
Bearman (1969) 105 − 7.5× 10⁵ 12 6.5 highly polished 0.2 < 0.18
Achenbach and Heinecke (1981) 1.5× 10⁵ − 4× 10⁶ 3.38-6.75 16.6 ∼ 10−5 0.45 NR
Schewe (1983) 2.3× 10⁴ − 7.1× 10⁶ 10 10 polished < 0.4 < 0.1
Shih et al. (1993) 3.2× 10⁵ − 6.3× 10⁶ 8 11 2.5× 10⁻⁵ ≤ 0.08 < 0.3
Vaz et al. (2007)† 3× 10⁴ − 9× 10⁵ 18 5 smooth NR -
35

Breuer, M., 2000. A challenging test case for large eddy simulation: high Reynolds number
circular cylinder flow. International Journal of Heat and Fluid Flow 21 (5), 648–654.
Bursnall, W., Loftin, L. J., 1951. Experimental investigation of the pressure distribution
about a yawed circular cylinder in the critical Reynolds number range. Tech. Rep. NACA
TN2463, NACA.
Cantwell, B., Coles, D., 1983. An experimental study of entrainment and transport in the
turbulent near wake of a circular cylinder. Journal of Fluid Mechanics 136, 321–374.
Catalano, P., Wang, M., Iaccarino, G., Moin, P., 2003. Numerical simulation of the flow
around a circular cylinder at high Reynolds numbers. International Journal of Heat and
Fluid Flow 24 (4), 463–469.
Delany, N., Sorensen, N., 1953. Low-speed drag of cylinders of various shapes. Tech. Rep.
NACA TN3038, NACA.
Dryden, H., Heald, R., 1926. Investigation of turbulence in wind tunnels by a study of the
flow about cylinders. Tech. Rep. 231, National Advisory Committee for Aeronautics.
Fage, A., 1930. Drag of circular cylinders and spheres. Tech. Rep. R&M 1370, Aeronautical
Research Council.
Fung, Y., 1960. Fluctuating lift and drag acting on a cylinder in a flow at supercritical
Reynolds numbers. Journal of the aerospace science 27 (11), 801–814.
Humphreys, J. S., 1960. On a circular cylinder in a steady wind at transition Reynolds
numbers. Journal of Fluid Mechanics 9 (4), 603–612.
Jofre, L., Lehmkuhl, O., Ventosa, J., Trias, F. X., Oliva, A., 2014. Conservation properties
of unstructured finite-volume mesh schemes for the navier-stokes equations. Numerical
Heat Transfer, Part B: Fundamentals 54 (1), 53–79.
36

Jones, G. W., 1968. Steady lift forces generated by vortex shedding about a large, stationary,
and oscillating cylinder at high Reynolds numbers. In: Fluids Engineering Conference. Vol.
ASME PAPER 68-FE-36.
Karabelas, S., 2010. Large Eddy Simulation of high-Reynolds number flow past a rotating
cylinder. International Journal of Heat and Fluid Flow 31 (4), 518–527.
Lehmkuhl, O., Rodrıguez, I., Borrell, R., Chiva, J., Oliva, A., 2014. Unsteady forces on a
circular cylinder at critical Reynolds numbers. Physics of Fluids 26 (12), 125110.
Moussaed, C., Salvetti, M. V., Wornom, S., Koobus, B., Dervieux, A., 2014. Simulation
of the flow past a circular cylinder in the supercritical regime by blending RANS and
variational-multiscale LES models. Journal of Fluids and Structures 47, 114–123.
Nicoud, F., Ducros, F., 1999. Subgrid-scale stress modelling based on the square of the
velocity gradient tensor. Flow, Turbulence and Combustion 62, 183–200.
Norberg, C., 1986. Interaction between freestream turbulence and vortex shedding for a
single tube in cross-flow. Journal of Wind Engineering and Industrial Aerodynamics 23,
501–514.
Norberg, C., 2003. Fluctuating lift on a circular cylinder: review and new measurements.
Journal of Fluids and Structures 17 (1), 57–96.
Park, C.-W., Lee, S.-J., 2000. Free end effects on the near wake flow structure behind a
finite circular cylinder. Journal of Wind Engineering and Industrial Aerodynamics 88 (2-
3), 231–246.
Polhamus, E. C., 1984. A review of some Reynolds number effects related to bodies at high
angle of attack. Tech. Rep. NASA Contractor Report 3809, NASA.
Prasad, A., Williamson, C. H. K., 1996. The instability of the separated shear layer from a
bluff body. Physics of Fluids 8, 1347.
37

Relf, E., Simmons, L., 1924. On the frequency of the eddies generated by the motion of
circular cylinders through a fluid. Reports and Memoranda 917, Aeronautical Research
Council.
Rodrıguez, I., Borrell, R., Lehmkuhl, O., Perez-Segarra, C. D., Oliva, A., 2011. Direct
numerical simulation of the flow over a sphere at Re = 3700. Journal of Fluid Mechanics
679, 263–287.
Roshko, A., 1954. On the drag and shedding frequency of two-dimensional bluff bodies.
Tech. Rep. TN3169, National Advisory Committee for Aeronautics.
Roshko, A., 1961. Experiments on the flow past a circular cylinder at very high Reynolds
number. Journal of Fluid Mechanics 10 (3), 345–356.
Schewe, G., 1983. On the force fluctuations acting on a circular cylinder in crossflow from
subcritical up to transcritical Reynolds numbers. Journal of Fluid Mechanics 133, 265–285.
Schmidt, L. V., 1965. Measurements of fluctuating air loads on a circular cylinder. Journal
of Aircraft 2 (1), 49–55.
Shih, W., Wang, C., Coles, D., Roshko, A., 1993. Experiments on flow past rough cir-
cular cylinders at large Reynolds numbers. Journal of Wind Engineering and Industrial
Aerodynamics 49, 351–368.
Spitzer, R., 1965. Measurements of unsteady pressures and wake fluctuations for flow over a
cylinder at supercritical Reynolds number. Ph.D. thesis, California Institute of Technology.
Szechenyi, E., 1975. Supercritical Reynolds number simulation for two-dimensional flow over
circular cylinders. Journal of Fluid Mechanics 70, 529–542.
Trias, F. X., Lehmkuhl, O., 2011. A self-adaptive strategy for the time integration of Navier-
Stokes equations. Numerical Heat Transfer. Part B 60 (2), 116–134.
38

Trias, F. X., Lehmkuhl, O., Oliva, A., Perez-Segarra, C. D., Verstappen, R. W. C. P., 2014.
Symmetry-preserving discretization of Navier-Stokes equations on collocated unstructured
grids. Journal of Computational Physics 258, 246–267.
Van Nunen, J., 1974. Pressure and forces on a circular cylinder in a cross flow at high
Reynolds numbers. In: Springer-Verlag (Ed.), Flow Induced Structural Vibrations. Berlin,
pp. 748–754.
Vaz, G., Mabilat, C., van der Wal, R., Gallagher, P., 2007. Viscous flow computations on
smooth cylinders: A detailed numerical study with validation. In: 26th International Con-
ference on Offshore Mechanics and Artic Engineering. OMAE2007. San Diego, California.
Verstappen, R. W. C. P., Veldman, A. E. P., 2003. Symmetry-preserving discretization of
turbulent flow. Journal of Computational Physics 187, 343–368.
West, G., Apelt, C., 1981. Blockage and aspect ratio effects on flow past a circular cylinder
for 104 < Re < 105. Tech. Rep. No. CE 29, University of Queensland.
Wieselsberger, C., 1922. New data on the laws of fluid resistance. Tech. Rep. TN-84, NACA.
Williamson, C. H. K., 1996. Vortex dynamics in the cylinder wake. Annual Review of Fluid
Mechanics 28 (1), 477–539.
Zan, S., 2008. Experiments on circular cylinders in crossflow at Reynolds numbers up to 7
million. Journal of Wind Engineering and Industrial Aerodynamics 96 (6-7), 880–886.
39


