
https://biointerfaceresearch.com/ 10510
Article
Volume 11, Issue 3, 2021, 10510 - 10532
https://doi.org/10.33263/BRIAC113.1051010532
Optimization of Roasting Conditions on the Bioactive
Compounds and their Antioxidant Power from Opuntia
fiscus-Indica Seeds using Response Surface Methodology
(RSM)
Chakir El Guezzane 1 , Hamza El Moudden 1 , Hicham Harhar 1 , Ismail Warad 2 , Abdelkabir
Bellaouchou 1 , Abdallah Guenbour 1 , Abdelkader Zarrouk 1,* , Mohamed Tabyaoui 1
1 Laboratory of Materials,Nanotechnology and Environment, Faculty of Sciences, Mohammed V University, P.O. Box1014
Agdal-Rabat, Morocco 2 Department of Chemistry and Earth Sciences, PO Box 2713, Qatar University, Doha, Qatar
* Correspondence: [email protected];
Scopus Author ID 36125763200
Received: 14.09.2020; Revised: 25.10.2020; Accepted: 26.10.2020; Published: 31.10.2020
Abstract: This work is aimed to optimize the effects of different roasting factors on the bioactive
compound’s antioxidant capabilities of opuntia ficus indica seeds by using DPPH and ABTS assays.
The Box-Behnken design (BBD) was applied to optimize the roasting temperature (X1:60-200 °C),
roasting time (X2:10-50 min), and extraction time (X3: 3–6h). The optimal conditions of roasting
applied in order to optimize the greatest content of the responses were: TPC (Total Phenolic Content):
X1:200 °C, X2: 50 min, and X3: 5.49 h with 103.5±0.76 GAE/g extract experimental response, TFC
(Total Flavonoids content): X1:200°C, X2:50min, and X3:3.16 h with 104.29±0.54 mg QE/g extract
experimental response, TTC (Total Condensed Tannins Content ): X1: 200°C, X2: 50min, X3: 6h with
10,16±0.89 mg QAE/g extract experimental response, TSC ( Total Sugars Content ): X1: 60°C, X2:50
min, X3:5.12 h with 40.35±0.99 mg D-Glu E/g extract an experimental response. The maximal
antioxidant power by DPPH and ABTS assays was recorded at a strong temperature of roasting.
Moreover, the significant correlations were obtained by the principal component analysis (PCA), the
first step, between the bioactive compounds, and on the second step, between their antioxidant
capacities (DPPH, ABTS). Hierarchical Cluster Analysis (HCA) classified extracts into three clusters
on the basis of measured antioxidant activity characteristics. Therefore, the result of this work indicates
that roasted Opuntia ficus Indica seeds could be used as a significant human nutrient.
Keywords: Seeds; Box-Behnken design; roasting, antioxidant activity; polyphenols; DPPH;
ABTS;Opuntia ficus indica.
© 2020 by the authors. This article is an open-access article distributed under the terms and conditions of the Creative
Commons Attribution (CC BY) license (https://creativecommons.org/licenses/by/4.0/).
1. Introduction
Opuntia ficus – Indica is notorious under the name of prickly pear; it belongs to the
family of Cactaceae. It adapts well to arid and semi-arid conditions. It is also well spread in the
Mediterranean region, Mexico, and South Africa [1–3]. Additionally, it is an important plant
in the agricultural economies and has been cultivated since old periods [4,5]. Furthermore,
prickly pears have been used for a long time in traditional medicine. Recent research showed
that domestic use of seeds, fruits, and vegetables had a strong positive correlation in the
prevention of modern diseases such as diabetes, cancer, and arthritis [6,7]. The seeds are
https://doi.org/10.33263/BRIAC113.1051010532
https://biointerfaceresearch.com/ 10511
considered an essential source of nutritional values, such as flavonoids, polyphenols, fatty
acids, and tannins, and their quantities are higher than in the fruit pulp[8]. In addition, they
contain about 10 to 15 % of the edible pulp and are often discarded as waste after extraction
from the pulp [9]. Roasting the seeds has numerous benefits such as promoting flavor, aroma,
change the color and texture of roasted seeds, as well as eliminating unwanted microorganisms
and food contaminants. Furthermore, they are known for deactivating enzymes that can
accelerate the loss of nutrients and extending the duration of product life. In order to preserve
the beneficial constituents of the seeds, the duration and temperature of roasting are considered
the most important conditions [10–12]. Moreover, a number of research investigations have
shown that the phenolic profile of different edible ingredients can be made of more health
benefits by increasing their antioxidant capabilities [11]. This beneficial result is dependent on
the grain considered and the roasting conditions utilized. During the roasting, the antioxidant
compounds can degrade, and the formation of new products named Maillard reaction products
(MRP) is observed. Degradation can influence antioxidant significantly [13]. Several studies
assessed the effects of roasting on bioactive composition and antioxidant capabilities from
various vegetable plants and seeds[14,15]. And it was found that the optimization of roasting
conditions for seeds from Opuntia ficus Indica can significantly improve the antioxidant
activity. Therefore systematic and precise optimization protocols for extraction and roasting
conditions are required to maintain the bioactive and antioxidant activities precisely. Response
Surface Methodology (RSM) is a statistical technique used to optimize the suggested protocols
as it uses quantitative variables (roasting parameters) with an adequate experimental design to
evaluate the effects of these parameters and their inherent interaction. Box-Behnken design
(BBD) is an RSM capable of the generation of a mathematical model, taking into account the
effect of the potential interactions among the factors under testing while keeping the number
of experiments to be carried out minimized [14,16]. Therefore, the objective of the present
work is to apply the RMS methodology and to investigate the effect of several factors such as
the temperature of the roasting process, the duration of roasting, and the duration of extraction
in order to optimize TCP (Total Phenolic Content), TFC (Total Flavonoids Content), TTC
(Total Condensed Tannins Content), TSC (Total Sugars Content), and the antioxidant activity
by DPPH and ABTS assays of Opuntia ficus Indica seeds. The correlation between the
bioactive molecules and their antioxidant capabilities is evaluated by the Principal Component
Analysis (PCA). A Hierarchical Cluster Analysis (HCA) was used to construct three clusters
based on their bioactive compounds and antioxidant capacities.
2. Materials and Methods
2.1. Vegetals materials sites.
The plant seeds from Opuntia ficus Indica were harvested in the summer in the period
between July and September 2019 in the Taza city region located in the East-North of Morocco.
2.2. Preparation of experimental extracts and extraction of antioxidant compounds.
After the material vegetal is collected (seeds), the seeds were isolated using water and
dried in the dark at room temperature for 72 hours. Afterward, they are placed in an aluminum
paper and roasted in a forced hot-air convection oven at different temperatures (60°C, 130°C,
200°C) for various durations (10,30,50min). The seeds were then crushed using a grinder. The
resulting fine powder is stored at room temperature in an airtight container. Next, 50 g of fine

https://doi.org/10.33263/BRIAC113.1051010532
https://biointerfaceresearch.com/ 10512
powder was extracted with ethanol solvent distilling between 40°C and 60 °C in a soxhlet. The
solvent was evaporated by a rotary evaporator. The extract was stored at a temperature of about
4 °C for subsequent analysis.
2.3. Chemicals and reagents.
The chemical reagents used in this work are classified as follows: 2,2’-azino-bis (3-
ethyl benzthiazoline-6-sulphonic acid), 2, 2-diphenyl-1-pycridazil (DPPH .90%), Ascorbic
acid, aluminum chloride (ALCL3), 2-thiobarbituric acid (TBA), KH2PO4, K2HPO4, sulfuric
acid, potassium persulphate, phenol, ethylene-diamine, tetraacetic acid, Folin-Ciocalteau‘s
phenol reagent, sodium carbonate, sodium acetate, aluminum chloride, sodium hydroxide,
ethanol, methanol, ferrous sulfate, ferric chloride, and 2,4,6-Tris (1-pyridyl )-5-traizine
(TPTZ).
2.4. Total phenolic content (TPC).
The polyphenol content was done by the assay of Singleton et al. 1999[17], 200 μl gent
of seeds extracts was added to 1.5 ml of Folin-Ciocalteu reagent (10% diluted). After about 4
minutes of dilution, 1.5 ml of 5% sodium carbonate (Na2CO3) was added to the mixture and
left in darkness. The results were collected after 2 hours by a spectrophotometer at 750 nm.
The concentration of TPC was obtained according to a calibration interval using Galic Acid (0-
100 µg/ml). The concentration of total polyphenols is expressed milligrams equivalent of a
Gallic Acid gram of extract (mg EGA / g extract).
2.5. Total flavonoids content (TFC).
The aluminum trichloride (AlCl3) assay described byYeddes et al., 2013[18], is used to
quantify the flavonoids in our extracts. One mL of each sample diluted is mixed with one ml
of a solution of Aluminum chloride (AlCl3) diluted to 2% in methanol. Consequently, the
absorbance was measured at 430 nm after 10 minutes of the start of the reaction. Quercetin was
used to establish a calibration curve. Therefore, the TFC was expressed in milligrams
equivalent of quercetin per gram of extract (mg EQ / g extract).
2.6. Total condensed tannins content (TTC).
The analysis of TTC was obtained by Sun et al., 1998 [19]. 50 ml of diluted extract (50-
600 µg/mL), 3 mL of 4% vanillin solution in methanol, and 1.5 of concentrated H2SO4 were
added. The mixture was allowed to stand for 15 min, and the absorbance was measured at 430
nm, using catechin to establish a calibration curve. The TTC was expressed in mg catechin
equivalent (CE) per gram of extract.
2.7. Total sugars content (TSC).
The TSC of Opuntia ficus Indica seeds extract was determined by Chaiwut et al. [20].
We used the phenol-sulfuric acid method. One mL of each extract was added to 1mL of
aqueous phenol 5%. Then 5 mL of sulphuric acid was added to the mixture. After that, the
mixture was incubated at 50°C for 20 min. The absorbance was read at 490 nm. The TTC was
determined by a linear regression equation established using glucose. Therefore, the TSC was
expressed in milligrams equivalent of glucose per gram of extract (mg D-GluE/ g extract).

https://doi.org/10.33263/BRIAC113.1051010532
https://biointerfaceresearch.com/ 10513
2.8. Radical scavenging activity of DPPH (1-diphenyl picrylhydrazyl).
The free radical removal activity of the extracts was carried out using the method of
Zengin et al. 2015 [21] with slight modification. A stable free radical, DPPH, was used. 1mL
of each sample at different concentrations (50 to1000µg/ mL ) was added to 1 mL of DPPH
methanol solution at 0.1 mM and left to stand for 30 min at 27°C. Both DPPH and methanol
were used as controls. The mixture was incubated at 37°C in the dark for 20 min; after that, the
absorbance was collected at 517 nm. The antiradical activity was estimated according to the
following equation: % Radical scavenging activity DPPH = 1-[A sample / A control] x 100,
where A sample and A control are the absorbances of the sample and the control.
2.9. Radical cation inhibition activity (ABTS).
The radical cation activity of Opuntia ficus Indica extracts was estimated according to
the method of Yim et al., 2013[22]. 88 µ L of 140 mM of potassium persulfate (K2S2O8) was
mixed with 5 mL of 7 mM ABTS.+ solution. The solution was stored in the dark for 16 h at
room temperature. Then, the absorbance of the solution was adjusted using ethanol to
0.70±0.05 at 734 nm.10µL of Opuntia ficus Indica extract at different concentrations was
added to one mL of ABTS.+ solution (100 to 1000µg/mL). The absorbance was measured
against the blank reagent at 734 nm. The inhibition activity was determined by the following
equation: % Radical inhibition activity ABTS = 1-[A sample / A control] x 100 where A sample
and A control were the absorbances of the sample and the control.
2.10. Preparation of extracts according to the experimental design.
In this work, we used Box-Behnken Design(BBD); this technique consists of 15
experimental assays (Table 2). It was used for the optimization of roasting conditions and
extraction factors. Three factors (independent variables) were optimized, which are roasting
temperature, roasting time, and extraction time. These factors had 3 levels (-1,0,+1), which are
lower, medium, and higher, respectively. Table 1 presents the domains of variation and the
coded levels of the three variables. TPC, TTC, TFC, TSC, and the antioxidant capacity by
ABTS and DPPH assays were selected as the responses of model design (Y) of this work, and
they are mentioned in Table 2.
Table 1. Levels of the roasting factors by BBD.
Extraction Process Independent Variables Level
(-1) (0) (+1)
soxhlet process X1roastingtemperature(°C) 60 130 200
X2roasting time (min) 10 30 50
X 3 extraction time(h) 3 4.5 6
The regression coefficients (β) were generated by the adjustment of the experimental
results to a second-order polynomial model. The second-order polynomial model for response
surface analysis was presented as follows [23]:
Y = 𝛽0 + ∑𝛽𝑖𝑋𝑖 + ∑𝛽𝑖𝑖𝑋𝑖2 +∑𝛽𝑖𝑗𝑋𝑖𝑋𝑗 (1)
Where Y is the predicted response, as well as Xi and Xj were the independent variables.
Moreover, β0, βi, βii, and βij was the regression coefficient of the mode (constant, linear,
quadratic, and interactive effect), respectively. Furthermore, the analysis of variance
(ANOVA) was used to obtain these regression coefficients using JMP11(SW) software. P-

https://doi.org/10.33263/BRIAC113.1051010532
https://biointerfaceresearch.com/ 10514
value of the model, a p-value of lack of fit, coefficient of determination (R2), and coefficient
of adjustment (R2adj) were used to estimate the adequacy of the polynomial equation of the
response. The desirability function was used for multi-response prediction [24]. The
significance of all terms of the models was considered statistically different when the p-value
<0.05. The surface graphs (3D) were visualized by JMP 11 (SW ) software [25].
2.11. Principal component analysis (PCA), hierarchical cluster analysis (HCA), and matrix
correlation.
The Pearson correlations between TPC, TFC, TTC, TSC, DPPH, and ABTS were
performed by PCA, which represented the 15 samples according to their response values
graphically in order to enable visual correlation of the data depending on the nature of the
roasting condition and extraction time. HCA was performed to pursue the interrelatedness
between all extracts into clusters on the basis of measured bioactive compounds characteristics.
Moreover, the similarities between the analyzed extracts are represented in the form of
dendrograms generated by the XLSTAT 2014 software. The distances between extracts were
calculated using square Euclidean distances. This technique uses an analysis of variance
approach to evaluate the distances between clusters [26].
2.12. Data analysis.
Box-Behnken Design (BDD) was applied in order to optimize the roasting factors and
extraction time for extracts from Opuntia ficus Indica seeds using JMP 11 (SW) software.
Moreover, PCA, HCA, and Pearson correlations were performed using XLSTAT 2014
software[27,28]. The IBM SPSS Statistics 21 software was used to present the results in means
± standard error of the mean. The significance of the results used by the Tukey test at alpha
=0.05.
3. Results and Discussion
Optimization of roasting conditions and extraction time was carried out in 15
randomized trials. Table 2shows the data collected for TFC, TPC, TTC, TSC, ABTS (IC50),
and DPPH (IC50) of extracts seeds from Opuntia ficus Indica from Morocco.
3.1. Second-order polynomial model and interpretation of the response surface model of TPC
and TFC.
The TPC and TFCof extract seeds from Opuntia ficus Indica varied from 31.14±0.90
to 103.76 ±1.82 mg GAE / g extract and 26.14±0.98 to mgQE/g extract, respectively.
According to data from ANOVA for TPC and TFC (Table 3), the models were significant; their
p-value is <0.0001 and<0.0015, respectively. The coefficient of determination(R2) was
0.996167 and 0.976653 for TPC and TFC, respectively; these values indicated that the models
are adequate because R2 was more than 0.75[29].
Table 2. Results of TFC, TPC, TTC, TSC, ABTS (IC50), and DPPH (IC50) according to experimental design.
Run X1 X2 X 3 TPC TFC TTC TSC DPPHIC50 ABTS IC50
1 200 10 4.5 76.43±0.90a 83.286±0.802a 6.05±0.95ad 40.32±0.91ah 205.35±1.21a 711.89±2.1a
2 60 50 4.5 44.51±1.29b 38.45±0.71ib 1.23±0.20b 39.56±0.79a 321.43±1.29b 950.64±1.19b
3 60 30 3 34.86±1.12cf 30.14±0.86cg 1.61±0.29b 29.02±0.98be 430.67±1.19c 1090.15±1.95c
4 130 50 6 66.58±1.19d 48.54±1.40d 6.83±0.41ac 23.37±0.82c 210.26±1.08a 620.36±1.31d
5 130 30 4.5 56.46±0.80e 44.03±0.97bd 3.25±0.20be 30.17±0.93be 230.64±0.83d 684.23±1.11e

https://doi.org/10.33263/BRIAC113.1051010532
https://biointerfaceresearch.com/ 10515
Run X1 X2 X 3 TPC TFC TTC TSC DPPHIC50 ABTS IC50
6 60 30 6 39.29±0.81bf 43.38±1.30bd 1.41±0.31b 26.36±0.31bc 390.92±1.98e 1010.76±2.90f
7 200 30 6 90.71±1.10g 72.57±0.93e 7.76±0.79ac 10.35±0.32d 120.17±2.10f 445.48±0.91g
8 130 10 6 35.38±0.89cf 35.16±1.06igj 2.16±0.20b 27.93±0.97be 350.39±0.65g 914.91±1.99h
9 130 50 3 52.91±1.01e 39.54±1.29bj 3.12±0.18be 26.03±0.98bc 251.18±2.02h 736.93±1.03i
10 130 30 4.5 57.57±1.28e 46.97±0.98d 3.67±0.33dbe 31.26±0.68eg 231.53±1.19d 682.01±1.01e
11 200 50 4.5 103.76±1.82h 106.71±1.20f 9.12±0.90c 15.54±0.39f 76.91±0.99i 323.52±1.21j
12 60 10 4.5 28.26±1.09i 28.34±0.96c 1.54±0.30b 34.91±0.99g 491.27±2.11j 1157.36±2.11k
13 200 30 3 80.07±0.98a 98.86±1.10h 5.31±0.70ae 34.02±0.61g 171.73±1.09k 610.32±2.69l
14 130 10 3 31.14±0.90ci 26.14±0.98c 1.76±0.18b 44.62±0.79h 412.67±2.20l 1054.52±2.21m
15 130 30 4.5 56.03±1.01e 43.24±0.86bd 3.41±0.30dbe 29.46±0.48be 232.06±0.98d 681.09±1.02e
The results are expressed in the form of an average of 2 individual repetitions (n = 2e ± SEM). The mean followed by similar letters
exposing in the column are not different (P<0.05). TPC (mg GAE/g extract ) : TFC(mg QE/g extract) : TTC(mg QAE/g extract) ;
TSC(mg D-Glu E/g extract ) ;DPPHIC50(µg/ml) : ABTS IC50 (µg/ml); X1:roasting temperature(°C) ; X2: roasting time (min) ;
X3:extraction time (h).
Additionally, the adjusted determination coefficient Radj2 was 0.989267 and 0.934629 for
the TPC and TFC; respectively, this indicates that the models adequately presented the true
combination between all independents variables used. Moreover, the lack of fit was not
significant for TPC and TFC because their p-values were 0.0673 and 0.0536, respectively,
which indicated that the model equations were adequate for predicting the response values.
Equations (2) and (3) can predict the effect of independent variables on the content of TPC and
TFC, respectively. They were represented by a reduced regression model.
TPC(mgGAE/gextract) =56.686667+25.50625X1+12.06875X2+4.1225X3+2.77X1*X2+1.5525X1 *
X 3+2.3575X2 * X 3 +10.641667X1*X1-4.088333X2*X2-6.095833X3 * X 3 (2)
TFC (mg QE/g extract) = 44.746667+ 27.6395X1+7.53925X2+0.62125 X3+3.3285X1*X2 -9.8825X1 *
X 3-0.005X2 * X 3 +21.671167X1*X1-2.221333X2*X2 -5.180333X3 * X 3 (3)
The data of ANOVA for TPC (Table 2) showed that the factors X1, X2, and X3 had a
significant positive linear effect on TPC since their p-values were <0.0001, <0.0001, and
0.0043, respectively. Also, the quadratic effect X1 * X 1 had a significant positive effect (p-
value=0.0003). On the contrary, the quadratic effectsX2* X 2andX3 * X 3 had a significant
negative effect on TPC (p-value <0.05). Furthermore, no significant interaction between the
three factors tested was observed (Table 2).
Table 3. Data on the ANOVA of the regression coefficient and the terms of the model. Source Coef Sum of
square
Degree of
freedom
Mean square F-avlue p-avlue
TPC
Model 7236.7311 9 804.081 144.3821 <0.0001*
Constant 56.686667 <0.0001*
X1 25.50625 5204.5503 1 5204.5503 934.5376 <0.0001*
X2 12.06875 1165.2378 1 1165.2378 209.2320 0.0001*
X3 4.1225 135.9601 1 135.9601 24.4132 0.0043*
X1 * X2 2.77 30.6916 1 30.6916 5.5110 0.0658
X1 * X 3 1.5525 9.6410 1 9.6410 1.7312 0.2454
X2 * X 3 2.3575 22.2312 1 22.2312 3.9919 0.1022
X1 * X 1 10.641667 418.1356 1 418.1356 75.0811 0.0003*
X2 * X 2 -4.088333 61.7150 1 61.7150 11.0816 0.0208*
X3 * X 3 -6.095833 137.2031 1 137.2031 24.6364 0.0042*
Residual 27.8456 5 5.569
Total 7264.5767 14
Lack of fit 26.582725 3 8.86091 14.0330 0.0673
Pure Error 1.262867 2 0.63143
Total Error 27.845592 5
R2 0.996167
Radj2 0.989267
TFC

https://doi.org/10.33263/BRIAC113.1051010532
https://biointerfaceresearch.com/ 10516
Source Coef Sum of
square
Degree of
freedom
Mean square F-avlue p-avlue
Model 8955.6569 9 995.073 23.2404 0.0015*
Constant 44.746667 <0.0001*
X1 27.6395 6111.5357 1 6111.5357 142.7375 <0.0001*
X2 7.53925 454.7223 1 454.7223 10.6202 0.0225*
X3 0.62125 3.0876 1 3.0876 0.0721 0.7990
X1 * X2 3.3285 44.3156 1 44.3156 1.0350 0.3557
X1 * X 3 -9.8825 390.6552 1 390.6552 9.1239 0.0294*
X2 * X 3 -0.005 0.0001 1 0.0001 0.0000 0.9988
X1 * X 1 21.671167 1734.0534 1 1734.0534 40.4996 0.0014*
X2 * X 2 -2.221333 18.2190 1 18.2190 0.4255 0.5430
X3 * X 3 -5.180333 99.0862 1 99.0862 2.3142 0.1887
Residual 214.0830 5 42.817
Total 9169.7398 14
Lack of fit 206.35613 3 68.7854 17.8042 0.0536
Pure Error 7.72687 2 3.8634
Total Error 214.08300 5
R2 0.976653
Radj2 0.934629 * Significant at p-value<0.05
Concerning the results of ANOVA for TFC, the roasting temperature (X1) and roasting
time (X2) had a positive linear effect on TFC (p-value<0.05). However, the extraction time
(X3) was not significant (p-value>0.05). In addition ,the interaction effect between X1 and X3
had a significant negative effect on TFC (p-value>0.05). Furthermore, the quadratic effect of
roasting temperature (X1) had a significant negative effect on TFC (p-value=0.0014).
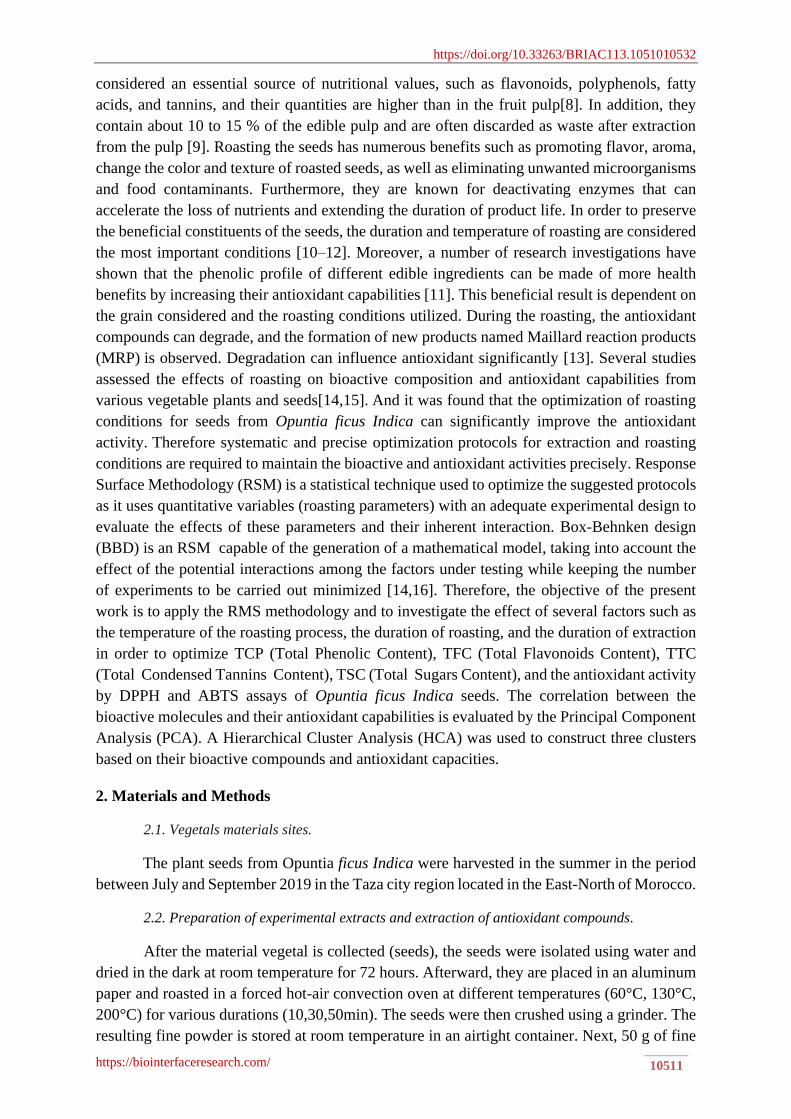
3.2. Response surface methodology(RSM) analysis.
The effects of three factors: roasting temperature, roasting time, and extraction time, as
well as their interaction and quadratic effect on TPC and TFC were visualized on response
surface (3D) plots shown in Figure1. Accordingly, Figure 1a shows TPC as a function of
roasting temperature (X1) and roasting time (X2) at fixed extraction time (X3) (6h). It showed
that TPC rapidly increased when the roasting temperature (X1) increased at a roasting time
(X2) fixed, as well as it increased gradually when the roasting time (X2) increased and reached
an optimum in the region close to 200°C and50min. Figure 1b shows the effect of roasting
time (X2) and extraction time (X3) at fixed roasting temperature (200°C) on the TPC; the TPC
increased with increasing extraction time(X3) when the roasting time (X2) was fixed, as well
as, it increased gradually when the extraction time increased before passing 5h of extraction,
after that, it decreased. The effect of roasting temperature (X1) and extraction time (X3) at a
fixed roasting time (X2) (50°C) is shown in Figure 1c; accordingly, TFC increased with
increasing roasting time when the extraction time was fixed. Also, when the roasting
temperature was fixed, the TFC increased before the extraction time increased at 5h; after that,
it decreased marginally. Moreover, the optimization of the response values was carried out
according to desirability function (d) in order to achieve the optimal response for TPC, for
instance. The optimum response for TPC was found when the desirability was close to 1 (Figure
4)[24,30,31]. Therefore, the optimum of TPC was at roasting temperature 200 °C, roasting time
50 min, and extraction time 5.49 h with 106.2311mg GAE/g extract predicted response and
desirability d=0.94(Figure. 4a). These results were consistent with the previous studies of TPC.
Chandrasekara and Shahidi,2011[32] indicated that the roasting at high temperatures (130°C)
for 33 min increased the TPC significantly more than the raw seeds (testa, cashew nuts). Also,
the TPC (in both water and ethanol) from peanut skin increased by about35% relative to the
raw sample at a roasting temperature of 175 °C for 5 min[33]. Moreover, in the study done by
https://doi.org/10.33263/BRIAC113.1051010532
https://biointerfaceresearch.com/ 10517
Locatelli et al. [34], the TPC of hazelnut skin(extract soluble ) increased at 180°C for 20 min
more than 10 min. In addition, Yin et al. [35] showed that the TPC increased about 2.4-3.4
times at a temperature between 120°C and 140°C for 180 min. Moreover, the TPC
significantly increased (p-value <0.05) at a heat treatment [36].
Concerning the TFC, Figure 1d shows the response surface plot of roasting temperature
(X1) and roasting time (X2) on the total flavonoids content when the extraction time (X3) was
fixed at 3 h. The TFC was stable when the roasting time was fixed, and the roasting temperature
increased between 60-120 °C; beyond 120 °C, the TFC quickly increased. Also, the TFC
slightly increased with increasing roasting time (X2) when the roasting temperature was fixed.
In addition, Figure 1e showed that the effect of roasting time (X2) and extraction time (X3) on
the TFC when the roasting temperature was fixed at 200°C; the TFC increased with the
increasing of the roasting time (X2) when the extraction time fixed, but, it decreased with the
increasing of the extraction time (X3) when the roasting time (X2) fixed.
(a) (d)
(b) (e)
(c) (f)
Figure 1. Response surface plots of roasting conditions of TPC (a, b, and c) and TFC (d, e, and f) of the Opuntia
ficus Indica seeds extracts.
Moreover, the effect of the roasting temperature (X1)and extraction time (X3) on the
TFC when the roasting time (X2) was fixed at 50°C (Figure1f), according to that, the TFC

https://doi.org/10.33263/BRIAC113.1051010532
https://biointerfaceresearch.com/ 10518
slightly increased with the increasing of extraction time when the X1 fixed. Also, the TFC
quickly increased with the increasing of roasting temperature when the X3 was fixed. The
strong level of TFC was recorded at a higher roasting temperature. Consequently, the maximum
of TFC was at roasting temperature200 °C, roasting time 50 min, and extraction time 3.16h
with 106.85 mgQE/g extract predicted response and the desirability is d=0.948(Figure 4b).
These results are similar to various works. Lin et al. [37] indicated that the TFC increased
significantly by roasting (after 5 min); in addition to that, the flavonoid aglycones and acids
are increased by the effects of roasting temperature and roasting time. Furthermore, a study
was done by Kumar et al.[48] showed that the fraction of sugar in flavonoids glycosides had
an essential role in antioxidant activity, and the aglycones had a strong effect on the antioxidant
activity more than the glycosides. The results of TPC and TFC of this study after the roasting
can be explained by these causes. First, the phenolic molecules can be degraded/polymerized
during the roasting, which showed the formation of new molecules; these molecules can be
more soluble in water and ethanol. Also, these molecules can be reagent with the Folin-
Ciocalteu in the alkaline middle [33]. Secondly, during the roasting, the bound compounds
bioactive can be released [39].
3.3. Second-order polynomial model and interpretation of the response surface model of TTC
and TSC.
In this work, the TTC and TSC of extract seeds from Opuntia ficus Indica varied from
1.23±0.20to 9.12±0.90mg QAE/g extract and from 10.35±0.32to 44.62±0.79 mg D-Glu E/g
extract, respectively. According to data of ANOVA presented in Table 4, the models were
significant because their p-value was 0.0023 and 0.0004 for TTC and TSC, respectively.
Table 4. Data of ANOVA of the regression coefficient and the terms of the model. Source Coef Sum of
square
Degree of
freedom
Mean square F-value p-value
TTC
Model 87.863198 9 9.76258 19.1480 0.0023*
Constant 3.4433333 0.0004*
X1 2.80625 63.000313 1 63.000313 123.5668 0.0001*
X2 1.09875 9.658013 1 9.658013 18.9429 0.0073*
X3 0.795 5.056200 1 5.056200 9.9171 0.0254*
X1 * X2 0.845 2.856100 1 2.856100 5.6019 0.0642
X1 * X 3 0.6625 1.755625 1 1.755625 3.4434 0.1227
X2 * X 3 0.8275 2.739025 1 2.739025 5.3722 0.0682
X1 * X 1 0.7983333 2.353241 1 2.353241 4.6156 0.0844
X2 * X 2 0.2433333 0.218626 1 0.218626 0.4288 0.5415
X3 * X 3 -0.219167 0.177356 1 0.177356 0.3479 0.5810
Residual 2.549242 5 0.50985
Total 90.412440 14
Lack of fit 2.4593750 3 0.819792 18.2446 0.0524
Pure Error 0.0898667 2 0.044933
Total Error 2.5492417 5
R2 0.971804
Radj2 0.921052
TSC
Model 1107.8079 9 123.090 38.2405 0.0004*
Constant 30.296667 <0.0001*
X1 -3.7025 109.66805 1 109.66805 34.0707 0.0021*
X2 -5.41 234.14480 1 234.14480 72.7421 0.0004*
X3 -5.71 260.83280 1 260.83280 81.0333 0.0003*
X1 * X2 -7.3575 216.53123 1 216.53123 67.2701 0.0004*
X1 * X 3 -5.2525 110.35503 1 110.35503 34.2842 0.0021*
X2 * X 3 3.5075 49.21022 1 49.21022 15.2882 0.0113*
X1 * X 1 -1.632083 9.83519 1 9.83519 3.0555 0.1409
X2 * X 2 3.9179167 56.67719 1 56.67719 17.6080 0.0085*

https://doi.org/10.33263/BRIAC113.1051010532
https://biointerfaceresearch.com/ 10519
Source Coef Sum of
square
Degree of
freedom
Mean square F-value p-value
X3 * X 3 -3.727083 51.29040 1 51.29040 15.9345 0.0104*
Residual 16.0942 5 3.219
Total 1123.9020 14
Lack of fit 14.450100 3 4.81670 5.8595 0.1492
Pure Error 1.644067 2 0.82203
Total Error 16.094167 5
R2 0.98568
Radj2 0.959904 * Significant at p-value<0.05
Moreover, the lack of fit was not significant (p-value >0.05), which indicated that the
models’equation was for p adequate for predicting the response values. In addition to that, the
R2values were 0.971804 and 0.98568 for TTC and TSC, respectively, which indicates that 97%
of experimental results were compatibles [40]. These values showed that the models adequately
presented the true combinations between all variables used. Furthermore, the adjusted
determination coefficients Radj2 were 0.921052 and 0.959904 for TTC and TSC, respectively,
which indicated that the models were adequate (Radj2>0.75)[29]. Consequently, the second-
order polynomial models were applied in equations 4 and 5 for TTC and TSC, respectively.
TTC(mgQAE/gextract) =3.4433333+2.80625X1+1.09875X2+0.795X3+0.845X1*X2+0.6625X1
*X 3+0.8275X2*X 3+0.7983333X1*X1+0.2433333X2*X2-0.219167X3 * X 3(4)
TSC(mgD-GluE/gextract) =30.296667-3.7025X1-5.41X2-5.71X3-7.3575X1*X2-5.2525X1
*X 3+3.5075X2 * X 3-1.632083X1*X1+3.9179167X2*X2-3.727083X3 * X 3(5)
According to Table 4, the linear effect of roasting temperature (X1), roasting time (X2),
and extraction time (X3) had a significant positive effect on TTC (p-value <0.05). Moreover,
the interaction effects between X1,X2, and X3were not significant on TTC (p-value> 0.05).
Also, the quadratic effect of three independent variables had no significance on TTC because
their p-value was 0.0844, 0.5415, and 0.5810 for X1, X2, and X3, respectively. As regards TSC,
the linear effect of roasting temperature, roasting time, and extraction time had a significant
negative effect (p-value < 0.05). Additionally that, the interaction effects X1 * X2 and X2 * X 3
had a significant negative effect on TSC (p-value > 0.05); on the contrary, the interaction effect
between roasting time and extraction time had a significant positive effect on TSC because of
its p-value is equal 0.0113. Furthermore, the quadratic effects X2*X 2 had a significant positive
effect on TSC (p-value =0.0085), but the quadratic effect of extraction time X3*X 3 had a
negative effect on TSC(p-value=0.0104). On the contrary, the quadratic effect of X2*X 2 was
not significant (p-value>0.05).
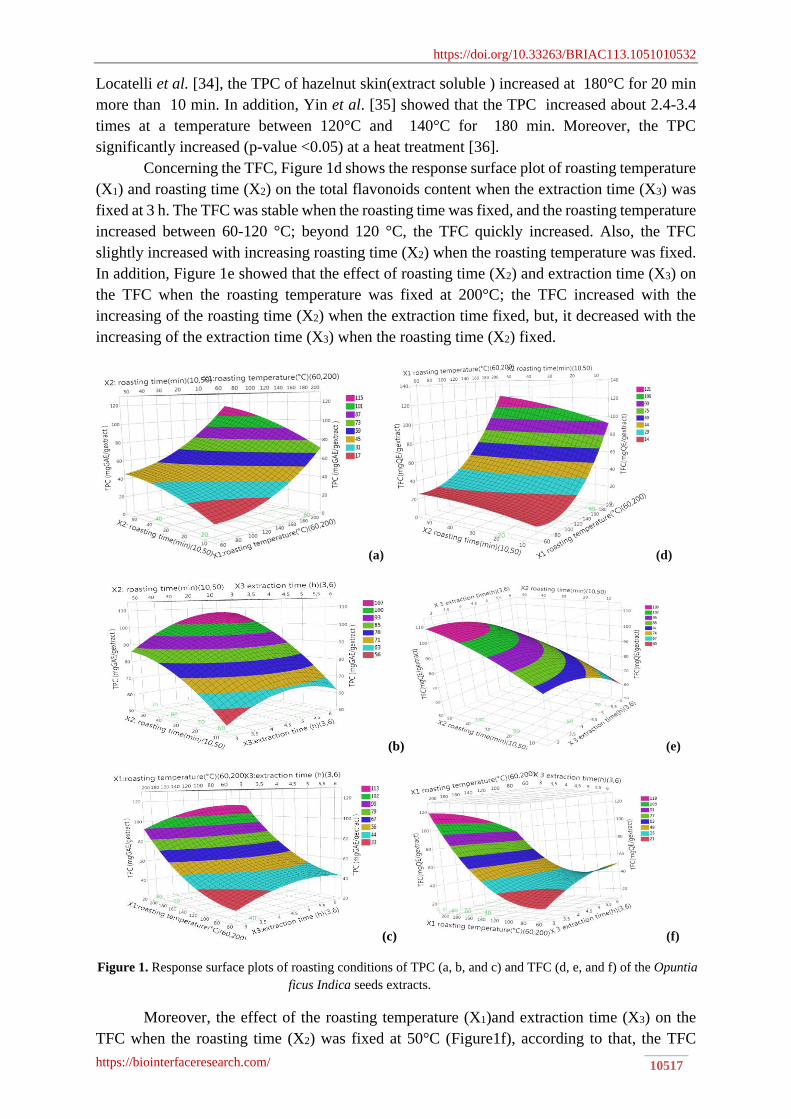
3.4. Response surface methodology (RSM) analysis.
The responses surfaces (3D) of regression equations 4 and 5 were established by RSM
to illustrate the effects of each independent variable studied on TTC and TSC (Figure 2).
According to that, Figure 2a shows the influence of roasting temperature (X1) and roasting time
(X2) on TTC when the extraction time (X3) was fixed at 6h. It noted that the TTC increased
with the increasing of the roasting temperature when the roasting time was fixed. Also, it is
shown that the roasting time (X2) had an influence on the TTC because the TTC slowly
increased with the increase of X2 when the X1was fixed. Moreover, the positive interaction
effectX1 * X2 on the TTC was observed. Figure 2b shows the effect of roasting time and
extraction time on the TTC when the X1 was fixed at 200°C. Thus, the positive interaction X2
https://doi.org/10.33263/BRIAC113.1051010532
https://biointerfaceresearch.com/ 10520
* X3 was recorded. Therefore, the TTC increased with the increase of the X2 and X1,
respectively. Figure 2c showed the effect of roasting time and extraction time on the TTC when
the roasting temperature was fixed at 50min. The positive effect of X2 and X3 on the TTC was
observed. Therefore, the TTC increased with the increase of two factors X1 and X2. It reached
a maximum of TTC in the region close to 50min and 6h. The maximum of TTC was at roasting
temperature: 200 °C, roasting time 50 min, extraction time6h with 11.30 mg QAE/g extract
predicted responses, and the desirability is d =0.99 (Figure 4c). These results are agreed with
those reported by Lin et al. [37]. They indicated that the ethanolic extracts had a strong level
in the TTC during the roasting (200 °C for 20 min).
Concerning the data of TSC, figure 2d shows the effect of roasting temperature and
roasting time on TSC when the extraction time fixed (6h); accordingly, the negative interaction
effect between X1 and X2 was recorded; thus, the optimum of TSC was observed in the region
at high temperature 200°C and less roasting time 10 min. Moreover, Figure 2e presents the
effect of roasting time and extraction time on the TSC when the roasting temperature was fixed
at 200°C; the TSC decreased with the increasing of the extraction time when the roasting time
fixed, the same effect when the X3 fixed.
(a) (d)
(b) (e)
(c) (f)
Figure 2. Response surface plots of roasting conditions of TTC (a,b, and c) and TSC (d, e, and f) of the
Opuntia ficus Indica seeds extracts.
https://doi.org/10.33263/BRIAC113.1051010532
https://biointerfaceresearch.com/ 10521
According to Figure 2f, who showed the influence of X1 and X3 on the TCS when the
X2 was fixed at 10min, the TSC quickly decreased with the increase of X3 when the X1 fixed,
but it slowly decreased when the increasing of X1 and X3 fixed. These results are similar to
work showed that the content of free sugar generally decreased with increasing roasting
temperature and time[41]. Because during the various roasting, nutrients such as carbonyl and
amino molecules can be degraded by non-enzymatic browning reactions [42,43]. Therefore,
the optimum ofTSC was at roasting temperature: 60 °C, roasting time 50 min, extraction time
5.12 h with 38.86 mg D-Glu E /g extract predicted responses, and the desirability is d
=0.81(Figure 4d).
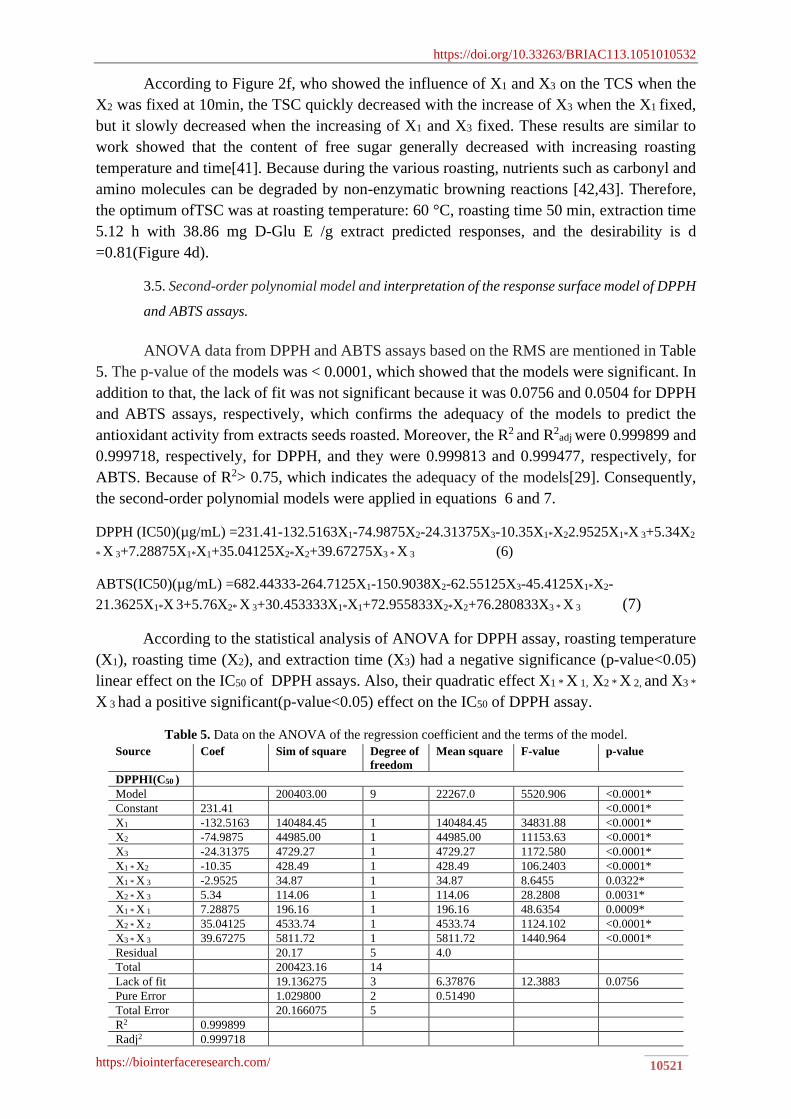
3.5. Second-order polynomial model and interpretation of the response surface model of DPPH
and ABTS assays.
ANOVA data from DPPH and ABTS assays based on the RMS are mentioned in Table
5. The p-value of the models was < 0.0001, which showed that the models were significant. In
addition to that, the lack of fit was not significant because it was 0.0756 and 0.0504 for DPPH
and ABTS assays, respectively, which confirms the adequacy of the models to predict the
antioxidant activity from extracts seeds roasted. Moreover, the R2 and R2adj were 0.999899 and
0.999718, respectively, for DPPH, and they were 0.999813 and 0.999477, respectively, for
ABTS. Because of R2> 0.75, which indicates the adequacy of the models[29]. Consequently,
the second-order polynomial models were applied in equations 6 and 7.
DPPH (IC50)(µg/mL) =231.41-132.5163X1-74.9875X2-24.31375X3-10.35X1*X22.9525X1*X 3+5.34X2
* X 3+7.28875X1*X1+35.04125X2*X2+39.67275X3 * X 3 (6)
ABTS(IC50)(µg/mL) =682.44333-264.7125X1-150.9038X2-62.55125X3-45.4125X1*X2-
21.3625X1*X 3+5.76X2* X 3+30.453333X1*X1+72.955833X2*X2+76.280833X3 * X 3 (7)
According to the statistical analysis of ANOVA for DPPH assay, roasting temperature
(X1), roasting time (X2), and extraction time (X3) had a negative significance (p-value<0.05)
linear effect on the IC50 of DPPH assays. Also, their quadratic effect X1 * X 1, X2 * X 2, and X3 *
X 3 had a positive significant(p-value<0.05) effect on the IC50 of DPPH assay.
Table 5. Data on the ANOVA of the regression coefficient and the terms of the model.
Source Coef Sim of square Degree of
freedom
Mean square F-value p-value
DPPHI(C50 )
Model 200403.00 9 22267.0 5520.906 <0.0001*
Constant 231.41 <0.0001*
X1 -132.5163 140484.45 1 140484.45 34831.88 <0.0001*
X2 -74.9875 44985.00 1 44985.00 11153.63 <0.0001*
X3 -24.31375 4729.27 1 4729.27 1172.580 <0.0001*
X1 * X2 -10.35 428.49 1 428.49 106.2403 <0.0001*
X1 * X 3 -2.9525 34.87 1 34.87 8.6455 0.0322*
X2 * X 3 5.34 114.06 1 114.06 28.2808 0.0031*
X1 * X 1 7.28875 196.16 1 196.16 48.6354 0.0009*
X2 * X 2 35.04125 4533.74 1 4533.74 1124.102 <0.0001*
X3 * X 3 39.67275 5811.72 1 5811.72 1440.964 <0.0001*
Residual 20.17 5 4.0
Total 200423.16 14
Lack of fit 19.136275 3 6.37876 12.3883 0.0756
Pure Error 1.029800 2 0.51490
Total Error 20.166075 5
R2 0.999899
Radj2 0.999718

https://doi.org/10.33263/BRIAC113.1051010532
https://biointerfaceresearch.com/ 10522
Source Coef Sim of square Degree of
freedom
Mean square F-value p-value
ABTS(IC50 )
Model 823930.42 9 91547.8 2976.325 <0.0001*
Constant 682.44333 <0.0001*
X1 -264.7125 1 -264.7125 18225.15 <0.0001*
X2 -150.9038 1 -150.9038 5922.736 <0.0001*
X3 -62.55125 1 -62.55125 1017.640 <0.0001*
X1 * X2 -45.4125 1 -45.4125 268.1903 <0.0001*
X1 * X 3 -21.3625 1 -21.3625 59.3467 <0.0001*
X2 * X 3 5.76 1 5.76 4.3146 0.0924
X1 * X 1 30.453333 1 30.453333 111.3268 0.0001*
X2 * X 2 72.955833 1 72.955833 638.9256 <0.0001*
X3 * X 3 76.280833 1 76.280833 698.4914 <0.0001*
Residual 153.79 5 30.8
Total 824084.21 14
Lack of fit 148.58192 3 49.5273 19.0071 0.0504
Pure Error 5.21147 2 2.6057
Total Error 153.79339 5
R2 0.999813
Radj2 0.999477 * Significant atp-value<0.05
Moreover, the interaction effect X2 * X 3 had a significant positive effect on DPPH (
IC50) because its p-value is equal 0.0031,on the contrary, the interaction effects X1 * X2 and X1
* X3 had a negative significant(p-value<0.05) effects on IC50 DPPH. Concerning data of
ANOVA for ABTS assay. The three factors X1, X2, and X3 had a negative linear effect on IC50
ABTS (p-value<0.05); in addition to that,their quadratic effects had a positive significant effect
on IC50 ABST(p-value<0.05). In addition to that, the interaction effect between roasting
temperature (X1) and extraction time (X3) had a significant negative effect on IC50 ABTS (p-
value<0.0001). On the contrary, the interaction effectX2 * X 3 had not significant because its p-
value is 0.0924.
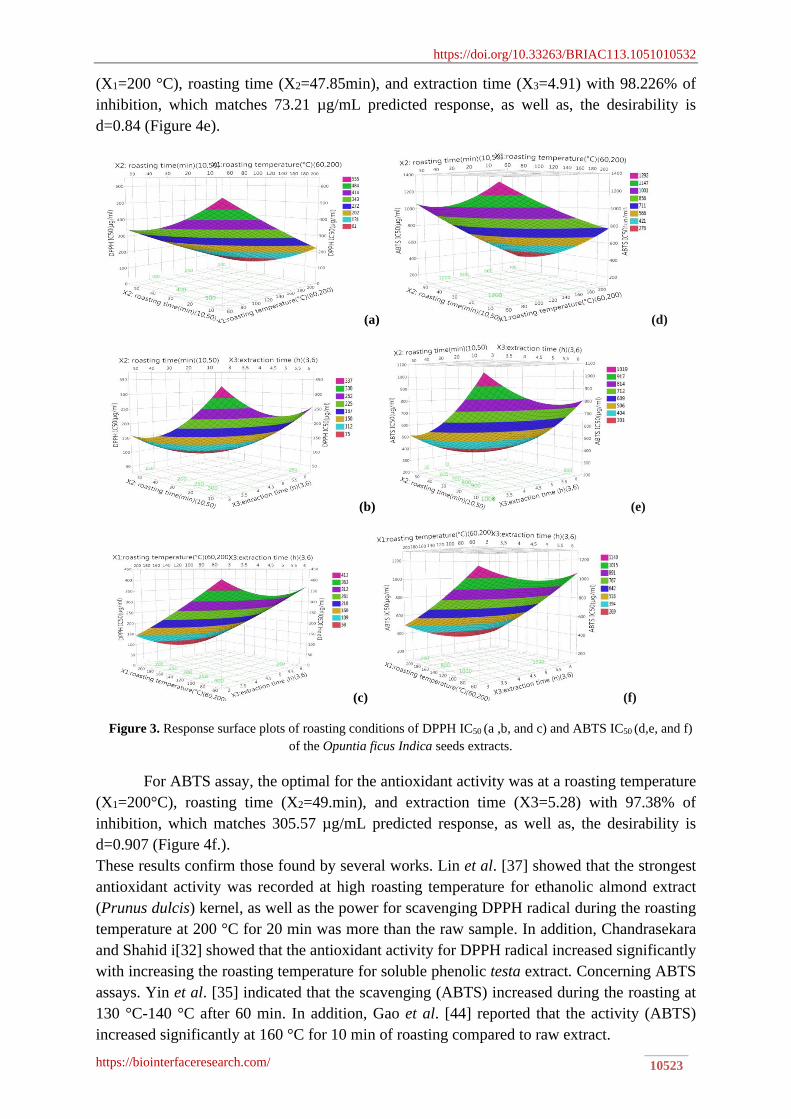
3.6. Response surface methodology (RSM) analysis.
The response surface (3D) of regression equations 6 and 7 were constructed using RMS
and are shown in Figure3. The antioxidant activity is inversely proportional to IC50. Moreover,
Figure 3a and Figure 3d show the effect of roasting time(X2) and roasting temperature (X1) on
the IC50 for DPPH and ABTS assays, respectively, when the extraction time (X3) was fixed at
4.5h. We observed that the antioxidant activity by DPPH and ABTS assays increased
significantly with the increasing of roasting time (X2) and roasting temperature (X1) because
of the IC50 of DPPH and ABTS assays was decreased. Therefore, the maximal of the
antioxidant activity for the two assays were in the at a high roasting temperature region (X1)
and roasting time (X2). Additionally, the effects of roasting time(X2) and extraction time (X3)
on IC50 when the roasting temperature was fixed(200°C) are presented in Figure 3b and Figure
3e for DPPH and ABTS assays, respectively. The negative effects significant of X2 and X3 on
IC50 for DPPH and ABTS are recorded. Thus, the antioxidant activity increased with the
increasing extraction time and roasting temperature for the two assays. Figure 3c and Figure 3f
showed the effects of roasting temperature and extraction time when the roasting time was
fixed(50min) on IC50 of DPPH and ABTS, respectively. We observed that the antioxidant
activity increased for the two assays with the increasing of two factors X1 and X3 because the
IC50 value was decreased. Moreover, the optimal antioxidant activity was at a strong roasting
temperature and extraction time for DPPH and ABTS assays. Based on the desirability
function, the maximum of antioxidant activity by DPPH assay was at a roasting temperature
https://doi.org/10.33263/BRIAC113.1051010532
https://biointerfaceresearch.com/ 10523
(X1=200 °C), roasting time (X2=47.85min), and extraction time (X3=4.91) with 98.226% of
inhibition, which matches 73.21 µg/mL predicted response, as well as, the desirability is
d=0.84 (Figure 4e).
(a) (d)
(b) (e)
(c) (f)
Figure 3. Response surface plots of roasting conditions of DPPH IC50 (a ,b, and c) and ABTS IC50 (d,e, and f)
of the Opuntia ficus Indica seeds extracts.
For ABTS assay, the optimal for the antioxidant activity was at a roasting temperature
(X1=200°C), roasting time (X2=49.min), and extraction time (X3=5.28) with 97.38% of
inhibition, which matches 305.57 µg/mL predicted response, as well as, the desirability is
d=0.907 (Figure 4f.).
These results confirm those found by several works. Lin et al. [37] showed that the strongest
antioxidant activity was recorded at high roasting temperature for ethanolic almond extract
(Prunus dulcis) kernel, as well as the power for scavenging DPPH radical during the roasting
temperature at 200 °C for 20 min was more than the raw sample. In addition, Chandrasekara
and Shahid i[32] showed that the antioxidant activity for DPPH radical increased significantly
with increasing the roasting temperature for soluble phenolic testa extract. Concerning ABTS
assays. Yin et al. [35] indicated that the scavenging (ABTS) increased during the roasting at
130 °C-140 °C after 60 min. In addition, Gao et al. [44] reported that the activity (ABTS)
increased significantly at 160 °C for 10 min of roasting compared to raw extract.

https://doi.org/10.33263/BRIAC113.1051010532
https://biointerfaceresearch.com/ 10524
Table 6. Experimental and predicted results at conditions optimal.
Responses X1 roasting
temperature (°C)
X2 roasting
time (min)
X 3 extraction
time(h)
Predicted
value
Experimental
value
Total phenolicContents
(mgGAE/gextract)
200°C 50min 5.49 h 106.23 103.5±0 .76
Total flavonoids
content(mgQE/gextract)
200°C 50min 3.16h 106.85 104.29±0.54
Total TanninsContent
(mgQAE/gextract)
200°C 50min 6h 11.30 10,16±0.89
Total sucrs Content (mg
D-Glu Egextract )
60°C 50min 5.12h 38.86 40.35±0.99
DPPH IC50 (µg/mL) 200°C 47.85min 4.91h 73.21 75.48±0.85
ABTSIC50 (µg/mL) 200°C 49.69min 5.28h 305.57 306.59±0.90
These results can be justified as follows: during roasting, the antioxidants
characteristics can be enhanced due to a reaction between amino acids and the reducing sugars;
this reaction produced a new molecule named Maillard reaction products (MRPs), as well as
the degradation of the heat-labile antioxidants compounds [32,45]. Moreover, during the
thermal treatment, the bound antioxidant phenol and bound polymeric compounds of plants
may be degraded and released, which leads to an increase in the antioxidant capacity[46].
Furthermore, the resultant melanoidin and Maillard reaction products had a higher antioxidant
activity, which depends on the presence of reductone-type structures[47], as well as, roasting
improves the solubility of non-phenolic molecules[48].
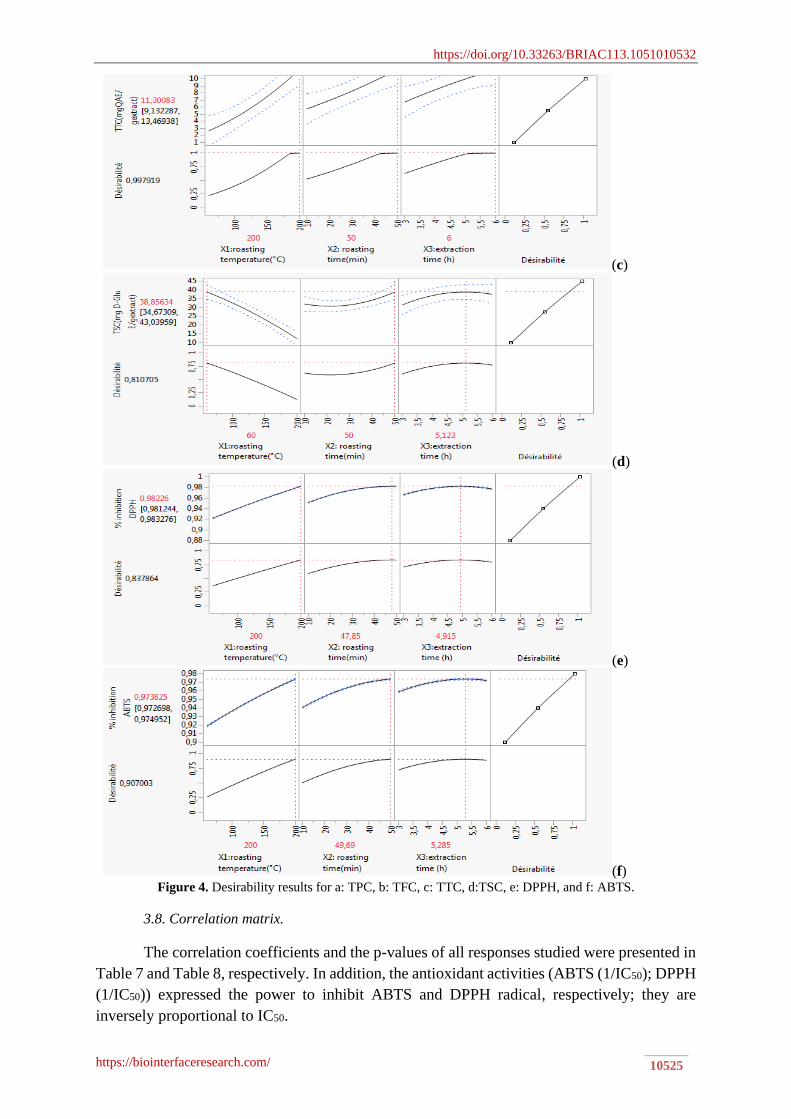
3.7. Verification and comparisons of predicted models and experimental values.
The validity of the predictive models was checked by comparing the results predicted
and experimental data. This verification was carried out using the experimental conditions of
the maximal response values. Based on data from Table 6, the predicted results are close to
experimental results.
(a)
(b)
https://doi.org/10.33263/BRIAC113.1051010532
https://biointerfaceresearch.com/ 10525
(c)
(d)
(e)
(f) Figure 4. Desirability results for a: TPC, b: TFC, c: TTC, d:TSC, e: DPPH, and f: ABTS.
3.8. Correlation matrix.
The correlation coefficients and the p-values of all responses studied were presented in
Table 7 and Table 8, respectively. In addition, the antioxidant activities (ABTS (1/IC50); DPPH
(1/IC50)) expressed the power to inhibit ABTS and DPPH radical, respectively; they are
inversely proportional to IC50.

https://doi.org/10.33263/BRIAC113.1051010532
https://biointerfaceresearch.com/ 10526
Table 7. Pearson’s correlation matrix between antioxidant activities and bioactive compounds.
Variable TPC TFC TTC TSC DPPH (1/IC50) ABTS(1/IC50)
TPC 1
TFC 0.917 1
TTC 0.949 0.831 1
TSC -0.560 -0.358 -0.607 1
DPPH (1/IC50) 0.917 0.836 0.891 -0.650 1
ABTS (1/IC50) 0.920 0.802 0.907 -0.695 0.992 1
The results in bold are different from 0 at a significance level alpha=0.05.
Table 8. p-value of coefficient correlations matrix.
Variables TPC TFC TTC TSC DPPH(1/IC50) ABTS(1/IC50)
TPC 0
TFC < 0.0001 0
TTC < 0.0001 0.000 0
TSC 0.030 0.191 0.016 0
DPPH (1/IC50) < 0.0001 0.000 < 0.0001 0.009 0
ABTS(1/IC50) < 0.0001 0.000 < 0.0001 0.004 < 0.0001 0 The results in bold are different from 0 at a significance level alpha=0.05.
As can be seen from Tables7 and 8, the strong positive correlations(p-value < 0.0001)
between the phytochemical compounds(TPC, TFC, TTC) and the antioxidant power were
recorded. The coefficient correlations of TPC were 0.917 and 0.920 with free radical
scavenging DPPH and ABTS, respectively. These positive correlations mean that the
antioxidant activity of Opuntia ficus Indica seeds extracts can be attributed to the presence of
polyphenol (TPC). They were also reported by various researchers [49,50]. Strong significant
positive correlation between TFC and antioxidant power between DPPH (1/IC50)(r2 = 0.836),
and ABTS(1/IC50) (r2= 0.802) was observed. Moreover, it was found that the TTC also had a
significant positive correlation (p-value <0.0001) between DPPH(1/IC50) and ABTS(1/IC50 ).
Accordingly, these correlations are confirmed by high positive significant correlations(p-
value< 0.05) between TPC, TFC, and TTC. We also observed that the TSC was not significant
with antioxidant activity (p-value>0.05). In addition, the higher positive correlation was
significant between 2 antioxidant activity(r2 =0.992) and showed that the same antioxidant
compounds in our samples are responsible for the scavenging activity of 2 free radicals ABTS
and DPPH.
3.9. Principal component analysis PCA.
Figure 6 showed the projections of the results of experimental assays (15 extracts) by
the factorial plan (F1-F2), according to PCA. The first essential component, F1, explains
83.38% of the information, and the second shows 11.64% of the information. Thus, the
cumulative percentage was 95.02 %; it is more than 50%, which indicated that the linear
combination is already representative of the variables. The correlations between all responses
are shown in Figure 5 by the plane formed by axes F1 and F2. Therefore, the F1 plan was
constructed by the positive correlation between TFC, TPC, TTC, ABTS (1/IC50), and DPPH
(1/IC50). But the F2 plan was formed by TSC (Figure 5). The extracts of this study were
separated into 3 groups based on responses results in Figure 6.

https://doi.org/10.33263/BRIAC113.1051010532
https://biointerfaceresearch.com/ 10527
Figure 5. Principal Component Analysis factorial plan carried out on the values (TFC, TPC, TSC, TTC, ABTS
(1/IC50), and DPPH(1/IC50)).
DPPH (1/ IC50); ABTS (1/ IC50) ,. GI: Group I; GII: Group II; G III; Group III.
Figure 6. Projection the factorial plan (F1×F2) of the individual’s variable.
Group I is composed of four extracts (1,13,7,11); these extracts had high values of TPC
TFC, and TCC; also, they had a high antioxidant capacity by ABTS and DPPH assays. On the
contrary, they had a lower value of TSC. Group II contains 6 extracts (8, 3, 6, 2, 12, and 14).
The extracts of this group are characterized by the low values of TPC, TFC, and TTC, but they
had a higher value of TSC. Its antioxidant capacity is low compared to other groups. Group III
is formed by five extracts (5,10, 9,4,15). The extracts of this group are characterized by a higher
value of TSC and by medium values of TPC, TFC, and TTC. Consequently, their antioxidant
capacity is medium compared to G 1. Group I contains extracts characterized by a strong
roasting temperature of 200 °C, which indicated that their antioxidant activity is stronger and
more than the extract of G II and G III. Therefore, roasting can increase the extraction of
bioactive molecules responsible for antioxidants activity.
TPC
TFC
TTC
TSC
DPPH(1/IC50)
ABTS(1/IC50)
-1
-0,75
-0,5
-0,25
0
0,25
0,5
0,75
1
-1 -0,75 -0,5 -0,25 0 0,25 0,5 0,75 1
F2 (
11
.64
%)
F1 (83.38 %)
Variables (axes F1 et F2 : 95.02 %)

https://doi.org/10.33263/BRIAC113.1051010532
https://biointerfaceresearch.com/ 10528
3.10. Hierarchical clustering analysis HCA.
According to HCA, extracts were classified by the squared Euclidean and Wards
method i to estimate the similarity measure. HCA was used to evaluate the correlation between
the extracts and to present similarities of 15 extracts (experiment assays) based on data of
antioxidant contents and antioxidant activity, as indicated in the dendrogram in Figure 7.
According to bioactive molecules, the 15 extracts were clustered into three Clusters. Cluster I
contains 4 extracts (1,13,7,11) representing for 26.66 % of the total extracts characterized by a
high range mean of TPC, TFC, and TTC 87.74 mg GAE/g extract, 90.36 mg QE/g extract, and
7.06 mg QAE/g extract, respectively, as well as, they had a stronger antioxidants capacity.
Cluster II, the largest cluster formed using 6 extracts, namely 8, 3, 6, 2, 12, and 14, accounted
for 40 % of total extracts; these extracts had the lowest mean value of TPC, TFC, and TTC
35.57 mg GAE/g extract, 33.60 mg QE/g extract, and 1.62 mg QAE/g extract respectively.
Also, they had a high mean level of TSC 33.73 mg D-Glu E/g extract, and they are
characterized by a low antioxidant activity by DPPH and ABTS. From the cluster analysis,
Cluster III contained four extracts, namely 5,10,9, 4, and 15 representing for 33.33 % of the
total extracts, with a medium mean values of antioxidant compounds TPC, TFC, TTC, and
TSC 57.91 mg GAE/g extract, 44.46 mg QE/g extract, 4.06 mg QAE/g extract, and 28.06 mg
D-Glu E/g extract respectively, as well as, a medium antioxidant power. These results are in
agreement with the data of the PCA, in which the distribution of all extracts on the score plot
indicates a similar trend. Furthermore, the PCA results were consistent with those of HCA.
CI: Cluster I; CII: Cluster II; C III; Cluster III.
Figure 7. Dendrogram of the extracts tested founded by HCA using bioactive and their antioxidant capacities.
4. Conclusions
RSM (response surface method) was employed to optimize the conditions of the dry
thermal processing in order to determine the optimum levels of bioactive molecules and their
antioxidant activities from Opuntia ficus Indica seeds extracts. The results showed that the
levels of bioactive molecules increased significantly with increasing roasting temperature and
roasting time. Moreover, the experimental values generated based on the optimized roasting
factors were found close to the predicted values. Therefore, this work suggests that the models
obtained can be used to optimize the roasting temperature, roasting time, and extraction time
for the extraction of bioactive molecules from Opuntia ficus Indica seeds. PCA indicated a
positive correlation between bioactive molecules and antioxidant activities (ABTS, DPPH).
Furthermore, HCA showed that the interrelatedness between extracts. Therefore, roasted
https://doi.org/10.33263/BRIAC113.1051010532
https://biointerfaceresearch.com/ 10529
Opuntia ficus Indica seeds may be considered as traditional food with strong antioxidant power
for the production of functional foods.
Funding
This research received no external funding.
Acknowledgments
We thank all colleagues of the Laboratory of Materials, Nanotechnology, and Environment,
Faculty of Sciences, Mohammed V University.
Conflicts of Interest
The authors declare no conflict of interest.
References
1. Jorge, A. J.; De La Garza, T. H.; Alejandro, Z. C.; Ruth, B. C.; Noé, A. C. The optimization of phenolic
compounds extraction from cactus pear (Opuntia ficus-indica) skin in a reflux system using response surface
methodology. Asian Pac. J. Trop. Bio. 2013, 3, 436-442, https://doi.org/10.1016/S2221-1691(13)600933.
2. Benayad, Z.; Martinez-Villaluenga, C.; Frias, J.; Gomez-Cordoves, C.; Es-Safi, N. E. Phenolic composition,
antioxidant and anti-inflammatory activities of extracts from Moroccan Opuntia ficus-indica flowers obtained
by different extraction methods. Ind. Crops Prod. 2014, 62, 412-420,
https://doi.org/10.1016/j.indcrop.2014.08.046.
3. Marin-Bustamante, M. Q.; Chanona-Pérez, J. J.; Gυemes-Vera, N.; Arzate-Vázquez, I.; Perea-Flores, M. J.;
Mendoza-Pérez, J. A.;Casarez-Santiago, R. G. Evaluation of physical, chemical, microstructural and
micromechanical properties of nopal spines (Opuntia ficus-indica). Ind. Crops Prod. 2018, 123, 707-718,
https://doi.org/10.1016/j.indcrop.2018.07.030.
4. Bensadón, S.; Hervert-Hernández, D.; Sáyago-Ayerdi, S. G.; Goñi, I. By-products of Opuntia ficus-indica as
a source of antioxidant dietary fiber. Plant Foods Hum. Nutr. 2010, 65, 210-216,
https://doi.org/10.1007/s11130-010-0176-2.
5. Ammar, I.; Salem, M. B.; Harrabi, B.; Mzid, M.; Bardaa, S.; Sahnoun, Z.; Ennouri, M. Anti-inflammatory
activity and phenolic composition of prickly pear (Opuntia ficus-indica) flowers. Ind. Crops Prod. 2018, 112,
313-319, https://doi.org/10.1016/j.indcrop.2017.12.028.
6. Amrane-Abider, M.; Nerin, C.; Cannelas, E.; Zeroual, B.; Hadjal, S.; Louaileche, H.Prickly pear (Opuntia
ficus-indica) seeds as a source of phenolic compounds: microwave-assisted extraction optimization and effect
on food lipid oxidations. The Annals of the University Dunarea de Jos of Galati. Fascicle VI-Food
Technology 2018, 42, 23-35, https://doi.org/10.1111/jfpp.13437.
7. Ammar, I.; Ennouri, M.; Attia, H. Phenolic content and antioxidant activity of cactus (Opuntia ficus-indica
L.) flowers are modified according to the extraction method. Ind. Crops Prod. 2015, 64, 97-104,
https://doi.org/10.1016/j.indcrop.2014.11.030.
8. Al Juhaimi, F.; Özcan, M. M.; Uslu, N.; Ghafoor, K.; Babiker, E. E. Effect of microwave heating on phenolic
compounds of prickly pear (Opuntia ficus‐indica L.) seeds. J. Food Process. Pres. 2018, 42, 1435‐1449,
https://doi.org/10.1111/jfpp.13437.
9. Brahmi, F.; Haddad, S.; Bouamara, K..; Yalaoui-Guellal, D.; Prost-Camus, E.; de Barros, J. P. P.; Lizard, G.
Comparison of chemical composition and biological activities of Algerian seed oils of Pistacia lentiscus L.,
Opuntia ficus indica (L.) mill. and Argania spinosa L. Skeels. Ind. Crops. Prod. 2020, 151, 112456,
https://doi.org/10.1016/j.indcrop.2020.112456.
10. Fikry, M.; Yusof, Y. A.; M Al-Awaadh, A.; Abdul Rahman, R.; Chin, N. L.; Ghazali, H. M. Antioxidative
and quality properties of full-fat date seeds brew as influenced by the roasting conditions. Antioxidants
2019, 8, 226, https://doi.org/10.3390/antiox8070226.
11. Carciochi, R. A.; Galván D′ Alessandro, L.; Manrique, G. D. Effect of roasting conditions on the antioxidant
compounds of quinoa seeds. Int. J. Food. Sci. & Tech. 2016, 51, 1018-1025,
https://doi.org/10.1111/ijfs.13061.

https://doi.org/10.33263/BRIAC113.1051010532
https://biointerfaceresearch.com/ 10530
12. Khan, A.; Saini, C. S. Effect of roasting on physicochemical and functional properties of flaxseed
flour. Cogent. Eng. 2016, 3, 1145566, https://doi.org/10.1080/23311916.2016.1145566.
13. Açar, Ö. Ç.; Gökmen, V.; Pellegrini, N.; Fogliano, V. Direct evaluation of the total antioxidant capacity of
raw and roasted pulses, nuts and seeds. Eur. Food Res. Technol. 2009, 229, 961-969,
https://doi.org/10.1007/s00217-009-1131-z.
14. Sharma, K.; Ko, E. Y.; Assefa, A. D.; Ha, S.; Nile, S. H.; Lee, E. T.; Park, S. W. Temperature-dependent
studies on the total phenolics, flavonoids, antioxidant activities, and sugar content in six onion varieties. J
Food. Drug. Anal. 2015, 23, 243-252, https://doi.org/10.1016/j.jfda.2014.10.005.
15. Vujasinovic, V.; Djilas, S.; Dimic, E.; Basic, Z.; Radocaj, O. The effect of roasting on the chemical
composition and oxidative stability of pumpkin oil. Eur J Lipid Sci Technol 2012, 114, 568-574,
https://doi.org/10.1002/ejlt.201100158.
16. Alberti, A.; Zielinski, A. A. F.; Zardo, D. M.; Demiate, I. M.; Nogueira, A.; Mafra, L. I. Optimisation of the
extraction of phenolic compounds from apples using response surface methodology. Food chemistry
2014, 149, 151-158,https://doi.org/10.1016/j.foodchem.2013.10.086.
17. Singleton, V. L.; Orthofer, R.; Lamuela-Raventós, R. M. Analysis of total phenols and other oxidation
substrates and antioxidants by means of folin-ciocalteu reagent. Method enzymol. 1999, 299, 152-178,
https://doi.org/10.1016/S0076-6879(99)99017-1.
18. Yeddes, N.; Chérif, J. K.; Guyot, S.; Sotin, H.; Ayadi, M. T. Comparative study of antioxidant power,
polyphenols, flavonoids and betacyanins of the peel and pulp of three Tunisian Opuntia forms. Antioxidants
2013, 2, 37-51, https://doi.org/10.3390/antiox2020037.
19. Sun, B.; Ricardo-da-Silva, J. M.; Spranger, I. Critical factors of vanillin assay for catechins and
proanthocyanidins. J. Agric. Food. Chem. 1998, 46, 4267-4274, https://doi.org/10.1021/jf980366j.
20. Chaiwut, P.; Pintathong, P.; Thitipramote, N.; Sangthong, S. Optimization of polysaccharide extraction
from Okra (Abelmoschus esculentus) by using response surface methodology. J. Food. Sci. Agril. Technol.
(JFAT) 2019, 5, 99-105, http://rs.mfu.ac.th/ojs/index.php/jfat.
21. Zengin, G.; Uysal, S.; Ceylan, R.; Aktumsek, A. Phenolic constituent, antioxidative and tyrosinase inhibitory
activity of Ornithogalum narbonense L. from Turkey: a phytochemical study. Ind. Crops Prod. 2015,70, 1-6,
https://doi.org/10.1016/j.indcrop.2015.03.012.
22. Yim, H. S.; Chye, F. Y.; Rao, V.; Low, J. Y.; Matanjun, P.; How, S. E.; Ho, C. W. Optimization of extraction
time and temperature on antioxidant activity of Schizophyllum commune aqueous extract using response
surface methodology. J. Food. Sci. Technol. 2013, 50, 275-283, https://doi.org/10.1007/s13197-011-0349-
5.
23. Chen, X. Q.; Li, Z. H.; Wang, Z. J.; Liu, L. L.; Sun, T. T.; Ma, J. Z.; Zhang, Y. Ultrasound-assisted extraction
of total anthocyanins from Rubia sylvatica Nakai fruit and radical scavenging activity of the
extract. Ind.Crops Prod. 2020, 150, 112420, https://doi.org/10.1016/j.indcrop.2020.112420.
24. Los, F. G. B.; Zielinski, A. A. F.; Wojeicchowski, J. P.; Nogueira, A.; Demiate, I. M. Extraction optimization
of phenolic extracts from carioca bean (Phaseolus vulgaris L.) using response surface methodology. Food
Anall. Methods 2019, 12, 148-159, https://doi.org/10.1007/s12161-018-1347-2.
25. Tomšik, A.; Pavlić, B.; Vladić, J.; Ramić, M.; Brindza, J.; Vidović, S. Optimization of ultrasound-assisted
extraction of bioactive compounds from wild garlic (Allium ursinum L.). Ultrason. Sonochem. 2016, 29, 502-
511, https://doi.org/10.1016/j.ultsonch.2015.11.005.
26. Biswas, A.; Dey, S.; Li, D.; Yiu, L.; Zhang, J.; Huang, S.; Deng, Y. Comparison of phytochemical profile,
mineral content, and in vitro antioxidant activities of corchorus capsularis and corchorus olitorius leaf extracts
from different populations. J. Food. Qual. 2020, https://doi.org/10.1155/2020/2931097.
27. Zielinski, A. A.; Haminiuk, C. W.; Nunes, C. A.; Schnitzler, E.; van Ruth, S. M.; Granato, D. Chemical
composition, sensory properties, provenance, and bioactivity of fruit juices as assessed by chemometrics: a
critical review anguideline. Compr. Rev. Food. SCI. F 2014, 13, 300-316, https://doi.org/10.1111/1541-
4337.12060.
28. Jugreet, B. S.; Mahomoodally, M. F.; Sinan, K. I., Zengin, G.; Abdallah, H. H. Chemical variability,
pharmacological potential, multivariate and molecular docking analyses of essential oils obtained from four
medicinal plants. Ind.Crops Prod. 2020, 150, 112394, https://doi.org/10.1016/j.indcrop.2020.112394.
29. Li, H. Z.; Tan, Y. L.; Zhang, Z. J.; Xia, Y. Y. ; Li, X. J.; CUI, L. X. ; Chen, T. Optimization of ultrasound-
assisted extraction of procyanidins from perilla seed hull and their antioxidant activities in vitro. Food. Sci.
Technol. 2019, 39, 378-387,https://doi.org/10.1590/fst.30417.
30. Laib, I.; Barkat, M. Optimization of conditions for extraction of polyphenols and the determination of the

https://doi.org/10.33263/BRIAC113.1051010532
https://biointerfaceresearch.com/ 10531
impact of cooking on total polyphenolic, antioxidant, and anticholinesterase activities of potato. Foods
2018, 7, 36, https://doi.org/10.3390/foods7030036.
31. Gullian, K. M.; Terrats, P. M. Optimization of the ultrasound-assisted extraction of phenolic compounds from
Brosimumalicastrum leaves and the evaluation of their radical-scavenging activity. Molecules 2017, 22,
1286, https://doi.org/10.3390/molecules22081286.
32. Chandrasekara, N.; Shahidi, F. Effect of roasting on phenolic content and antioxidant activities of whole
cashew nuts, kernels, and testa. J. Agr. Food. Chem. 2011, 59, 5006-5014,
https://doi.org/10.1021/jf2000772.
33. Yu, J.; Ahmedna, M.; Goktepe, I. Effects of processing methods and extraction solvents on concentration
and antioxidant activity of peanut skin phenolics. Food. Chem. 2005, 90, 199-206,
https://doi.org/10.1016/j.foodchem.2004.03.048.
34. Locatelli, M.; Travaglia, F.; Coïsson, J. D.; Martelli, A.; Stévigny, C.; Arlorio, M. Total antioxidant activity
of hazelnut skin (Nocciola Piemonte PGI): Impact of different roasting conditions. Food Chemistry 2010,
119, 1647-1655, https://doi.org/10.1016/j.foodchem.2009.08.048.
35. Yin, Q.; Mu, H.; Zeng, M.; Gao, D.; Qin, F.; Chen, J.; He, Z. Effects of heating on the total phenolic content,
antioxidant activities and main functional components of simulated Chinese herb candy during boiling
process. J. Food. Meas. Charact. 2019, 13, 476-486, https://doi.org/10.1007/s11694-018-9961-7.
36. Kim, S. Y.; Jeong, S. M.; Park, W. P.; Nam, K. C.; Ahn, D. U.; Lee, S. C. Effect of heating conditions of
grape seeds on the antioxidant activity of grape seed extracts. Food. Chem. 2006, 97, 472-479,
https://doi.org/10.1016/j.foodchem.2005.05.027.
37. Lin, J. T.; Liu, S. C.; Hu, C. C.; Shyu, Y. S.; Hsu, C. Y.; Yang, D. J. Effects of roasting temperature and
duration on fatty acid composition, phenolic composition, Maillard reaction degree and antioxidant attribute
of almond (Prunus dulcis) kernel. Food. Chem. 2016, 190, 520-528,
https://doi.org/10.1016/j.foodchem.2015.06.004.
38. Kumar, S.; Pandey, A. K. Chemistry and biological activities of flavonoids: an overview. Sci. World. J. 2013,
https://doi.org/10.1155/2013/162750.
39. Jeong, S. M.; Kim, S. Y.; Kim, D. R.; Nam, K. C.; Ahn, D. U.; Lee, S. C. Effect of seed roasting conditions
on the antioxidant activity of defatted sesame meal extracts. J. Food. Sci. 2004, 69, C377-C381,
https://doi.org/10.1111/j.1365-2621.2004.tb10701.x.
40. Maran, J. P.; Manikandan, S.; Mekala, V. Modeling and optimization of betalain extraction from Opuntia
ficus-indica using Box–Behnken design with desirability function. Ind. Crops Prod. 2013, 49, 304-311,
https://doi.org/10.1016/j.indcrop.2013.05.012.
41. Youn, K. S.; Chung, H. S. Optimization of the roasting temperature and time for preparation of coffee-like
maize beverage using the response surface methodology. LWT-Food. Sci. Technol. 2012, 46, 305-310,
https://doi.org/10.1016/j.lwt.2011.09.014.
42. Namiki, M. Chemistry of Maillard reactions: recent studies on the browning reaction mechanism and the
development of antioxidants and mutagens. Adv. Food. Res. 1988, 32, 115-184,
https://doi.org/10.1016/S0065-2628(08)60287-6.
43. Yaylayan, V. A.; Kaminsky, E. Isolation and structural analysis of Maillard polymers: caramel and
melanoidin formation in glycine/glucose model system. Food Chem. 1998, 63, 25-31,
https://doi.org/10.1016/S0308-8146(97)00237-9.
44. Gao, P.; Cao, Y.; Liu, R.; Jin, Q.; Wang, X.. Phytochemical Content, Minor‐Constituent Compositions, and
Antioxidant Capacity of Screw‐Pressed Walnut Oil Obtained from Roasted Kernels. Eur. J. Lipid. Sci. Tech.
2019, 121, 1800292,https://doi.org/10.1002/ejlt.201800292.
45. Nicoli, M. C.; Anese, M.; Parpinel, M. Influence of processing on the antioxidant properties of fruit and
vegetables. Trends in Food Sci & Tech 1999, 10, 94-100, https://doi.org/10.1016/S0924-2244(99)00023-0.
46. Lee, J. C.; Kim, H. R.; Kim, J.; Jang, Y. S. Antioxidant property of an ethanol extract of the stem of Opuntia
ficus-indica var. saboten. J. Agrifood. Chem. 2002, 50, 6490-6496, https://doi.org/10.1021/jf020388c.
47. Hayase, F.; Hirashima, S.; Okamoto, G.; Kato, H. Scavenging of active oxygens by melanoidins. Agr. Bio.
Chem. 1989, 53, 3383-3385, https://doi.org/10.1271/bbb1961.53.3383.
48. Dewanto, V.; Wu, X.; Adom, K. .K..; Liu, R. H. Thermal processing enhances the nutritional value of
tomatoes by increasing total antioxidant activity. J. Agric. Food. Chem. 2002, 50, 3010-3014,
https://doi.org/10.1021/jf0115589.
49. Amri, O.; Elguiche, R.; Tahrouch, S.; Zekhnini, A.; Hatimi, A. Antifungal and antioxidant activities of some
aromatic and medicinal plants from the southwest of Morocco. J. Chem. Pharm. Res. 2015, 7, 672-678.

https://doi.org/10.33263/BRIAC113.1051010532
https://biointerfaceresearch.com/ 10532
50. Cheniany, M.; Ebrahimzadeh, H.; Vahdati, K.; Preece, J. E.; Masoudinejad, A.; Mirmasoumi, M. Content of
different groups of phenolic compounds in microshoots of Juglans regia cultivars and studies on antioxidant
activity. Acta. Physiol. Plant. 2013, 35, 443-450, https://doi.org/10.1007/s11738-012-1087-7.


